Article

Discussion on Transitional Shale Gas Accumulation Conditions from the Perspective of Source-Reservoir-Caprock Controlling Hydrocarbon: Examples from Permian Shanxi Formation and Taiyuan Formation in the Eastern Margin of Ordos Basin, NW China

1
PetroChina Research Institute of Petroleum Exploration & Development, Beijing 100083, China
2
National Energy Shale Gas R&D (Experiment) Center, Langfang 065007, China
3
PetroChina Coalbed Methane Company Limited, Beijing 100028, China
4
Department of Geology, Northwest University, Xi’an 710069, China
*
Authors to whom correspondence should be addressed.
Energies 2023, 16(9), 3710; https://doi.org/10.3390/en16093710
Submission received: 9 February 2023 / Revised: 7 March 2023 / Accepted: 22 March 2023 / Published: 26 April 2023

Abstract

:
Transitional shale gas, rich in resources, is expected to be a practical contributor to the increase in shale gas reserves and production in China. Its exploration prospect has been demonstrated by several wells in the Daning-Jixian block on the eastern margin of the Ordos Basin. In this paper, the Lower Permian Shanxi Formation (P1s) and Taiyuan Formation (P1t) in the eastern margin of Ordos Basin were compared for organic geochemical parameters, revealing that the overflow fan + lagoon combination (OLC) of the third sub-member of the second member of Shanxi Formation (P1s23) and the marine + lagoon combination (MLC) of the first member of Taiyuan Formation (P1t1) are the most favorable shale gas intervals. The two intervals were comparatively analyzed with respect to mineral composition, brittleness, caprocks, and preservation conditions. It is found that the OLC of P1s23 has a similar porosity to and much lower permeability than the MLC of P1t1 (or MLC1) and a BET surface area of 10–15 m2/g, which is smaller than the MLC1 (15–20 m2/g). Moreover, OLC has a brittle mineral content equivalent to MLC1 but a brittleness index of 33.73–62.36 (avg. 49.86), smaller than MLC1 (53.34–58.27, or avg. 55.85). OLC contains sandstones at both the roof and floor, with a higher permeability than shale in the interval, which cannot serve as good physical seals. In contrast, MLC1 contains limestones with lower permeability at the roof and floor, which, together with the overlying coal seams, have hydrocarbon generation capacity and can physically seal the MLC1 shale but also fill it with hydrocarbons, making MLC1 have higher gas content and superior for shale gas exploration than the OLC shale. Due to the multi-lithologies developed in transitional facies, besides the organic matter enrichment, and reservoir characteristics, it is necessary to find a suitable lithological combination to ensure the gas in shale can be better preserved and retained.

1. Introduction

In China, research on marine shale gas has contributed a series of results [1,2,3,4,5], and marine shale gas demonstration areas have been built in the Changning-Weiyuan, Zhaotong, and Jiaoshiba blocks of the Sichuan Basin. The marine shale gas production reached 230 × 108 m3 in 2021, with an annual increase of 30 × 108 m3 [6]. However, the efficient and sustainable development of marine shale gas faces serious challenges, such as the deteriorating quality of reservoirs in the expected replacing mid-deep strata (2000–3500 m) and the unavailability of a production model of high-yield shale gas wells in deep strata (3500–4500 m), which causes increased stress to realize more reserves and production of shale gas in southern Sichuan Basin. In response to China’s “carbon peak and carbon neutrality” goals, there is an urgent need to achieve clean energy succession and strategic transition as soon as possible. Against this background, new shale gas zones/formations beyond marine shale gas become hot spots in shale gas research.
Transitional shale gas, rich in resources [7,8,9,10], is expected to be a practical contributor to the increase in shale gas reserves and production in China. According to Dong et al. (2021), the transitional facies is divided into the delta, estuary bay, lagoon, barrier island, and tidal-flat facies [10]. Tidal-flats appear in shallow water, where the oxidizing condition is not conducive to the preservation of organic matter due to tidal washing. A barrier island is subjected to strong hydrodynamics, forming sandstone dominantly. Deltas include delta fronts, delta plains, and prodelta subfacies. Delta fronts and delta plains are dominantly sandy deposits, serving as the main carriers of conventional gas, while prodeltas exist in an environment with mixed freshwater and brackish water, where thriving algae create an oxygen-poor setting for the enrichment of organic matter. Nevertheless, there are no reports on shale oil and gas exploration in delta facies. A lagoon is a zone of low water energy due to the sheltering of the barrier island, where the organic-rich shale is dominated by black shale and silty shale with horizontal bedding. A lagoon is the most favorable transitional facies for shale gas development, and lagoon deposits have been discovered in the Permian Taiyuan Formation–Shanxi Formation in South China, the Lower Carboniferous Ceshui Formation in central Hunan, and the Permian Longtan Formation in eastern Sichuan. Especially the organic matter conversion coefficient of the Longtan Formation is 0.08–2.54, proving to be the most favorable interval with shale gas enriched.
In the eastern margin of Ordos Basin, the Shanxi Formation and Taiyuan Formation develop lagoon shales. The current research focuses on transitional shale gas, mainly focusing on the reservoir characteristics of the Shanxi Formation [11,12,13,14,15,16]. Systematic comparative studies of the Shanxi Formation and Taiyuan Formation are mostly performed with respect to sedimentary evolution, organic matter enrichment, and pore size distribution [17,18,19,20,21,22,23]. Specific research on the Taiyuan Formation has rarely been reported. In addition, many companies attempt to explore transitional shale gas mainly in the lagoon shale of the Shanxi Formation [9,24,25] but seldom in the lagoon shale of the Taiyuan Formation. The systematic comparative study of the two sets of shales has not been conducted extensively, which hinders the evaluation of transitional shale gas sweet spots. In this study, the source, reservoir, and caprock conditions of the Lower Permian Shanxi and Taiyuan (P1s and P1t) lagoon shales in the Daning-Jixian block are systematically compared, with an aim to provide a theoretical basis for selecting sweet intervals of transitional facies and to promote the exploration and development of transitional shale gas.

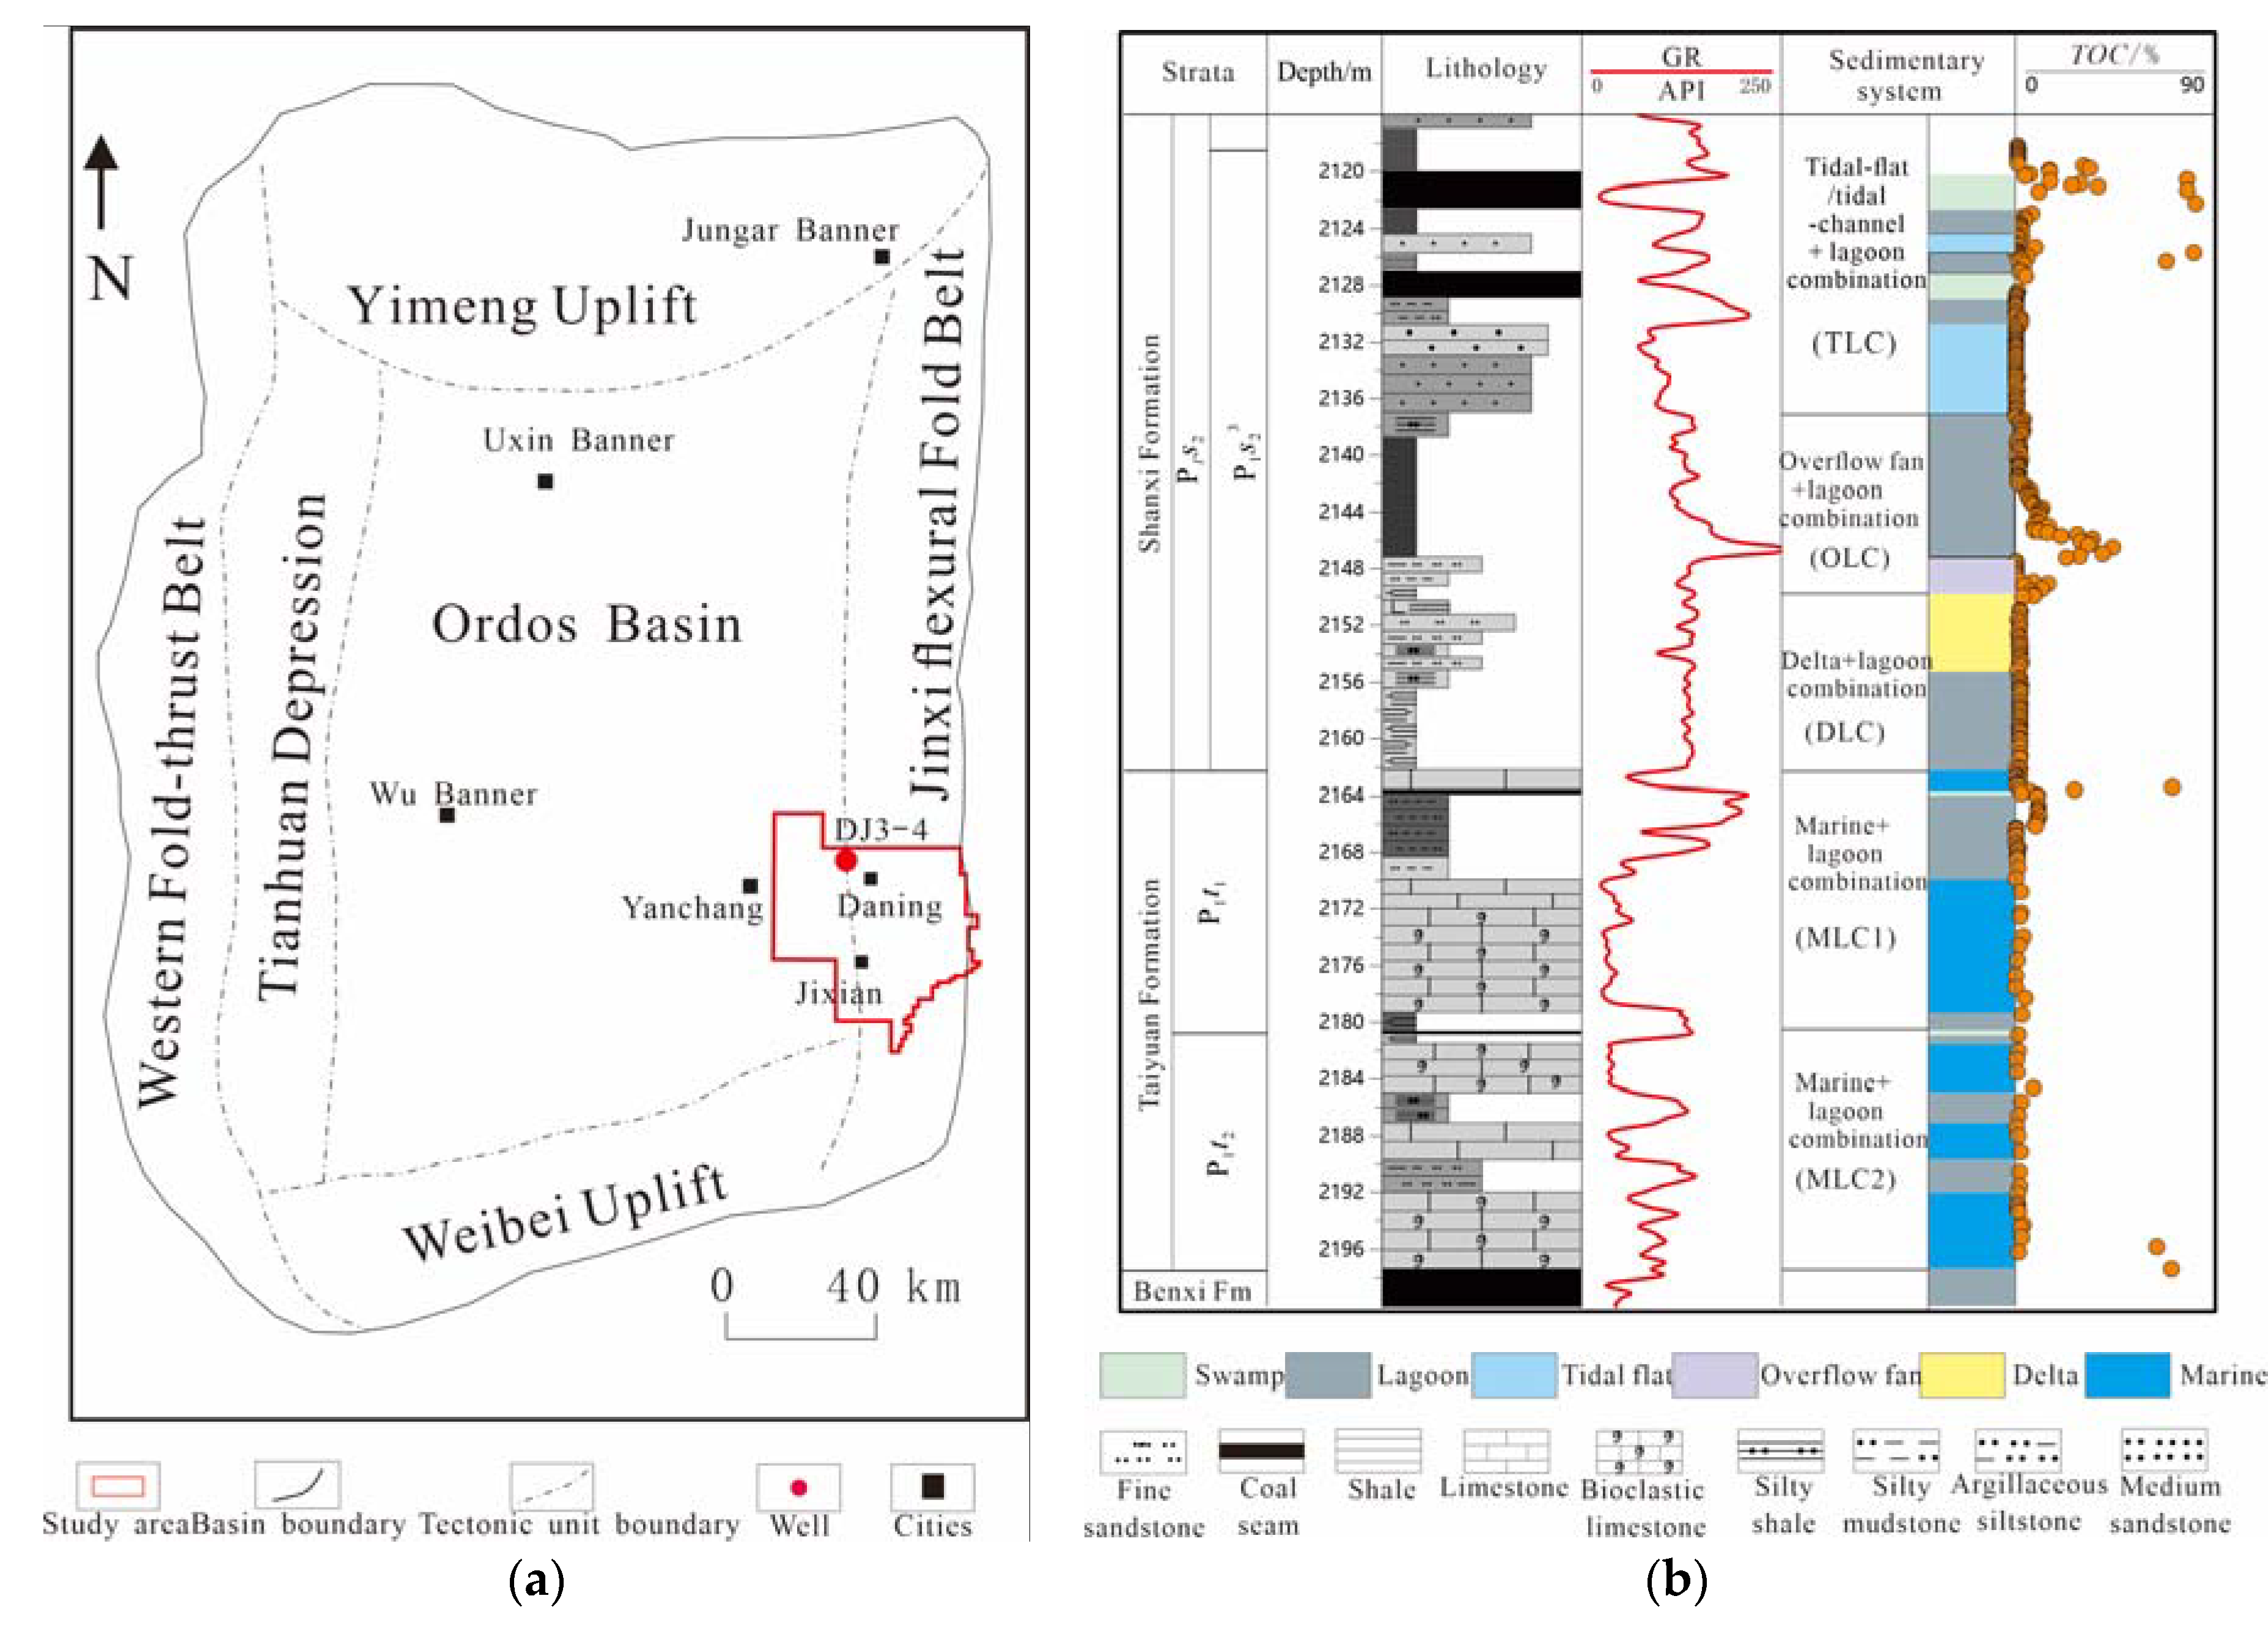
2. Geological Setting

The Ordos Basin at the western margin of the North China Platform mainly experienced three evolutionary stages in the Late Paleozoic: (1) epicontinental sea basin dominated by marine deposits; (2) offshore lake basin dominated by transitional deposits; and (3) inland depressed lake basin dominated by terrestrial clastic deposits. The structural pattern can be divided into six second-order tectonic units, namely, the Yimeng uplift, the Weibei uplift, the Jinxi flexural fold belt, the Yishan slope, the Tianhuan syncline, and the thrust-fault tectonic zone in the western margin. In the eastern margin of Ordos Basin, the platform was flooded due to transgression in the late stage of Late Carboniferous, and sea regression began to occur in the early stage of Early Permian, forming a marine-continental alternating environment.
The Daning-Jixian block is located east of the Yishan slope and adjacent to the Yanchuan South block in the south. The Shanxi Formation and the Taiyuan Formation constitute a set of epicontinental sea deposits. The Shanxi Formation (P1s) can be divided into two members: P1s1 and P1s2. P1s2 has a larger single-layer thickness, more stable lateral distribution, darker lithology, and fewer and thinner interlayers than P1s1 [9,25]. From top to bottom, P1s2 can be subdivided into three sub-members: P1s21, P1s22, and P1s23. The lagoon shales of the Shanxi Formation are concentrated in P1s23, which, from top to bottom, include: (1) the tidal-flat/tidal-channel + lagoon combination (TLC), consisting of black shale, fine sandstone, coal seam, and silty shale where the tidal-channel sand body is in abrupt contact with the underlying silty shale; (2) the overflow fan + lagoon combination (OLC), consisting of silty shale, black shale, and fine sandstone; and (3) the delta + lagoon combination (DLC), consisting of medium sandstone, silty shale, fine sandstone, muddy sandstone, and black shale [11]. The cumulative thickness of the three combinations is 30–40 m. The Taiyuan Formation (P1t) is deposited in carbonate platform–lagoon facies and is mainly composed of calcareous shale, silty shale, coal seam, and limestone, with a cumulative thickness of 10–20 m (Figure 1b). The Taiyuan Formation is divided into two members: P1t2 and P1t1, from bottom to top, both of which are marine + lagoonal combination (MLC) deposits. The MLC of P1t1 is defined as MLC1, and the MLC of P1t2 as MLC2, which are separated by the No.7 coal seam. At the top of MLC1, there is the No.6 coal seam. Well DJ3-4 is drilled in the Daning-Jixian block in the southeastern margin of the Ordos Basin.

3. Materials and Methods

3.1. Samples

A total of 334 samples were taken from P1s23 and P1t in Well DJ3-4 for analysis of geochemistry, mineral composition, physical properties, and pore structure.

3.2. Experiments

3.2.1. Geochemistry

The geochemical analysis includes total organic carbon (TOC), thermal maturity (Ro), and δ13Corg measurements. TOC was measured using the Leco carbon/sulfur analyzer in PetroChina Key Laboratory of Unconventional Oil and Gas Resources, with an analytical precision of ±0.5%, and according to the procedures given by Gu et al. [26]. Ro was determined by using the Leitz MVP-3 microscope photometer. Organic carbon isotopes were measured at the Center of Modern Analysis, Nanjing University, using the Elementar Vario MICRO, and δ13Corg was analyzed according to the steps proposed by Wang et al. [27].

3.2.2. Mineral Composition

Mineral compositions of 125 samples were determined using the Bruker D2 PHASER X-ray diffractometer (XRD) according to the procedures provided in SY/T5163-2010. The error of the XRD analysis was estimated to be 2%.

3.2.3. Physical Properties

Shale porosity and permeability were tested respectively by using the helium pycnometer with core plugs, according to the procedures given by Tian et al. [28], and the low-field nuclear magnetic resonance (LF-NMR) according to the procedures given by Yuan et al. [29].

3.2.4. Pore Structure

A Low-pressure N2 adsorption experiment was conducted to identify pores larger than 1.5 nm using a Micromeritics ASAP 2020 apparatus in PetroChina Key Laboratory of Unconventional Oil and Gas Resources, according to the procedures given by Sun et al. [30]. The surface area was calculated using the Brunauer-Emmett-Teller (BET) method [31] from the adsorption curves in a relative pressure range of 0.05–0.35. The pore volume was measured using the Barrett-Joyner-Halenda (BJH) method [32] from the adsorption curves in the relative pressure (P/Po) range of 0.06–0.99.

4. Results

4.1. Geochemical Characteristics

4.1.1. TOC

For the 260 samples from P1s23, TOC ranges from 0.03% to 81.5%, with an average of 5.74% (Figure 2). Excluding the coal samples, the TOC is 0.03–8.87% (avg. 1.00%) for TLC, 0.11–43.9% (avg. 7.90%) for OLC, and 0.74–2.96% (avg. 1.75%) for DLC (Figure 2, Table 1). Clearly, OLC has the highest TOC, while TLC and DLC have low TOC, not meeting the TOC criterion of organic-rich shale (TOC = 2%). Thus, OLC is determined as the optimal interval in P1s23.
For the 74 samples from P1t, TOC ranges from 0.08% to 70.9%, with an average of 5.70%. Excluding the coal samples, the TOC is 0.08–26.6% (avg. 3.72%) for MLC1 and 0.37–7.96% (avg. 1.74%) for MCL2 (Figure 2, Table 1). Obviously, MLC1 meets the TOC criterion of organic-rich shale and thus determines the optimal interval in P1t.
In the following sections, the OLC of P1s23 and the MLC1 of P1t are compared to determine the most favorable interval.

4.1.2. Ro

The results of the vitrinite reflectance (Ro) test indicate that the samples from P1s23 and P1t are comparable in maturity, and both are in the dry gas generation stage. The Ro of the P1s23 samples ranges from 2.07% to 2.61%, with an average of 2.34%. The Ro of the P1t samples ranges from 2.02% to 2.36%, with an average of 2.21% (Figure 2).

4.2. Reservoir Characteristics

4.2.1. Mineralogy

X-ray diffraction (XRD) data show that P1s23 and P1t have diverse mineral compositions. The P1s23 samples are mainly composed of clay (avg. 49.9%), quartz (avg. 38.4%), plagioclase (avg. 2.2%), carbonate (avg. 3.8%), siderite (avg. 3.7%), and pyrite (avg. 1.2%), and the P1t samples are mainly composed of carbonate (avg. 47.4%), clay minerals (avg. 32.7%), quartz (avg. 22.3%), plagioclase (avg. 0.2), siderite (avg. 1.8%), and pyrite (avg. 1.7%) (Figure 2, Table 1). DLC, OLC, and TLC exhibit higher quartz contents (avg. 34.6%, 43.2%, and 40.7%, respectively) and lower clay contents (avg. 56.4%, 46.1%, and 44.7%, respectively). MLC1 and MLC2 are equivalent in quartz content but different in clay content (avg. 32.3% and 13.3%, respectively).

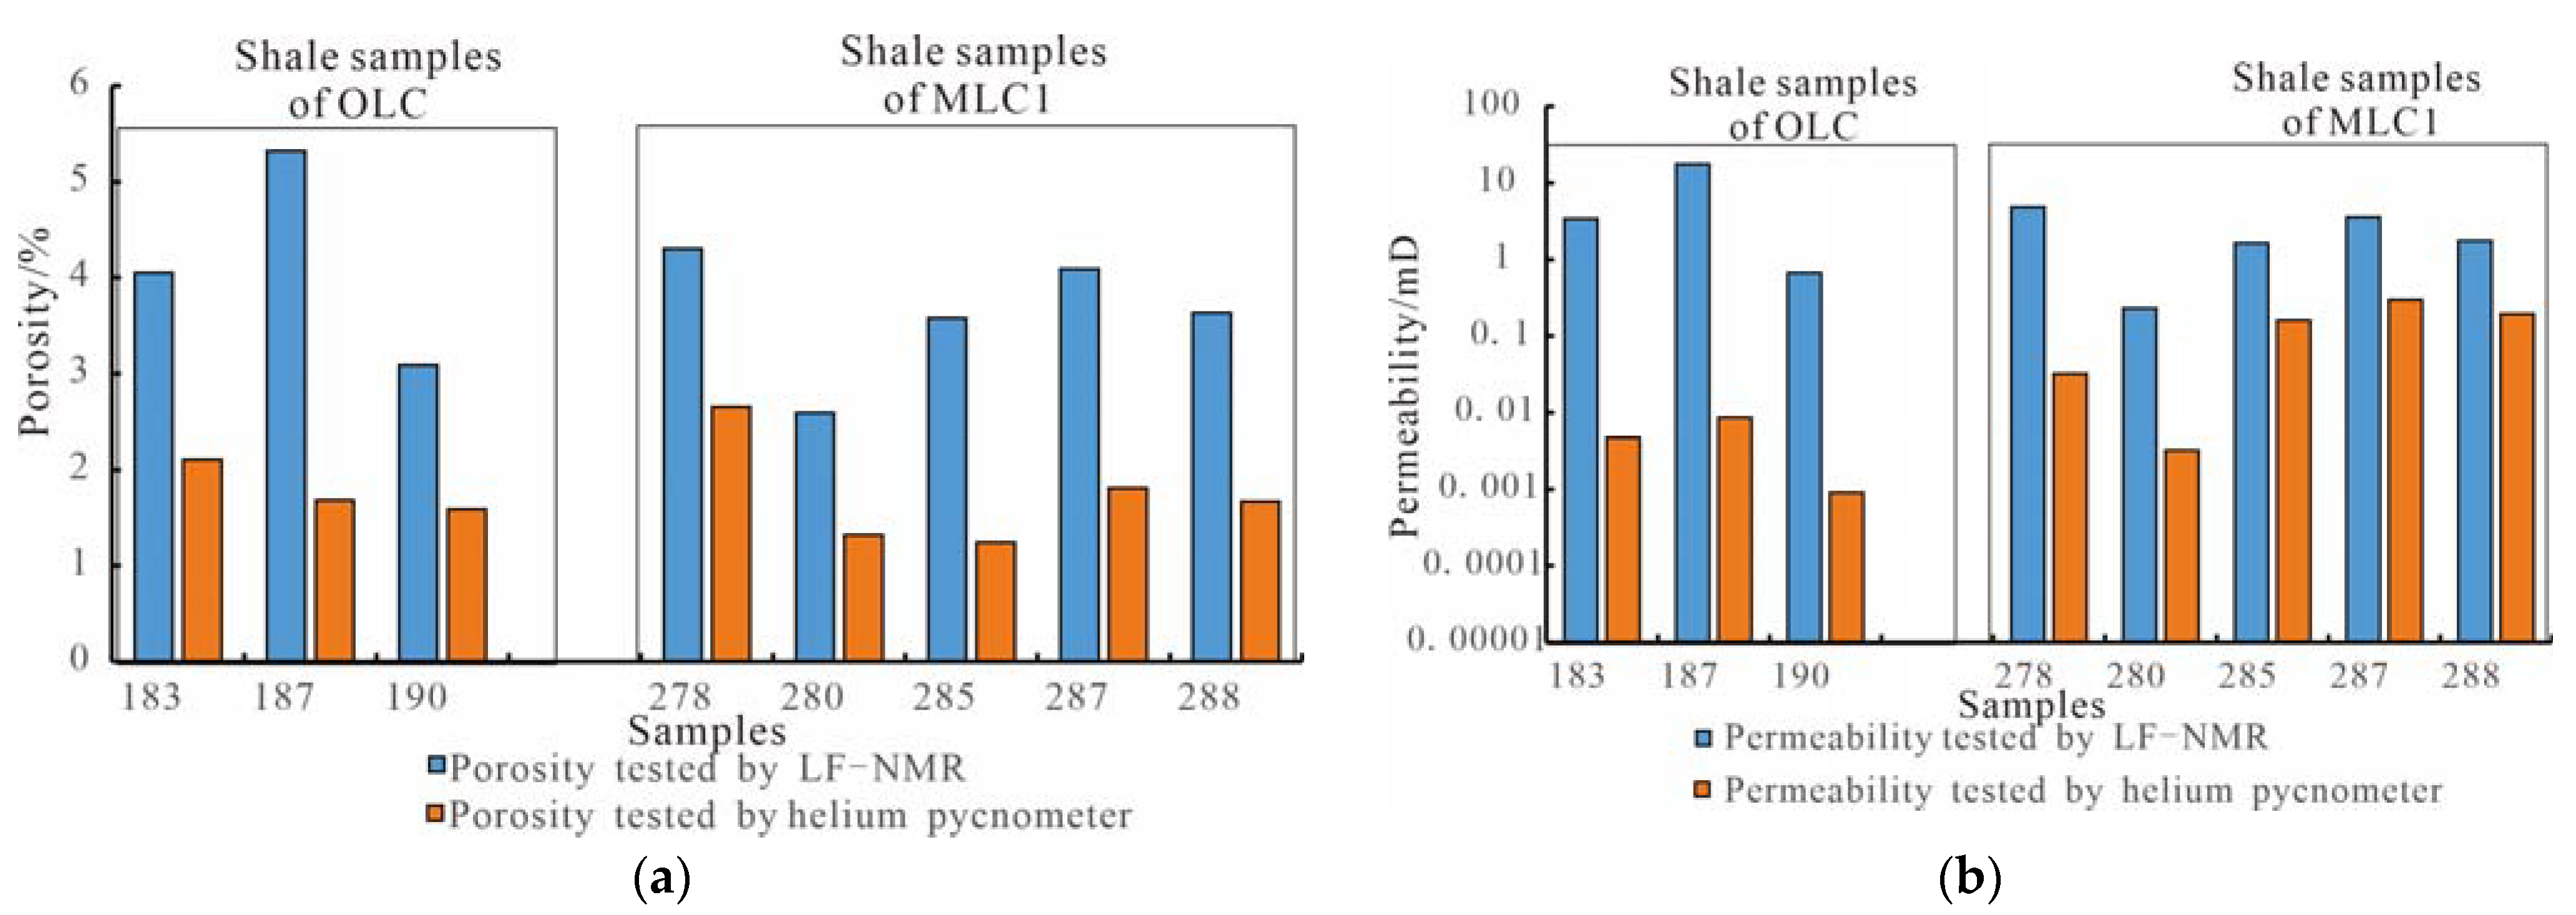
4.2.2. Porosity and Permeability

Eight samples were selected from OLC and MLC1 for analysis of porosity and permeability. The OLC samples exhibit a porosity of 3.09–5.32% (avg. 4.15%) and a permeability of 0.67–17.56 mD (avg. 7.22 mD) as tested by LF-NMR, and a porosity of 1.59–2.11% (avg. 1.80%) and permeability of 0.0009–0.0087 mD (avg. 0.0048 mD) as tested by helium pycnometer (Figure 3). The samples of MLC1 exhibit a porosity of 2.59–4.3% (avg. 3.64%) and permeability of 0.23–4.86 mD (avg. 2.42 mD) as tested by LF-NMR, and a porosity of 1.24–2.65% (avg. 1.76%) and permeability of 0.0032–0.2983 mD (avg. 0.14 mD) as tested by helium pycnometer (Figure 3). Clearly, the porosity tested by LF-NMR is significantly higher than that tested by helium pycnometer; so is the permeability. Moreover, the OLC and MLC1 samples have similar porosity but very different permeability. Especially the permeability of MLC1 is two orders of magnitude higher than that of OLC, indicating that MLC1 may contain relatively abundant microfractures or lamination conducive to gas flow.

4.2.3. BET Surface Area and BJH Pore Volume

For the P1s23 samples, the BET surface area is 0.68–32.39 m2/g (avg. 11.26 m2/g), and the BJH pore volume is 0.002–0.087 cm3/g (avg. 0.03 cm3/g); for the P1t samples, the BET surface area is 0.81–25.6 m2/g (avg. 8.51 m2/g), and the BJH pore volume is 0.00–0.054 cm3/g (avg. 0.02 cm3/g) (Figure 2). For samples in OCL, the BET surface area is 4.79–33.22 m2/g (avg. 14.34 m2/g), and the samples with the BET surface area of 10–15 m2/g account for 54.34%; for samples in MLC1, the BET surface area is 3.12–25.6 m2/g (avg. 13.9 m2/g), and the samples with the BET surface area of 15–20 m2/g account for 40% (Figure 4a). The MLC1 samples demonstrate a maximum BET surface area lower than the OLC samples but show a concentrated distribution of BET surface area with overall values significantly higher than the OLC samples. This indicates that MLC1 has a higher adsorbed gas content which is consistent with the study of Zhang et al. [33]. For OCL, the BJH pore volume is 0.012–0.087 cm3/g (avg. 0.033 cm3/g), and the samples with the BJH pore volume of 0.02–0.03 cm3/g account for 41.3%; for MLC1, the BJH pore volume is 0.011–0.054 cm3/g (avg. 0.029 cm3/g), and the samples with the BJH pore volume of 0.02–0.03 cm3/g account for 45% (Figure 4b). It can be seen that the BJH pore volume of OLC is equivalent to that of MLC1.
Compared with OLC, the TOC of MLC1 samples is much lower, while the porosity and BJH pore volume are equivalent, and the BET surface area is higher. The different origins of the organic matter in both OLC and MLC1 may lead to the above results. Large amounts of plant debris were found in shales of OLC, and the C/N ratios of the high TOC samples (TOC > 20%) are higher than 20, indicating most of the organic matter originating from terrestrial input [34], while in MLC1, the C/N ratios of high TOC samples (TOC 6.32–10.6%) range from 8.1–14.9, averages of 10.7, indicating organic matter mainly coming from marine origins. In addition, marine fossils such as foraminifera and sponge spicules are often found in MLC1 [33], which also verifies the great influence of the marine sea. Due to the difference in organic matter origins, the contribution of organic matter to pore development is also different. With terrestrial organic matter contributing less to the pore development in OLC, the samples in MLC1 with lower TOC have similar or even higher values of the reservoir’s physical properties.

4.3. Brittleness

The Brittleness index is an important parameter reflecting the reservoir fracturability. Shales with a higher brittleness index are more likely to form a complex fracture network. Currently, shale brittleness is quantitatively evaluated by the mineral composition or elastic parameters. In this study, the content of brittle minerals (mainly quartz, carbonate, and pyrite) was evaluated for target intervals. It is found that the content of brittle minerals is 23.1–73.2% (avg. 51.6%) for OLC and 19.5–100% (avg. 52.2%) for MLC1, slightly higher than the former. According to the results of rock mechanics tests, the vertical brittleness index is 33.73–62.36 (avg. 49.86) for OLC, and 53.34–58.27 (avg. 55.85) for MLC1, suggesting that MLC1 is more brittle than OLC, that is, MLC1 is more likely to form a complex fracture network.

5. Discussion

5.1. Sealing and Preservation Conditions

5.1.1. Regional Caprock

In the Ordos Basin, the Carboniferous–Permian gas reservoirs are discovered mainly in the Shihezi Formation, followed by the Shanxi Formation and Taiyuan Formation. The regional caprock is a set of lacustrine argillaceous rocks in the Upper Shihezi Formation, which is composed of sandy mudstone, silty sandstone, and mudstone, interbedded with a small amount of sandstone and tuff. The argillaceous rocks are generally 150–200 m thick, with the largest thickness found in the eastern part of the basin. The mudstone of the Upper Shihezi Formation has an absolute gas permeability of 10−4–10−5 mD, and a saturated gas breakthrough pressure of 1.5–2.0 MPa, indicating a strong sealing capacity [35].
For the P1s23 shale gas reservoir, P1s21+2 serves as the regional caprock and comprises thick fine sandstone, siltstone, and mudstone interbedded with coal seams, with the widespread carbonaceous mudstone and coal seam regionally, which are mainly 21.2–58 m thick. Overall, P1s21+2 presents a similar trend of thickness to P1s23. For the Taiyuan Formation, P1s23 is the regional caprock, which is 9.5–25.3 m thick and consists of carbonaceous mudstone and siltstone, as well as fine sandstone and medium sandstone locally [35]. From the end of the Late Paleozoic to the early Mesozoic, the Xingmeng Trough in the northern part and the Qinqi Trough in the southwestern part of the North China Craton were fully closed, and the Ordos block entered the stage of inland depressed lake basin [35]. The Shanxi Formation deposited in this period has gentle trending and no obvious faults [36]. Generally, the lagoon shale gas reservoirs of both P1t and P1s23 have good regional caprock and preservation conditions.

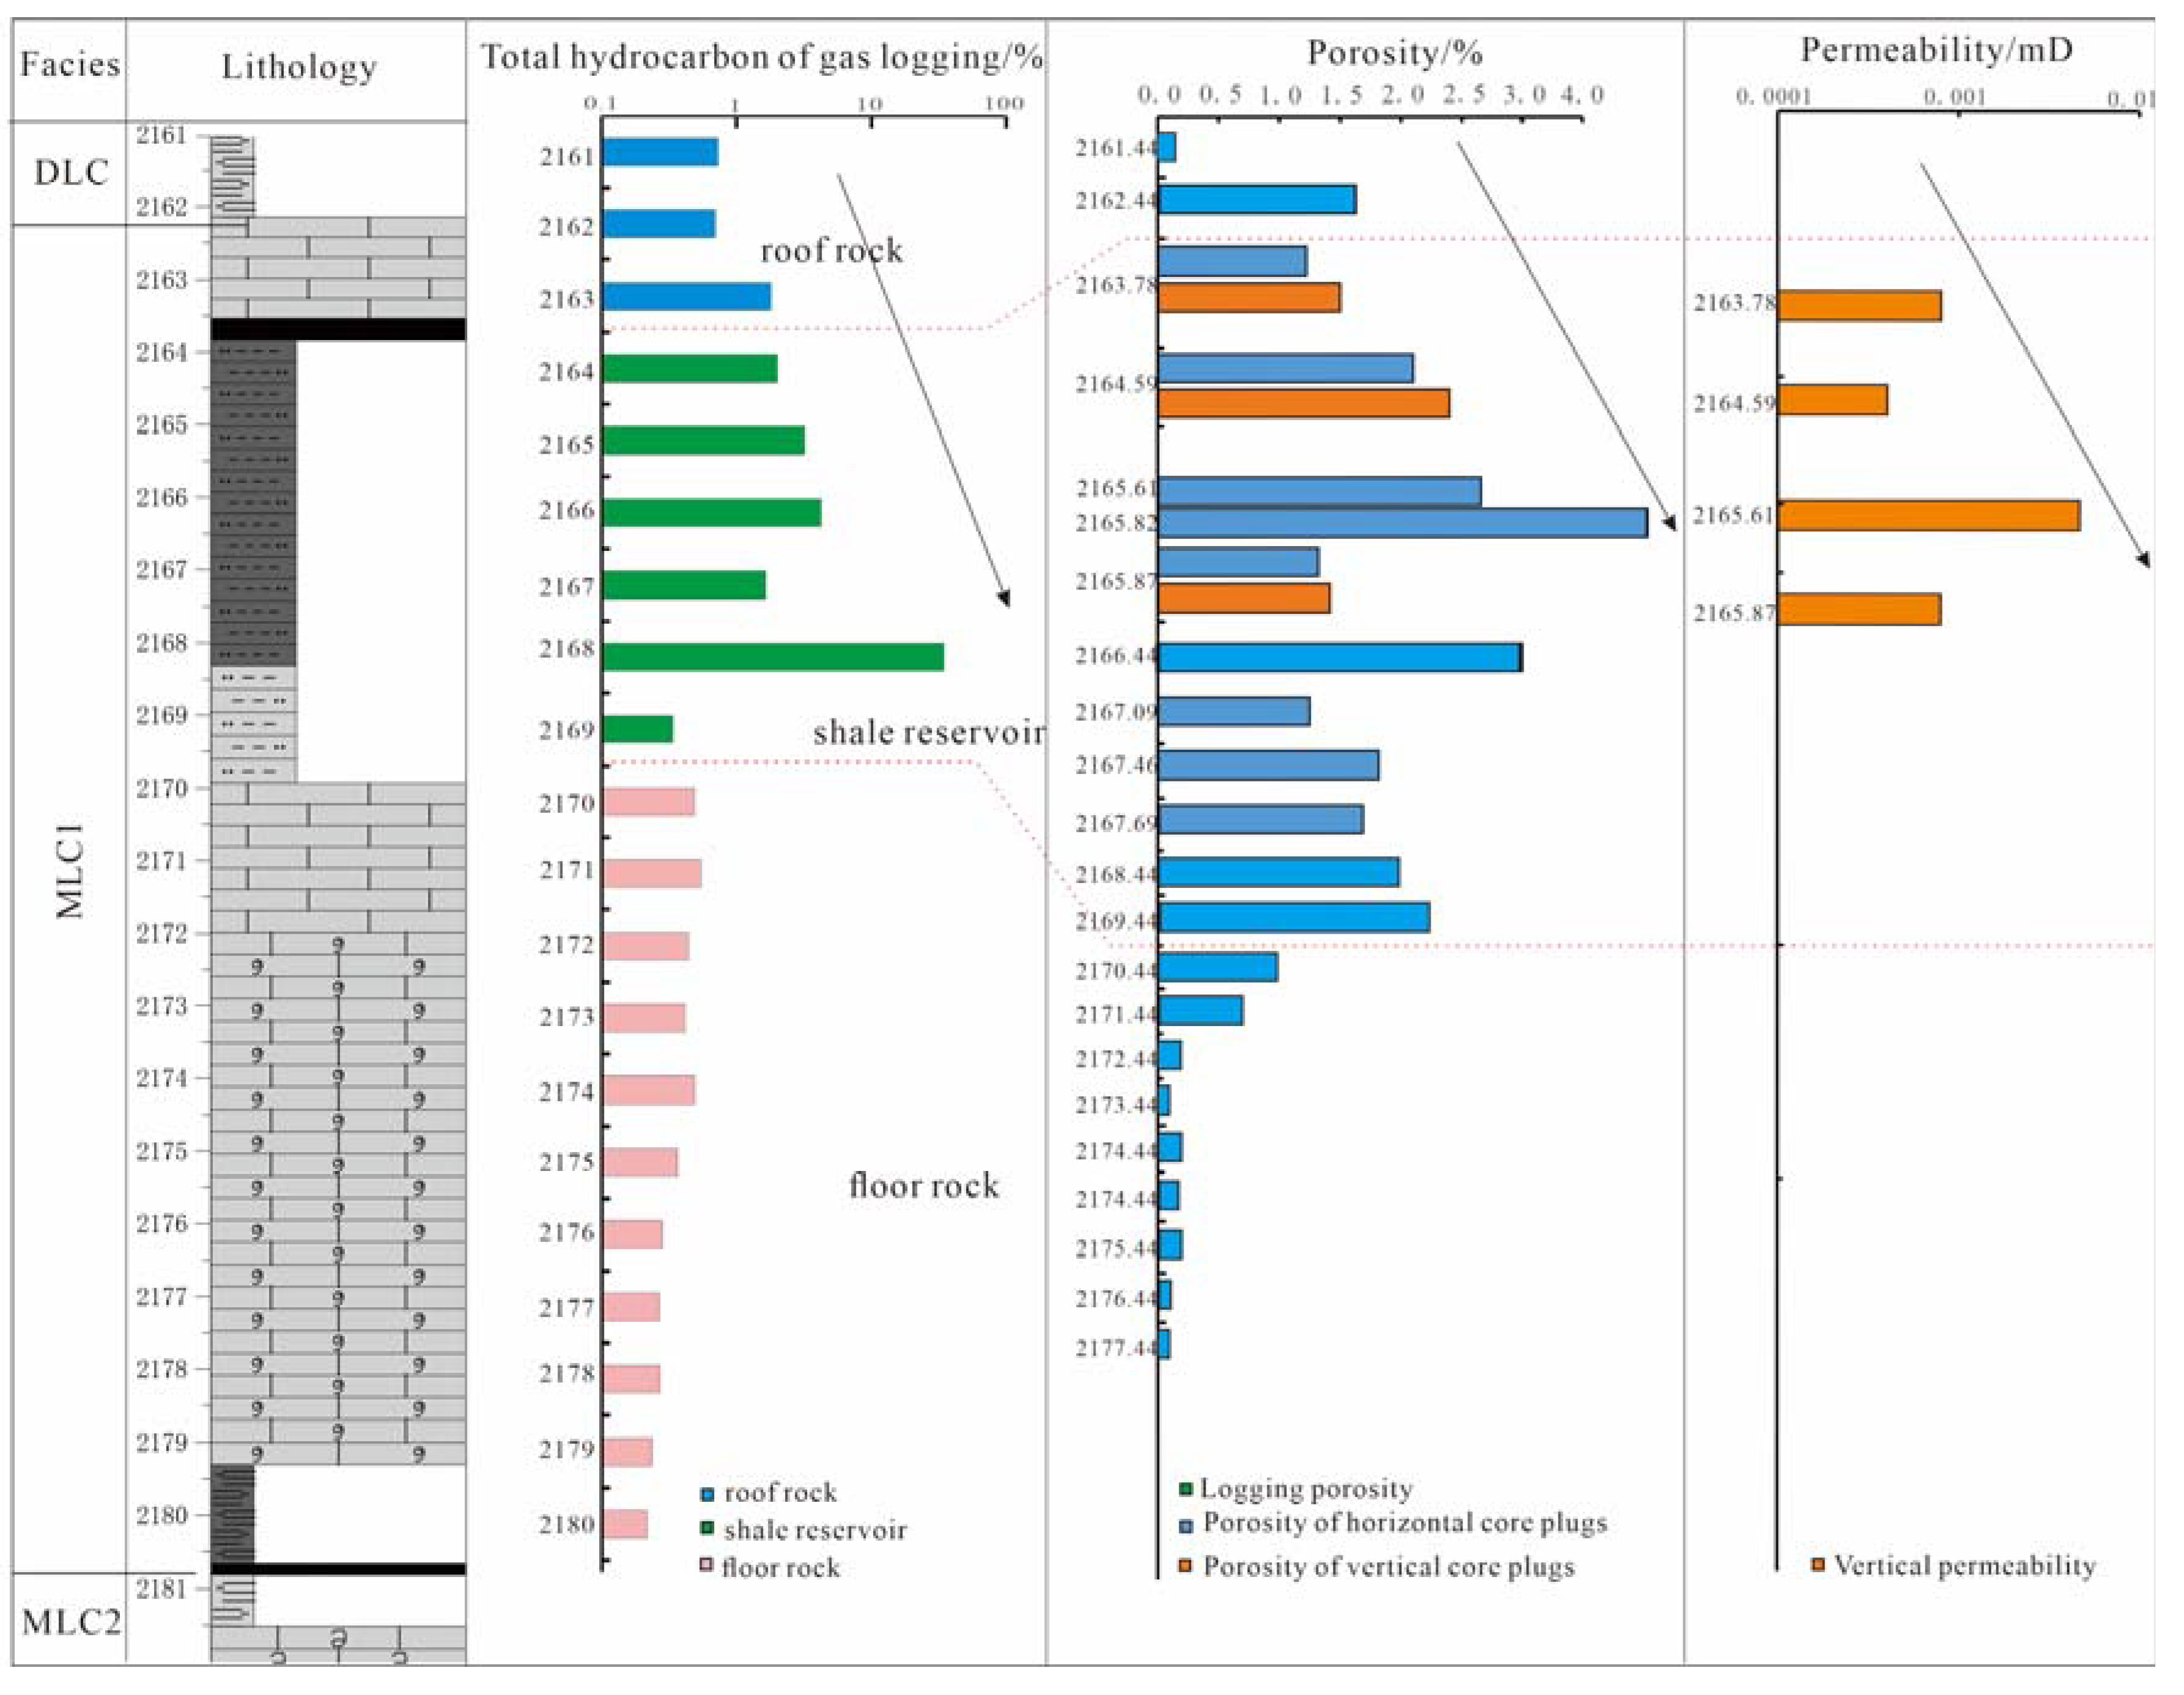
5.1.2. Direct Caprock

Shale gas is generated and stored in the same set of strata, but it still can transport given concentration difference. Therefore, direct caprock appears to be more important than regional caprock. At the top of OLC, there is a deposition of tidal-channel subfacies, which are mainly composed of coarse sandstone and fine sandstone, with tidal laminations and oblique laminations (Figure 5a–c). At the top of MLC1, there are the No.6 coal seam and carbonate rocks of platform facies, in which bioclasts are developed, most of which are fusuline, foraminifera, and echinoderms, and occasionally brachiopods, ostracods, and sponge spicules (Figure 5d–f).
For P1s23, the OLC lagoon shale and the roof tidal-channel sandstone were compared for porosity and permeability (Figure 6). For the tidal-channel sandstone, the porosities are 2.49–3.52% and 2.23–3.92%, respectively, for horizontal core samples and vertical core samples. For the lagoon shale, the porosities are 1.19–2.11% and 0.99–1.69%, respectively, for horizontal core samples and vertical core samples. In comparison, the porosity of the tidal-channel sandstone is higher than that of the lagoon shale. As tested by N2 adsorption, the pore volume of the tidal-channel sandstone is 0.0168–0.0267 cm3/g (avg. 0.023 cm3/g), smaller than that (0.012–0.087 cm3/g, or avg. 0.033 cm3/g) of the lagoon shale, indicating that there are some microfractures or larger pores in the tidal-channel sandstone to enable it to have a higher porosity than the lagoon shale. The permeability was used to evaluate the sealing capacity of direct caprock. It is found that the permeability (0.0041–0.012 mD) of the tidal-channel sandstone is much higher than that (0.0001–0.0005 mD) of the lagoon shale, further verifying the existence of preferential pathways, or microfractures, for gas flow in the roof tidal-channel sandstone, which disables the physical seal at the top of the lagoon shale of P1s23. Therefore, the gas generated in OLC was probably to be transported to the overlying tidal-channel sandstone under the dual action of gas concentration difference and preferential pathways. At the floor of the lagoon shale of P1s23, there are deposits of overflow fan, delta front, estuary bar, delta plain, and prodelta subfacies, and the lithology is mainly fine sandstone and siltstone with a few thin mudstone layers. There are no measured porosity and permeability data of the floor rocks, but the logging interpretation indicates that the floor rocks have a porosity of less than 0.5% and a BJH pore volume of 0.019–0.040 cm3/g (avg. 0.033 cm3/g), equivalent to OLC. The deltaic sandstone is generally a good conventional gas reservoir due to its higher permeability than the lagoon shale. As a result, the gas generated from the lagoon shale can also migrate downward, further reducing the amount of gas retained in the lagoon shale. So in the vertical direction, the gas generated in OLC can be transported upwards and downwards. The value of total hydrocarbon by gas logging in the upper TLC is much higher than that in the OLC, while the value in lower DLC is slightly higher than that in OLC (Figure 6), which also verifies the conclusion reached above.
For the Taiyuan Formation, the MCL1 lagoon shale and its direct caprock were compared for porosity and permeability (Figure 7). For the direct caprock–limestone, the average logging porosity is 1.72%. For the lagoon shale, the porosities are 1.22–4.25% (avg. 2.0%) and 1.22–4.25% (avg. 2.0%), respectively, for horizontal core samples and vertical core samples. For the limestone at the floor of MLC1, the logging porosity is ˂1%, and mostly ˂0.5%. It can be seen that the porosity of the lagoon shale is close to that of the roof limestone but much higher than that of the floor limestone. Low-temperature N2 adsorption results show that the pore volume of the roof limestone (0.003–0.054 cm3/g, or avg. 0.017 cm3/g) and the pore volume of the floor limestone (0.008–0.010 cm3/g, or avg. 0.009 cm3/g) is much smaller than the pore volume of the lagoon shale (0.011–0.054 cm3/g, or avg. 0.029 cm3/g). The parallel permeability of the lagoon shale ranges from 0.0004 mD to 0.0047 mD, with an average of 0.0007 mD, but the measured permeability data of the roof and floor limestones are not available. Nonetheless, according to the porosity and BJH pore volume data, the roof and floor limestones are characterized by low porosity and low permeability, indicating good sealing capacity (Figure 7). Moreover, the roof limestone has a TOC of 0.29–1.61% (avg. 0.74%) and features the oil-prone kerogen [37], which meets the lower limit of TOC for carbonate as source rock. Therefore, the gas generated from the MLC1 lagoon shale is prevented from migrating upward by the roof limestone. Instead, the gas generated from the roof limestone can change the underlying shale under the differential flow pressure. In addition, the No. 6 coal seam between the roof limestone and the lagoon shale can generate a large amount of gas to form a hydrocarbon concentration seal for the underlying shale, allowing the gas to remain in the shale. The floor limestone has TOC of 0.08–3.35% (avg. 1.61%) (Figure 2B), meeting the criterion of carbonate as source rock. Thus, the floor limestone can serve as the physical seal for the lagoon shale but also provide a gas source, which is favorable for the retention of lagoon shale gas. In addition, the porosity and permeability, the value of total hydrocarbon by gas logging in the shale are much higher than both upper and downward limestone (Figure 7), which indicates that gas generated in the shale can be retained in the reservoir without transporting to upwards and downwards.
Due to poor preservation conditions, the gas content measured on-site in the OLC is lower than in MLC1. The gas content of OLC is 0.7–2.22 m3/t (avg. 1.21 m3/t), indicating a huge variation between the upper and lower limits. By contrast, the gas content of MLC1 is evenly distributed, and the gas content of all three samples is higher than 1.5 m3/t, with an average of 1.57 m3/t (Table 2). It is concluded that the MLC1 shale is more homogeneous and has higher gas content than the OLC shale.

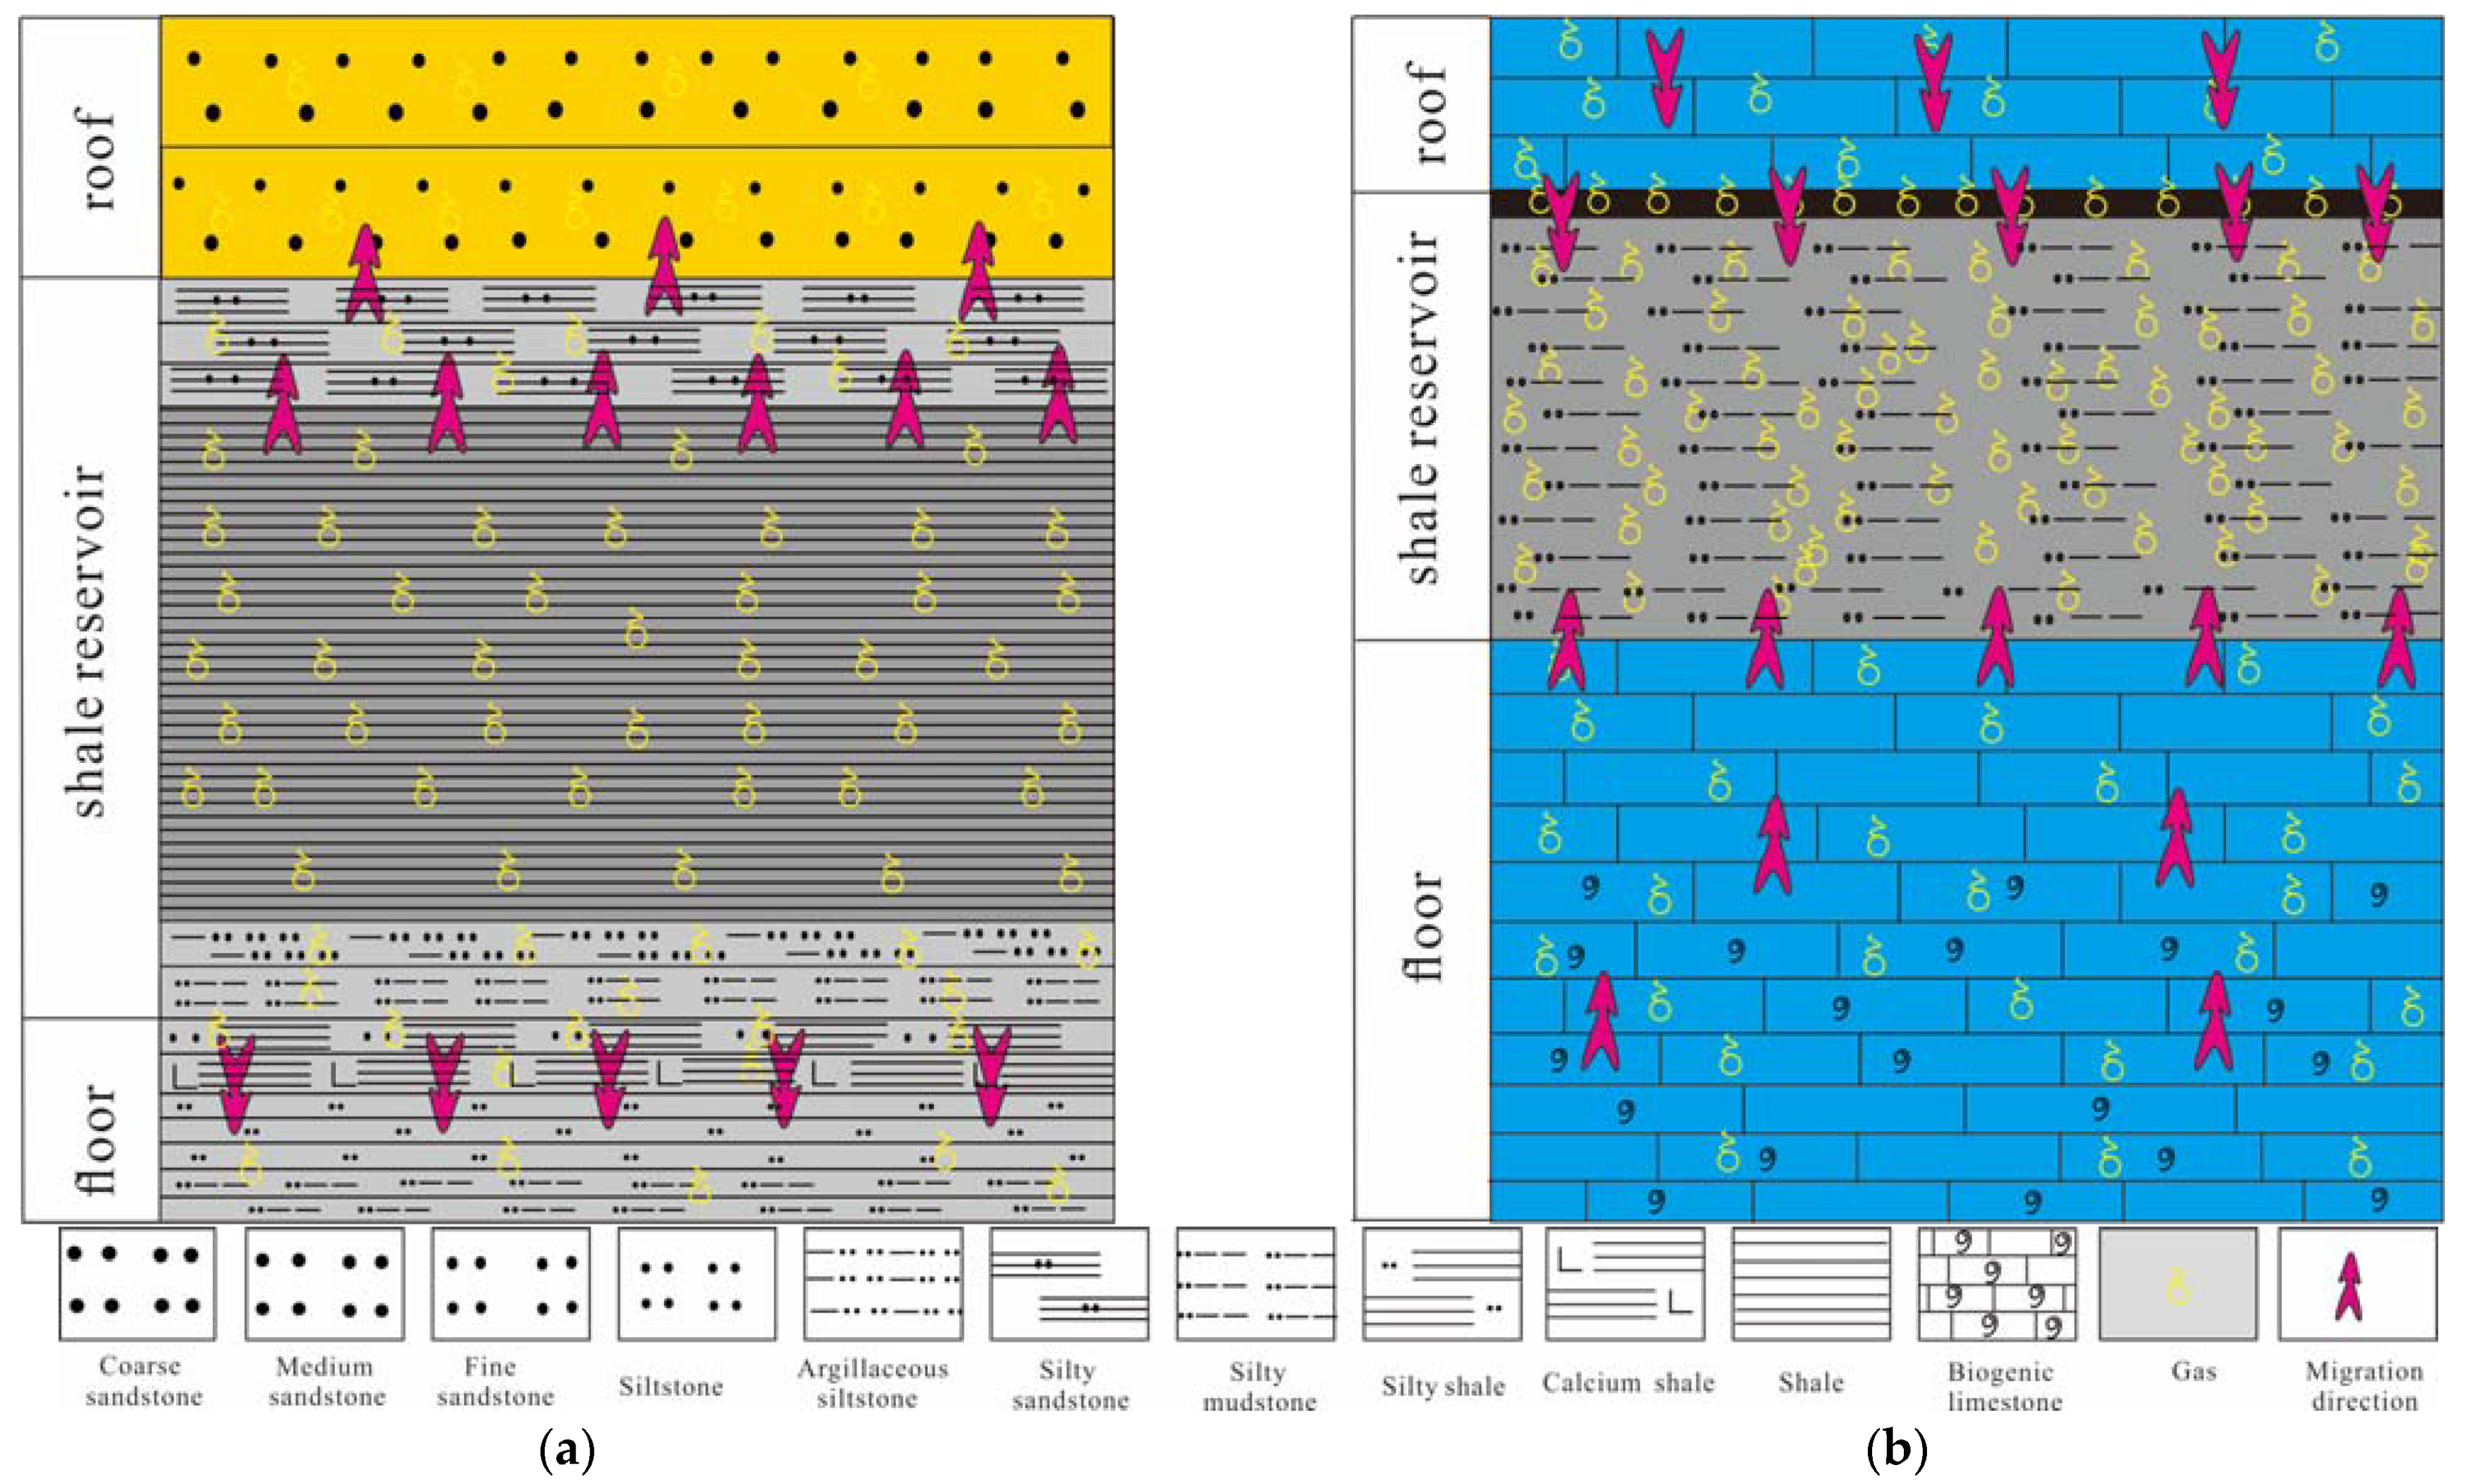
5.2. Shale Gas Accumulation Model for Both OLC and MLC1

By comprehensive analysis of organic geochemical characteristics, reservoir properties, specific surface area, brittleness, and sealing and preservation conditions, the shale gas accumulation models of OLC and MLC1 are established (Figure 8). OLC has higher TOC and lower brittleness index than MLC1 and similar reservoir properties to MLC1. OLC contains mainly type II2 organic matter and has a BET surface area in the range of 10–15 m2/g. OLC’s direct caprock is tidal-channel sandstone, which has lower TOC and high permeability. The gas generated in OLC could diffuse and migrate upward under the effect of concentration difference and preferential pathways. As a result, the gas content of OLC is unevenly distributed, with the gas-logging total hydrocarbon ranging from 0.375 to 3.18 (avg. 1.19). The tidal-channel sandstone has gas-logging total hydrocarbon between 0.58 and 6.09 (avg. 3.12) (Figure 6), which is much higher than the underlying lagoon shale, further indicating that the gas generated in the shale has migrated upward. In contrast, MLC1 has a TOC slightly lower than OLC, but reservoir properties (especially the permeability) are not inferior to OLC. In addition, MLC1 exhibits the BET surface area of 15–20 m2/g. The porosity and permeability of the overlying and underlying MCL1 limestone are significantly lower than those of the MLC1 lagoon shale, indicating that the limestone can seal the lagoon shale gas both upward and downward. In addition, the limestone featured by the oil-prone kerogen type meets the TOC criterion of effective source rock. In addition to acting as the physical seal, the limestone can provide a gas charge to the lagoon shale. The coal seam above the lagoon shale also has a favorable hydrocarbon-generating capacity and can form a hydrocarbon concentration seal for the MLC1 lagoon shale. Therefore, the MLC1 lagoon shale has a high content of retained hydrocarbons, with a gas-logging total hydrocarbon of 0.338–34.46 (avg. 8.23), which is much higher than OLC, and more homogeneous gas content measured on site (>1.5 m3/t for all samples) than OLC. To sum up, MLC1 is superior to OLC, and it is a sweet interval for transitional shale gas enrichment.

5.3. Significance to the Shale Gas Exploration and Development

It is believed that organic-rich shale acts as not only source rock but also reservoir rock and caprock in a shale gas accumulation system. However, the marine shale exploration practices in southern China prove that the exploration effects vary greatly regardless of little difference in shale quality, suggesting that the caprock and preservation conditions of shale gas are also key factors to be considered in shale gas exploration. Nie et al. [38] and Sun et al. [39] discussed the shale gas enrichment mechanism in the Sichuan Basin and the Weiyuan block in southern China from the source-caprock perspective, and they concluded that preservation conditions are the main controlling factor for shale gas accumulation with similar shale quality.
Compared with marine shale, transitional shale is characterized by fast sedimentary facies transition, poor lateral continuity, thin reservoir thickness, and high clay content. This also means more challenges for transitional shale gas exploration. The lithology of transitional facies is more complex and generally contains shale, mudstone, sandstone, coal, and limestone. In the vertical direction, these multi-lithologies usually overlap, with coal and shale as source rocks. In the condition of high thermal maturity, organic matter enrichment determines the gas generation capacity, but the top and bottom conditions of different lithologic assemblages and the development degree of microfractures eventually determine the remaining gas content in the shale. In the transitional shale gas exploration and development, there are mainly multiple combination modes, such as top and bottom tight limestone, top and bottom sandstone, top mudstone and bottom limestone, top and bottom shale, etc. In these combination modes, preservation conditions both upwards and downwards should be considered. It is necessary to find a suitable lithologic combination to ensure that the shale still has a high concentration of hydrocarbon gas. The two models proposed above in Section 5.2 are a comparison of two different lithologic combinations, which are intended to reveal the importance of the lithologic combinations for shale gas preservation and provide reference suggestions for shale gas exploration in transitional facies.

6. Conclusions

Based on the comprehensive analysis of organic geochemical characteristics, reservoir properties, brittleness, gas content, and preservation conditions of the Permian Shanxi Formation and Taiyuan Formation in the eastern margin of the Ordos Basin, the following four conclusions are obtained.
(1)
There are three lagoon facies combinations in P1s23, among which OLC has the highest TOC and is the optimal interval for shale gas enrichment in P1s23. There are two lagoon facies combinations in the Taiyuan Formation, among which MLC1 is the optimal interval for shale gas enrichment.
(2)
The reservoir physical characteristics of OLC and MLC1 are similar, but the shale in MLC1 is more brittle than that in OLC, indicating that MLC1 is more likely to form a complex fracture network when being fractured.
(3)
Due to the different lithologies, the preservation conditions of MLC1 is more superior for shale gas retention, which makes the gas content in MLC1 much higher and more favorable for shale gas exploration.
(4)
For transitional shale gas exploration, it is necessary to compare the hydrocarbon generation, reservoir storage, and preservation conditions among different lithologic combinations and single out the most suitable combination for transitional shale gas exploration.

Author Contributions

Conceptualization, Q.Z. and Z.Q.; Investigation, X.L. (Xingtao Li), W.X. and C.F.; Methodology, W.L., D.L., X.L. (Xiang Li), H.Y. and Y.X.; data curation, Q.Z. and W.X.; analysis, Z.Q. and X.L. (Xiang Li); Writing—Original draft, Q.Z.; Writing—Review & editing, Z.Q., W.X. and X.L. (Xingtao Li). All authors have read and agreed to the published version of the manuscript.

Funding

This research was funded by the Scientific Research and Technological Development Programs of Research Institute of Petroleum Exploration and Development (RIPED) (No. 2021yjcq02) and CNPC (No. 2021DJ2001).

Institutional Review Board Statement

Not applicable.

Informed Consent Statement

Not applicable.

Data Availability Statement

Not applicable.

Conflicts of Interest

The authors declare no conflict of interest.

References

  1. Zou, C.N.; Dong, D.Z.; Wang, Y.; Li, X.; Huang, J.; Wang, S.; Guan, Q.; Zhang, C.; Wang, H.; Liu, H. Shale gas in China: Characteristics, challenges and prospects (I). Pet. Explor. Dev. 2015, 42, 689–701. [Google Scholar]
  2. Zou, C.N.; Dong, D.Z.; Wang, Y.; Li, X.; Huang, J.; Wang, S.; Guan, Q.; Zhang, C.; Wang, H.; Liu, H. Shale gas in China: Characteristics, challenges and prospects (II). Pet. Explor. Dev. 2016, 43, 166–178. [Google Scholar]
  3. Ma, X.H. Natural gas and energy revolution: A case study of Sichuan-Chongqing gas province. Nat. Gas Ind. B 2017, 37, 91–99. [Google Scholar]
  4. Ma, X.H.; Xie, J. The progress and prospects of shale gas exploration and exploitation in southern Sichuan Basin, NW China. Pet. Explor. Dev. 2018, 45, 161–169. [Google Scholar]
  5. Ma, X.H.; Xie, J.; Yong, R. Geological characteristics and high production control factors of shale gas in Silurian Longmaxi Formation, southern Sichuan Basin, SW China. Pet. Explor. Dev. 2020, 47, 901–915. [Google Scholar]
  6. Li, L.G. Development of natural gas industry in China: Review and prospect. Nat. Gas Ind. 2021, 41, 187–196. [Google Scholar]
  7. Tang, X.; Zhang, J.C.; Ding, W.L.; Yu, B.S.; Wag, L.; Ma, Y.L.; Yang, Y.T.; Chen, H.Y.; Huang, H.; Zhao, P.W. The reservoir property of the Upper Paleozoic marine-continental transitional shale gans its gas-bearing capacity in the Southeastern Ordos Basin. Earth Sci. Front. 2016, 23, 147–157. [Google Scholar]
  8. Zou, C.N.; Zhao, Q.; Dong, D.Z.; Yang, Z.; Qiu, Z.; Liang, F.; Wang, N.; Huang, Y.; Duan, A.X.; Zhang, Q.; et al. Geological characteristics, main challenges and future prospect of shale gas. Nat. Gas Geosci. 2017, 2, 1781–1796. [Google Scholar]
  9. Kuang, L.C.; Dong, D.Z.; He, W.Y.; Wen, S.M.; Sun, S.S.; Li, S.X.; Qiu, Z.; Liao, X.W.; Li, Y.; Wu, J.; et al. Geological characteristics and development potential of transitional shale gas in the east margin of the Ordos Basin, NW China. Pet. Explor. Dev. 2020, 47, 435–446. [Google Scholar]
  10. Dong, D.Z.; Qiu, Z.; Zhang, L.F.; Li, S.X.; Zhang, Q.; Li, X.T.; Zhang, S.R.; Liu, H.L.; Wang, Y.M. Progress on sedimentology of transitional facies and new discoveries of shale gas. Acta Sedimentol. Sin. 2021, 39, 29–45. [Google Scholar]
  11. Feng, Z.Q. Characteristics and Evaluation of the Organic-Rich Shale of Shanxi Formation, Southeast in Ordos Basin. Master’s Thesis, China University of Geosciences, Beijing, China, 2014. [Google Scholar]
  12. Zhao, K.Y.; Guo, S.B. Characteristics and main controlling factors of shale gas reservoirs in transitional facies: A case study of Upper Paleozoic in Ordos Basin. Pet. Geol. Exp. 2015, 37, 141–149. [Google Scholar]
  13. Yang, C.; Zhang, J.C.; Han, S.B.; Wang, X.Z.; Wang, L.; Yu, W.W.; Wang, Z.G. Compositional controls on pore-size distribution by nitrogen adsorption technique in the Lower Permian Shanxi Shales, Ordos Basin. J. Nat. Gas Sci. Eng. 2016, 34, 1369–1381. [Google Scholar]
  14. Sun, Z.P.; Wang, Y.L.; Wei, Z.F.; Zhang, M.F.; Wang, G.; Wang, Z.X.; Zhuo, S.G.; Xu, L. Shale gas content and geochemical characteristics of marine-continental transitional shale: A case from the Shanxi formation of Ordos Basin. J. China Univ. Min. Technol. 2017, 46, 859–868. [Google Scholar]
  15. Xiong, F.Y.; Jiang, Z.X.; Li, P.; Wang, X.Z.; Bi, H.; Li, Y.R.; Wang, Z.Y.; Amooir, M.; Soltanian, M.R.; Moortgat, J. Pore structure of transitional shales in the Ordos Basin, NW China: Effects of composition on gas storage capacity. Fuel 2017, 206, 504–515. [Google Scholar]
  16. Liu, H.L.; Wang, H.C.; Zhang, H.; Zhao, W.B.; Liu, Y.; Liu, D.X. Geological characteristics and exploration countermeasures of shale gas in the Shanxi Formation of the Ordos basin. Acta Geol. Sin. 2020, 94, 905–915. [Google Scholar]
  17. Dai, J.X.; Zou, C.N.; Dong, D.Z.; Ni, Y.Y.; Wu, W.; Gong, D.Y.; Wang, Y.M.; Huang, S.P.; Huang, J.L.; Fang, C.C.; et al. Geochemical characteristics of marine and terrestrial shale gas in China. Mar. Pet. Geol. 2016, 76, 444–463. [Google Scholar]
  18. Wang, J.; Guo, S. The whole-aperture pore-structure characteristics of marine-continental transitional shale facies of the Taiyuan and Shanxi Formations in the Qinshui Basin, North China. Interpretation 2019, 7, T547–T563. [Google Scholar]
  19. Xue, C.Q.; Wu, J.G.; Qiu, L.W.; Zhong, J.H.; Zhang, S.R.; Zhang, B.; Wu, X.; Hao, B. Lithofacies classification and its controls on the pore structure distribution in Permian transitional shale in the northeastern Ordos Basin, China. J. Pet. Sci. Eng. 2020, 195, 107657. [Google Scholar]
  20. Chen, Y.H.; Wang, Y.B.; Guo, M.Q.; Wu, H.Y.; Li, J.; Wu, W.T.; Zhao, J.Z. Differential enrichment mechanism of organic matters in the marine-continental transitional shale in northeastern Ordos Basin, China: Control of sedimentary environments. J. Nat. Gas Sci. Eng. 2020, 83, 103625. [Google Scholar]
  21. Wei, Z.F.; Wang, Y.L.; Wang, G.; Zhang, T.; He, W.; Ma, X.Y.; Yu, X.L. Enrichment Mechanism of the Upper Carboniferous-Lower Permian Transitional Shale in the East Margin of the Ordos Basin, China: Evidence from Geochemical Proxies. Geofluids 2020, 2020, 8867140. [Google Scholar] [CrossRef]
  22. Zhang, L.F.; Dong, D.Z.; Qiu, Z.; Wu, C.J.; Zhang, Q.; Wang, Y.M.; Liu, D.X.; Deng, Z.; Zhou, S.W.; Pan, S.Q. Sedimentology and geochemistry of Carboniferous-Permian marine-continental transitional shales in the eastern Ordos Basin, North China. Palaeogeogr. Palaeoclimatol. Palaeoecol. 2021, 571, 110389. [Google Scholar]
  23. Gu, Y.F.; Cai, G.Y.; Li, S.X.; Jiang, Y.Q.; Qiu, Z.; Sun, S.S.; Fu., Y.H. Pore structure and controlling factors of different lithofacies in transitional shale: A case study of the Shanxi Formation Shan23 submember, eastern Ordos Basin. Acta Sedimentol. Sin. 2023, 41, 318–332. [Google Scholar]
  24. Qin, Y.; Liang, J.S.; Shen, J.; Liu, Y.H.; Wang, C.W. Gas logging shows and gas reservoir types in tight sandstones and shales from southern Qinshui Basin. J. China Coal Soc. 2014, 39, 1559–1565. [Google Scholar]
  25. Lan, C.L.; Guo, W.; Wang, Q.; Zhang, X. Shale gas accumulation condition and favorable area optimization of the Permian Shanxi Formation, Eastern Ordos Basin. Acta Geol. Sin. 2016, 90, 177–188. [Google Scholar]
  26. Gu, Y.F.; Li, X.T.; Qi, L.; Li, S.X.; Jiang, Y.Q.; Fu, Y.H.; Yang, X.S. Sedimentology and Geochemistry of the Lower Permian Shanxi Formation Shan 23 Submember Transitional Shale, Eastern Ordos Basin, North China. Front. Earth Sci. 2022, 10, 859845. [Google Scholar] [CrossRef]
  27. Wang, D.; Struck, U.; Ling, H.F.; Guo, Q.J.; Shields-Zhou, G.A.; Zhu, M.Y.; Yao, S.P. Marine redox variations and nitrogen cycle of the early Cambrian southern margin of the Yangtze Platform, South China: Evidence from nitrogen and organic carbon isotopes. Precambrian Res. 2015, 267, 209–226. [Google Scholar]
  28. Tian, D.; Harris, N.B.; Ayranci, K.; Twemlow, C.E.; Nassichuk, B.R. Porosity characteristics of the Devonian Horn River shale, Canada:Insights from lithofacies classification and shale composition. Int. J. Coal Geol. 2015, 141–142, 74–90. [Google Scholar]
  29. Yuan, Y.J.; Rezaee, R.; Verrall, M.; Hu, S.Y.; Zou, J.; Testmanti, N. Pore characterization and clay bound water assessment in shale with a combination of NMR and low-pressure nitrogen gas adsorption. Int. J. Coal Geol. 2018, 194, 11–21. [Google Scholar] [CrossRef]
  30. Sun, M.; Yu, B.; Hu, Q.; Chen, S.; Xia, W.; Ye, R. Nanoscale pore characteristics of the lower Cambrian Niutitang formation shale: A case study from well yuke #1 in the southeast of Chongqing, China. Int. J. Coal Geol. 2016, 154–155, 16–29. [Google Scholar] [CrossRef]
  31. Brunauer, S.; Emmett, P.H.; Teller, E. Adsorption of gases in multimolecular layers. J. Am. Chem. Soc. 1938, 60, 309–319. [Google Scholar]
  32. Barrett, E.P.; Joyner, L.G.; Halenda, P.P. The determination of pore volume and area distributions in porous substances. Computations from nitrogen isotherms. J. Am. Chem. Soc. 1951, 73, 373–380. [Google Scholar]
  33. Zhang, L.F.; Zhao, Q.; Wu, C.; Qiu, Z.; Zhang, Q.; Wang, Y.M.; Liu, D.; Dong, D.Z.; Zhou, S.W. Pore structures of the Lower Permian Taiyuan shale and limestone in the Ordos Basin and the significance to unconventional natural gas generation and storage. Geofluid 2022, 2022, 3156547. [Google Scholar] [CrossRef]
  34. Emerson, S.; Hedges, J.I. Processes controlling the organic carbon content of open ocean sediments. Paleoceanography 1988, 3, 621–634. [Google Scholar]
  35. Tian, W. Sedimentary System Study of Permian Shaanxi Formation in South-Eastern of Ordos Basin. Ph.D. Thesis, Northwest University, Xi’an, China, 2016. [Google Scholar]
  36. Zhu, R.X.; Chen, L.; Wu, F.Y.; Liu, J.L. Timing, scale and mechanism of the destruction of the North China Craton. Sci. China Earth Sci. 2011, 41, 789–797. [Google Scholar] [CrossRef]
  37. Zhang, L.F.; Zhao, Q.; Peng, S.Z.; Qiu, Z.; Feng, C.J.; Zhang, Q.; Wang, Y.M.; Dong, D.Z.; Zhou, S.W. Paleoenvironment and Organic Matter Accumulation Mechanism of Marine–Continental Transitional Shales:Outcrop Characterizations of the Carboniferous–Permian Strata, Ordos Basin, North China. Energies 2021, 14, 7445. [Google Scholar] [CrossRef]
  38. Nie, H.K.; Jin, Z.J.; Bian, R.K.; Du, W. The “source-cap hydrocarbon-controlling” enrichment of shale gas in Upper Ordovician Wufeng Formation-Lower Silurian Longmaxi Formation of Sichuan Basin and its periphery. Acta Pet. Sin. 2016, 37, 557–571. [Google Scholar]
  39. Sun, C.X.; Nie, H.K.; Xiong, L.; Du, W.; Chen, Q.; Li, D.H. Main geological factors of enrichment and high yield of deep shale gas reservoirs in Weiyuan area, Sichuan Basin: Analyzed from the perspective of source-cap controlling hydrocarbon. Mar. Orig. Pet. Geol. 2021, 27, 135–145. [Google Scholar] [CrossRef]
Figure 1. (a) Location map of the study area in the Ordos Basin. The red dot shows the position of a well (DJ3-4) in the study area. and (b) stratigraphic column of Shanxi Formation–Taiyuan Formation in the Ordos Basin.
Energies 16 03710 g001
Figure 2. Stratigraphic column, sedimentary environment, TOC, mineral composition, and Ro of P1s23 and P1t in the Ordos Basin.
Energies 16 03710 g002
Figure 3. (a) Porosity and (b) permeability of OLC and MLC1 samples.
Energies 16 03710 g003
Figure 4. (a) BET surface area and (b) BJH pore volume of OLC and MLC1.
Energies 16 03710 g004
Figure 5. Photogs of tidal-channel sandstone of P1s23 and carbonate rock of P1t1. (a) Tidal-channel sandstone of P1s23, cross-bedding, 2136.4 m; (b) Lithology boundary of tidal-channel sandstone of P1s23, 2135.10 m; (c) Fine- to medium-grained feldspathic lithic sandstone, 2133.63 m; (d) Carbonate of P1t, 2195–9195.4 m [33]; (e) Bioclastic limestone, cross-polarized light, echinoderms, 2164.02 m; (f) Bioclastic limestone, cross-polarized light, 2164.69 m.
Energies 16 03710 g005
Figure 6. Gas-logging total hydrocarbon, porosity, and permeability of P1s23.
Energies 16 03710 g006
Figure 7. Gas-logging total hydrocarbon, porosity, and permeability of MCL1.
Energies 16 03710 g007
Figure 8. Shale gas accumulation models of (a) OLC and (b) MLC1.
Energies 16 03710 g008
Table 1. TOC and mineral composition of representative samples of P1s23 and P1t in the Ordos Basin.
HorizonTOC/%Quartz/%Plagioclase/%Siderite/%Carbonate/%Pyrite/%Clay/%
P1s230.03–81.5/5.122.3–64.3/38.50–16.8/2.20–59.7/3.70–50.5/3.80–16.3/1.21.4–97.7/49.9
TLC0.03–8.81/1.004.4–64.3/40.70–16.8/4.40–44.6/4.20–36.3/5.40–6.8/0.2711.6–95.6/44.7
OLC0.11–43.9/7.910.7–61.8/43.20–10/0.390–59.7/2.60–50.5/4.70–16.3/3.112.5–67/46.1
DLC0.74–2.96/1.755.5–45.1/34.60–7/1.80–44.4/4.10–92.1/2.80–3.5/0.51.4–71.5/56.4
P1t0.08–26.6/3.140–75.5/22.30–4.0/0.20–56/1.80–100/47.40–12.8/1.70–91.3/32.7
MLC10.08–26.6/3.720–70.4/22.50–4.0/0.30–54.4/1.70–100/41.20–12.8/1.90–80.6/32.3
MLC20.37–7.96/1.740–75.5/24.100–0.5/0.020–99.5/59.20–5.2/1.10–73.1/13.3
Note: Data after “/” refers to the average value.
Table 2. Gas content of OLC and MLC1 shales.
HorizonFaciesDepth/mMass/gLost Gas m3/tDesorption Gas/(m3/t)Residual Gas/(m3/t)Total Gas/(m3/t)
P1s23OLC2140.14–2140.4253010.30.160.260.71
2141.84–2142.1152900.20.170.330.7
2146.36–2146.6639310.651.190.392.22
P1tMLC12165.52–2165.8253420.410.930.241.58
2166.18–2166.4850150.40.840.291.53
2167.99–2168.2650130.341.030.251.61
Disclaimer/Publisher’s Note: The statements, opinions and data contained in all publications are solely those of the individual author(s) and contributor(s) and not of MDPI and/or the editor(s). MDPI and/or the editor(s) disclaim responsibility for any injury to people or property resulting from any ideas, methods, instructions or products referred to in the content.

