
Dimensioning Air Reactor and Fuel Reactor of a Pressurized CLC Plant to Be Coupled to a Gas Turbine: Part 2, the Fuel Reactor
 , , , , and
Abstract
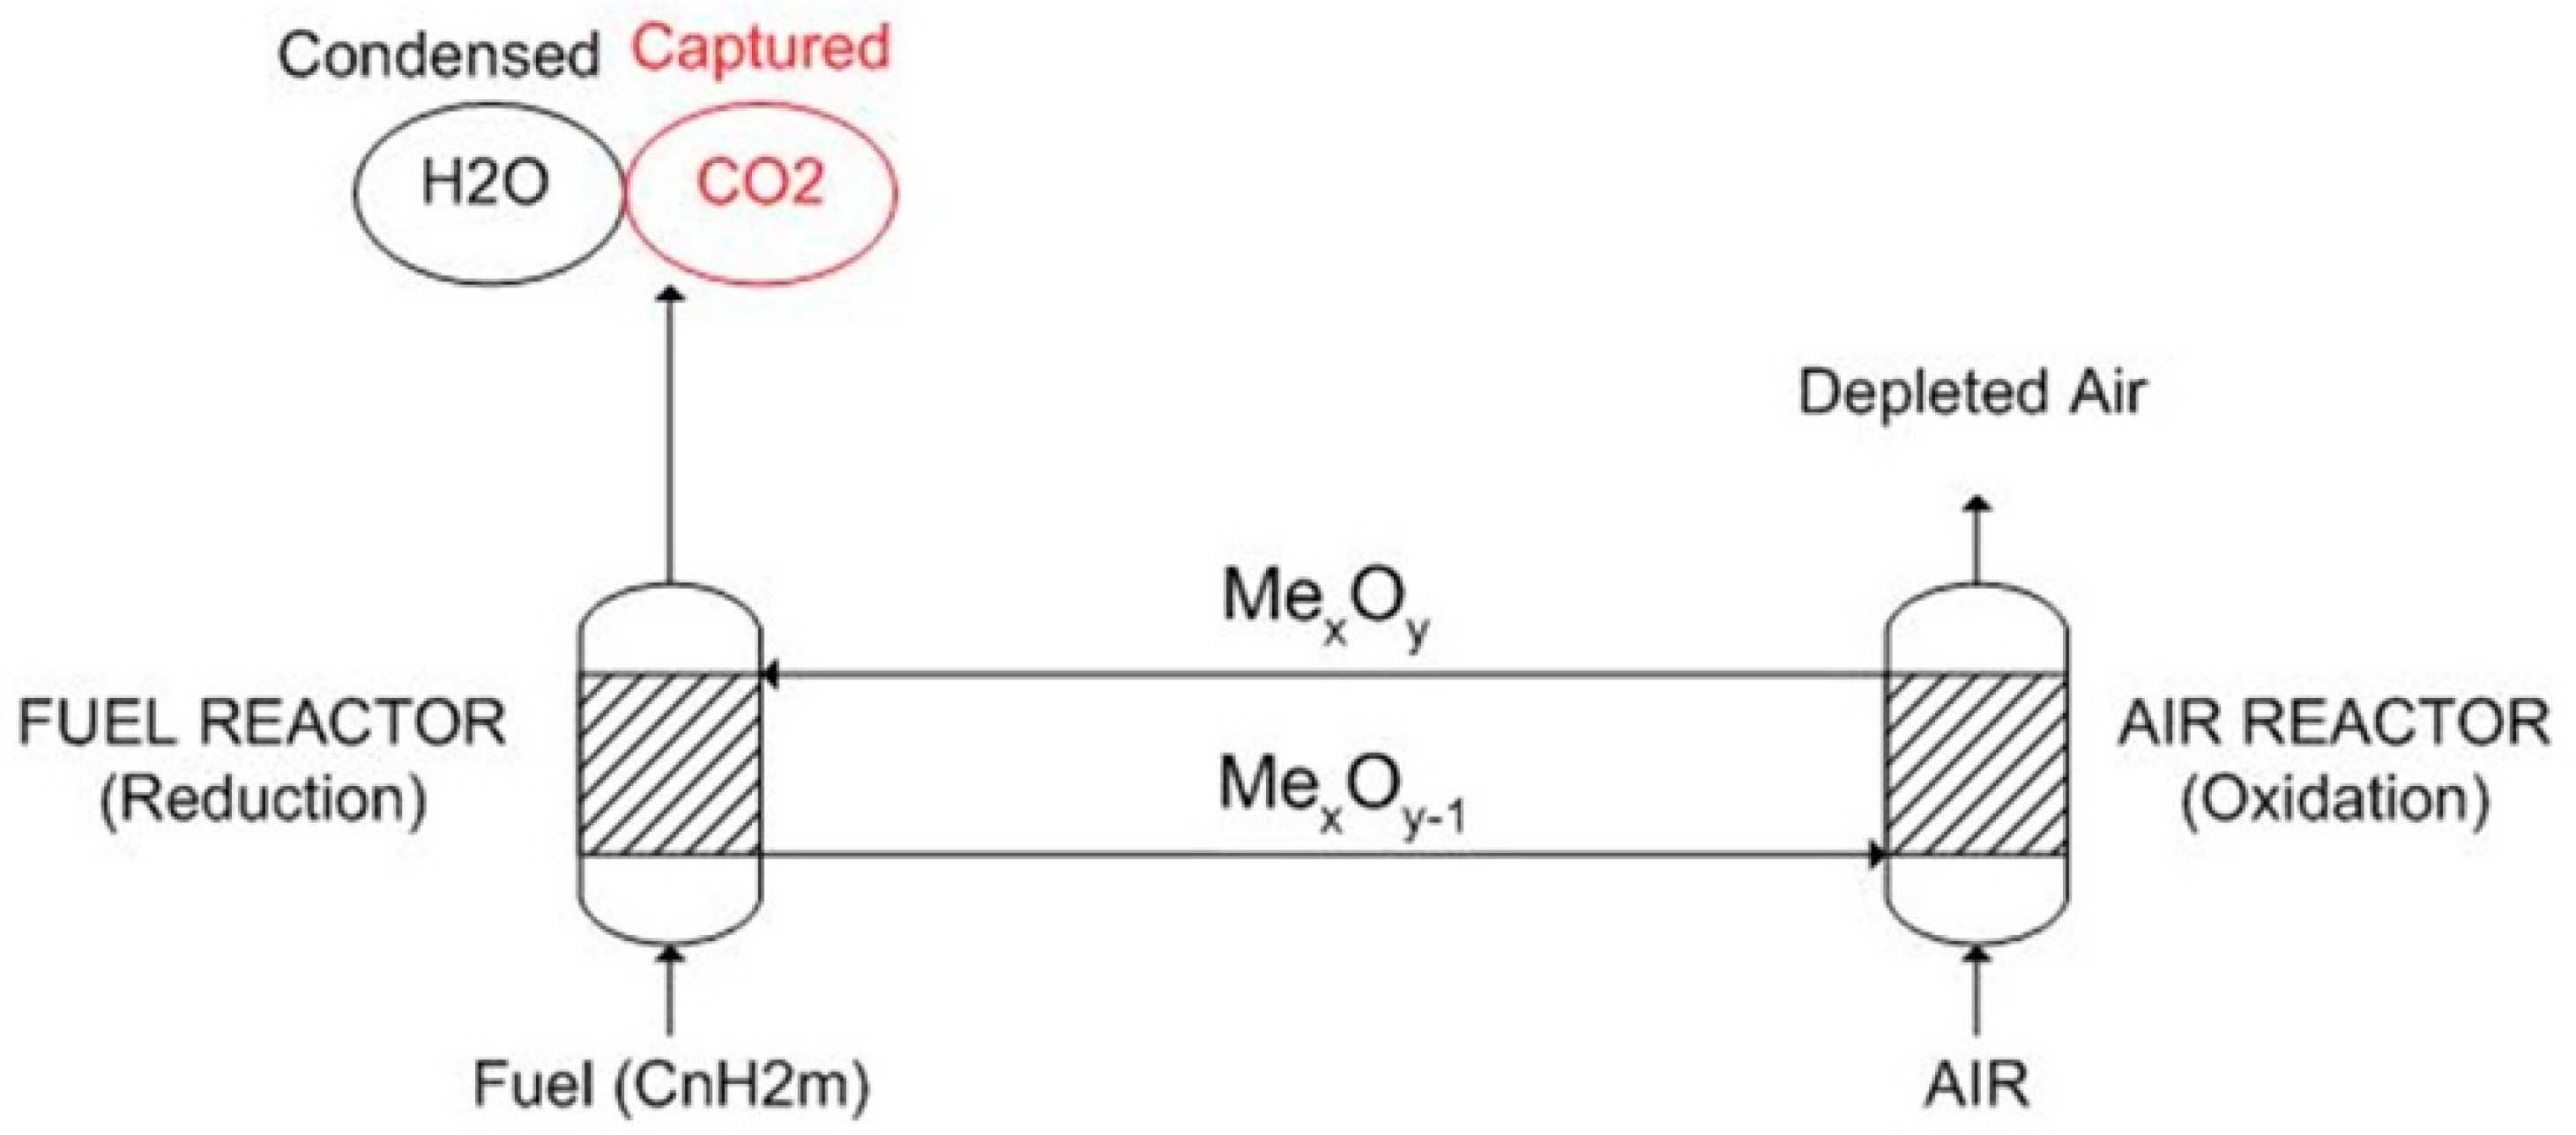
:1. Introduction
2. Materials and Methods
2.1. Methodology Followed to Design the Fuel Reactor
- -
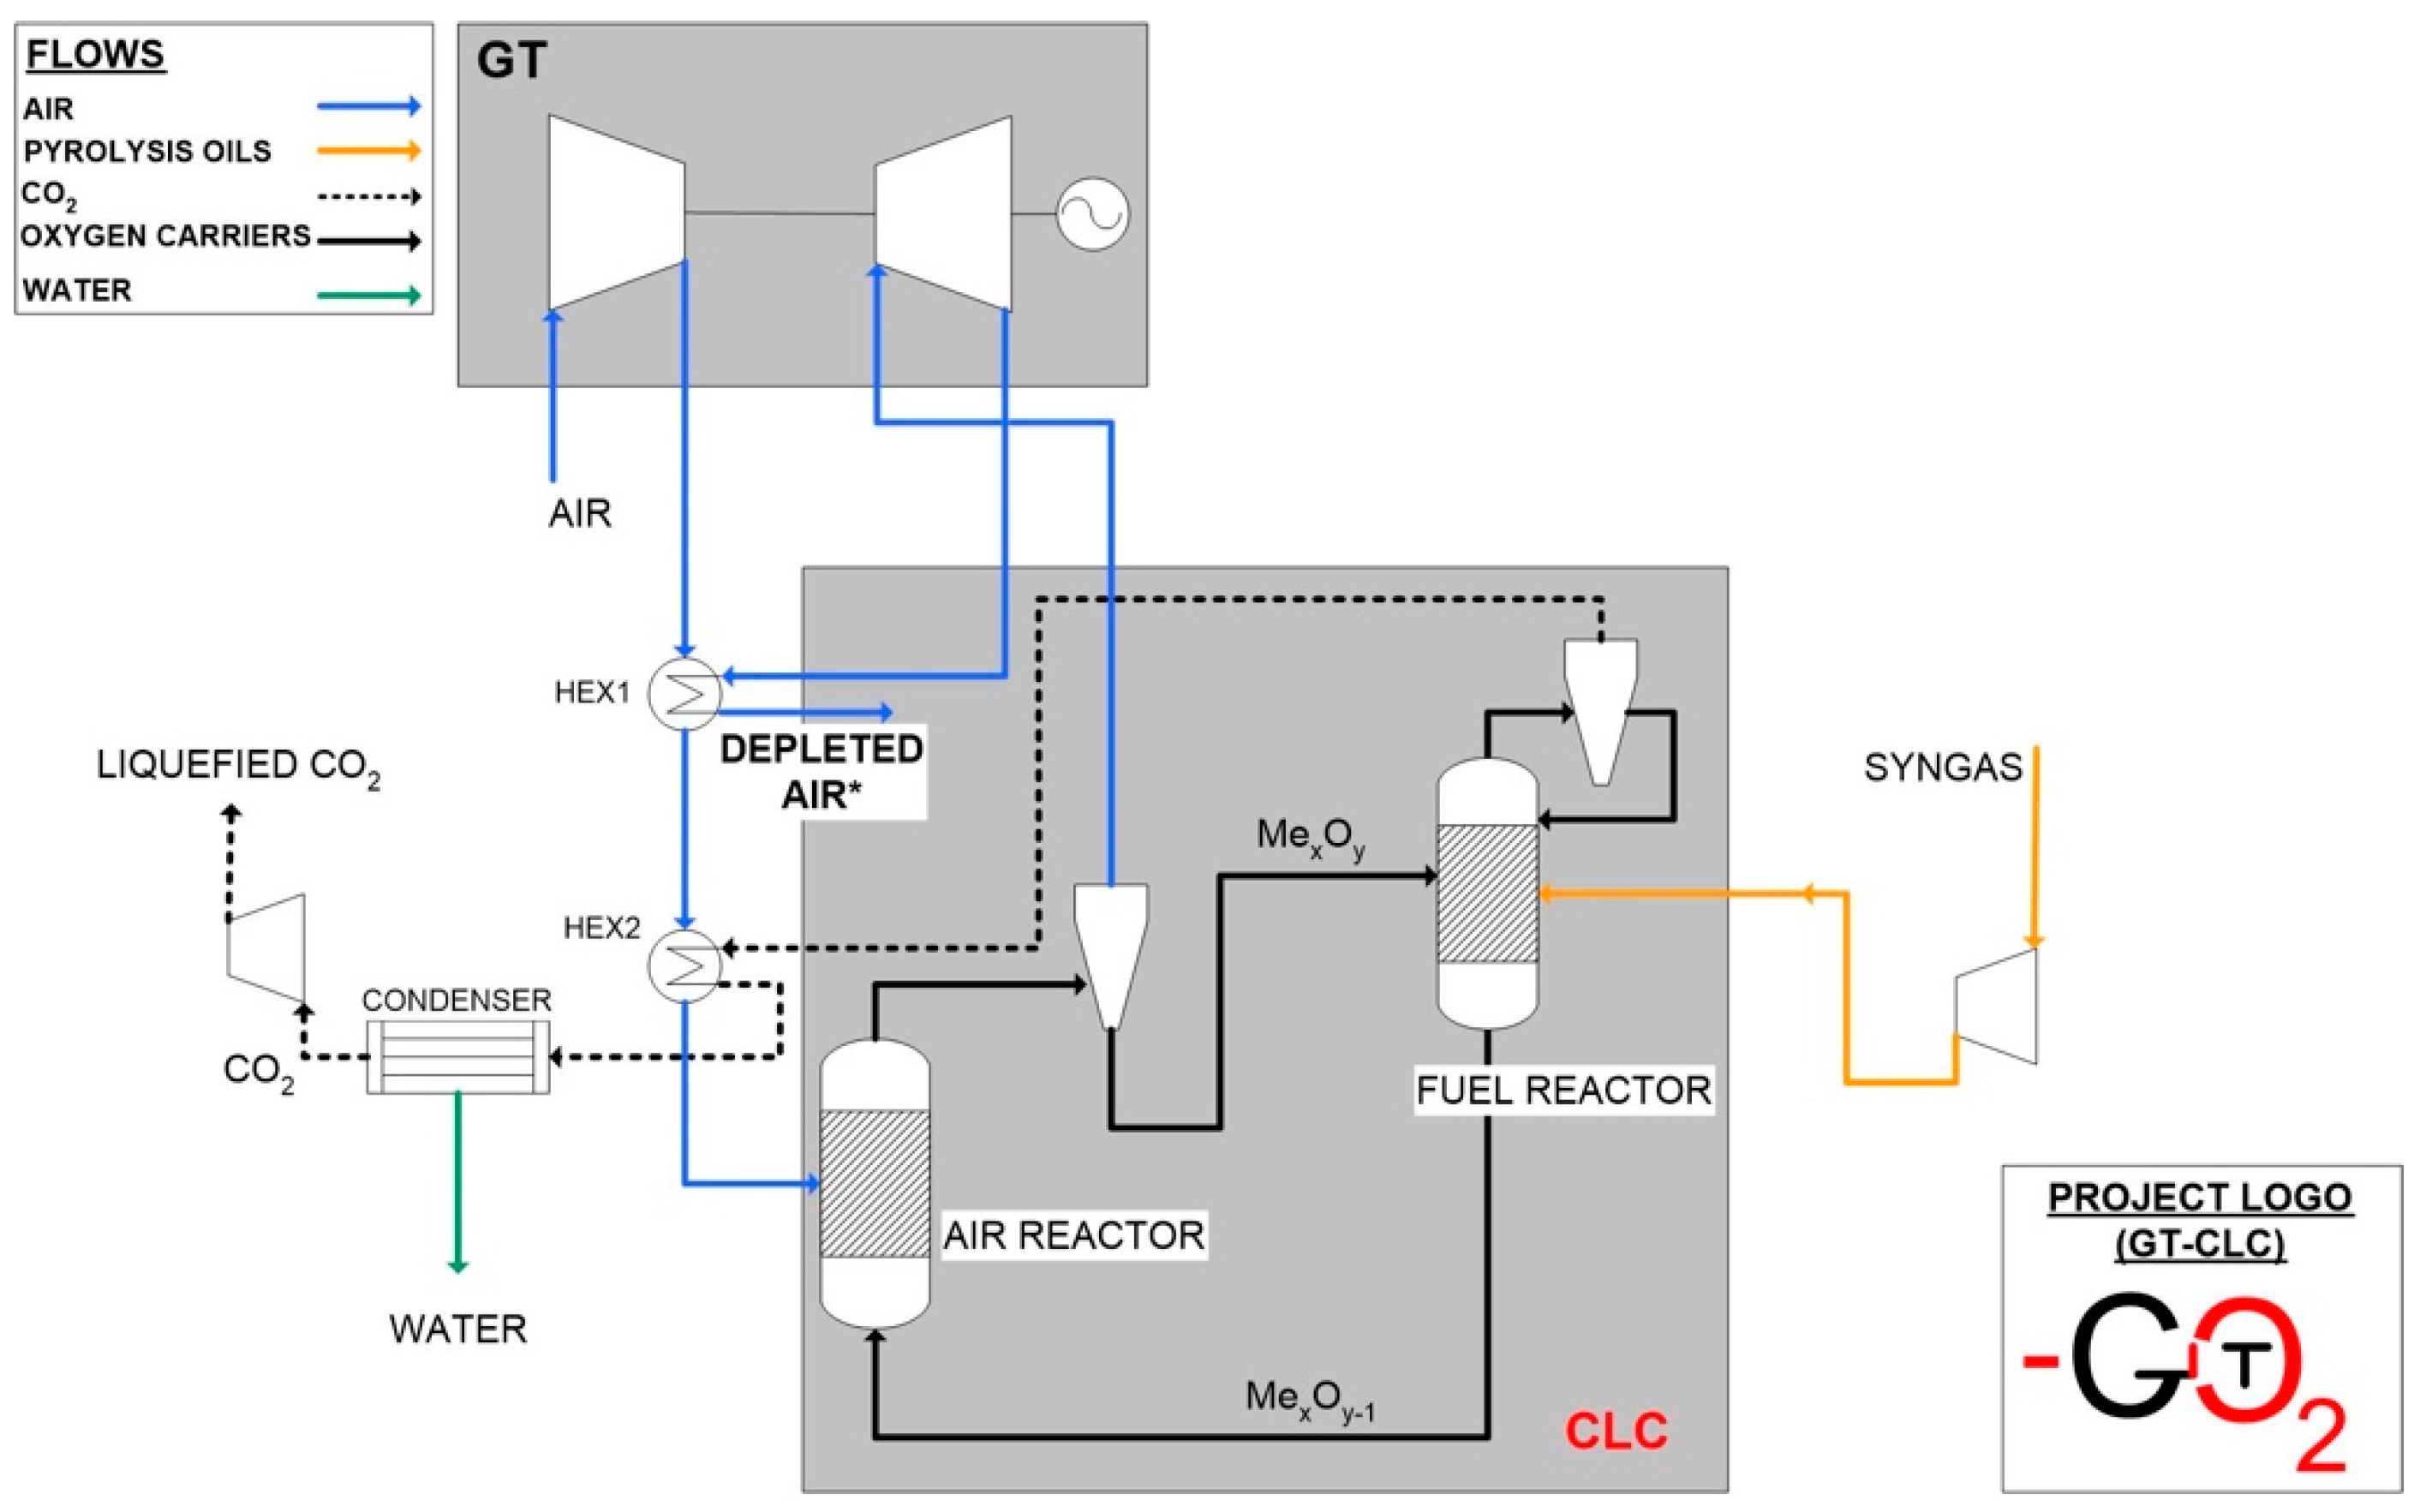
- The part that uses fuel characteristics, oxygen carrier characteristics, and oxidation and reduction reactions kinetics to calculate mass balances, reactor inventory, and solids circulation rate. This part first takes into account the air reactor because it is the one which is directly connected to the gas turbine and then the fuel reactor mass flows are determined based on stoichiometric calculations referred to the fuel needed to reduce the oxidized oxygen carrier. The dimensions of the reactor are set considering the optimal velocity of fluidization and the entrainment of particles;
- -
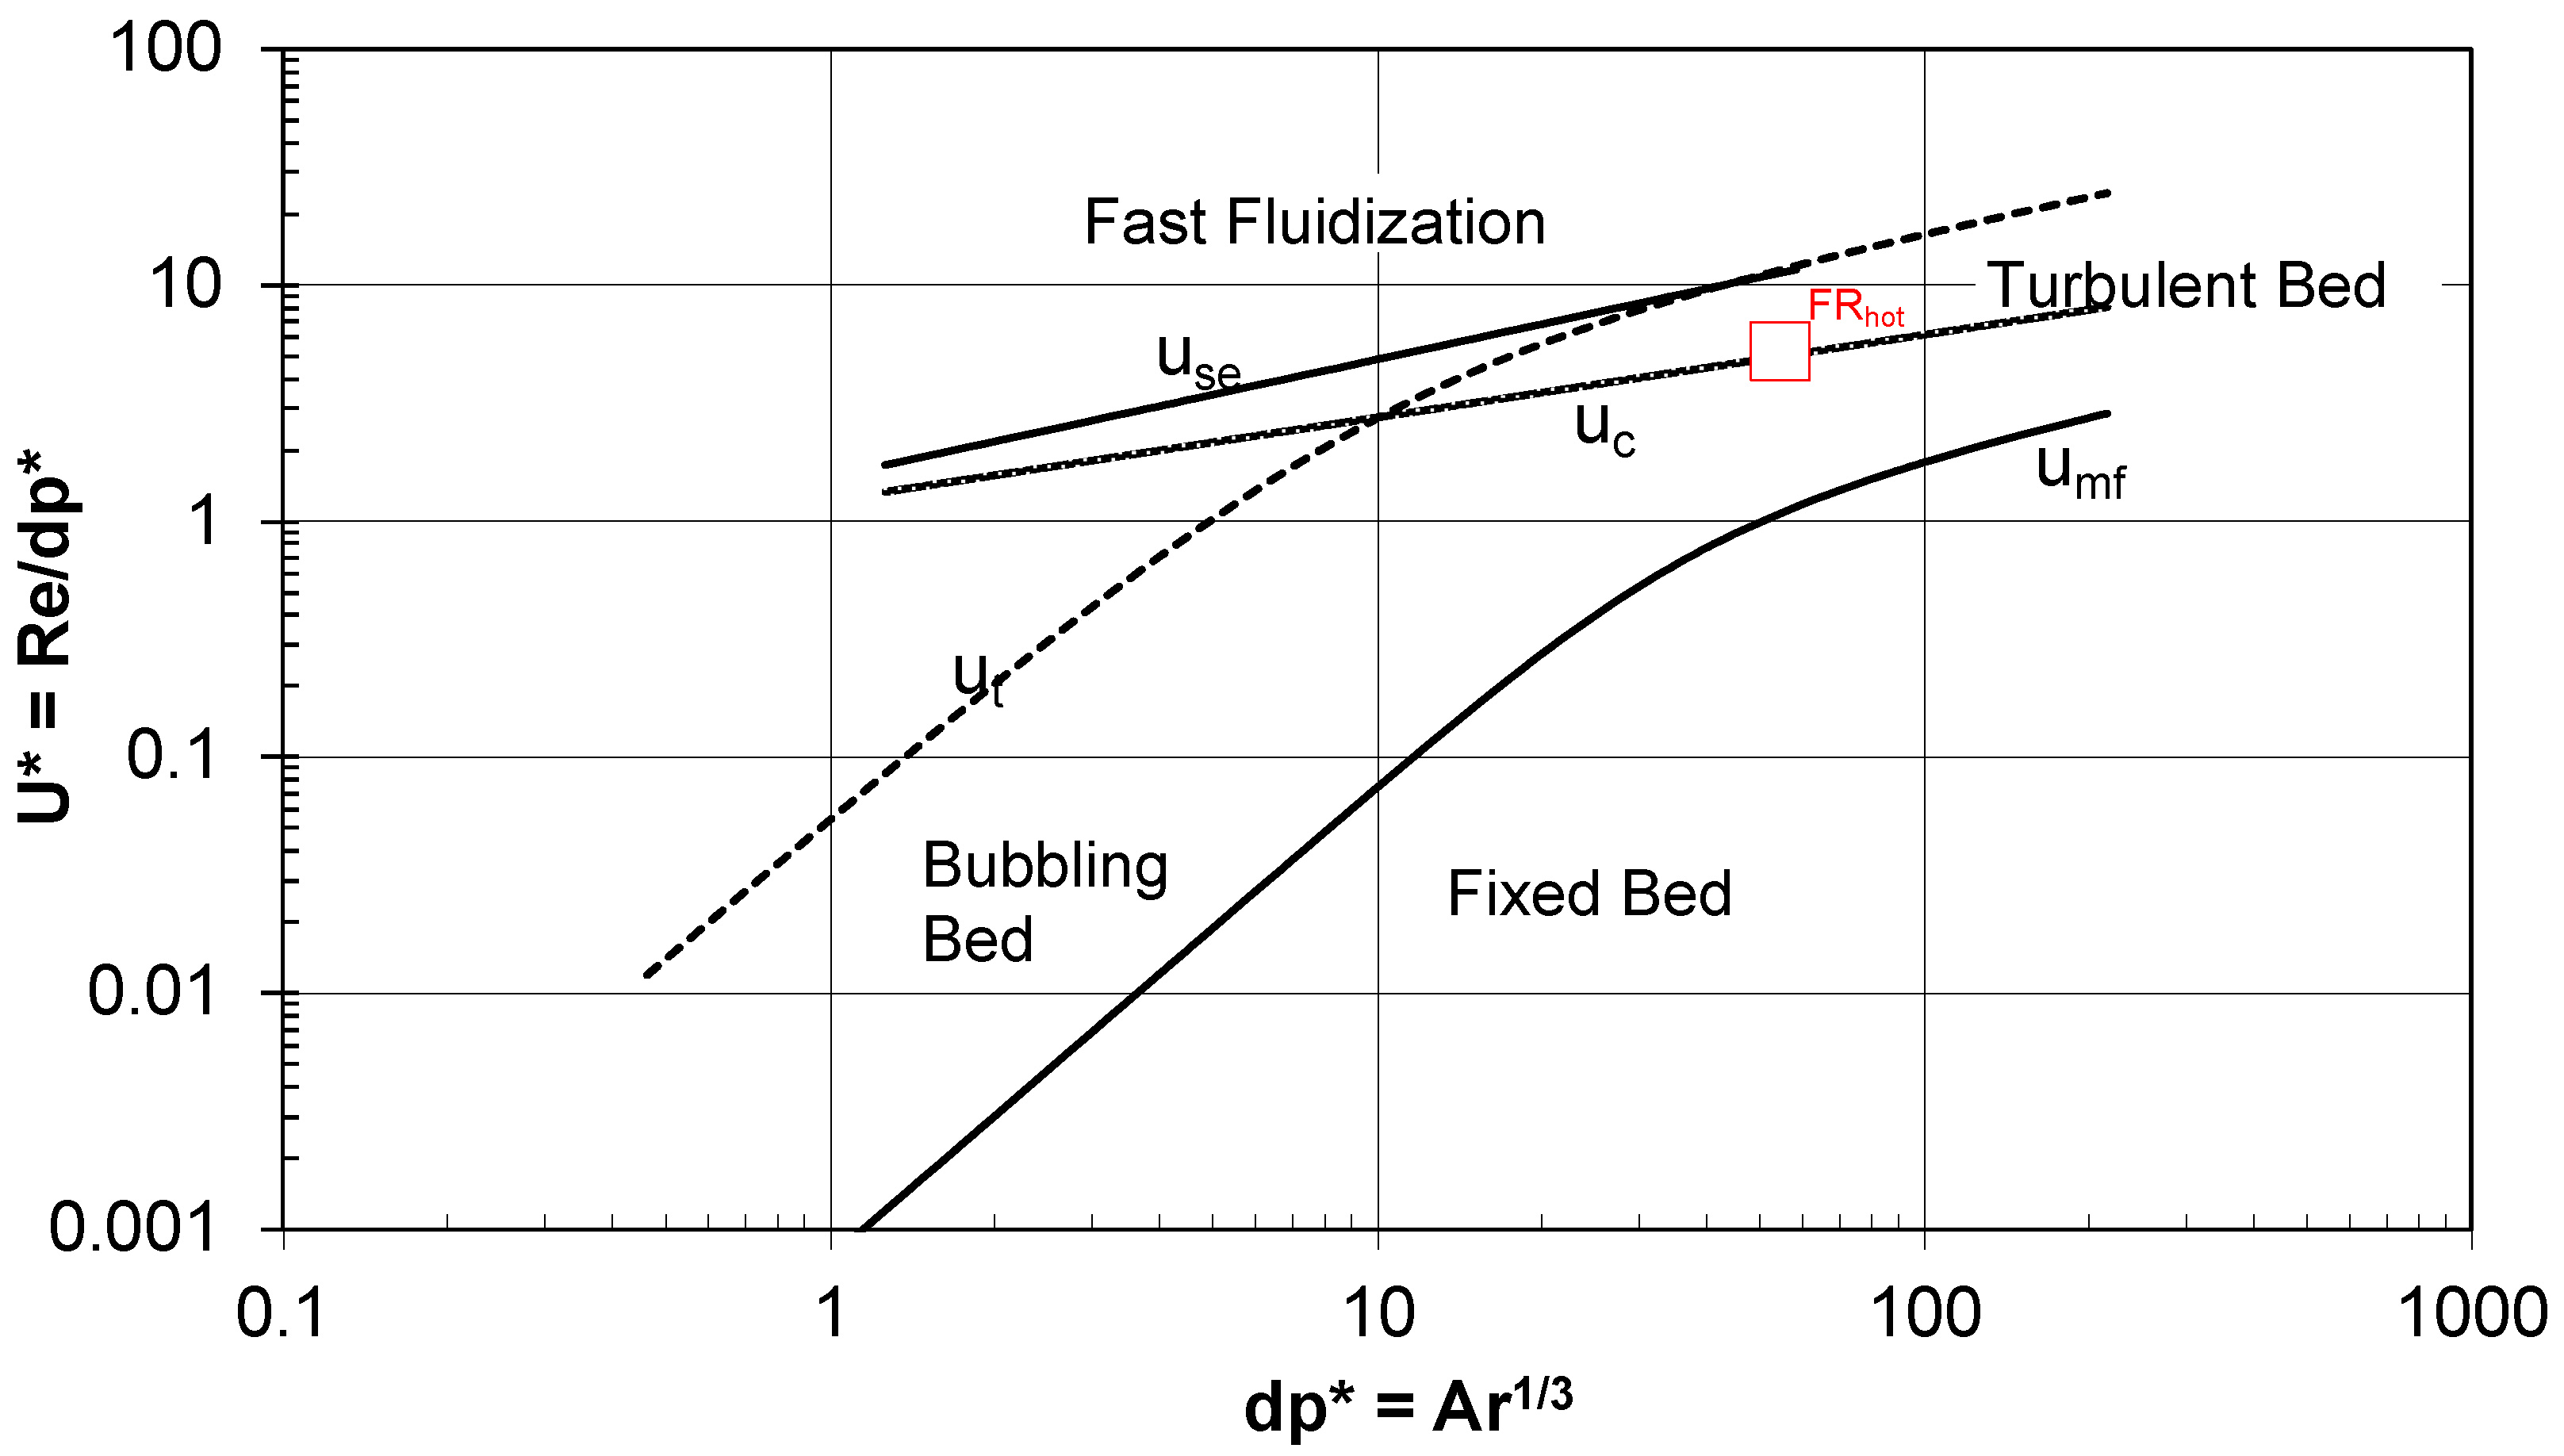
- In the second part, the dimensions of the reactor and the optimal velocities are double checked using the Grace diagram to calculate the fluidization regime and checking that this is close to the fast fluidization regime.
2.2. Oxygen Carrier Main Characteristics
- -
- Component ID and Alias are identified as the compound chemical formula;
- -
- Compound state (in the case of the oxygen carrier we consider solid state);
- -
- Molecular weight;
- -
- Normal boiling point;
- -
- Solid enthalpy of formation;
- -
- Solid Gibbs energy of formation;
- -
- Molar volume data (here also the density of the solid can be inserted);
- -
- Vapor pressure data;
- -
- Extended Antoine vapor pressure coefficients;
- -
- Solid heat capacity data;
- -
- Solid heat capacity polynomial coefficient.
2.3. Inventory and Circulation Rate Calculations
- -
- Type of oxygen carrier;
- -
- Conversion variation obtained in the oxygen carrier;
- -
- Type of fuel;
- -
- Fuel reactor characteristics.
- -
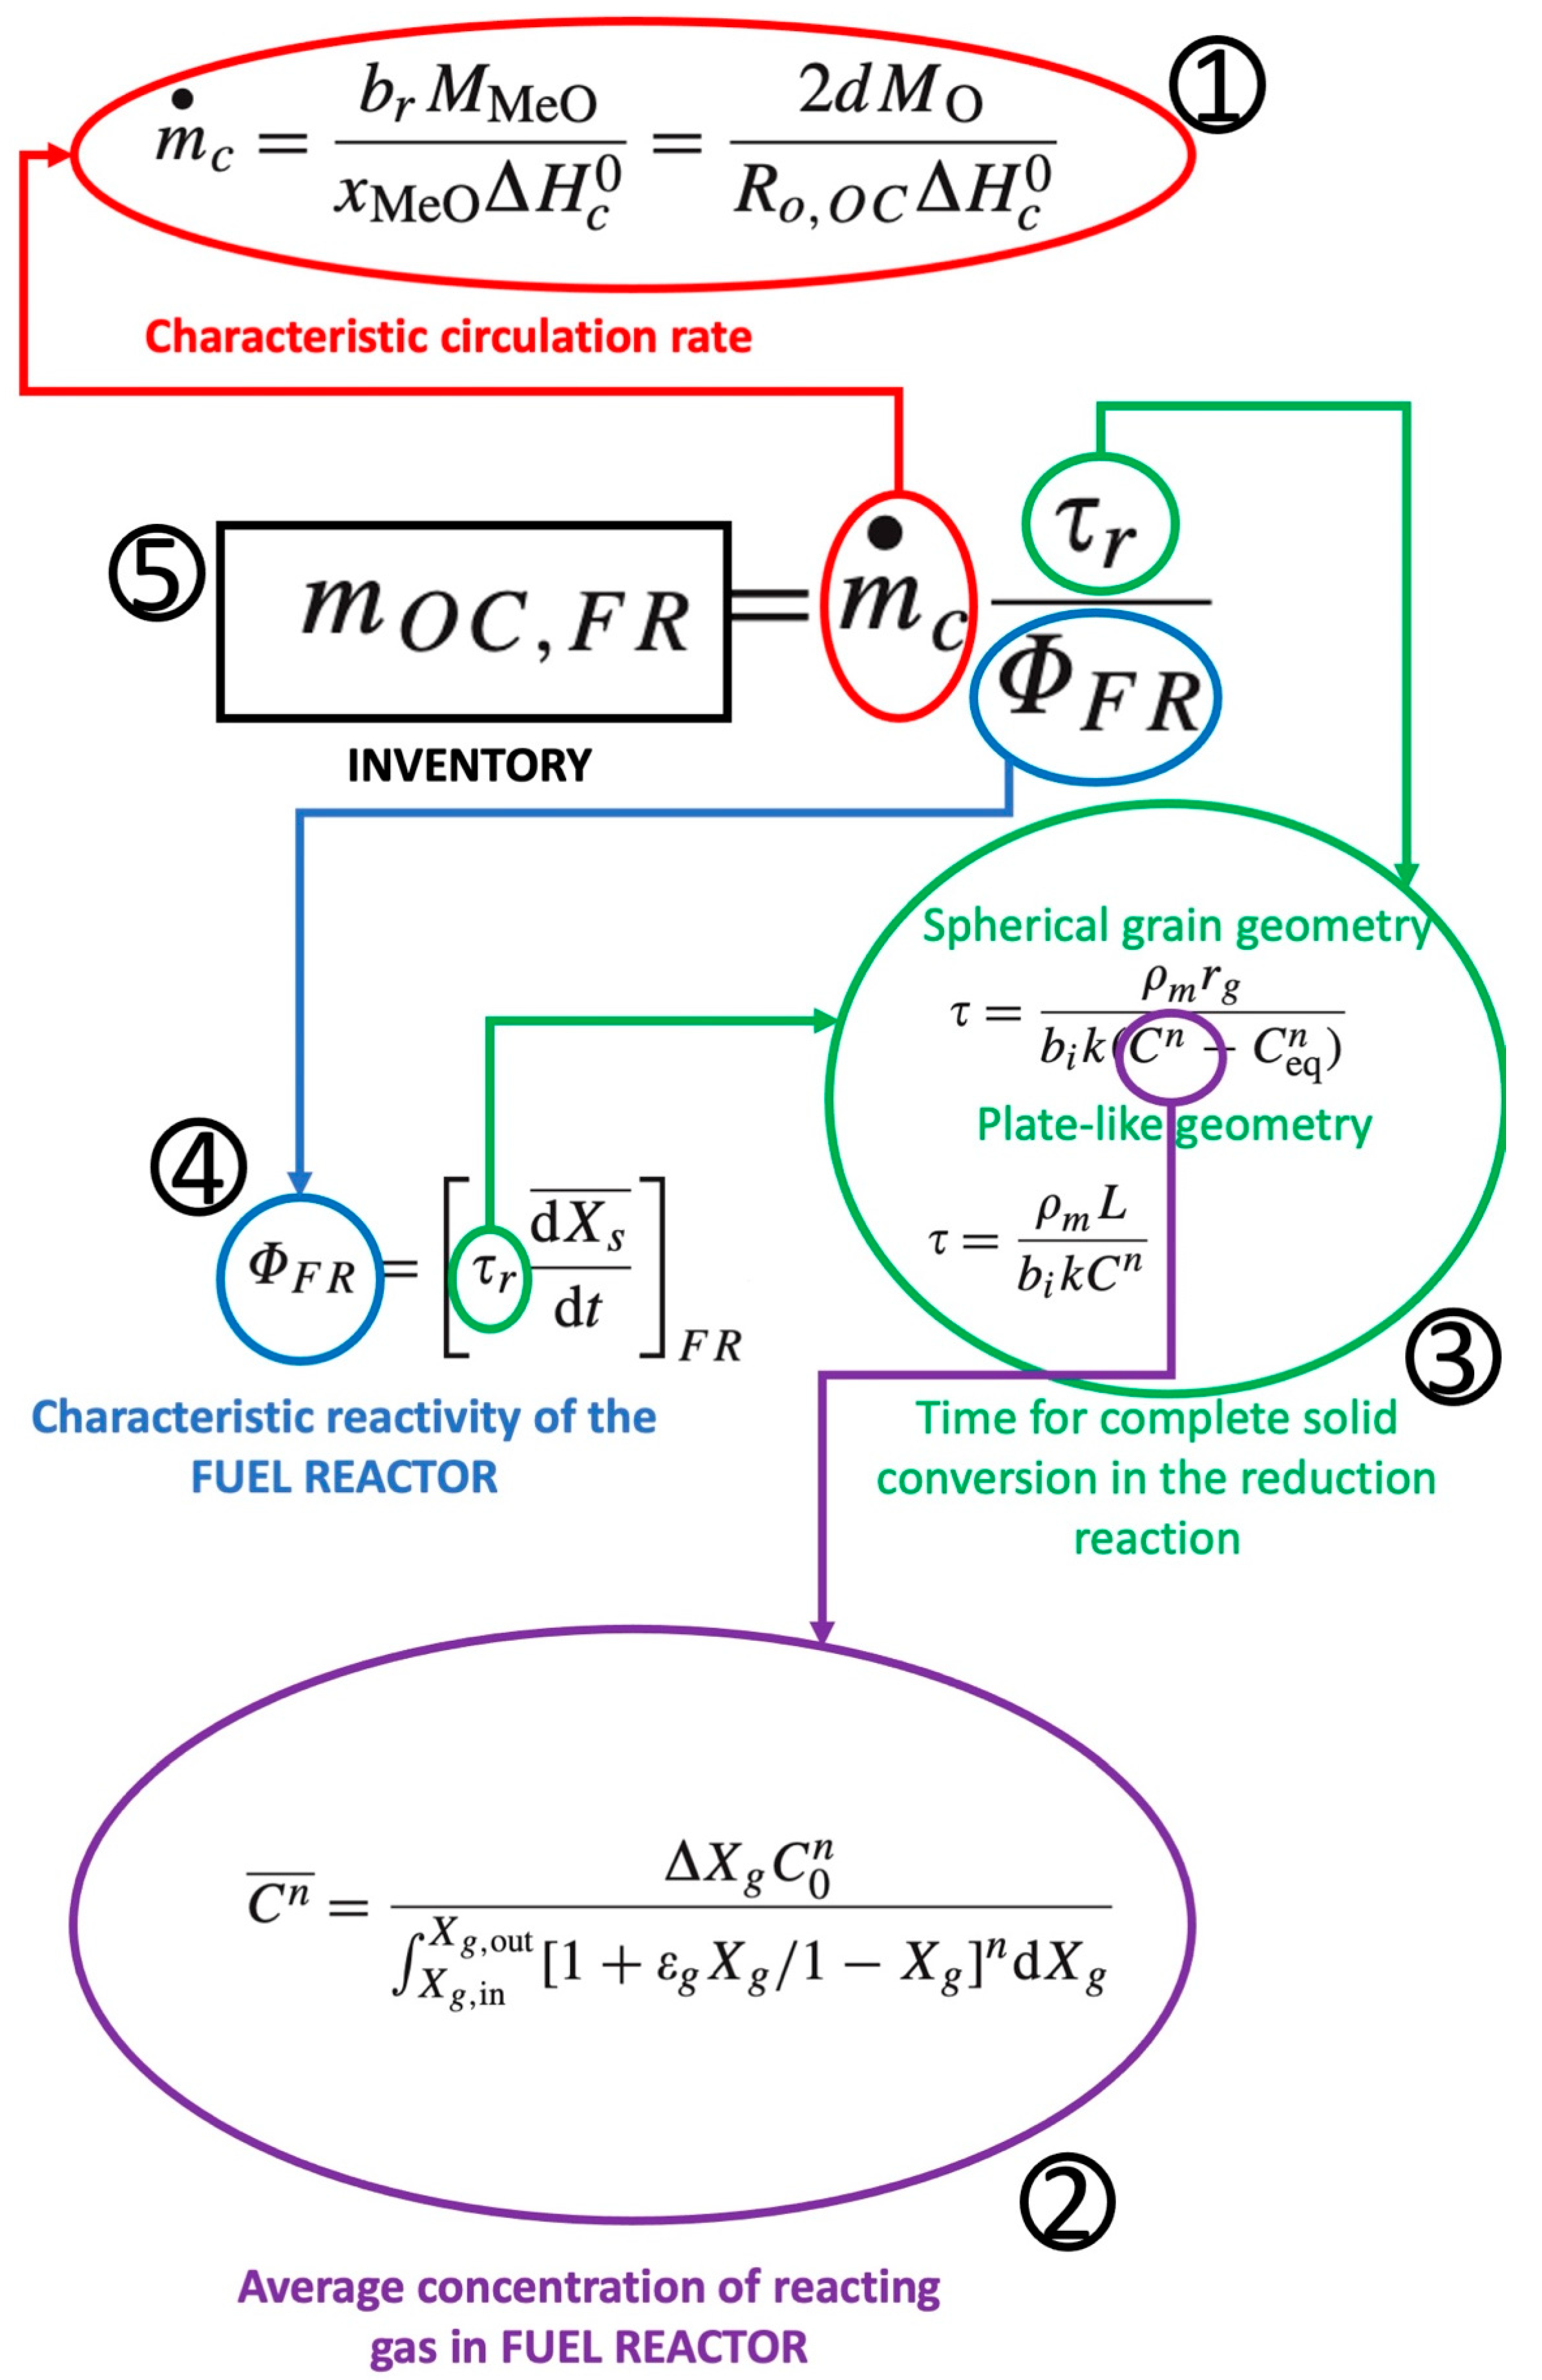
- Characteristic circulation rate;
- -
- Time for complete solid conversion in the reduction reaction;
- -
- Characteristic reactivity of the FUEL REACTOR.
2.4. Oxygen Carrier Reduction and Oxidation Reactions
3. Results
3.1. Final Design of the Fuel Reactor
3.2. Profiles of Velocity, Solids Volume Fraction
3.3. Profiles of Gases Concentrations
3.4. Grace Diagram in the Fuel Reactor
4. Conclusions
Author Contributions
Funding
Data Availability Statement
Acknowledgments
Conflicts of Interest
References
- Kang, J.-N.; Wei, Y.-M.; Liu, L.-C.; Wang, J.-W. Observing technology reserves of carbon capture and storage via patent data: Paving the way for carbon neutral. Technol. Forecast. Soc. Chang. 2021, 171, 120933. [Google Scholar] [CrossRef]
- Mi, Z.; Meng, J.; Guan, D.; Shan, Y.; Song, M.; Wei, Y.-M.; Liu, Z.; Hubacek, K. Chinese CO2 emission flows have reversed since the global financial crisis. Nat. Commun. 2017, 8, 1712. [Google Scholar] [CrossRef] [PubMed][Green Version]
- Black, R.; Cullen, K.; Fay, B.; Hale, T.; Lang, J.; Mahmood, S.; Smith, S. Taking Stock: A Global Assessment of Net Zero Targets. 2021. Available online: https://www.google.com.hk/url?sa=t&rct=j&q=&esrc=s&source=web&cd=&ved=2ahUKEwis1dW5zdD-AhUlmFYBHdzRAe4QFnoECA0QAQ&url=https%3A%2F%2Fca1-eci.edcdn.com%2Freports%2FECIU-Oxford_Taking_Stock.pdf&usg=AOvVaw1ZhRcYFX86SGMCS1CayncH (accessed on 3 April 2023).
- Vergragt, P.J.; Markusson, N.; Karlsson, H. Carbon capture and storage, bio-energy with carbon capture and storage, and the escape from the fossil-fuel lock-in. Glob. Environ. Change 2011, 21, 282–292. [Google Scholar] [CrossRef]
- Gasser, T.; Guivarch, C.; Tachiiri, K.; Jones, C.D.; Ciais, P. Negative emissions physically needed to keep global warming below 2 °C. Nat. Commun. 2015, 6, 7958. [Google Scholar] [CrossRef] [PubMed][Green Version]
- Gough, C.; Upham, P. Biomass energy with carbon capture and storage (BECCS or Bio-CCS). Greenh. Gases Sci. Technol. 2011, 1, 324–334. [Google Scholar] [CrossRef]
- Rueda, O.; Mogollón, J.M.; Tukker, A.; Scherer, L. Negative-emissions technology portfolios to meet the 1.5 °C target. Glob. Environ. Change 2021, 67, 102238. [Google Scholar] [CrossRef]
- Greenhouse Gas Removal; Royal Society and Royal Academy of Engineering: London, UK, 2019; ISBN 978-1-78252-349-9.
- Smith, P. Soil carbon sequestration and biochar as negative emission technologies. Glob. Change Biol. 2016, 22, 1315–1324. [Google Scholar] [CrossRef] [PubMed]
- Griscom, B.; Adams, J.; Ellis, P.; Houghton, R.; Lomax, G.; Miteva, D.; Schlesinger, W.; Shoch, D.; Smith, P.; Woodbury, P. Natural climate solutions. Earth Atmos. Planet. Sci. 2017, 114, 11645–11650. [Google Scholar] [CrossRef][Green Version]
- Smith, P.; Davis, S.J.; Creutzig, F.; Fuss, S.; Minx, J.; Gabrielle, B.; Kato, E.; Jackson, R.B.; Cowie, A.; Kriegler, E. Biophysical and economic limits to negative CO2 emissions. Nat. Clim. Change 2016, 6, 42–50. [Google Scholar] [CrossRef][Green Version]
- Fuss, S.; Lamb, W.F.; Callaghan, M.W.; Hilaire, J.; Creutzig, F.; Amann, T.; Beringer, T.; de Oliveira Garcia, W.; Hartmann, J.; Khanna, T. Negative emissions—Part 2: Costs, potentials and side effects. Environ. Res. Lett. 2018, 13, 063002. [Google Scholar] [CrossRef][Green Version]
- Woolf, D.; Amonette, J.; Street-Perrott, F.; Lehmann, J.; Joseph, S. Sustainable Biochar to Mitigate Global Climate Change. Nat. Commun. 2010, 1, 56. [Google Scholar] [CrossRef] [PubMed][Green Version]
- Bhave, A.; Taylor, R.H.; Fennell, P.; Livingston, W.R.; Shah, N.; Mac Dowell, N.; Dennis, J.; Kraft, M.; Pourkashanian, M.; Insa, M. Screening and techno-economic assessment of biomass-based power generation with CCS technologies to meet 2050 CO2 targets. Appl. Energy 2017, 190, 481–489. [Google Scholar] [CrossRef][Green Version]
- Climate Intervention: Carbon Dioxide Removal and Reliable Sequestration; Committee on Geo engineering Climate: Technical Evaluation and Discussion of Impacts; The National Academies Press: Washington, DC, USA, 2015.
- Harrison, D.P. A method for estimating the cost to sequester carbon dioxide by delivering iron to the ocean. Int. J. Glob. Warm. 2013, 5, 231–254. [Google Scholar] [CrossRef]
- McLaren, D. A comparative global assessment of potential negative emissions technologies. Process Saf. Environ. Prot. 2012, 90, 489–500. [Google Scholar] [CrossRef]
- Sanna, A.; Uibu, M.; Caramanna, G.; Kuusik, R.; Maroto-Valer, M. A review of mineral carbonation technologies to sequester CO2. Chem. Soc. Rev. 2014, 43, 8049–8080. [Google Scholar] [CrossRef]
- González, M.F.; Ilyina, T. Impacts of artificial ocean alkalinization on the carbon cycle and climate in Earth system simulations. Geophys. Res. Lett. 2016, 43, 6493–6502. [Google Scholar] [CrossRef][Green Version]
- Renforth, P.; Jenkins, B.; Kruger, T. Engineering challenges of ocean liming. Energy 2013, 60, 442–452. [Google Scholar] [CrossRef][Green Version]
- Chan, G.G.; Koch, C.M.; Connors, L.H. Blood proteomic profiling in inherited (ATTRm) and acquired (ATTRwt) forms of transthyretin-associated cardiac amyloidosis. J. Proteome Res. 2017, 16, 1659–1668. [Google Scholar] [CrossRef][Green Version]
- Keith, D.W.; Holmes, G.; Angelo, D.S.; Heidel, K. A process for capturing CO2 from the atmosphere. Joule 2018, 2, 1573–1594. [Google Scholar] [CrossRef]
- Ghouleh, Z.; Guthrie, R.I.; Shao, Y. Production of carbonate aggregates using steel slag and carbon dioxide for carbon-negative concrete. J. CO2 Util. 2017, 18, 125–138. [Google Scholar] [CrossRef][Green Version]
- Huijgen, W.J.; Comans, R.N.; Witkamp, G.-J. Cost evaluation of CO2 sequestration by aqueous mineral carbonation. Energy Convers. Manag. 2007, 48, 1923–1935. [Google Scholar] [CrossRef]
- Möllersten, K. Assessment of classes of CDR methods: Technology Readiness, Costs, Impacts and Practical Limitations of Biochar as Soil Additive and BECCS. Energy 2022, 2004, 2965. [Google Scholar][Green Version]
- Araújo, O.d.Q.F.; de Medeiros, J.L. Carbon capture and storage technologies: Present scenario and drivers of innovation. Curr. Opin. Chem. Eng. 2017, 17, 22–34. [Google Scholar] [CrossRef]
- Di Giuliano, A.; Capone, S.; Anatone, M.; Gallucci, K. Chemical Looping Combustion and Gasification: A Review and a Focus on European Research Projects. Ind. Eng. Chem. Res. 2022, 61, 14403–14432. [Google Scholar] [CrossRef]
- Kearns, D.; Liu, H.; Consoli, C. Technology Readiness and Costs of CCS; Global CCS Institute: Docklands, Australia, 2021. [Google Scholar]
- Bartocci, P.; Abad, A.; Bischi, A.; Wang, L.; Cabello, A.; de Las Obras Loscertales, M.; Zampilli, M.; Yang, H.; Fantozzi, F. Dimensioning Air Reactor and Fuel Reactor of a Pressurized Chemical Looping Combustor to Be Coupled to a Gas Turbine: Part 1, the Air Reactor. Energies 2023, 16, 2102. [Google Scholar] [CrossRef]
- Bischi, A.; Langørgen, Ø.; Saanum, I.; Bakken, J.; Seljeskog, M.; Bysveen, M.; Morin, J.-X.; Bolland, O. Design study of a 150 kWth double loop circulating fluidized bed reactor system for chemical looping combustion with focus on industrial applicability and pressurization. Int. J. Greenh. Gas Control 2011, 5, 467–474. [Google Scholar] [CrossRef]
- Bartocci, P.; Abad, A.; Mattisson, T.; Cabello, A.; de las Obras Loscertales, M.; Negredo, T.M.; Zampilli, M.; Taiana, A.; Serra, A.; Arauzo, I. Bioenergy with Carbon Capture and Storage (BECCS) developed by coupling a Pressurised Chemical Looping combustor with a turbo expander: How to optimize plant efficiency. Renew. Sustain. Energy Rev. 2022, 169, 112851. [Google Scholar] [CrossRef]
- Nikoo, M.B.; Mahinpey, N. Simulation of biomass gasification in fluidized bed reactor using ASPEN PLUS. Biomass Bioenergy 2008, 32, 1245–1254. [Google Scholar] [CrossRef]
- Abdelouahed, L.; Authier, O.; Mauviel, G.; Corriou, J.-P.; Verdier, G.; Dufour, A. Detailed modeling of biomass gasification in dual fluidized bed reactors under Aspen Plus. Energy Fuels 2012, 26, 3840–3855. [Google Scholar] [CrossRef]
- Kaushal, P.; Tyagi, R. Advanced simulation of biomass gasification in a fluidized bed reactor using ASPEN PLUS. Renew. Energy 2017, 101, 629–636. [Google Scholar] [CrossRef]
- Puig-Gamero, M.; Pio, D.; Tarelho, L.; Sánchez, P.; Sanchez-Silva, L. Simulation of biomass gasification in bubbling fluidized bed reactor using aspen plus®. Energy Convers. Manag. 2021, 235, 113981. [Google Scholar] [CrossRef]
- Sotudeh-Gharebaagh, R.; Legros, R.; Chaouki, J.; Paris, J. Simulation of circulating fluidized bed reactors using ASPEN PLUS. Fuel 1998, 77, 327–337. [Google Scholar] [CrossRef]
- Cho, P.; Mattisson, T.; Lyngfelt, A. Comparison of iron-, nickel-, copper- and manganese-based oxygen carriers for chemical-looping combustion. Fuel 2004, 83, 1215–1225. [Google Scholar] [CrossRef]
- Abad, A.; García-Labiano, F.; de Diego, L.F.; Gayán, P.; Adánez, J. Reduction Kinetics of Cu-, Ni-, and Fe-Based Oxygen Carriers Using Syngas (CO + H2) for Chemical-Looping Combustion. Energy Fuels 2007, 21, 1843–1853. [Google Scholar] [CrossRef]
- Schuhmann, R. Technical Publication 1189; American Institute of Mining and Metallurgical Engineers: New York, NY, USA, 1940. [Google Scholar][Green Version]
- Abad, A.; Adánez, J.; García-Labiano, F.; de Diego, L.F.; Gayán, P.; Celaya, J. Mapping of the range of operational conditions for Cu-, Fe-, and Ni-based oxygen carriers in chemical-looping combustion. Chem. Eng. Sci. 2007, 62, 533–549. [Google Scholar] [CrossRef]
- Ergun, S. Fluid flow through packed columns. Chem. Eng. Prog. 1952, 48, 89–94. [Google Scholar][Green Version]
- George, S. Entrainment of particles from aggregative fluidized beds. AIChE Symp. Ser. 1978, 74, 67–74. [Google Scholar]
- Tasirin, S.; Geldart, D. Entrainment of FCC from fluidized beds—A new correlation for the elutriation rate constants Ki∞. Powder Technol. 1998, 95, 240–247. [Google Scholar] [CrossRef]


| NET Technology | TRL |
|---|---|
| Afforestation, reforestation, and forest management [9,10,11] | 8–9 |
| Wetland, peatland, and coastal habitat restoration [10] | 5–6 |
| Soil carbon sequestration [9,12] | 8–9 |
| Biochar [9,12,13] | 3–6 |
| Bioenergy with carbon capture and storage [11,14] | Bioenergy: 7–9 CCS: 4–7 |
| Ocean fertilization [15,16] | 1–5 |
| Building with biomass [17] | 8–9 |
| Enhanced terrestrial weathering [11] | 1–5 |
| Mineral carbonation [18] | 3–8 |
| Ocean alkalinity [19,20] | 2–4 |
| Direct air capture [12,21,22] | 4–7 |
| Low-carbon concrete [18,23,24] | 6–7 |
| TRL | Technology |
|---|---|
| high technology readiness level—TRL (7–9) |
|
| low technology readiness level—TRL (≦7) |
|
| Parameter | Value | Unit of Measure |
|---|---|---|
| Active NiO content | 40 | wt% |
| Oxygen transport capacity, R0 | 0.084 | - |
| Particle size | 0.2 | μm |
| Porosity | 0.36 | % |
| Specific surface area (BET) | 0.8 | m2/g |
| Solid density | 5380 | kg/m3 |
| Interval | Lower Limit | Upper Limit (μm) | Weight Fraction (μm) | Cumulative Weight Fraction |
|---|---|---|---|---|
| 1 | 100 | 130 | 0.185279 | 0.185279 |
| 2 | 130 | 160 | 0.0677037 | 0.252982 |
| 3 | 160 | 190 | 0.0743889 | 0.327371 |
| 4 | 190 | 220 | 0.0805198 | 0.407891 |
| 5 | 220 | 250 | 0.086215 | 0.494106 |
| 6 | 250 | 280 | 0.0915561 | 0.585662 |
| 7 | 280 | 310 | 0.0966021 | 0.682264 |
| 8 | 310 | 340 | 0.101397 | 0.783661 |
| 9 | 340 | 370 | 0.105975 | 0.889637 |
| 10 | 370 | 400 | 0.110363 | 1 |
| Symbol | H2 | CO | |
|---|---|---|---|
| Molar density of metal oxide in the solid (mol MeO m−3 solid) | ρm | 89,290 | 89,290 |
| Stoichiometric factor in the reduction reaction of metal oxide (moles of MeO per mole of fuel gas) | b | 1 | 1 |
| Preexponential factor of the chemical reaction rate constant (mol1−n m3n−2 s−1) | k0 | 9.3 × 10⁻³ | 5.2 × 10⁻³ |
| Activation Energy (J mol−1) | E | 26 | 25 |
| Reaction order | n | 0.5 | 0.8 |
| Exponent in Equation (4) | q | −0.47 | −0.93 |
| dXr/dt at 0.1 MPa | - | 0.040 | 0.028 |
| dXr/dt at 2.0 MPa | - | 0.044 | 0.019 |
| Parameter | Value | Unit of Measure |
|---|---|---|
| Voidage at minimum fluidization | 0.5 | - |
| Geldart classification | B | - |
| Minimum fluidization velocity calculation method | Ergun [41] | - |
| Transport disengagement Height Model | George and Grace [42] | - |
| Maximum dCv/dh | 1 × 10⁻⁵ | - |
| Elutriation model | Tasirin and Geldart [43] | - |
| Decay constant | 3 | - |
| TG parameter A1 | 23.7 | - |
| TG parameter A2 | 14.5 | - |
| TG parameter B1 | 2.5 | - |
| TG parameter B2 | 2.5 | - |
| TG parameter C1 | −5.4 | - |
| TG parameter C2 | −5.4 | - |
| Constant diameter | - | - |
| Cross section | circular | - |
| Solids discharge location | 95% of total height | - |
| Gas distribution | injectors | - |
| Distributor pressure drop | 0.04 | bar |
| Parameter | Fuel Reactor | Unit of Measure |
|---|---|---|
| Total reactor height | 8 | m |
| Reactor diameter | 3.0 | m |
| Inventory | 8000 | kg |
| Circulation rate | 111 | kg/s |
| Operating pressure | 12 | bar |
| Height of bottom zone | 0.01 | m |
| Height of freeboard | 5.99 | m |
| Transport Disengaging Height calculated by correlation | 5.33 | m |
| Transport Disengaging Height based on solids volume fraction profile | 3.89 | m |
| Number of particles in bed | 3.3 × 10¹⁰ | - |
| Surface area | 26,040 | sqm |
| Minimum fluidization velocity | 0.04 | m/s |
Disclaimer/Publisher’s Note: The statements, opinions and data contained in all publications are solely those of the individual author(s) and contributor(s) and not of MDPI and/or the editor(s). MDPI and/or the editor(s) disclaim responsibility for any injury to people or property resulting from any ideas, methods, instructions or products referred to in the content. |
© 2023 by the authors. Licensee MDPI, Basel, Switzerland. This article is an open access article distributed under the terms and conditions of the Creative Commons Attribution (CC BY) license (https://creativecommons.org/licenses/by/4.0/).
Share and Cite
Lu, W.; Bartocci, P.; Abad, A.; Bischi, A.; Yang, H.; Cabello, A.; de Las Obras Loscertales, M.; Zampilli, M.; Fantozzi, F. Dimensioning Air Reactor and Fuel Reactor of a Pressurized CLC Plant to Be Coupled to a Gas Turbine: Part 2, the Fuel Reactor. Energies 2023, 16, 3850. https://doi.org/10.3390/en16093850
Lu W, Bartocci P, Abad A, Bischi A, Yang H, Cabello A, de Las Obras Loscertales M, Zampilli M, Fantozzi F. Dimensioning Air Reactor and Fuel Reactor of a Pressurized CLC Plant to Be Coupled to a Gas Turbine: Part 2, the Fuel Reactor. Energies. 2023; 16(9):3850. https://doi.org/10.3390/en16093850
Chicago/Turabian StyleLu, Wang, Pietro Bartocci, Alberto Abad, Aldo Bischi, Haiping Yang, Arturo Cabello, Margarita de Las Obras Loscertales, Mauro Zampilli, and Francesco Fantozzi. 2023. "Dimensioning Air Reactor and Fuel Reactor of a Pressurized CLC Plant to Be Coupled to a Gas Turbine: Part 2, the Fuel Reactor" Energies 16, no. 9: 3850. https://doi.org/10.3390/en16093850