Article

The Micro-Occurrence Mechanisms of Tight Oil: Fluid–Rock Interactions at Microscale Pores, Nanoscale Pores, and Mineral Surfaces

1
Petroleum Exploration and Production Research Institute, Sinopec, Beijing 102206, China
2
State Key Laboratory of Shale Oil and Gas Enhancement Mechanisms and Effective Development, Sinopec, Beijing 100083, China
3
Northwest Institute of Eco-Environment and Resources, Chinese Academy of Sciences, Lanzhou 730000, China
4
Key Laboratory of Petroleum Resources Research, Gansu Province, Lanzhou 730000, China
5
Wuxi Research Institute of Petroleum Geology, Sinopec Petroleum Exploration and Production Research Institute, Wuxi 214126, China
*
Author to whom correspondence should be addressed.
Energies 2023, 16(9), 3917; https://doi.org/10.3390/en16093917
Submission received: 7 March 2023 / Revised: 28 April 2023 / Accepted: 3 May 2023 / Published: 5 May 2023

Abstract

:
Understanding the micro-occurrence mechanism of tight oil has long been a daunting challenge in the exploration and development of unconventional resources. This article discusses the micro-occurrence mechanism of tight oil through continuous extraction by combining thin casting, fluorescent thin sections, environmental scanning electron microscope observations, physical property testing, and X-ray diffraction experiments. The results indicated that in the tight sandstone of the Chang 8 Formation in the Ordos Basin, the average tight oil content was 35.46% for microscale pores, 35.74% for nanoscale pores, and 28.79% for mineral surfaces. Six types of micro-occurrence states of tight oil were identified: emulsion, cluster, throat, star-like, isolation, and thin film forms. Although clay minerals and heavy components dominate the adsorption of tight oil on mineral surfaces, micro-occurrence is fundamentally an oil–rock interaction process. Hence, oil–rock interactions and occurrence states were combined in this study to identify tight oil’s micro-occurrence mechanism. The van der Waals forces of attraction between asphaltene molecules and a mineral surface play a critical role, and minerals with hydroxyl groups can also combine with carboxyl and hydroxyl groups present in tight oil. As a consequence of the adsorption of heavy components by minerals, tight oil components remain in microscale and nanoscale pores with a higher saturation, increased aromatic hydrocarbon content, and greater fluidity. The heterogeneity of the components due to adsorption influences the physical properties and mineralization framework of tight oil reservoirs. These findings suggest that tight oil occurrence results from the coupling of microscopic occurrence and component heterogeneity in microscale and nanoscale pores.

1. Introduction

Tight sandstones, mudstones, and shales represent the most abundant deposits in Earth’s sedimentary record. These deposits play diverse roles in the context of conventional and unconventional hydrocarbon resources, serving as source rocks, caprocks, or even reservoirs [1]. Furthermore, tight sandstones are of particular importance, as they constitute the most critical reservoir space for unconventional oil and gas resources [2]. Consequently, tight oil has emerged as a focal point in the research and exploration of global petroleum geology [3,4,5].
In the Ordos Basin, the tight oil resources were preliminarily estimated to be approximately 35.5∼40.6 × 10⁸ t [6,7]. The Yanchang Formation, which is characterized by a low porosity, low permeability, and complex pore structure with strong microscopic heterogeneity, serves as a typical tight oil reservoir [8,9]. The Yanchang Formation can be subdivided into ten members based on their lithostratigraphy, ranging from the Chang 1 Member to the Chang 10 Member, in descending order [8]. Among these, the Chang 6 to Chang 8 Members are considered the most critical tight-oil-producing targets during operations. The proven tight oil reserves of the Chang 6, Chang 7, and Chang 8 Members contain 12.24 × 10⁸, 8.42 × 10⁸, and 9.60 × 10⁸ t, respectively [2,7].
Previous studies have demonstrated that the storage of tight oil in sandstones is dependent on the chemical composition of tight oil and the structural properties of the reservoir [5,9,10,11,12]. Both the initial sediment composition and subsequent diagenetic modifications play a crucial role in determining a reservoir’s properties [8,13]. The extensive diagenetic modification of the Yanchang Formation’s reservoir is the primary factor contributing to the strong heterogeneity of the tight sandstone reservoir [9,11]. Due to the complex pore structure and poor physical properties of tight oil reservoirs, the occurrence mechanisms of tight oil become increasingly complicated. Consequently, understanding the distribution of reservoir quality is of paramount importance for the exploration and development of tight oil resources.
In the last decade, research on the micro-occurrence mechanism of tight oil in sandstones has been divided into direct and indirect methods. The direct methods encompass the following: (1) using fluorescent thin sections (FTSs) to identify, describe, and classify tight oils in various pore types [14]; (2) employing a combination of environmental scanning electron microscopy (ESEM) and energy dispersive spectrometry (EDS) to quantitatively compare the differences in tight oil occurrence within pores of distinct morphologies [15]; (3) utilizing the micro-CT methodology to calculate the tight oil stored in pores, thus enabling the determination of the occurrence state and relative content of tight oil [16].
Direct methods offer the advantage of distinguishing between micro-occurrence states and pore types; however, accurate quantification remains a challenge. Consequently, researchers have employed indirect methods, including the following: (1) utilizing centrifugal or displacement methods to determine the content and proportion of tight oil distributed in large connected pores and throats [17,18,19,20], although this approach cannot isolate tight oil within nanoscale pores; (2) employing the Rock-Eval method to differentiate between free oil and adsorbed oil, as well as to determine their respective ratios and compositional differences [21,22,23]; (3) extracting tight oil step by step with organic solvents for separation, allowing the analysis of compositional differences [24], although this method cannot differentiate between tight oil in different pore sizes; (4) leveraging molecular simulation techniques to examine the direct interaction between crude oil and minerals at the molecular scale and simulate single- or multilayer adsorption of crude oil on mineral surfaces [16,25,26,27]; however, due to the complexity of the components of crude oil, current molecular simulations can only target individual components or simple interactions; (5) conducting single-mineral adsorption simulation experiments to ascertain the amounts of different minerals adsorbed to crude oil and the adsorption mechanism of crude oil on mineral surfaces [28]. While this method can be used to elucidate the oil–rock interaction mechanism on mineral surfaces, it cannot determine the micro-occurrence states of crude oil within reservoirs.
Previous studies have acknowledged the vast potential of tight oil resources and proposed that a significant number of microscale and nanoscale pores that have developed in tight reservoirs serve as the primary storage space for tight oil. However, the distribution of tight oil among microscale pores, nanoscale pores, and mineral surfaces remains an open question. Research on the occurrence characteristics and micro-occurrence mechanisms of tight oil in sandstone is still limited [29].
In this article, we focus on the Chang 8 Member of the Yanchang Formation of the Upper Triassic in the Ordos Basin, a typical tight oil reservoir. By examining the characterization of the micro-occurrence of tight oils in sandstones and conducting a quantitative analysis of their content and composition, we explore the factors governing the micro-occurrence states in sandstones and the micro-occurrence mechanisms of tight oils. This study aims to provide essential theoretical guidance for the exploration and development of tight oil resources.

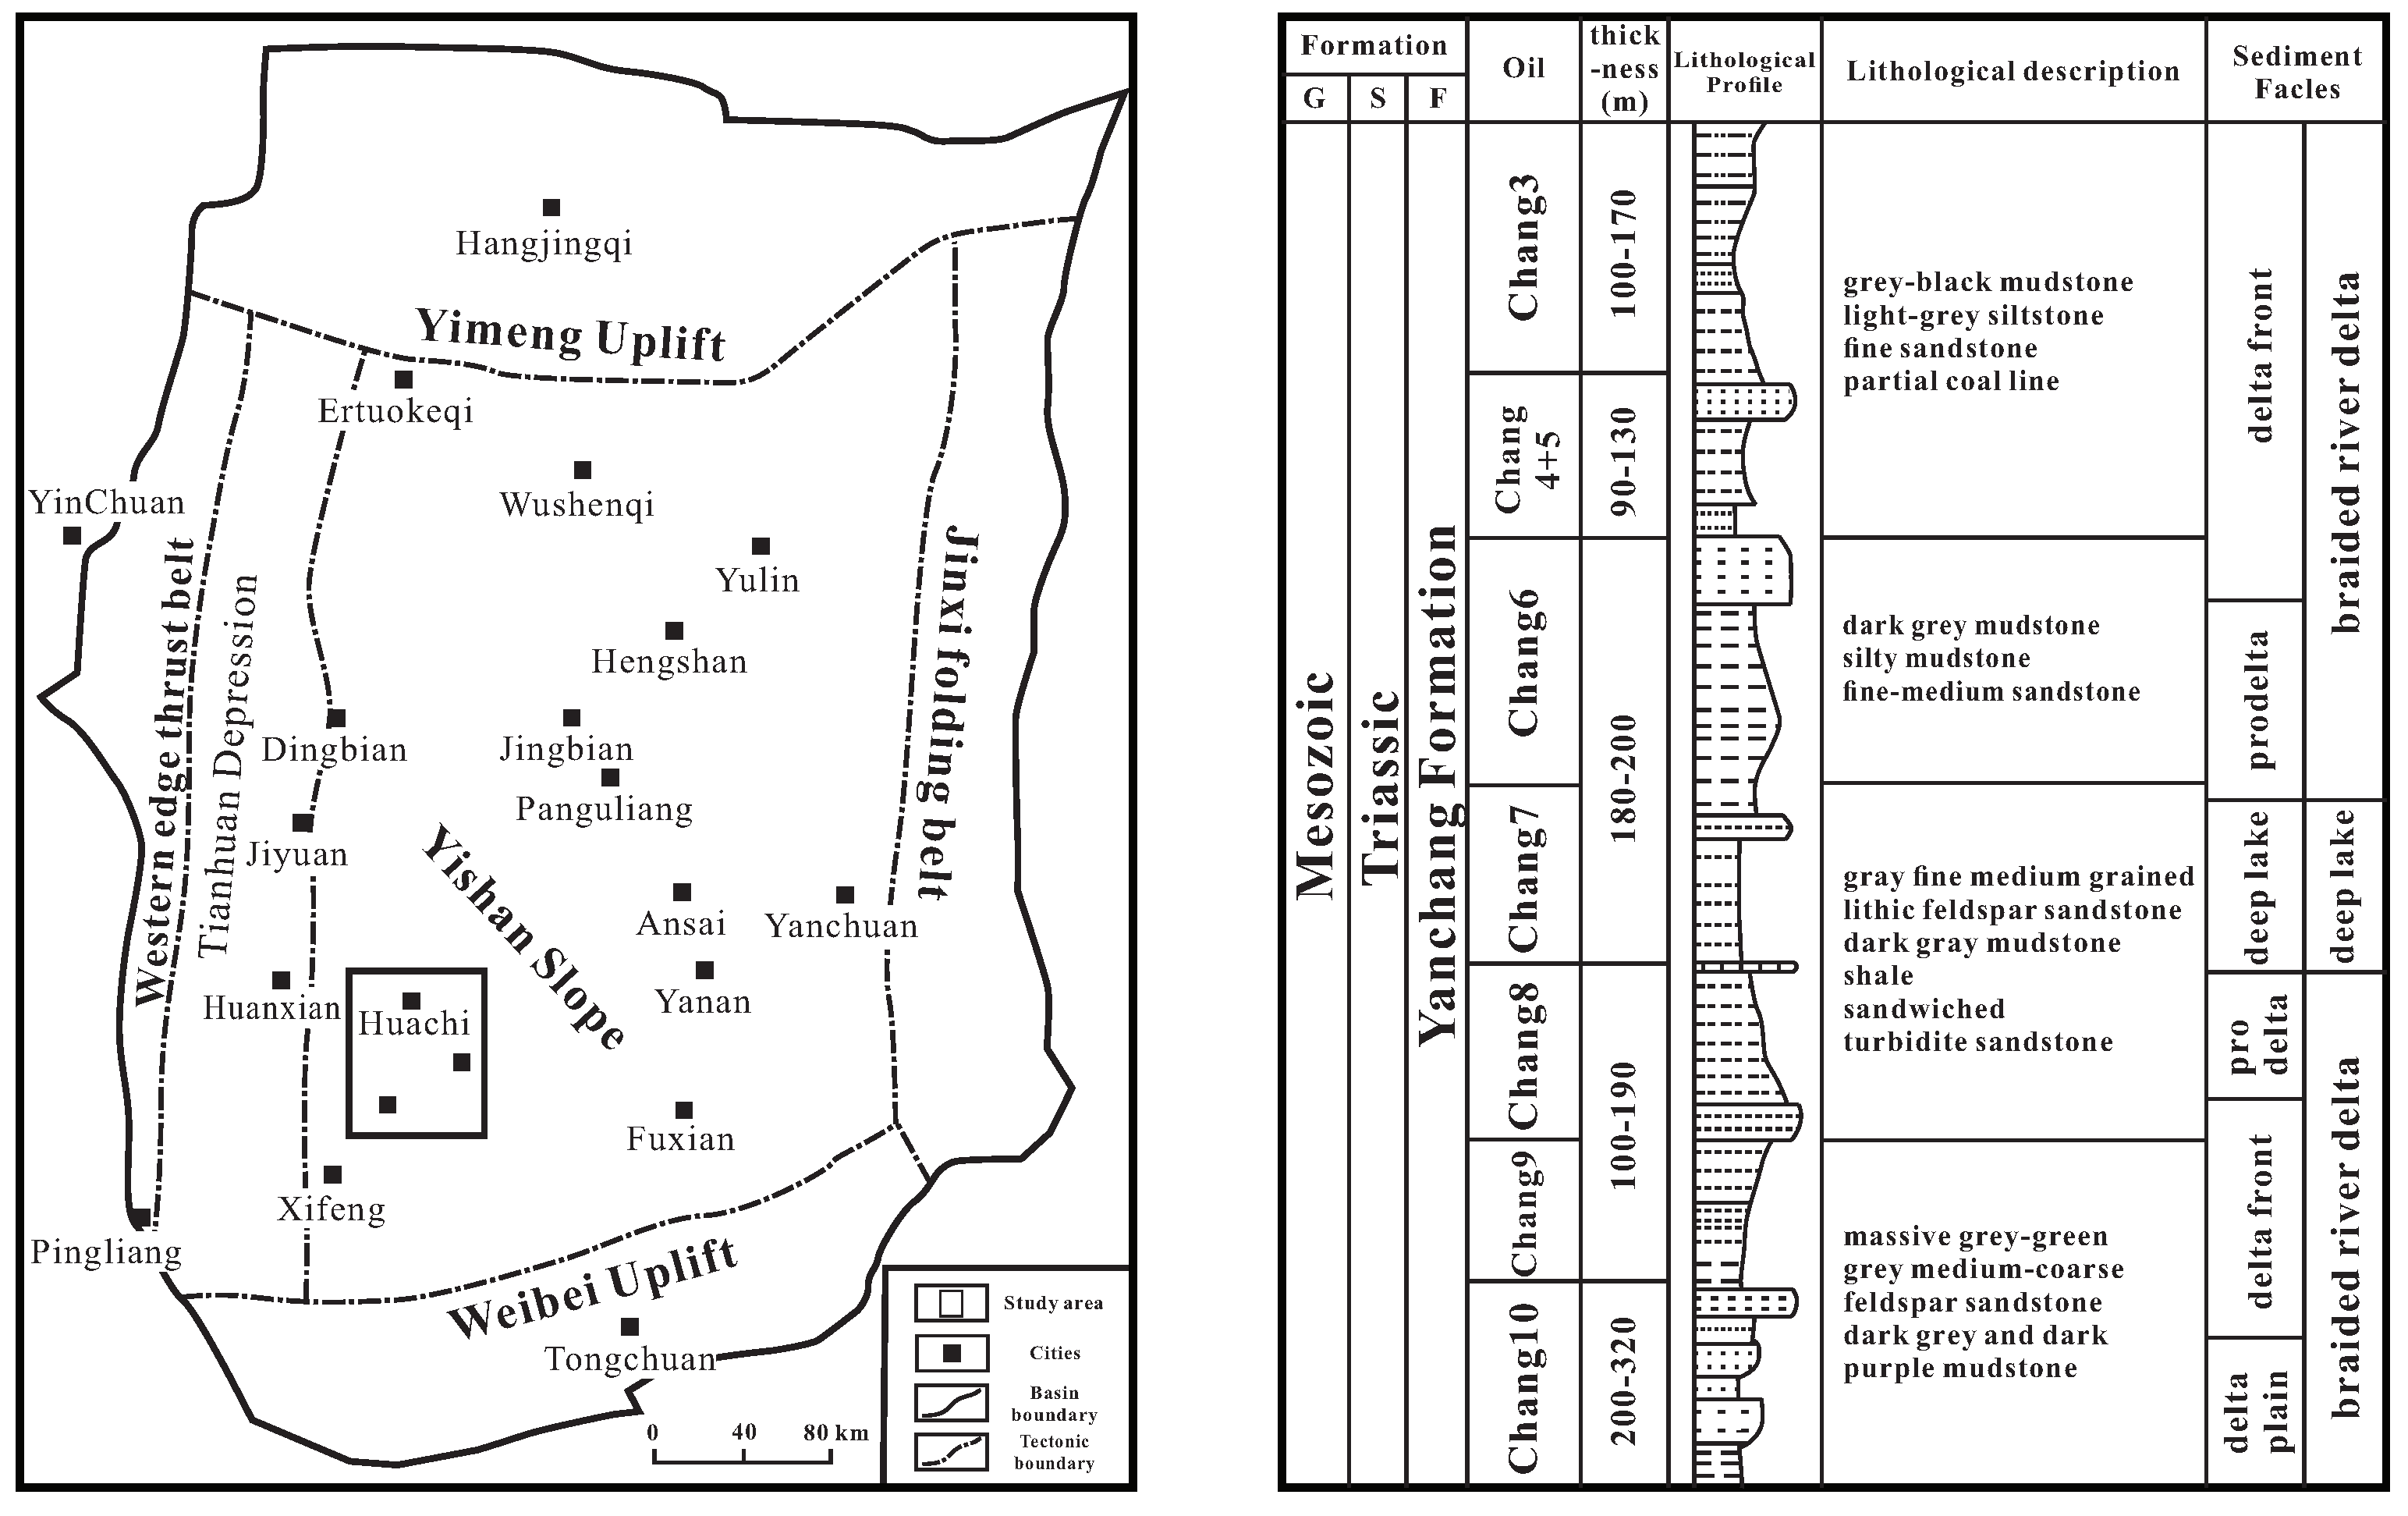
2. Geological Settings

The Ordos Basin, a typical superimposed basin, is the second largest basin in China, spanning an area of 3.7 × 10⁵ km2 [2,5,6,11]. Characterized by a simple monocline with an average structural slope of 1/100, the accumulation of oil and gas in this region appears to be unrelated to its structural features, as they primarily occur within lithologic reservoirs. The Yanchang Formation serves as the main target layer for the exploration and development of oil and gas in the area, exhibiting characteristics such as well-developed hydrocarbon source rocks, matching source–reservoir–cap assemblages, a vast exploration field, significant potential, and abundant petroleum resources.
The Yanchang Formation underwent multiple stages of water inflow and recession, resulting in the development of numerous sets of sandstone and mudstone. The Chang 6 to Chang 8 Members are the primary targets for exploration and development (Figure 1). The lithology of the Chang 8 Member is predominantly medium-fine lithic feldspar sandstone, followed by medium-fine lithic feldspar sandstone. In general, the compositional maturity of sandstones in the study area is characterized by medium structural maturity and medium-to-good sorting, with mainly subangular roundness and a predominance of point–line contacts between grains. The residual feldspar primarily consists of albite (or acidic plagioclase), with albitization of plagioclase being a notable feature.

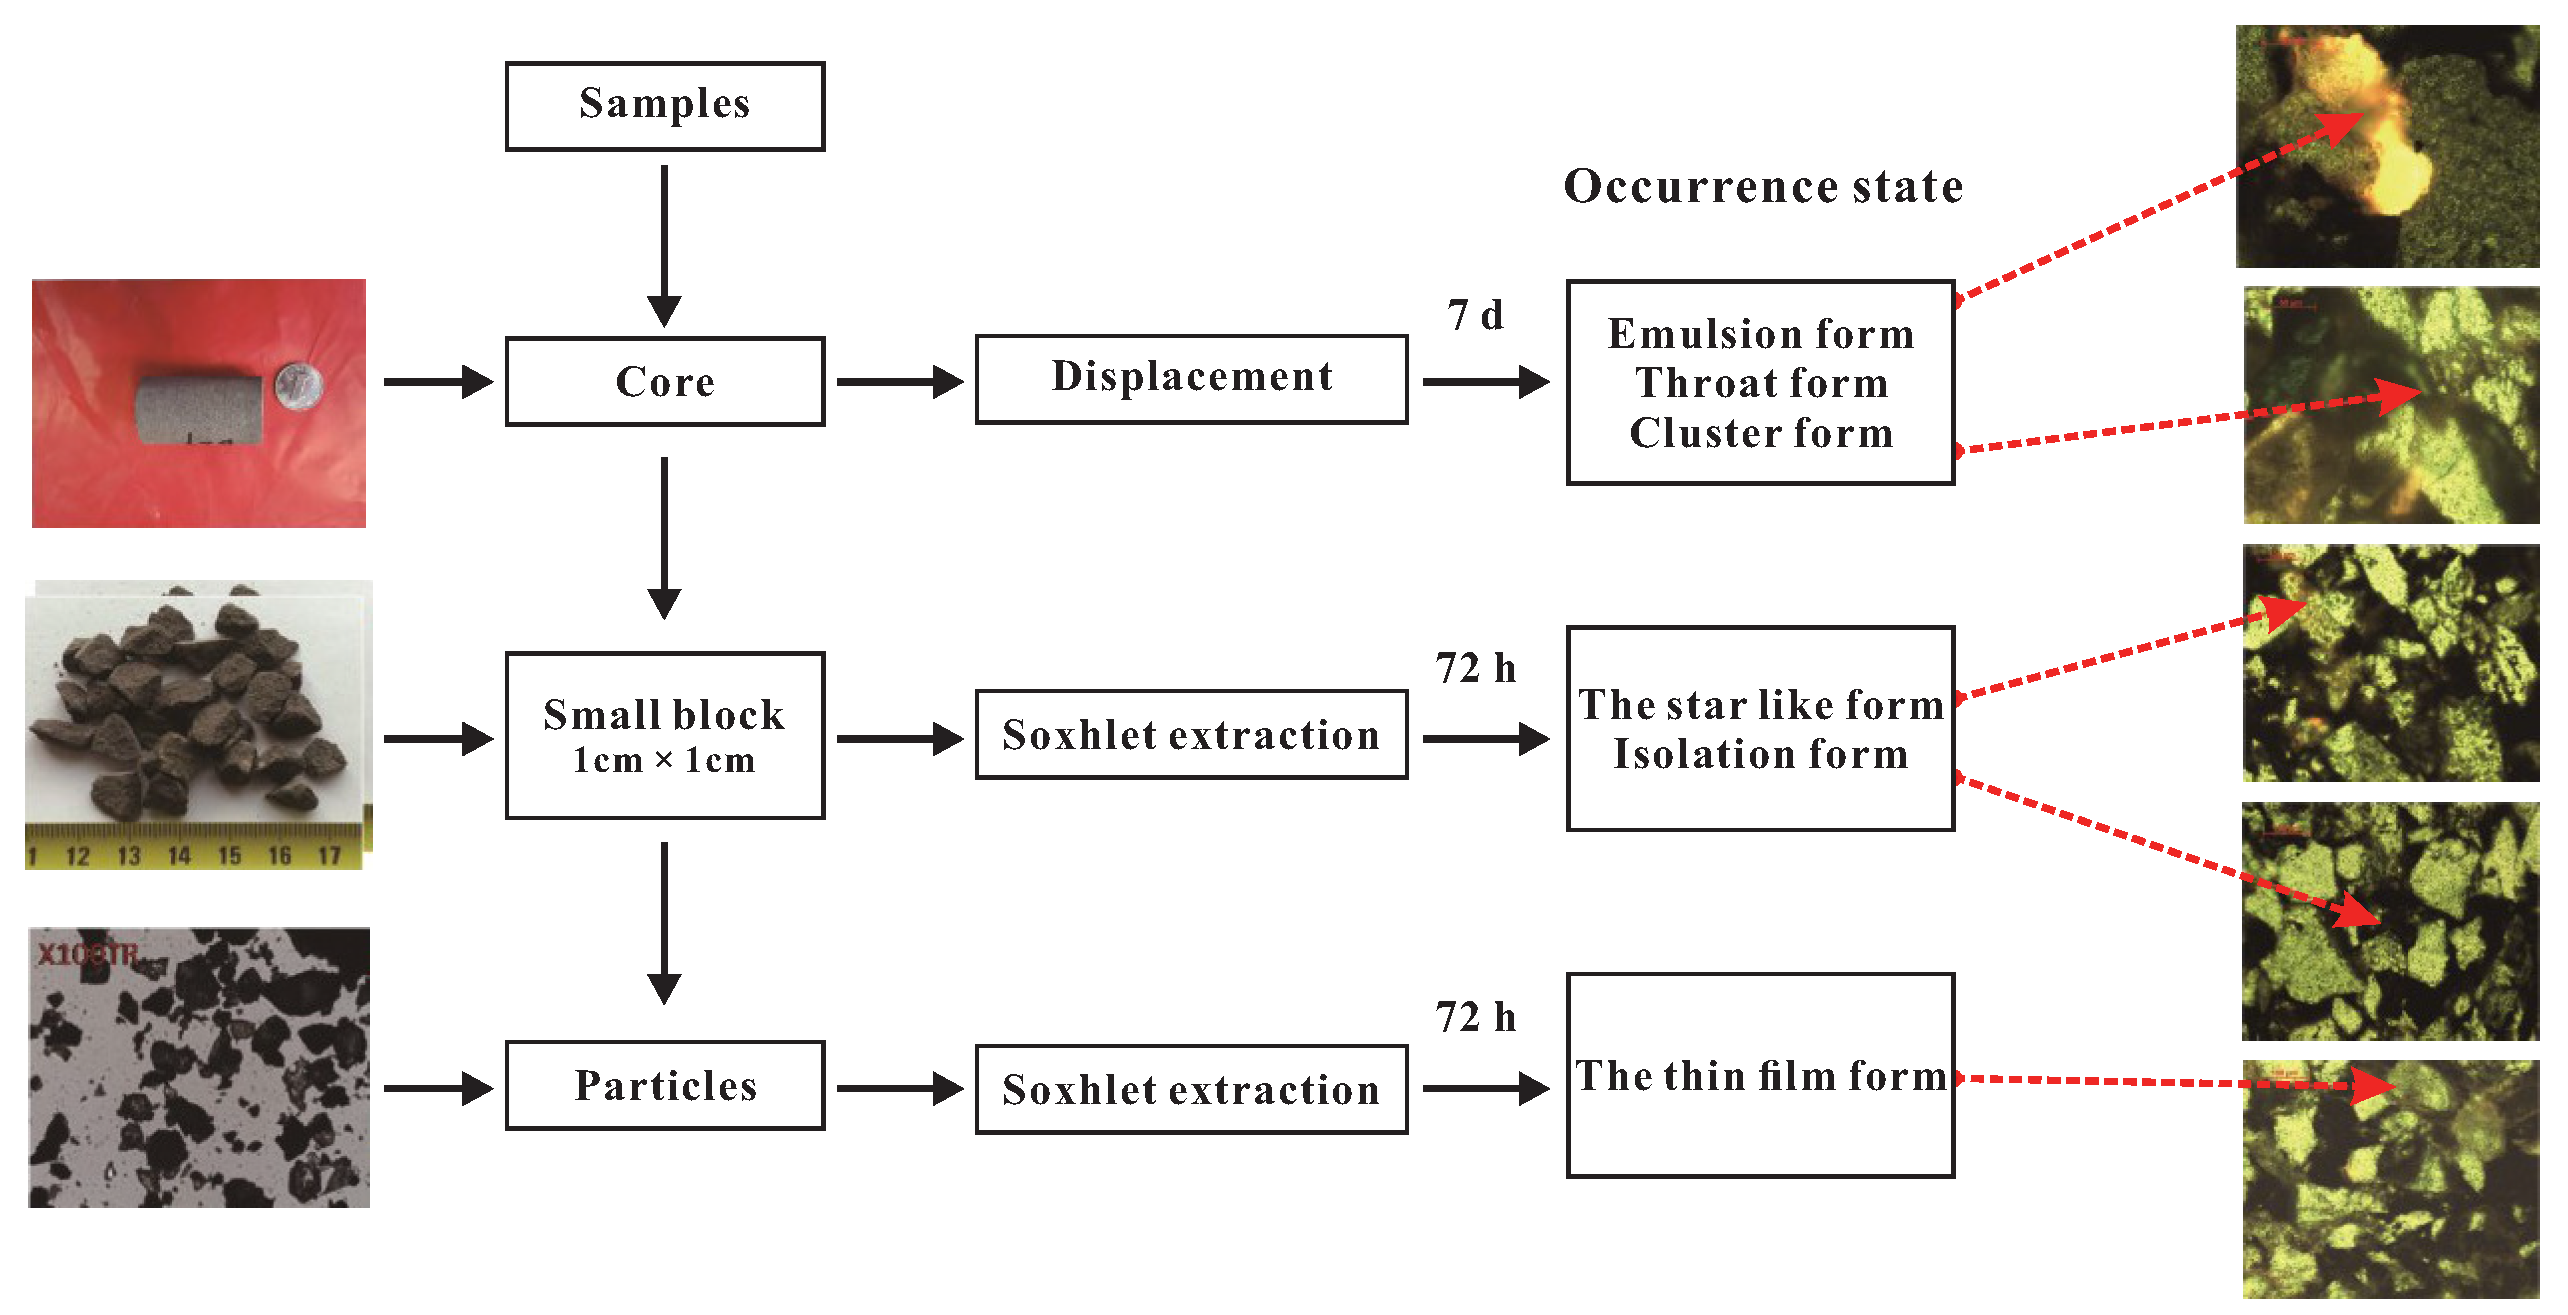
3. Materials and Methods

In this study, 12 samples were collected from the well core of the Chang 8 Member in the Huaqing area, Ordos Basin. The samples included medium-fine lithic arkose, medium-fine lithic arkose, and fine feldspathic debris sandstone. The porosity of the samples ranged from 6.33% to 15%, while the permeability varied from 0.037 to 1.25 × 10⁻³ μm2, representing a set of typical tight oil reservoirs. All samples underwent basic geological experiments, such as porosity and permeability testing, casting thin section observation, and X-ray diffraction (XRD) mineral composition analysis (Table 1). During core drilling and placement, the formation pressure was released. The data obtained in the analyses and tests during this experiment were all information on the tight oil remaining in sandstones.

3.1. FTS and ESEM Observation

Fluorescent thin sections (FTSs) and Environmental Scanning Electron Microscopy (ESEM) are currently the two most prevalent methods for observing the micro-occurrence states of tight oil [5,14,15]. By analyzing variations in fluorescence colors, intensities, and occurrence locations, researchers can examine and assess the micro-occurrence states of tight oil in sandstones. In this study, a Nikon 80i three-channel advanced fluorescence microscope was employed for sample identification.
The morphology of microscale and nanoscale pores, as well as the internal oil properties, could be observed by using ESEM in the low-vacuum mode. By leveraging the fact that X-ray photon energy varies with element types, X-ray Energy Dispersive Spectroscopy (EDS) could be employed to quantitatively measure the carbon content of hydrocarbons for component analysis [15,30]. A Quanta FEG450 equipped with EDS was selected as the measurement instrument. Experiments were conducted in the low-vacuum mode with a chamber pressure of 10 Pa and a working voltage of 15 kV to prevent damage to the original occurrence states of the tight oil. The electron beam spot size was 4.5 nm (corresponding to a beam current value of 7 nA), and the operating temperature was maintained at 20 °C. An ultrathin window (UTW) detector was used in the spectrometer to detect elements with atomic numbers ranging from 4 (Be)∼92 (U). A positive correlation was observed between the peak value of the same element in the same sample and its content.

3.2. Extraction of Tight Oil from Sandstones

Core flow-through methods possess the advantage of displacing tight oils in connected micron pores [18,31]. However, they cannot separate the tight oil that exists in nanoscale pores or is adsorbed on mineral surfaces. The step extraction method can effectively separate tight oils stored in pores or adsorbed on mineral surfaces, but it is unable to determine whether the extracts existed in microscale pores or were stored in nanoscale pores. Consequently, it is crucial to first separate the tight oil present in microscale pores. Following the separation process of adsorbed oil by Taheri-Shakib et al. [19,32], a set of continuous separation methods were employed in this study to differentiate the tight oil existing in connected microscale pores, nanoscale pores, and on mineral surfaces (Figure 2). FTSs and ESEM observations were conducted at each step.
Through this experimental procedure, the tight oil stored in microscale pores, nanoscale pores, and mineral surfaces could be extracted. The specific experimental procedures were as follows: (1) Separation of tight oil stored in microscale pores: The core was placed into the core holder, and the injection pressure was set to 5 MPa [11]. The confining pressure was maintained 3∼5 MPa higher than the maximum injection pressure during the experiment [33]. The displacement process continued until the extracts were colorless, with the entire process lasting approximately seven days. Subsequently, the quantification of residual oil in pores of each size was performed at room temperature. After the organic reagent naturally volatilized to a constant weight, the weight was determined through weighing. In this step, the organic solvent was a mixture of dichloromethane and methanol (v:v 93:7). (2) Separation of tight oil stored in nanoscale pores: The sample was gradually broken under knocking to promote natural separation (the sample size was close to 1 cm × 1 cm), and then it was placed in a Soxhlet extractor for 72 h of continuous extraction. After the experiment, the extracts were collected and weighed. (3) Separation of tight oil adsorbed on mineral surfaces: The cooled sample was crushed in a 60∼80 mesh (single particle size) and placed in a Soxhlet extractor for 72 h of continuous extraction [34]. After the experiment, the extracts were collected and weighed. In this step, the organic solvent was chloroform. Following the completion of the above experiment, the extracts collected in steps (1), (2), and (3) were analyzed by using family components, gas chromatography/mass spectrometry (GC/MS), and fourier-transform infrared spectroscopy (FTIR).

3.3. Separation of Fractional Compositions

The methods for separating the fractional compositions have been detailed in the previous literature [35,36]. Tight sandstone extracts were first treated to precipitate asphaltenes by using 99.9% n-hexane, followed by separation through column chromatography by employing silica gel (80∼100 mesh) and alumina (100∼200 mesh), respectively. Saturate, aromatic, and polar fractions were obtained by elution with n-hexane, n-hexane/DCM (3:1, v/v), and absolute ethanol, respectively [36,37,38]. The separated solvents of the fractional compositions were individually collected by using a conical flask and transferred to 5 mL weighing bottles with dichloromethane. Once the dichloromethane solvent completely evaporated, the transferred separated solvents of the fractional compositions were weighed [35,36]. The analytical error for the oil and fractional compositions when using this approach was typically less than 2% of the measured weight.

3.4. GC/MS Analysis

All samples were weighed at every stage after separation, and all of the hydrocarbon fractions were subsequently analyzed by using Gas Chromatography–Mass Spectrometry (GC/MS). The GC/MS analysis was conducted on an HP6890N gas chromatograph connected to an HP5973N mass spectrometer; both were produced by Agilent Technologies [12]. The GC conditions were as follows: The column utilized was an HP-5 elastic quartz capillary column (30 m × 0.25 mm × 0.25 μm); the oven temperature program was set to increase from 80 °C (held for 2 min) to 290 °C (held for 30 min) at a rate of 4 °C/min; high-purity helium gas (99.999%) served as the carrier gas, and a constant pressure of 11.121 kPa was maintained. For the MS conditions, the ion source employed was an EI with ionization at 70 eV, and the temperature of the ion source was set to 280 °C.

3.5. FTIR Analysis

The pressed KBr pellet method was employed for the Fourier-Transform Infrared Spectroscopy (FTIR) analysis [12]. Initially, the sandstone extracts were dispersed in powder form with dry KBr. Subsequently, the samples were mixed with KBr at a weight ratio of 1:120 and pressed into pellets under a pressure of 130 bars. A Bruker Vertex70 FTIR spectrometer was utilized to acquire the FTIR spectra at room temperature. The spectra were measured within the range of 400∼4000 cm−1, incorporating 128 scans, and the testing accuracy was 0.24 cm−1.

4. Results and Discussion

4.1. The Occurrence State of Tight Oil

The pore and throat system of tight sandstone reservoirs is more complex than that of conventional reservoirs due to the continuous evolution of sedimentary and diagenetic processes throughout geological history [18,20]. As a result, the micro-occurrence characteristics of the storage of tight oil in these reservoirs differ from those in conventional reservoirs [5,12,39]. Accurate characterization of the micro-occurrence states of tight oil in sandstones is crucial for the effective assessment of tight oil resources.

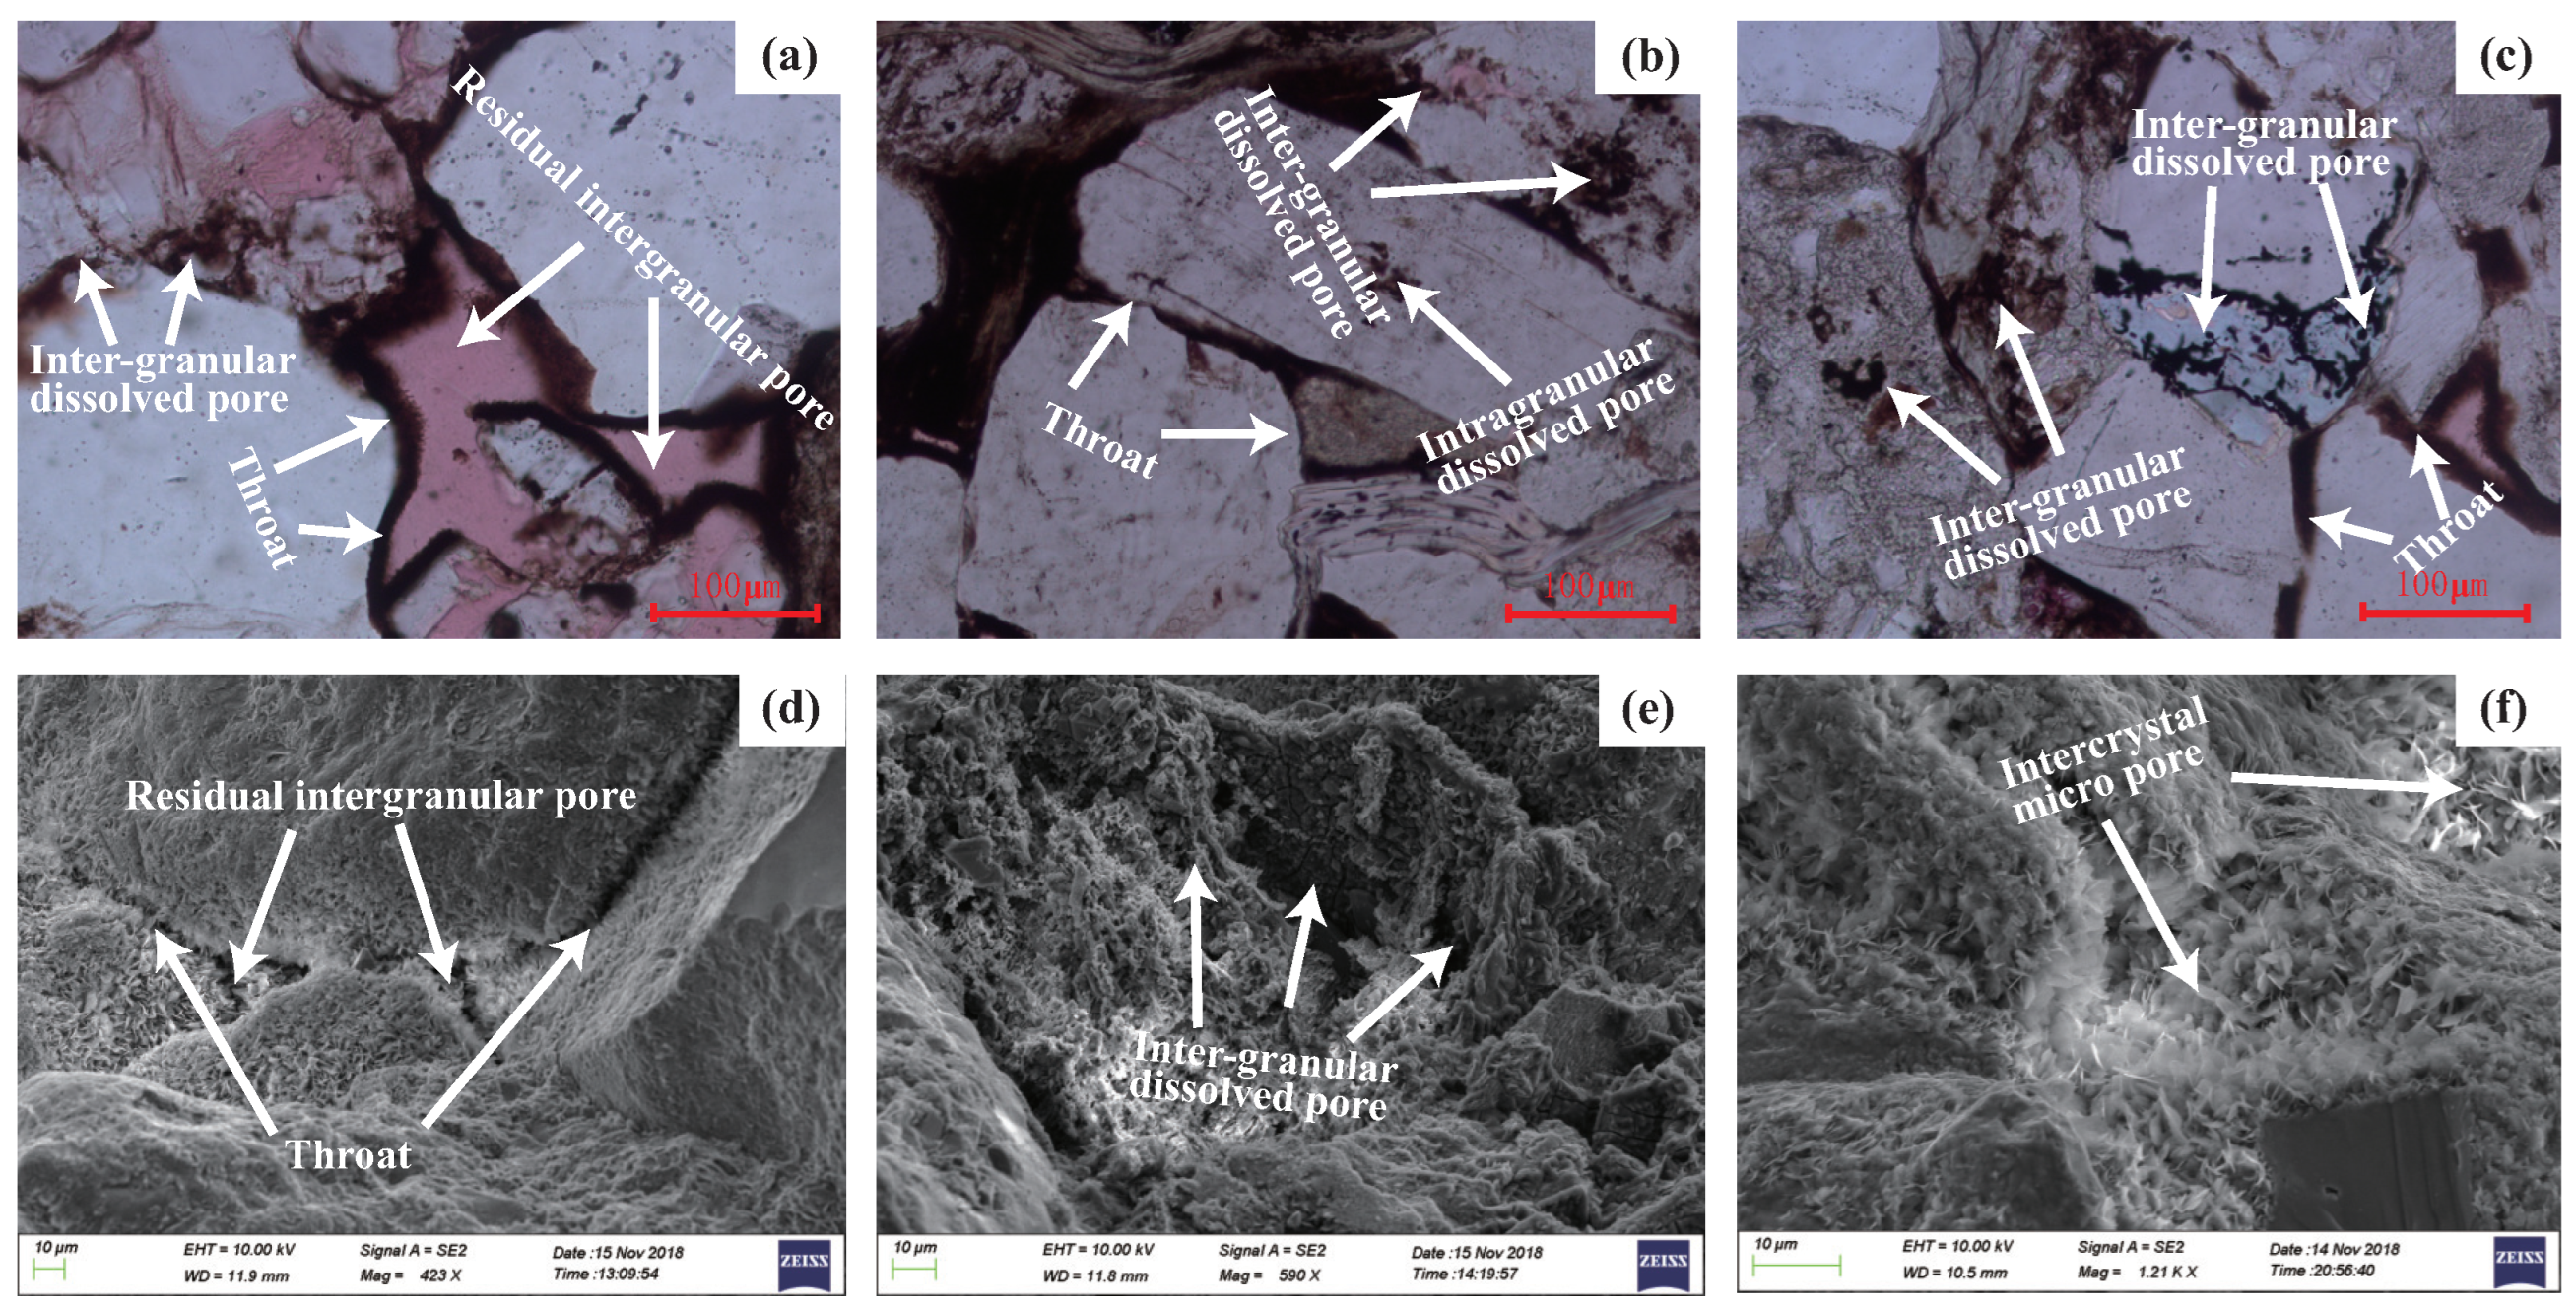
4.1.1. Distribution of Pores and Throats

Pores and throats are the primary locations for tight oil accumulation. Prior to analyzing the micro-occurrence states of tight oil in sandstones, it is essential to determine the distribution characteristics of pores and throats. Sandstone samples from the Chang 8 Member of the Yanchang Formation were selected from drill cores of seven wells, and 24 thin sections (TSs) and 26 field-emission scanning electron microscopy (FE-SEM) analyses were conducted to examine pore and throat types and pores’ structural characteristics. The reservoir space of tight sandstone in the study area mainly consisted of three types: residual intergranular pores, secondary dissolved pores, and intercrystalline pores. Based on the TSs and FE-SEM observations, the shapes of the residual intergranular pores were predominantly elliptical, triangular, polygonal, elongated, or irregular (Figure 3a,c) and were distributed on a scale of several tens of micrometers, accounting for 59.05%. The secondary dissolved pores included feldspar dissolved pores and debris dissolved pores, accounting for 30.96% and 7.14%, respectively. The shapes of the secondary dissolved pores were primarily irregular and elliptical.
Furthermore, the feldspar dissolved pores could be categorized into intergranular dissolved pores and intragranular dissolved pores, with size ranges of 1.12∼33.46 μm and 200∼800 nm, respectively. Notably, numerous nanoscale pores formed through the aggregation of flaky chlorite particles, which constituted the core structures of intercrystalline pores (Figure 3f). The throats exhibited sheet-like or bent-sheet shapes, and the throat radius was mainly distributed in the range of 1∼5 μm (Figure 3).
The pore and throat types primarily consisted of small pores with fine/microthroats and large pores with fine/microthroats. Based on the TSs and FE-SEM observations, the microscale pores predominantly encompassed residual intergranular pores and intergranular dissolved pores, while the nanoscale pores mainly included intragranular dissolved pores and intercrystalline pores.

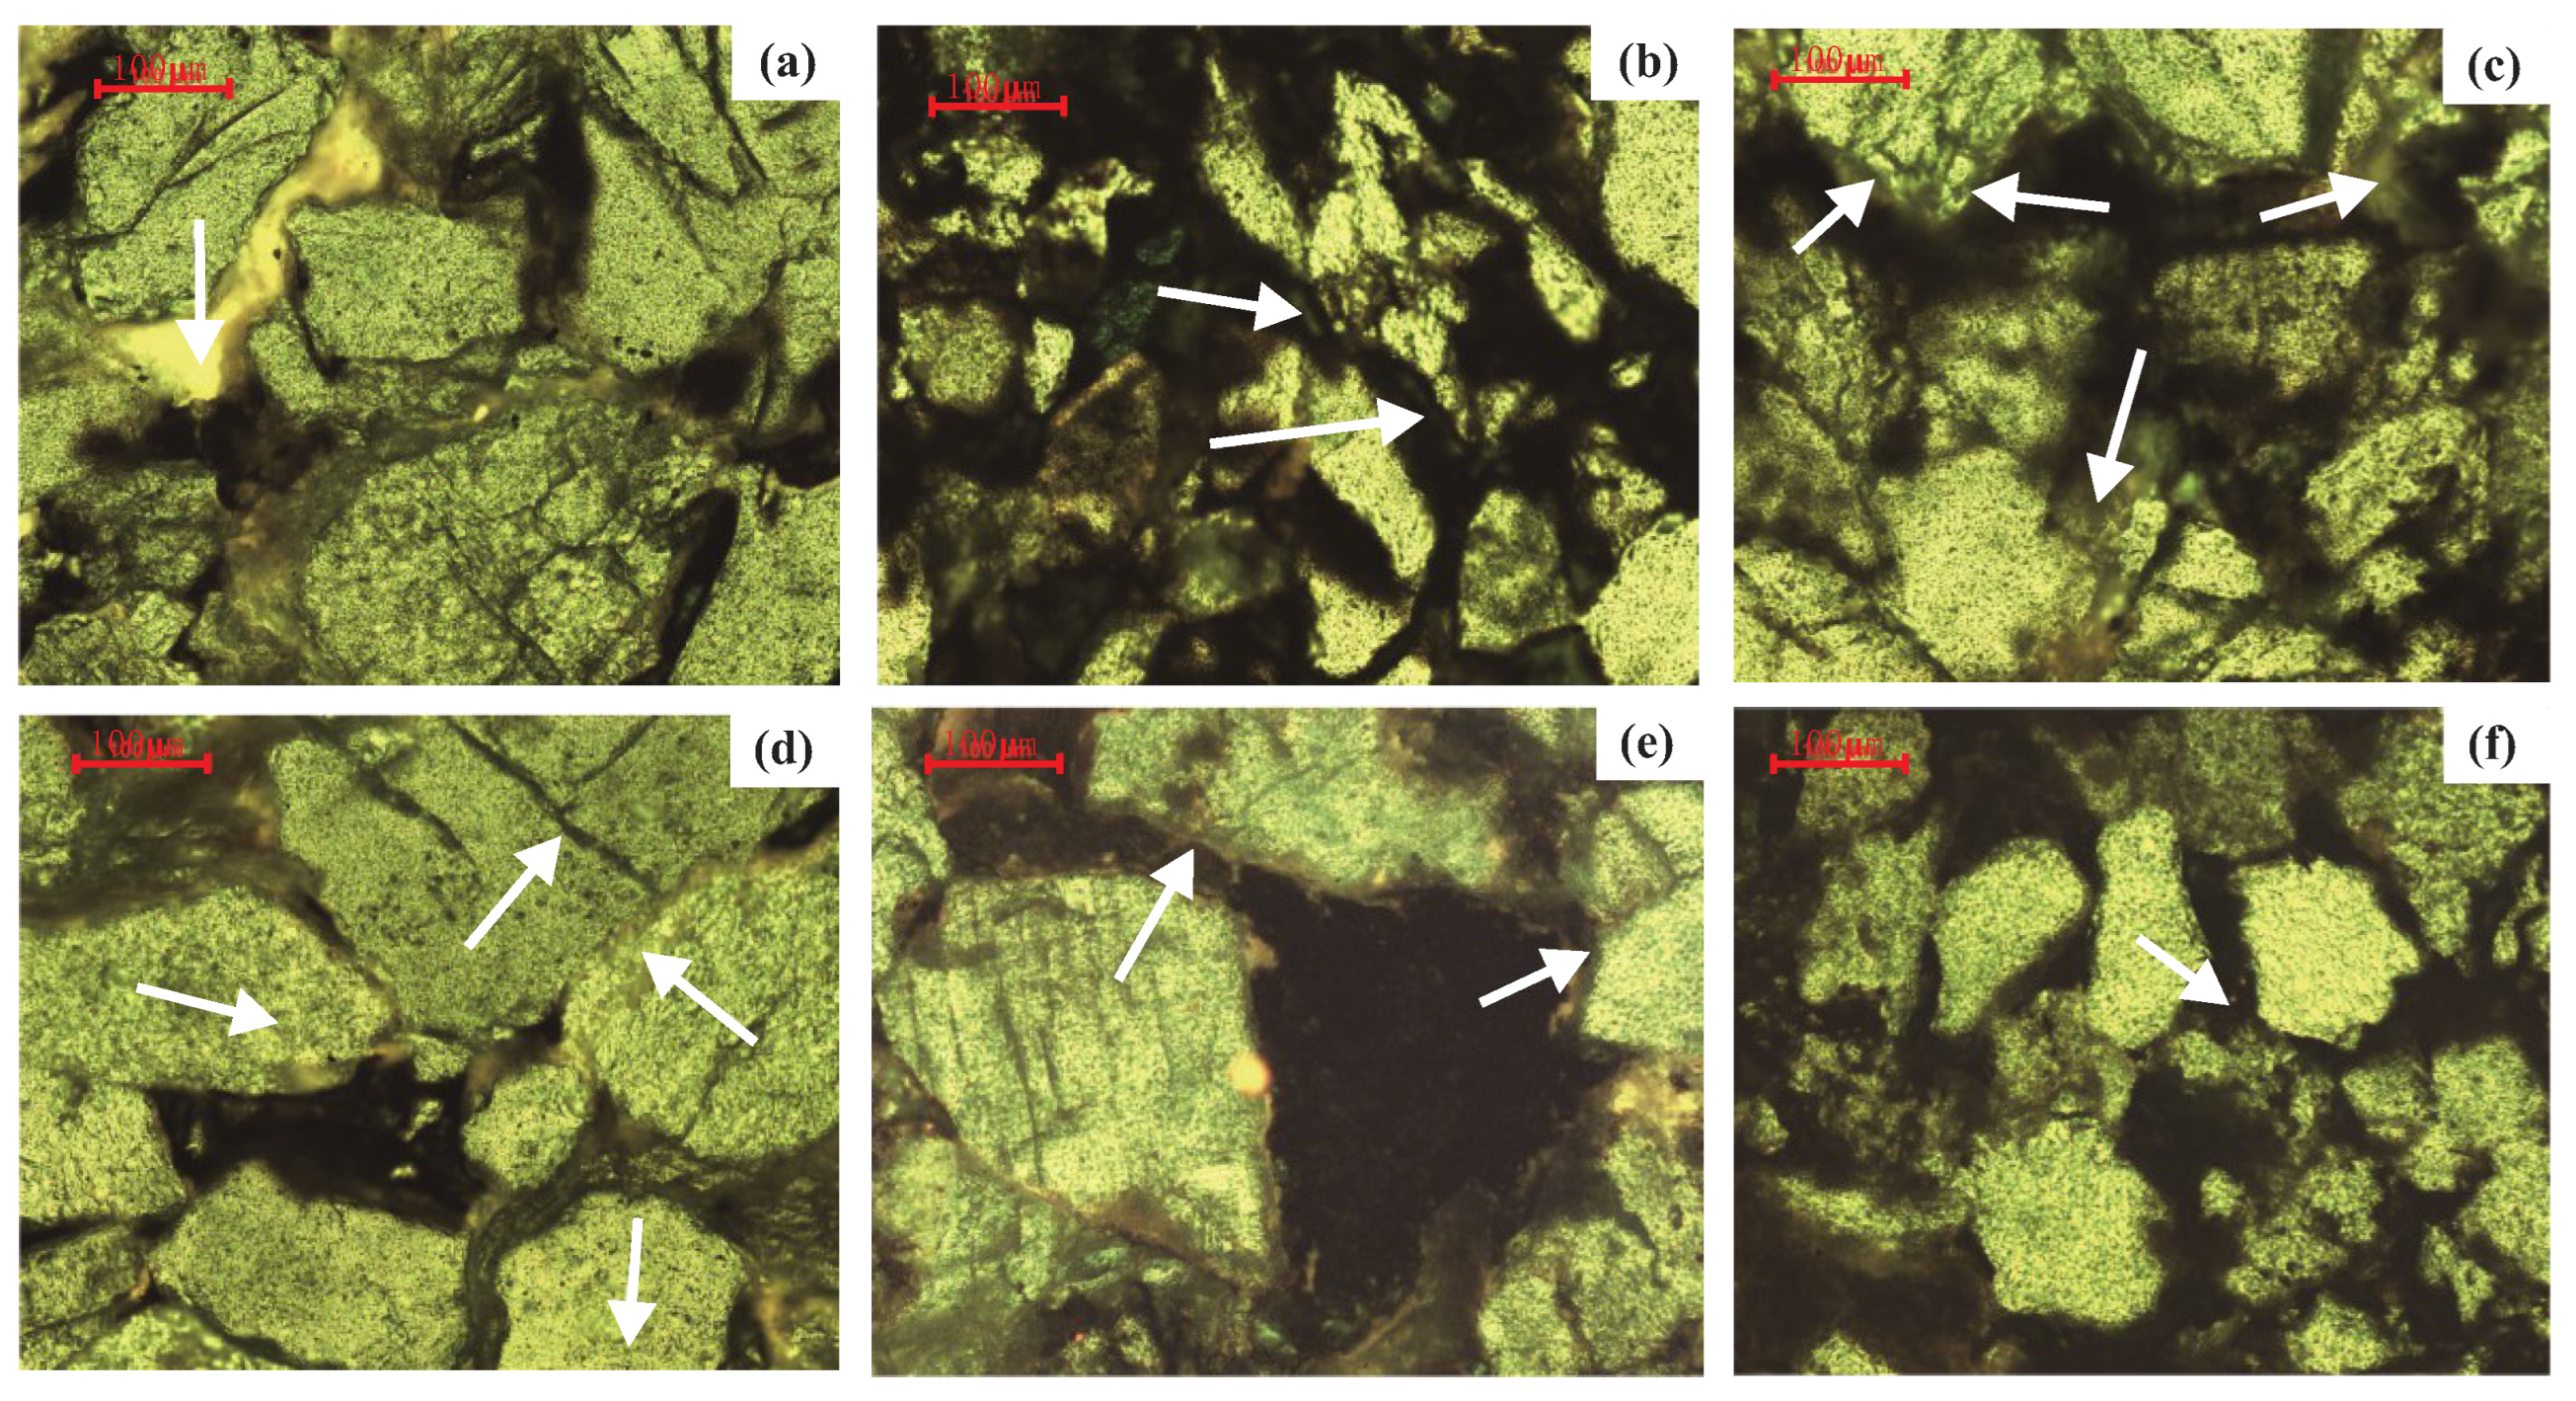
4.1.2. Micro-Occurrence State of Tight Oil

The micro-occurrence characteristics of tight oil encompass the micromorphology and location of tight oil within sandstones. By elucidating the storage space of tight oil, this study employed a combination of FTSs and ESEM to analyze the micro-occurrence features of tight oil.
Based on the fluorescence color, the tight oil remaining in the reservoir was predominantly yellow and green, suggesting a similar period of hydrocarbon filling [14]. Through the examination of 96 FTS images from 12 samples collected from 7 representative wells in the Ordos Basin and taking the morphology of tight oil and its pore space characteristics into account, the forms of tight oil could be categorized into six types: emulsion, cluster, throat, thin film, star-like, and isolation forms (Figure 4).
The morphology of tight oil stored in the reservoir was primarily influenced by the size and shape of the pores and throats. The emulsion form was predominantly distributed within residual intergranular pores, with a plane size distribution spanning several tens of microscales. Its distribution was governed by the shape and space of the residual intergranular pores. The morphology mainly consisted of large-area and long strips or irregular ellipsoids, and the fluorescence color was primarily bright yellow (Figure 4a). The throat form, which was primarily composed of slender, unevenly thick strips, was mainly distributed in the center of the throat. Its plane size distribution ranged within several microscales, and the fluorescence color was mostly lighter green (Figure 4b). The cluster form, which was characterized by contiguous granular or ellipsoidal distribution, was primarily situated on the edges of intergranular dissolved pores. The fluorescence color was predominantly green or bright yellow, with the plane size distribution extending from several to tens of microscales (Figure 4c).
The star-like form primarily consisted of sizable isolated aggregates with a continuous distribution, and it was mainly located in the central part of feldspar particle dissolution or along the feldspar cleavage fracture with a nearly parallel distribution of thin strips. The plane size distribution was in the range of hundreds of nanoscales, and the fluorescenxe color was predominantly bright yellow or light green (Figure 4d). The thin film form was mainly distributed on the surface of the mineral particles as unevenly thick and thin layers, forming a bright ring edge surrounding the mineral particles. The fluorescence color was generally green (Figure 4e). The isolation form was primarily dispersed within clay minerals as scattered spots, with the fluorescence color that was predominantly bright yellow and a plane size distribution of tens of nanoscales (Figure 4f). As the FTS observation indicated, the tight oil occurring in the microscale pores was mainly in the emulsion form, throat form, and cluster form; in the nanoscale pores, it was primarily in the star-like form and isolation form; on the mineral surface, the tight oil was mainly in the thin film form.
The low-vacuum environment of ESEM is advantageous for preserving the original micro-occurrence states of tight oil [12,39]. Moreover, the elemental analysis provided by EDS enabled in situ testing of amounts of tight oil with various pore sizes [15,40]. The combination of ESEM and EDS allowed for a semi-quantitative analysis of tight oil micro-occurrence in sandstones [2,41]. By categorizing the occurrence states of tight oil by using FTSs and meticulously characterizing the corresponding occurrence states with ESEM and EDS, the micro-occurrence states and patterns of tight oil could be determined. Taking sample S2 as an example, the presence of both carbon and other mineral elements in the tight oil states indicated that tight oil existed within the reservoir as an aggregate of minerals and crude oil.
The emulsion form of tight oil found in residual intergranular pores was primarily several to tens of microscales in size, with agglomerated or elongated shapes, as observed in ESEM (Figure 5(a1)). The carbon content of this form was 42.48% (Figure 5(a2)). The presence of C, N, S, and other mineral elements in the emulsion form suggested that it may better retain the structure and properties of the crude oil itself. The throat form of the tight oil that occurred in throats was predominantly observed as strips and grains with unequal thickness (mainly within the range of <1∼3 μm) in ESEM (Figure 5(b1)), and it had a carbon content of 39.84% (Figure 5(b2)). The throat form exhibited C, N, and S elements, which was similar to the composition of the emulsion form.
The cluster form predominantly occurred in intergranular dissolved pores, and its shape and size were influenced by the characteristics of these pores, as observed in ESEM (Figure 5(c1)). The carbon content of the cluster form was 23.97% (Figure 5(c2)). Chlorite is primarily composed of a double-layer structure, with the inner layer mainly being formed during the process of particle dissolution. This process results in a narrow space, yielding small crystal sizes and weak crystal types of chlorite, which typically appear as disordered aggregate accumulations. In contrast, the intercrystalline pores observed in ESEM primarily consisted of the outer layer of chlorite. These chlorite crystals were larger and exhibit better-defined crystal types, primarily displaying leaf-like morphologies. They generally formed pore linings on the surfaces of vertical particles.
Owing to the crystal characteristics of the outer layer chlorite, the bidirectional convection of fluid within the pores hindered the migration of tight oil from the intercrystalline pores. As a result, the tight oil in these pores mainly occurred in the form of agglomerates or granules (Figure 5(d1)), with, in general, a nanoscale plane size and a carbon content of 17.55% (Figure 5(d2)). The thin film form was typically found on the mineral surface (Figure 5(e1)). Its distribution was influenced by particle size, and the thickness was typically nanoscale. The carbon content of the thin film form was 9.67% (Figure 5(e2)).
The thin film form contained not only the carbon element, but also other mineral elements, suggesting that the tight oil occurring on the mineral surface may have existed as a complex. The star-like form of tight oil, which was distributed within the dissolved pores in feldspar particles, primarily occurred in the shape of unevenly thick ring edges (Figure 5(f1)). The plane thickness was typically less than 100 nm, and the carbon content was 4.49% (Figure 5(f2)). The tight oil stored in the sandstones exhibited various shapes and was influenced by the characteristics of the pores and minerals.
The micro-occurrence states of tight oil in the Chang 8 Member reservoirs of the Ordos Basin encompassed the emulsion form, throat form, cluster form, star-like form, isolation form, and thin film form. By considering the microscopic characteristics of tight oil in different micro-occurrence states and the differences in their positions, a preliminary micro-occurrence state pattern diagram for tight oil was established (Figure 6).
Through the ESEM observations, it was evident that nearly all pore types and mineral surfaces exhibited traces of tight oil. Moreover, due to the development of pore throats and variations in mineral properties, the micro-occurrence states of tight oil in the reservoirs displayed significant heterogeneity. Consequently, it was crucial to further analyze the controlling factors that contributed to the differences in tight oil micro-occurrence within sandstones.

4.2. The Influencing Factors of Tight Oil Content in Sandstones

4.2.1. The Content of Tight Oil Storage in Sandstones

Pores and throats serve as the primary spaces for tight oil storage; thus, determining the amount of tight oil stored in different reservoir spaces has consistently been a focal point in tight oil exploration and development [2,21,42]. Figure 7 demonstrates the potential morphology and occurrence distribution of tight oil extracted during various extraction stages, providing insights into the different micro-occurrence states of tight oil separated across these stages. As illustrated in Figure 7(a1), in the original state, tight oil occupied a substantial portion of the pore space and exhibited a strong fluorescence intensity. Furthermore, according to the ESEM observations, the crude oil stored in residual intergranular pores was distributed in the form of continuous oil droplets (Figure 7(a2)) and possessed a high carbon content (Figure 7(a3)). Following displacement, the fluorescence intensity was significantly diminished, and the emulsion form and cluster form that were previously observed in the original state were no longer present.
Likewise, according to the ESEM observations, the tight oil distribution in the residual intergranular pores was diminished (Figure 7(b2)), and the carbon content noticeably decreased (Figure 7(b3)). After extracting the sample and breaking it into 1 cm × 1 cm pieces, the fluorescence appeared to be weak (Figure 7(c1)), and it was primarily distributed on the mineral surface in the form of a thin film. In the corresponding ESEM observations, the isolation form that initially existed in the intercrystalline pores of chlorite had essentially vanished, leaving only the thin film form deposited on the surface of the chlorite crystal (Figure 7(c2)). The carbon content also significantly decreased (Figure 7(c3)). By combining the previous observations from TSs, FE-SEM, FTSs, and ESEM, it was determined that the microscale pores mainly contained the emulsion form, cluster form, and throat form, while the nanoscale pores predominantly contained the star-like form and isolation form. Additionally, the thin film form primarily occurred on the mineral surface.
By utilizing the extraction method, the tight oil occurring in the microscale pores, nanoscale pores, and on mineral surfaces was extracted step by step. As illustrated in Figure 8, the total content of tight oil in sandstones ranged from 7.03 to 20.54 mg/g, with an average of 14.24 mg/g. The content within the microscale pores varied between 0.18 and 10.53 mg/g, averaging 5.05 mg/g, which accounted for 35.46% of the total. The content in the nanoscale pores spanned from 2.11 to 7.89 mg/g, with an average of 5.09 mg/g, representing 35.74% of the total. Lastly, the content on the mineral surface ranged from 2.63 to 5.01 mg/g, with an average of 4.10 mg/g, constituting 28.79% of the total content.

4.2.2. The Influencing Factors of Tight Oil Occurrence

Effectively improving development efficiency and enhancing recovery rates of tight reservoirs have become the focal points of oilfield development [12,43,44,45,46]. While differences in micro-occurrence states and the content of tight oil in sandstones have been investigated, determining the amount of oil stored in sandstones and its influencing factors remains crucial for enhanced oil recovery.
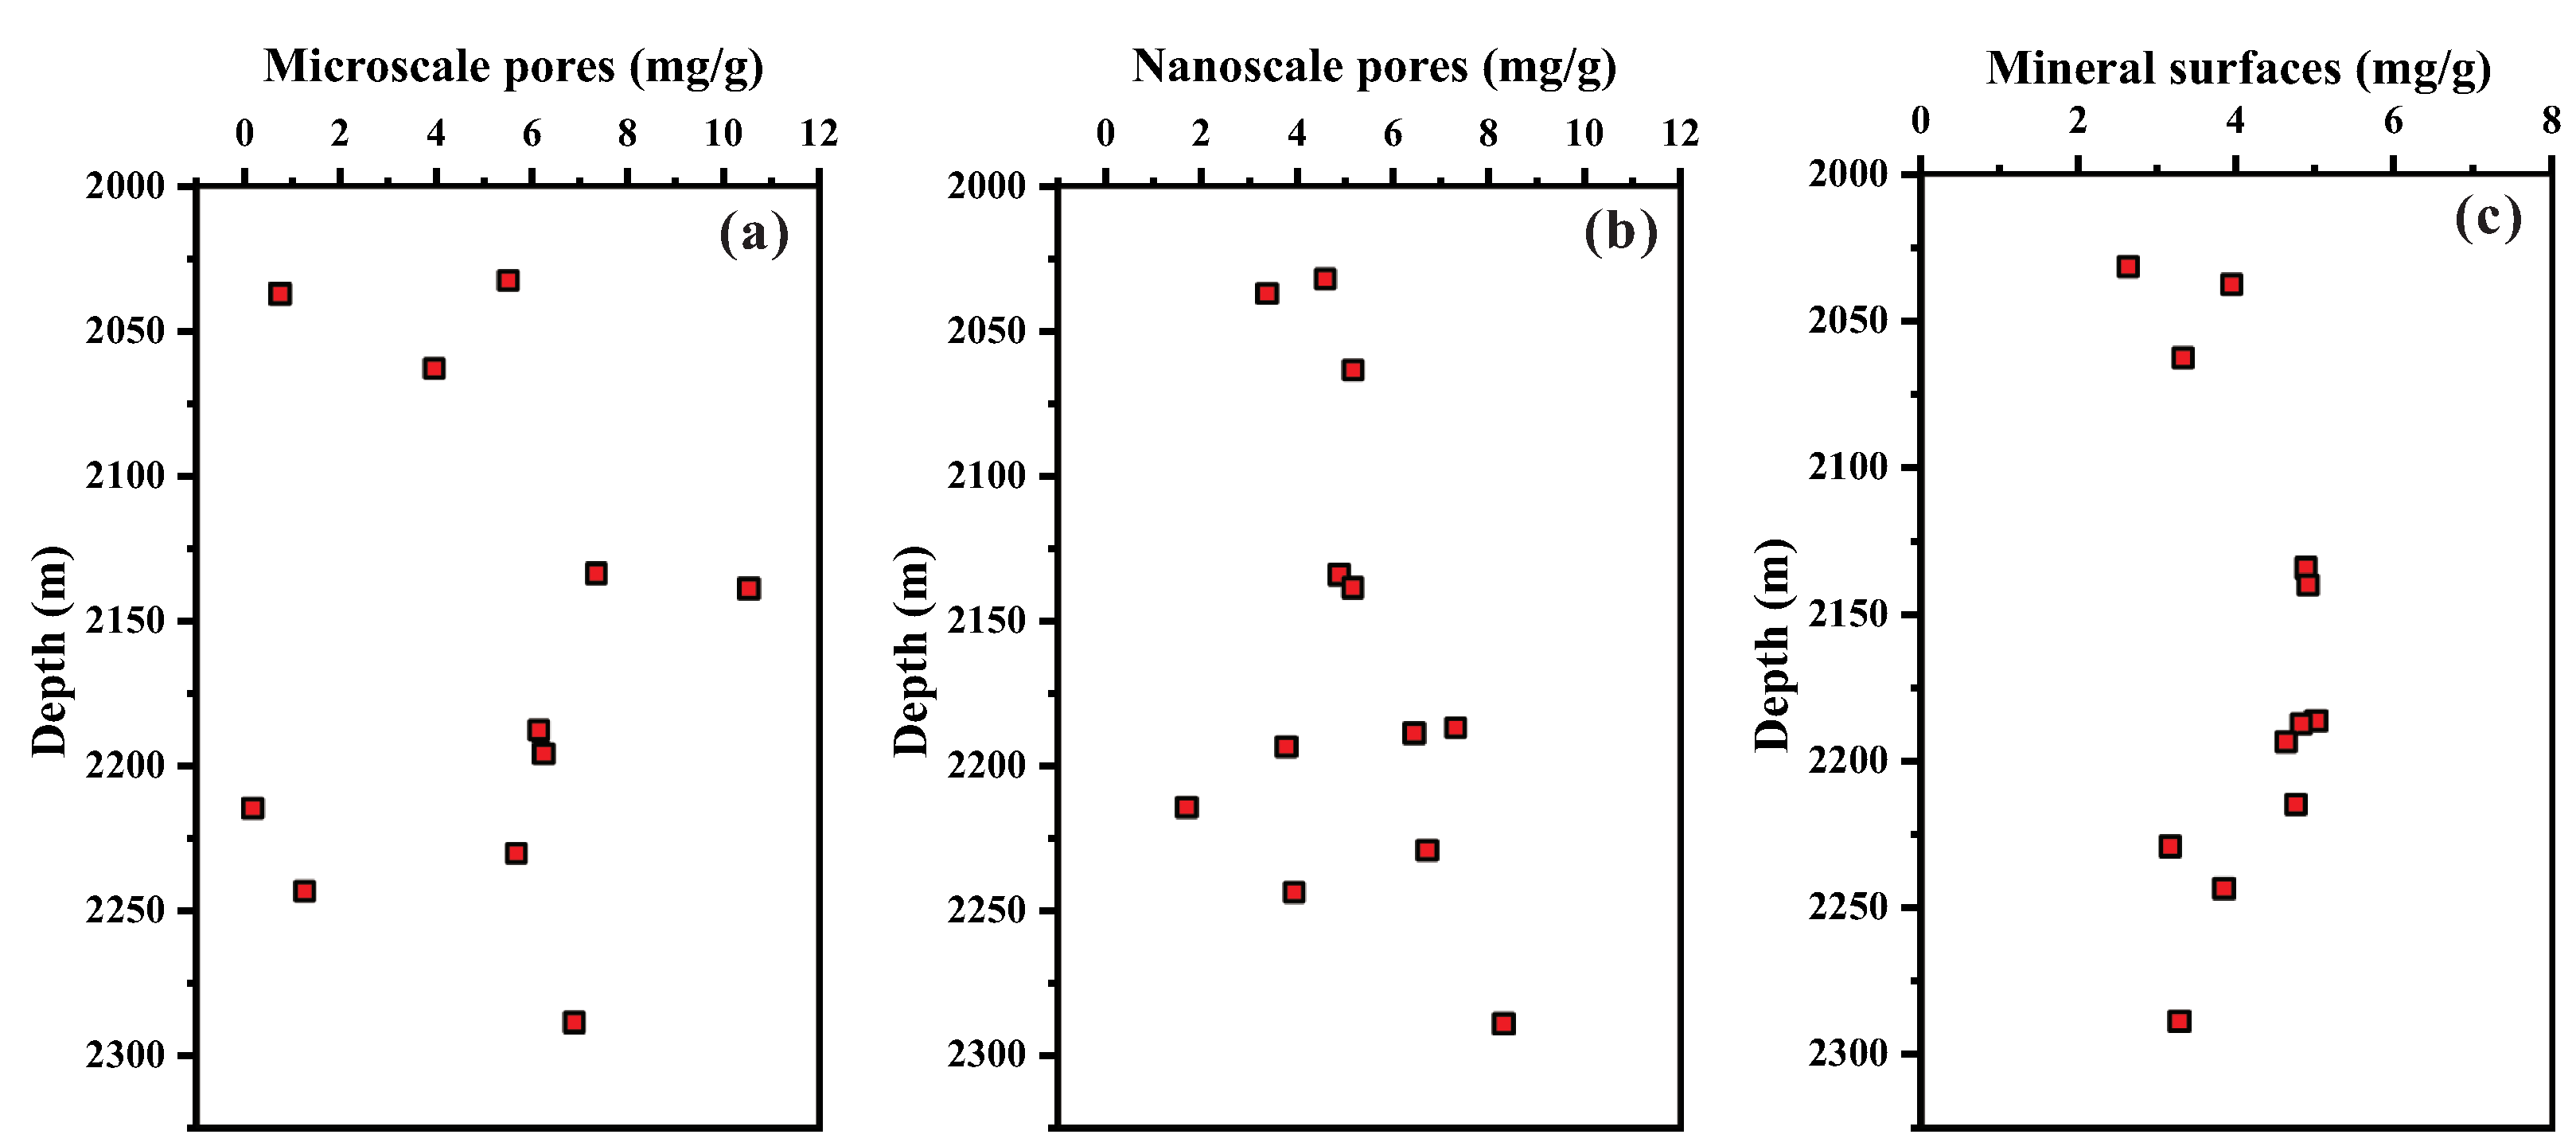
  • 1. Burial depth of tight oil: Figure 9 illustrates the relationship between burial depth and the content of tight oil existing in microscale pores, nanoscale pores, and on mineral surfaces. The content of tight oil in microscale pores showed no correlation with burial depth. This phenomenon may be attributed to the tight sandstone reservoirs experiencing complex diagenesis, which led to high reservoir heterogeneity. The detailed calculation process can be found in the Table S1 of the Supplementary Material.
    As the burial depth increased, the content of tight oil in the nanoscale pores demonstrated a moderate increase. This phenomenon may be attributed to the following reasons: (1) With increasing burial depth, the compaction effect is intensified, leading to a higher densification degree of the reservoir, more developed nanoscale pores, and a greater capacity for storage [5]. (2) As the burial depth and geothermal gradient increase, the viscosity of tight oil decreases, the content of saturated hydrocarbons increases, and more tight oil can enter nanoscale pores under formation pressure [11,41]. Conversely, as the burial depth increased, the content of tight oil on the mineral surface initially increased between 2000 and 2100 m, but decreased with community succession from 2100 to 2300 m. The underlying reason for this is that as the burial depth increases, tight oil viscosity decreases, and the interaction between tight oil and minerals is reduced, resulting in a decrease in the tight oil present on mineral surfaces.
  • 2. Quality factor: The occurrence of tight oil in the reservoir was inevitably influenced by the reservoir’s spatial distribution and pore–throat connectivity. The reservoir quality factor ( Q factor = φ K ) is a critical parameter that determines the reservoir properties, and a Q factor close to 1 indicates superior reservoir properties [15]. As shown in Figure 10a,b, the content of tight oil stored in the microscale and nanoscale pores exhibited a positive relationship with the Q factor, with correlation coefficients of 0.500 and 0.431, respectively. This suggested that the tight oil deposition in sandstones was governed by reservoir properties. The better the original physical properties of the reservoir, the greater the pore–throat connectivity, and the more favorable the conditions for tight oil storage in the reservoir space [47]. In contrast, no significant correlation was observed between the amount of tight oil present on the mineral surface and the reservoir quality factor (Figure 10c). This phenomenon indicated that the storage mechanism of tight oil on mineral surfaces differed from that of pores. Consequently, it was essential to examine the relationship between tight oil content and mineral composition and then clarify the reasons for the differences in tight oil accumulation in sandstones.
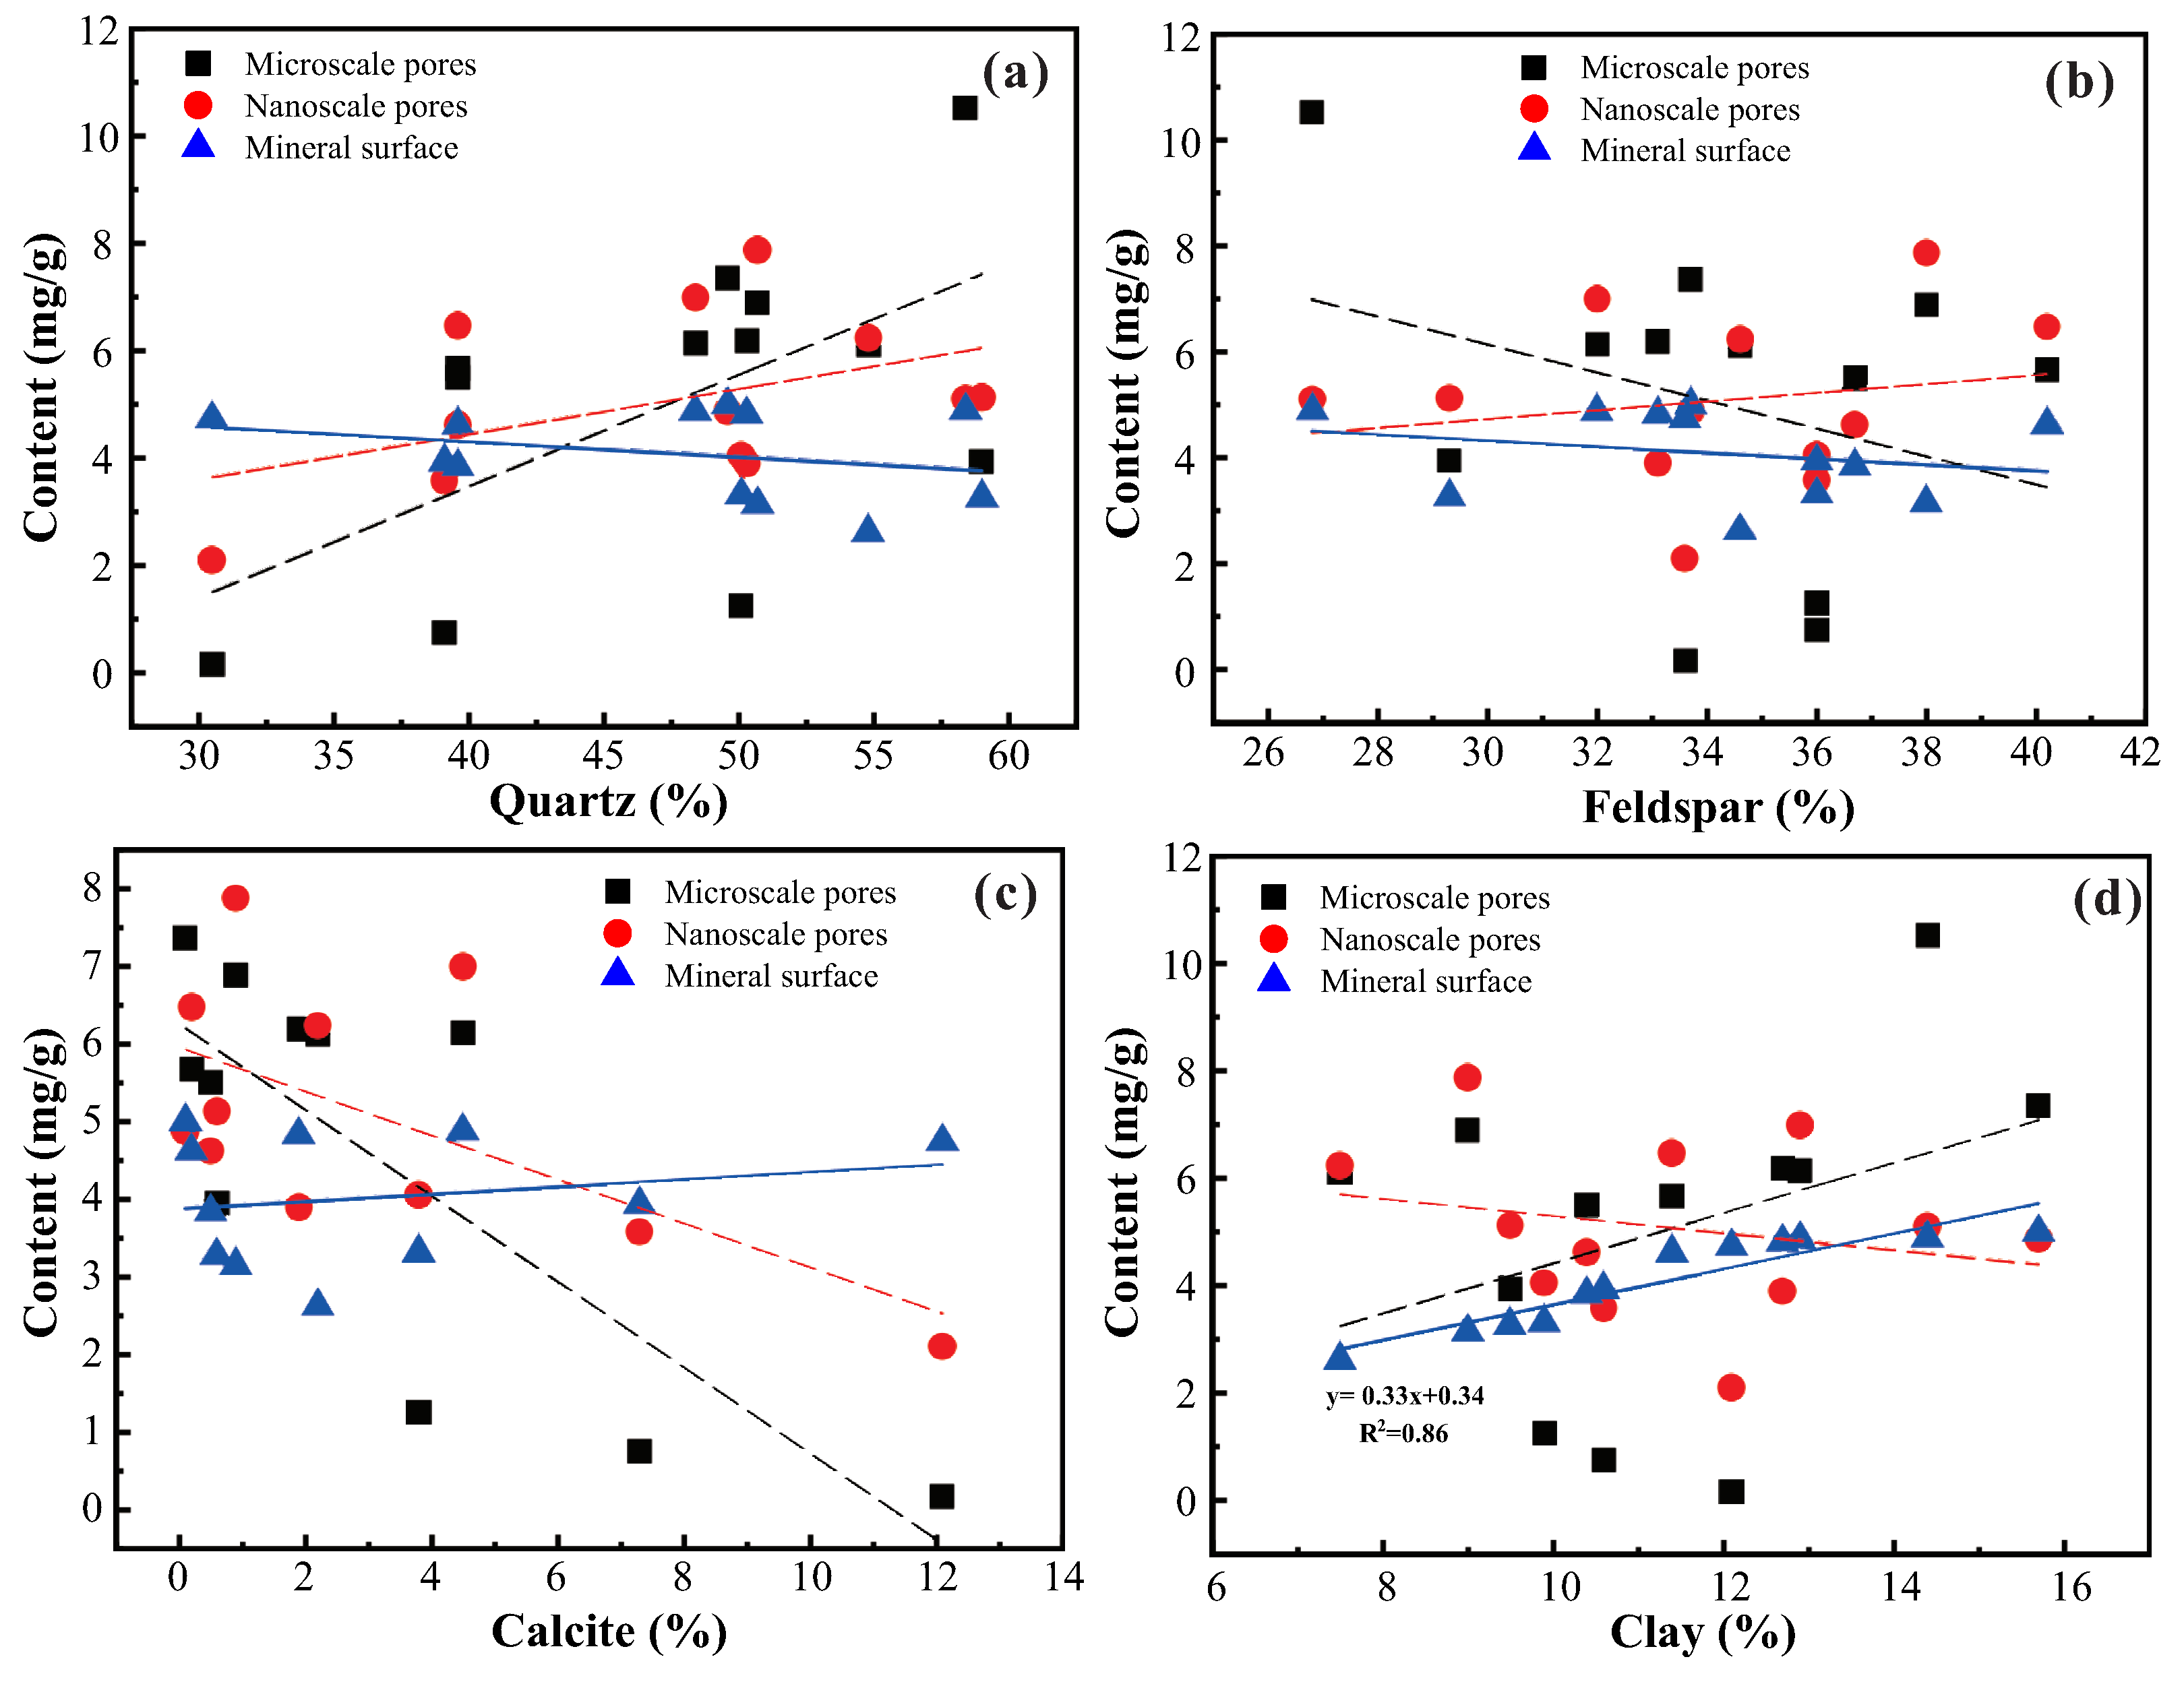
  • 3. Mineral composition: Minerals serve as the foundation for various reservoir spaces, and intricate oil–rock interactions are crucial to the formation of tight oil in sandstones [31,39,48,49,50]. Through the examination and analysis of core samples and thin sections (TSs), it was determined that the Chang 8 Member of the Yanchang Formation in the Ordos Basin predominantly consisted of black/dark gray fine/medium debris/feldspar and fine feldspar/debris sandstones. The results are presented in Table 1.
    The relationship between the content of tight oil in sandstones and different minerals is illustrated in Figure 11. The higher the quartz and clay contents, the greater the amount of tight oil stored in microscale pores. Conversely, higher feldspar and calcite contents result in less tight oil being stored in microscale pores. This phenomenon is related to the preservation mechanisms of different minerals in microscale pores within the reservoir during diagenesis. Quartz is an essential framework mineral in tight sandstone reservoirs, exhibiting strong resistance to compaction. This characteristic is conducive to the preservation of residual microscale pores during compaction. As the quartz content increases, so does the corresponding amount of tight oil stored in the microscale pores (Figure 11a). Calcite, which is primarily distributed in residual intergranular pores as microcrystals, is the main factor causing pore and throat reduction in tight sandstones, particularly in microscale pores [51]. Thus, as the calcite content increases, microscale pores significantly decrease, along with the corresponding amount of tight oil (Figure 11c). The development of clay minerals, especially chlorite, can enhance a reservoir’s resistance to compaction, thus promoting the preservation of residual intergranular pores. The higher the clay mineral content, the more favorable the conditions for the distribution of tight oil in microscale pores (Figure 11d).
    Furthermore, the content of tight oil stored in nanoscale pores exhibited a specific positive correlation with the quartz and feldspar content, while a negative correlation existed with calcite and clay content. This outcome may be associated with the pore–throat connectivity and the development of nanoscale pores in reservoirs. On the one hand, as the quartz content increases, the resistance of a reservoir to compaction becomes stronger, and the enhanced pore–throat connectivity is beneficial for crude oil to be charged into nanoscale pores. On the other hand, a higher feldspar content indicates that more dissolved pores are developed in the feldspar grains, which is conducive to the corresponding tight oil existing in nanoscale pores (Figure 11b). In contrast, as the content of calcite and clay increased, the tight oil stored in nanoscale pores noticeably decreased. This observation was related to the fact that calcite and clay occupied a significant amount of pore space in the reservoir and weakened the fluidity of tight oil, making it challenging for tight oil to enter the nanoscale pores [29].
    The content of tight oil present on the mineral surface exhibited a strong positive correlation with clay minerals ( R 2 = 0.86 ) but a weak relationship with minerals such as quartz, feldspar, and calcite. These results demonstrate that the primary factor influencing the occurrence of tight oil on mineral surfaces was clay minerals. Due to their large specific surface area and inherent mineral properties, clay minerals possess excellent adsorption capabilities for tight oil [52]. Consequently, clay minerals play a crucial role in determining the distribution of tight oil present on mineral surfaces [30,39].
    Based on this analysis, it can be concluded that the influence of authigenic minerals on the occurrence of tight oil in reservoir spaces manifested through multiple effects, which can be described as follows: (1) Authigenic minerals—particularly clay minerals—increase the specific surface area of pores and throats, which facilitates the adsorption of tight oil onto mineral surfaces, thereby forming a substantial amount of tight oil in the thin film form; (2) the growth of authigenic minerals generates numerous intercrystalline pores within clay minerals, providing storage space for the enrichment of tight oil in isolated forms within nanoscale pores; (3) the growth of authigenic minerals, such as calcite, significantly alters the reservoir’s pore structure and the seepage patterns of tight oil within the pores, resulting in a heterogeneous distribution of tight oil in the reservoir.

4.3. The Micro-Occurrence Process of Tight Oil

4.3.1. The Oil Components

The micro-occurrence of tight oil in sandstones typically represents a complex aggregate of various crude oil components. In the microscale pores, the tight oil contained 79.36% saturated hydrocarbons, 12.72% aromatics, 7.45% nonhydrocarbons, and 0.47% asphaltenes (Figure S1a). In the nanoscale pores, tight oil consisted of 79.37% saturated hydrocarbons, 12.88% aromatics, 6.69% nonhydrocarbons, and 1.06% asphaltenes (Figure S1b). Comparing the oil components extracted from the microscale and nanoscale pores revealed no significant differences between the two extracts. However, for tight oil occurring on particle surfaces, the contents of saturated hydrocarbons, aromatics, nonhydrocarbons, and asphaltenes were 17.43%, 13.35%, 44.47%, and 24.75%, respectively Figure S1c. The polar components—particularly nonhydrocarbons and asphaltenes—exhibited a substantial increase in content, which was especially the case for nonhydrocarbon components.
During the oil–rock interaction process, nonhydrocarbon compounds containing heteroatoms, such as O, N, and S, are more likely to be adsorbed on mineral surfaces. This phenomenon may be attributed to the heteroatom functional groups, which include O, N, and S atoms; these enhance electrostatic interactions, increase van der Waals interaction energies, and improve the adsorption capacity of crude oil [53]. The accumulation of asphaltenes on mineral surfaces may be related to the properties of the minerals constituting the sandstone reservoir. The primary components of tight sandstone reservoirs are detrital particles and cement, with most of their mineral constituents being quartz, carbonate, silicate, and aluminosilicate minerals, all of which exhibit a strong polarity. As crude oil flows through the reservoir, asphaltenes with high polarity are adsorbed onto the mineral surfaces through intermolecular forces. In contrast, nonpolar or weakly polar compounds, such as saturated and aromatic hydrocarbons, demonstrate less adsorption on mineral surfaces.
Figures S2–S4 present relative plots of the proportions of microscale pores, nanoscale pores, and tight oil present on mineral surfaces with saturated hydrocarbons, aromatics, nonhydrocarbons, and asphaltenes in the extracts, which can aid in investigating oil component differentiation in sandstones. As shown in Figure S2, the contents of saturated hydrocarbons and aromatics exhibited a positive correlation with the content of tight oil in microscale pores, with correlation coefficients of 0.4956 and 0.4865, respectively. Conversely, the contents of nonhydrocarbons and asphaltenes demonstrated a negative correlation with the content of tight oil in microscale pores, with correlation coefficients of 0.5269 and 0.5748, respectively. These results indicate that the tight oil stored in microscale pores had characteristics of light oil (high saturated hydrocarbon content and light components), which also explained why the tight oil morphology in microscale pores was more influenced by reservoir spaces. In the case of tight oil stored in nanoscale pores (Figure S3), none of the oil components exhibited a visible relationship with the content of tight oil. Only the nonhydrocarbon content displayed a positive relationship with the content of tight oil, suggesting that nonhydrocarbons may preferentially accumulate in nanoscale pores.
In contrast, aromatics, nonhydrocarbons, and asphaltenes exhibited a positive relationship with the content of tight oil that existed on mineral surfaces, with correlation coefficients of 0.5015, 0.4462, and 0.5247, respectively (Figure S4). Only saturated hydrocarbons displayed a negative correlation coefficient of 0.6899. This indicated that heavy components were enriched on mineral surfaces, leading to lighter oil components stored in pores. This phenomenon demonstrated that oil–rock interactions were the fundamental cause of crude oil component differentiation in the sandstones.

4.3.2. The Carbon Composition

During the hydrocarbon filling process, the interaction between minerals and crude oil not only leads to significant differentiation of oil components, but also causes considerable changes in some components of saturated hydrocarbons during oil–rock interactions [19]. Table S2 presents the carbon compositions of extracts stored in sandstones. The carbon composition of oil stored in microscale and nanoscale pores was primarily distributed in the C9∼C34 compounds, with the main peak being found in C19 and C20. As depicted in Table S2, the tight oil stored in nanoscale pores had a higher carbon fraction than that distributed in microscale pores. There were more C20∼C34 compounds in the nanoscale pores (41.55 wt%) than in the microscale pores of tight oil (31.96 wt%). This suggested that the <C20 mixtures of saturated hydrocarbons tended to aggregate in nanoscale pores. This phenomenon may be related to smaller molecules (<C20 compounds) being adsorbed or entering nanoscale pores under the influence of the filling pressure [54].
In contrast, the carbon composition of the oil adsorbed on mineral surfaces was primarily distributed in the C9∼C30 compounds, with the central peak being located at C23. The carbon fractions of tight oil adsorbed on mineral surfaces were lighter than those occurring in microscale pores, resulting in a higher percentage of <C17 compounds compared to that of the tight oil in microscale pores. This finding suggests that lighter carbon compounds in tight oil play a decisive role in their aggregation within sandstones. It can be concluded that lighter carbon compounds, particularly <C17 compounds, are easily separated from tight oil and adsorbed onto sandstone surfaces during the hydrocarbon filling process. Furthermore, it was observed that in nanoscale pores and on mineral surfaces, heavy compounds were found at higher concentrations, while lighter carbon compounds were separated from crude oil. This observation implies that the process of occurrence of tight oil in sandstones is, in fact, a process of interaction between minerals and crude oil.

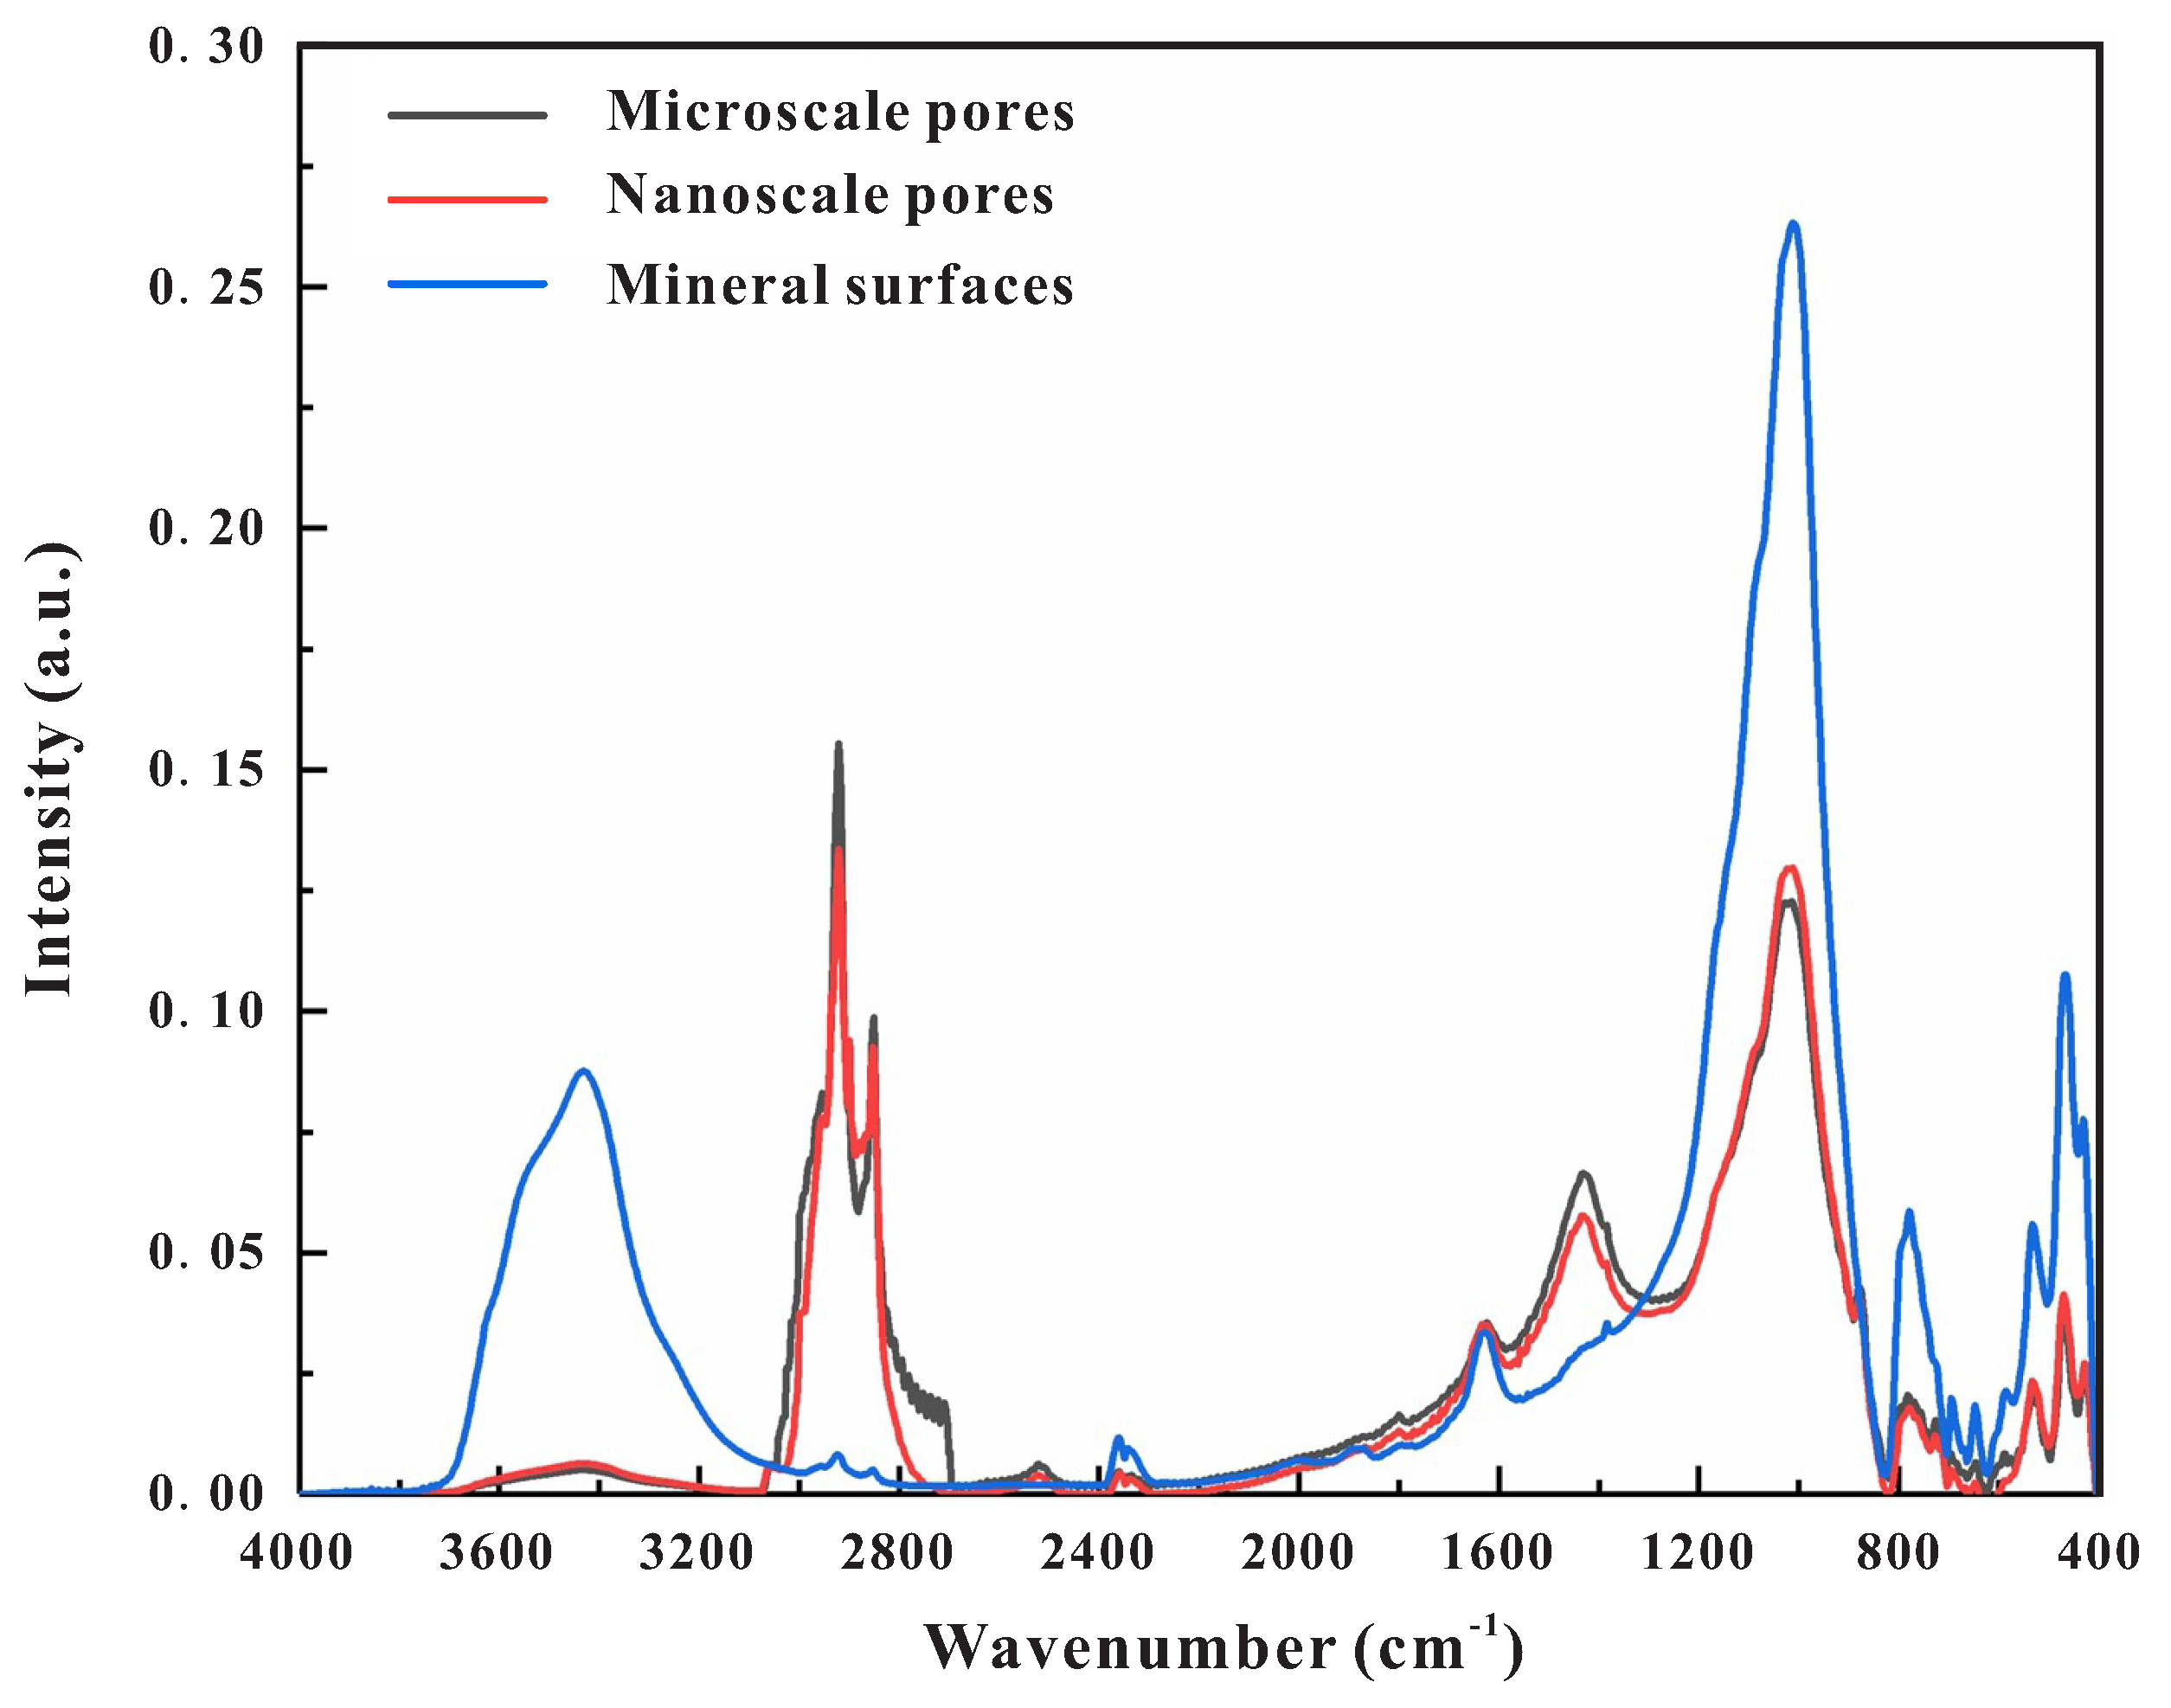
4.3.3. The Functional Groups

While oil component and GC/MS analyses provided valuable insights into the characteristics of sandstones, they do not offer information about the functional groups of tight oil, which are crucial for understanding its micro-occurrence mechanism. To address this issue, Fourier-transform infrared spectroscopy (FTIR) was employed to measure and analyze the tight oil stored in microscale pores, nanoscale pores, and adsorbed on mineral surfaces. To facilitate a more effective comparison of these extracts, normalized FTIR spectra are presented in Figure 12, and all of the functional group peaks are summarized in Table S3. In addition to the functional groups, several parameters could be derived from the FTIR results, which could help elucidate the micro-occurrence process and underlying mechanisms.
In the FTIR spectrum, the range of 2500∼3700 cm−1 corresponds to the hydrogen-stretching zone. The 2000∼2300 cm−1 and 1600∼2000 cm−1 ranges represent the triple- and double-bond-stretching regions, respectively. The 1000∼1600 cm−1 range constitutes the fingerprint region, wherein single bonds, C-H bending bonds, and some benzene ring bonds are located. Lastly, the 400∼1000 cm−1 range is associated with the aromatic region [19,55]. As illustrated in Figure 12, all three extracts exhibited almost identical peaks, albeit with varying heights.
The peak located at 3436 cm−1 was associated with the O-H or N-H stretching bond, and this region represented the most polar bonds in the crude oil due to the electronegativity difference between oxygen and hydrogen atoms [19,56,57]. The corresponding peak of the O-H or N-H stretching bond was also prominent and broad within the range of 3200∼3800 cm−1. Moreover, the variations in peak intensity and width in this region of the FTIR spectrum could provide information regarding the polarization of crude oil occurring in sandstones. The following sequence illustrates the intensity of the O-H or N-H stretching bonds in sandstones, where I represents the peak intensity [19]:
I m i n e r a l s u r f a c e > I n a n o s c a l e p o r e s > I m i c r o s c a l e p o r e s
This result indicates that the polarities of tight oil stored in sandstones are different and demonstrates that polarity is an essential factor controlling the differentiation of crude oil in reservoir spaces during oil–rock interactions. Tight sandstone reservoirs are formed in sedimentary and diagenetic environments containing significant amounts of formation water; therefore, the mineral surface contains numerous hydroxyl groups [58]. Moreover, the O-H stretching band in the molecular structure of crude oil can enable the formation of hydrogen bonds with adjacent oil molecules, leading to the aggregation of crude oil [54]. As such, hydrogen bonding is also a crucial factor affecting the differences in the micro-occurrence states of tight oil. A sample with higher O-H stretching bond intensity does not necessarily possess a greater ability to form hydrogen bonds. Furthermore, the peak intensity of the O-H stretching bond alone cannot describe the intermolecular hydrogen bonding strength. An index called RN−H or RO−H can be calculated by using the following equation [19]:
R N H or O H = I 3436 I 3053
In this equation, I3436 and I3053 represent the peak intensities of the O-H stretching bond and C-H stretching vibration, respectively. The RN−H or RO−H index represents the hydrogen bonding ability between molecules. For samples with a higher index, there is a stronger potential ability to bind surrounding molecules through hydrogen bonding. This index was calculated for the three extracts presented in this study, and the results are shown in Table 2. The tight oil that occurred on mineral surfaces exhibited a greater potential for hydrogen interaction. This finding suggests that this portion of the tight oil is more prone to interact with minerals to form an adsorption layer.
The peaks ranging from 2800 to 3000 cm−1 were associated with the CH2 and CH3 functional groups of the corresponding aliphatic hydrocarbons. As depicted in Figure 12, the peak of the C-H stretch band was poorly observed, which may be related to the carboxylic acid functional group and groups containing polar bands [19]. By comparing the peak intensities of the three extracts in this region, the oil stored in the microscale pores exhibited the highest intensity. This phenomenon indicates that the oil stored in microscale pores contained the highest aliphatic hydrocarbon content. This observation also explains why the tight oils in micropores possessed better fluidity. By measuring the absorption intensity of a fixed group at different wavelengths, the ratio of the intensities could be used to evaluate the degree of branching of the aliphatic compound in the extracts. Through analysis, Wang et al. [59] found that the absorption peaks of CH2 and CH3, which are anti-symmetric stretching vibrations, are more reliable. Consequently, the aliphatic branching index (ABI) can be defined as follows:
ABI = I 2954 I 2851
I2954 and I2851 represent the peak intensities corresponding to the CH3 and CH2 asymmetrical stretching bonds, respectively. This index was calculated for the three extracts, and the results are presented in Table 2. The values of the aliphatic branching indices for the three extracts are as follows:
ABI m i n e r a l s u r f a c e > ABI n a n o s c a l e p o r e s > ABI m i c r o s c a l e p o r e s
The results indicate that aliphatic compounds with a higher degree of branching are more likely to adsorb onto mineral surfaces. In contrast, aliphatic compounds with a lower degree of branching exhibit a greater ease of flow.
In the spectral region of 2500∼2600 cm−1, S-H polar functional groups could be observed, particularly in the extracts of the tight oil stored in microscale and nanoscale pores. The intensity of the S-H group occurring on the mineral surface was lower than that within the pores. This phenomenon was attributed to the fact that sulfur atoms in crude oil molecules significantly increase the binding capacity between crude oil and minerals [53]. Consequently, sulfur is an essential element that warrants further attention in the study of the molecular structure of crude oil.
In the samples, the extracts exhibited a distinct C=O peak at 1694 cm−1, which fell within the range of 1680∼1710 cm−1. This observation suggests that the aromatic ring structure was connected to the unsaturated bond, ultimately forming an aromatic acid with a double bond with oxygen. In the three extracts, the C=O peaks at 1694 cm−1 exhibited the same intensity, indicating the uniformity of their aromatic state. This finding is consistent with the results obtained from the oil composition analysis.
The peak situated at 1622 cm−1 was associated with the C=C aromatic stretching bond, which served as the primary indicator of aromatic compounds [19]. The intensities of the peaks at 1622 cm−1 were determined by the vibrations of hydrogens adjacent to an aromatic ring. Figure 12 displays the following sequence of 1622 cm−1 peak intensities for the three extracts:
I m i n e r a l s u r f a c e > I n a n o s c a l e p o r e s I m i c r o s c a l e p o r e s
These results indicated that the C=C functional group adjacent to the aromatic compounds might be easily adsorbed onto mineral surfaces.
The region between 675 and 900 cm−1 was associated with the out-of-plane vibrations of the C-H bond outside the benzene ring [6]. The C-H bond connected to the aromatic rings could replace the hydrogen bond in an adjacent position. As hydrogen was replaced by another aromatic structure, the aromatic molecules were no longer in a mono-state, but rather bound together with other aromatic ring structures. When the structure of the molecules consisted of more than one aromatic ring, it was called a polynuclear aromatic ring [19]. Based on the location differences of polynuclear aromatic ring peaks (Table S4), they could be divided into the di-, tri-, and tetra- types, with the structure depending on the number of attached aromatic rings. Table S4 displays the peaks of the FTIR spectrum of tight oil stored in sandstones, ranging between 675 and 900 cm−1. Combining Tables S4 and Table 3 provides valuable information about the polynuclear aromatic rings. Consequently, the FTIR spectrum revealed that the extracts from the microscale and nanoscale pores were similar to one of the structures, d i ( 1 , 3 ) , and they were likely predominantly composed of structures with two aromatic rings per molecule. In contrast, the extracts from the mineral surfaces resembled one of the structures, t r i ( 1 , 2 , 3 ) , and they were likely predominantly composed of structures with three aromatic rings per molecule. The results demonstrated that as the molecular weight and hydrophobicity of polynuclear aromatic rings increased, they were more likely to be adsorbed onto mineral surfaces.
The peak at 1315 cm−1 was associated with the presence of carboxylate bonds in carboxylic acids [12,19]. As illustrated in Figure 12, the extracts of tight oil stored in the microscale and nanoscale pores exhibited a higher carboxyl content compared to that of the extracts adsorbed on mineral surfaces. This phenomenon suggests that after the initial adsorption of crude oil onto mineral surfaces, there may be a continuous influx of carboxylic acid fluids in later stages [27]. However, the presence of the initially adsorbed oil weakened the dissolution process, leaving microscale and nanoscale pores with carboxyl groups. Furthermore, due to the crude oil molecules being connected with the carboxyl functional group, it was easier for other crude oil molecules and minerals to adsorb onto the mineral surface in the form of hydrogen bonds or to form self-aggregates of crude oil, which were stored in the available storage space. This process led to a reduction in carboxyl groups in the adsorbed oil.
Bands near 1020 cm−1 were associated with the stretching of sulfoxide groups. The presence of these groups in extracts could be attributed to the oxidation of crude oil during the oil and gas filling periods [12,19]. Oxidation typically results in the incorporation of compounds with oxygen-containing functional groups into the crude oil structure [12,60]. The three extracts in this region exhibited high intensities, indicating that they contained higher concentrations of sulfoxide compounds. The intensities of these extracts stored in sandstones are presented in the following order:
I m i n e r a l s u r f a c e > I n a n o s c a l e p o r e s > I m i c r o s c a l e p o r e s
To compare and analyze the subfractions of the tight oils that existed in these sandstones, three indices were defined as follows [55]:
(1) Aromatic index (AI):
AI = I 1622 I 878 + I 826 + I 742 + I 713
(2) Aliphatic index (ALI):
ALI = I 1431 + I 1377 I 1694 + I 1622 + I 1431 + I 1377 + I 1027 + I 878 + I 826 + I 742 + I 713 + I 2954 + I 2921 + I 2851
(3) Long-chain index (LCI):
LCI = I 742 I 1431 + I 1377
In the FTIR spectrum, I represents the peak intensities, and the subscript number denotes the corresponding wavelength to the peak. The aromatic index encompasses all aromatic entities of the extracts, while the aliphatic index represents the straight-chain saturated or branched alkane compounds in the molecular structure [12,19]. Furthermore, the long-chain index indicates the length of branched alkane compounds within the oil molecular structure or those attached to the aromatic rings.
As displayed in Table 3, the tight oil stored in microscale pores exhibited the highest content of aliphatic compounds, while the tight oil in nanoscale pores had the highest aromaticity. However, the tight oil adsorbed on the mineral surface possessed the longest length of branched alkane compounds and the lowest content of aliphatic compounds and aromaticity. These results are consistent with the step-by-step extraction of tight oil and the adsorption simulation of crude oil reported in previous studies [19,21,24]. This evidence suggests that the differences in composition within sandstones during the micro-occurrence of tight oil in tight reservoirs are indeed a result of oil–rock interactions.
Based on the results of the content analysis of alkyl, aryl, and heteroatom groups in the extracts of tight oil within sandstones (Figure S5), the extracts from microscale pores and nanoscale pores were primarily composed of alkyl and aryl groups. In contrast, the extracts from mineral surfaces were dominated by heteroatom groups, with their content reaching up to 68%. This observation suggests that during the micro-occurrence of tight oil, polar macromolecules rich in heteroatom groups, such as non-hydrocarbons and asphaltenes, are adsorbed onto mineral surfaces due to intermolecular interactions. This process results in the differentiation of tight oil components, promoting the presence of light fractions (saturated hydrocarbons and aromatics) in microscale pores and nanoscale pores.

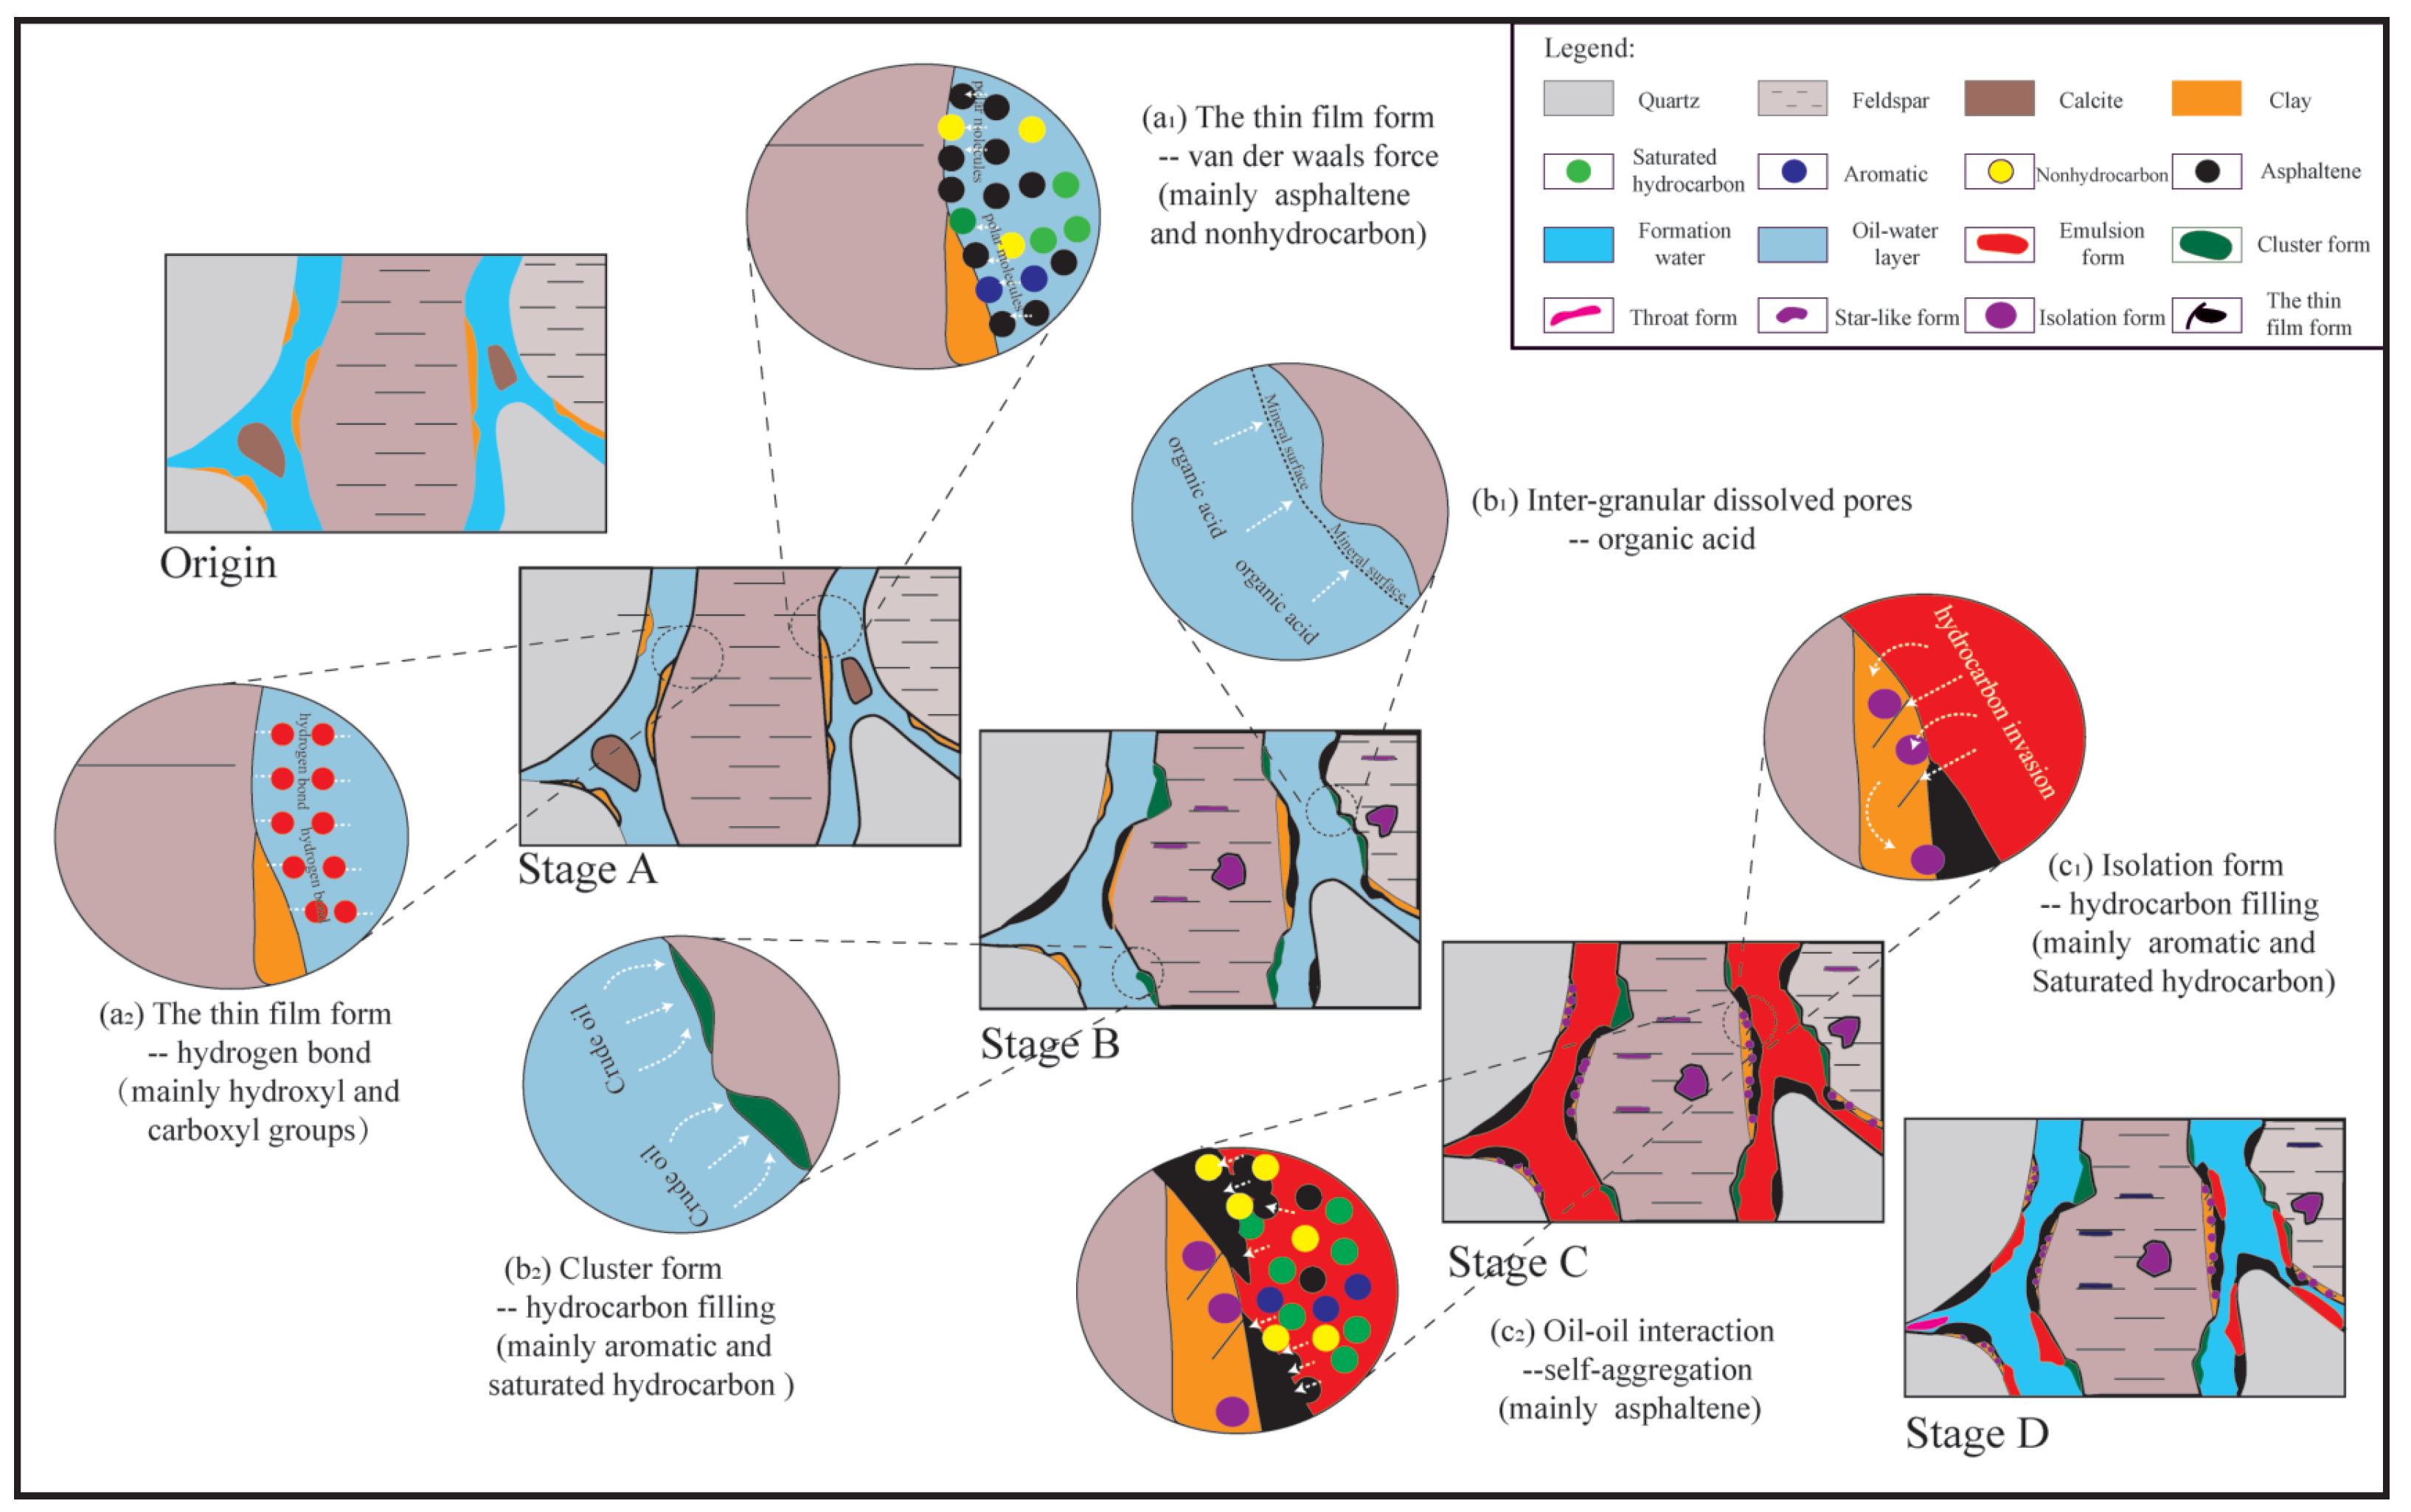
4.4. The Micro-Occurrence Mechanism of Tight Oil

In order to comprehensively consider the locations of various occurrence states, oil components, and the process of interaction between minerals and crude oil, it was determined that tight oil in states such as the emulsion form and throat form was primarily achieved through the interaction of charged dense oil and minerals. After reaching saturation, the remaining tight oil was predominantly stored in microscale pores and controlled by pore morphology. The cluster form and star-like form may have been formed after the formation of dissolved pores. Simultaneously, the roughness of feldspar minerals increased after dissolution, promoting the adsorption of crude oil onto the feldspar mineral surface. The isolation form was primarily formed in the intercrystalline pores of clay minerals under a specific pressure difference during the mass expulsion of hydrocarbons. The thin film form was primarily developed through oil–rock interactions as hydrocarbons were injected, continuing until saturation was reached.
By integrating the distribution, content, composition characteristics, carbon number changes, and FTIR characteristics of tight oils with different micro-occurrence states, this study preliminarily established a micro-occurrence mechanism model for sandstones (Figure 13). The micro-occurrence mechanism can be summarized as follows.
Origin stage: Following an extended period of sedimentary and diagenetic processes, a reservoir space framework was established. At this stage, the predominant pore types were mainly intergranular pores with improved pore–throat connectivity, which was accompanied by the development of new authigenic minerals, such as early calcite and clay minerals. During this phase, formation water occupied the entire reservoir.
Stage A: As hydrocarbons were charged into the reservoir, crude oil and minerals came into direct contact, leading to oil–rock interactions that formed a thin film of tight oil on the mineral surface. During this stage, due to the inherent polarity of the minerals constituting the reservoir, polar substances in the crude oil, such as nonhydrocarbons and asphaltenes, could be adsorbed onto the mineral surface via van der Waals forces (Figure 13(a1)). Simultaneously, in the presence of formation water, the hydroxyl or carboxyl groups of oxygen-containing functional groups in crude oil could be adsorbed through hydrogen bonding with the mineral surface, which was rich in hydroxyl groups (Figure 13(a2)). Moreover, aliphatic hydrocarbons with long chains and highly branched portions, the <C17 compounds of saturated hydrocarbons, and polynuclear aromatic rings with the structure of t r i ( 1 , 2 , 3 ) could also be adsorbed onto mineral surfaces, albeit in smaller quantities. Oil–rock interactions were the fundamental drivers of the differentiation of crude oil components. The adsorption of polar macromolecules and oxygen-containing functional groups resulted in the remaining crude oil having a relatively higher proportion of light components, which increased the fluidity of crude oil and facilitated further migration within the sandstones.
Stage B: During the hydrocarbon filling process, a substantial amount of organic acids could be supplied. The intrusion of these organic acids could dissolve early calcite and feldspar minerals, forming secondary dissolution pores, with the early calcite being completely dissolved. These dissolution pores were primarily at the microscale (Figure 13(b1)) and nanoscale (Figure 13(b2)) levels. As crude oil occupied these pores, cluster and star-like forms were created. The tight oil stored in these pores was characterized by a high proportion of saturated hydrocarbons and aromatics. When organic acids dissolved feldspar particles, they could alter the fundamental surface properties of the minerals, increasing roughness and specific surface area, which, in turn, facilitated mineral–crude oil interactions and promoted the adsorption and further aggregation of some heavy components at the edges of the dissolution pores. Consequently, as the heavy components were adsorbed onto the mineral surface, a greater amount of lighter components remained in the dissolution pores.
Stage C: As hydrocarbons continuously infiltrated the reservoir, oil occupied the pore space. During this process, due to formation pressure and the early differentiation of crude oil components, crude oil with higher saturated hydrocarbon and aromatic content could invade the intercrystalline pores (nanoscale) of clay minerals, forming the isolation form (Figure 13(c1)). In this stage, tight oil distributed within the continuous large pores in the reservoir existed in the form of a continuous oil phase, which was characterized by a high saturated hydrocarbon ratio, low aromatic content, few oxygen-containing functional groups, and high fluidity. Owing to the ample supply of crude oil at this stage and the saturation of oil–rock interactions, self-aggregation of crude oil may have occurred in the reservoir, particularly for macromolecular polar components, such as asphaltene flocculation and precipitation (Figure 13(c2)). This could be attributed to the concentration gradients between the mineral surface and crude oil, which affected the attraction of oil molecules. Asphaltenes can flocculate at concentrations of 8 wt% or higher [55]. Furthermore, asphaltene molecules tend to aggregate, significantly promoting the accumulation of asphaltenes and the differentiation of crude oil components [61].
Stage D: At the end of hydrocarbon filling, the intrusion of formation water in this stage disrupted the original micro-occurrence states of tight oil and led to the formation of the current micro-occurrence states. In this phase, tight oil, which was initially distributed in microscale pores within the continuous oil phase, was disrupted and gradually transformed into a discontinuous emulsion form and throat form in the residual intergranular pores and throats. During this stage, the differentiation of oil components caused by oil–rock interaction resulted in the formation of residual intergranular pores and tight oil present in the throat, which exhibited the highest saturated hydrocarbon content and the fewest oxygen-containing functional groups.

5. Conclusions

The micro-occurrence process of tight oil is a complex system involving minerals, intricate pore spaces, and pore fluid properties. A comprehensive study was conducted to elucidate the micro-occurrence mechanism of tight oil resulting from oil–rock interactions under the combined influence of rock physical properties and fluid components in the Chang 8 Member of the Yanchang Formation of the Upper Triassic in the Ordos Basin. Based on this work, the following conclusions were derived.
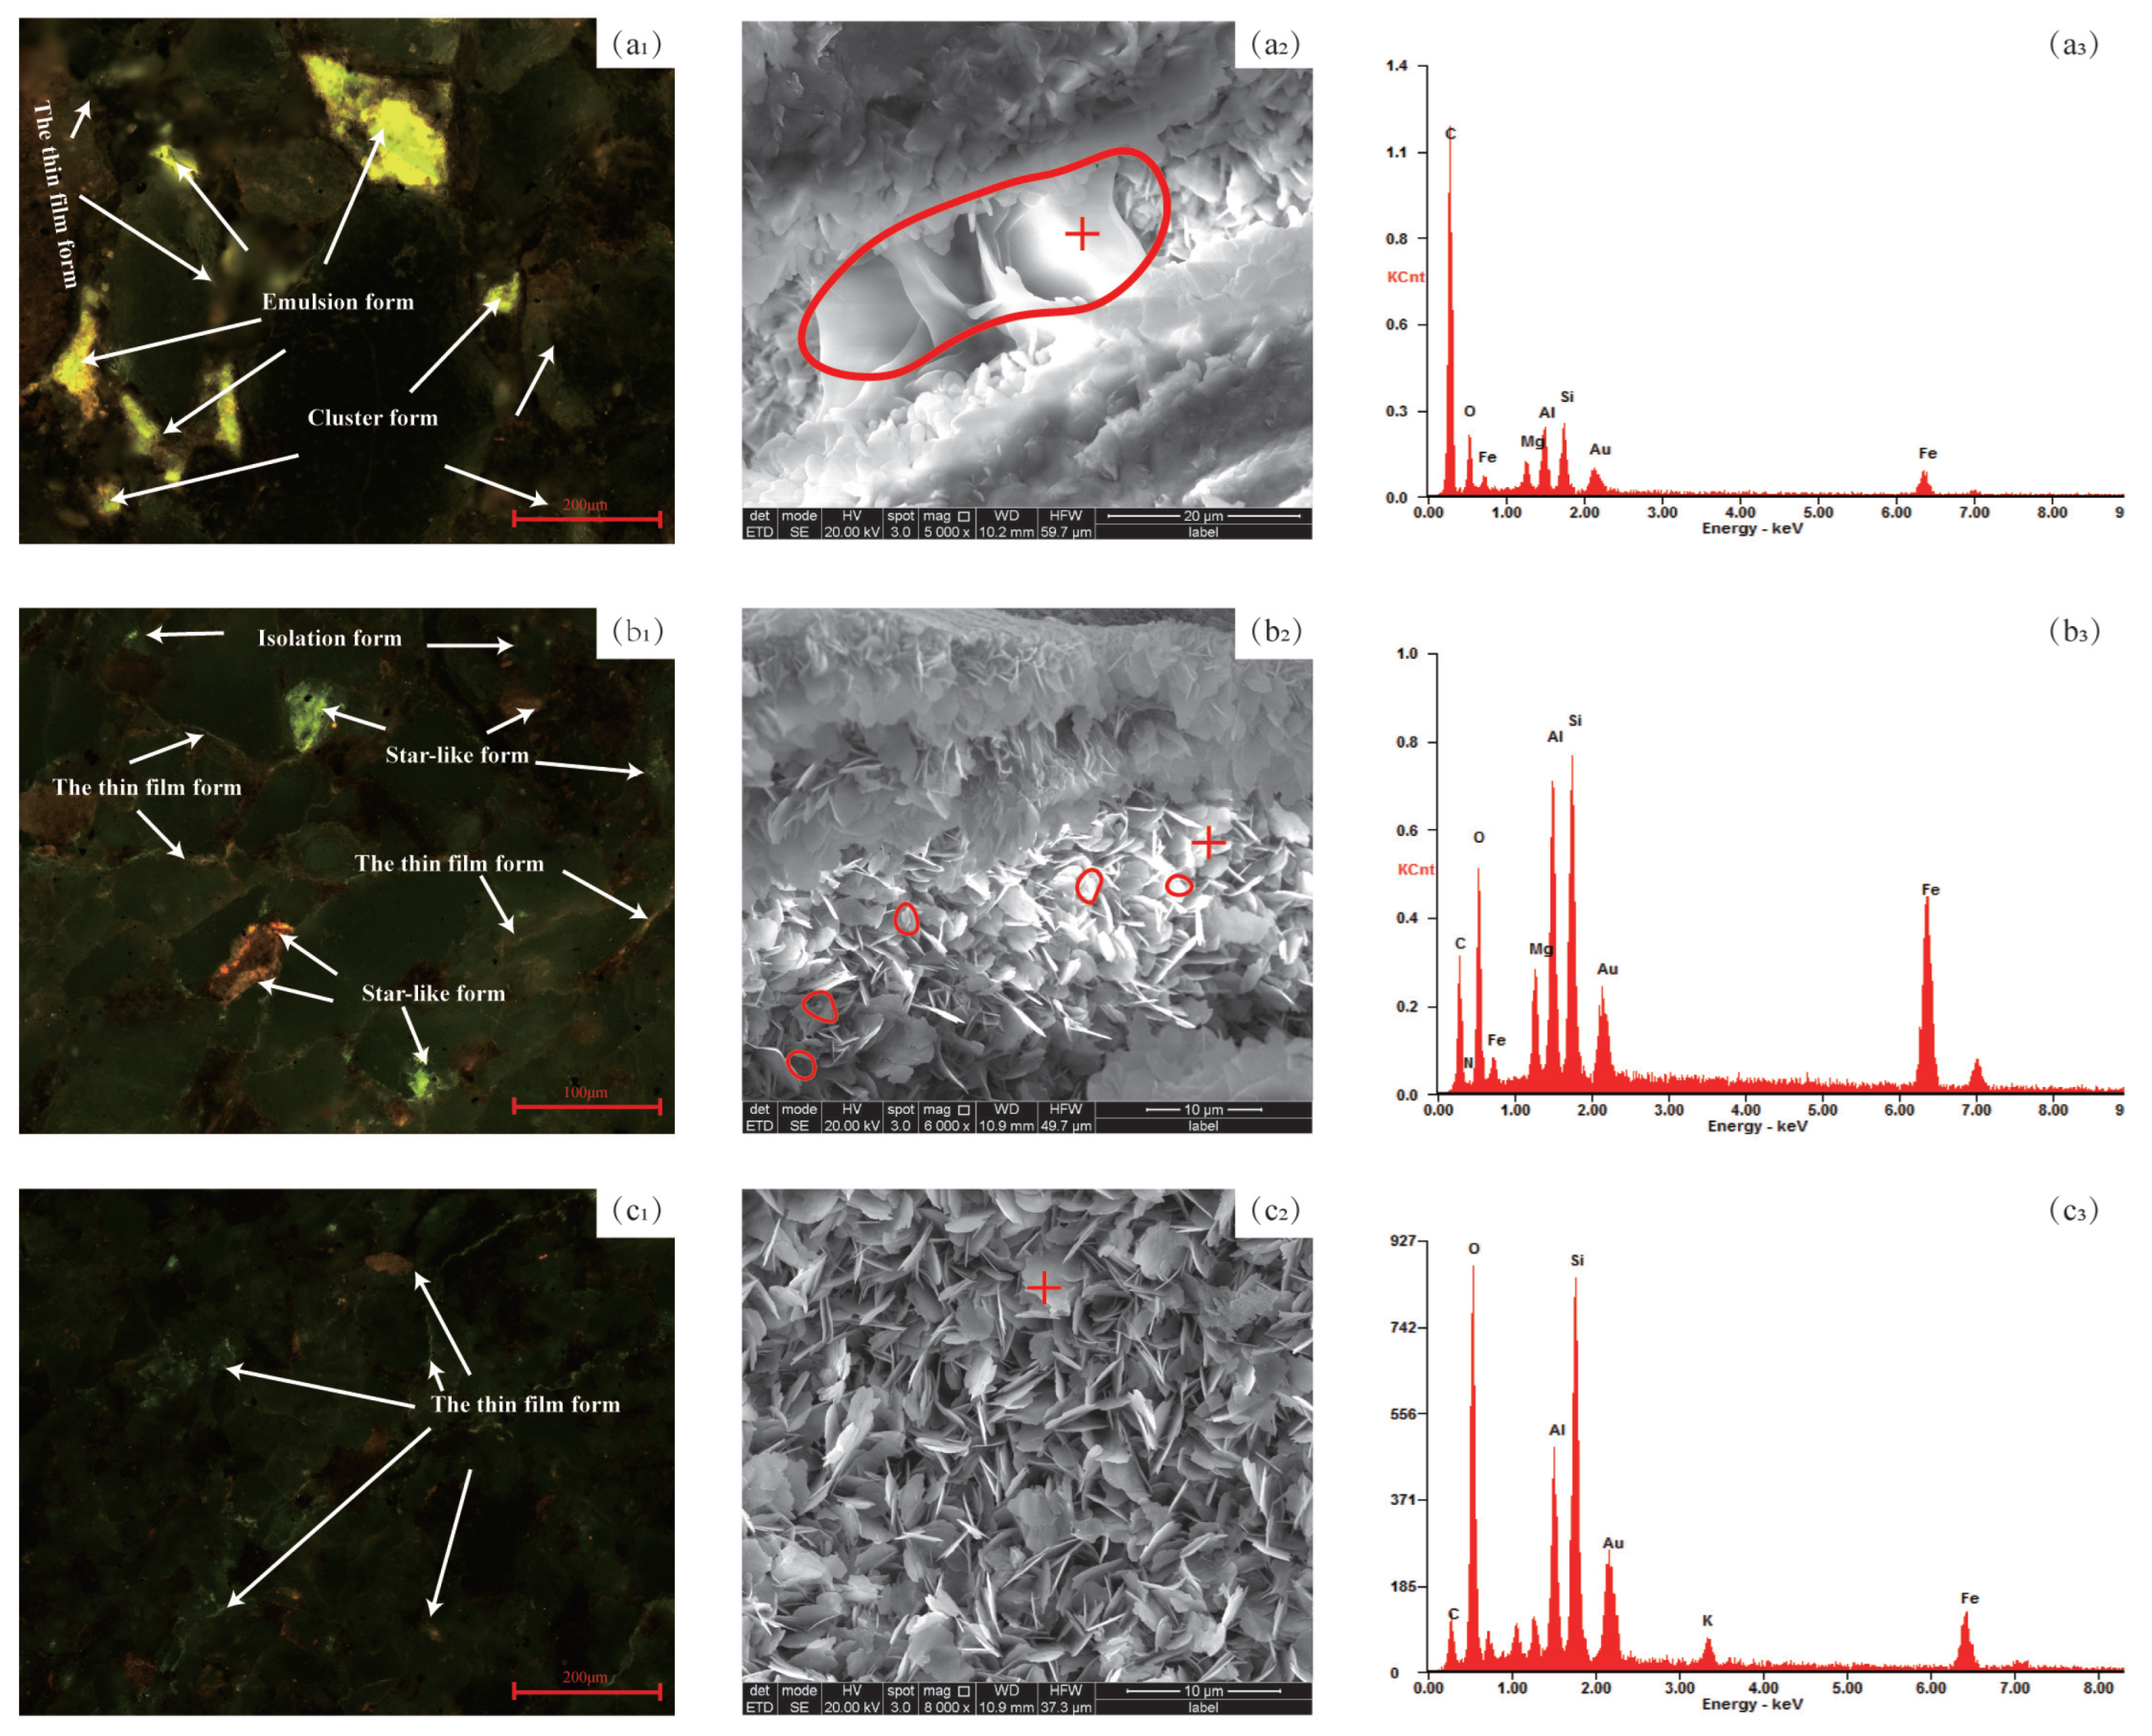
  • Based on the variations in micromorphology and the location of tight oil, the micro-occurrence states of tight oil weren classified into six types: the emulsion form, cluster form, throat form, star-like form, isolation form, and thin film form. The emulsion form, cluster form, and throat form were primarily developed in microscale pores, while the star-like form and isolation form were predominantly developed in nanoscale pores. The thin film form mainly existed on mineral surfaces.
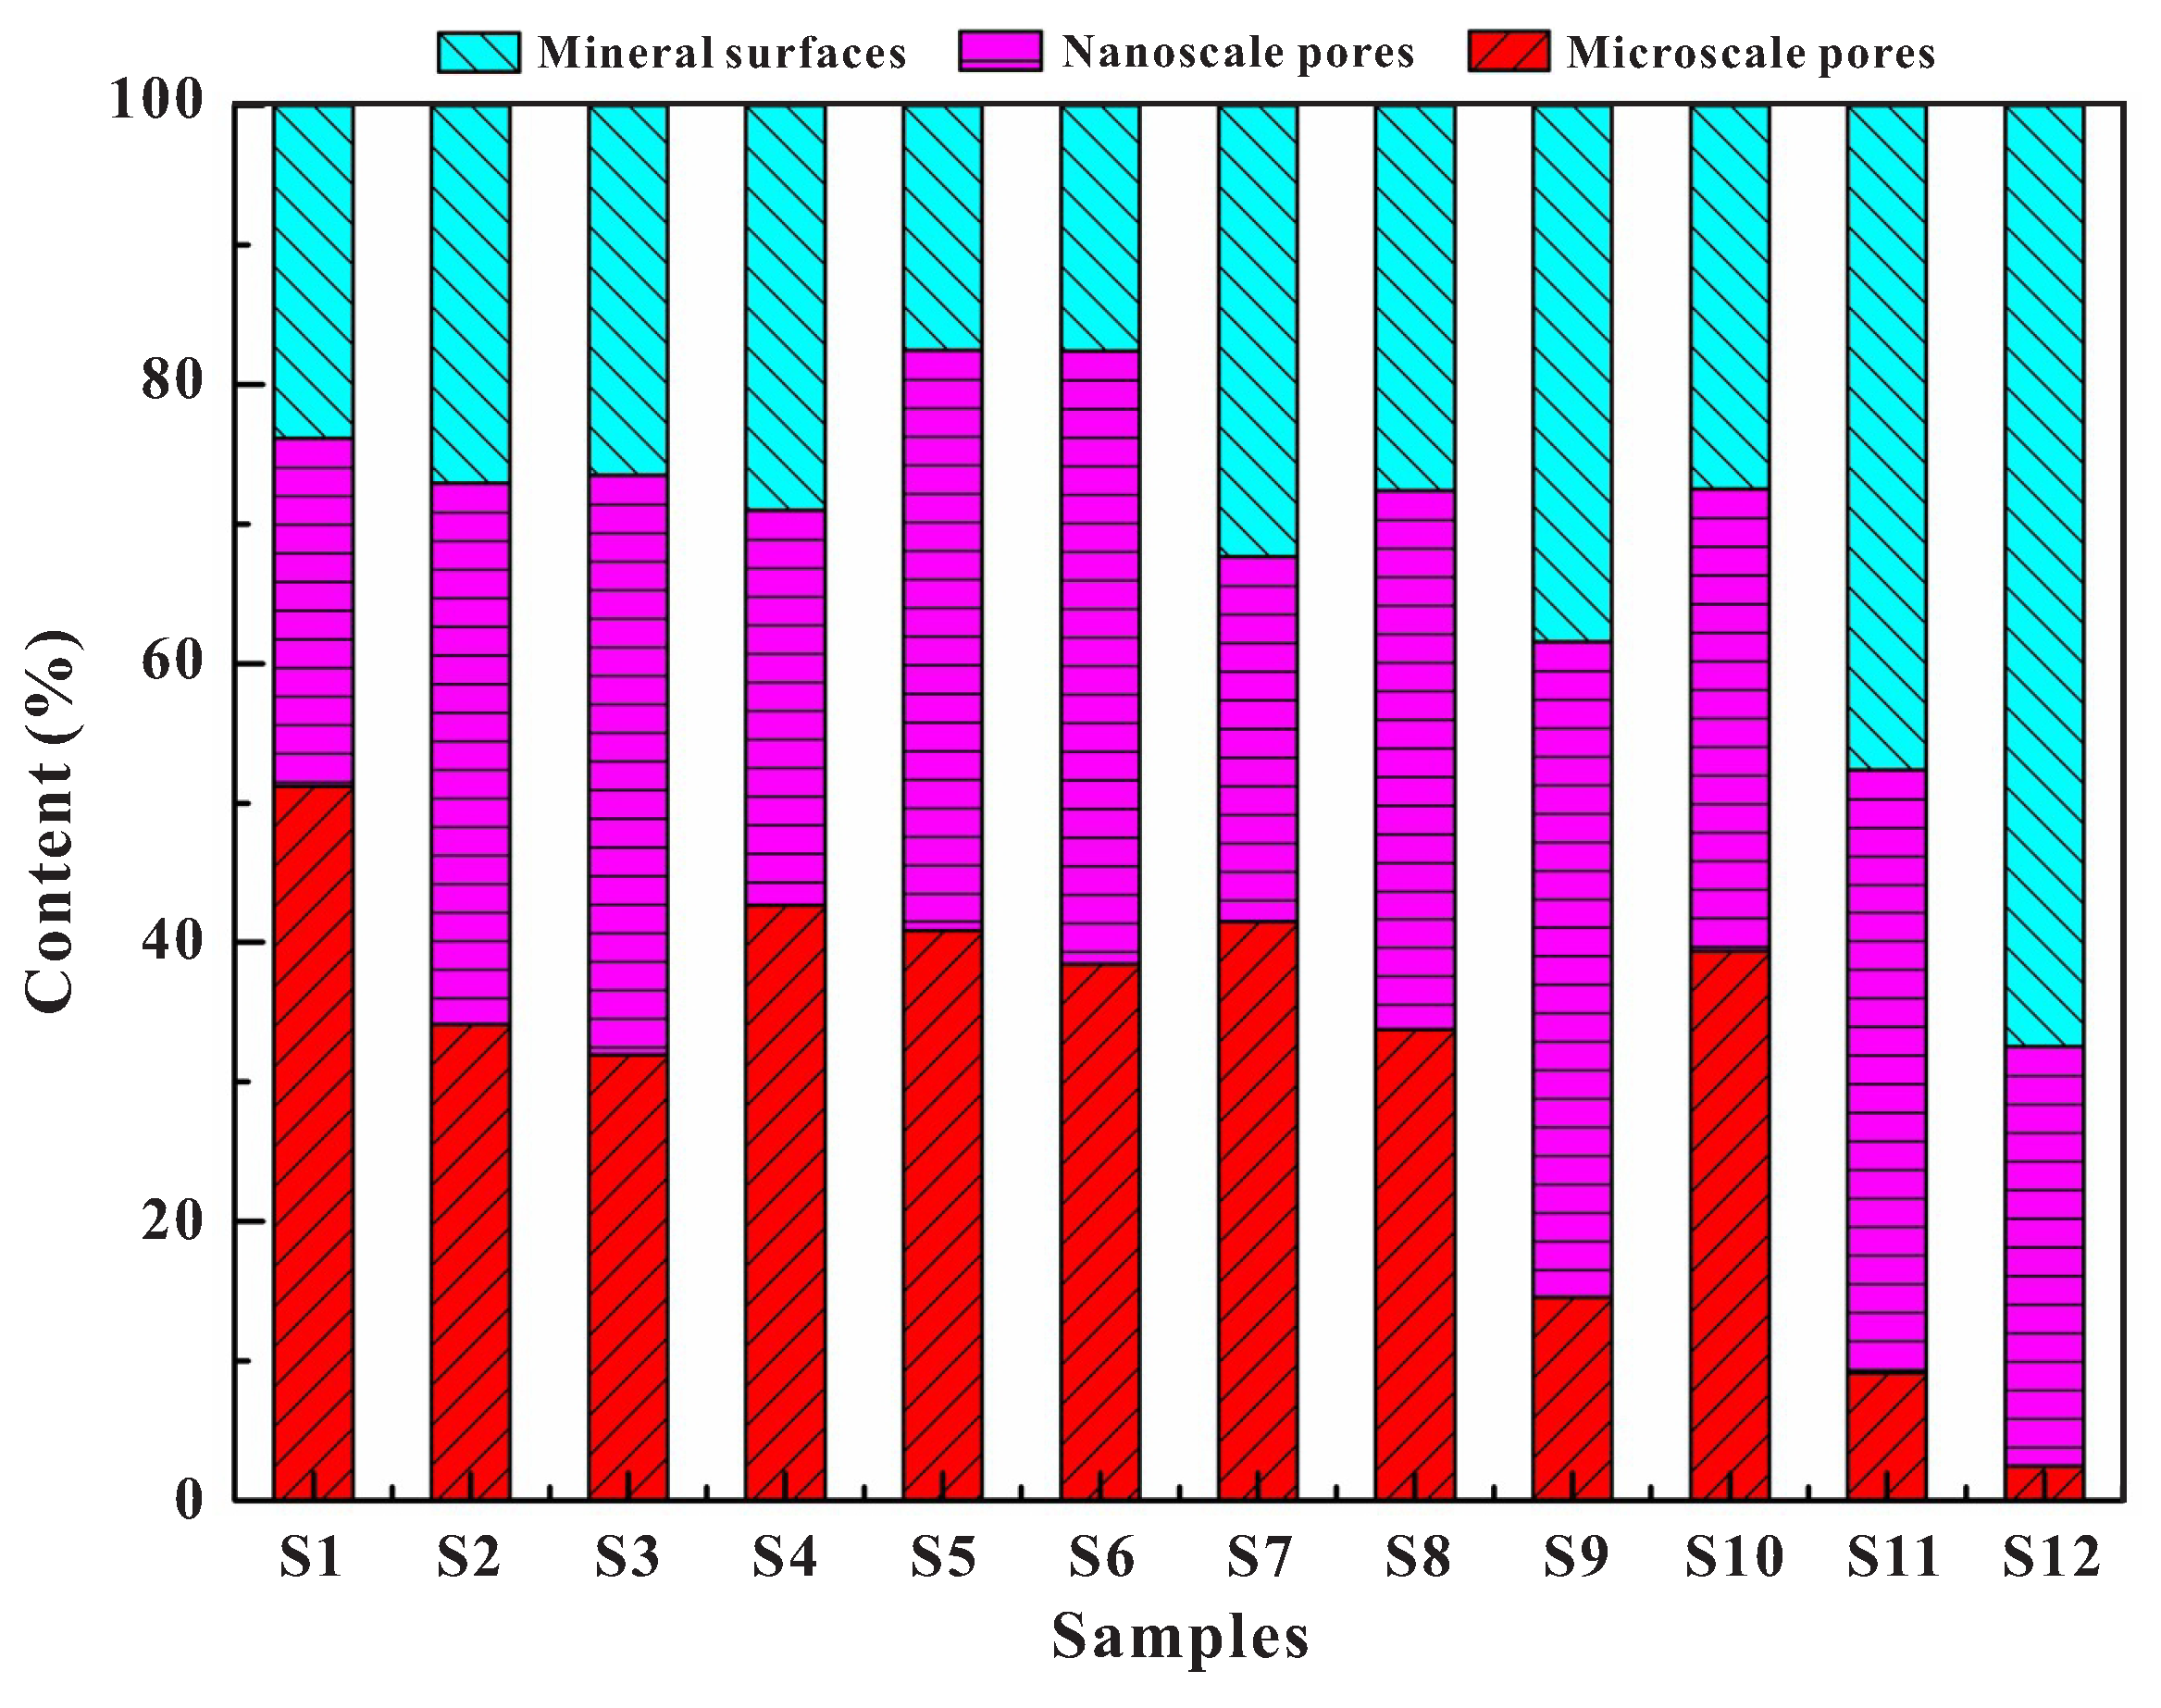
  • Tight oil found in microscale pores, nanoscale pores, and mineral surfaces was extracted step by step through tight oil extraction, accounting for 35.46%, 35.74%, and 28.79% of the total content, respectively. Microscale and nanoscale pores served as the primary storage spaces for tight oil; however, tight oil present on mineral surfaces also constituted a significant potential resource.
  • A micro-occurrence pattern of tight oil in sandstones was established for the residual tight oil observed in each type of pore. The content of anti-compaction minerals, original reservoir properties, and the content of light components primarily controlled the occurrence of tight oil stored in microscale and nanoscale pores. Conversely, the amount of tight oil present on mineral surfaces was chiefly influenced by clay minerals and heavy components.
  • Oil–rock interaction is a crucial factor contributing to component differentiation during the micro-occurrence process of tight oil. The adsorption of heavy components by minerals results in the remaining crude oil components being concentrated in microscale and nanoscale pores, which are characterized by higher saturated and aromatic hydrocarbon content and increased fluidity. The intrusion of formation water in later stages establishes the current micro-occurrence characteristics of tight oil. Consequently, the micro-occurrence process of tight oil in the reservoir is fundamentally a product of the combined effects of oil–rock interactions and the disruption and reformation caused by the presence of formation water.

Supplementary Materials

The following supporting information can be downloaded at: https://www.mdpi.com/article/10.3390/en16093917/s1, Table S1: The amount of tight oil extracted from tight sandstones; Table S2: Hydrocarbon composition of tight oil; Table S3: FTIR peak table for tight oil; Table S4: The FTIR peaks of the 650∼900 cm−1 region; Figure S1: Percentage distribution of oil family components: Figure S2: Family components of tight oil in the microscale pores; Figure S3: Family components of tight oil in the nanoscale pores: Figure S4: Family components of tight oil on mineral surfaces; Figure S5: The functional groups extracted from tight oil.

Author Contributions

D.Z.: Writing—review and editing, Methodology, Validation; M.H.: Resources, Funding acquisition; Q.Z.: Writing—original draft, Conceptualization, Methodology; T.Y.: Data curation, Visualization, Software; Y.Z.: Resources, Investigation, Formal analysis; J.C.: Supervision; X.L.: Resources, Data curation. All authors have read and agreed to the published version of the manuscript.

Funding

This research was supported by the National Natural Science Foundation of China [Grant No. 42002175], the Key Laboratory of Petroleum Resources Research, Gansu Province [Grant No. SZDKFJJ20201210], Gansu Province Science and Technology Fund Program [Grant No. 22JR5RA045 and 22JR5RA084], National Key Research and Development Program [Grant No. 2018YFA0702400], the Scientific and Technological Funds for Young Scientists of Sinopec [Grant No. YK-2022-35-2], and the Science Foundation of Sinopec Group [Grant No. P20030].

Data Availability Statement

Data available on request from the corresponding author.

Acknowledgments

The authors wish to acknowledge the Changqing Oil Field for providing the drill cores used herein. Several meaningful suggestions were provided for this study by the reviewers from Wuxi Research Institute of Petroleum Geology of Sinopec. We are also grateful to Yitian Xiao for sharing pearls of wisdom with us during this research.

Conflicts of Interest

The authors declare no conflict of interest.

References

  1. Xu, Z.; Liu, L.; Liu, B.; Wang, T.; Zhang, Z.; Wu, K.; Feng, C.; Dou, W.; Wang, Y.; Shu, Y. Geochemical Characteristics of the Triassic Chang 7 Lacustrine Source Rocks, Ordos Basin, China: Implications for Paleoenvironment, Petroleum Potential and Tight Oil Occurrence. J. Asian Earth Sci. 2019, 178, 112–138. [Google Scholar] [CrossRef]
  2. Li, C.; Chen, G.; Li, X.; Zhou, Q.; Sun, Z. The Occurrence of Tight Oil in the Chang 8 Lacustrine Sandstone of the Huaqing Area, Ordos Basin, China: Insights into the Content of Adsorbed Oil and Its Controlling Factors. J. Nat. Gas Geosci. 2022, 7, 27–37. [Google Scholar] [CrossRef]
  3. Wu, S.; Zhu, R.; Yang, Z.; Mao, Z.; Cui, J.; Zhang, X. Distribution and Characteristics of Lacustrine Tight Oil Reservoirs in China. J. Asian Earth Sci. 2019, 178, 20–36. [Google Scholar] [CrossRef]
  4. Zheng, D.; Pang, X.; Zhou, L.; You, X.; Liu, X.; Guo, F.; Li, W. Critical Conditions of Tight Oil Charging and Determination of the Lower Limits of Petrophysical Properties for Effective Tight Reservoirs: A Case Study from the Fengcheng Formation in the Fengcheng Area, Junggar Basin. J. Pet. Sci. Eng. 2020, 190, 107135. [Google Scholar] [CrossRef]
  5. Zhou, Q.; Li, X.; Qian, Z.; Chen, G.; Lyu, C.; Ma, X.; Li, C. The Occurrence of Adsorbed Tight Oil and Its Effect on Porosity and Permeability Reduction of Triassic Lacustrine Sandstone Reservoir. Geofluids 2022, 2022, 6923449. [Google Scholar] [CrossRef]
  6. Cui, J.; Li, S.; Mao, Z. Oil-Bearing Heterogeneity and Threshold of Tight Sandstone Reservoirs: A Case Study on Triassic Chang 7 Member, Ordos Basin. Mar. Pet. Geol. 2019, 104, 180–189. [Google Scholar] [CrossRef]
  7. Luan, B.; Zhang, B.; Wang, D.; Deng, C.; Wang, F. Quantitative Evaluation of Tight Oil Reservoirs in the Chang 8 Member of the Yanchang Formation in Southern Ordos Basin. Front. Earth Sci. 2022, 10, 1326. [Google Scholar] [CrossRef]
  8. Lai, J.; Wang, G.; Ran, Y.; Zhou, Z.; Cui, Y. Impact of Diagenesis on the Reservoir Quality of Tight Oil Sandstones: The Case of Upper Triassic Yanchang Formation Chang 7 Oil Layers in Ordos Basin, China. J. Pet. Sci. Eng. 2016, 145, 54–65. [Google Scholar] [CrossRef]
  9. Lai, J.; Wang, G.; Wang, Z.; Chen, J.; Pang, X.; Wang, S.; Zhou, Z.; He, Z.; Qin, Z.; Fan, X. A Review on Pore Structure Characterization in Tight Sandstones. Earth-Sci. Rev. 2018, 177, 436–457. [Google Scholar] [CrossRef]
  10. Li, Y.; Huang, Y.; Ma, H.; Chang, C.; Xie, W. Study on the Development Options of Tight Sandstone Oil Reservoirs and Their Influencing Factors. Front. Energy Res. 2022, 10, 1397. [Google Scholar] [CrossRef]
  11. Ma, Z.; Tan, J.; Zheng, L.; Ni, C.; Hu, R.; Ma, J. Simulation Experiment of Fluid-Feldspar Sandstone Interactions and Their Implications for Tight Oil and Gas Exploration of the Yanchang Formation, Ordos Basin, China. Mar. Pet. Geol. 2022, 142, 105737. [Google Scholar] [CrossRef]
  12. Zhou, Q.; Zhang, D.; Li, X.; Qian, Z.; Chen, G.; Lyu, C.; Ma, X.; Li, C. Insight into the Desorption Behavior and Mechanism of Tight Oil with In-Situ Low-Temperature Thermal. J. Pet. Sci. Eng. 2022, 218, 111001. [Google Scholar] [CrossRef]
  13. Liu, K.; Wang, R.; Shi, W.; Travé, A.; Martín-Martín, J.D.; Baqués, V.; Qi, R.; Lin, J.; Ye, H. Diagenetic Controls on Reservoir Quality and Heterogeneity of the Triassic Chang 8 Tight Sandstones in the Binchang Area (Ordos Basin, China). Mar. Pet. Geol. 2022, 146, 105974. [Google Scholar] [CrossRef]
  14. Fu, L.; Zhu, X.; Gan, R.; Zhou, J.; Zheng, Y.; Jin, T. Research of Visualization of the Occurrence State of Fluids in the Extralow Permeability Reservoirs and Its Application. J. Yangtze Univ. (Nat. Sci. Ed.) 2017, 14, 35–39+117. [Google Scholar] [CrossRef]
  15. Gong, Y.; Liu, S.; Zhu, R.; Liu, K.; Tang, Z.; Jiang, L. Micro-Occurrence of Cretaceous Tight Oil in Southern Songliao Basin, NE China. Pet. Explor. Dev. 2015, 42, 323–328. [Google Scholar] [CrossRef]
  16. Wang, M.; Zhang, S.; Zhang, F.; Liu, Y.; Ganu, H.; Li, J.; Shao, L.; Yang, S.; She, Y. Quantitative Research on Tight Oil Microscopic State of Chang 7 Member of Triassic Yanchang Formation in Ordos Basin, NW China. Pet. Explor. Dev. 2015, 42, 827–832. [Google Scholar] [CrossRef]
  17. Li, P.; Sun, W.; Wu, B.; Gao, Y.; Du, K. Occurrence Characteristics and Influential Factors of Movable Fluids in Pores with Different Structures of Chang 63 Reservoir, Huaqing Oilfield, Ordos Basin, China. Mar. Pet. Geol. 2018, 97, 480–492. [Google Scholar] [CrossRef]
  18. Li, Z.; Wu, S.; Xia, D.; He, S.; Zhang, X. An Investigation into Pore Structure and Petrophysical Property in Tight Sandstones: A Case of the Yanchang Formation in the Southern Ordos Basin, China. Mar. Pet. Geol. 2018, 97, 390–406. [Google Scholar] [CrossRef]
  19. Taheri-Shakib, J.; Hosseini, S.A.; Kazemzadeh, E.; Keshavarz, V.; Rajabi-Kochi, M.; Naderi, H. Experimental and Mathematical Model Evaluation of Asphaltene Fractionation Based on Adsorption in Porous Media: Dolomite Reservoir Rock. Fuel 2019, 245, 570–585. [Google Scholar] [CrossRef]
  20. Wu, J.; Fan, Y.; Wu, F.; Li, C. Combining Large-Sized Model Flow Experiment and NMR Measurement to Investigate Drilling Induced Formation Damage in Sandstone Reservoir. J. Pet. Sci. Eng. 2019, 176, 85–96. [Google Scholar] [CrossRef]
  21. Wang, M.; Ma, R.; Li, J.; Lu, S.; Li, C.; Guo, Z.; Li, Z. Occurrence Mechanism of Lacustrine Shale Oil in the Paleogene Shahejie Formation of Jiyang Depression, Bohai Bay Basin, China. Pet. Explor. Dev. 2019, 46, 833–846. [Google Scholar] [CrossRef]
  22. Li, J.; Jiang, C.; Wang, M.; Xu, L.; Li, M.; Yu, C.; Wu, Y.; Lu, S. Determination of in Situ Hydrocarbon Contents in Shale Oil Plays. Part 1: Is Routine Rock–Eval Analysis Reliable for Quantifying the Hydrocarbon Contents of Preserved Shale Cores? Org. Geochem. 2022, 170, 104449. [Google Scholar] [CrossRef]
  23. Li, Q.; Chen, F.; Wu, S.; Zhang, L.; Wang, Y.; Xu, S. A Simple and Effective Evaluation Method for Lacustrine Shale Oil Based on Mass Balance Calculation of Rock-Eval Data. Appl. Geochem. 2022, 140, 105287. [Google Scholar] [CrossRef]
  24. Qian, M.; Jiang, Q.; Li, M.; Li, Z.; Liu, P.; Ma, Y.; Cao, T. Quantitative characterization of extractable organic matter in lacustrine shale with different occurrences. Pet. Geol. Exp. 2017, 39, 278–286. [Google Scholar] [CrossRef]
  25. Tian, Y.; Yan, C.; Jin, Z. Characterization of Methane Excess and Absolute Adsorption in Various Clay Nanopores from Molecular Simulation. Sci. Rep. 2017, 7, 12040. [Google Scholar] [CrossRef]
  26. Li, J.; Lu, S.; Xie, L.; Zhang, J.; Xue, H.; Zhang, P.; Tian, S. Modeling of Hydrocarbon Adsorption on Continental Oil Shale: A Case Study on n-Alkane. Fuel 2017, 206, 603–613. [Google Scholar] [CrossRef]
  27. Luo, Y.; Xiao, H.; Liu, X.; Zheng, T. Occurrence Characteristics and Influential Factors of Movable Oil in Nano-Pores by Molecular Dynamics Simulation. Colloids Surf. A Physicochem. Eng. Asp. 2022, 655, 130320. [Google Scholar] [CrossRef]
  28. Marcano, M.C.; Kim, S.; Becker, U. Surface Interaction of Crude Oil, Maltenes, and Asphaltenes with Calcite: An Atomic Force Microscopy Perspective of Incipient Wettability Change. Appl. Geochem. 2020, 113, 104501. [Google Scholar] [CrossRef]
  29. Zhang, Z.; Xi, K.; Xin, H.; Yang, C.; Zhao, H.; Wang, Y.; Dan, W.; Luo, B. Origin of Calcite Cements in Tight Sandstone Reservoirs of Chang 8 Member of the Yanchang Formation in Zhijing-Ansai Area, Ordos Basin, China. Energies 2022, 15, 9544. [Google Scholar] [CrossRef]
  30. Xie, L.; You, Q.; Wang, E.; Li, T.; Song, Y. Quantitative Characterization of Pore Size and Structural Features in Ultra-Low Permeability Reservoirs Based on X-Ray Computed Tomography. J. Pet. Sci. Eng. 2022, 208, 109733. [Google Scholar] [CrossRef]
  31. Zhou, Q.; Li, C.; Chen, G.; Lyu, C.; Qu, X.; Ma, X.; Li, C.; Lei, Q.; Xie, Q. The Formation Mechanism of Authigenic Chlorite in Tight Sandstone and Its Effect on Tight Oil Adsorption during Hydrocarbon Filling. Oil Gas Sci. Technol.-Rev. D’IFP Energies Nouv. 2021, 76, 39. [Google Scholar] [CrossRef]
  32. Taheri-Shakib, J.; Keshavarz, V.; Kazemzadeh, E.; Hosseini, S.A.; Rajabi-Kochi, M.; Salimidelshad, Y.; Naderi, H.; Bakhtiari, H.A. Experimental and Mathematical Model Evaluation of Asphaltene Fractionation Based on Adsorption in Porous Media: Part 1. Calcite Reservoir Rock. J. Pet. Sci. Eng. 2019, 177, 24–40. [Google Scholar] [CrossRef]
  33. Zhang, Y.; Zeng, J.; Dai, Z.; Viswanathan, H.; Xiao, T.; Ma, Y.; Feng, X. Experimental Investigation on Oil Migration and Accumulation in Tight Sandstones. J. Pet. Sci. Eng. 2018, 160, 267–275. [Google Scholar] [CrossRef]
  34. Liu, Y.; Zhang, X.; Shi, J.; Guo, W.; Kang, L.; Yu, R.; Sun, Y.; Wang, Z.; Pan, M. A Reservoir Quality Evaluation Approach for Tight Sandstone Reservoirs Based on the Gray Correlation Algorithm: A Case Study of the Chang 6 Layer in the W Area of the as Oilfield, Ordos Basin. Energy Explor. Exploit. 2021, 39, 1027–1056. [Google Scholar] [CrossRef]
  35. Konan, N.F.D.S.; Li, M.; Shi, S.; Liu, X.; Tang, Y.; Kojo, A.; Toyin, A. Simple Column Chromatography Separation Procedure for Polycyclic Aromatic Hydrocarbons: Controlling Factor(s). Arab. J. Geosci. 2022, 15, 1350. [Google Scholar] [CrossRef]
  36. Zhang, D.; Wang, L.; Su, L.; Wu, Y.; Sun, R.; Wu, C.; Song, D.; Tuo, J. The Chemical Kinetics of the Semi-Open Hydrous Pyrolysis System: Time Series Analysis of Lithostatic Pressure and Fluid Pressure. Int. J. Coal Geol. 2020, 220, 103418. [Google Scholar] [CrossRef]
  37. Ma, W.; Hou, L.; Luo, X.; Tao, S.; Guan, P.; Liu, J.; Lin, S. Role of Bitumen and NSOs during the Decomposition Process of a Lacustrine Type-II Kerogen in Semi-Open Pyrolysis System. Fuel 2020, 259, 116211. [Google Scholar] [CrossRef]
  38. Hou, L.; Luo, X.; Zhao, Z.; Zhang, L. Identification of Oil Produced from Shale and Tight Reservoirs in the Permian Lucaogou Shale Sequence, Jimsar Sag, Junggar Basin, NW China. ACS Omega 2021, 6, 2127–2142. [Google Scholar] [CrossRef]
  39. Zhou, Q.; Lv, C.; Li, C.; Chen, G.; Ma, X.; Li, C. Formation Mechanism of Authigenic Chlorite in Tight Sandstone and Its Influence on Tight Oil Adsorption, Triassic Ordos Basin, China. Energy Explor. Exploit. 2020, 38, 2667–2694. [Google Scholar] [CrossRef]
  40. Gong, Y.; Liu, K. Pore Throat Size Distribution and Oiliness of Tight Sands-A Case Study of the Southern Songliao Basin, China. J. Pet. Sci. Eng. 2020, 184, 106508. [Google Scholar] [CrossRef]
  41. Wood, J.M.; Cesar, J.; Ardakani, O.H.; Rudra, A.; Sanei, H. Geochemical Evidence for the Internal Migration of Gas Condensate in a Major Unconventional Tight Petroleum System. Sci. Rep. 2022, 12, 7931. [Google Scholar] [CrossRef] [PubMed]
  42. Zhang, P.; Lu, S.; Li, J.; Chang, X.; Lin, Z.; Chen, G.; Li, J.; Liu, J.; Tian, S. Evaluating Microdistribution of Adsorbed and Free Oil in a Lacustrine Shale Using Nuclear Magnetic Resonance: A Theoretical and Experimental Study. J. Pet. Sci. Eng. 2022, 212, 110208. [Google Scholar] [CrossRef]
  43. Cho, H.; Kar, T.; Firoozabadi, A. Effect of Interface Elasticity on Improved Oil Recovery in a Carbonate Rock from Low Salinity and Ultra-Low Concentration Demulsifier. Fuel 2020, 270, 117504. [Google Scholar] [CrossRef]
  44. Zhou, Y.; Wu, X.; Zhong, X.; Reagen, S.; Zhang, S.; Sun, W.; Pu, H.; Zhao, J. Polymer Nanoparticles Based Nano-Fluid for Enhanced Oil Recovery at Harsh Formation Conditions. Fuel 2020, 267, 117251. [Google Scholar] [CrossRef]
  45. Vahdanikia, N.; Divandari, H.; Hemmati-Sarapardeh, A.; Nait Amar, M.; Schaffie, M.; Ranjbar, M. Integrating New Emerging Technologies for Enhanced Oil Recovery: Ultrasonic, Microorganism, and Emulsion. J. Pet. Sci. Eng. 2020, 192, 107229. [Google Scholar] [CrossRef]
  46. Afekare, D.; Gupta, I.; Rao, D. Nanoscale Investigation of Silicon Dioxide Nanofluids and Implications for Enhanced Oil Recovery—An Atomic Force Microscope Study. J. Pet. Sci. Eng. 2020, 191, 107165. [Google Scholar] [CrossRef]
  47. Wang, J.; Wu, S.; Li, Q.; Zhang, J.; Guo, Q. Characterization of the Pore-Throat Size of Tight Oil Reservoirs and Its Control on Reservoir Physical Properties: A Case Study of the Triassic Tight Sandstone of the Sediment Gravity Flow in the Ordos Basin, China. J. Pet. Sci. Eng. 2020, 186, 106701. [Google Scholar] [CrossRef]
  48. Khishvand, M.; Oraki Kohshour, I.; Alizadeh, A.H.; Piri, M.; Prasad, S. A Multi-Scale Experimental Study of Crude Oil-Brine-Rock Interactions and Wettability Alteration during Low-Salinity Waterflooding. Fuel 2019, 250, 117–131. [Google Scholar] [CrossRef]
  49. Saxena, N.; Goswami, A.; Dhodapkar, P.; Nihalani, M.; Mandal, A. Bio-Based Surfactant for Enhanced Oil Recovery: Interfacial Properties, Emulsification and Rock-Fluid Interactions. J. Pet. Sci. Eng. 2019, 176, 299–311. [Google Scholar] [CrossRef]
  50. Takeya, M.; Ubaidah, A.; Shimokawara, M.; Okano, H.; Nawa, T.; Elakneswaran, Y. Crude Oil/Brine/Rock Interface in Low Salinity Waterflooding: Experiments, Triple-Layer Surface Complexation Model, and DLVO Theory. J. Pet. Sci. Eng. 2020, 188, 106913. [Google Scholar] [CrossRef]
  51. Zhao, S.; Fu, Q.; Fu, J.; Liu, X.; Li, S.; Zhang, G.; Teng, J. Effect of Authigenic Clay Minerals and Carbonate Cements on Quality of Tight Sandstone Reservoirs: Insight from Triassic Tight Sandstones in the Huaqing Area, Ordos Basin, Northern China. J. Asian Earth Sci. 2022, 229, 105099. [Google Scholar] [CrossRef]
  52. Zheng, R.; Pan, J.; Cai, G.; Liang, J.; Liu, D.; Song, Q.; Yao, Q. Effects of Clay Minerals on the Low-Temperature Oxidation of Heavy Oil. Fuel 2019, 254, 115597. [Google Scholar] [CrossRef]
  53. Bai, Y.; Sui, H.; Liu, X.; He, L.; Li, X.; Thormann, E. Effects of the N, O, and S Heteroatoms on the Adsorption and Desorption of Asphaltenes on Silica Surface: A Molecular Dynamics Simulation. Fuel 2019, 240, 252–261. [Google Scholar] [CrossRef]
  54. Cai, J.; Lu, L.; Ding, F.; Fan, F. Significance of Interaction Between Soluble Organic Matter and Clay Minerals in Muddy Source Rocks. J. Tongji Univ. Sci. 2009, 37, 1679–1684. [Google Scholar] [CrossRef]
  55. Hemmati-Sarapardeh, A.; Dabir, B.; Ahmadi, M.; Mohammadi, A.H.; Husein, M.M. Toward Mechanistic Understanding of Asphaltene Aggregation Behavior in Toluene: The Roles of Asphaltene Structure, Aging Time, Temperature, and Ultrasonic Radiation. J. Mol. Liq. 2018, 264, 410–424. [Google Scholar] [CrossRef]
  56. Craddock, P.R.; Le Doan, T.V.; Bake, K.; Polyakov, M.; Charsky, A.M.; Pomerantz, A.E. Evolution of Kerogen and Bitumen during Thermal Maturation via Semi-Open Pyrolysis Investigated by Infrared Spectroscopy. Energy Fuels 2015, 29, 2197–2210. [Google Scholar] [CrossRef]
  57. Chen, Q.; Yang, H.J.; Liu, H.; Liu, Y.; Zhao, D.F. Spatially Resolved Micron-Scale Wrinkle Structures at Asphaltene Films Induced by Mild Thermal Treatment and Its Impact on Emulsion Stability. Pet. Sci. 2022, 19, 3107–3115. [Google Scholar] [CrossRef]
  58. Yang, Z.; Zou, C.; Hou, L.; Wu, S.; Lin, S.; Luo, X.; Zhang, L.; Zhao, Z.; Cui, J.; Pan, S. Division of Fine-Grained Rocks and Selection of “Sweet Sections” in the Oldest Continental Shale in China: Taking the Coexisting Combination of Tight and Shale Oil in the Permian Junggar Basin. Mar. Pet. Geol. 2019, 109, 339–348. [Google Scholar] [CrossRef]
  59. Wang, C.; Li, T.; Gao, H.; Zhao, J.; Li, H.A. Effect of Asphaltene Precipitation on CO2-Flooding Performance in Low-Permeability Sandstones: A Nuclear Magnetic Resonance Study. RSC Adv. 2017, 7, 38367–38376. [Google Scholar] [CrossRef]
  60. Boczkaj, G.; Makoś, P.; Przyjazny, A. Application of Dispersive Liquid–Liquid Microextraction and Gas Chromatography with Mass Spectrometry for the Determination of Oxygenated Volatile Organic Compounds in Effluents from the Production of Petroleum Bitumen. J. Sep. Sci. 2016, 39, 2604–2615. [Google Scholar] [CrossRef]
  61. Zhang, S.; Zhang, L.; Lu, X.; Shi, C.; Tang, T.; Wang, X.; Huang, Q.; Zeng, H. Adsorption Kinetics of Asphaltenes at Oil/Water Interface: Effects of Concentration and Temperature. Fuel 2018, 212, 387–394. [Google Scholar] [CrossRef]
Figure 1. A map showing the sample locations and stratigraphic characteristics of the Yanchang Formation in the study area.
Energies 16 03917 g001
Figure 2. A workflow for the extraction of tight oil from sandstones.
Energies 16 03917 g002
Figure 3. Photomicrographs illustrating the pore systems in the tight sandstones of the Chang 8 Member Formation. (a) Residual intergranular pores, intergranular dissolved pores, and sheet and bent-sheet throats, Sample S2; (b) intergranular dissolved pores, intragranular dissolved pores and sheet throats, Sample S1; (c) intergranular dissolved pores and sheet throats, Sample S3; (d) residual intergranular pores and sheet and bent-sheet throats, Sample S6; (e) intergranular dissolved pores, Sample S7; (f) intercrystalline pores, Sample S11.
Energies 16 03917 g003
Figure 4. Micro-occurrence states of tight oil (Sample S1) as observed through focused transmission spectroscopy. (a) Emulsion form; (b) Throat form; (c) Cluster form; (d) Star-like form; (e) The thin film form; (f) Isolation form.
Energies 16 03917 g004
Figure 5. Micro-occurrence states of tight oil as characterized by environmental scanning electron microscopy and energy dispersive spectroscopy. (a1) Emulsion form; (a2) EDS of emulsion form; (b1) Throat form; (b2) EDS of throat form; (c1) Cluster form; (c2) EDS of cluster form; (d1) Isolation form; (d2) EDS of isolation form; (e1) The thin film form; (e2) EDS of the thin film form; (f1) Star-like form; (f2) EDS of star-like form.
Energies 16 03917 g005
Figure 6. Micro-occurrence state pattern of tight oil in the Chang 8 Member of the Yanchang Formation of the Upper Triassic in the Ordos Basin.
Energies 16 03917 g006
Figure 7. Alterations in the micro-occurrence states of tight oil during stepwise extraction (Sample S1). (a1a3) Original micro-occurrence states of tight oil for core displacement; (b1b3) Micro-occurrence states of tight oil for small block soxhlet extraction; (c1c3) Micro-occurrence states of tight oil for particles soxhlet extraction of FTS, ESEM and EDS, respectively.
Energies 16 03917 g007
Figure 8. Percentage of tight oil extracted through a step-by-step approach.
Energies 16 03917 g008
Figure 9. Association between burial depth and the content of tight oil in the reservoir. (a) Microscale pores; (b) Nanoscale pores; (c) Mineral surfaces.
Energies 16 03917 g009
Figure 10. Correlation between the Q factor and the content of tight oil in the reservoir. (a) Microscale pores; (b) Nanoscale pores; (c) Mineral surfaces.
Energies 16 03917 g010
Figure 11. Association between mineral composition and the content of tight oil in the reservoir. (a) Quartz; (b) Feldspar; (c) Calcite; (d) Clay.
Energies 16 03917 g011
Figure 12. Normalized spectra of the microscale pores, nanoscale pores, and mineral surfaces for tight oil.
Energies 16 03917 g012
Figure 13. The pattern of the micro-occurrence mechanism of tight oil in sandstones.
Energies 16 03917 g013
Table 1. Overview of the mineral composition in the Chang 8 Member Formation, Ordos Basin.
SampleDepth
(m)
Porosity
(%)
Permeability
(×10−3 μm2)
ABCDEFG
S12138.1015.001.25058.426.8-14.43.151.449.81
S22185.6012.990.75448.432.04.512.91.971.659.29
S32062.2010.460.74159.029.30.69.52.140.746.63
S42133.4514.090.72549.633.70.115.74.881.579.25
S52187.4511.680.56854.834.62.27.50.150.636.73
S62288.0013.000.54250.738.00.99.02.390.775.84
S72192.6011.080.52150.333.11.912.72.922.037.75
S82228.3312.150.43139.640.20.211.41.481.148.78
S92242.4010.200.40650.136.03.89.92.490.996.43
S102031.6512.530.31639.636.70.510.43.540.945.93
S112036.857.880.12039.136.07.310.63.601.175.83
S122213.356.330.03730.533.612.112.12.902.306.90
A: Quartz; B: Feldspar; C: Calcite; D: Clay; E: I/S; F: Illite; G: Chlorite.
Table 2. Structural parameters of tight oil stored in microscale pores, nanoscale pores, and mineral surfaces in sandstones.
Microscale PoresNanoscale PoresMineral Surfaces
RN−H or RO−H index0.811.1314.86
Aliphatic branching index0.840.841.15
Aromatic index0.460.580.35
Aliphatic index0.170.160.13
Long-chain index0.110.10.55
Table 3. The peaks presented in the range between 675 and 900 cm−1.
Microscale PoresNanoscale PoresMineral Surfaces
Wavelength
(cm−1)
Intensity
(%)
Wavelength
(cm−1)
Intensity
(%)
Wavelength
(cm−1)
Intensity
(%)
7131.56950.516951.99
7261.537281.27282.75
7691.927651.587805.87
7812.067801.79
8270.588784.04
8784.29
Disclaimer/Publisher’s Note: The statements, opinions and data contained in all publications are solely those of the individual author(s) and contributor(s) and not of MDPI and/or the editor(s). MDPI and/or the editor(s) disclaim responsibility for any injury to people or property resulting from any ideas, methods, instructions or products referred to in the content.

