
Model-Based Performance Optimization of Thermal Management System of Proton Exchange Membrane Fuel Cell
by
 ,
,
Jiaming Zhang
1,2,3,
Fuwu Yan
1,2,3,
Changqing Du
1,2,3,
Wenhao Li
1,2,3,*,
Hongzhang Fang
4 and
Jun Shen
1,2,3 1
Hubei Key Laboratory of Advanced Technology for Automotive Components, Wuhan University of Technology, Wuhan 430070, China
2
Foshan Xianhu Laboratory of the Advanced Energy Science and Technology Guangdong Laboratory, Foshan 528200, China
3
Hubei Research Center for New Energy and Intelligent Connected Vehicle, Wuhan University of Technology, Wuhan 430070, China
4
Hubei VOYAH Automobile Technology Company Ltd., Wuhan University of Technology, Wuhan 430070, China
*
Author to whom correspondence should be addressed.
Energies 2023, 16(9), 3952; https://doi.org/10.3390/en16093952
Submission received: 9 April 2023
/
Revised: 28 April 2023
/
Accepted: 6 May 2023
/
Published: 8 May 2023
Abstract
:As a promising new power source, the proton exchange membrane fuel cell (PEMFC) has attracted extensive attention. The PEMFC engine produces a large amount of waste heat during operation. The excessive temperature will reduce the efficiency and lifespan of PEMFC engine and even cause irreversible damage if not taken away in time. The thermal management system of the PEMFC plays a critical role in efficiency optimization, longevity and operational safety. To solve the problem of high heat production in the operation of the PEMFC, two approaches are proposed to improve the heat dissipation performance of the radiators in thermal management systems. Three kinds of nanofluids with excellent electrical and thermal conductivity–Al2O3, SiO2 and ZnO– are employed as the cooling medium. The radiator parameters are optimized to improve the heat transfer capability. A typical 1D thermal management system and an isotropic 3D porous medium model replacing the wavy fin are constructed to reveal the effects of the nanofluid and the parameters of the radiator performance and the thermal management system. The results show that all three kinds of nanofluids can effectively improve the heat transfer capacity of the coolant, among which the comprehensive performance of the Al2O3 nanofluid is best. When the mass flow rate is 0.04 kg/s and the concentration is 0.5 vol%, the amount of heat transfer of the Al2O3 nanofluid increases by 12.7% when compared with pure water. Under the same conditions, it can reduce the frontal area of the radiator by 12%. For the radiator, appropriate reduction of the fin pitch and wavy length and increase of wave amplitude can effectively improve the spread of heat. The use of fin parameters with higher heat dissipation power results in lower coolant temperatures at the inlet and outlet of the stack. The performance of the radiator is predicted by the two model-based approaches described above which provide a reliable theoretical basis for the optimization of the thermal management system and the matching of the components.
1. Introduction
The advent of new energy vehicles that use unconventional fuels as power sources reduces the dependence of vehicles on conventional energy sources and opens up possibilities for solving energy and environmental problems. Proton exchange membrane fuel cells (PEMFC) have attracted wide attention in the field of transportation because of their high energy efficiency and zero emissions [1,2]. The PEMFC is an electrochemical device in which hydrogen and oxygen react electrochemically to produce water and, at the same time, produce electricity [3,4]. When a PEMFC engine is operating, it produces significant waste heat. More than 95% of the waste heat relies on coolant to dissipate, preventing the stack from working at an excessive temperature [5]. Therefore, the thermal management system requires more precise control strategies as well as careful design. In order to keep the temperature of the stack in the appropriate range, almost all of the waste heat generated by the PEMFC should be carried away in time by the coolant. The thermal equilibrium of the PEMFC plays a crucial role in the performance and lifetime of the PEMFC and hence a higher demand is placed on the cooling system. Despite significant progress in the research field of PEMFCs, obstacles to their large-scale commercialization remain, among which the development of thermal management systems is a huge challenge [6]. In the development of thermal management systems in the past, the key points were the construction of some complex models and the dynamical control of the system, for which the models have complex geometries, changing boundary conditions and fluid properties, thereby increasing the computational and analytical difficulties. Therefore, it is necessary to properly design the PEMFC thermal management system [5].
With the rapid development of CFD technology, the simulation of the PEMFC engine thermal management system has gradually become an irreplaceable part of this development. Most researchers have used CFD techniques to investigate the flow patterns and heat transfer mechanisms [7]. Dong et al. [8] experimentally investigated the effect of each geometry parameter of the wavy fins on thermal transmission performance; the experimental data were in high agreement with the simulation data. Chen et al. [9] constructed a new 3-D flow channel and used CFD technology to verify the performance improvement of PEMFC. Moreover, they investigated the two geometry parameters, wavy fin amplitude and length, that have the greatest influence on the thermal hydraulic properties and came up with a set of optimized geometry parameters. Zhang et al. [5] studied the relationship between airflow distribution, pressure drop and heat transfer. It has been demonstrated that the more uniform the distribution of the flow, the smaller the pressure drop as the air crosses the channel. In addition, the more uniform the distribution of air, the stronger the heat transfer. Rahimi-Esbo et al. [10,11] and Zhao et al. [12] also showed that the uniformity of gas flow increases significantly with the decrease of pressure, thus improving the efficiency of the radiator. In addition to the structural and gas effects, some researchers have started to use nanofluids to try and improve the performance of thermal management systems. Bargal et al. [13] studied the performance of a PEMFC engine for vehicles by using ZnO and AlN nanofluids based on a mixture of water and ethylene glycol (1:1). It is found that by adding ZnO nanofluid to the base solution, the performance of PEMFC engines can be enhanced. Johari et al. [14] proved, through experimental tests, that Al2O3-SiO2 hybrid nanofluids were superior to the base fluid in terms of electrical and thermal conductivity and could improve the performance of the PEMFC. Islam et al. [15] used the nanofluids as a coolant for thermal management systems and demonstrated that the use of nanofluids as coolant can increase the amount heat transfer and reduce the frontal area of the radiator. Likewise, Islam et al. [6] also investigated the use of nanofluid as a coolant and suggested that the use of nanofluid as a coolant does not increase the pressure drop in the thermal management system.
Although simulation techniques have now also been developed to a high level, it is still difficult to implement simulations of the entire radiator due to the complex fin structure and the huge computational effort. This has also made porous medium models more and more popular for the simulation of entire radiators. Peng et al. [16] used porous media in the cathode gas passage of polymer electrolyte membrane, proving that porous media can improve the gas heat exchange performance. Mao et al. [17] simulated the fin-and-tube radiator model by using a porous medium model and found that the model can effectively replace the complex fin model for heat transfer and flow simulation. Huang et al. [18,19] used a porous medium model instead of a ribbon tubular radiator. Although the error between simulation and experiment is found to be large, the trend of the simulation results is approximately the same as the experimental results. Zhang et al. [20] obtained some characteristic curves about the intercooler by replacing the fin area with a porous area. The aforementioned papers, all of which use porous medium models for 3D simulations, obtain numerical results only for a particular component but not from the perspective of a thermal management system. In order to obtain better performance properties, in this paper we simulate not only the radiator through 3D simulations but also the thermal management system through 1D and 3D coupled simulations.
Taking all these factors into account, this paper improves the thermal properties of radiators in two ways. The coolant medium is replaced by a nanofluid with excellent electrical and thermal conductivity. In addition, the fin parameters are optimized to improve the heat transfer capability. Based on the above two points, a typical 1D thermal management system and an isotropic 3D porous medium model replacing the wavy fin are constructed to reveal the effects of the nanofluid and the parameters of the radiator performance as well as on the thermal management system. The thermal properties of radiators with nanofluid as a coolant and different fin parameters are predicted by the above two models, which provide a reliable theoretical basis for the optimization of thermal management systems.
2. Model Description and Methodology
2.1. System Description
The structural details of the PEMFC engine thermal management system are shown in Figure 1, which mainly consists of stack, pump, thermostat, PTC heater and radiator. The coolant is driven by a pump and circulates within the thermal management system. The coolant flowing to the thermostat is divided into two branches (the inner circulation and the outer circulation) which are composed of the PTC heater and the radiator, respectively. The coolant flow rate of both branches is regulated by the opening of the thermostat. When the coolant flows through the inner circulation, it returns to the stack inlet through the PTC heater. When the coolant flows through the external circulation, it completes convective heat transfer with the environment through the radiator and returns to the stack inlet.
2.2. Radiator Model Analysis and Building
The geometry of the wavy fin and flat tube radiator, as well as some parametric terms, are presented in Figure 2, and Table 1 shows the specific parameters of the fin and flat tube. The structural diagram of the radiator model is presented in Figure 3, which contains three layers of fin areas and four layers of flat tubes. The entire model is 203 mm long in the horizontal direction and 54 mm long in the vertical direction. Due to the presence of wavy fins, the structure of the radiator becomes complex, while the heat transfer coefficient, the heat transfer surface and the uneven flow are enhanced, ensuring the high heat dissipation capacity of the radiator.
A porous medium model is utilized instead of the complex wavy fin model to simulate heat transfer. The parameters of the porous medium model are obtained by simulating a row of wavy model fin, shown in Figure 4, which contains the fluid region of the air side. The CFD calculation model using a porous medium instead of a wavy fin area is shown in Figure 5. The calculated size of the model is the same as the structural size of the radiator shown in Figure 3. Using the simulation results of a row of wavy fin model, the viscous drag coefficient, inertial drag coefficient and porosity required for a porous medium model are obtained. The porous medium model is assumed to be isotropic.
The 3D simulation software Star-CCM+ is used for simulation and analysis. The extension area and porous area are filled with polyhedral mesh and the number and thickness of the boundary layer mesh air is selected properly based on the Y+ value. An encrypted trimmed grid is applied to the water pipe wall, while a polyhedral and thin-walled mesh is used on the water side. Before performing the simulation, a grid independent check was completed to ensure the accuracy of the simulation [21].
The total heat exchange of the coolant in the radiator can be expressed as Equation (1) [22,23]:
here, is the heat transfer rate, is the specific heat capacity of the coolant at constant pressure, and are the inlet and outlet temperatures, respectively, and is the mass flow rate.
For the water side, the frictional heat loss can be calculated using the following equation:
here, is the frictional head loss, is the friction coefficient, is the length of the pipe, is the hydraulic diameter of the tube, is the average velocity in a certain plane and is the acceleration of gravity.
The friction coefficient in the turbulent state can be expressed by the Blasius formula:
here, is the kinematic viscosity of the fluid medium.
The pressure drop on the water side is:
here, ρ is the density of the medium.
For the boundary conditions, the fluid can be assumed to be three-dimensional, steady state, incompressible and turbulent, and the k-ε turbulence model is chosen. The water pipe wall is considered to be a three-dimensional and constant density solid. The finite volume analysis is carried out in Star-CCM+. The water side inlet is set as the mass flow rate inlet and the outlet is the pressure outlet. Similarly, the inlet and outlet at the wind side is the velocity inlet and pressure outlet, respectively. When the influence of the water side is analyzed, the inlet air speed and temperature of the air side are set at 6 m/s and 25 °C, respectively. Meanwhile, to study the effect of fin parameters on heat transfer performance, the mass flow rate on the water side was 0.08 kg/s and the temperature was 90 °C.
The continuity equation [24] is:
The momentum equation is:
The energy equation is:
And the standard k-ε equation is:
Because of the presence of numerous fins, the porous medium model is used to describe the resistance of air flow through the radiator. The basic control equation of porous medium theory is:
here, is the velocity along the wind direction, and are the lengths, is the time, is the air density, is the pressure on the fluid micro-element, is the kinematic viscosity and is the addition of momentum source term.
In the generalized porous medium model, consists of two components: viscous loss term and inertial loss term. It can be expressed as Equation (15):
The addition of the momentum source term has an effect on the pressure gradient in the porous medium region, generating a pressure drop proportional to the velocity and to the square of the velocity. Here, is the permeability coefficient, is the inertial drag coefficient or pressure loss coefficient, is the air motion viscosity coefficient and is the velocity in the x-direction.
For the numerical simulation, the porous medium model is equivalent through pressure loss, and the pressure drop equation is:
here, is the inertial drag coefficient and is the viscous drag coefficient.
It should be noted that the effective thermal conductivity of the porous medium is determined by the conductivity of the fin, the conductivity of the air and the porosity of the porous medium:
here, is the porosity of porous medium, is air thermal conductivity and is fin thermal conductivity.
The binomial fitting curves of pressure drop and air speed per unit length are shown in Figure 6. The image indicates that the greater the air velocity at the radiator inlet, the greater the pressure drop generated by the resistance. According to Equation (1), the values of inertial drag coefficient and viscous drag coefficient are obtained as 16.01 and 90.39, respectively. According to Figure 6, the relationship between the pressure drop per unit length and the wind speed is shown as follows.
2.3. 1D and 3D Coupled Simulation Model
Based on the respective advantages of 1D and 3D simulations, this paper uses a 1D and 3D coupled simulation that can better reflect the influence of different coolant mediums on the radiator and the thermal management system. The coupled simulation method uses the mass flow rate and temperature of the coolant from the 1D simulation as the boundary conditions for the 3D simulation, and the heat dissipation obtained from the 3D radiator simulation is fed back into the 1D as the result. The model of 1D and 3D coupled simulation built by using Amesim software is shown in Figure 7, which contains the stack module, water pump, thermostat, PTC heater, sensor, radiator module and various signal modules. The material properties are shown in Table 2.
3. Results and Discussion
3.1. Validation of Model
In order to verify the accuracy of the model, the original wavy fin model and the porous medium model were simulated under the same conditions and the pressure drops of the two models under different wind speeds were obtained. The comparison of pressure drop results at different air speeds is shown in Figure 8. It is clear that the pressure drop of the two models has good agreement and the maximum deviation of the simulation data is not more than 5%. It can be considered that the porous medium model can be a good substitute for the wavy fin model.
Next, to validate the heat exchanger model based on the porous medium, the simulation was conducted with the conditions of 25 °C inlet air temperature as well as 90 °C inlet water temperature. The experimental data under the same conditions from Dong et al. [25] were compared. The comparative results of heat transmission are shown in Figure 9. The simulation results have a good agreement with the test data and the maximum deviation is not more than 6%. This shows that the heat exchanger model based on a porous medium is accurate and can also be used for further studies.
3.2. The Influence Analysis of Nanofluids
Nanofluid is a new type of heat transfer medium. Compared to conventional heat transfer medium, nanofluids have some special properties, including high specific surface area, high dispersion stability and high thermal conductivity. These properties can be changed by adjusting the concentration of nanoparticles. To test the difference between the properties of different concentrations of nanofluids and compare the quality of different types of nanofluids, three materials (Al2O3, SiO2 and ZnO) were selected for simulation experiment comparison; the concentrations were 0.1%, 0.3% and 0.5%, respectively. Their physical property parameters were derived from the literature [26,27]. The effect of particle size is ignored. The physical parameters of three nanofluids with different concentrations are shown in Table 3, Table 4 and Table 5.
The effect of different concentrations of three nanofluids (0.1~0.5%) as a coolant on the heat transfer performance of the radiator at different flow rates are shown in Figure 10. The results show that the three nanoparticles significantly improved the thermal conductivity of the base fluid. Compared with the base fluid, when the mass flow rate is 0.02 kg/s and the concentration is 0.1 vol%, the amount of heat transfer of Al2O3, SiO2 and ZnO nanofluids increases by 9.5%, 9.1% and 4.2% respectively. Whereas for 0.5 vol% concentrations, the amount of heat transfer of the three nanofluids increases by 15%, 13.9% and 10%, respectively. However, the three nanofluids showed the same trend for nanofluid at the same concentration; the increase in the amount of heat transfer compared to the base fluid decreases as the mass flow rate increases.
The effect of different concentrations of the three nanofluids on the frontal area of the radiator at different mass flow rates are shown in Figure 11. It can be seen that all three nanofluids can significantly reduce the frontal area of the radiator. When the mass flow rate is 0.04 kg/s, by adding 0.5 vol% of nanoparticles to pure water, the Al2O3 nanofluid can reduce the area by 12% when compared with the base fluid. Under the same conditions, SiO2 and ZnO nanofluids can reduce the area by 11.67% and 9.17%, respectively. With the increase of nanoparticle concentration, the decreased range of the front area of the radiator increases. The increase of mass flow significantly reduces the decreased range of the front area of the radiator; this is due to the fact that the higher the mass flow rate, the smaller the increase in amount of heat transfer when compared to the base fluid.
Since the addition of nanoparticles leads to increased viscosity of the coolant, resulting in a greater pressure drop as the coolant passes through the radiator, more pumping power is required to get the coolant flowing. Previous studies [28,29] have found that the tendency of using nanofluids can cause an increase in pressure drop. The pressure drop generated by different concentrations of three nanofluids at variable mass flow rates are shown in Figure 12. When the mass flow rate is 0.16 kg/s, by adding 0.5 vol% nanoparticles to pure water, the Al2O3 nanofluid can increase the pressure drop by 7.6% when compared with the base fluid. Under the same conditions, the SiO2 and ZnO nanofluids can increase the pressure drop by 6.1% and 5%, respectively. The study clearly demonstrates that the addition of nanoparticles to the base fluid leads to an increase in pressure drop, and that the pressure drops increases more as the concentration of nanoparticles and the coolant mass flow rate rise.
Based on the above test data, among the three kinds of nanofluids, the Al2O3 nanofluid has the best heat transfer effect, but the pressure drop is the largest. Although the ZnO nanofluid cause the least pressure drop, its heat transfer effect is the worst. Therefore, the comprehensive heat dissipation performance of the Al2O3 nanofluid is the best among the three kinds of tested nanofluids.
For the thermal management system, it is assumed that the stack is in steady state operation and the heat output is 24 kW. The pump speed is constant, and the effect of different coolants on the inlet and outlet temperature of the stack can be obtained under the same pump power. The effect of the inlet and outlet temperature of the stack when pure water and 0.5% Al2O3 nanofluid are used as the cooling mediums is shown in Figure 13. It is straightforward to find that when using 0.5% Al2O3 nanofluid as the cooling medium, the inlet and outlet temperature of the stack are approximately 10 °C lower than when using pure water as the cooling medium. When using the nanofluid, the temperature difference is smaller, which means that the temperature inside the stack is more uniform, suggesting the efficient operation of the stack. In addition, the curves are relatively flat when using the nanofluid because the addition of nanoparticles improves the specific heat of the coolant. A more moderate temperature variation results in a better working condition and a longer lifetime of the stack.
3.3. The Influence Analysis of Fin Parameters
The model-based method is used to investigate the effects of fin pitch, wavy length and wavy amplitude on the heat transfer performance of the radiator. To ensure the reliability of the results, all simulations were performed at the same coolant flow rate of 0.08 kg/s and the medium of 0.1% Al2O3 nanofluid. As shown in Table 6, nine groups, varying the values of the above three parameters to study the law of the effect on the heat transfer performance of the radiator, were tested. The porous medium coefficients are calculated for each set of parameters as above. Turning the complex fin model into a porous medium model makes it simple to calculate the heat transfer power of the radiator model.
The effect of fin pitch, wavy amplitude, and wavy length on radiator heat transfer performance is shown in Figure 14, Figure 15 and Figure 16, respectively. From the three figures, it can be seen that the effect of fin pitch and wavy amplitude on the radiator heat transfer performance is relatively greater, and the impact on radiator heat transfer performance increases as the radiator inlet air speed increases. The radiator with the fin pitch of 2.5 mm has a cooling power approximately 300 W greater than the radiator with the fin pitch of 4.5 mm. The radiator with the wavy amplitude of 0.85 mm dissipates approximately 250 W more power than the radiator with the wavy amplitude of 0.55 mm. When the wind speed is low, the fin length has less influence on the radiator’s cooling power. However, the effect gradually increases when the wind speed exceeds 6 m/s.
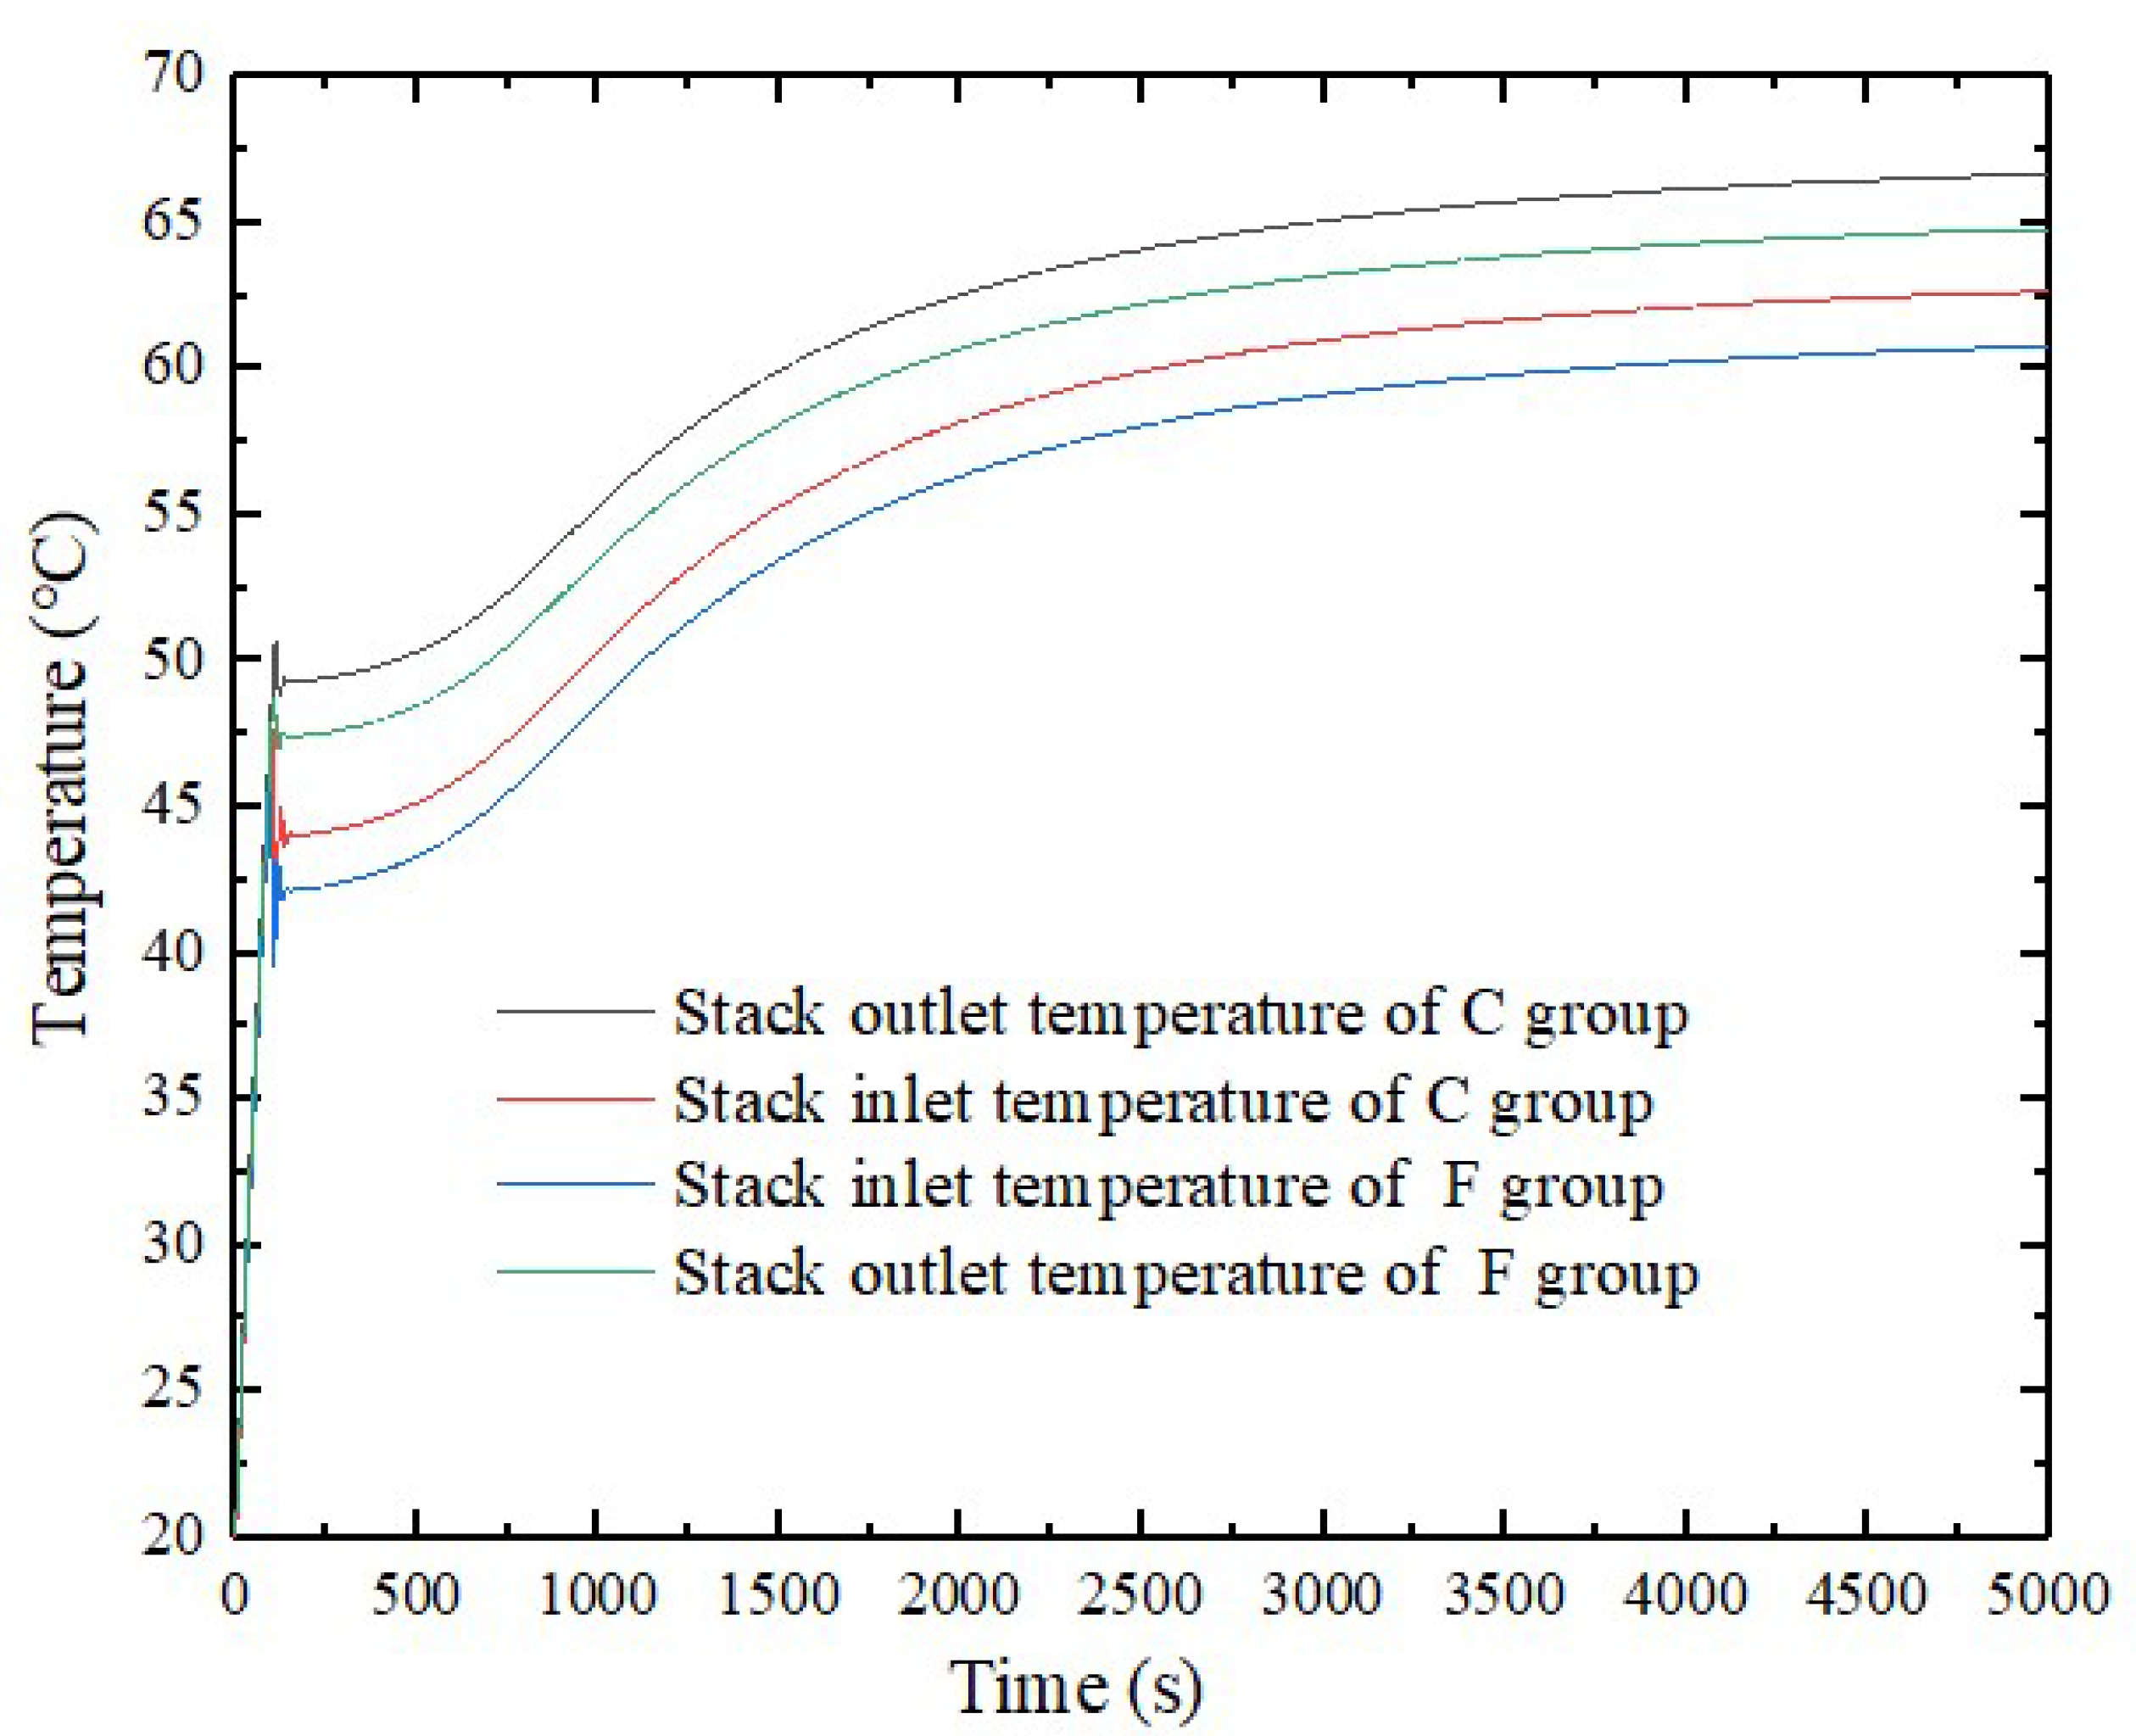
From the above nine groups of fin parameters, two groups, C and F, the groups with the smallest and largest heat dissipation power, were selected to study the effect of radiators with different fin parameters on the temperature of the stack through a joint 1D-3D simulation. The simulation result is shown in Figure 17. The inlet and outlet coolant temperatures using the radiator parameters in group F are about 1.8 °C lower than those using group C; this is because of the greater heat dissipation power of the radiator using group F parameters. However, the temperature difference of coolant in both cases is not significant, which is caused by using the same coolant.
4. Conclusions
Two model-based approaches (replacing the cooling medium with the nanofluids and varying the thermal radiator parameters) have been investigated to enhance the heat transfer capacity of PEMFC thermal management systems. The radiator model is established and the porous medium model is used to replace the fins in the radiator. The relation between the airspeed and the pressure drop is calculated and these quantities are used to calculate the coefficients of the porous medium. A series of simulations were carried out to verify the validity of the porous medium coefficients and the radiator model. The amount of heat transferred in the radiator model is in good agreement with the experimental data, with a maximum deviation of less than 6%. Next, a simulation analysis of a radiator using a porous medium is implemented. The heat dissipation performance and pump power consumption of a radiator using three kinds of nanofluids as coolant medium have been further studied. The variation of the inlet and outlet temperature of the stack in the thermal management system using nanofluid and pure water as the cooling medium are investigated through 1D and 3D coupled simulation. Finally, the effect of the fin pitch on the heat transfer performance of the radiator is studied. The main conclusions are summarized as follows:
- In order to verify whether nanofluids can improve the performance of the radiator, three kinds of nanofluids (Al2O3, SiO2 and ZnO) were selected for simulation tests and compared with pure water. The results show that the amount of heat transfer of the coolant can be improved by using nanofluids. When the mass flow rate is 0.02 kg/s and the concentration is 0.1 vol%, the amount of heat transfer of Al2O3, SiO2 and ZnO nanofluids increases by 9.5%, 9.1% and 4.2%, respectively, when compared with pure water. It is also found that the higher the concentration of nanoparticles, the greater the improvement in heat dissipation properties. However, the improvement in heat dissipation performance decreases as the coolant mass flow rate increases. The three nanofluids show the same trend.
- The increased heat dissipation capacity means that the frontal area of the radiator can be reduced. When the mass flow rate is 0.04 kg/s, by adding 0.5 vol% nanoparticles to pure water, the Al2O3 nanofluid can reduce the area by 12% when compared with pure water. Under the same conditions, the SiO2 and ZnO nanofluids can reduce the area by 11.67% and 9.17%, respectively. As the concentration of nanoparticles increases, the effect on frontal area reduction becomes larger. However, more pumping power is consumed and as the concentration of nanoparticles rises, the required pumping power rises. When the mass flow rate is 0.16 kg/s, by adding 0.5 vol% nanoparticles to pure water, the Al2O3 nanofluid can increase the pressure drop by 7.6% when compared with the base fluid. Under the same conditions, the SiO2 and ZnO nanofluids can increase the pressure drop by 6.1% and 5%, respectively. Although the Al2O3 nanofluid caused the most pressure drop, it has the best comprehensive performance and is suitable for use in the coolant to improve the heat dissipation capacity.
- A 1D-3D coupled model is established to study the temperature changes at the inlet and outlet of the stack using pure water and 0.5% Al2O3 nanofluid as a cooling medium. Through simulation analysis, it is found that the inlet and outlet temperature of the stack is about 10 °C lower when using nanofluid than when using pure water. The temperature difference of the coolant is smaller and the temperature variation is relatively mild, providing a good thermal environment for the operation of the stack.
- A porous media model is established and used to investigate the effects of fin pitch, wavy length, and wavy amplitude on the heat transfer performance of the radiator. In addition, 0.1% Al2O3 nanofluid is used as the cooling medium, and the mass flow rate is set at 0.08 kg/s. The results show that fin pitch, wavy amplitude and wavy length all have a significant effect on the heat dissipation capacity of the radiator, and the effect is more pronounced when the inlet air speed of the radiator is higher. The use of fin parameters with higher heat dissipation power results in lower coolant temperatures at the inlet and outlet of the stack, but the temperature difference does not change significantly. Among the nine groups of parameter values, group F has the best comprehensive heat dissipation performance and can be used for radiator parameter optimization.
Our future work will continue to focus on the coolant optimization of the PEMFC engine cooling system and the structural optimization of the radiator. The next step will be to try bench testing to get the results more in line with actual conditions and to apply them to actual fuel cell engines.
Author Contributions
Conceptualization, J.Z., F.Y., C.D., H.F., W.L. and J.S.; methodology, J.Z., F.Y., C.D. and W.L.; software, J.Z., H.F. and W.L.; formal analysis, F.Y., C.D. and J.S.; resources, F.Y., C.D., W.L. and J.S.; data curation, J.Z., H.F. and W.L.; writing—original draft preparation, J.Z., F.Y., C.D., H.F. and W.L.; writing—review and editing, J.Z., F.Y., C.D., H.F., W.L. and J.S.; visualization, J.Z., F.Y., C.D., W.L. and J.S.; supervision, F.Y. and C.D.; funding acquisition, F.Y. and C.D. All authors have read and agreed to the published version of the manuscript.
Funding
This research was funded by National Key R&D Program of China, grant number 2022YFB4003703; Key R&D project of Hubei Province China, grant number 2021AAA006.
Data Availability Statement
Not applicable.
Conflicts of Interest
The authors declare no conflict of interest.
References
- Park, J.; Oh, H.; Park, H.; Moon, J.W.; Lee, S.J.; Jung, S.Y. Water transport in polymer electrolyte membrane fuel cell: Degradation effect of gas diffusion layer. Int. J. Energy Res. 2022, 46, 9058–9070. [Google Scholar] [CrossRef]
- Wei, Y.; Zhao, Y.; Yun, H. Research on PEMFC Internal Temperature Predictions and Thermal Management Strategy Based on a Kalman Algorithm. J. Energy Eng. 2021, 147, 04021010. [Google Scholar] [CrossRef]
- Silva, A.P.; Galante, R.M.; Pelizza, P.R.; Bazzo, E. A combined capillary cooling system for fuel cells. Appl. Therm. Eng. 2012, 41, 104–110. [Google Scholar] [CrossRef]
- Song, T.-W.; Choi, K.-H.; Kim, J.-R.; Yi, J.S. Pumpless thermal management of water cooled high-temperature proton exchange membrane fuel cells. J. Power Sources 2011, 196, 4671–4679. [Google Scholar] [CrossRef]
- Zhang, Q.; Xu, L.; Li, J.; Ouyang, M. Performance prediction of proton exchange membrane fuel cell engine thermal management system using 1D and 3D integrating numerical simulation. Int. J. Hydrogen Energy 2018, 43, 1736–1748. [Google Scholar] [CrossRef]
- Islam, M.R.; Shabani, B.; Rosengarten, G. Nanofluids to improve the performance of PEM fuel cell cooling systems: A theoretical approach. Appl. Energy 2016, 178, 660–671. [Google Scholar] [CrossRef]
- Giuseppe, C.; Stefano, F.; d’Adamo, A. Methodology for PEMFC CFD Simulation Including the Effect of Porous Parts Compression. Int. J. Hydrogen Energy 2022, 47, 14658–14673. [Google Scholar]
- Dong, J.; Su, L.; Chen, Q.; Xu, W. Experimental study on thermal-hydraulic performance of a wavy fin-and-flat tube aluminum heat exchanger. Appl. Therm. Eng. 2013, 51, 32–39. [Google Scholar] [CrossRef]
- Chen, X.; Yu, Z.; Yang, C.; Chen, Y.; Jin, C.; Ding, Y.; Li, W.; Wan, Z. Performance investigation on a novel 3D wave flow channel design for PEMFC. Int. J. Hydrogen Energy 2021, 46, 11127–11139. [Google Scholar] [CrossRef]
- Rahimi-Esbo, M.; Ranjbar, A.; Ramiar, A.; Alizadeh, E.; Aghaee, M. Improving PEM fuel cell performance and effective water removal by using a novel gas flow field. Int. J. Hydrogen Energy 2016, 41, 3023–3037. [Google Scholar] [CrossRef]
- Alizadeh, E.; Rahimi-Esbo, M.; Rahgoshay, S.; Saadat, S.; Khorshidian, M. Numerical and experimental investigation of cascade type serpentine flow field of reactant gases for improving performance of PEM fuel cell. Int. J. Hydrogen Energy 2017, 42, 14708–14724. [Google Scholar] [CrossRef]
- Zhao, C.; Yang, J.; Zhang, T.; Yan, D.; Pu, J.; Chi, B.; Li, J. Numerical simulation of flow distribution for external manifold design in solid oxide fuel cell stack. Int. J. Hydrogen Energy 2017, 42, 7003–7013. [Google Scholar] [CrossRef]
- Bargal, M.H.S.; Souby, M.M.; Abdelkareem, M.A.A.; Sayed, M.; Tao, Q.; Chen, M.; Wang, Y. Experimental investigation of the thermal performance of a radiator using various nanofluids for automotive PEMFC applications. Int. J. Energy Res. 2021, 45, 6831–6849. [Google Scholar] [CrossRef]
- Johari, M.N.I.; Zakaria, I.A.; Azmi, W.H.; Mohamed, W.A.N.W. Green bio glycol Al2O3-SiO2 hybrid nanofluids for PEMFC: The thermal-electrical-hydraulic perspectives. Int. Commun. Heat Mass Transf. 2022, 131, 105870. [Google Scholar] [CrossRef]
- Islam, R.; Shabani, B.; Andrews, J.; Rosengarten, G. Experimental investigation of using ZnO nanofluids as coolants in PEM fuel cell. Int. J. Hydrogen Energy 2017, 42, 19272–19286. [Google Scholar] [CrossRef]
- Peng, M.; Chen, L.; Zhang, R.; Xu, W.; Tao, W.-Q. Improvement of thermal and water management of air-cooled polymer electrolyte membrane fuel cells by adding porous media into the cathode gas channel. Electrochim. Acta 2022, 412, 140154. [Google Scholar] [CrossRef]
- Mao, S.; Cheng, C.; Li, X.; Michaelides, E.E. Thermal/structural analysis of radiators for heavy-duty trucks. Appl. Therm. Eng. 2010, 30, 1438–1446. [Google Scholar] [CrossRef]
- Huang, Y.-Q.; Huang, R.; Yu, X.-L.; Lv, F. Simulation, experimentation, and collaborative analysis of adjacent heat exchange modules in a vehicular cooling system. J. Zhejiang Univ. Sci. A 2013, 14, 417–426. [Google Scholar] [CrossRef]
- Huang, Y.; Liu, Z.; Lu, G.; Yu, X. Multi-scale thermal analysis approach for the typical heat exchanger in automotive cooling systems. Int. Commun. Heat Mass Transf. 2014, 59, 75–87. [Google Scholar] [CrossRef]
- Zhang, Q.; Qin, S.; Ma, R. Simulation and experimental investigation of the wavy fin-and-tube intercooler. Case Stud. Therm. Eng. 2016, 8, 32–40. [Google Scholar] [CrossRef]
- Al-Asadi, M.T.; Alkasmoul, F.S.; Wilson, M.C.T. Heat transfer enhancement in a micro-channel cooling system using cylindrical vortex generators. Int. Commun. Heat Mass Transf. 2016, 74, 40–47. [Google Scholar] [CrossRef]
- Hussein, A.M.; Bakar, R.A.; Kadirgama, K. Heat transfer enhancement using nanofluids in an automotive cooling system. Int. Commun. Heat Mass Transf. 2014, 53, 195–202. [Google Scholar] [CrossRef]
- Mus, J.; Mylle, S.; Schotte, S.; Fevery, S.; Latré, S.K.; Buysschaert, F. CFD Modelling and Simulation of PEMFCs in STAR-CCM+. In Proceedings of the 2022 11th International Conference on Renewable Energy Research and Application (ICRERA), Istanbul, Turkey, 18–21 September 2022. [Google Scholar]
- McDonald, A.G.; Magande, H.L. Fundamentals of heat exchanger design. In Introduction to Thermo-Fluids Systems Design; John Wiley & Sons Ltd. Hoboken: Hoboken, NJ, USA, 2012; pp. 127–211. [Google Scholar]
- Dong, J.; Zhang, Y.; Li, G.; Xu, W. Experimental Study of Wavy Fin Aluminum Plate Fin Heat Exchanger. Exp. Heat Transf. 2013, 26, 384–396. [Google Scholar]
- Cui, Y. Numerical Simulation of Enhanced Heat Transfer of Nanofluid in the Cooling Chamber of Internal Combustion Engine; Dalian Jiaotong University: Dalian China, 2016. [Google Scholar]
- Li, Q.; Xuan, Y. Convective heat transfer and flow characteristics of Cu-water nanofluid. Sci. China 2002, 45, 408–416. [Google Scholar]
- Sajadi, A.R.; Kazemi, M.H. Investigation of turbulent convective heat transfer and pressure drop of TiO2/water nanofluid in circular tube. Int. Commun. Heat Mass Transfer. 2011, 38, 1474–1478. [Google Scholar] [CrossRef]
- Huang, D.; Wu, Z.; Sunden, B. Pressure drop and convective heat transfer of Al2O3/water and MWCNT/water nanofluids in a chevron plate heat ex changer. Int. J. Heat Mass Transfer. 2015, 89, 620–626. [Google Scholar] [CrossRef]
Figure 1.
Schematic of the PEMFC engine thermal management system.
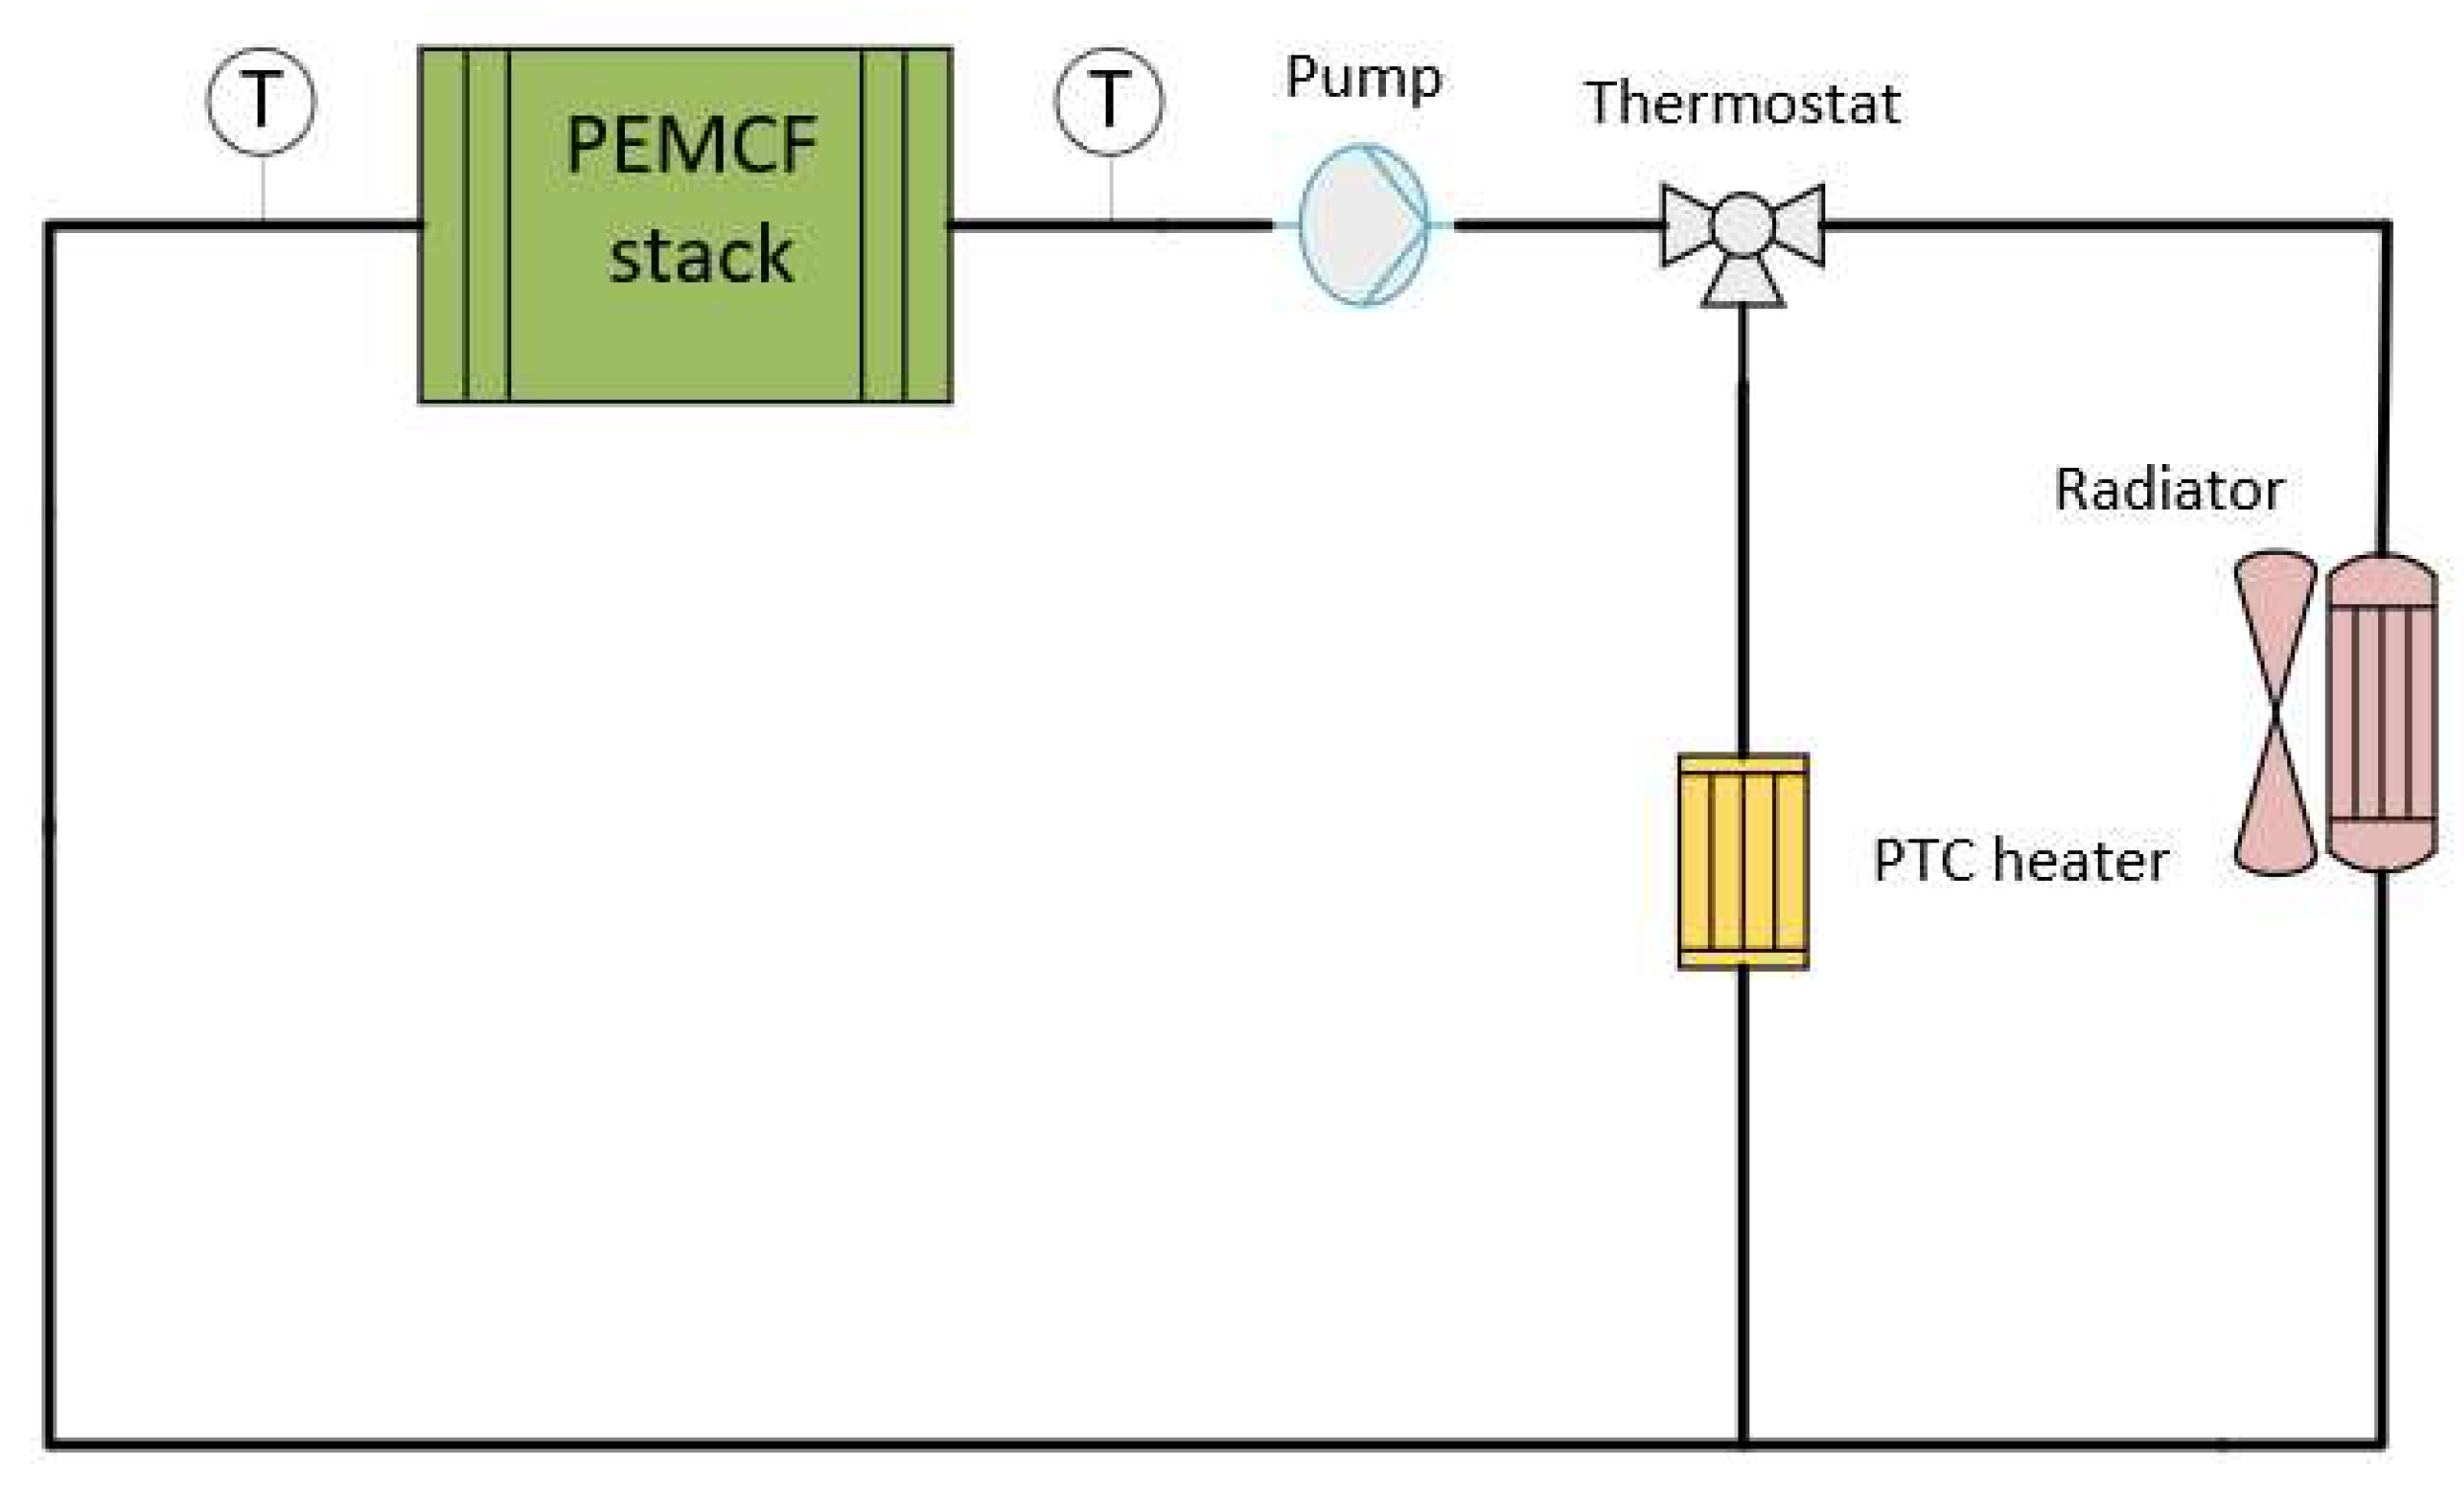
Figure 2.
Geometry parameters of wavy fin.
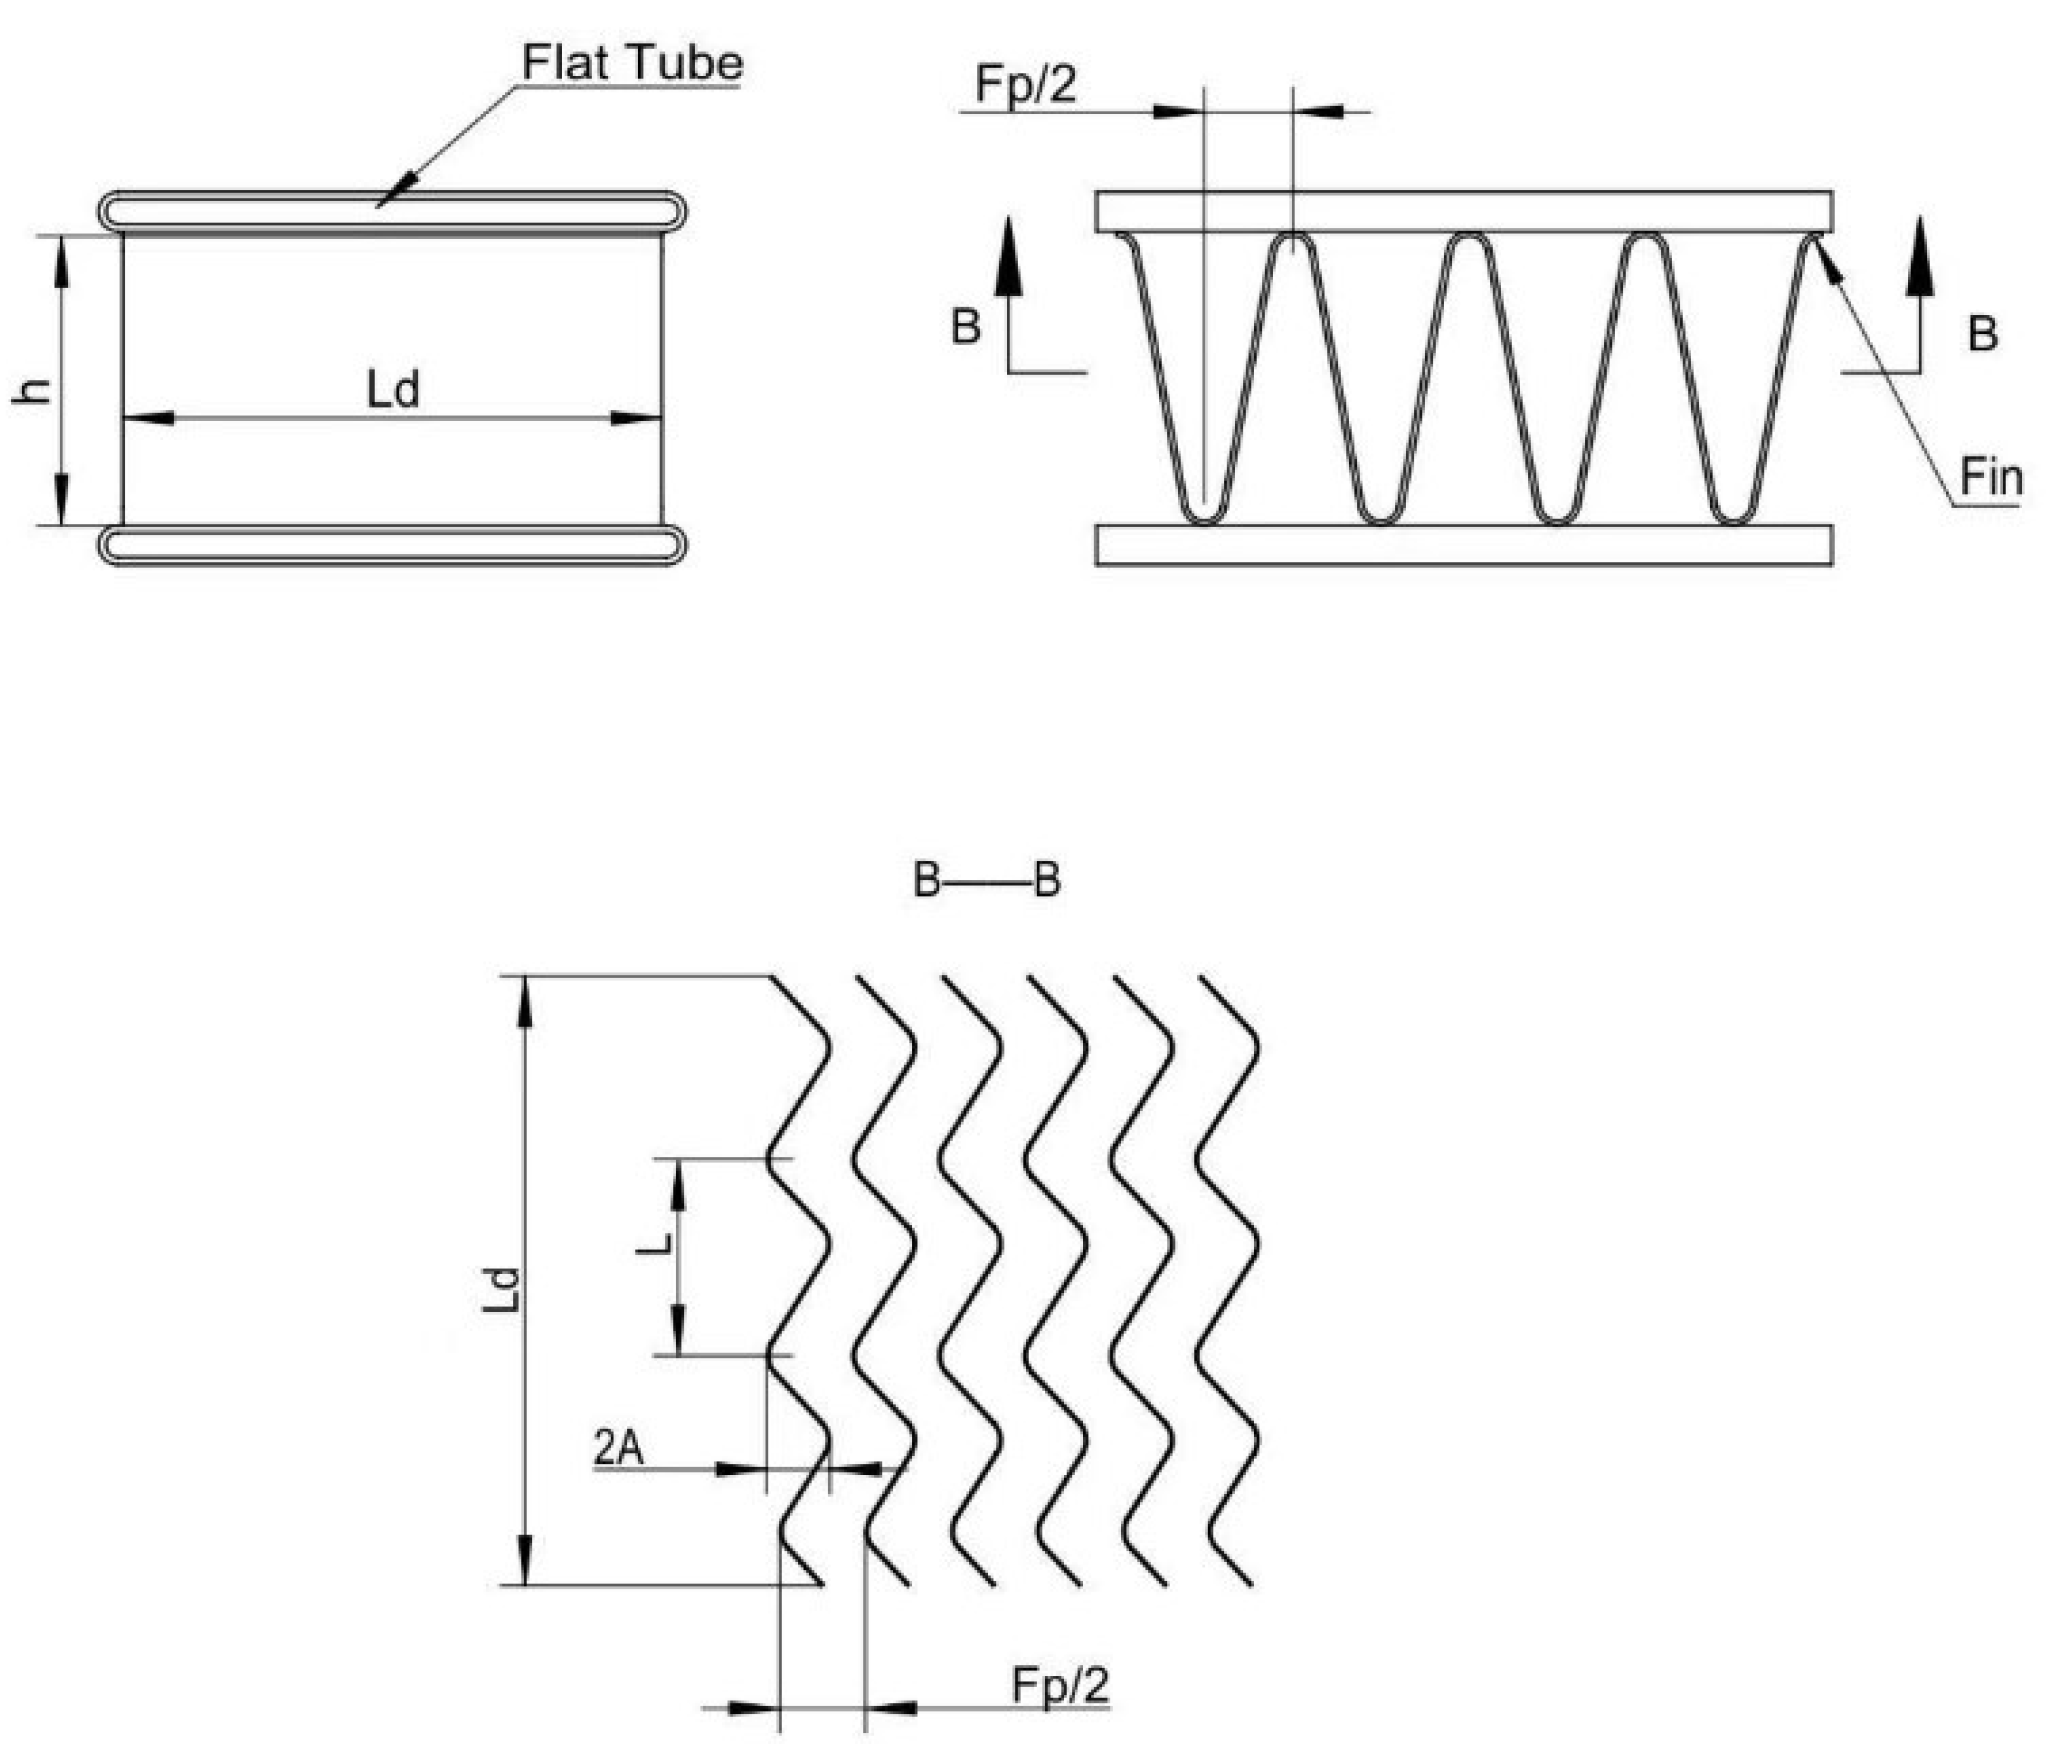
Figure 3.
Structural diagram of the radiator model.
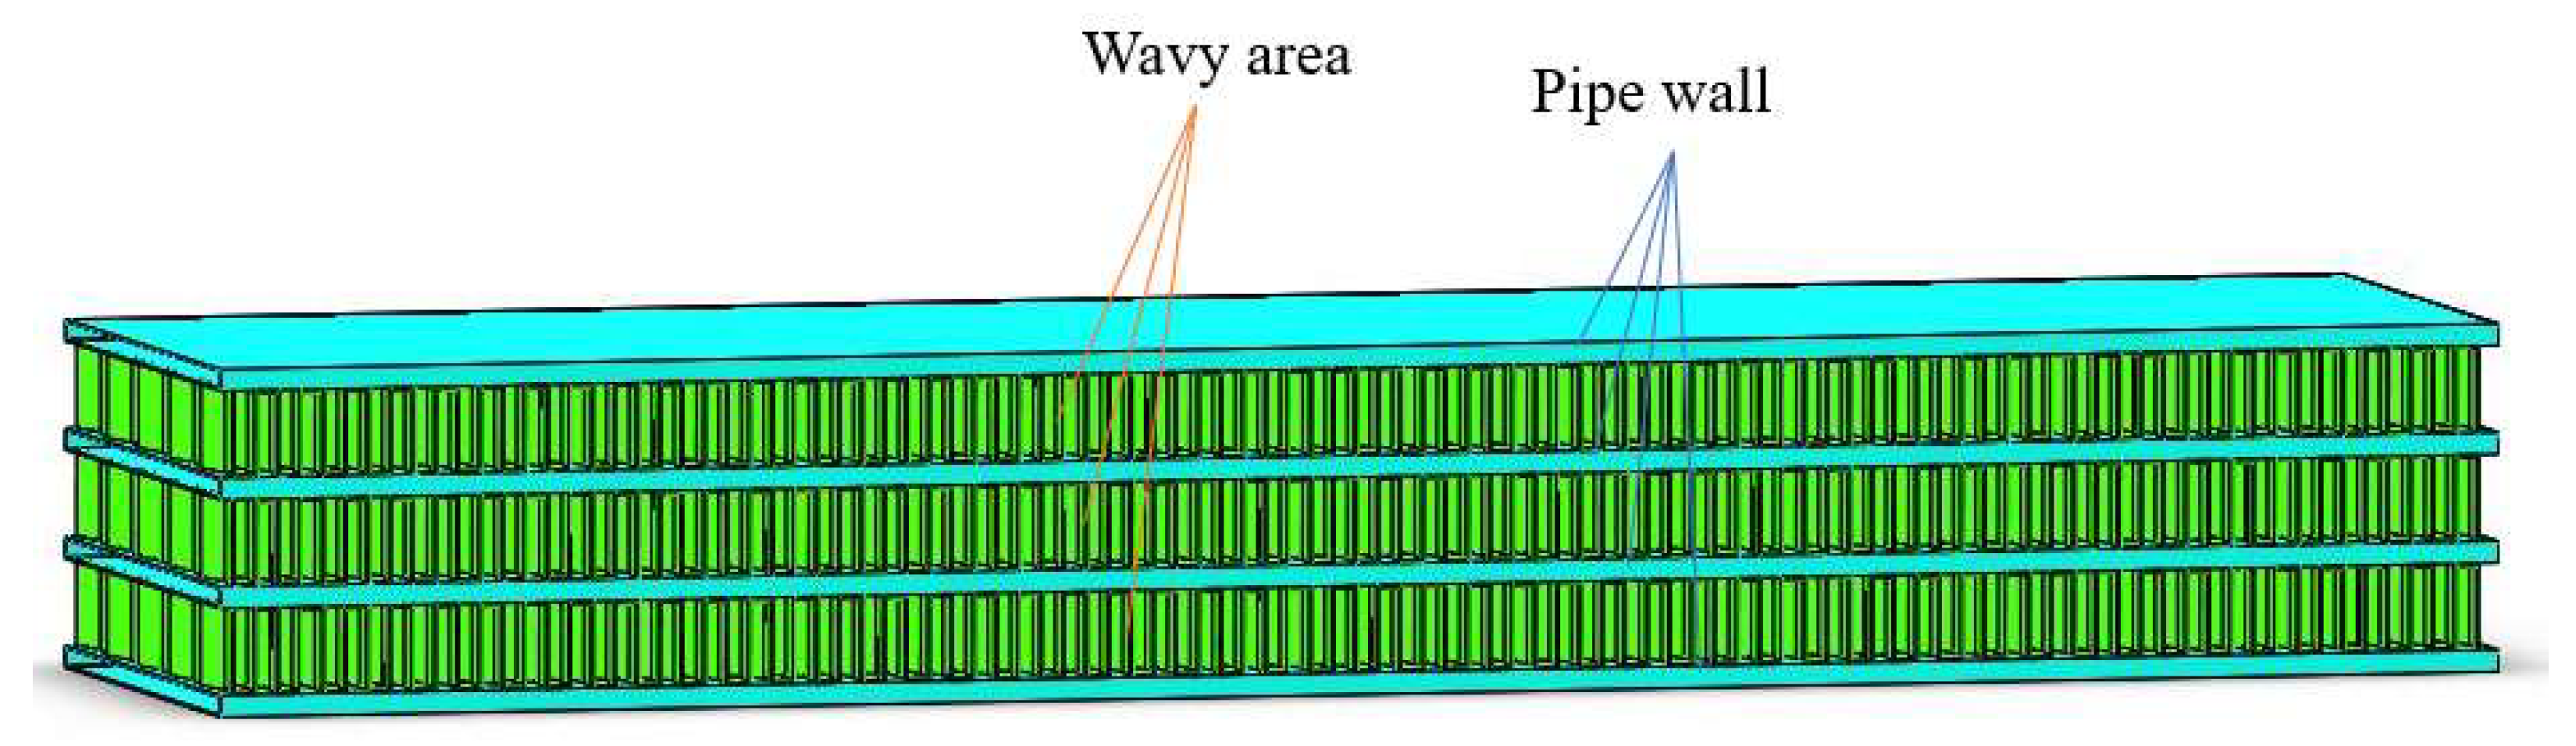
Figure 4.
Model for calculating the parameters of the porous medium model.

Figure 5.
Calculation model of the radiator.
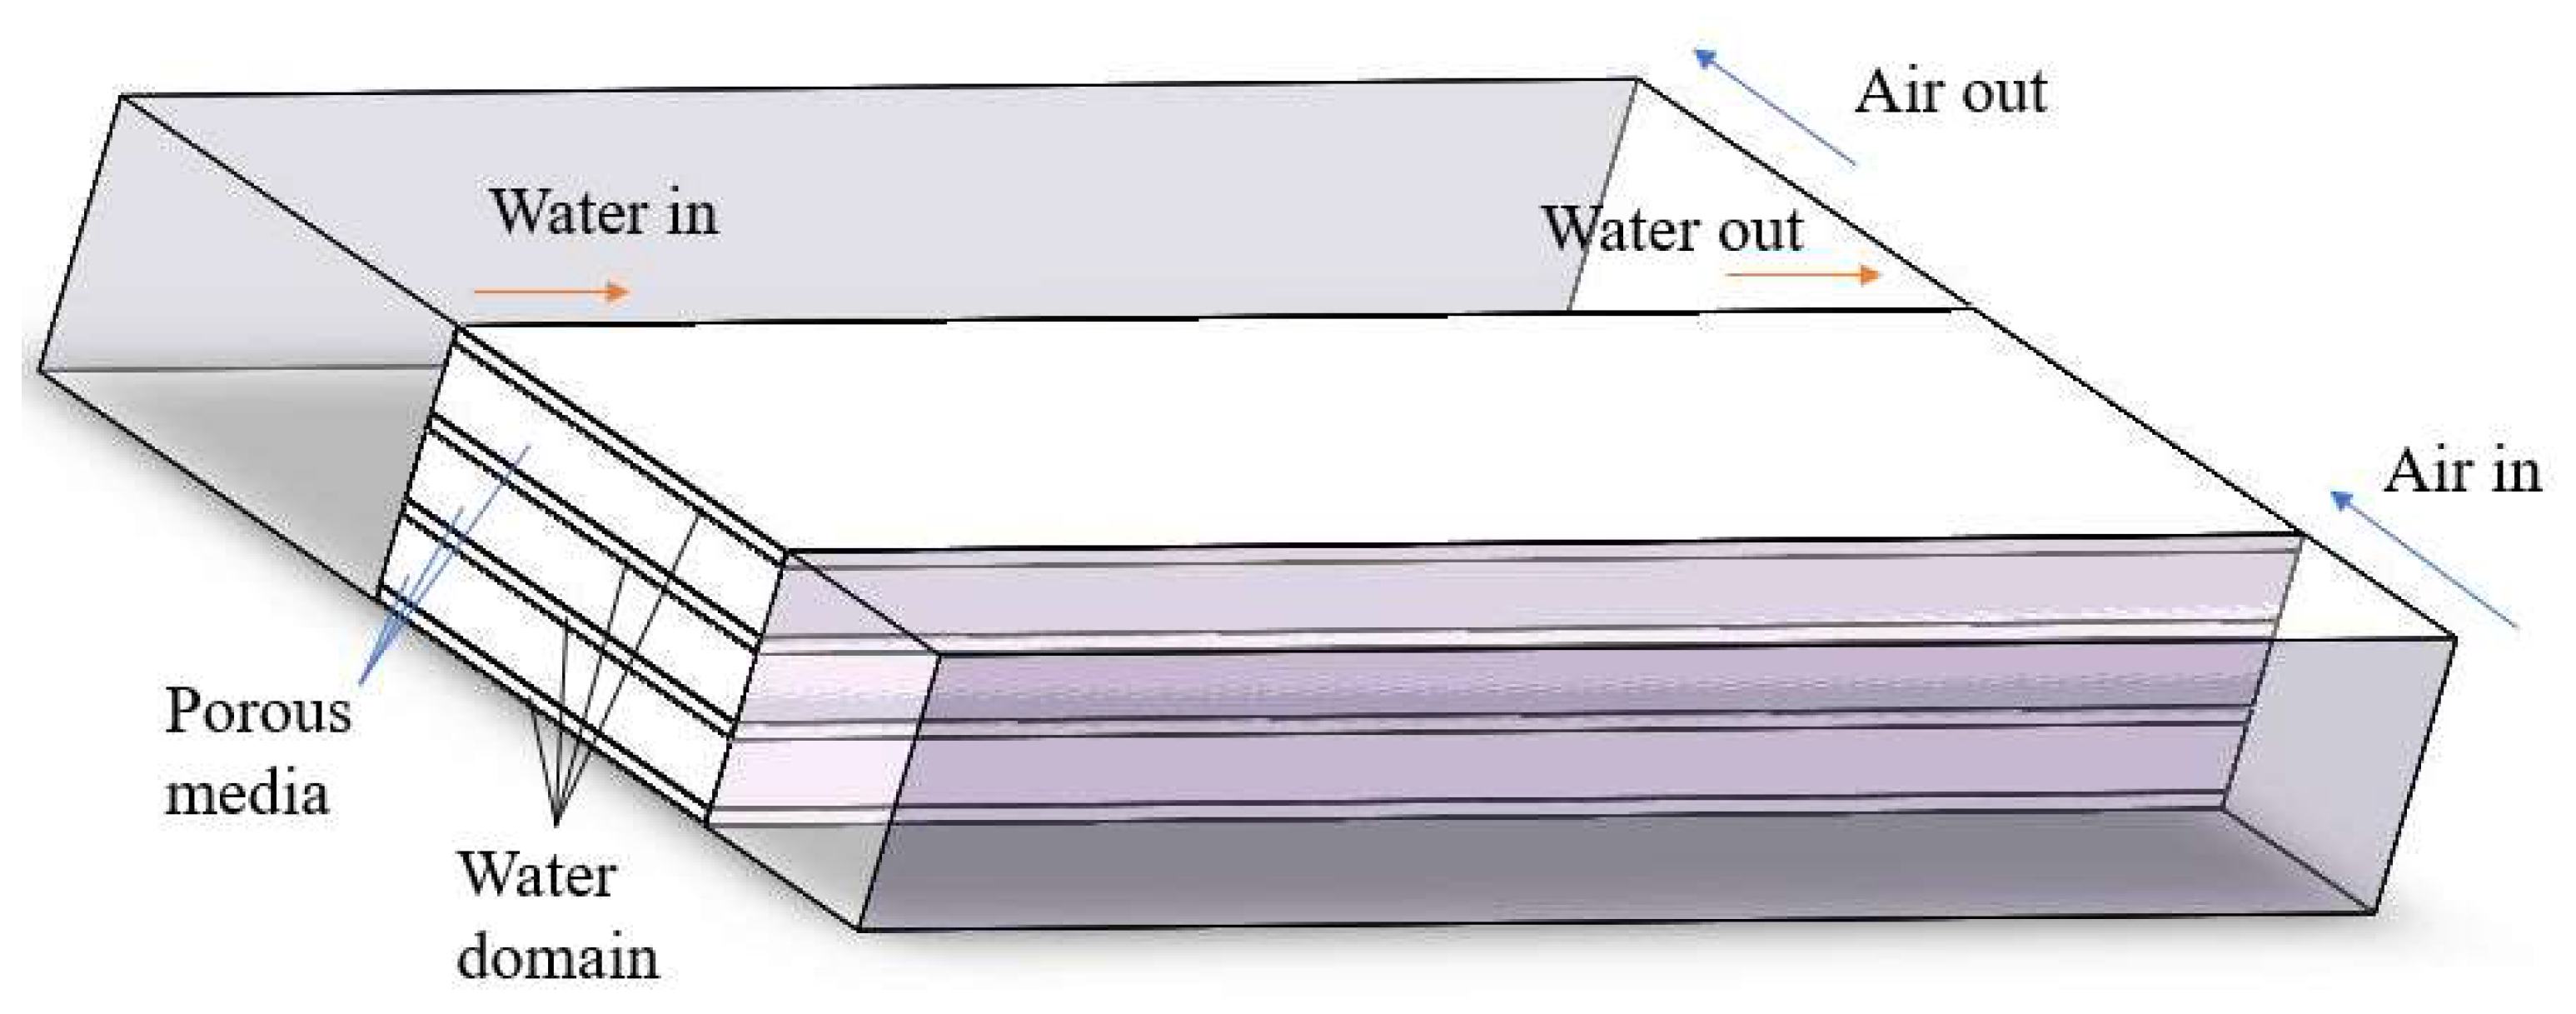
Figure 6.
Fitting curve with pressure drops and velocity.
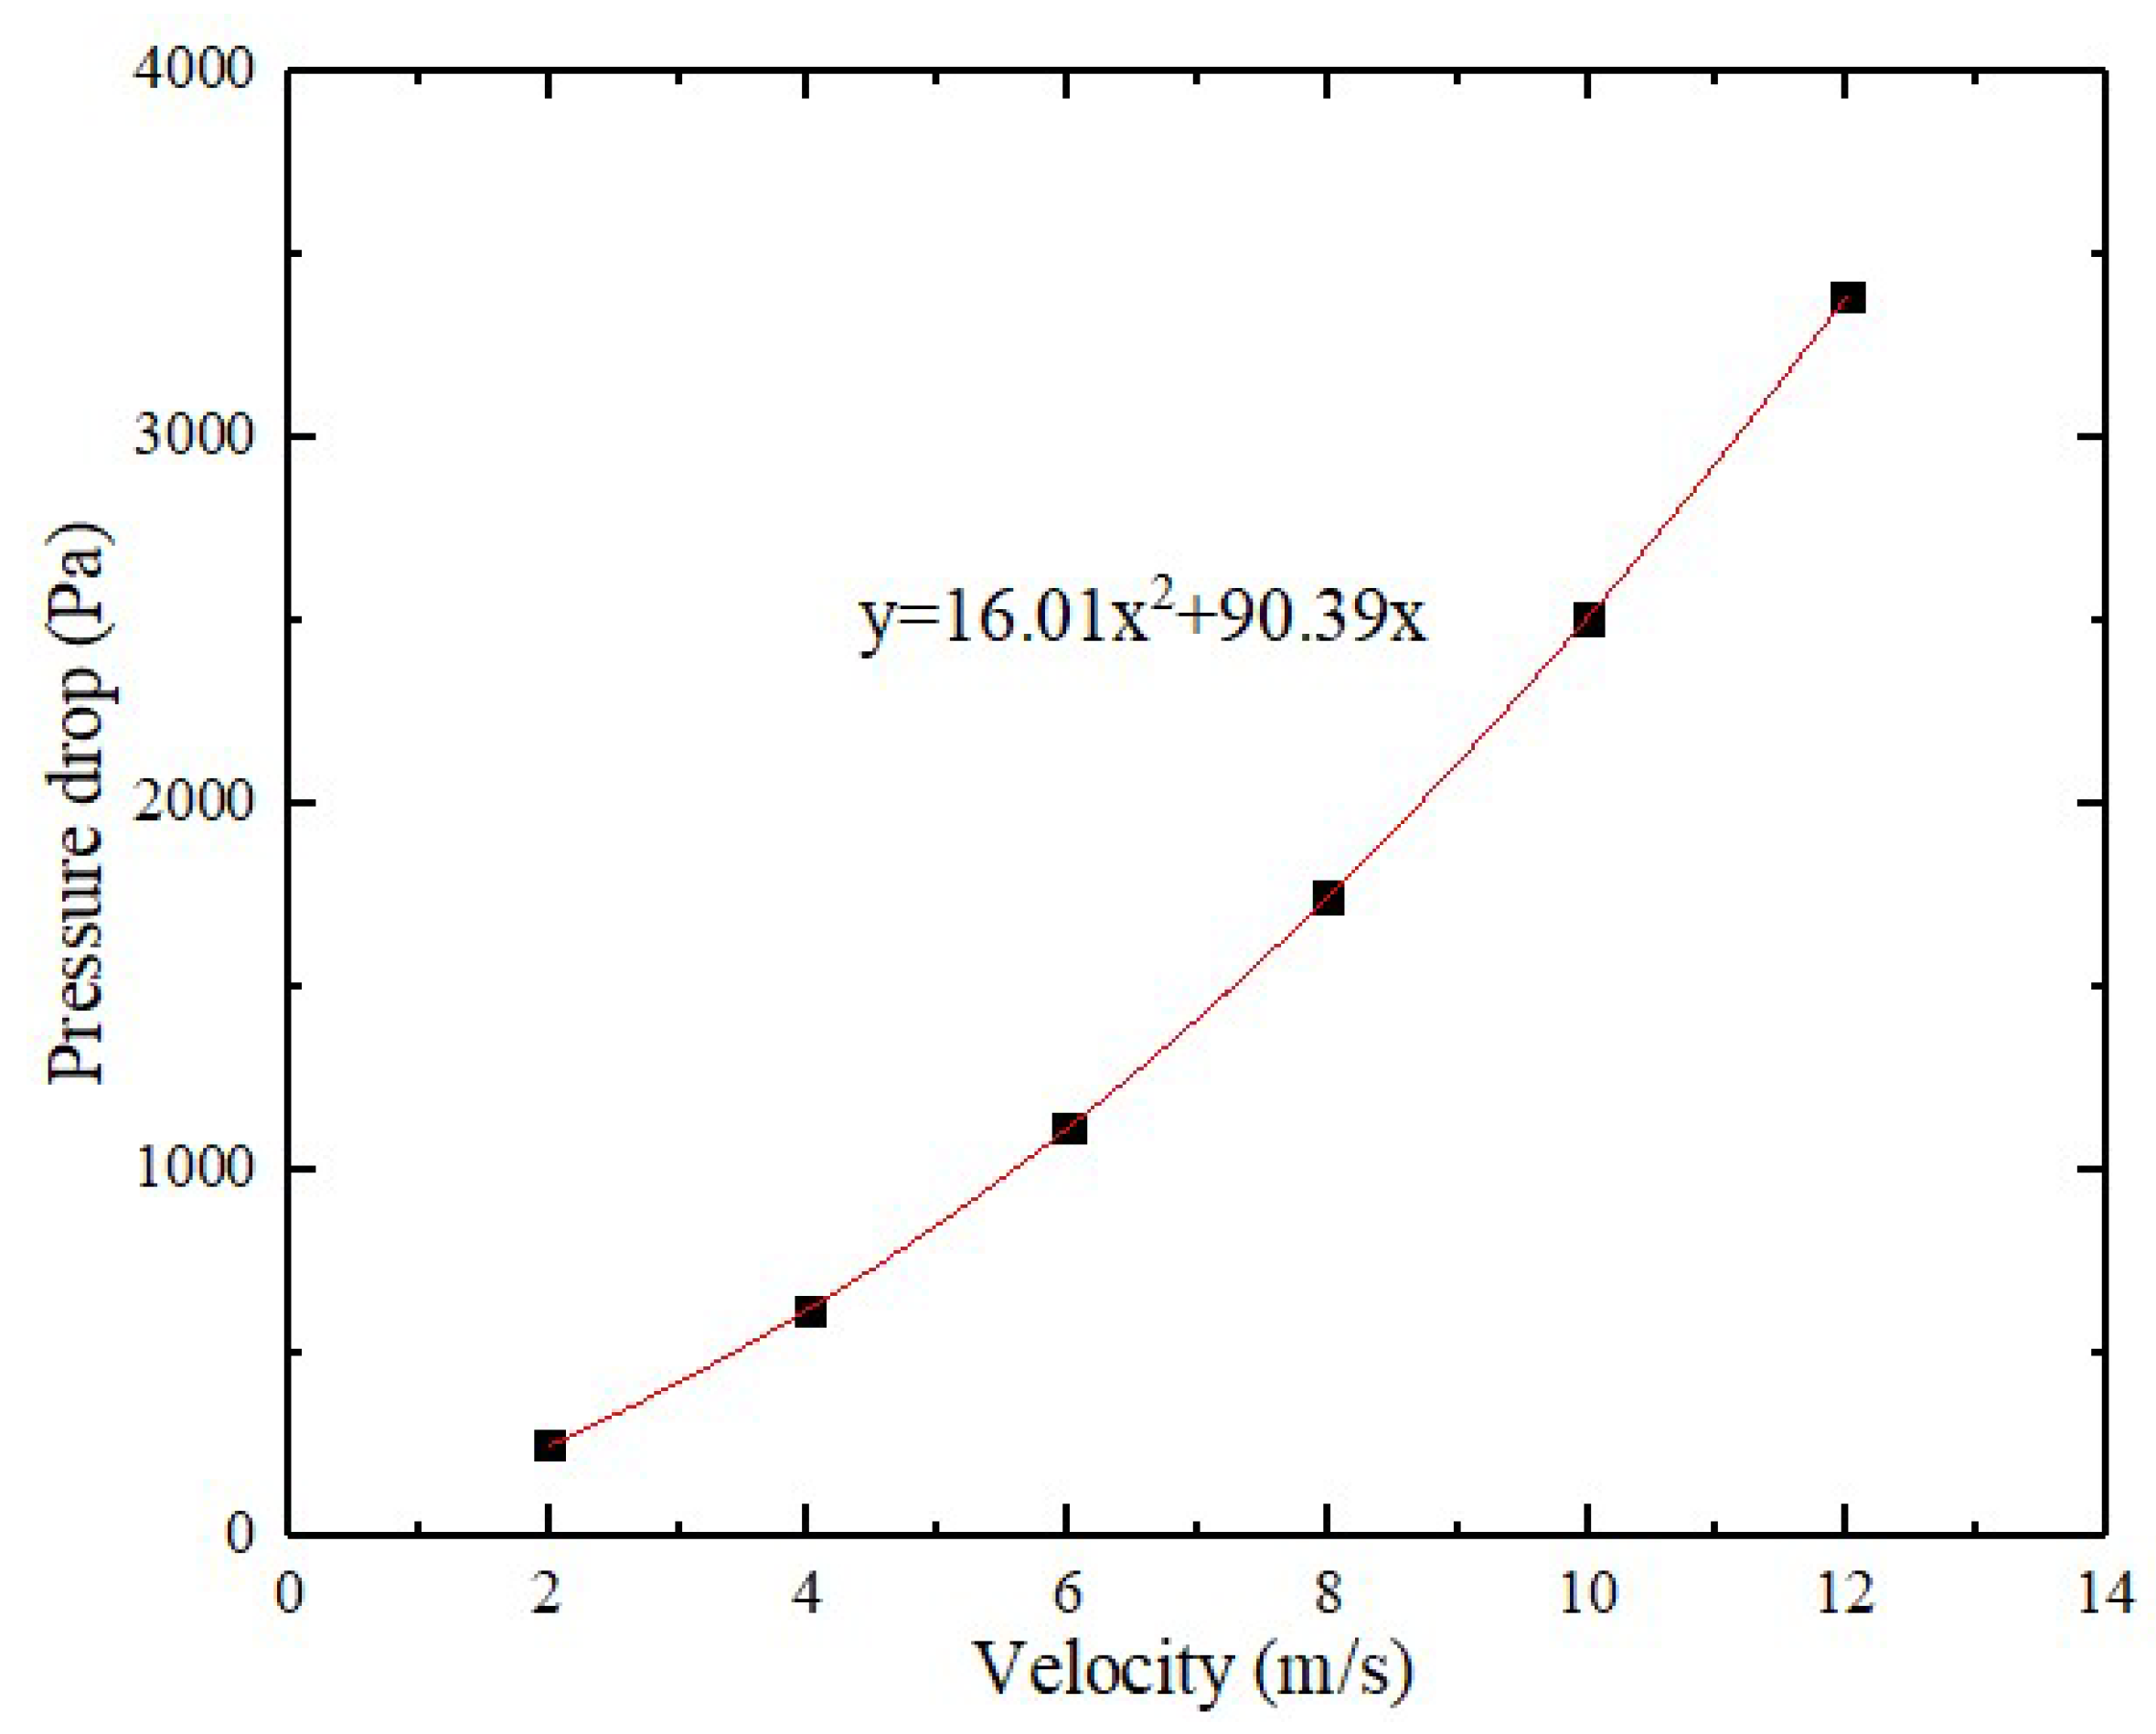
Figure 7.
The model of 1D-3D coupled simulation.

Figure 8.
Comparisons of the pressure drop in different models.
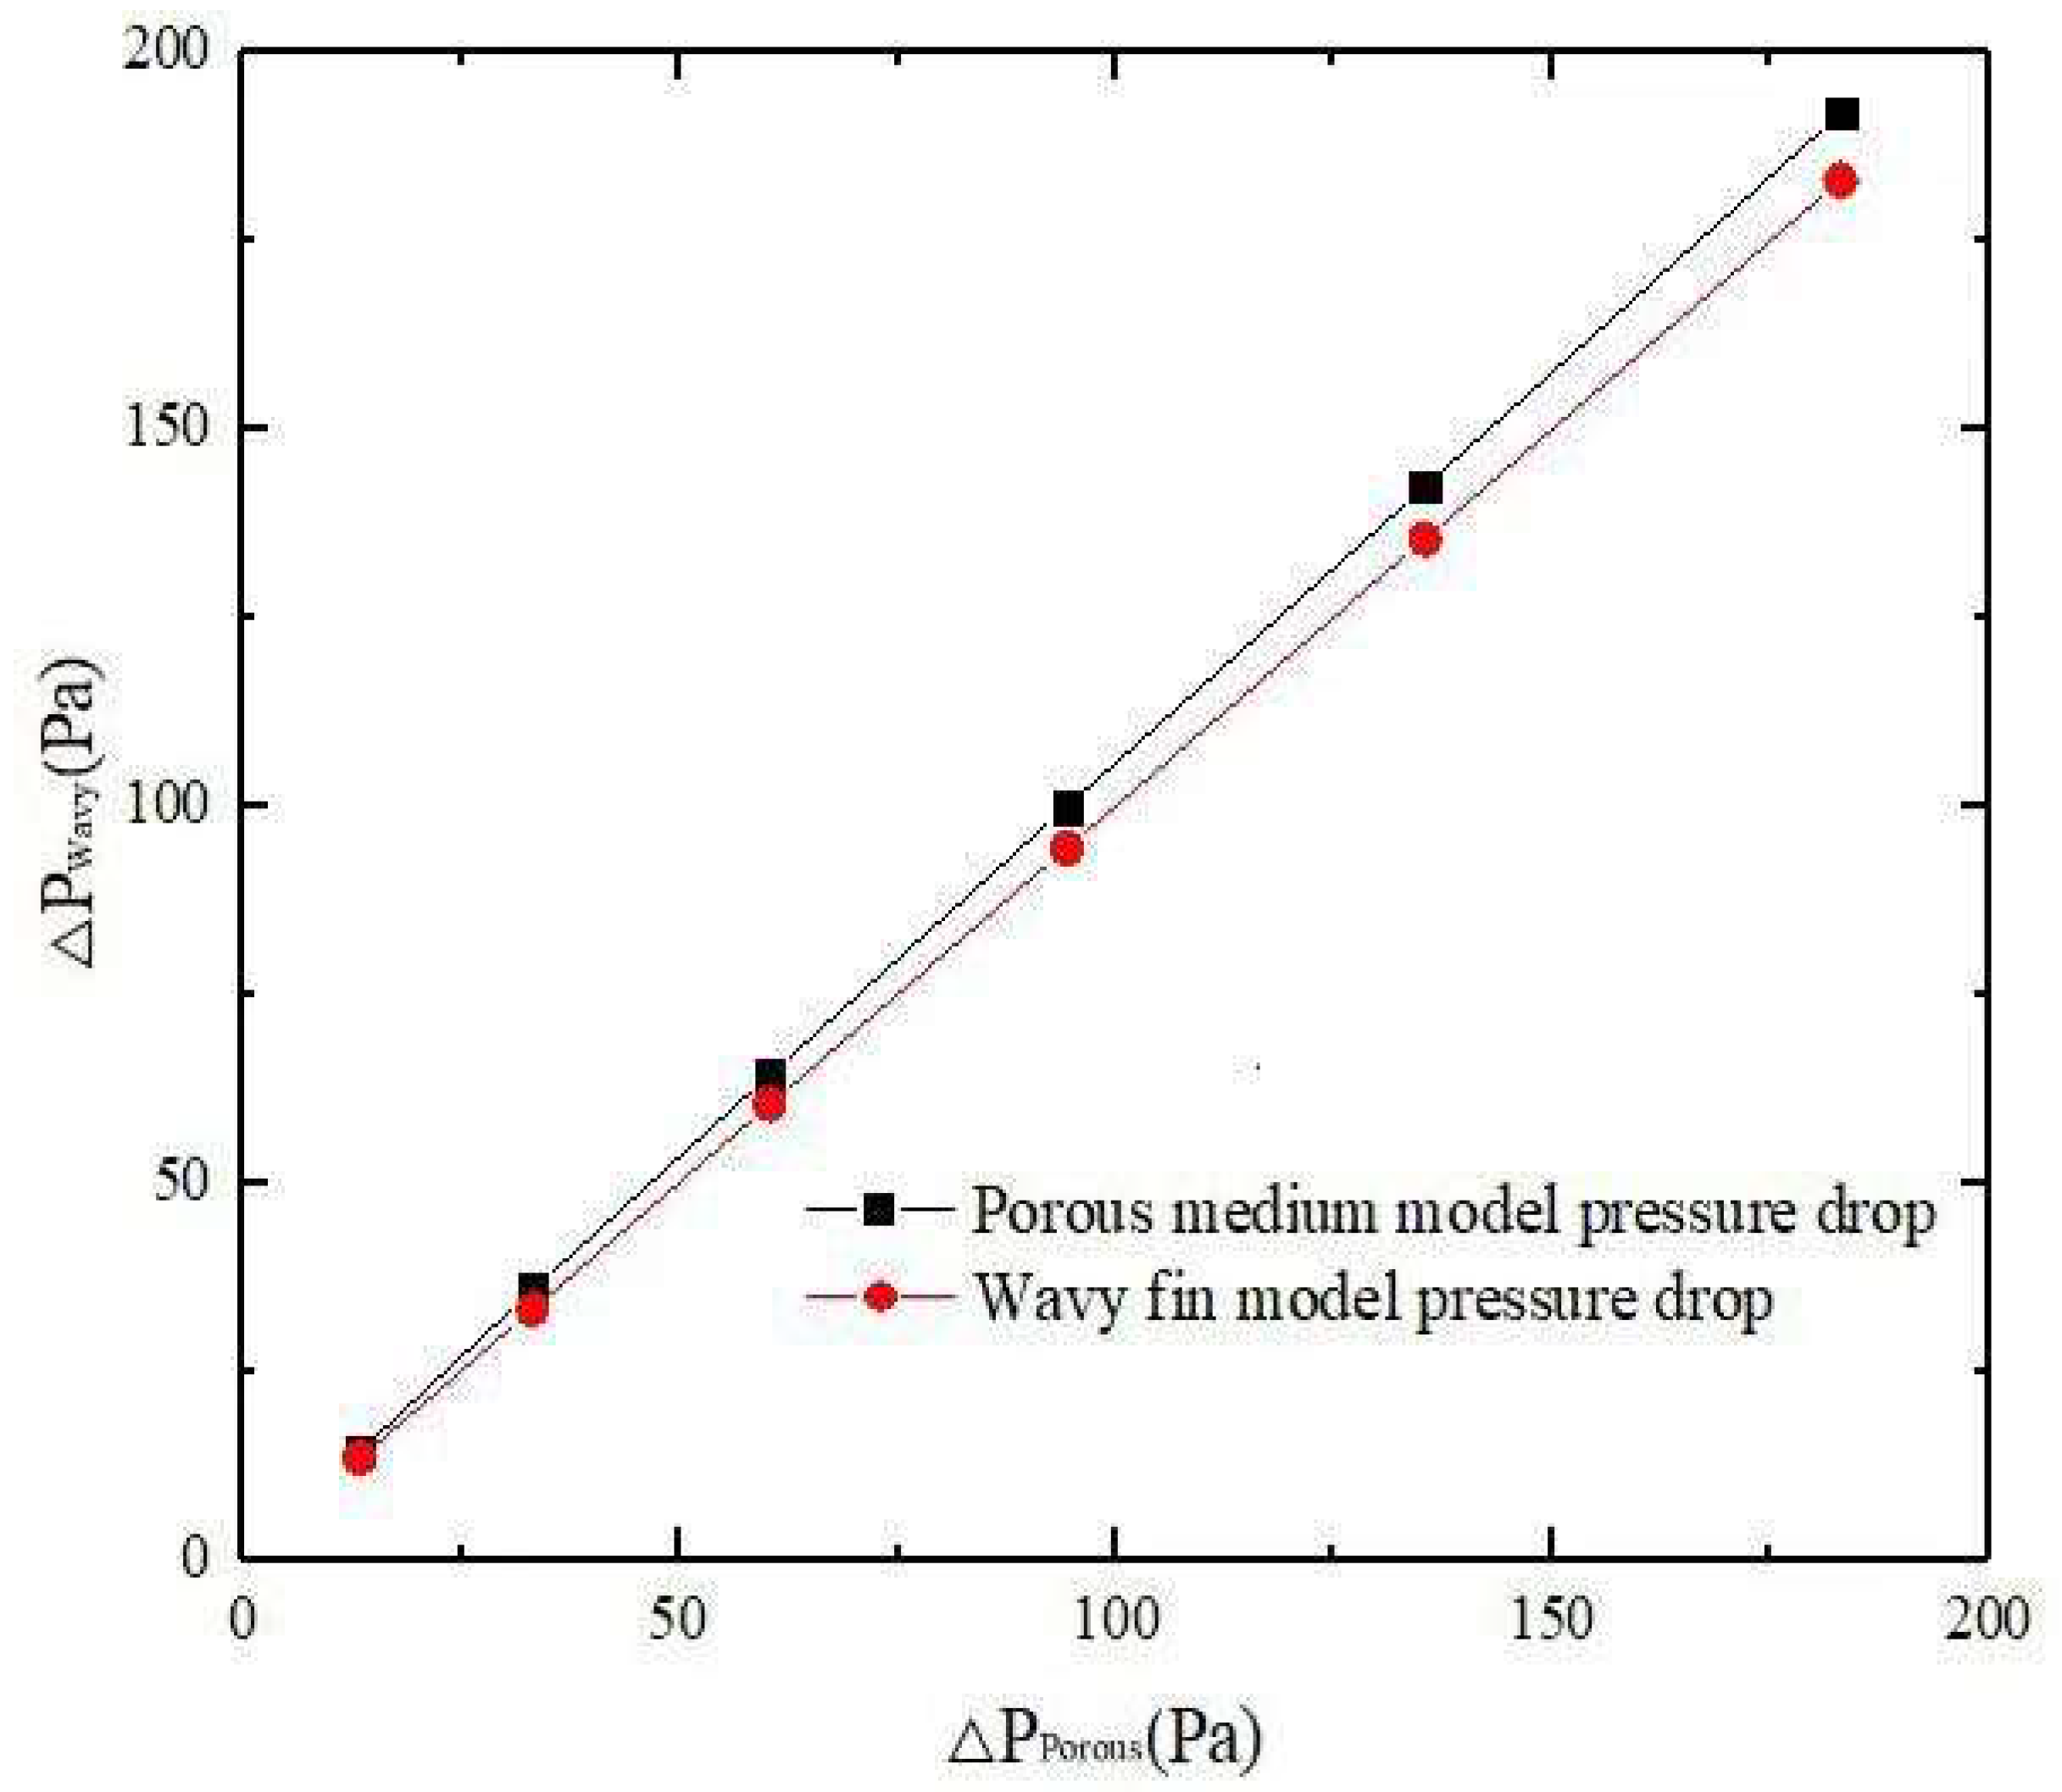
Figure 9.
Comparison of the experimental data with simulation data.

Figure 10.
The amount of heat transfer of different concentrations of nanofluids at different mass flow rates. (a) Al2O3 nanofluid; (b) SiO2 nanofluid; (c) ZnO nanofluid.
Figure 10.
The amount of heat transfer of different concentrations of nanofluids at different mass flow rates. (a) Al2O3 nanofluid; (b) SiO2 nanofluid; (c) ZnO nanofluid.
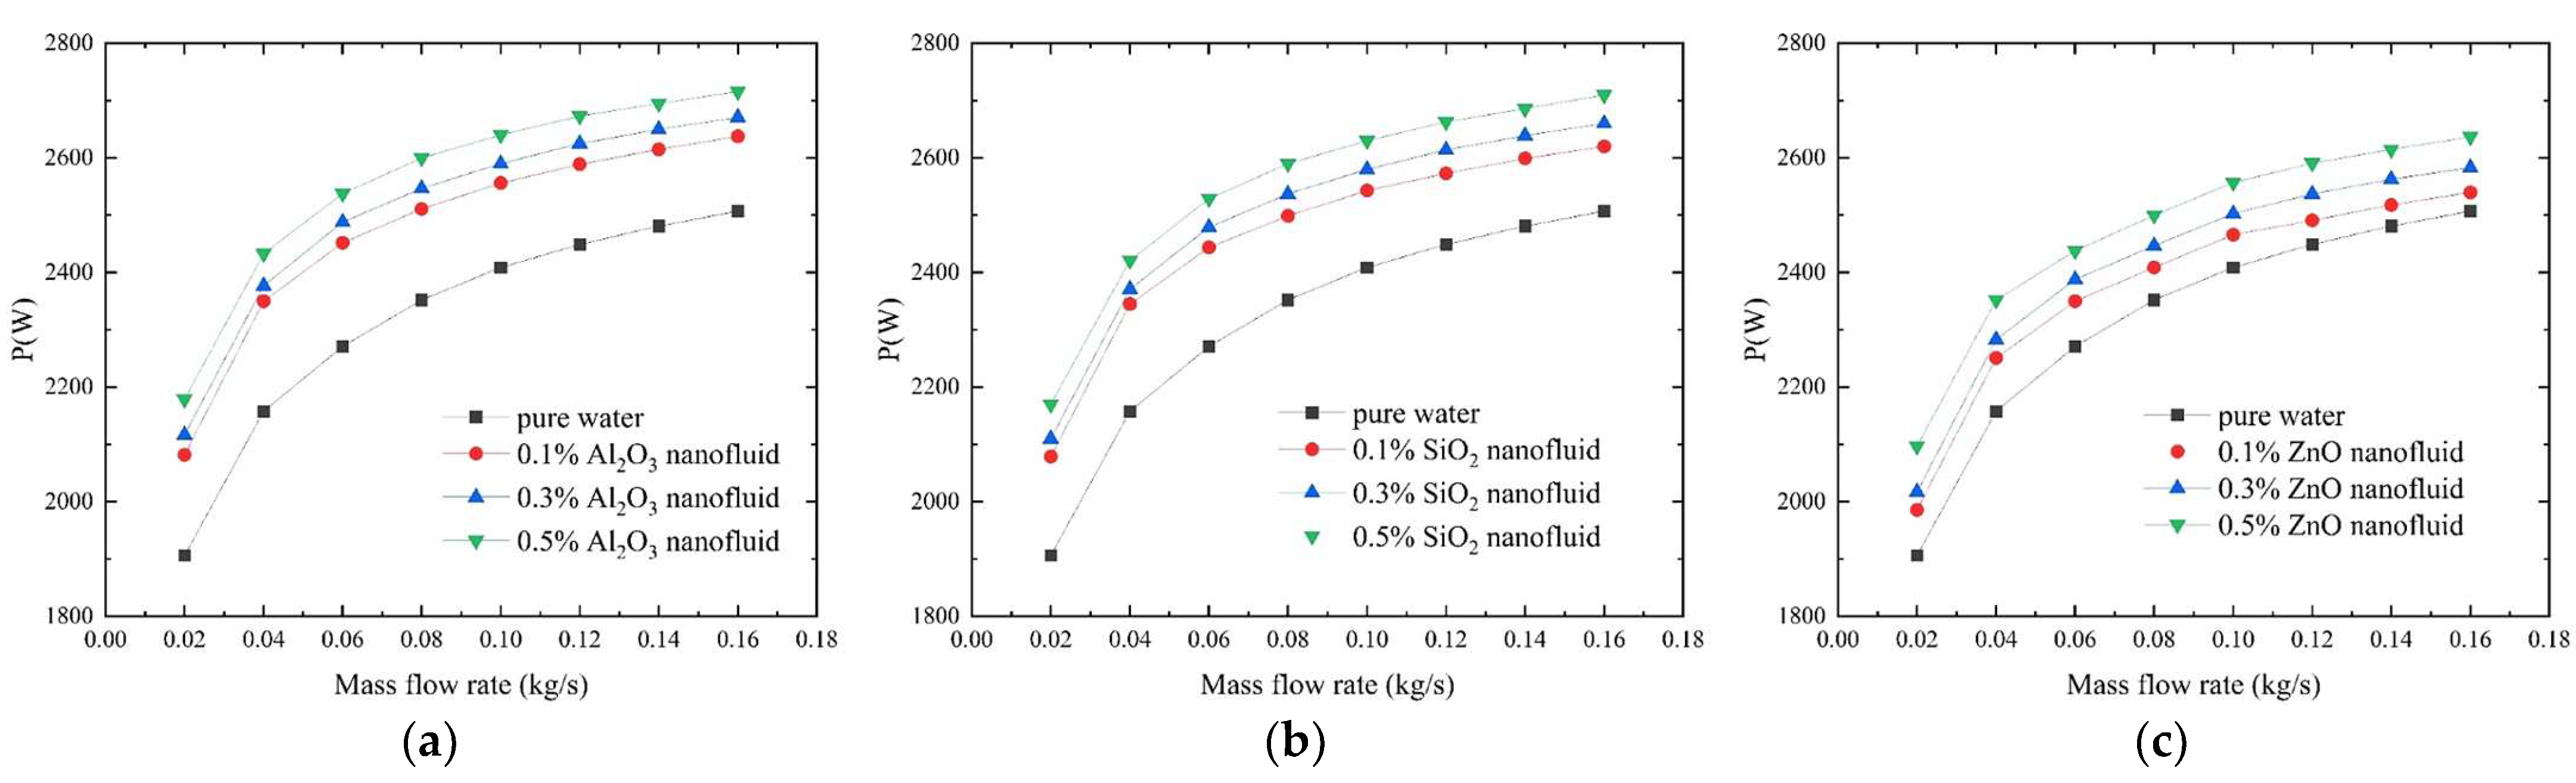
Figure 11.
Reduction of the frontal area of the radiator by different concentrations of nanofluid at variable mass flow rates. (a) Al2O3 nanofluid; (b) SiO2 nanofluid; (c) ZnO nanofluid.
Figure 11.
Reduction of the frontal area of the radiator by different concentrations of nanofluid at variable mass flow rates. (a) Al2O3 nanofluid; (b) SiO2 nanofluid; (c) ZnO nanofluid.

Figure 12.
Coolant pressure drop at different concentrations of nanofluid and variable mass flow rates. (a) Al2O3 nanofluid; (b) SiO2 nanofluid; (c) ZnO nanofluid.
Figure 12.
Coolant pressure drop at different concentrations of nanofluid and variable mass flow rates. (a) Al2O3 nanofluid; (b) SiO2 nanofluid; (c) ZnO nanofluid.

Figure 13.
Effect of using nanofluid as a coolant on stack inlet and outlet temperatures.
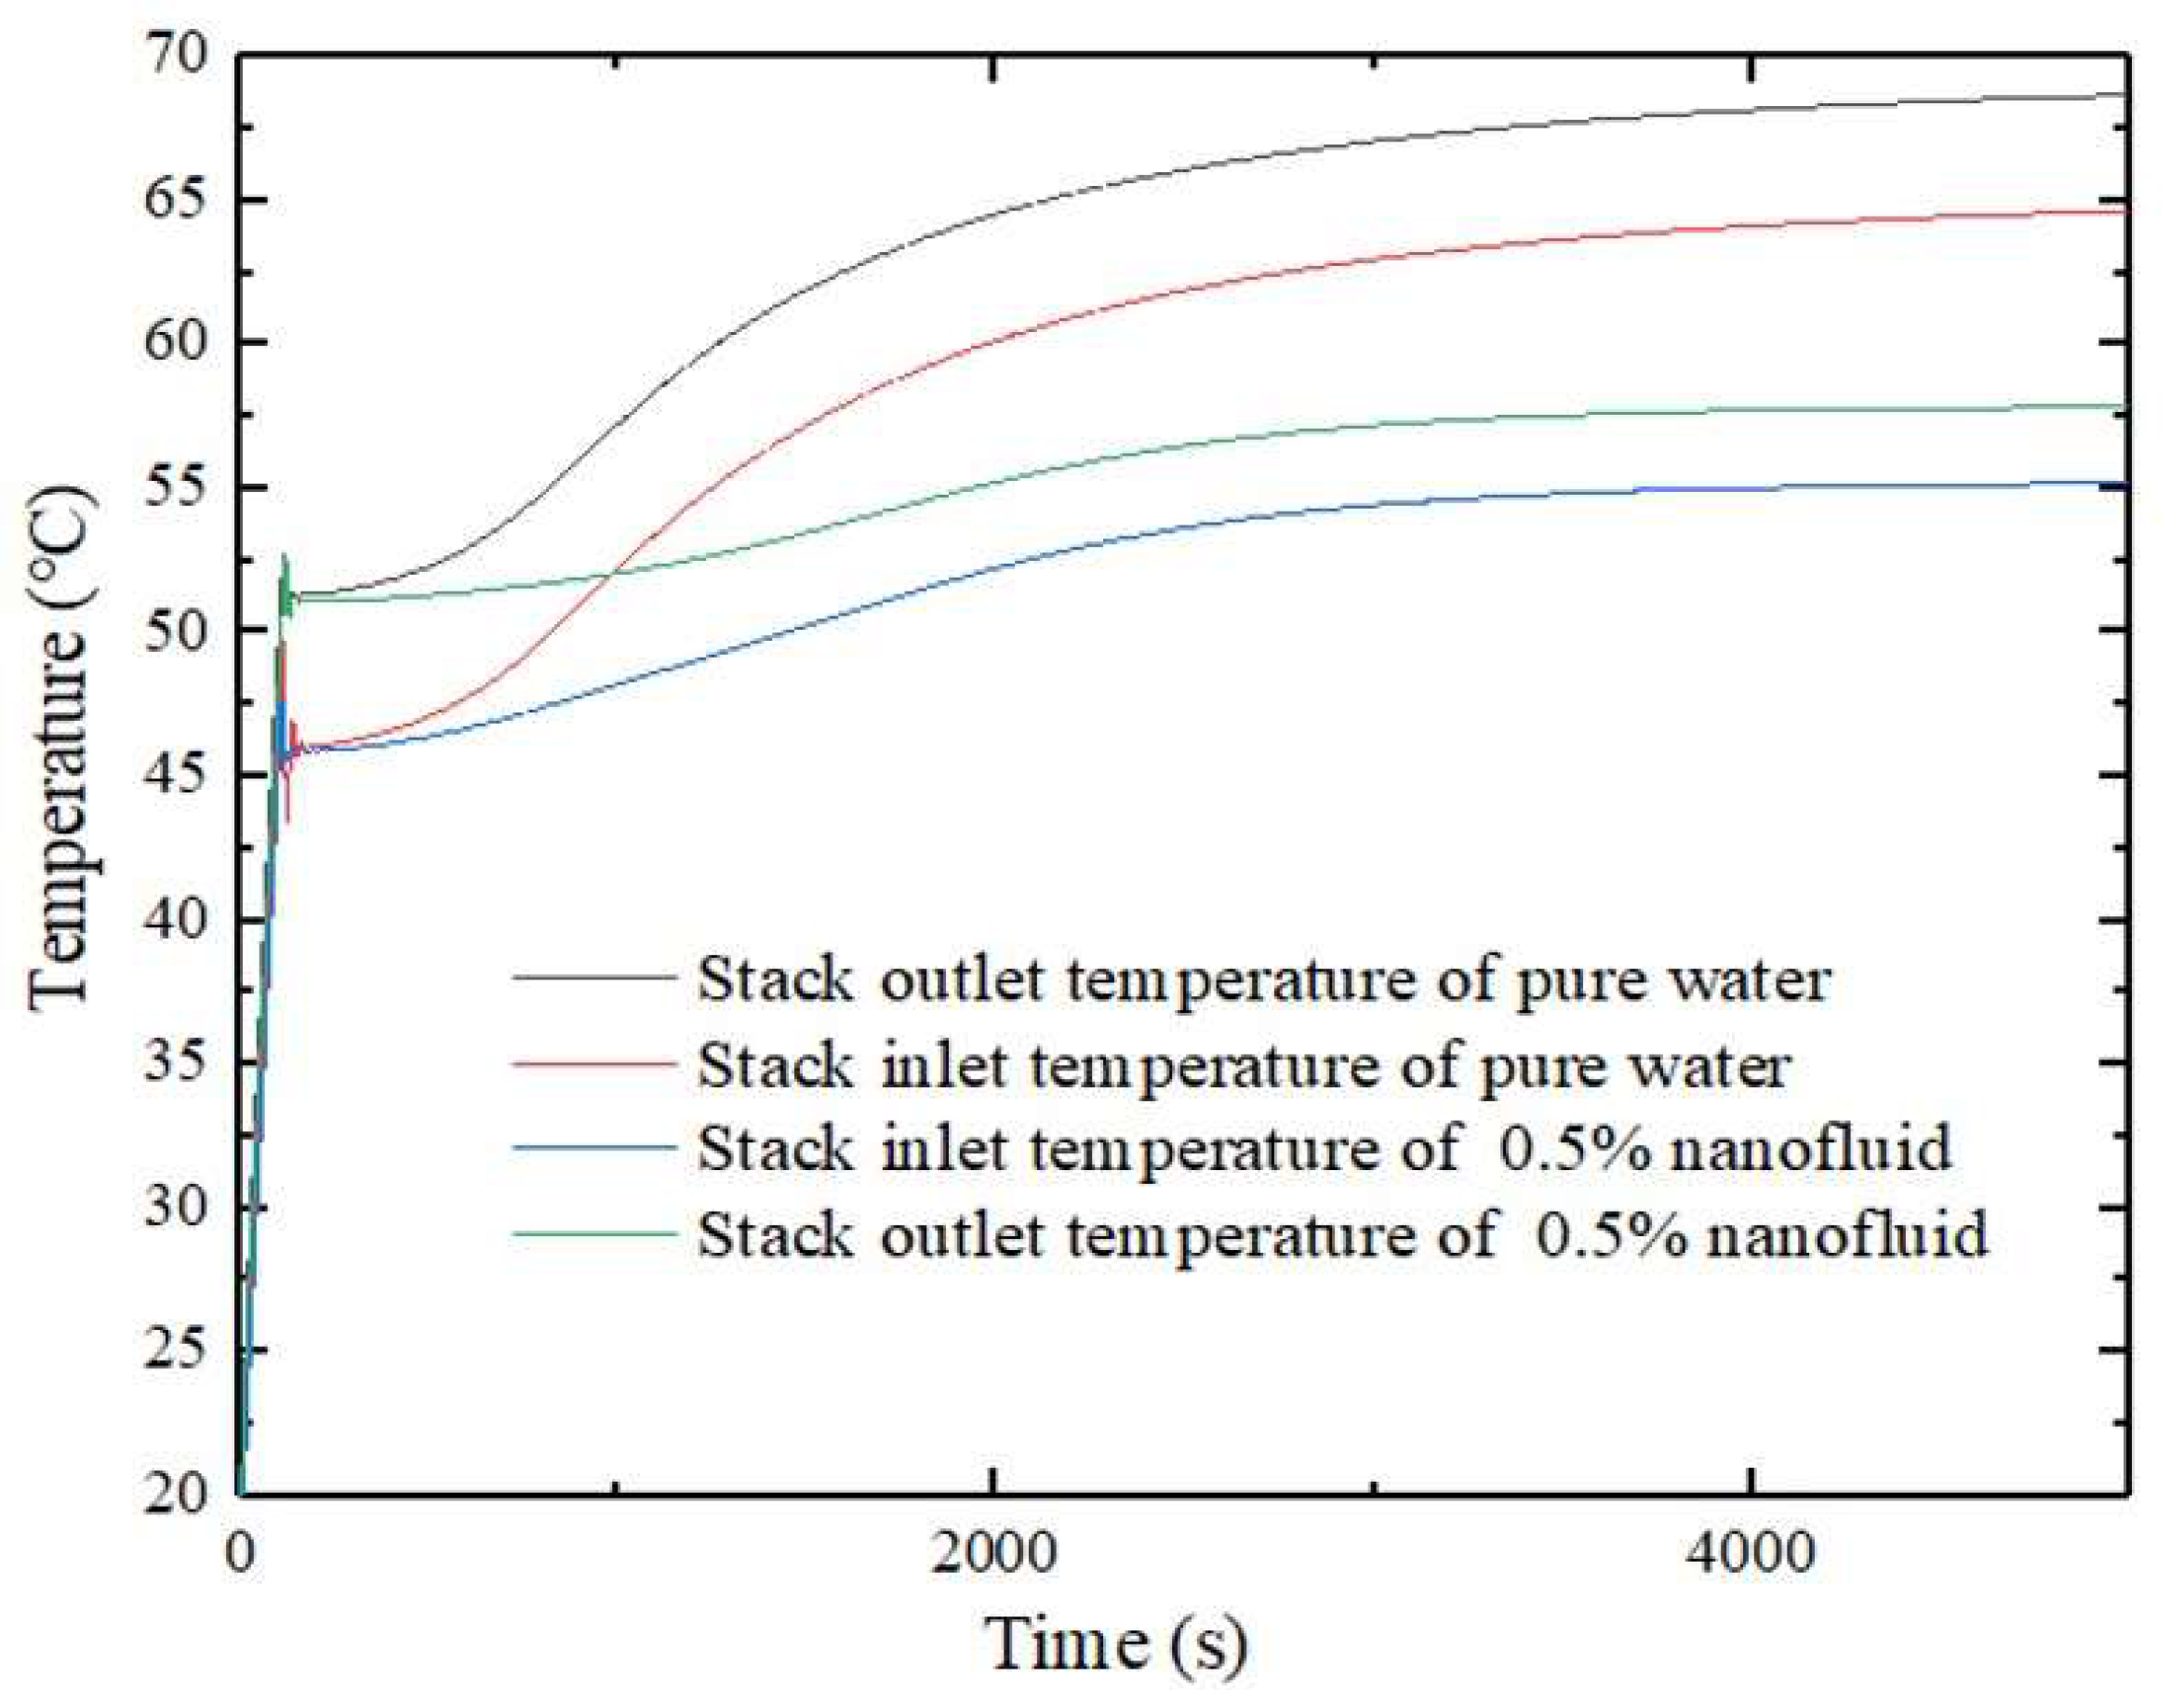
Figure 14.
Effect of fin pitch on radiator’s cooling power.
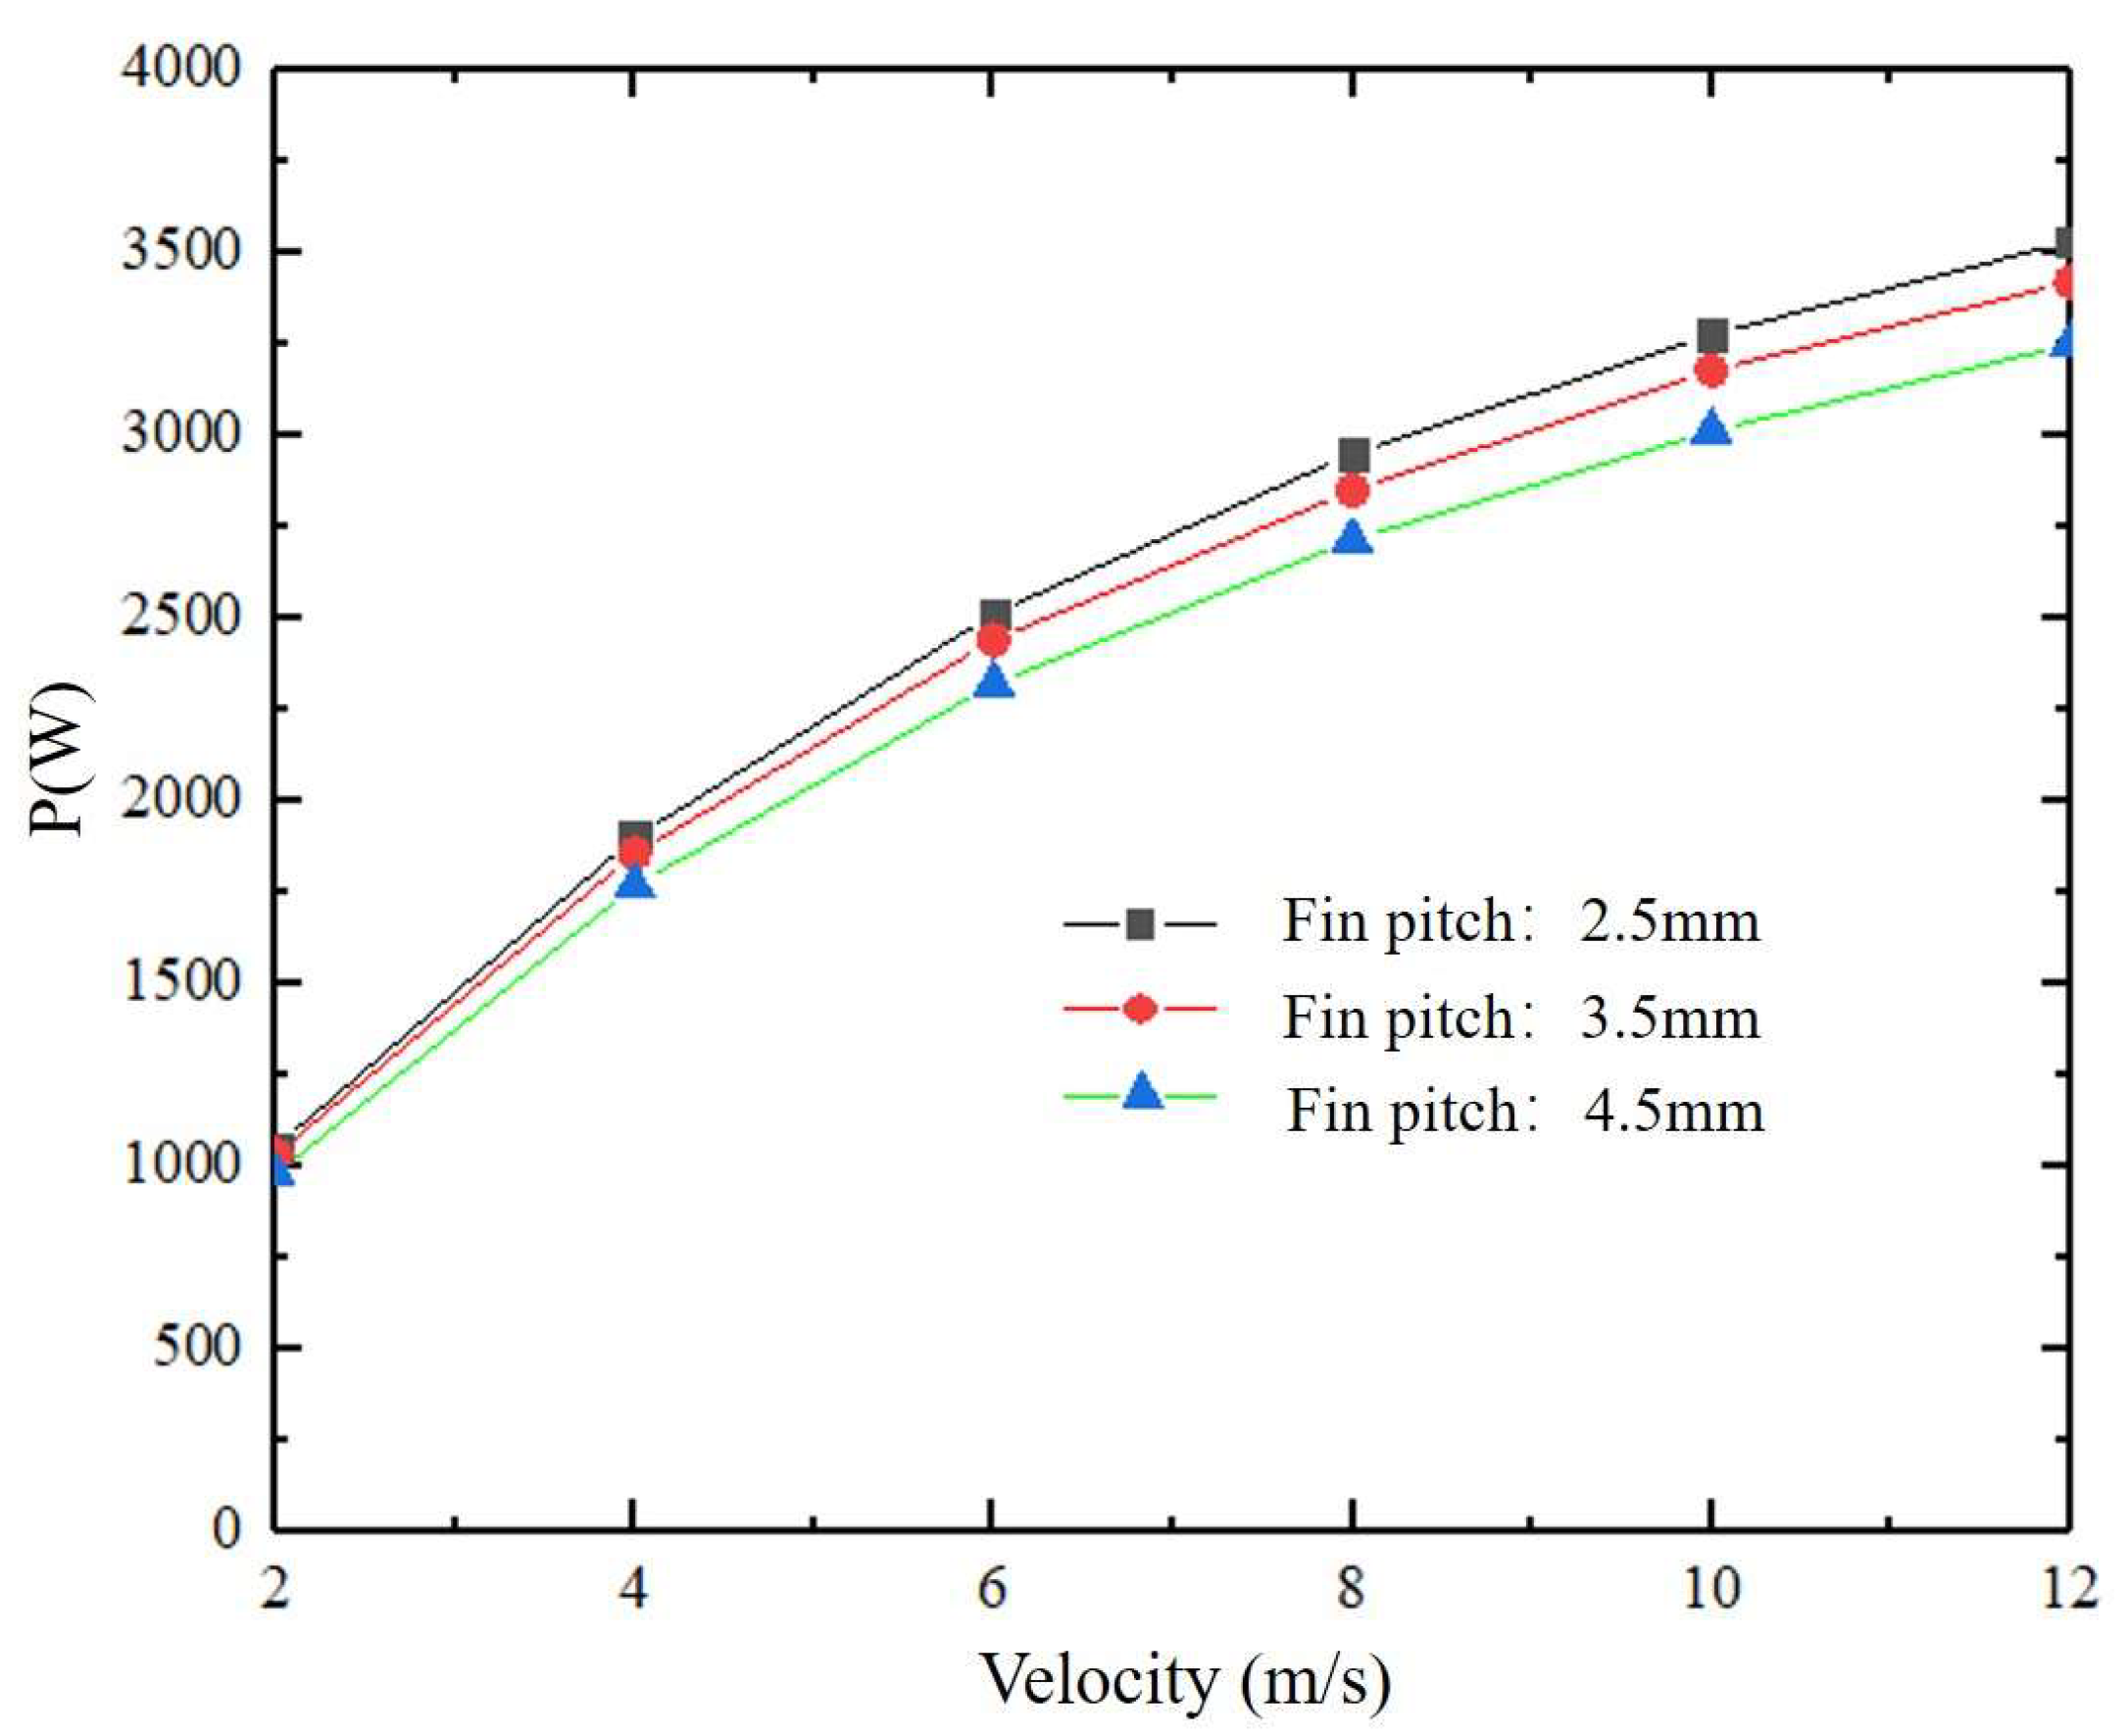
Figure 15.
Effect of fin wave amplitude on radiator’s cooling power.
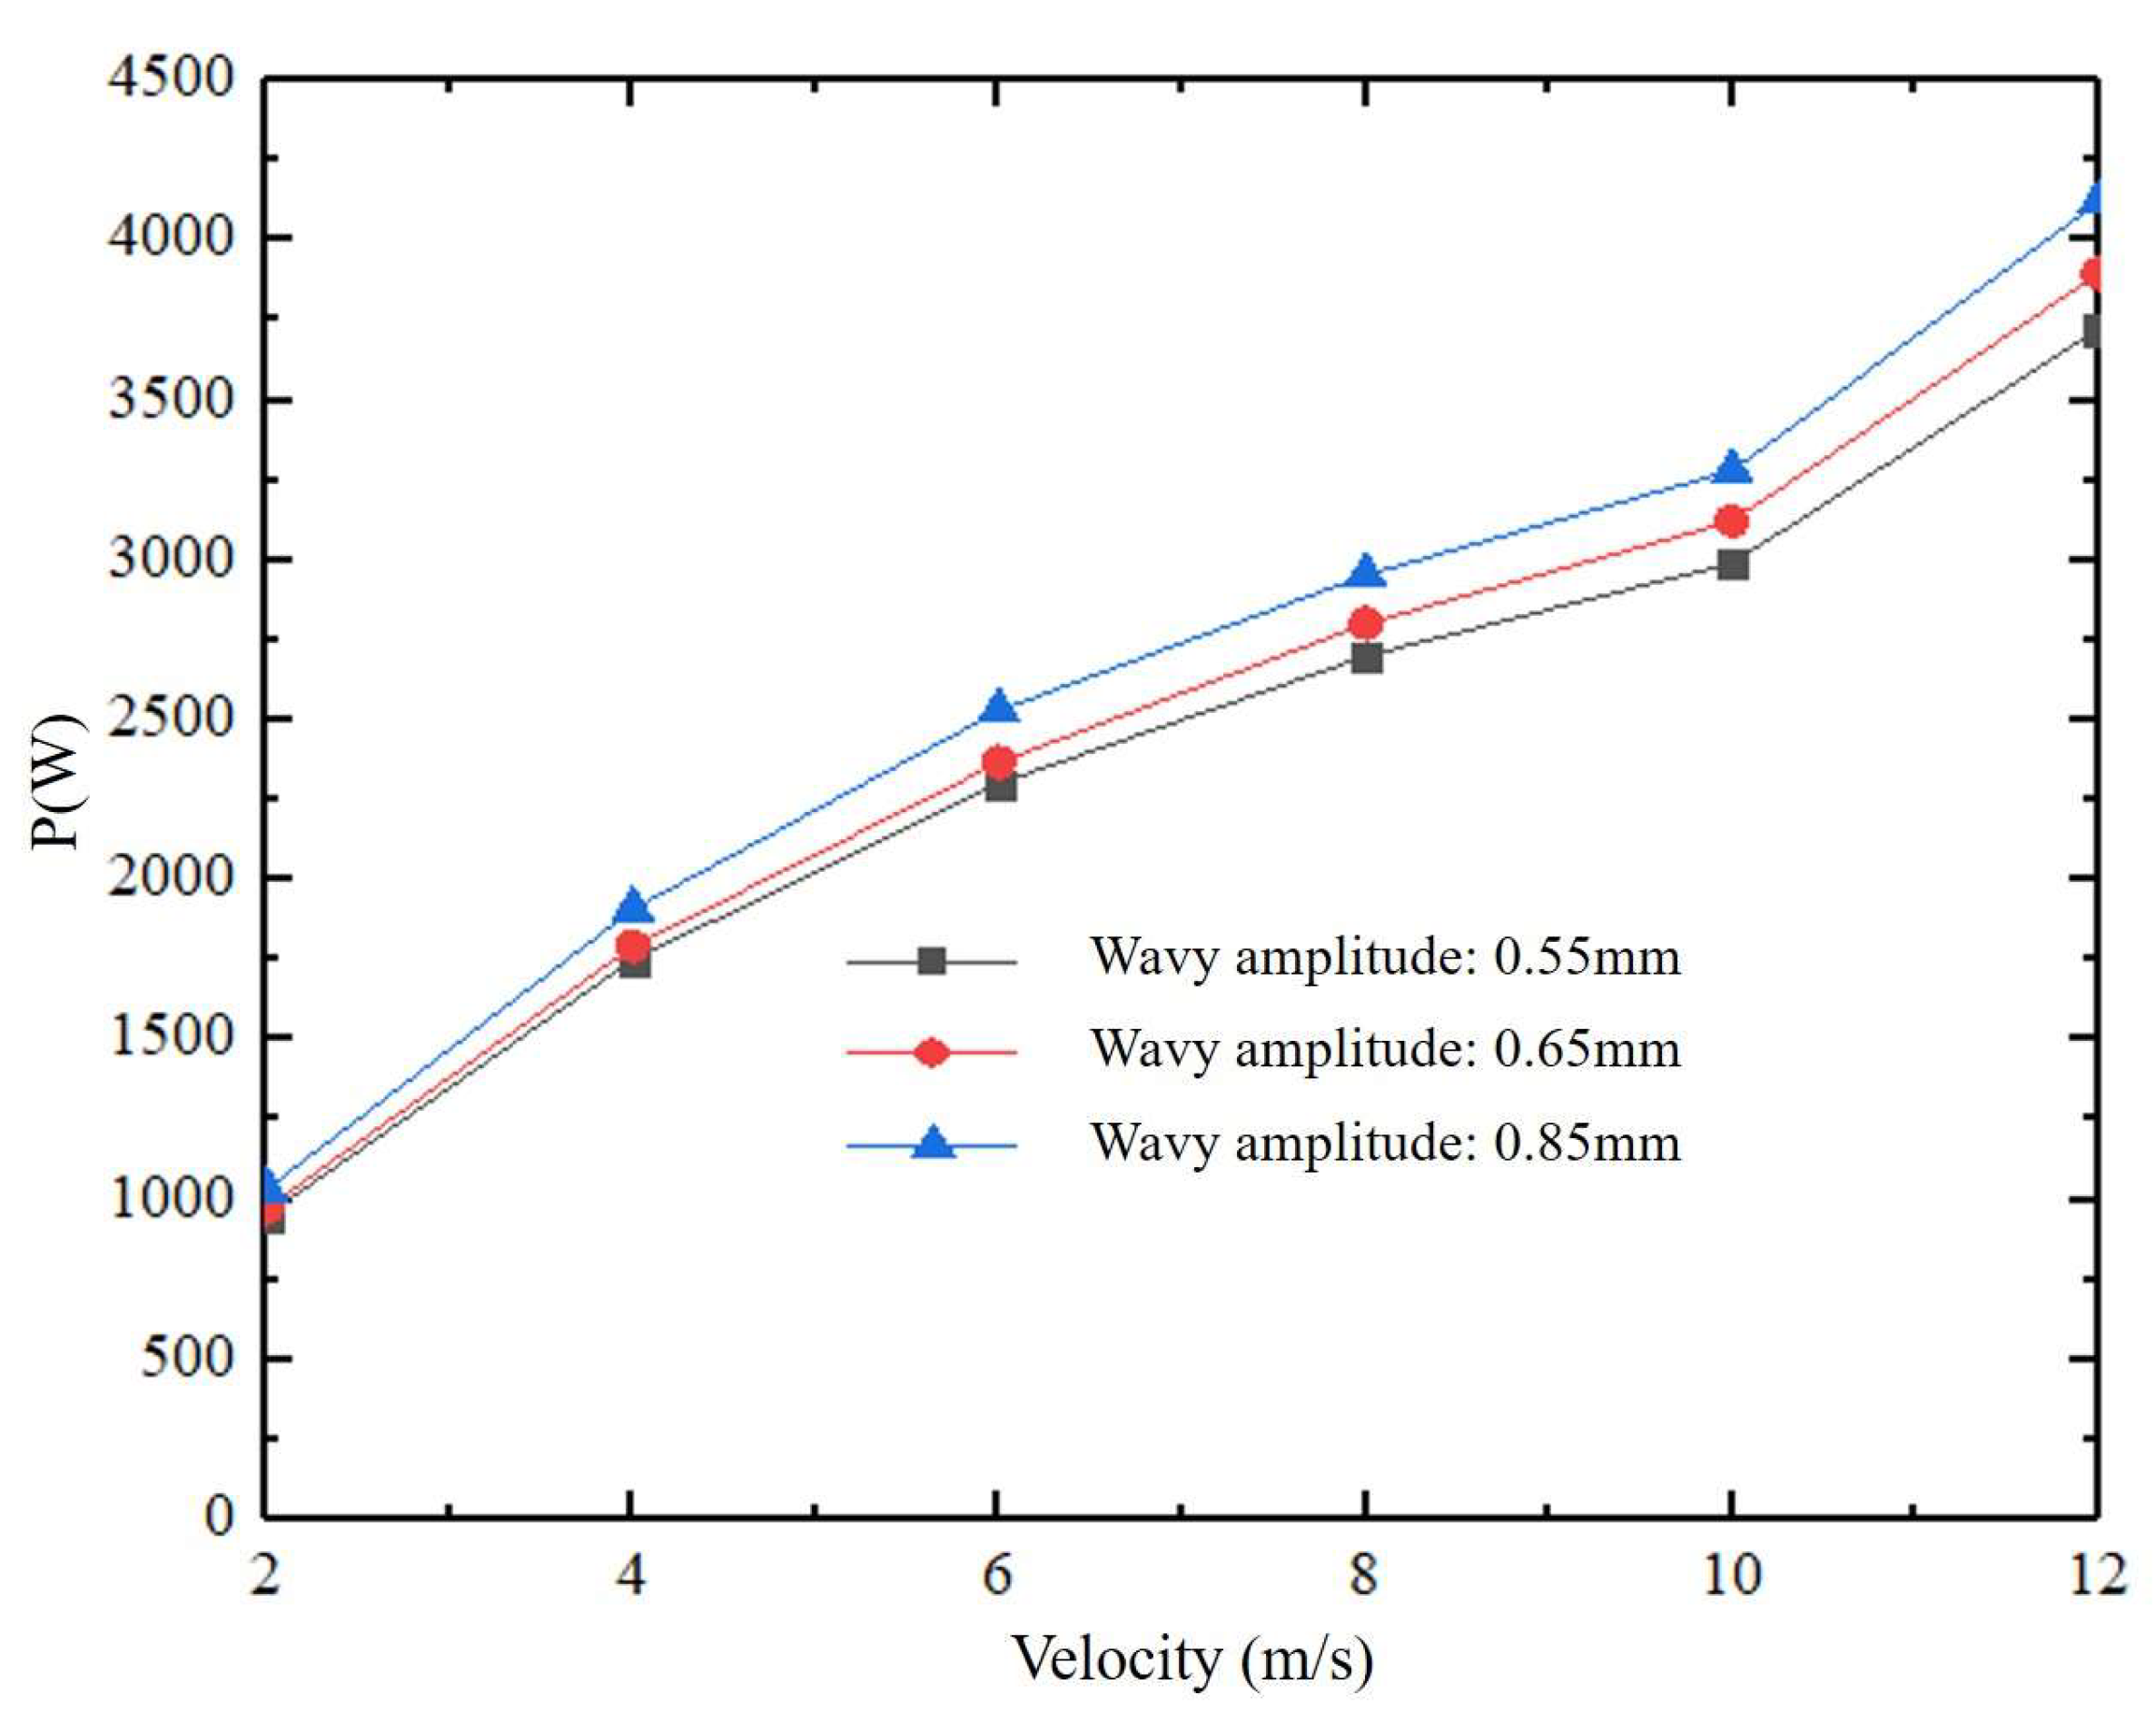
Figure 16.
Effect of fin length on radiator’s cooling power.

Figure 17.
Inlet and outlet coolant temperature of the stack for C and F group.

Table 1.
Specification of wavy fin parameters.
| Fin Pitch (Fp)/mm | Fin Height (h)/(mm) | Fin Length (Ld)/(mm) | Wavy Length (L)/(mm) | Wavy Amplitude (2A)/(mm) | Fin Thickness (δ)/(mm) | Flat Tube Height /(mm) |
|---|---|---|---|---|---|---|
| 4 | 7.5 | 54 | 10.8 | 0.75 | 0.2 | 1.5 |
Table 2.
Material property.
| Material | Density (kg∙m−3) | Specific Heat (J∙kg−1∙K−1) | Thermal Conductivity (W∙m−1∙K−1) |
|---|---|---|---|
| Pure water | 997.561 | 4081.72 | 0.620271 |
| Air | 1.293 | 1003.62 | 0.02603 |
| Aluminum | 2702 | 903 | 237 |
Table 3.
Physical properties of different Al2O3/water nanofluids.
| Concentration | Density/ (kg∙m−3) | Specific Heat/ (J∙kg−1∙K−1) | Thermal Conductivity/ (W∙m−1∙K−1) | Viscosity/ (Pa∙s) |
|---|---|---|---|---|
| 0.1% | 974.42 | 4191.45 | 0.97 | 3.60 × 10⁻⁴ |
| 0.3% | 979.68 | 4184.36 | 1.06 | 3.87 × 10⁻⁴ |
| 0.5% | 984.94 | 4177.27 | 1.27 | 3.89 × 10⁻⁴ |
Table 4.
Physical properties of different SiO2/water nanofluids.
| Concentration | Density/ (kg∙m−3) | Specific Heat/ (J∙kg−1∙K−1) | Thermal Conductivity/ (W∙m−1∙K−1) | Viscosity/ (Pa∙s) |
|---|---|---|---|---|
| 0.1% | 973.14 | 4191.77 | 1.04 | 3.39 × 10⁻⁴ |
| 0.3% | 975.84 | 4185.31 | 1.17 | 3.45 × 10⁻⁴ |
| 0.5% | 978.54 | 4178.86 | 1.41 | 3.50 × 10⁻⁴ |
Table 5.
Physical properties of different ZnO/water nanofluids.
| Concentration | Density/ (kg∙m−3) | Specific Heat/ (J∙kg−1∙K−1) | Thermal Conductivity/ (W∙m−1∙K−1) | Viscosity/ (Pa∙s) |
|---|---|---|---|---|
| 0.1% | 1049.85 | 3409.73 | 0.425 | 1.51 × 10⁻⁴ |
| 0.3% | 1054.13 | 3397.45 | 0.434 | 1.62 × 10⁻⁴ |
| 0.5% | 1062.29 | 3374.92 | 0.446 | 1.97 × 10⁻⁴ |
Table 6.
The radiator parameters.
| Item | Fin Height (h)/(mm) | Fin Thickness (δ)/(mm) | Flat Tube Height /(mm) | Fin Length (Ld)/(mm) | Fin Pitch (Fp)/(mm) | Wavy Amplitude (2A)/(mm) | Wavy Length (L)/(mm) |
|---|---|---|---|---|---|---|---|
| A | 7.5 | 0.2 | 1.5 | 54 | 2.5 | 0.75 | 10.8 |
| B | 7.5 | 0.2 | 1.5 | 54 | 3.5 | 0.75 | 10.8 |
| C | 7.5 | 0.2 | 1.5 | 54 | 4.5 | 0.75 | 10.8 |
| D | 7.5 | 0.2 | 1.5 | 54 | 4 | 0.55 | 10.8 |
| E | 7.5 | 0.2 | 1.5 | 54 | 4 | 0.65 | 10.8 |
| F | 7.5 | 0.2 | 1.5 | 54 | 4 | 0.85 | 10.8 |
| G | 7.5 | 0.2 | 1.5 | 54 | 4 | 0.75 | 6.8 |
| H | 7.5 | 0.2 | 1.5 | 54 | 4 | 0.75 | 8.8 |
| I | 7.5 | 0.2 | 1.5 | 54 | 4 | 0.75 | 12.8 |
Disclaimer/Publisher’s Note: The statements, opinions and data contained in all publications are solely those of the individual author(s) and contributor(s) and not of MDPI and/or the editor(s). MDPI and/or the editor(s) disclaim responsibility for any injury to people or property resulting from any ideas, methods, instructions or products referred to in the content. |
© 2023 by the authors. Licensee MDPI, Basel, Switzerland. This article is an open access article distributed under the terms and conditions of the Creative Commons Attribution (CC BY) license (https://creativecommons.org/licenses/by/4.0/).
Share and Cite
MDPI and ACS Style
Zhang, J.; Yan, F.; Du, C.; Li, W.; Fang, H.; Shen, J. Model-Based Performance Optimization of Thermal Management System of Proton Exchange Membrane Fuel Cell. Energies 2023, 16, 3952. https://doi.org/10.3390/en16093952
AMA Style
Zhang J, Yan F, Du C, Li W, Fang H, Shen J. Model-Based Performance Optimization of Thermal Management System of Proton Exchange Membrane Fuel Cell. Energies. 2023; 16(9):3952. https://doi.org/10.3390/en16093952
Chicago/Turabian StyleZhang, Jiaming, Fuwu Yan, Changqing Du, Wenhao Li, Hongzhang Fang, and Jun Shen. 2023. "Model-Based Performance Optimization of Thermal Management System of Proton Exchange Membrane Fuel Cell" Energies 16, no. 9: 3952. https://doi.org/10.3390/en16093952
Note that from the first issue of 2016, this journal uses article numbers instead of page numbers. See further details here.