Article

Spoilt for Choice: User-Centric Choice of Battery Size and Chemistry for Battery-Electric Long-Haul Trucks

Institute of Automotive Technology, Department of Mobility Systems Engineering, School of Engineering & Design, Technical University of Munich, Boltzmannstr. 15, 85748 Garching, Germany
*
Author to whom correspondence should be addressed.
Energies 2024, 17(1), 158; https://doi.org/10.3390/en17010158
Submission received: 25 November 2023 / Revised: 19 December 2023 / Accepted: 25 December 2023 / Published: 27 December 2023
(This article belongs to the Section D2: Electrochem: Batteries, Fuel Cells, Capacitors)

Abstract

:
With growing demands to save greenhouse gases, the rapid market introduction of battery-electric trucks (BETs) will become increasingly important, with truck manufacturers announcing various models entering the market in the near future. Soon, truck operators will be faced with deciding which battery capacity and cell chemistry to choose in their next purchase. In this study, we evaluate the choice of battery capacity, regarding feasibility and cost-effectiveness, for trucks using NMC and LFP cell chemistry. Our results show that higher energy density allows larger NMC batteries to be installed, resulting in the ability to transport higher payloads at low charging powers. The LFP chemistry has to rely on higher charging powers of up to 700 kW to transport the same payloads. When asked to choose a battery capacity for the individual use case, the smallest battery size should always be selected when only charging powers up to 300 kW are available. However, the reduction in publicly charged energy can lead to cost advantages of larger battery capacities at higher charging powers. When deciding between the two cell chemistries, the LFP chemistry shows advantages in most cases. Only at high payloads and low charging powers the NMC chemistry shows cost advantages.

1. Introduction

The dominant way of transporting goods in the European Union (EU) is road freight transport. A total of 75% of the transport performance in the EU is provided by land-bound road transport [1], accounting for a share of 8.5% of total EU CO 2 emissions [2]. To reduce these emissions and to achieve the EU’s goal of climate neutrality in 2050 [3], a transformation towards zero-emission propulsion systems is needed. To accelerate the market penetration of these vehicles, the EU has set emission reduction targets of 15% by 2025 and 30% by 2030 [4], with the newest proposals to further tighten them to 45% by 2030 [5,6]. Industry and research are therefore pushing for market maturity and technical progress of various solutions for zero-emission vehicles [7,8,9]. In particular, due to their high efficiency, possible rapid market maturity, and the ramp up of a public charging network, which is being driven forward by politics and industry, BETs are seen as the most promising option for the initial transition towards zero-emission vehicles [10,11,12]. In order to achieve the emission targets mentioned, a rapid increase in the market share of BETs is necessary, which requires the active purchase decision of a truck operator for a BET. These purchasing decisions are largely driven by the total cost of ownership (TCO). An essential part of this TCO is the investment cost, which in turn depends largely on the cost of the battery [13]. In comparison to the purchasing decision for a diesel truck, the tank size is not dominating the investment cost. Therefore, the importance of the battery system choice is novel for truck operators. In the future, truck operators will have to choose the truck or battery system that promises the lowest TCO from a growing portfolio offered by manufacturers. This portfolio of announced models by European OEMs is shown in Figure 1.
The relevant properties for a purchasing decision for the truck operator are the installed battery capacity, which leads to an achievable range, and the transportable payload, which is calculated from the tractor weight and the weight of the trailer [15] in relation to the maximum permissible gross vehicle weight (GVW). With the rise of the GVW limit to 42 t for zero-emission vehicles [16], most announced models show a payload loss of around 500–1000 k g in comparison to an average diesel truck [4]. Nevertheless, lighter and significantly heavier vehicles have also been announced, which leads to a great variance in options regarding the maximal battery capacity. In addition to the maximum battery capacities, a lower number of battery packs can also be selected, which increases the variance even further. In terms of cell chemistry, the two predominantly proposed chemistries are lithium iron phosphate LiFePO4 (LFP) and nickel cobalt manganese oxide Li(NixCoyMnz)O2 (NMC), which lead to different properties, like aging behavior, cost, and maximal possible battery capacity for the truck operator. From the variance in possible battery capacity and cell chemistry, the need arises to support the truck operator in its most cost-effective purchasing decision. Next to the variance in proposed battery systems, each truck operator has a wide range of individual use cases and properties at the home depot. For example, the daily range, the available charging power en route, or the transportable payload varies from use case to use case as well as between operators. This study links these requirements with the various possible battery systems and provides a decision-making aid for the individual truck operator.
The following studies have addressed the impact of battery sizing on the cost-effectiveness in the truck use case.
Nykvist and Olson [17] studied the effects of downsizing the battery, enabled by fast charging during operation. They find that smaller batteries show a cost advantage compared to larger battery capacities, especially for high GVW. Additionally, they show that the cycle life of the battery has a greater impact on the battery cost in comparison to the cell price.
Mareev et al. [18] analyzed the required battery capacities for different use cases, as well as the impact on the maximal possible payload. They find a required battery capacity of 900 kWh for a range of 500 k m for a demanding driving profile and an en-route charging infrastructure of 880 kW . Additionally, they show that with rising battery capacity, the possible payload is reduced. In their study, they analyzed the payload reduction and cost-effectiveness of the TCO for two different NMC cells.
In a previous study, we analyzed the impact of the novel MCS standard and the operation strategy on the battery size [19]. We showed the impact of varying charging power and operation strategies on the required battery size. We found a minimal battery size of 798 kWh for driving 9 h while employing a single-stop-strategy. Additionally, we found advantages for NMC cells when restricted charging power is available and a single-stop strategy is chosen.
Next to the dependence of battery sizing on charging power, operation strategy, and payload, the following studies analyzed the benefit of oversizing the battery for a given use case.
Babin et al. [20] investigated battery-electric light-duty vehicles with varying battery sizes in terms of TCO effectiveness. They combined an electro-thermal cell model with an aging model for an LFP cell. Results show a TCO advantage for a battery oversized by up to 100%. Higher oversizing factors lead to rising TCO. They additionally state that their results depend heavily on the analyzed cell chemistry and deployed charging strategy.
Karlsson and Grauers [21] analyzed the cost-effectiveness of varying battery sizes in the use case of a Swedish truck operator. The aging of the battery was approximated by a functional dependence of the used share of state of charge (SOC) of the battery. They find cost advantages for large batteries when neglecting cost due to losing payload capacity. When considering the mentioned cost, they state that the analyzed truck operator would likely choose a small battery capacity. They also show that the result depends on the price for public charging and the opportunity cost caused by payload loss.
Al-Saadi et al. [22] investigated the effect of varying battery capacities for battery-electric buses on the aging and the cost-effectiveness of three different bus lines. They analyzed three different cell chemistries and their aging behavior with respect to the battery size. The authors state that a cost-effective design has to show a higher lifetime-increase in comparison to the capacity increase. Results show that LFP cells gain no cost advantage, in comparison to NMC cells, which profit from a large gain in lifetime with a small increase in battery capacity.
Additionally to the battery size, the following studies analyzed the impact of the cell chemistry on the truck use case.
Mauler et al. [23] investigated the cost-effectiveness of BETs with an NMC or LFP cell, as well as a truck with a hydrogen fuel-cell system for long-haul trucks in the U.S. The authors calculate the most cost-efficient choice based on a detailed TCO model, considering opportunity costs for loss of time due to charging as well as loss of payload. Results show that the use of LFP cells is beneficial for the largest share of use cases, but especially for volume-constrained and short-distance transport. NMC cells show advantages for weight-constrained transport between 350 k m and 600 k m . For longer trips, a fuel-cell truck has an advantage. The authors show that cell price, energy density, and lifetime have a large impact on the results.
Teichert et al. [15] developed a method to select the most cost-effective cell for the BET use case out of a database containing various cells. Results show that individual cell cost-effectiveness varies greatly for both NMC and LFP chemistries. Additionally, it is shown that charging C-rate and cycle life have a great impact on the cost-effectiveness of the individual cell.
Depcik et al. [24] studied the impact of different cell chemistries and future improvements on the BET use case. Results show that LFP cells hold an advantage over NMC cells, based predominantly on the cycle stability. The authors additionally state that future improvements in energy density in terms of solid-state lithium cells offer great potential for the BET use case.

1.1. Contributions

The shown literature answers questions regarding battery size in individual use cases and cell chemistry in general applicability. Nevertheless, the questions that arise for a truck operator when given the task of a purchasing decision with a growing portfolio of BET between different battery sizes and cell chemistries are not answered in a comprehensive and user-centric way. In this study, we analyze, which combination of battery size and chemistry results in the most cost-effective choice for a truck operator’s individual use case. The first important information is which battery size is feasible for the individual use case and given infrastructure. Previous studies investigated which minimum battery sizes are possible for different use cases. However, there is no analysis of what battery size is feasible at which daily mileage, available charging power, and payload, without loss of additional time for charging. In this study, the vehicle limitations resulting from volume and weight restrictions are also taken into account. After determining which minimal battery size is needed in order to fulfill the individual use case, the question arises if a larger battery size provides cost advantages compared to the minimal feasible option. However, the following trade-off arises: as the battery size increases, the investment increases, but the lifetime also increases, as does the proportion of energy charged at home. The presented studies consider only a small number of use cases and, for the most part, do not use semi-empirical aging models to model the effect of oversizing on aging. In addition, the distinction between several cell chemistries is missing. In this study, electro-thermal simulations and semi-empirical aging models are used for both NMC and LFP chemistry to model the mentioned aging effect. In addition, a sensitivity analysis evaluates the influence of different parameters on the effectiveness of oversizing the battery. So far, the choice of cell chemistry on cost-effectiveness is analyzed predominantly for the U.S. and without taking different charging powers as well as weight and volume restrictions into account. The present study fills these gaps and additionally considers cell aging in detail as described above while focusing on the two most promising cell chemistries NMC and LFP.
The main contributions of this paper can be summarized as follows:
  • Comprehensive analysis of the feasibility of varying battery capacities for different use cases
    This paper presents the first comprehensive analysis of which battery size is feasible for a long-haul BETs considering charging power, payload, and cell-individual vehicle restrictions as well as degradation effects.
  • Novel investigation on the cost-effectiveness of oversizing the battery
    We analyze the trade-off between rising investment costs and less need to replace the battery during lifetime, caused by the degradation of the cell. We model the aging effects based on cell chemistry as well as available charging power and transported payload.
  • Detailed analysis of the cost-optimal and use case individual choice of cell chemistry
    We provide an in-depth comparison of the two mentioned cell chemistries, regarding cost-effectiveness. We significantly enhance the state of the art, considering detailed aging modeling and the dependency on available charging infrastructure. We additionally conduct a sensitivity analysis in order to make the influence of our assumptions as transparent as possible.
The results of this study can be used predominantly by truck operators, to improve their purchasing decisions, but also provide additional information for truck manufacturers and fellow researchers conducting investigations on the feasibility of BETs. The source code of the underlying study is available as open source, thereby enabling the scientific community to further enhance the presented method and results (https://github.com/TUMFTM/BET_BatterySizing_CellChemistry (accessed on 24 December 2023)).

1.2. Organization of the Article

The structure of this paper is organized as follows: Section 2 describes the used method, consisting of the investigated scenario, a thermo-electric aging model, and a cost model. Also the used parameterization is shown in this section. In Section 3, the results corresponding to the mentioned gaps in literature are shown and discussed in Section 4. Section 5 summarizes this work and shows an outlook for future research.

2. Method

In order to investigate the mentioned research gaps, we use the developed method shown in Figure 2. We calculate each step for each set of variation parameters, which consist of battery capacity, payload, daily range, and charging power. Next to the mentioned parameters, we calculate each following step for both the NMC and LFP chemistry. We start by defining the scenario based on the chosen parameters, followed by the calculation of the resulting power profile. Based on this power profile, the resulting SOC, as well as temperature and C-rate, is calculated by the thermo-electric model. Here, we answer the question, of which use case with which battery capacity is feasible. The aging model takes thermo-electric results into account and calculates the resulting battery lifetime. With this result, the corresponding battery-related costs are calculated by the cost model. By comparing these costs at each battery capacity, we can answer the question of whether oversizing the battery is beneficial for each use case. In conclusion, the two different cell chemistries are compared in terms of cost optimality, while taking opportunity costs into account.

2.1. Scenario and Power Profile

It is assumed that long-haul transport cannot be covered without en-route charging [17,19]. To implement this en-route charging into the daily operation, it is expected that the rest time, required under the EU regulation 561/2006 [25], can be used to recharge the truck. The rest time model stipulates that a 45 min rest time must be taken after 4.5 h of driving. This is followed by another maximal 4.5 h driving stint, which results in a daily driving time of 9 h. The assumption of using the rest time to charge, as well as the representation of the 1-stop operation scenario, is widely used in academia and also in industry to calculate the maximal drivable range [15,17,18,26]. We adopt this assumption for our defined scenario, which is schematically shown in Figure 3a.
We assume that if the distance exceeds the drivable distance in 4.5 h, the rest stop is conducted exactly in the middle of the total driving distance. This enables the driver to achieve the longest possible distance with the lowest battery capacity [19]. We additionally assume that the public charging infrastructure is always available when needed. Of the 45 min rest time, 5 min is allocated to the connecting and payment process and thus is not available for charging, which results in a 40 min pure charging time for en-route charging. In comparison to the high charging power, which will be possible due to the novel megawatt charging system (MCS) standard, we assume that lower charging power is available in longer rest stops after the daily driving task to fully charge the truck and to assure that the next operation day can be started at the maximal possible SOC. Since cost reduction is a main objective for truck operators, it is the goal to charge at the cheapest rate possible during operation and to charge just as much energy as needed to be able to finish the driving task, due to the higher charging cost for en-route charging. We implemented this strategy into the electric control model described in Section 2.2.
To derive a power curve from this scenario, which the traction battery must provide, a quasi-static distance-based longitudinal dynamics model is used [15]. This model uses the VECTO long-haul driving cycle and takes the battery mass into account. The parameterization of the other vehicle parameters is carried out using the best-in-class values of the published values via EU Regulation 956/201 [4]. To map the parametrized daily range, the VECTO driving cycle is repeated until the defined distance is covered. During the rest times, the defined available charging power is allocated, which ultimately results in the demand power curve shown in Figure 3b.

2.2. Electro-Thermal Aging Model

The shown power profile serves as the input variable P dem for the electro-thermal aging model, illustrated in Figure 4. It consists of an electrical and a thermal submodel, each with a control algorithm, and an aging model. Based on the power profile to be simulated, the SOC curve can be calculated by the electrical submodel, which is required to assess the feasibility of the individual use cases. In addition, the SOC and C-rate curves, based on the electrical model and the cell temperature curve, are included in the semi-empirical aging model to calculate the battery life for the cost model. The details of the individual sub-models are presented below. We assume that all cells of the battery pack have the same initial conditions and the same temperature, and thus assume that the battery pack behaves like a single cell. Therefore, the demanded power at cell P dem , cell level is calculated according to the installed battery capacity E bat and the used cell data, shown in Equation (1).
P dem , cell = P dem U nom Q nom E bat
For the electrical model, an equivalent circuit model is used for both the NMC and LFP cells. The used formulas for the calculation of the electric behavior based on [27] are shown in Equations (2)–(5). The resulting cell current I cell based on the demanded power P dem , cell is calculated with the open circuit voltage U OCV and the internal resistance R i at the present SOC and cell temperature T cell . Subsequently, the SOC in the next time step is calculated with the C rate , scaled with the nominal cell capacity Q nom and the simulation time step Δ t i . The ohmic losses are calculated based on the cell current I cell and the internal resistance R i at the given conditions.
I cell = U OCV + U OCV 2 + 4 R i P dem , cell 2 R i
C rate , i = I cell Q nom
S O C i + 1 = S O C i + C rate Δ t i 3600
P loss , i = R i I cell 2
where = U OCV = f ( S O C i ) R i , d = f ( S O C i , T cell , i ) R i , c = f ( S O C i , T cell , i ) R i = R i , c i f P dem , cell > 0 R i , d i f P dem , cell < 0
In order to prevent overcharge, we deploy a realistic charging profile and integrate the mentioned charging strategy within an electric control algorithm that controls the input cell power for the electric model. To prevent overcharge, the cell power gets zeroed when the maximal SOC is exceeded in the next timestep. To prevent accelerated aging of the cell, because of degradation modes like lithium plating, fast-charging strategies are deployed by automotive manufacturers, which reduce the charging power at higher SOC ranges [28]. Hence, we implemented the CC-CV charging protocol into the electric control algorithm. It compares the terminal voltage U, calculated according to Equation (6), with the maximal cell voltage U max and reduces the cell current so that the terminal voltage stays constant at the maximal cell voltage.
U = U OCV + I cell R i
In addition, the operating strategy is implemented, which has the goal of charging as little as possible at public infrastructure due to cost savings. For this purpose, a charging target S O C ch , target is defined up to which the truck will be charged. This value is calculated (Equation (8)) based on the energy consumed until the charging event S O C ch ,   start , the maximal possible SOC S O C cell ,   max due to cell limitations and the desired SOC at the end of the trip S O C EndofTrip . The latter is defined by the minimal cell limit S O C cell ,   min and buffer due to range anxiety by the driver S O C RA , Equation (7).
S O C EndofTrip = S O C RA + S O C cell ,   min
S O C ch , target = S O C cell ,   max S O C ch ,   start + S O C EndofTrip
If charging is not required to reach S O C EndofTrip , the S O C ch , target is set to the current SOC. When the S O C ch , target is reached during the charging event, the control algorithm sets P dem , cell to zero, and the charging process is stopped.
For determining the internal resistance, the current cell temperature T cell is required. We calculate this by using a lumped-capacitance model with two thermal masses, based on [29]. According to the electric model, we assume a homogenous temperature over the battery pack and can therefore model the battery pack as a single thermal mass while assuming the pack housing as the second thermal mass. The thermal capacity of the housing is scaled accordingly to the installed battery capacity, shown in Equation (9). In this case, we calculate the mass of the housing via the cell2pack-factor z c 2 p , grav , which describes the lost energy density from cell to pack level.
C th , housing = c aluminium n cells E cell 1 z c 2 p ,   grav
We calculate the housing temperature T housing with the heat transfer from the cells inside the pack as well as the heat transfer due to active cooling by the battery thermal management system (BTMS) and the heat transfer to the environment, based on Equation (10). The heat transfer to the BTMS is defined through the cooling power P cool and the coefficient of performance of the cooling system. If cooling is applied, it is controlled by the thermal control algorithm. The heat transfer to the cells and the ambient is calculated with the respective thermal resistances R h ,   a and R cell ,   h in combination with the corresponding temperature differences.
T h ,   i + 1 = T h ,   i + Δ t i C th ,   h P cool C O P cool + n cells T cell ,   i     T h ,   i R cell ,   h + T amb     T h ,   i R h ,   amb
Subsequently, the cell temperature can be calculated, according to Equation (11).
T cell ,   i + 1 = T cell ,   i + Δ t i m cell c th ,   cell P loss + T cell ,   i     T h ,   i R cell ,   h
The thermal control algorithm controls at which point the active cooling via the BTMS is applied. We define a cooling threshold T cool ,   on at which the cooling is activated and a threshold at which the cooling is turned off T cool ,   off . This is in accordance with state-of-the-art battery-electric vehicle (BEV) implementations [30].
As shown in Figure 4, the SOC, T cell , and C rate are calculated for the entire operation day. For the feasibility analysis, the model is adapted in order to represent the performance of the battery at its end of life. We assume a capacity loss of 20% and an increase in the internal resistance of 50% at the end of life. The SOC profile over the whole operation day is analyzed by checking if the SOC dropped below 0%. If it stayed over 0% for the entire day, we define the use case as feasible.
In addition to analyzing whether the installed battery capacity is sufficient for a given use case, weight and volumetric feasibility limits are also taken into account. For zero-emission trucks, the limit of m gvw ,   max 42 t gross vehicle weight applies [15]. Therefore, we define combinations that exceed this weight as not feasible. The vehicle weight is calculated based on Equation (12).
m gvw = m w /   o   bat + m payload + E bat ρ gravimetric z c 2 p ,   grav
Also, we define an exceeding of the maximum available volume for the battery V bat , max as unfeasible. The volume of the battery is defined by the battery capacity E bat , the respective volumetric energy density ρ volumetric , and the volumetric cell2pack factor z c 2 p ,   vol .
The curves of C-rate, SOC, and temperature serve as inputs for the semi-empirical aging model. For NMC chemistry, the aging model of Schmalstieg et al. [31] is used. In the case of LFP chemistry, we use the aging model of Naumann et al. [32,33].
We show the implementation of the aging model, which considers cyclic as well as calendaric aging, using the formulaic relationships of the NMC model. Both the calendar and cyclic loss of capacity due to a certain load depend on the state of health (SOH). To map this, we calculate the equivalent charge throughput Q eq and time t eq that would have passed to get to the current aging state at the given load, seen in Equations (13) and (15). The stress factors of k Uavg , k SOC , and k T are determined by the corresponding formulaic relationships of the aging models. For their calculation, the mean temperature, the mean C-rate, and the mean SOC are determined over the previously calculated operation day. To determine k DoD , the rainflow counting algorithm, shown in [34], is used.
In the case of the used NMC aging model, a non-automotive cell was used for parameterization, which shows significantly lower cycle life than state-of-the-art automotive cells [30]. The cycle stability is therefore scaled by the factor k scale to match the automotive state of the art, based on the aging tests performed with a highway cycle, including recurring fast-charging events [30]. The capacity loss after the current operation day is then calculated on the basis of the existing capacity loss and the currently analyzed operation day, shown in Equations (14) and (16).
Q eq = Q loss , cyc , k / k scale / k Uavg + k DoD 2
Q loss , cyc , k + 1 = k scale k Uavg + k DoD Q e q + Q d a y
t eq = Q loss , cal , k / k scale / k T / k SOC 4 / 3
Q loss , cal , k + 1 = k scale k T k SOC t eq + t day 3 / 4
The aging behavior of the LFP cell is calculated by using the same procedure but with the concrete formula relationships by Naumann et al. [32,33]. We focus on the capacity loss to determine the battery lifetime and neglect the increase in the internal resistance over the lifetime. Nevertheless, we ensure that the use case can still be driven at the end of life consisting of increased internal resistance and the loss of capacity. The quantity of operation days is determined by the annual mileage as well as the daily range. Based on these two values, we derive a weekly distribution of operation and rest days, the sum of which matches the annual mileage. On an operation day, the calculated stress factors are used to update the loss of capacity. In the case of a rest day, we assume an average temperature of 25 C and an average SOC level of 80% for the stress factor calculation. By repeating the calculation according to the weekly distribution of drive and rest days and adding calendaric and cyclic capacity loss, the aging behavior for a given use case can be derived. The batteries’ operating life is defined when the capacity loss reaches 20%. This value is then used in the following cost model.

2.3. Cost Model

The cost model is used to compare the different battery sizes and chemistries against each other. For this reason, only the battery-related costs are compared, since all other shares of the TCO are equal in this analysis. The battery-related cost consists of investment cost C bat , inv , resale value C bat , res at the trucks end of life, the scrappage value C bat , scrap of replaced batteries, the imputed interest C bat , imp , and energy cost depending on the battery size C ene , shown in Equation (17). For the cell chemistry comparison, the opportunity cost C opp caused by the loss of payload is also considered. All costs are determined at their net present value to account for both operating and investment costs, as shown in [15].
C BatRelated = C bat , inv , n C bat , scrap , n C bat , res + C bat , imp + C ene ,   n + C opp ,   payload
The investment cost added (Equation (18)) is determined by the initial investment and the number of battery replacements required, which depends on the calculated battery life (Equation (19)). Every battery purchase is calculated depending on the batteries capacity E bat , the specific battery cost c spec , and the scaling factor from cell to system z c , c 2 s .
C bat , inv , n = c spec z c , c 2 s E bat r n t bat ,   life 365 n [ 0 , , n repl ]
n repl = t own / t bat ,   life
In the case of battery replacement, it is assumed that the battery at 80% SOH can be resold for e.g., second-life applications, which is calculated by Equation (20).
C bat , scrap , n = z scr c spec z c , c 2 s E bat r n t bat ,   life 365 n [ 1 , , n repl ]
If the battery has not yet reached the end of life at the end of the ownership period, the resale value is calculated by Equation (21). This resale value depends on the remaining SOH at the end of the service life, which is calculated according to Equation (22).
C bat , res = z scr + ( 1 z scrap ) z SOH c spec z c , c 2 s E bat r t own
z SOH = n repl + 1 t own / t bat ,   life
In addition, the investments are associated with costs by imputed interest, calculated by Equation (23).
C bat , imp = n = 0 n = n repl 1 C bat , inv , n + C bat , scrap , n 2 ( r t bat ,   life / 365 1 ) + C bat , inv , nrepl + C bat , res 2 ( r ( t own n repl t bat ,   life 365 ) 1 )
The cost of recharged energy, as shown in Equation (24) is calculated based on the annual mileage s annual as well as the specific cost c ene and the mass-dependent consumption f c o n s , m g v w , both of which are influenced by the battery capacity.
Due to the operation strategy, only the amount of energy is charged at public infrastructure to arrive at a residual SOC at the targeted daily distance. If a larger battery size is installed, less energy has to be recharged at a public charger. Therefore the specific energy cost c ene depends on the share of fast-charged energy z fc and the respective charging rates for slow c sc and fast-charged energy c fc (Equation (25)). With the novel MCS standard still in standardization, the maximal available charging power in operation is 400 kW , so no corresponding price at higher charging power rates is available. In accordance with Refs. [10,19,35], the price is assumed by means of linear regression based on prices at the currently feasible charging power rates (Equation (26)).
C ene = n = 0 n = 52 × t own 1 1 52 s annual f c o n s , m g v w c ene r n / 52
c ene = z fc c fc + ( 1 z fc ) c sc
c fc ( P ch ) = c sc ,   22 + c fc ,   400 c sc ,   22 400 kW 22 kW ( P ch 22 kW )
When comparing the two cell chemistries under consideration, varying vehicle weights at the same installed capacity arise. Therefore less payload can be transported with the heavier cell chemistry. We consider this loss of payload with arising opportunity costs for the foregone profit, calculated by the less transportable payload m payload ,   delta and the specific opportunity cost c opp (Equation (27)).
C opp = n = 0 t own 1 1 t own c opp m payload ,   delta s annual r n / t own
In order to compare use cases with different annual mileages, we calculate the cost per kilometer by dividing C BatRealated by the annual mileage s annual .
All used parameters in the shown method are listed in Table 1. Particularly for the parameterization of the electric model, U OCV and R i are used from [36]. In this study the Sony US26650FTC1 cell is used as a representative of the LFP chemistry and the Sanyo UR18650E for the NMC chemistry.

3. Results

This section shows and describes the results, answering the three proposed research questions. Section 3.1 shows which use cases are feasible at the end of life of the battery, without any time loss. Subsequently, Section 3.2 answers the question of whether oversizing the battery is cost-effective depending on the use case. Lastly, the results of the comparison of NMC and LFP chemistries in terms of cost advantages are shown in Section 3.3.

3.1. Feasibility

In Figure 5, the results of the feasibility analysis are shown, which investigate if the use case can be carried out at the batteries’ end of life. The two rows indicate the results for both the NMC and LFP cell chemistry, whereas the columns show the influence of increasing daily range. In all cases, the gravimetric and volumetric limits are shown. With the limit in GVW, less payload can be transported with increasing battery capacity and, therefore, battery weight. At 672 kWh the maximal transportable payload for NMC is 24.05   t , compared to 22.8   t when using the LFP chemistry. In terms of the limit caused by the batteries volume, the NMC chemistry shows a maximal installable capacity of 868 kWh compared to 672 kWh achieved by the LFP chemistry. These results are shown in all the following figures.
The colored shades represent all possible use cases at the corresponding charging power, whereas the white areas are not feasible without additional time loss. These feasibility limits range from low payloads with small batteries to high payloads with larger battery capacities. This is caused by the higher energy demand for high payloads and therefore higher required installed battery capacity. Since the energy demand increases significantly faster with increasing payload than with increasing weight due to larger batteries, the feasibility lines are showing this characteristic behavior.
In the NMC case, it can be seen that with 300 kW and the largest possible battery size, a large part of the use cases up to a payload of 23.2   t , 20.1   t , and 16.2   t with the corresponding daily ranges can be achieved. The increase in charging power up to 500 kW brings a significant advantage, whereas the increases to 700 and 900 kW show smaller advantages.
If an LFP chemistry is installed, only 13.8   t can be transported in the case of 600 k m daily mileage at maximum battery size and 300 kW charging power, which is 9.4   t less than the maximum payload of NMC chemistry at 300 kW . In addition, it can be seen that high payloads can only be achieved when using charging power of 500 kW or 700 kW in the corresponding daily driving performance. In this case, the increase from 700 kW to 900 kW does not bring any significant improvement since, in these cases, the truck gets fully charged during the rest time, even with 700 kW . Therefore, a further increase in charging power will not bring any added value.

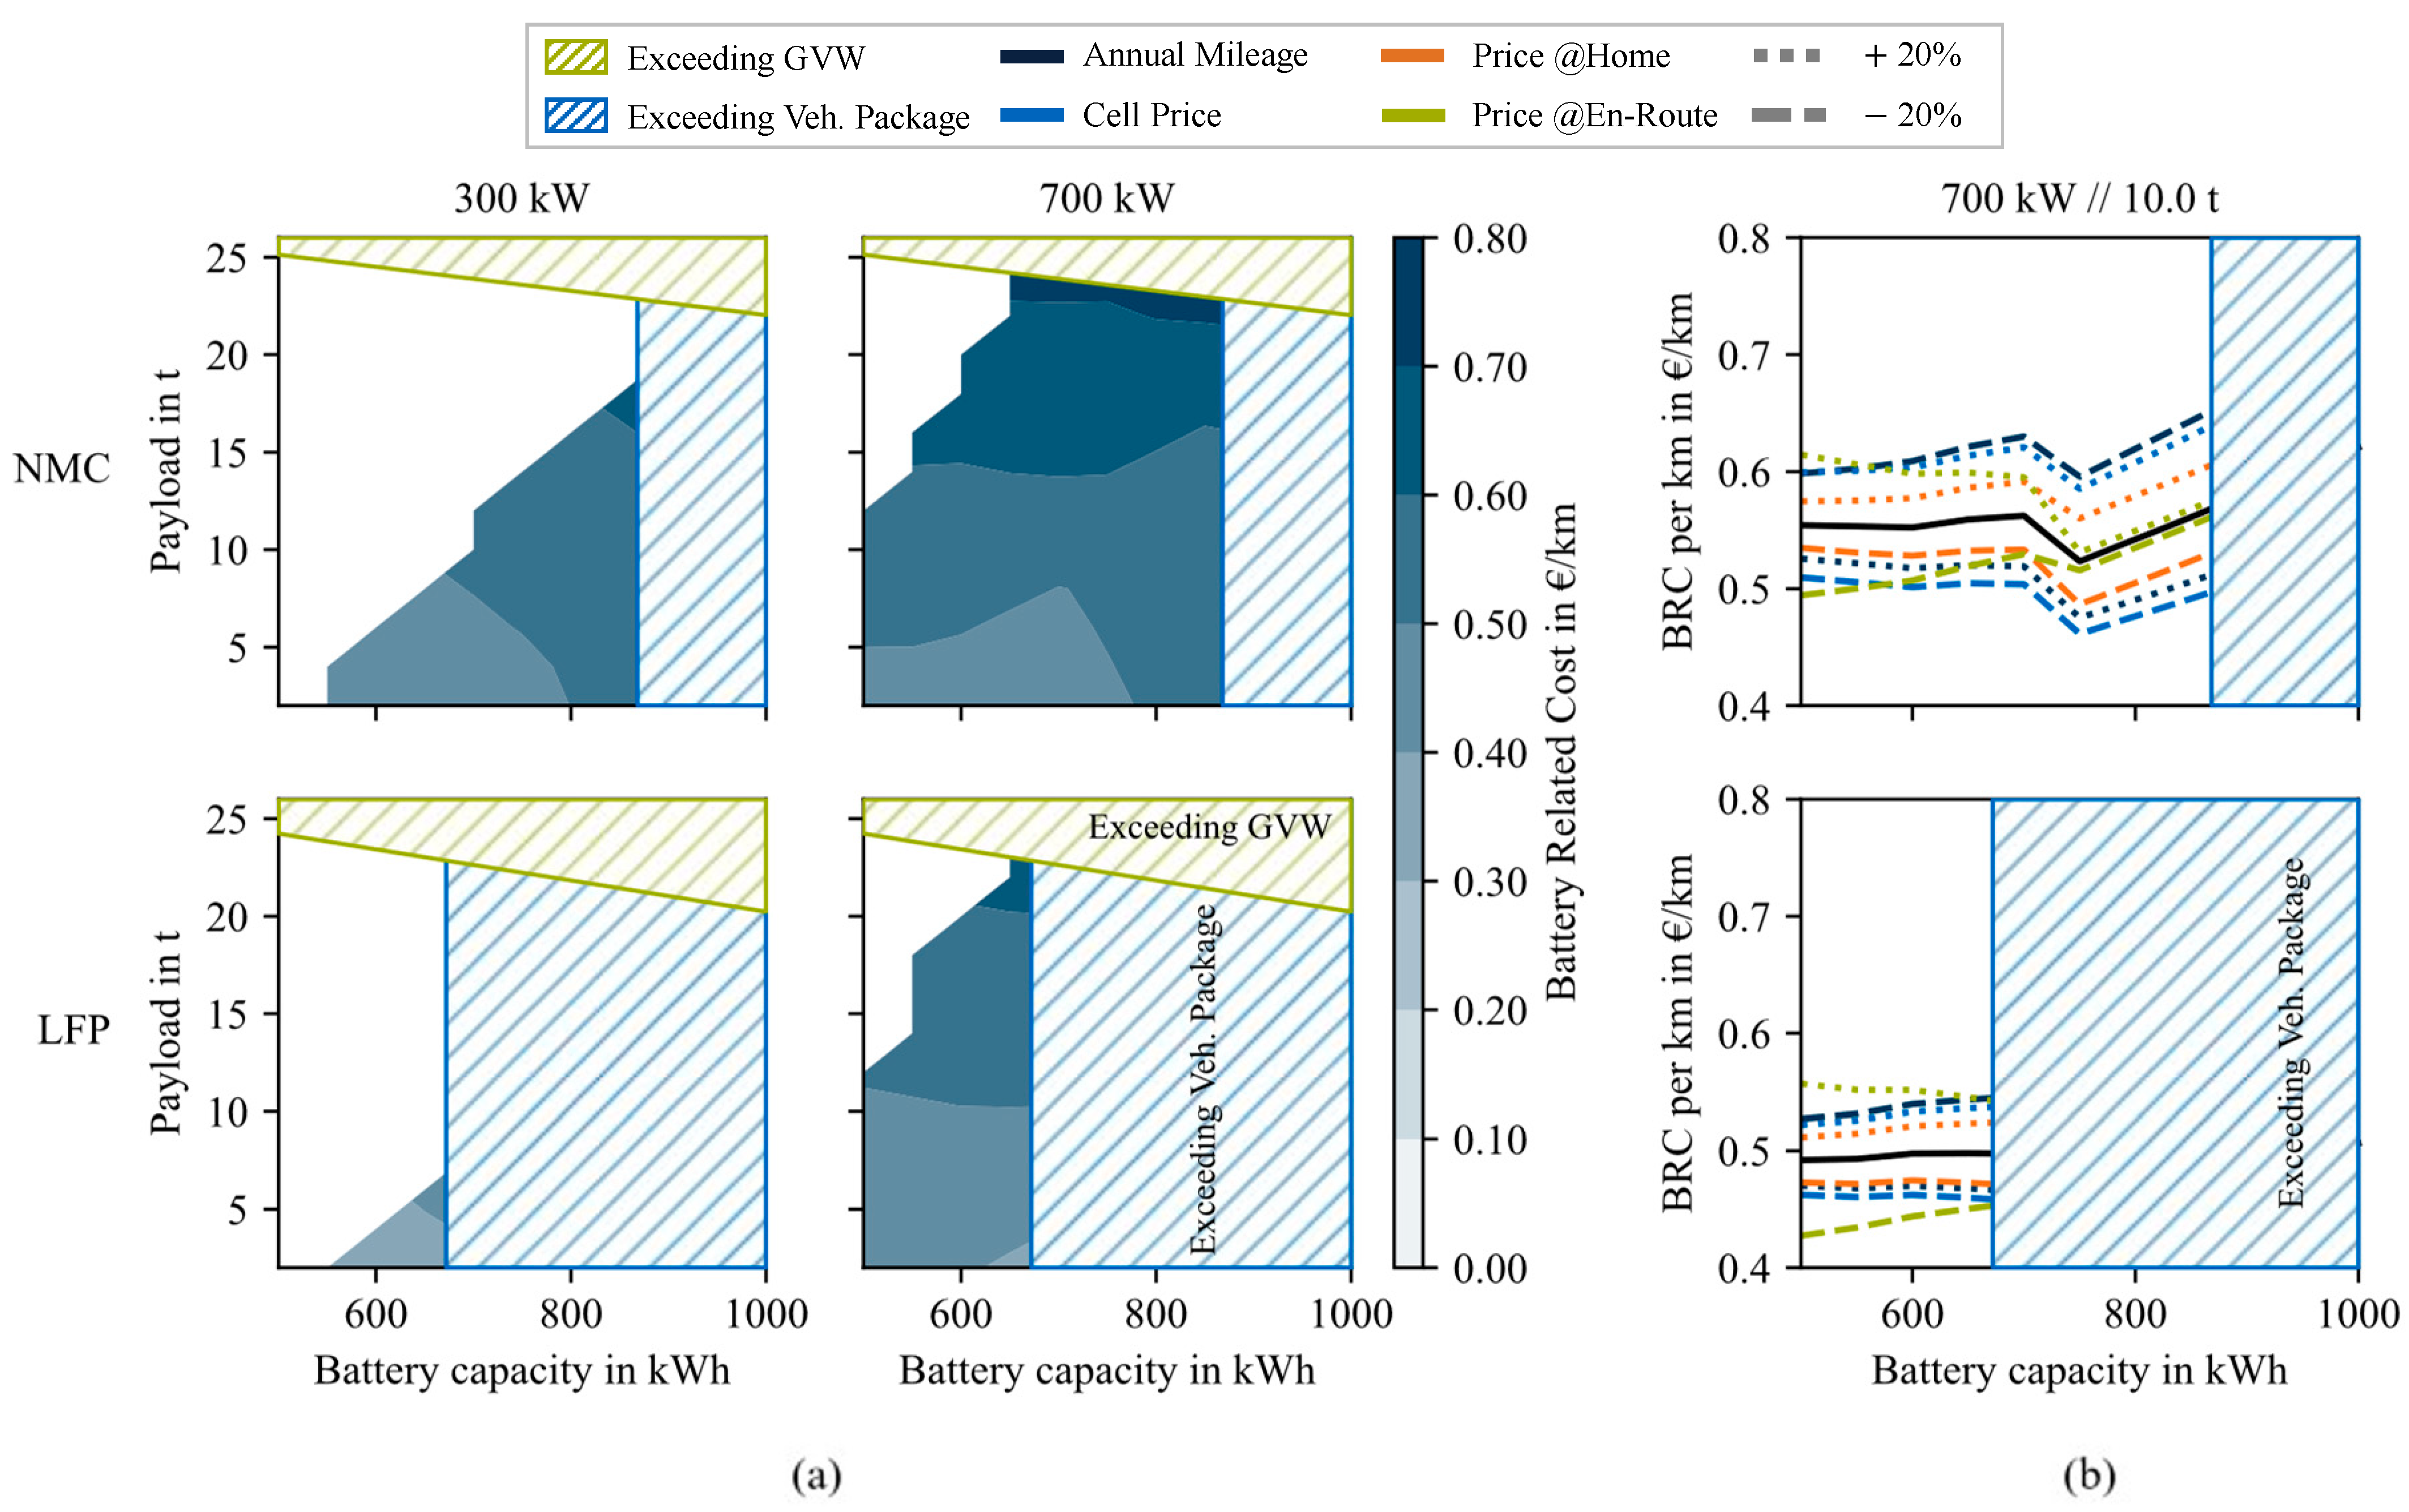
3.2. Cost-Effective Battery Size

The results, which answer the question of whether oversizing of the battery is cost-effective, are shown in Figure 6. In Figure 6a, the battery-related costs are shown, and in Figure 6b, the used parameters are varied in the context of a sensitivity analysis. In this case, again, the limits in relation to GVW and vehicle package and the non-feasible use cases are shown.
In the case of 300 kW charging power, results show that the cost increases with battery capacity for each payload. This can be observed for NMC as well as for LFP chemistry. The effect that the share of expensive publicly charged energy decreases by increasing the battery capacity is not as significant as the additional costs due to the larger investment of increasing battery capacity. One reason for this is the low amount of publicly recharged energy due to the low charging power and the lower public charging price compared to higher charging powers. In this case, the conclusion for the truck operators is to choose the smallest possible battery capacity to achieve the lowest cost.
The following trends can be observed at higher charging power of 700 kW . When choosing an NMC cell at ca. 5 t , the costs rise slightly from the smallest possible battery size up to 600 kWh . Due to the high energy consumption and the subsequent recharge during the rest time, high depth of discharge (DoD) and a large number of equivalent full cycle (EFC) negatively affect the cells aging behavior. Therefore, the investment costs are rising. A further increase in the battery size decreases the costs up to a minimum at 710 kWh . The reason for this is the possibility of less public charging at higher prices than at home when larger battery capacities are installed. Due to the higher charging power, both the amount of energy that can be recharged and the charging price are higher, which increases the savings potential in contrast to the 300 kW case. Larger batteries than 710 kWh are able to rely solely on depot charging and, therefore, cannot save any additional costs via energy cost reduction. Since the investment cost of larger batteries is rising faster compared to the benefit of less battery aging in this area, the costs are rising from this point up to the largest possible battery size. This trend can also be observed at higher payloads. However, the trend is shifted towards larger battery sizes, preventing the minimum at the point of 100% charging at home from being reached. In the LFP case, the costs are decreasing up to the point where no public charging is necessary. Here, the reason lies in the saved energy cost, because of the more expensive public-charged energy.
To show the dependence of the results on the selected parameterization, a sensitivity analysis is shown in Figure 6b, which shows the case of 700 kW and 10 t payload. All parameters shown are decreased and increased by 20%. Of the investigated parameters, the charging price at the home depot shows the smallest influence in the NMC and LFP scenario. It can be observed that a low charging price at home enhances the benefit of oversizing. The cell price shows the same tendencies. Lower cell prices make the initial and possible battery replacement cheaper, which benefits battery oversizing. The annual mileage plays a major role both in required energy over lifetime and aging behavior. Lower annual mileage lowers the benefit of less public charging, and less aging can be observed. These effects contribute to higher cost per km and a smaller benefit of oversizing. The highest sensitivity is shown by the public charging price. By reducing the former by 20%, the tendency switches and higher cost with higher battery capacities can be observed. This emphasizes the importance of public charging prices for the truck operators TCO and for the choice of battery capacity.
The LFP chemistry shows the same sensitivity tendencies. Nevertheless, the impact of the public charging price is even higher, as in the NMC case. All other parameters show a lower sensitivity compared to the NMC analysis. This is mainly caused by the lower cell price and lower cost for the initial investment and battery replacement. This, in combination with higher cycle stability by the LFP chemistry, also leads to less sensitivity to the annual mileage.

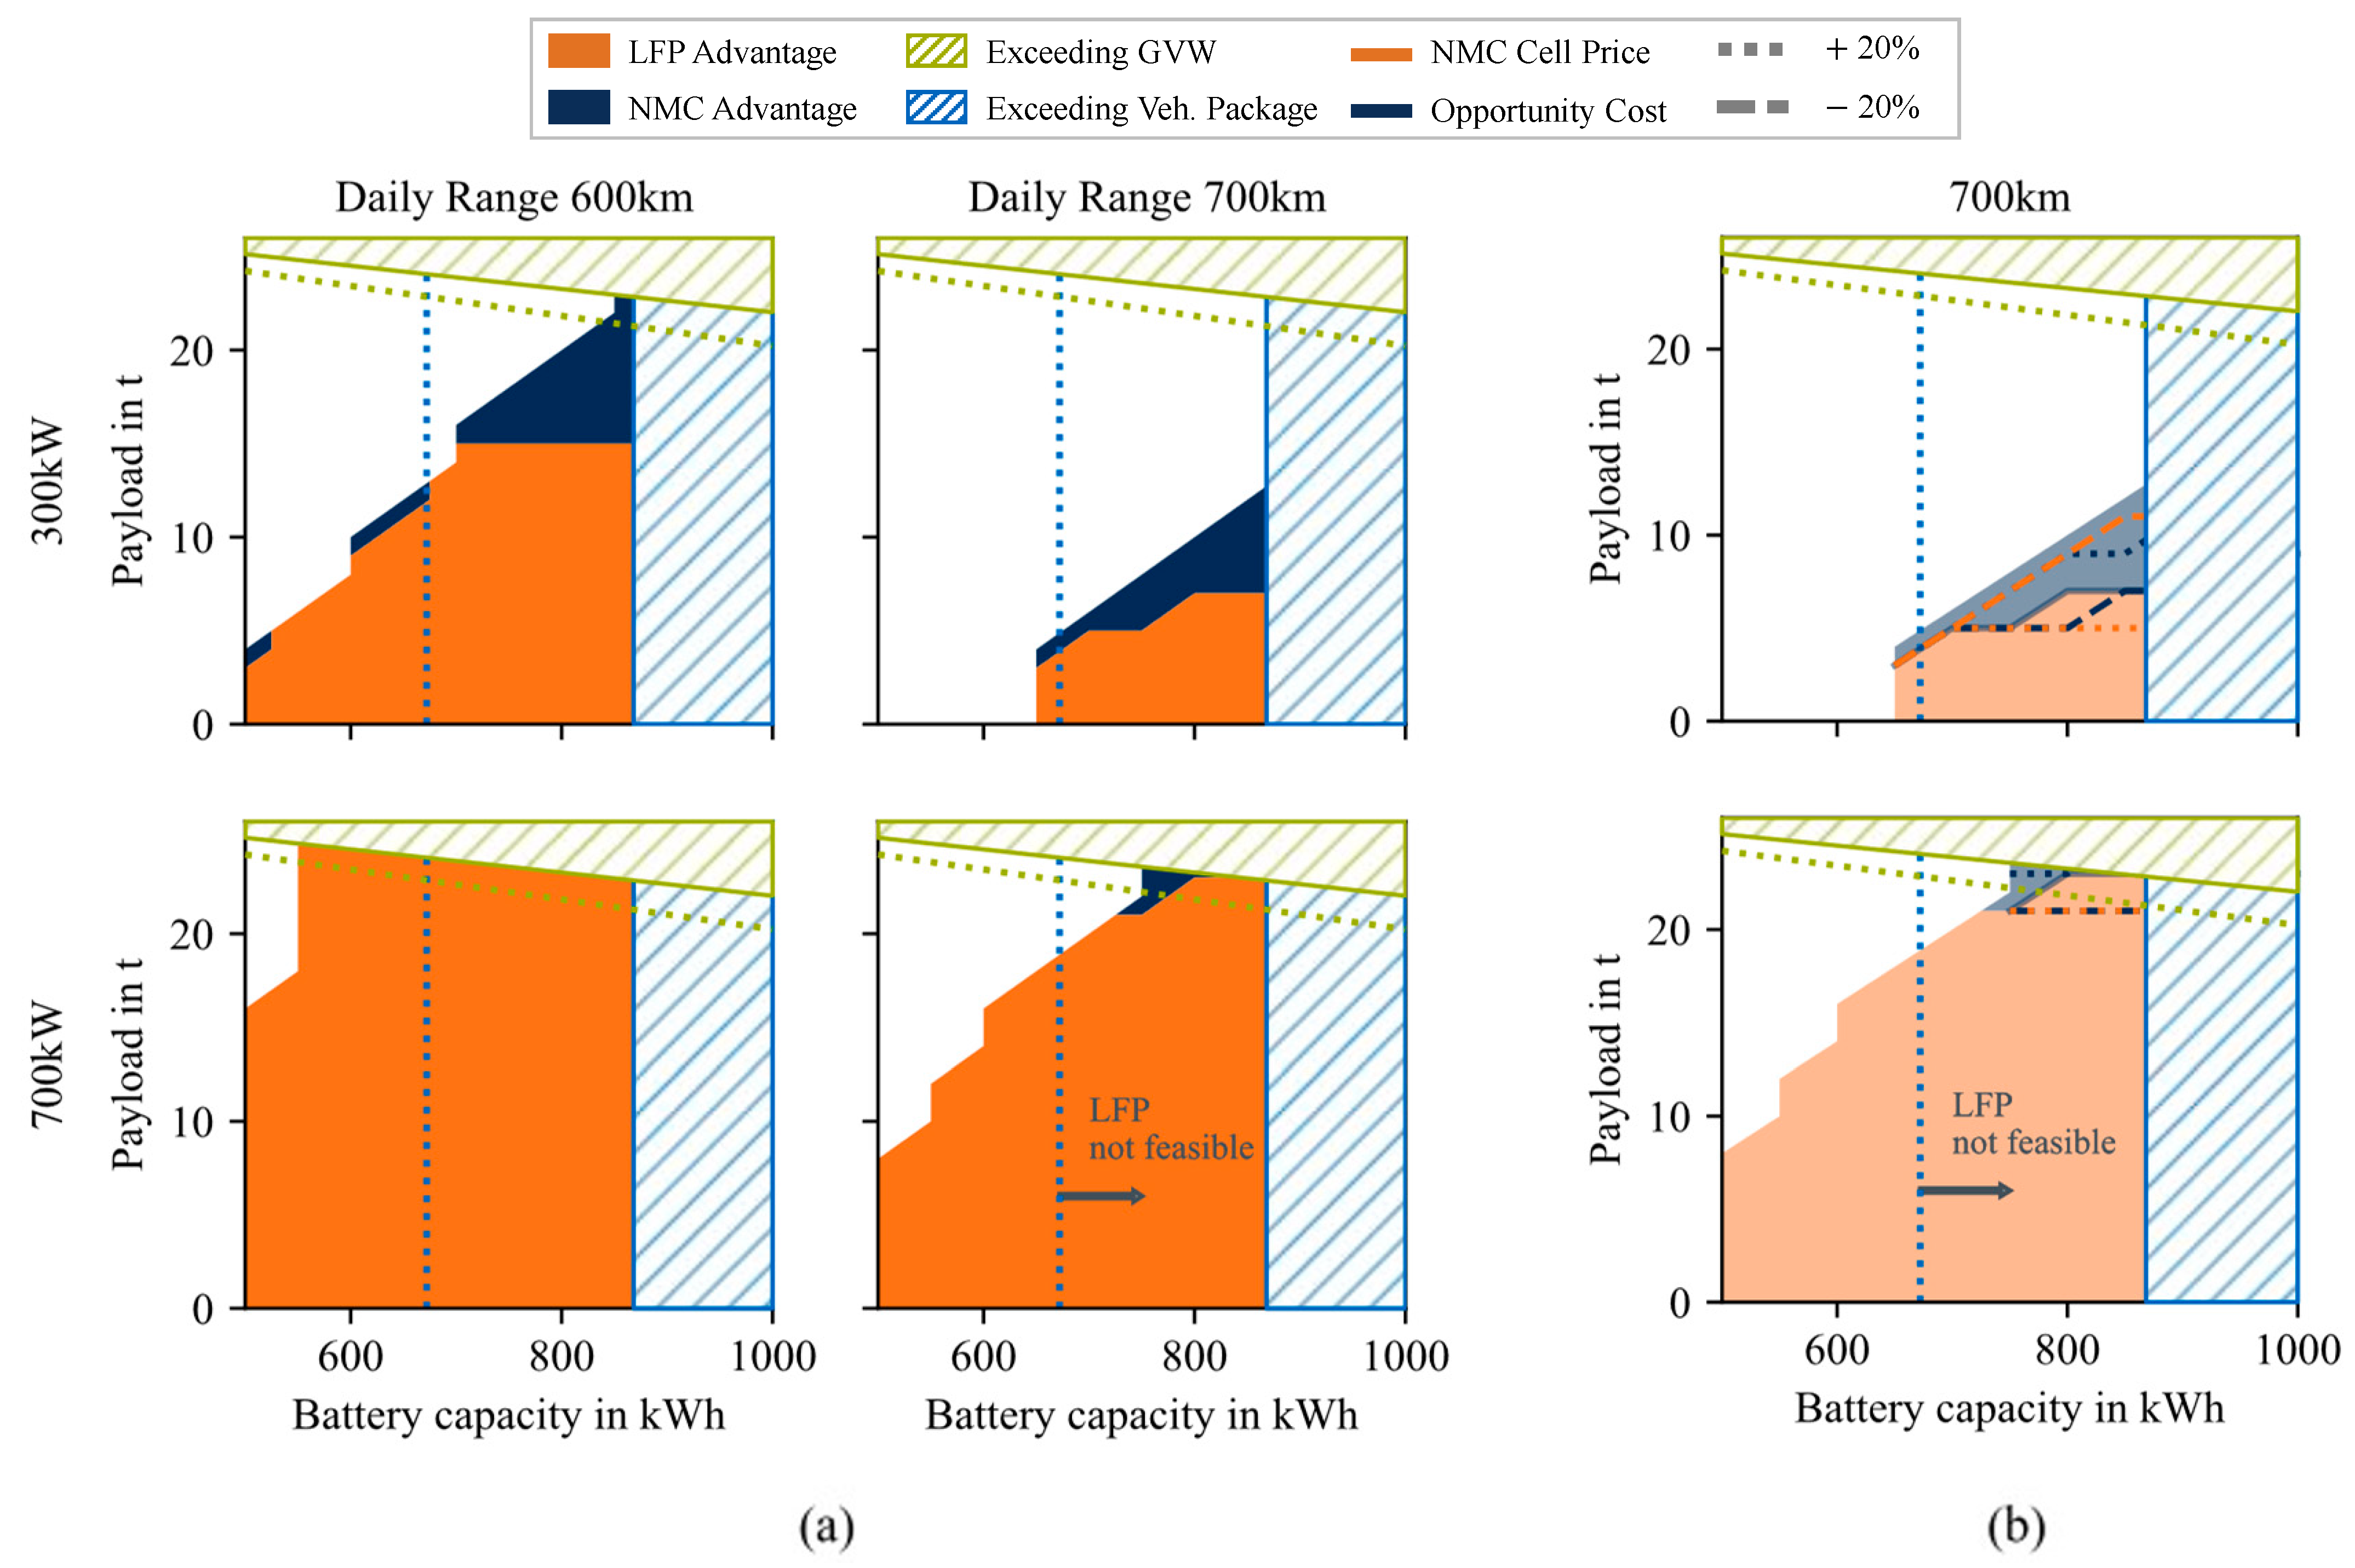
3.3. Cell Chemistry Comparison

Subsequently, the results for both cell chemistries are compared with each other. In Figure 7, the results of this comparison are presented for different use cases and, again, to show the influence of parameterization, they are varied within a sensitivity analysis.
In all figures, the feasibility limits for the LFP as well as those of the NMC are shown. In the range between the LFP and NMC volume limits, the maximum possible design of the LFP chemistry is compared with the correspondingly larger battery capacity of the NMC chemistry. At a specific payload, it is, therefore, possible to install a larger battery using NMC chemistry, thus obtaining the trade-off between the advantages of oversizing and the disadvantage of a higher cell price with the switch to NMC cell chemistry. In cases where higher payloads must be transported, which is possible with a larger NMC battery, but not for the maximum version consisting of LFP, the corresponding NMC version is compared with the maximum possible LFP battery. The difference in the transportable payload is considered as additional costs using opportunity costs.
With charging powers of 300 kW at public charging points, the LFP chemistry is the cost-effective choice for the majority of use cases. A cost advantage is particularly evident in lower payloads of up to 15 t . The NMC chemistry shows cost advantages at the limits of feasibility for battery capacities that both chemistries can cover. Here, the lower weight of the NMC chemistry has the advantage that larger payloads can be transported, and thus, opportunity costs arise if the LFP chemistry is chosen. These exceed the initial cost advantage due to the lower cell cost. With the same battery sizes, this advantage is only seen close to the feasibility limits at 600 k m and 700 k m . In contrast, the NMC chemistry shows a more significant advantage with payloads that are only possible with larger battery sizes than the maximum LFP design. Here, the larger battery generates additional investment costs, but the rising opportunity cost offsets these costs due to the loss of transportable payload. In the case of 600 k m daily mileage and over 16 t , it can be seen that the NMC chemistry is the most cost-effective choice. With a payload of 16 t , it has advantages up to the maximal possible NMC battery size. The same tendency can be seen with higher daily mileage. Here, NMC chemistry is the most cost-effective choice from 8 t up to higher payloads. If a charging power of 700 kW is available, the LFP chemistry can transport a payload similar to the NMC chemistry. This reduces the disadvantages of opportunity costs due to payload loss. A larger battery capacity, which would be possible with the NMC; therefore, no longer brings any advantages. This means that LFP cell chemistry offers cost advantages in the majority of use cases for higher charging powers. Only high payloads as well as high daily range show advantages for the NMC chemistry.
In the sensitivity analysis, the specific opportunity cost c opp and the cell price for the NMC chemistry c spec ,   NMC are varied to evaluate their impact on the results. In the case of 300 kW charging power, the NMC cell price shows considerable sensitivity. With a lower cell price, the NMC cell is the most cost-effective choice for payloads as low as 5 t . If, on the other hand, the cell price rises, the investment for a larger battery capacity increases so much that the advantage of a more transportable payload vanishes. The sensitivity of the specific opportunity cost is lower for larger battery capacities but is also not negligible, and has to be considered individually for every truck operator. In the case of 700 kW , even with high opportunity costs and low NMC cell price, the sensitivity is low, and the LFP chemistry shows cost advantages for nearly all use cases.

4. Discussion

This study answers the questions of which trips can be covered without losing time, which battery size should be selected, and which cell chemistry is the most cost-effective choice for the individual use case. This study therefore stands out from the existing literature due to its holistic approach from a freight forwarder’s point of view, including the aging modeling, and the presentation of sensitivities.
When asked what ranges at what charging power and payload are possible, it becomes apparent that the NMC chemistry has advantages at high payloads and low charging powers. In contrast, the LFP chemistry requires higher charging powers, which are possible with the novel MCS standard, to transport higher payloads over longer distances. This is mainly due to the disadvantage of volumetric energy density, which means that significantly lower maximum battery capacities can be installed. The difference in energy density between NMC and LFP is even more significant at the cell level, but this is offset by the better pack integration due to safety advantages [44,45]. To achieve the same safety properties as the LFP cell, additional material, which prevents thermal propagation, must be installed in the NMC battery pack. This study assumes no additional charging stops, which would mean extra time for the same daily range. Based on expert discussions, time criticality is rated as a high priority for truck operators and has to be minimized as much as possible. However, higher ranges and payloads are possible if additional time is accepted.
The results for the most cost-efficient battery size, show a strong dependence on the charging power. The smallest possible battery size is the most cost-efficient choice at low charging power in all use cases. However, if high charging power is available, both the smallest and largest possible can be the most cost-effective, depending on the public energy cost. In the case of the NMC chemistry, a minimum can be found at the battery size, where no public charging is needed. Additionally, our results show that the reduced aging alone cannot compensate for the additional investment of larger batteries. Still, a cost advantage can arise with a reduced share of publicly charged energy. Here, the price difference between charged energy at home and on the road plays a decisive role, which can differ for each truck operator. For example, truck operators have installed PV systems, which further lower the price at the home depot, or future business models may emerge that guarantee lower charging prices at public charging stations.
When truck operators ask themselves which cell chemistry they should choose for their use case, the results show cost advantages for LFP chemistry in most cases. However, low charging power results in a loss of the payload to be transported, which can be prevented by larger possible battery capacities with the NMC chemistry and thus brings cost advantages for high payloads. However, if higher charging capacities are available, this payload loss is significantly reduced, and the LFP chemistry shows cost advantages in all cases. This results in the recommendation to choose an NMC chemistry during the build-up phase of the infrastructure network and for high payloads to be transported. However, with a well-developed, high-power charging network in the future, LFP chemistry shows cost advantages in all use cases. As the electrification of truck traffic progresses, new trends in battery storage technology for the individual use cases of truck applications should be investigated in addition to the cell chemistries already on the market. Examples include sodium-ion cells [46], solid-state lithium-ion cells [24], or hybrid battery storage systems consisting of lithium-ion batteries with varying characteristics [47].
We acknowledge that this study contains some assumptions and simplifications, such as the optimal placement and availability of charging stations, the neglect of the age-related internal resistance increase, and the premise of the same use case over the entire lifetime. However, we argue that these assumptions allow categorizing the use cases from a freight forwarder’s point of view, and we address most of these limitations in the sensitivity analysis. Since the ranges and available charging capacities vary in different operation days for various freight forwarders, the routes, which show the lowest variance tend to be electrified first, which is in line with the assumption of this study. Nevertheless, we plan to extend the methodology to entire fleets and distributions of use cases in the future to provide carriers with even better recommendations for action. In addition, we encourage other researchers to further enhance the method and evaluate individual use cases, which is made possible by the open-source publication of the source code.

5. Conclusions

The BET will be crucial in transitioning to zero-emission trucking in the coming years. To support the truck operators in this transition and their purchasing decision, this paper analyzes which battery size and which cell chemistry promises the lowest costs for the operator and the individual application. The results show that the NMC chemistry can transport higher payloads at lower charging powers due to the larger installable battery capacity. However, this advantage disappears at higher charging powers, where the LFP chemistry can transport comparable payloads. With currently available charging powers of 300 kW , the results show that the smallest possible battery capacity should always be selected. With higher charging powers of 700 kW , possible with the novel MCS standard, a dependence on the available price at the home depot and public charging points becomes apparent. Due to the decreasing share of publicly charged energy with a larger battery capacity, a cost advantage can be achieved through a larger battery. This is shown for both the NMC and the LFP chemistry. However, the results show significant sensitivity to the energy prices mentioned, which must be evaluated in each use case. A comparison of the two cell chemistries shows that LFP chemistry is the cost-optimal option in most applications. However, losses in the transportable payload occur, especially with high payloads and low charging power, resulting in NMC chemistry being the cost-effective solution. At higher charging powers of 700 kW , the LFP chemistry has cost advantages, even if the opportunity cost and NMC cell price are varied by 20%.

Author Contributions

J.S.: Conceptualization, Methodology, Software, Writing—Original Draft Preparation. J.S. is the first author. O.T.: Methodology, Investigation, Writing—Review and Editing. M.Z.: Investigation, Writing—Review and Editing. K.G.: Investigation, Writing—Review and Editing. M.L. Resources, Supervision, Writing—Review and Editing, Funding acquisition. All authors have read and agreed to the published version of the manuscript.

Funding

The work of J.S. and M.Z. was sponsored by the Federal Ministry for Economic Affairs and Climate Action Germany within the project “NEFTON” under grant number 01MV21004A. The work of O.T. and K.G. was funded by the Federal Ministry of Education and Research Germany within the project “BetterBat” under grant number 03XP0362C and “SolChargE” under grant number 963530.

Data Availability Statement

The source code, used for this study is publicly available via the following link: https://github.com/TUMFTM/BET_BatterySizing_CellChemistry.

Conflicts of Interest

The authors declare no conflicts of interest.

References

  1. European Commission; Directorate-General for Mobility and Transport. EU Transport in Figures: Statistical Pocketbook 2022; Publications Office of the European Union: Luxembourg, 2022. [Google Scholar] [CrossRef]
  2. Statistisches Bundesamt Deutschland. Road Transport: EU-Wide Carbon Dioxide Emissions Have Increased by 24% since 1990; Statistisches Bundesamt: Wiesbaden, Germany, 2023. [Google Scholar]
  3. European Commission; Directorate-General for Climate Action. Going Climate-Neutral by 2050: A Strategic Long-Term Vision for a Prosperous, Modern, Competitive and Climate-Neutral EU Economy; Publications Office: Luxembourg, 2019. [Google Scholar] [CrossRef]
  4. European Union. Verordnung (EU) 2019/1242 des Europäischen Parlaments und des Rates. Off. J. Eur. Union 2019, L 198, 202. [Google Scholar]
  5. European Commission. European Green Deal: Commission Proposes 2030 Zero-Emissions Target for New City Buses and 90% Emissions Reductions for New Trucks by 2040. Available online: https://ec.europa.eu/commission/presscorner/detail/en/ip_23_762 (accessed on 24 December 2023).
  6. Mulholland, E.; Rodríguez, F. Recommendations for Revising the Modalities of Europe’s Heavy-Duty Vehicle CO2 Standards; International Council on Clean Transportation: Washington, DC, USA, 2022. [Google Scholar]
  7. MAN Truck and Bus, SE. NEFTON: MAN Conducts Research in Joint Project for Battery-Electric Freight Transport of the Future; MAN Truck & Bus: Munich, Germany, 2022. [Google Scholar]
  8. Breed, A.K.; Speth, D.; Plötz, P. CO2 fleet regulation and the future market diffusion of zero-emission trucks in Europe. Energy Policy 2021, 159, 112640. [Google Scholar] [CrossRef]
  9. Speth, D.; Funke, S.Á. Comparing Options to Electrify Heavy-Duty Vehicles: Findings of German Pilot Projects. World Electr. Veh. J. 2021, 12, 67. [Google Scholar] [CrossRef]
  10. Basma, H. Total Cost of Ownership for Tractor-Trailers in Europe: Battery Electric Versus Diesel; International Council on Clean Transportation: Washington, DC, USA, 2021. [Google Scholar]
  11. Plötz, P. Hydrogen technology is unlikely to play a major role in sustainable road transport. Nat. Electron. 2022, 5, 8–10. [Google Scholar] [CrossRef]
  12. Wolff, S.; Seidenfus, M.; Brönner, M.; Lienkamp, M. Multi-disciplinary design optimization of life cycle eco-efficiency for heavy-duty vehicles using a genetic algorithm. J. Clean. Prod. 2021, 318, 128505. [Google Scholar] [CrossRef]
  13. Noll, B.; Del Val, S.; Schmidt, T.S.; Steffen, B. Analyzing the competitiveness of low-carbon drive-technologies in road-freight: A total cost of ownership analysis in Europe. Appl. Energy 2022, 306, 118079. [Google Scholar] [CrossRef]
  14. Wolff, S.; Schneider, J.; Balke, G.; Zähringer, M.; Büttner, S.; Schuckert, M.; Jaensch, M. Battery, Hybrid Electric Vehicles—Trucks and Busses—And I would drive 500 miles—With batteries? Encycl. Electrochem. Power Sources, 2023; under review. [Google Scholar]
  15. Teichert, O.; Link, S.; Schneider, J.; Wolff, S.; Lienkamp, M. Techno-economic cell selection for battery-electric long-haul trucks. eTransportation 2023, 16, 100225. [Google Scholar] [CrossRef]
  16. Bundesministerium der Justiz. Straßenverkehrs-Zulassungs-Ordung. 2002. Available online: https://www.gesetze-im-internet.de/stvzo_2012/BJNR067910012.html (accessed on 24 December 2023).
  17. Nykvist, B.; Olsson, O. The feasibility of heavy battery electric trucks. Joule 2021, 5, 901–913. [Google Scholar] [CrossRef]
  18. Mareev, I.; Becker, J.; Sauer, D. Battery Dimensioning and Life Cycle Costs Analysis for a Heavy-Duty Truck Considering the Requirements of Long-Haul Transportation. Energies 2018, 11, 55. [Google Scholar] [CrossRef]
  19. Schneider, J.; Teichert, O.; Zähringer, M.; Balke, G.; Lienkamp, M. The novel Megawatt Charging System standard: Impact on battery size and cell requirements for battery-electric long-haul trucks. eTransportation 2023, 17, 100253. [Google Scholar] [CrossRef]
  20. Babin, A.; Rizoug, N.; Mesbahi, T.; Boscher, D.; Hamdoun, Z.; Larouci, C. Total Cost of Ownership Improvement of Commercial Electric Vehicles Using Battery Sizing and Intelligent Charge Method. IEEE Trans. Ind. Appl. 2018, 54, 1691–1700. [Google Scholar] [CrossRef]
  21. Karlsson, J.; Grauers, A. Case Study of Cost-Effective Electrification of Long-Distance Line-Haul Trucks. Energies 2023, 16, 2793. [Google Scholar] [CrossRef]
  22. Al-Saadi, M.; Olmos, J.; Saez-de Ibarra, A.; van Mierlo, J.; Berecibar, M. Fast Charging Impact on the Lithium-Ion Batteries’ Lifetime and Cost-Effective Battery Sizing in Heavy-Duty Electric Vehicles Applications. Energies 2022, 15, 1278. [Google Scholar] [CrossRef]
  23. Mauler, L.; Dahrendorf, L.; Duffner, F.; Winter, M.; Leker, J. Cost-effective technology choice in a decarbonized and diversified long-haul truck transportation sector: A U.S. case study. J. Energy Storage 2022, 46, 103891. [Google Scholar] [CrossRef]
  24. Depcik, C.; Gaire, A.; Gray, J.; Hall, Z.; Maharjan, A.; Pinto, D.; Prinsloo, A. Electrifying Long-Haul Freight—Part II: Assessment of the Battery Capacity. SAE Int. J. Commer. Veh. 2019, 12, 87–102. [Google Scholar] [CrossRef]
  25. EU Parlament. Verordnung (EG) Nr. 561/2006 Des Europäischen Parlaments und Des Rates vom 15. März 2006 zur Harmonisierung bestimmter Sozialvorschriften im Straßenverkehr und zur Änderung der Verordnungen (EWG) Nr. 3821/85 und (EG) Nr. 2135/98 des Rates sowie zur Aufhebung der Verordnung (EWG) Nr. 3820/85 des Rates. Off. J. Eur. Union 2006, L 102, 1. [Google Scholar]
  26. MAN Truck and Bus SE. eMPOWERING You. All the Way. So Navigiert Sie MAN zur Erfolgreichen Flottenelektrifizierung: Emobilität auf dem Nächsten level: DER massgeschneiderte man eTRUCK; MAN Truck & Bus: Munich, Germany, 2023. [Google Scholar]
  27. Teichert, O.; Müller, F.; Lienkamp, M. Techno-Economic Design of Battery Thermal Management Systems for Lithium-Ion-Based Stationary Energy Storage Supporting Fast Charging Stations in Different Climates. J. Energy Storage 2022, 48, 103832. [Google Scholar] [CrossRef]
  28. Wassiliadis, N.; Schneider, J.; Frank, A.; Wildfeuer, L.; Lin, X.; Jossen, A.; Lienkamp, M. Review of fast charging strategies for lithium-ion battery systems and their applicability for battery electric vehicles. J. Energy Storage 2021, 44, 103306. [Google Scholar] [CrossRef]
  29. Teichert, O.; Schneider, J.; Lienkamp, M. Strategy beats power: Cooling system design for battery-electric long-haul trucks. In Proceedings of the 35th International Electric Vehicle Symposium and Exhibition (EVS35), Oslo, Norway, 11–15 June 2022. [Google Scholar]
  30. Wassiliadis, N.; Steinsträter, M.; Schreiber, M.; Rosner, P.; Nicoletti, L.; Schmid, F.; Ank, M.; Teichert, O.; Wildfeuer, L.; Schneider, J.; et al. Quantifying the state of the art of electric powertrains in battery electric vehicles: Range, efficiency, and lifetime from component to system level of the Volkswagen ID.3. eTransportation 2022, 12, 100167. [Google Scholar] [CrossRef]
  31. Schmalstieg, J.; Käbitz, S.; Ecker, M.; Sauer, D.U. A holistic aging model for Li(NiMnCo)O2 based 18650 lithium-ion batteries. J. Power Sources 2014, 257, 325–334. [Google Scholar] [CrossRef]
  32. Naumann, M.; Schimpe, M.; Keil, P.; Hesse, H.C.; Jossen, A. Analysis and modeling of calendar aging of a commercial LiFePO4/graphite cell. J. Energy Storage 2018, 17, 153–169. [Google Scholar] [CrossRef]
  33. Naumann, M.; Spingler, F.B.; Jossen, A. Analysis and modeling of cycle aging of a commercial LiFePO4/graphite cell. J. Power Sources 2020, 451, 227666. [Google Scholar] [CrossRef]
  34. Downing, S.; Socie, D. Simple rainflow counting algorithms. Int. J. Fatigue 1982, 4, 31–40. [Google Scholar] [CrossRef]
  35. Link, S.; Plötz, P.; Griener, J.; Moll, C. Lieferverkehr mit Batterie-Lkw: Machbarkeit 2021—Fallbeispiel REWE Group—Region Nordost; Fraunhofer ISI: Karlsruhe, Germany, 2021. [Google Scholar]
  36. Möller, M.; Kucevic, D.; Collath, N.; Parlikar, A.; Dotzauer, P.; Tepe, B.; Englberger, S.; Jossen, A.; Hesse, H. SimSES: A holistic simulation framework for modeling and analyzing stationary energy storage systems. J. Energy Storage 2022, 49, 103743. [Google Scholar] [CrossRef]
  37. Teichert, O. Battery Design for Battery-Electric Long-Haul Trucks. Ph.D Thesis, Technical University Munich, Munich, Germany, 2023. [Google Scholar]
  38. Lienhard, J.H., IV; Lienhard, J.H.V. A Heat Transfer Textbook, 5th ed.; Dover Publications: Mineola, NY, USA, 2019. [Google Scholar]
  39. Schimpe, M.; Naumann, M.; Truong, N.; Hesse, H.C.; Santhanagopalan, S.; Saxon, A.; Jossen, A. Energy efficiency evaluation of a stationary lithium-ion battery container storage system via electro-thermal modeling and detailed component analysis. Appl. Energy 2018, 210, 211–229. [Google Scholar] [CrossRef]
  40. König, A.; Nicoletti, L.; Schröder, D.; Wolff, S.; Waclaw, A.; Lienkamp, M. An Overview of Parameter and Cost for Battery Electric Vehicles. World Electr. Veh. J. 2021, 12, 21. [Google Scholar] [CrossRef]
  41. Unterlohner, F. How to Decarbonise Long Haul Trucking in Germany: An Analysis of Available Vehicle Technologies and Their Associated Costs; Transport & Environment: Brussels, Belgium, 2021. [Google Scholar]
  42. Ionity GmbH. Current Price Informations. Available online: https://ionity.eu/en/network/access-and-payment (accessed on 24 December 2023).
  43. Hunter, C.; Penev, M.; Reznicek, E.; Lustbader, J.; Birky, A.; Zhang, C. Spatial and Temporal Analysis of the Total Cost of Ownership for Class 8 Tractors and Class 4 Parcel Delivery Trucks; National Renewable Energy Laboratory: Golden, CO, USA, 2021. [CrossRef]
  44. Said, A.O.; Lee, C.; Stoliarov, S.I. Experimental investigation of cascading failure in 18650 lithium ion cell arrays: Impact of cathode chemistry. J. Power Sources 2020, 446, 227347. [Google Scholar] [CrossRef]
  45. Schöberl, J.; Ank, M.; Schreiber, M.; Wassiliadis, N.; Lienkamp, M. Thermal runaway propagation in automotive lithium-ion batteries with NMC-811 and LFP cathodes: Safety requirements and impact on system integration. eTransportation 2023, 100305. [Google Scholar] [CrossRef]
  46. Zhao, L.; Zhang, T.; Li, W.; Li, T.; Zhang, L.; Zhang, X.; Wang, Z. Engineering of Sodium-Ion Batteries: Opportunities and Challenges. Engineering 2023, 24, 172–183. [Google Scholar] [CrossRef]
  47. Naseri, F.; Barbu, C.; Sarikurt, T. Optimal sizing of hybrid high-energy/high-power battery energy storage systems to improve battery cycle life and charging power in electric vehicle applications. J. Energy Storage 2022, 55, 105768. [Google Scholar] [CrossRef]
Figure 1. Market overview of proposed BET models for the European market and the user-relevant properties [14].
Energies 17 00158 g001
Figure 2. Schematic flowchart of the developed method. Based on a defined scenario, which is based on EU regulation, and the subsequently derived power profile, the thermal and electric values are calculated and passed into an aging model to calculate the lifetime for the cell at the given conditions. This lifetime information is used to calculate the cost per km and compares both investigated chemistries.
Energies 17 00158 g002
Figure 3. (a) Schematic scenario definition, based on EU Regulation 561/2006; (b) derived demand–power profile based on a longitudinal dynamics model and the repeated VECTO—long-haul cycle.
Energies 17 00158 g003
Figure 4. Method overview, showing the electro-thermal aging model and the resulting SOC and battery lifetime. These results are used to investigate which use case is feasible and which battery size is the cost-effective choice.
Energies 17 00158 g004
Figure 5. Results of the feasibility analysis. The shaded areas represent the use cases that are feasible at the end of life of the battery without time loss. Next to the shaded areas, which depend on the charging power as well as the targeted range, the gravimetric and volumetric feasibility edges are shown. It can be seen that the LFP chemistry requires high charging power in order to make up for less installable battery capacity. When using NMC chemistry, higher payloads can be transported at lower charging power due to the possibility of installing more battery capacity.
Energies 17 00158 g005
Figure 6. Battery-related costs at every investigated use case. In (a), the battery-related costs at every feasible use case are shown. For 300 kW , oversizing results in higher costs in comparison to 700 kW , where lower costs with rising battery capacity can be achieved. In (b), a sensitivity analysis shows that the en-route charging price has the highest impact, and weather oversizing is cost-effective.
Energies 17 00158 g006
Figure 7. Cost comparison between the LFP and the NMC cell chemistry. In (a), the comparison of two different charging powers as well as different daily driving ranges shows that at low charging powers and high payloads, NMC shows advantages. In all other use cases, LFP shows cost advantages. In (b), the sensitivity analysis shows high sensitivity by the NMC cell price.
Energies 17 00158 g007
Table 1. Parametrization according to the shown method.
SectionParameterValueSource
Power Profile c A 5.2   m 2 [4]
c rr 0.005 [4]
P aux 2.3   kW [15]
m w / o   bat 13,765 kg[19]
Thermal/Aging R cell ,   h 1.11   K W 1 [37]
R h ,   amb 0.092   K W 1 [37]
c aluminium 896  J   k g 1   K [38]
P cool 10  kW [39]
C O P cool 3 [39]
T cool , on 33  C [30]
T cool , off 31.5   C [30]
k scale 0.43 [30]
k scale 0.43 [30]
Feasibility m gvw ,   max 42  t [16]
V bat ,   max 3250  L [15]
S O C RA 5%
ρ gravimetric ,   NMC 273  Wh   k g 1 [30]
ρ gravimetric ,   LFP 176  Wh   k g 1 [19]
z c 2 p , grav ,   NMC 0.59 [30]
z c 2 p , grav ,   LFP 0.71 [19]
ρ volumetric ,   NMC 685  Wh   L 1 [30]
ρ volumetric ,   LFP 376  Wh   L 1 [19]
z c 2 p , vol ,   NMC 0.39 [30]
z c 2 p , vol ,   LFP 0.55 [19]
Δ t s
Cost Model c spec ,   NMC 140 kWh 1 [23]
c spec ,   LFP 100 kWh 1 [23]
z c , c 2 s 2.07 [40]
z scr 15%[15]
t own 8 a [13]
s annual 130,000 km[41]
c sc , 22 kW 0.252   kWh 1 [15]
c fc , 400 kW 0.79   kWh 1 [42]
c opp 0.041   t 1 k m [43]
r 1.095 [15]
Disclaimer/Publisher’s Note: The statements, opinions and data contained in all publications are solely those of the individual author(s) and contributor(s) and not of MDPI and/or the editor(s). MDPI and/or the editor(s) disclaim responsibility for any injury to people or property resulting from any ideas, methods, instructions or products referred to in the content.

