Abstract
Static axial induction control and tilt control are two strategies that have the potential to increase power production in wind farms, mitigating wake effects and increasing the available power for downstream turbines. In this study, wind tunnel experiments are performed to evaluate the efficiency of these two techniques. First, the axial induction of upstream turbines in wind farms comprising two, three, and five turbines is modified through the tip-speed ratio. This strategy is found to be ineffective in increasing power extraction. Next, the power extraction and flow through a two-turbine wind farm are evaluated, considering different tilt angles for the upstream turbine, under two levels of incoming flow turbulence intensities and turbine spacing distances. It is shown that forward tilting increases the overall power extraction by deflecting the wake downwards and promoting the entrainment of high-speed fluid in the upper shear layer, regardless of the turbine spacing distance and turbulence intensity level. Also, the wake is seen to recover faster due to the increased shear between the wake and the outer flow. Tilting a turbine backward deflects the wake upwards and pulls low-speed flow from under the turbine into the wake space, increasing the available power for downstream turbines, but it is not enough to increase global power extraction. Moreover, since the wake deflection under backward tilting is not limited by ground blockage, it leads to larger secondary steering compared with forward tilting. Finally, it is demonstrated that the secondary steering of the downstream turbine’s wake influences the flow encountered by a turbine positioned farther downstream.
1. Introduction
Wind energy has experienced exponential growth in installed capacity and electricity generation in the last two decades, reaching 900 GW and 2100 TWh in 2022, respectively [1]. Furthermore, all the scenarios proposed by the International Energy Agency contemplate that this growth will continue in the near future [1]. The construction of large offshore wind farms is a promising alternative that can be key to continuing this increase, as offshore environments offer reduced social impact, low turbulence—due to thermal stability and low surface roughness—and high capacity factors [2]. However, wind turbine wake recovery rates are lower in these typical offshore conditions.
Currently, most of the power production from wind comes from wind farms rather than isolated wind turbines due to lower construction, maintenance, commissioning, and grid connection costs [2]. In wind farms, wind turbines impact each other through their wakes, i.e., flow regions of reduced wind speed and increased turbulence, which appear downstream, as turbines extract kinetic energy from the wind through the rotation of their blades. Wakes are the most important turbine-induced flow phenomena, accounting for a substantial reduction in overall power production within a wind farm compared to its nominal power capacity (i.e., the sum of the wind turbines’ nominal power) [3,4]. In fact, in a fully aligned configuration, the global power produced can drop up to 60% of its nominal power for certain wind directions [5,6,7]. One approach to mitigate the wake effect could be to increase the turbine inter-spacing, allowing the outer flow to entrain and the wake to recover to the undisturbed level. However, a streamwise spacing of between 15 and 20 rotor diameters would be necessary to fully recover the wake [8], and considering the diameter of current wind turbines (i.e., 100 to 250 m), the areas needed to place wind farms would make their operation and maintenance very complex and costly [9]. In the literature, several wake mitigation strategies have been proposed in order to solve the aforementioned concern. All of them consist of operating upstream wind turbines outside of their optimal operation point (e.g., modifying their axial induction or misaligning the rotor shaft and the incoming wind direction) to weaken their wakes, accelerate their recovery by increasing their mixing with the outer flow, or deflect them from downstream turbines, increasing the available power for downstream machines. Therefore, maximum power is not necessarily obtained by running all the turbines at optimum conditions. If the increase in the power extraction of downstream turbines outweighs the loss of upstream ones, the overall power extraction increases [3,10,11,12].
The wake can be redirected through intentional yaw or tilt misalignment. When a wind turbine is yawed or tilted, since the wind direction happens to have a certain angle with respect to the rotor shaft, the effective area of the turbine is reduced together with its power extraction. However, the wake is deflected from downstream turbines due to a horizontal (yaw) or vertical (tilt) component of the thrust force induced on the flow, thereby increasing their power generation [13,14,15]. So far, yaw misalignment has attracted most of the interest, as it can be readily applied to wind farms with existing wind turbine technology [5,11,12,13,14]. Yet, recent studies have explored tilt control as a strategy to increase the wind farm’s power and compared it to yaw control, suggesting that even larger increments of power can be obtained [16,17,18]. It should be mentioned that forward tilting would cause the blades to collide against the tower. Hence, encouraged by promising results, creative ways to introduce this degree of freedom without collision are being investigated [19,20]. From an experimental point of view, Nanos et al. [19] explored the viability of tilting floating wind turbines through active ballast control and performed wind tunnel experiments using a cluster of two turbines. They showed an increase in power extraction of 7.9% using forward tilt (20°) and a decrease of −3.7% using backward tilt (−20°). The authors attributed this asymmetric behavior to the fact that the flow occupying the wake’s space in each case has different kinetic energy due to shear in the incoming flow. Scott et al. [21] observed a higher velocity deficit when deflecting the wake upwards (i.e., compared to downward deflecting), and this high deficit persisted downstream. The theoretical available power downstream of a tilted turbine, calculated in [16,22], showed good agreement with the aforementioned results, confirming the significant asymmetry between forward and backward tilt. Other studies have approached the technique from a numerical perspective, concluding that forward tilt is the deflection strategy that leads to the highest increase in global power extraction [15,17] (e.g., more than yaw misalignment). Fleming et al. [15,17] also observed how several key loads show different trends between forward and backward tilt.
The wake of a tilted wind turbine has been characterized both experimentally [16] and numerically [22]. Bossuyt et al. [16] performed cross-plane flow measurements and showed how the blockage of the ground, along with the low energetic and turbulent flow, causes the wake to spread laterally when it is downward deflected. In contrast, less eccentric wakes were observed for upward deflection. Simulations using two turbine hub heights [22] also showed how the ground prevents the wake from deflecting farther. Irrespective of the tilt direction, counter-rotating vortex pairs have been observed to induce wake deflection [16,22,23]. In fact, counter-rotating vortices originating from high tilt angles (i.e., ≥15) can persist for more than one turbine spacing downstream, accelerating the recovery of a downstream turbine wake [22,24,25]. Floor blockage could also have an effect on the production of the tilted turbine [26]. The power performance of a wind turbine under a wide range of tilt angles has not yet been experimentally studied and is one of the objectives of this study.
Alternatively, modifying the axial induction can also lead to higher power extraction. Through wind tunnel experiments, Adaramola and Krogstad [27] and Bartl and Saetran [28] studied the effect of modifying the axial induction factor of an upstream wind turbine through both the pitch angle and the tip-speed ratio (i.e., TSR) on the overall power extraction of a set of two aligned turbines. Adaramola and Krogstad [27] observed an increase of around 4% in wind farm efficiency by applying blade pitch control compared to a baseline case. Operating the upstream turbine away (i.e., higher and lower) from its optimal TSR led to an increase in power extraction from the downstream turbine. However, wind farm efficiency was only seen to increase by about 3% when the upstream turbine was operated at a higher TSR than its optimal value. Bartl and Saetran [28] observed an increase in the downstream turbine’s power only when the upstream one was pitched to feather or operated at a lower TSR than optimal (i.e., in disagreement with [27]). Even so, this gain was equivalent to the loss of that in the upstream turbine in the best configurations, and the total power output either remained constant or decreased. The difference observed in these two studies could come from operating the turbines at different turbulence intensity levels or from having different airfoil shapes and thrust curves. Campagnolo et al. [29] performed wind tunnel experiments, placing two columns of three wind turbines to evaluate the effect of downrating the first row of turbines on the overall power extraction. They did not see any gain in global power. Recent studies with more than two turbines have concluded that modifying the axial induction has its maximum impact on the next downstream turbine, and the power gain is marginally higher for turbines farther downstream [30,31]. Lee et al. [32] used the blade element momentum theory, the eddy viscosity model, and a genetic algorithm to optimize the pitch configurations of individual turbines in the Horns Rev wind farm. They suggested a possible increase in global power extraction of 4.5%. In spite of this, an increase in power extraction was evident from the fourth row onward. Dilip and Porté-Agel [33] performed an LES study of a two-turbine setup and found that the atmospheric turbulence had a strong effect on the feasibility of this strategy. They observed that pitching the upstream turbine to stall increased the thrust and, consequently, the velocity deficit in the near wake. However, a higher shear between the wake and outer flow led to faster recovery. An increase of 2.8% in the overall power extraction was seen for a hub-height turbulence intensity of 4.3%. In general, no overall power gain was observed for higher turbulence intensities. As mentioned, contradictory results can be found in the literature regarding static axial induction control. Most experimental studies consider wind farms of only two turbines and provide crucial first results on the effectiveness of the strategy, which are not sufficient to assess its potential in larger, more realistic wind farms. Experimental studies are needed for both analyzing the ability of static induction control to mitigate the wake effect in a large wind farm and providing data for the validation of CFD simulations.
The current wind tunnel investigation aims to gain insights into the effectiveness of static axial induction control and tilt control to increase overall power in a wind farm. Moreover, the effect of tilting a turbine on both its wake evolution and that of a downstream turbine is investigated. Section 2 describes the experimental setup and incoming boundary layer characteristics. The results are described in Section 3. The power measurements are discussed in Section 3.1.1 (induction control) and Section 3.1.2 (tilt control). A flow analysis is performed in Section 3.2, focusing on wake deflection (Section 3.2.1), wake recovery (Section 3.2.2), and secondary steering (Section 3.2.3). Finally, Section 4 summarizes the main conclusions of this study and presents ideas for future research.
2. Experimental Setup
Experiments were conducted in the boundary layer wind tunnel at the WiRE laboratory of EPFL. The wind tunnel test section measures 28 m in length, 2.6 m in width, and 2 m in height. A 130 kW fan powers the closed-loop wind tunnel, enabling a maximum free-stream velocity of 25 m/s and a typical free-stream turbulence intensity of 0.5%. A contraction with a 5:1 area ratio is present at the inlet of the test section, from where a boundary layer develops over the surface under approximately zero pressure gradient, which resembles the boundary layer found in a real atmosphere under neutral stratification.
The miniature turbine WiRE-01 [34,35] was used to perform the experiments. This turbine was specifically designed to have thrust and power coefficients comparable to full-scale commercial turbines. The rotor diameter D is 15 cm and the hub heights for the axial induction experiments and tilt experiments are 20.5 cm and 15.5 cm, respectively. This gives a ratio of D to , which is comparable to that in large-scale wind turbines [36]. The hub height was increased for the axial induction control experiments to reduce the turbulence intensity level. The ratio between the frontal area of the wind turbine and the wind tunnel cross-sectional area is less than 0.003. Therefore, blockage effects are negligible.
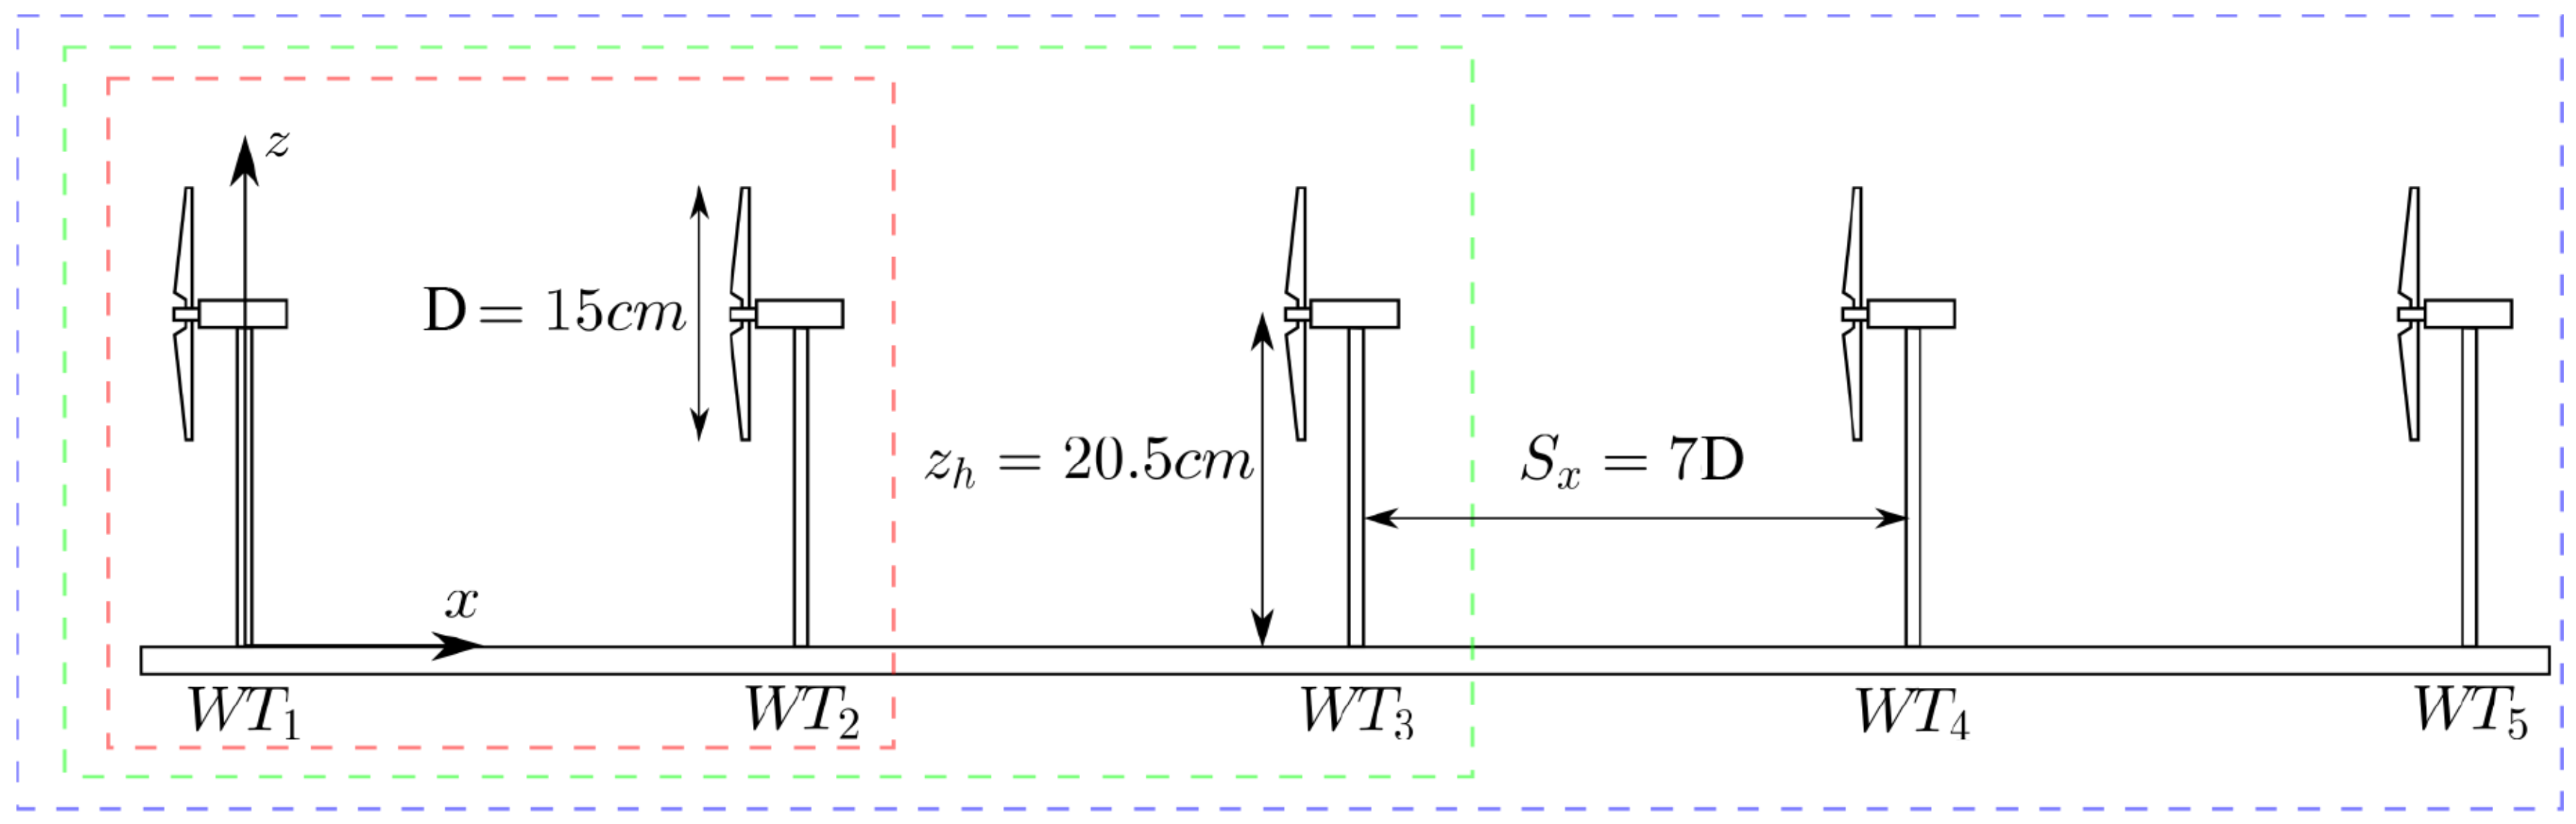
The effect of modifying the axial induction factor on the overall power was first tested in a wind farm with two turbines. The results of these first experiments allowed for comparison with previous studies and a reduction in the number of cases studied in larger wind farms. The rotational speed of the upstream turbine was modified in increments of 100 rpm (i.e., 4.5% of its optimal value, which implies a change of around 1 in the angle of attack), varying the TSR from 2.8 to 4.8, with 3.6 being the optimal value. To further assess the technique, it was applied to a wind farm with three and five wind turbines. For the three-turbine case, the first and second turbines were operated down to an 82% of their optimal rotational speed in 4.5% increments, whereas the third turbine was always operated at an optimal TSR (i.e., 25 combinations). For the sake of completeness, we included scenarios in which the second turbine was operated farther from its optimal operation point compared to the first turbine. For the five-turbine case, however, to limit the studied cases and examine the cumulative effect of the strategy, the downstream turbines were operated either as far from their optimal points as the upstream ones or closer (i.e., as a percentage). The upstream turbines were, again, operated down to an 82% of their optimal rotational speed in 4.5% increments. The excluded scenarios are considered less promising since this technique aims to enhance wind farm power production by increasing the available power for downstream turbines. Therefore, downrating upstream turbines is more likely to be advantageous, as there are more turbines downstream that can benefit from it. Throughout the experiments, the optimal TSR of all turbines was measured for each configuration, meaning that it was changed any time an upstream turbine modified its TSR. The turbine inter-spacing in the three cases was 7D, and the turbines were placed in one column under full wake conditions. A scheme of the setup placed in the wind tunnel can be seen in Figure 1.
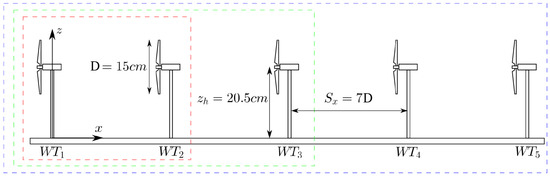
Figure 1.
Sketch of the wind farms tested in the axial induction control experiments (not to scale).
A hot-wire probe, consisting of a 5 m tungsten wire, was used to characterize the incoming boundary layer profile for the axial induction control experiments. The hot-wire anemometer was calibrated with a Dantec calibrator before and after the measurements. Data at each point were collected for 90 s at a rate of 10 kHz. Vertical profiles from cm to cm every 2 cm and from cm to cm every 4 cm were captured. Figure 2 shows the incoming streamwise velocity and turbulence intensity. The hub-height velocity was used as a reference to normalize the quantities (i.e., for the axial induction measurements, m/s). Based on the results from a previous LES study [33], a relatively low level of hub-height turbulence intensity of 4% was selected to create a favorable environment for the technique to be effective. Throughout this study, the turbulence intensity is defined as the ratio between the standard deviation of the streamwise velocity and the incoming flow’s hub-height velocity ( and for the axial induction and tilt experiments, respectively).
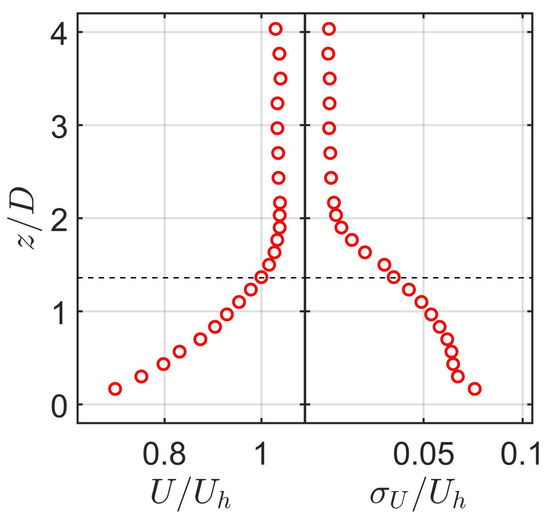
Figure 2.
Incoming boundary layer characteristics for the axial induction control experiments. The black dashed line represents the hub height.
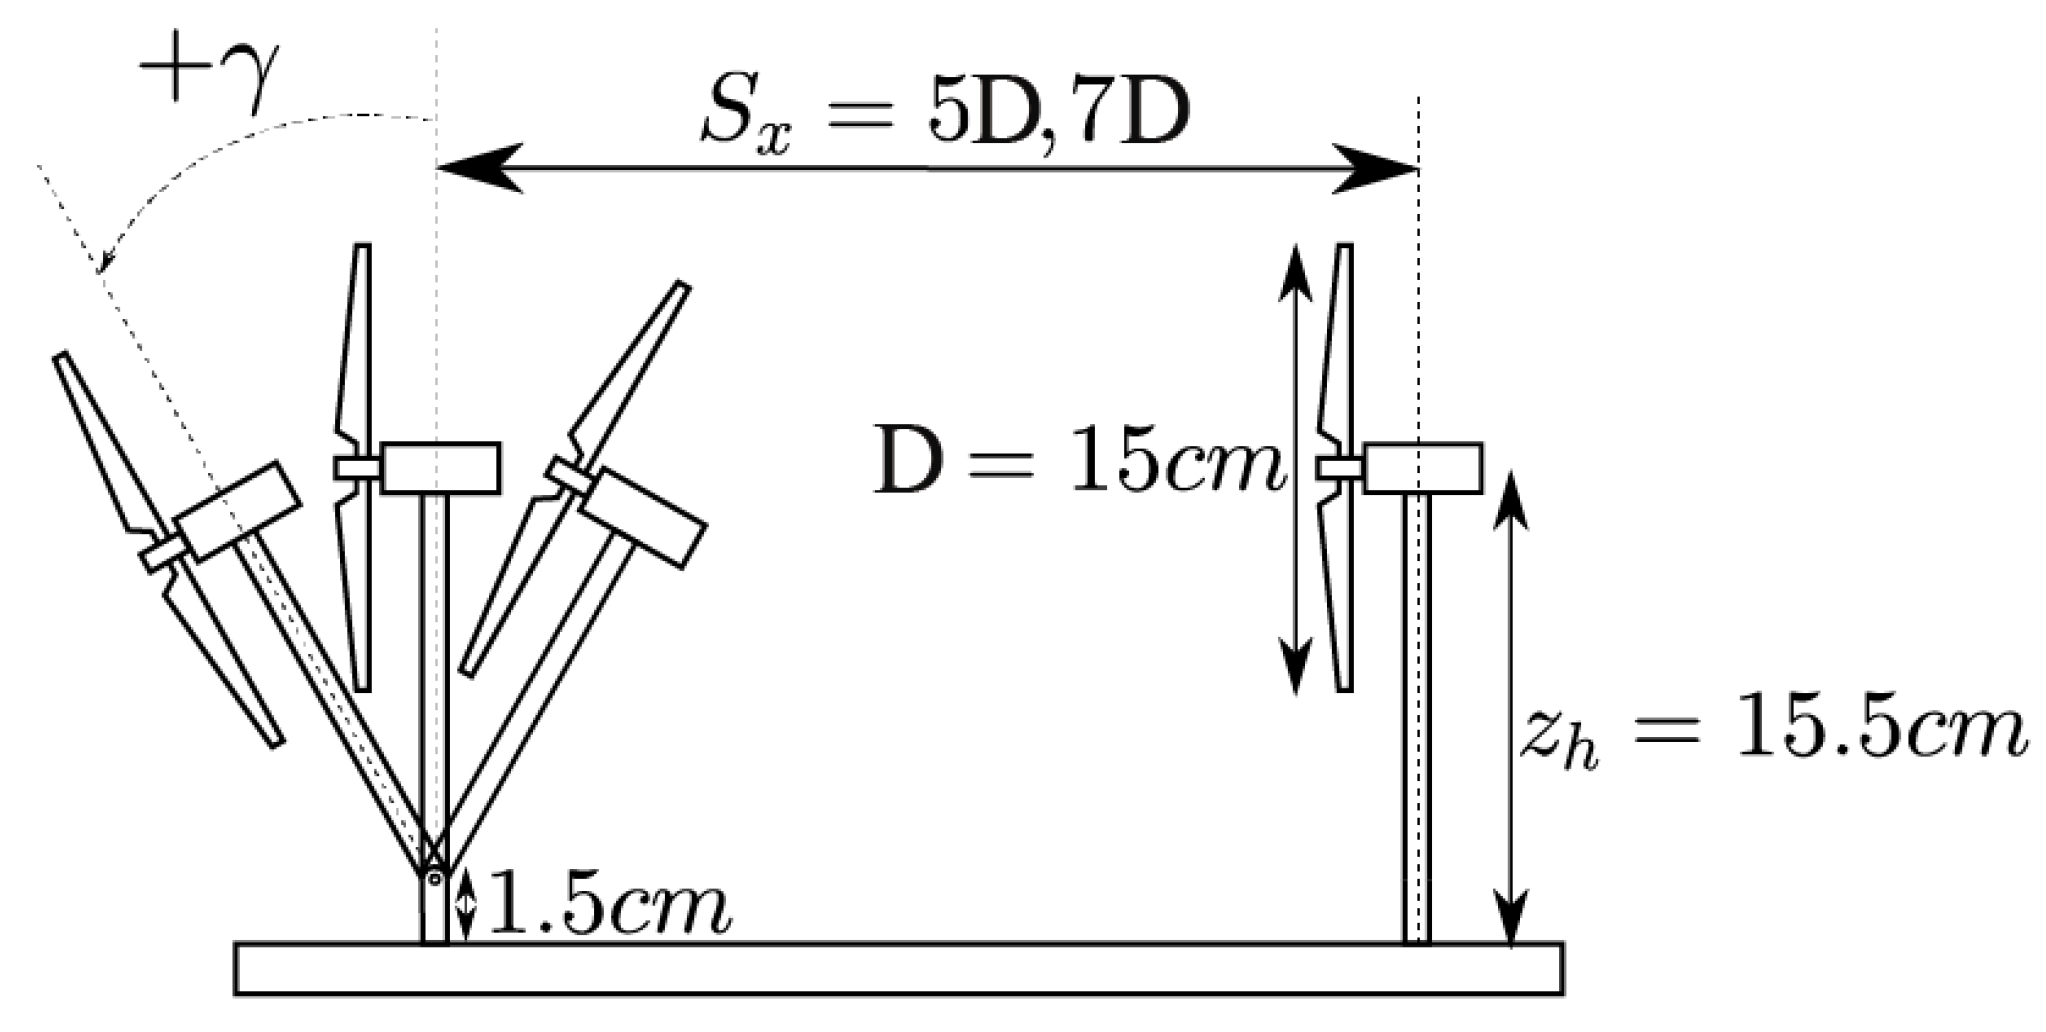
The ability of tilt control to enhance global power production was tested in a two-turbine wind farm, tilting the upstream turbine forward and backward up to an angle of in increments of (i.e., eleven tilt angles). The tilt angle of the turbine was controlled manually through a pivot installed at the bottom of the tower. In this way, both the turbine and the tower were tilted, keeping the rotor-tower distance constant as if active ballast control was used [19]. As a result of the tilting system used, the hub height and streamwise turbine spacing slightly varied with the tilt angle. To calculate these variations, one has to consider the tilt angle and the rotor-tower distance (i.e., 2 cm). The hub height decreased by 0.17D in the most extreme configuration, i.e., , and the turbine spacing showed variations of +0.57D and −0.21D for and , respectively. As an example, the maximum hub-height reduction (i.e., 0.17D) is calculated as , where 1.5 mm is the lower part of the tower that was not tilted, 14 mm is the length of the tilted part of the tower, and 3 mm is the distance between the rotor plane and the tower. Additionally, the impact of turbine spacing and turbulence intensity on the strategy was analyzed. To achieve this, experiments were conducted by placing the turbines at distances of 5D and 7D and two levels of streamwise turbulence intensity. A greater turbulence intensity was achieved by increasing surface roughness using straight chains, approximately 5 mm in height and perpendicular to the flow. These chains were placed every 40 cm throughout the test section, even within the wind farm. To sum up, the eleven tilt angles were tested across four configurations—two turbine spacing distances and two levels of streamwise turbulence intensity. A scheme of the setup placed in the tunnel can be seen in Figure 3.

Figure 3.
Sketch of the wind farm in the tilt control experiments (not to scale).
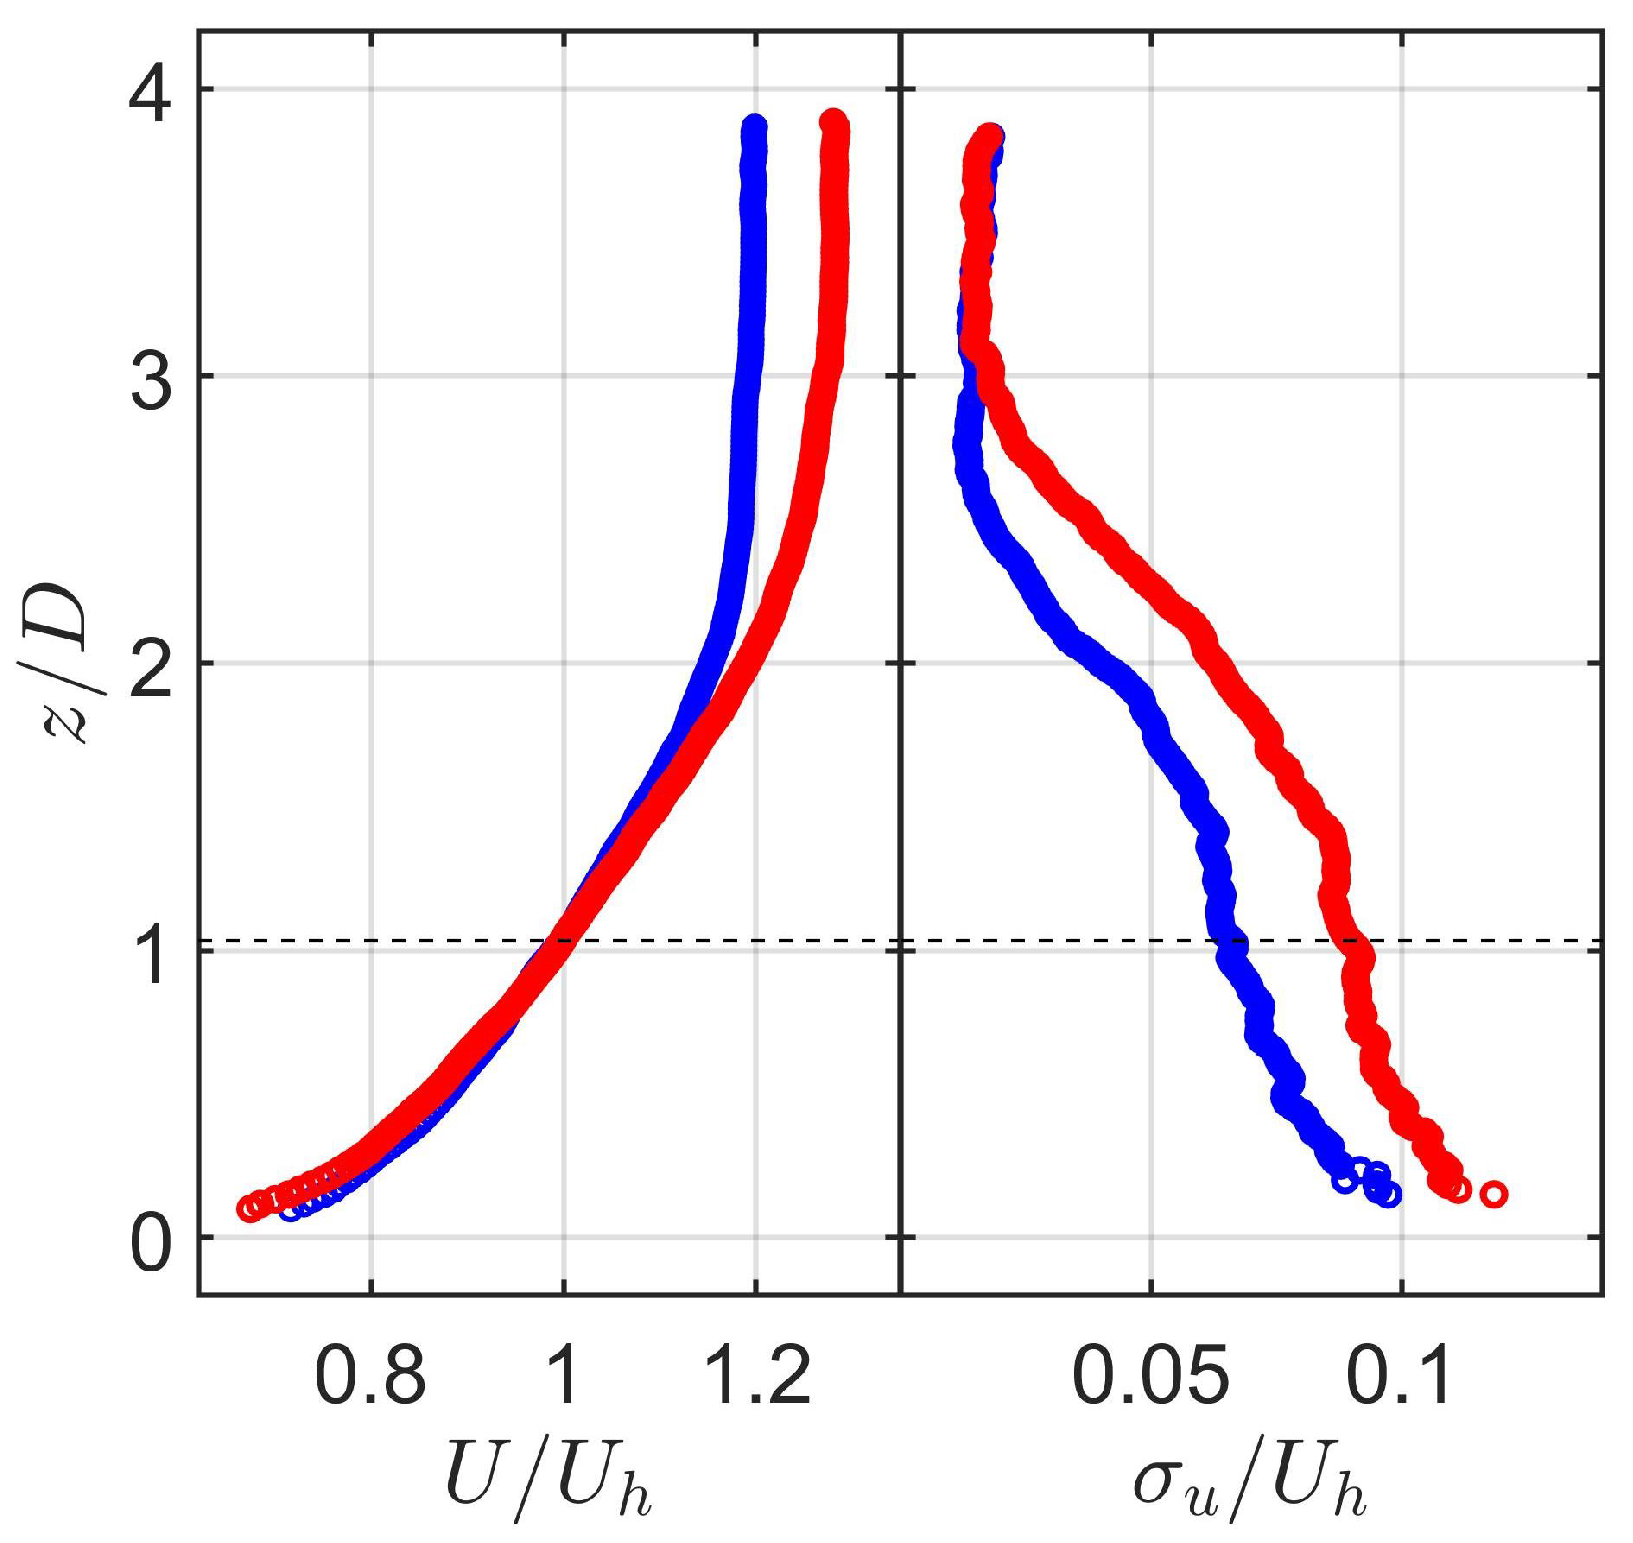
In addition to the power measurements, flow measurements were conducted in the two-turbine wind farm under tilt control. High-spatial-resolution stereoscopic particle-image velocimetry (S-PIV) was used to capture the velocity field in the wakes of both turbines. Oil passive droplets, with a size on the order of 1 m, were seeded in the flow. A double-pulse 425 mJNd:YAG laser was used as the laser source, and a cylindrical lens was used to expand the laser beam into a sheet. The plane in the center of the span of the turbine was captured through two 16-bit sCMOS cameras (2560 × 2160 pixels), with a 50 mm objective. The captured field of view (i.e., FOV) was approximately 6D in length; therefore, three FOVs were needed to capture the two wakes in the case and the two in the one (i.e., the wake of the second turbine was captured for the same streamwise distance as the turbine spacing for each case). An overlap of 1D between the FOVs was selected in order to optimize the match between two neighboring FOVs. The captured points were 2.5 mm apart in the streamwise and vertical directions. The images were sampled at a frequency of 10 Hz, and the mean velocity fields were obtained by averaging 1000 instantaneous vector fields. The S-PIV system was also used to capture the incoming boundary layers for the tilt control experiments. Figure 4 shows the streamwise velocity and turbulence intensity in the incoming boundary layers. Again, data were normalized with respect to the hub-height velocity for each case (i.e., m/s and m/s for low and high turbulence intensities, respectively). The two levels of hub-height streamwise turbulence intensity were 6.6% and 8.9% and are used to refer to each case throughout this study. Both the turbine spacing and turbulence intensity levels are considered typical values found in large-scale wind farms.
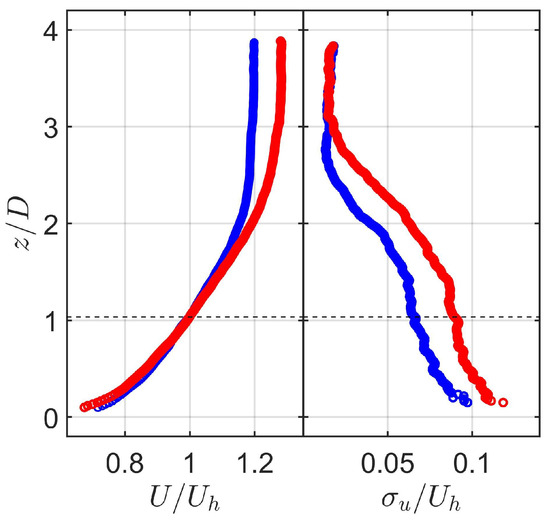
Figure 4.
Incoming boundary layers characteristics for the tilt control experiments, under high (red) and low (blue) levels of streamwise turbulence intensity. The black dashed line represents the hub height.
3. Results
In this section, the results from the wind tunnel experiments described in the previous section are presented. The results can be divided into two main categories: power and flow results. Power measurements were performed on wind farms comprising two, three, and five wind turbines using axial induction control and on a set of two wind turbines applying tilt control, always under full wake conditions. The wake flows through the two-turbine wind farm using tilt control were then characterized via S-PIV.
3.1. Power Analysis
In this section, the findings derived from the power analysis conducted on the different wind farms employing axial and tilt control are presented.
3.1.1. Static Axial Induction Control
The power and thrust curves of the turbine used are reported in [35]. The slope of the thrust curve around the optimal point is greater than that on the power curve. This indicates that the thrust at which the turbine is operated and, therefore, the wake can be varied through the TSR without compromising the power coefficient as much. When a turbine is operated at a TSR higher than the optimal level and, therefore, at greater thrust coefficients, a higher velocity deficit is encountered, especially in the near wake. Even though this may seem detrimental to downstream turbines, a higher shear between the wake and the outer flow can lead to faster wake recovery [33]. On the other hand, the thrust coefficient and the strength of the wake decrease by reducing the TSR [28], also increasing the available power for downstream turbines. In general, when upstream turbines operate away from their optimum point, they extract less energy from the wind, meaning that more energy could be available for downstream turbines. In any case, wake mitigation strategies are only useful if the gain in the power extraction from downstream turbines outweighs the loss in upstream ones.
The axial induction factor can be altered by changing the TSR or the pitch angle. These two strategies, however, do not act in the same way. A change in the pitch angle causes the axial induction factor and angle of attack (i.e., AoA) to vary uniformly over the entire blade of the turbine [28]. Instead, when a turbine is operated outside its optimal TSR, the induction factor and AoA change non-uniformly over the blade, varying the velocity deficit differently across the rotor of the turbine [28]. This can be mathematically seen through Equations (1) and (2), which relate the change in the TSR to the change in the AoA.
where is the hub-height velocity (purely axial; therefore, and ); is the rotational velocity; r is the radius at which airfoil i is located; is the angle between the axial component’s incoming wind velocity and the relative velocity ; is the AoA; is the pitch angle; is the angle of the relative wind; and , , , and are the lift, drag, thrust and torque forces, respectively, which are projections of the aerodynamic force . It should be noted that the shear in the incoming flow is neglected, and the entire rotor is assumed to have an incoming wind velocity equal to the hub-height velocity.
Even if the AoA does not vary uniformly along the blade when changing the TSR, in general, one might think that varying the AoA 1 through the TSR and the pitch angle are somehow equivalent. This would be, however, incorrect. In fact, reducing the AoA via the pitch angle (i.e., pitch to feather) reduces the thrust coefficient [37], but reducing the AoA through the rotational velocity (i.e., higher TSR) increases it, leading to significant differences in the wake and, therefore, in the power available for downstream turbines. In the following, we try to explain the difference between the two methods.
As can be seen in Figure 5, the magnitude of the thrust force, T, can be obtained as the sum of the projections of the lift and drag forces , whose magnitudes can be expressed mathematically as:
where and are the lift and drag coefficients, respectively; is the air density; and S is the rotor’s swept area. When the AoA is reduced through the pitch angle , the velocity triangle remains the same (i.e., neglecting the change in the axial induction factor, since wind and rotational velocities are not modified). Therefore, within Equations (3) and (4), only the coefficients vary, reducing their value with the AoA. We refer the reader to [37] for the lift and drag coefficient curves of the miniature wind turbine used. Conversely, when the AoA is decreased by increasing the TSR, the relative velocity increases. Even if the lift and drag coefficients are smaller than before increasing the TSR, the increase in the relative velocity, which is squared in Equations (3) and (4), causes an increase in the thrust force. A similar analysis could be performed to see how the torque changes when applying axial induction control techniques. Increments in the thrust force affect the power available for downstream turbines, and increments in the torque affect the power extracted by the downrated wind turbine. Because there is no pitch drive in the miniature wind turbine, this study only controls the axial induction factor through the TSR.
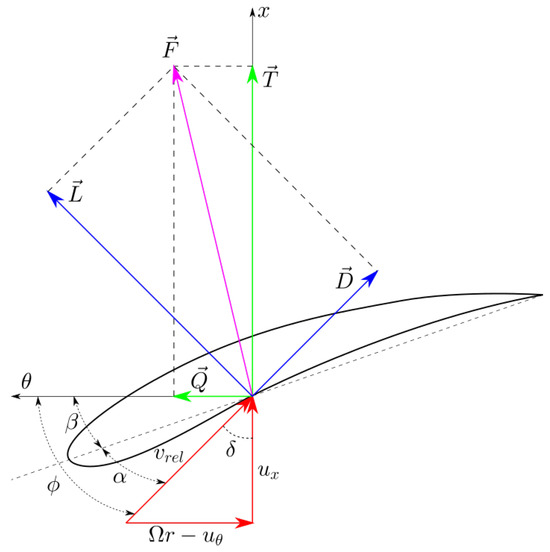
Figure 5.
Sketch of the forces acting in an arbitrary cross-section of the blade.
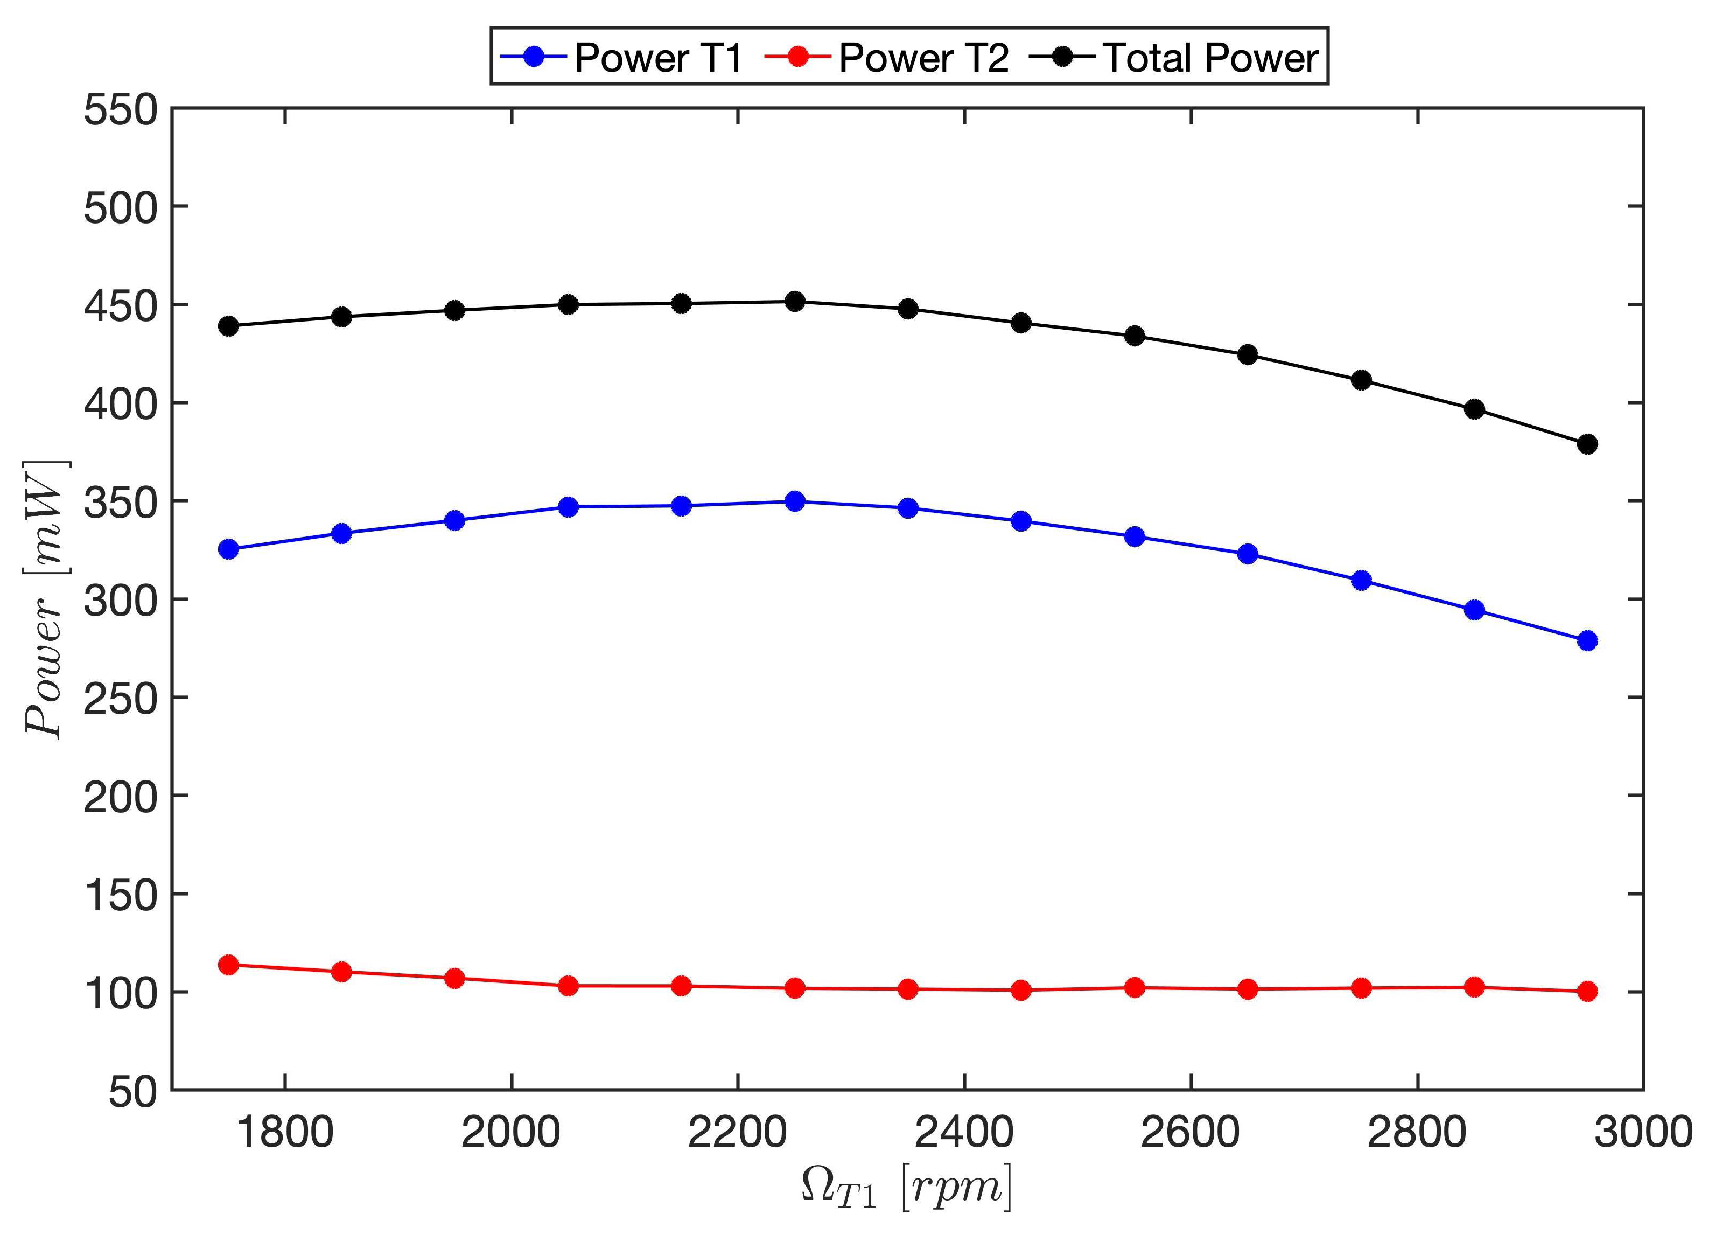
The effect of altering the TSR of upstream turbines on the overall power extraction was first tested in a two-turbine wind farm, to determine whether both increasing and decreasing lead to an increase in the downstream turbine power extraction. As can be seen in Figure 6, in agreement with [28], the downstream turbine only increased its power extraction as the upstream one reduced its rotational velocity. The lack of agreement with the results in [27,33] may stem from the fact that the thrust curve of the WIRE-01 turbine aligns well with the thrust curve observed in large-scale wind turbines for a TSR that is smaller than optimal, but it does not increase as much for a TSR that is higher than optimal [34]. Another possible explanation could be that the added kinetic energy in the wake due to operating the turbine above its optimal TSR diffused outside of the downstream rotor’s swept area, thereby precluding its extraction by it [28]. In any case, moving forward, the global power extraction of the wind farms is only analyzed when upstream turbines are operated at a lower TSR than optimal, as this is when downstream turbines demonstrate an increase in their power extraction. The variation in the global power extraction with respect to the baseline case (i.e., both turbines operated at optimal TSR) can be seen in Figure 7a. The different colors represent the percentage reduction in the rotational velocity. As can be observed in Figure 7a, the augmented power extraction in the downstream turbine was insufficient to account for the loss in the upstream turbine. Consequently, the overall power extraction decreased, as the upstream turbine was operated farther from its optimal point. Furthermore, the global power decreased at a faster rate, as the upstream turbine was operated farther from its optimal point, meaning that additional downrating would further reduce the global power.
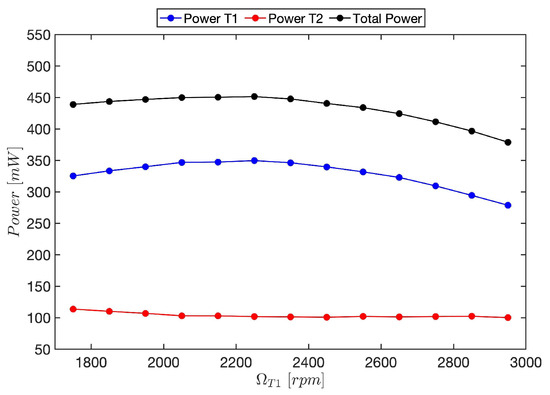
Figure 6.
Power extraction by the upstream turbine (blue), the downstream turbine (red), and the sum of both (black).
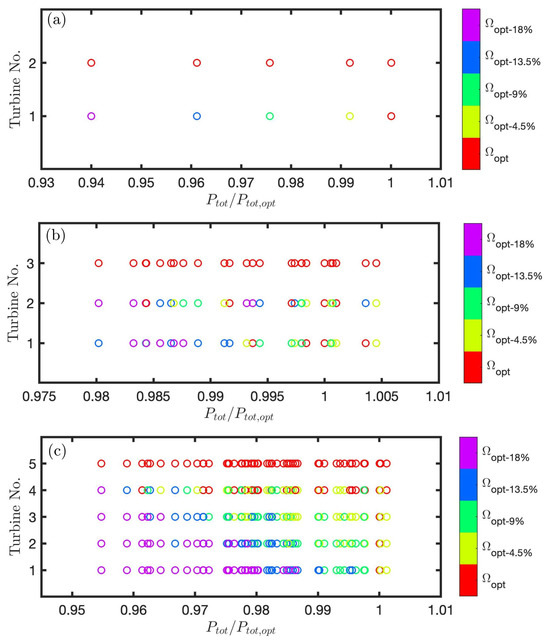
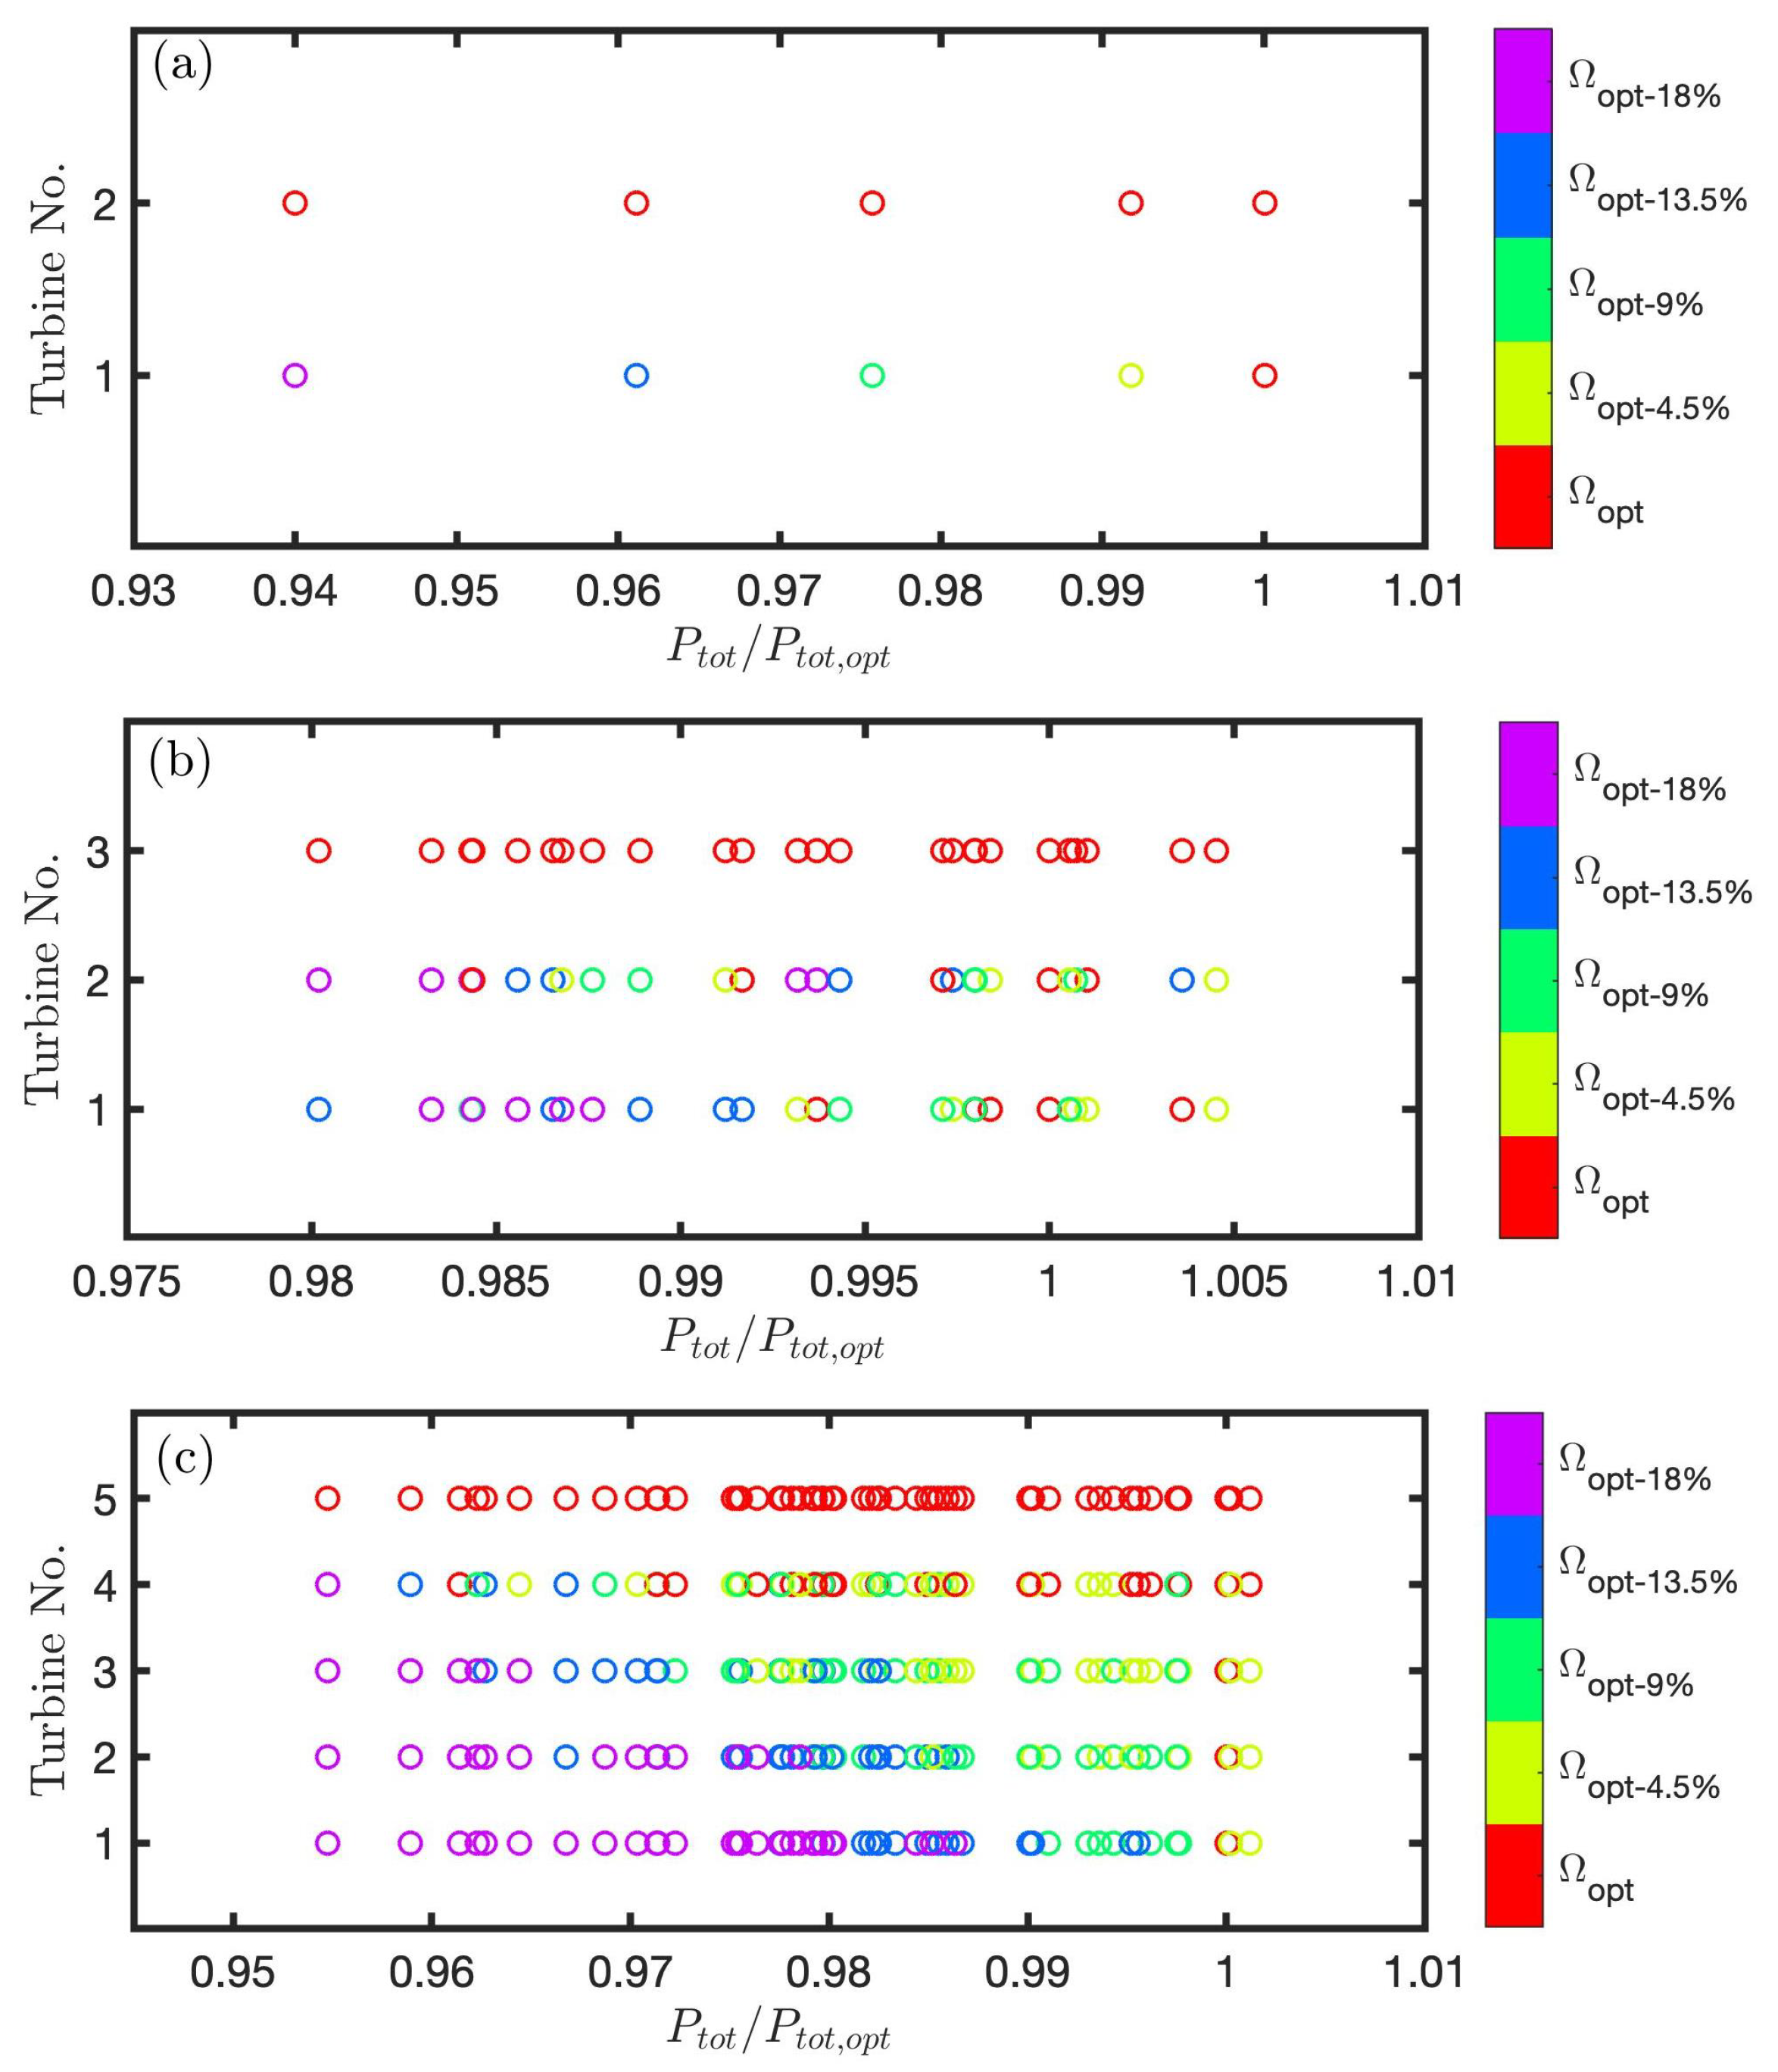
Figure 7.
Normalized wind farm power extraction for a wind farm comprising two (a), three (b) and five (c) wind turbines. Different colors indicate the difference (in percentage) between the operating TSR and the optimal value.
Figure 7b,c show the normalized overall power extraction with respect to the baseline case for three and five turbines. In the two plots, it can be seen that only a few cases exhibited slight enhancements in overall power production (i.e., less than 0.5%). Moreover, akin to the two-turbine scenario, the overall power gradually diminished as the upstream turbines were further downrated, indicating that additional downrating of the wind farm would not yield increased power production. Notably, the purple dots (i.e., the turbine operated at an 18% lower rotational speed) are predominantly clustered on the left side of the plot.
In conclusion, employing static axial induction control through the TSR is not an effective technique for augmenting global power production. Nevertheless, given the marginal overall losses observed in most configurations, this strategy could be contemplated for other objectives, such as load distribution balancing within a wind farm.
3.1.2. Tilt Control
A wind farm with two turbines was considered to evaluate the tilt control strategy. The power extraction of the two-turbine wind farm was measured for eleven tilt angles ranging from −25° to 25° with a 5° step interval (considering forward tilting as positive) for two streamwise spacing distances () and two turbulence intensity levels (). This allowed us to assess how the efficiency of the technique varies when varying and , two key quantities in wake development [5].
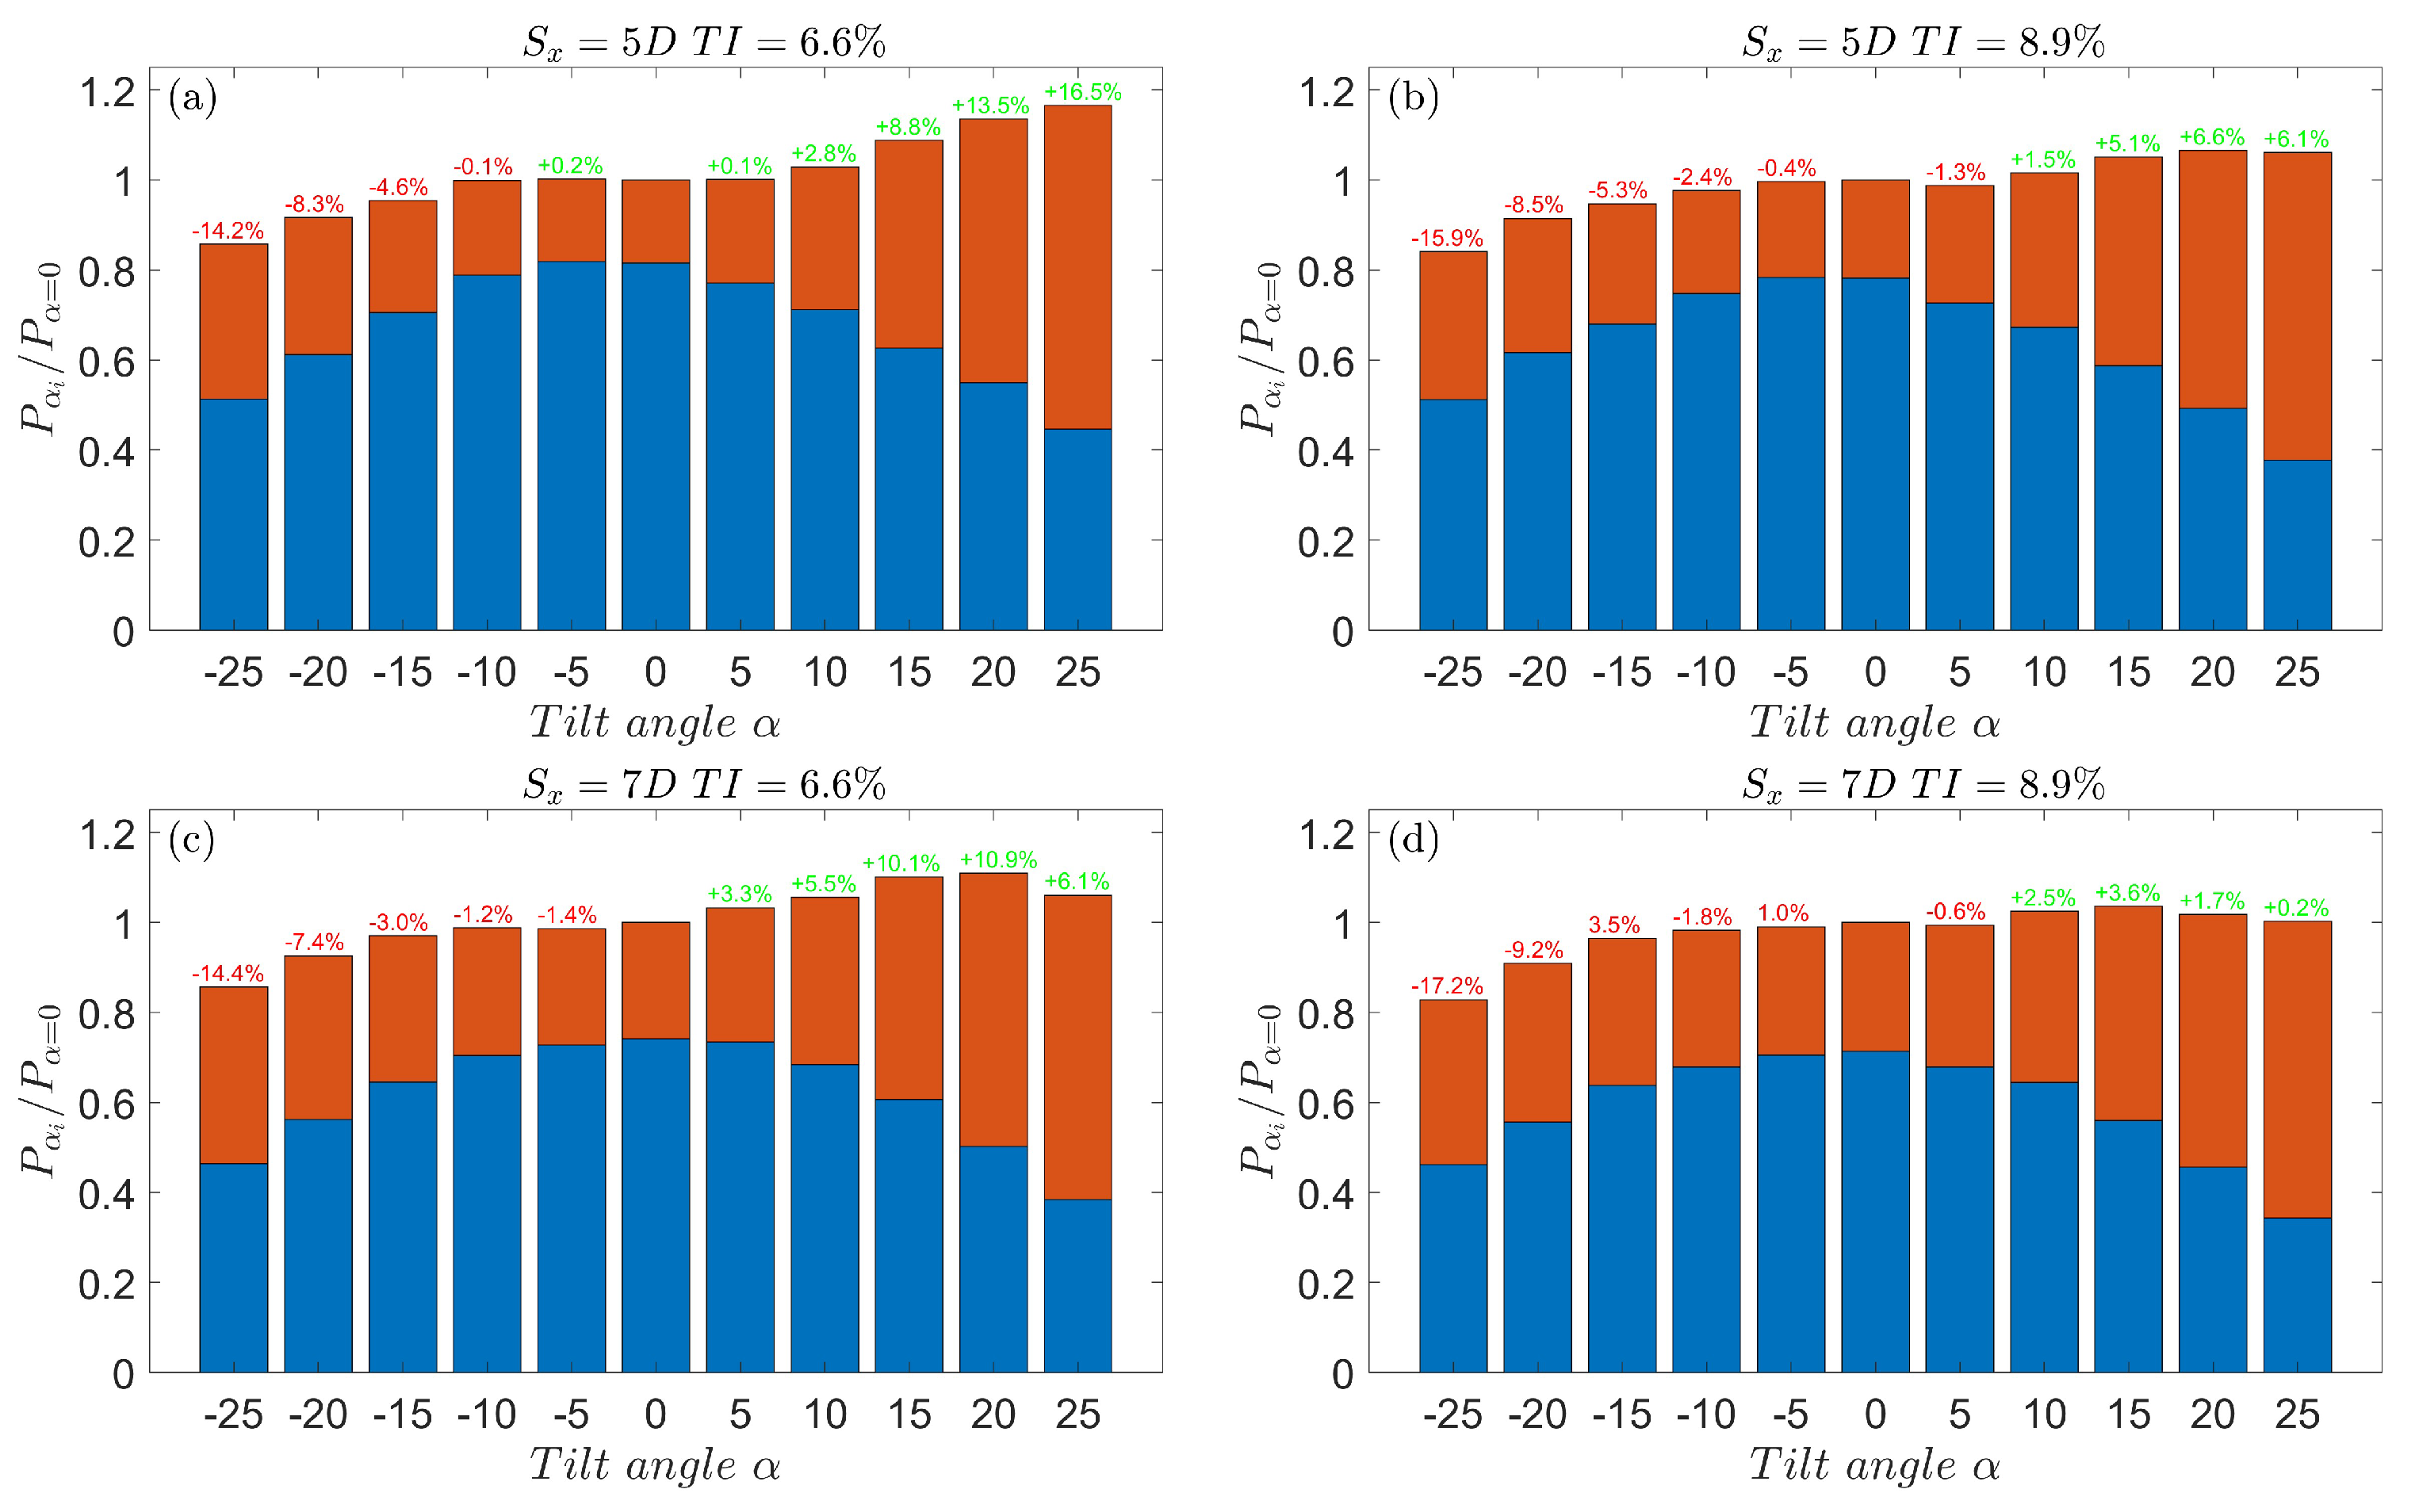
The power extraction for each of the two turbines and the combined cluster for the four setups can be seen in Figure 8. Data were normalized based on the combined power of both turbines in the baseline case of each configuration (i.e., no tilt applied). In agreement with previous studies [15,16,19,22], only forward tilting improved the efficiency of the wind farm. When the upstream turbine was tilted backward, although the power extraction of the downstream turbine gradually increased with the tilt angle, the gain was significantly smaller compared to the reduction of the upstream one, resulting in relatively similar losses percentage-wise across all four configurations. The overall power extraction gradually decreased with the tilt angle, meaning that further tilting of the upstream turbine would result in even lower output. Thus, backward tilting is seen as ineffective, regardless of the level and distance.
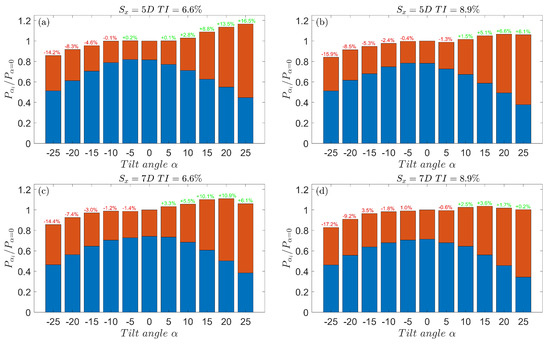
Figure 8.
Normalized power of the upstream turbine (blue) and the downstream turbine (orange) for the four configurations. (a) and ; (b) and ; (c) and ; (d) and . The sum of both represents the overall power production.
Regarding forward tilting, the highest increments in global power extraction were seen for low levels and distances. Higher levels enhanced turbulent mixing and vertical entrainment, and higher distances allowed the wake to recover. Therefore, the power losses caused by the upstream wake decreased with high levels and distances, leaving less room for improvement using wake mitigation techniques. Moreover, increased levels and distances also resulted in lower optimal tilt angles (i.e., angle at which the maximum extraction is obtained). This is understandable since, again, increasing the available power for downstream turbines by increasing the tilt angle becomes especially valuable when the wake has a more adverse impact in a baseline case. Tilt control is seen as more sensitive to the level than to the distance since the increase in both percentage-wise is comparable (i.e., from 6.6% to 8.9%, and from 5D to 7D), but an increase in the resulted in a higher reduction in power gain.
The increments in power (e.g., 16.5% and 10.9%) surpassed those of other wake mitigation techniques using only two turbines under full wake conditions [3,11,12,13,14,15,27]. Moreover, even lower levels were found in the atmospheric boundary layer, especially under stable stratification, which could lead to even greater increments in the overall power extraction. This technique is also likely to work more efficiently in wind farms with more turbines by gradually reducing the tilt angle, similar to yaw control [11,12].
3.2. Flow Analysis
In this section, the flow dynamics in a two-turbine wind farm when the upstream turbine is tilted at different angles are analyzed. The axial induction technique is not considered in this section since no increase in the power extraction is observed. In order to explain the effect of tilt control on power production and characterize the wakes of both turbines, flow measurements were conducted when tilting the upstream turbine () while maintaining two levels of streamwise spacing () and turbulence intensity (). For the sake of completeness, the wakes of both turbines were also measured under backward tilt (i.e., ).
In the wakes of tilted turbines, a counter-rotation vortex pair is known to form due to the high vertical velocities induced by these turbines. This phenomenon leads to a greater deflection of the wake center in comparison to the rest of the wake [13,16]. Given that tilt control is a vertical wake steering technique, akin to yaw control in other studies [12,13,38,39,40], we focus on data collected in the streamwise-vertical plane.
In this section, we first characterize the wake dynamics of both turbines, examining their evolution and entrainment. Then, we explore the impact of tilting the first turbine on a hypothetical third turbine.
3.2.1. Wake Deflection
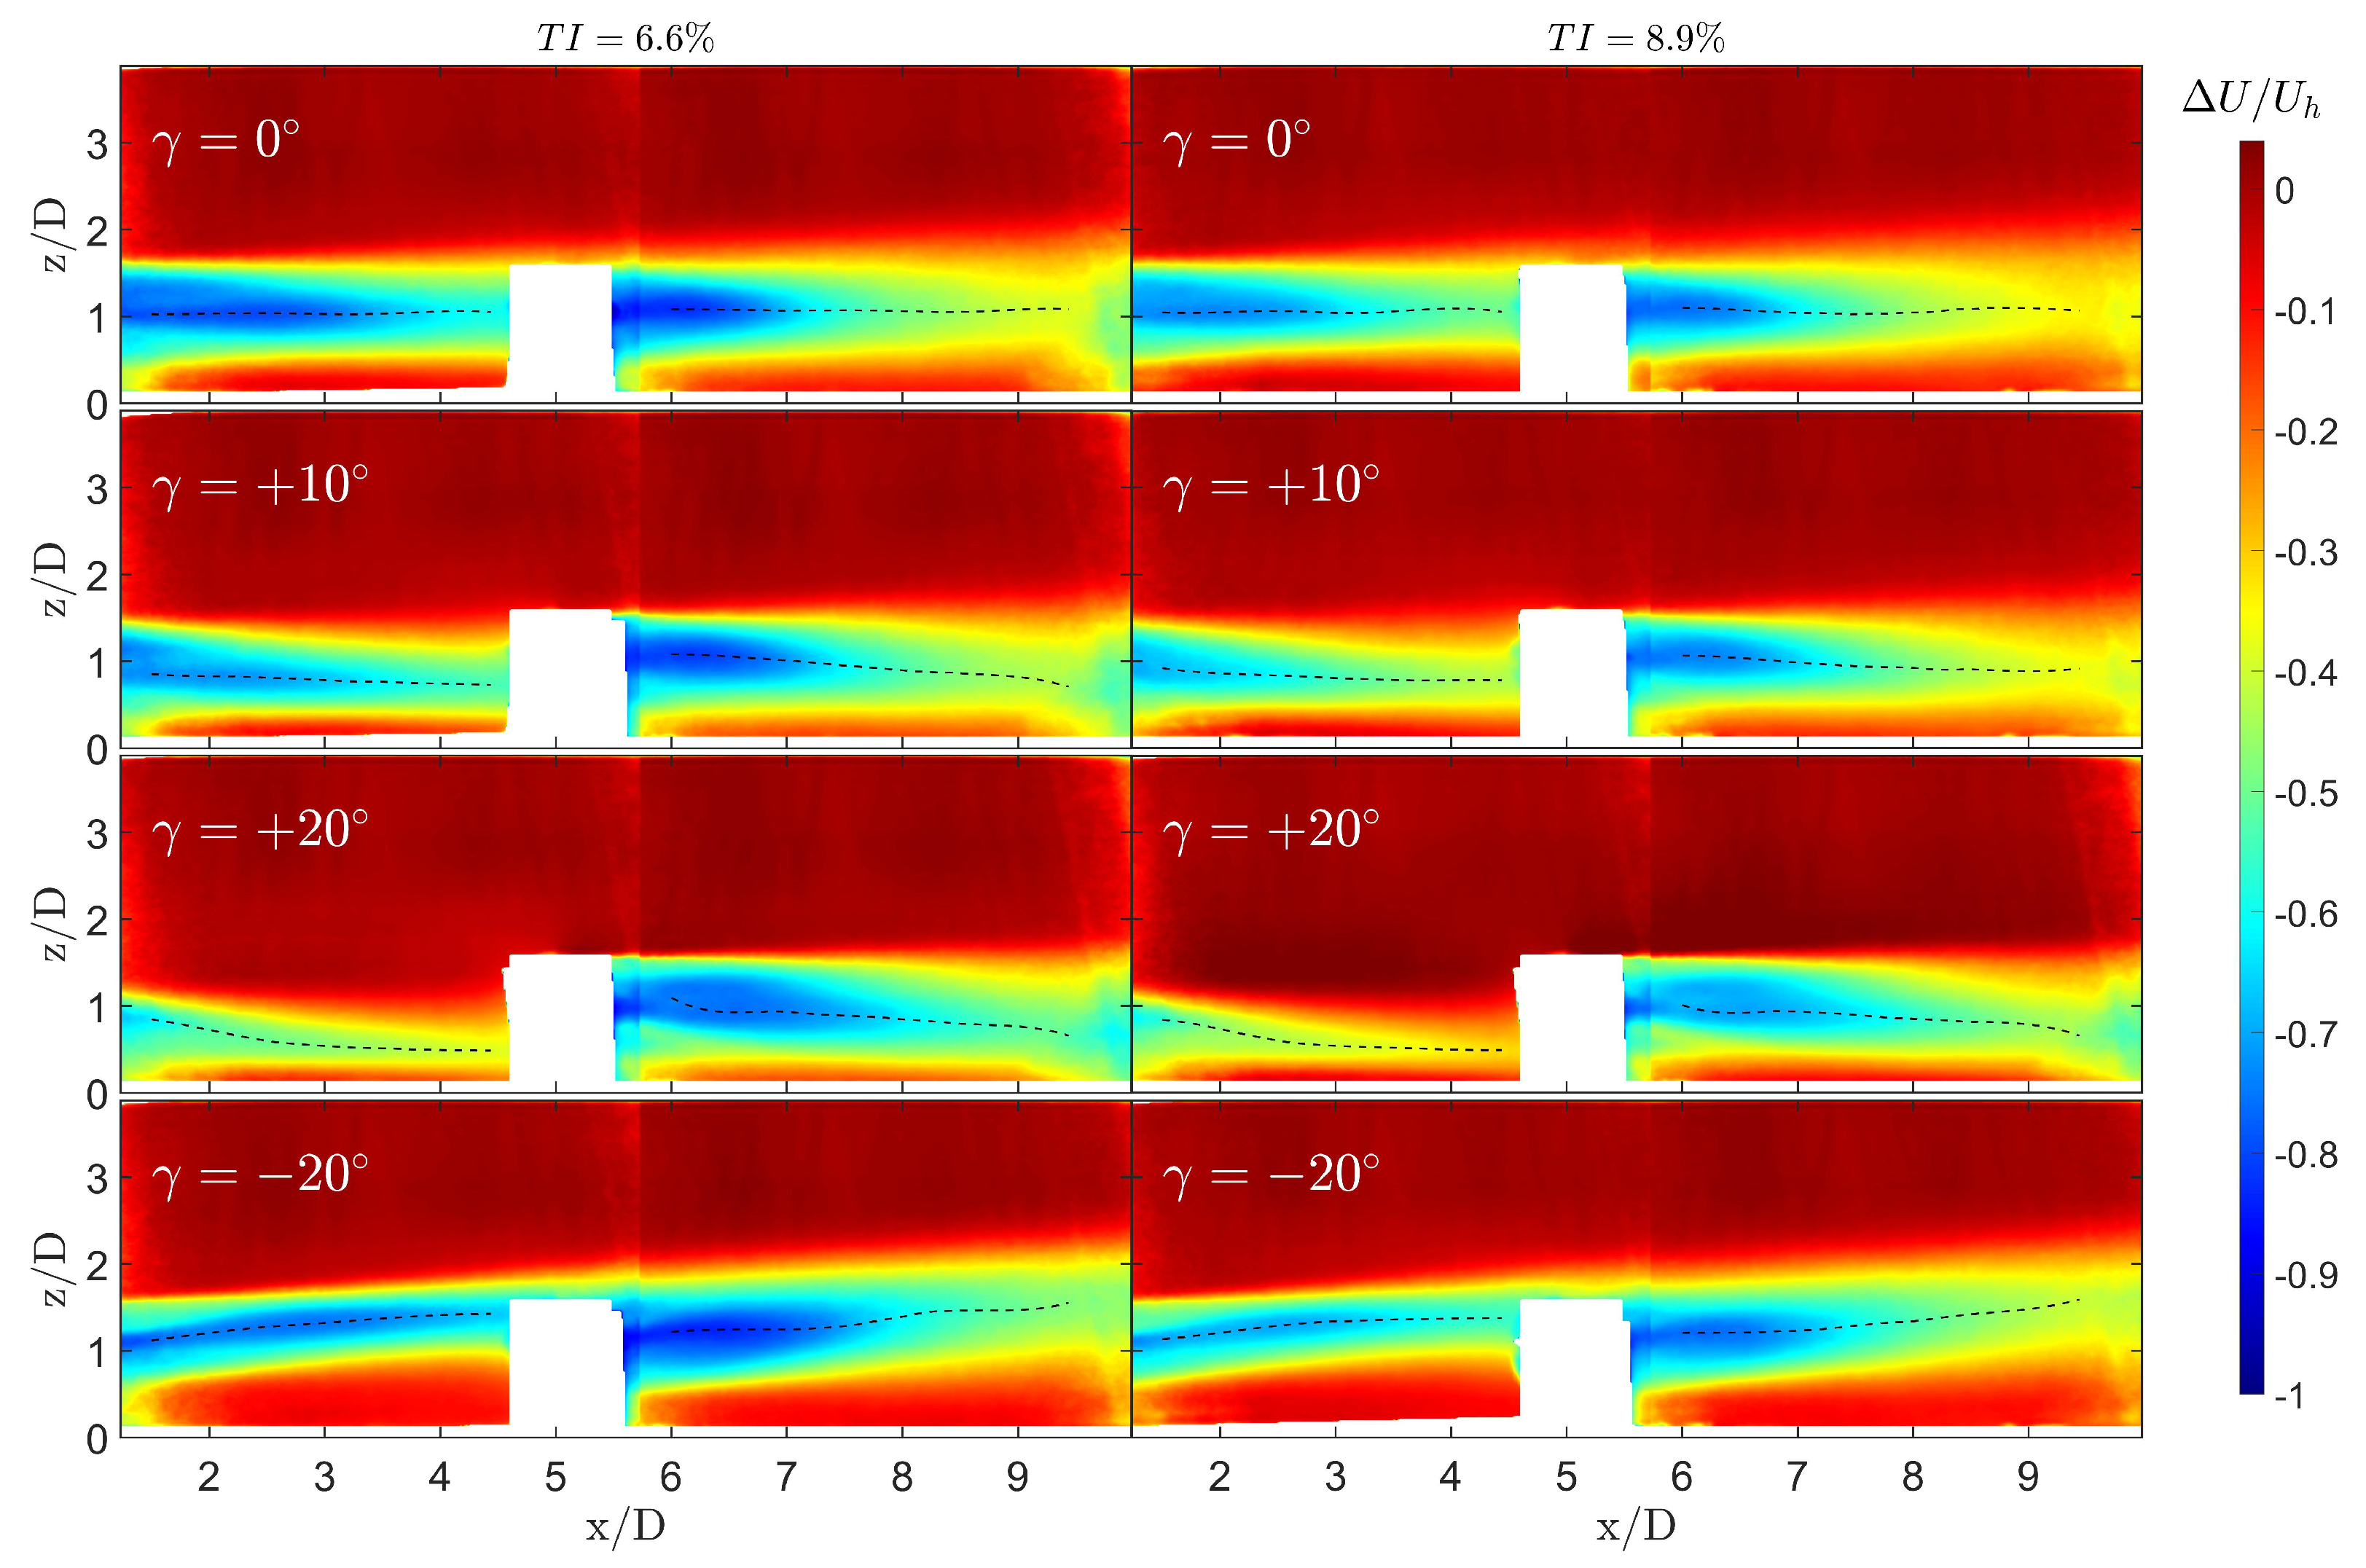
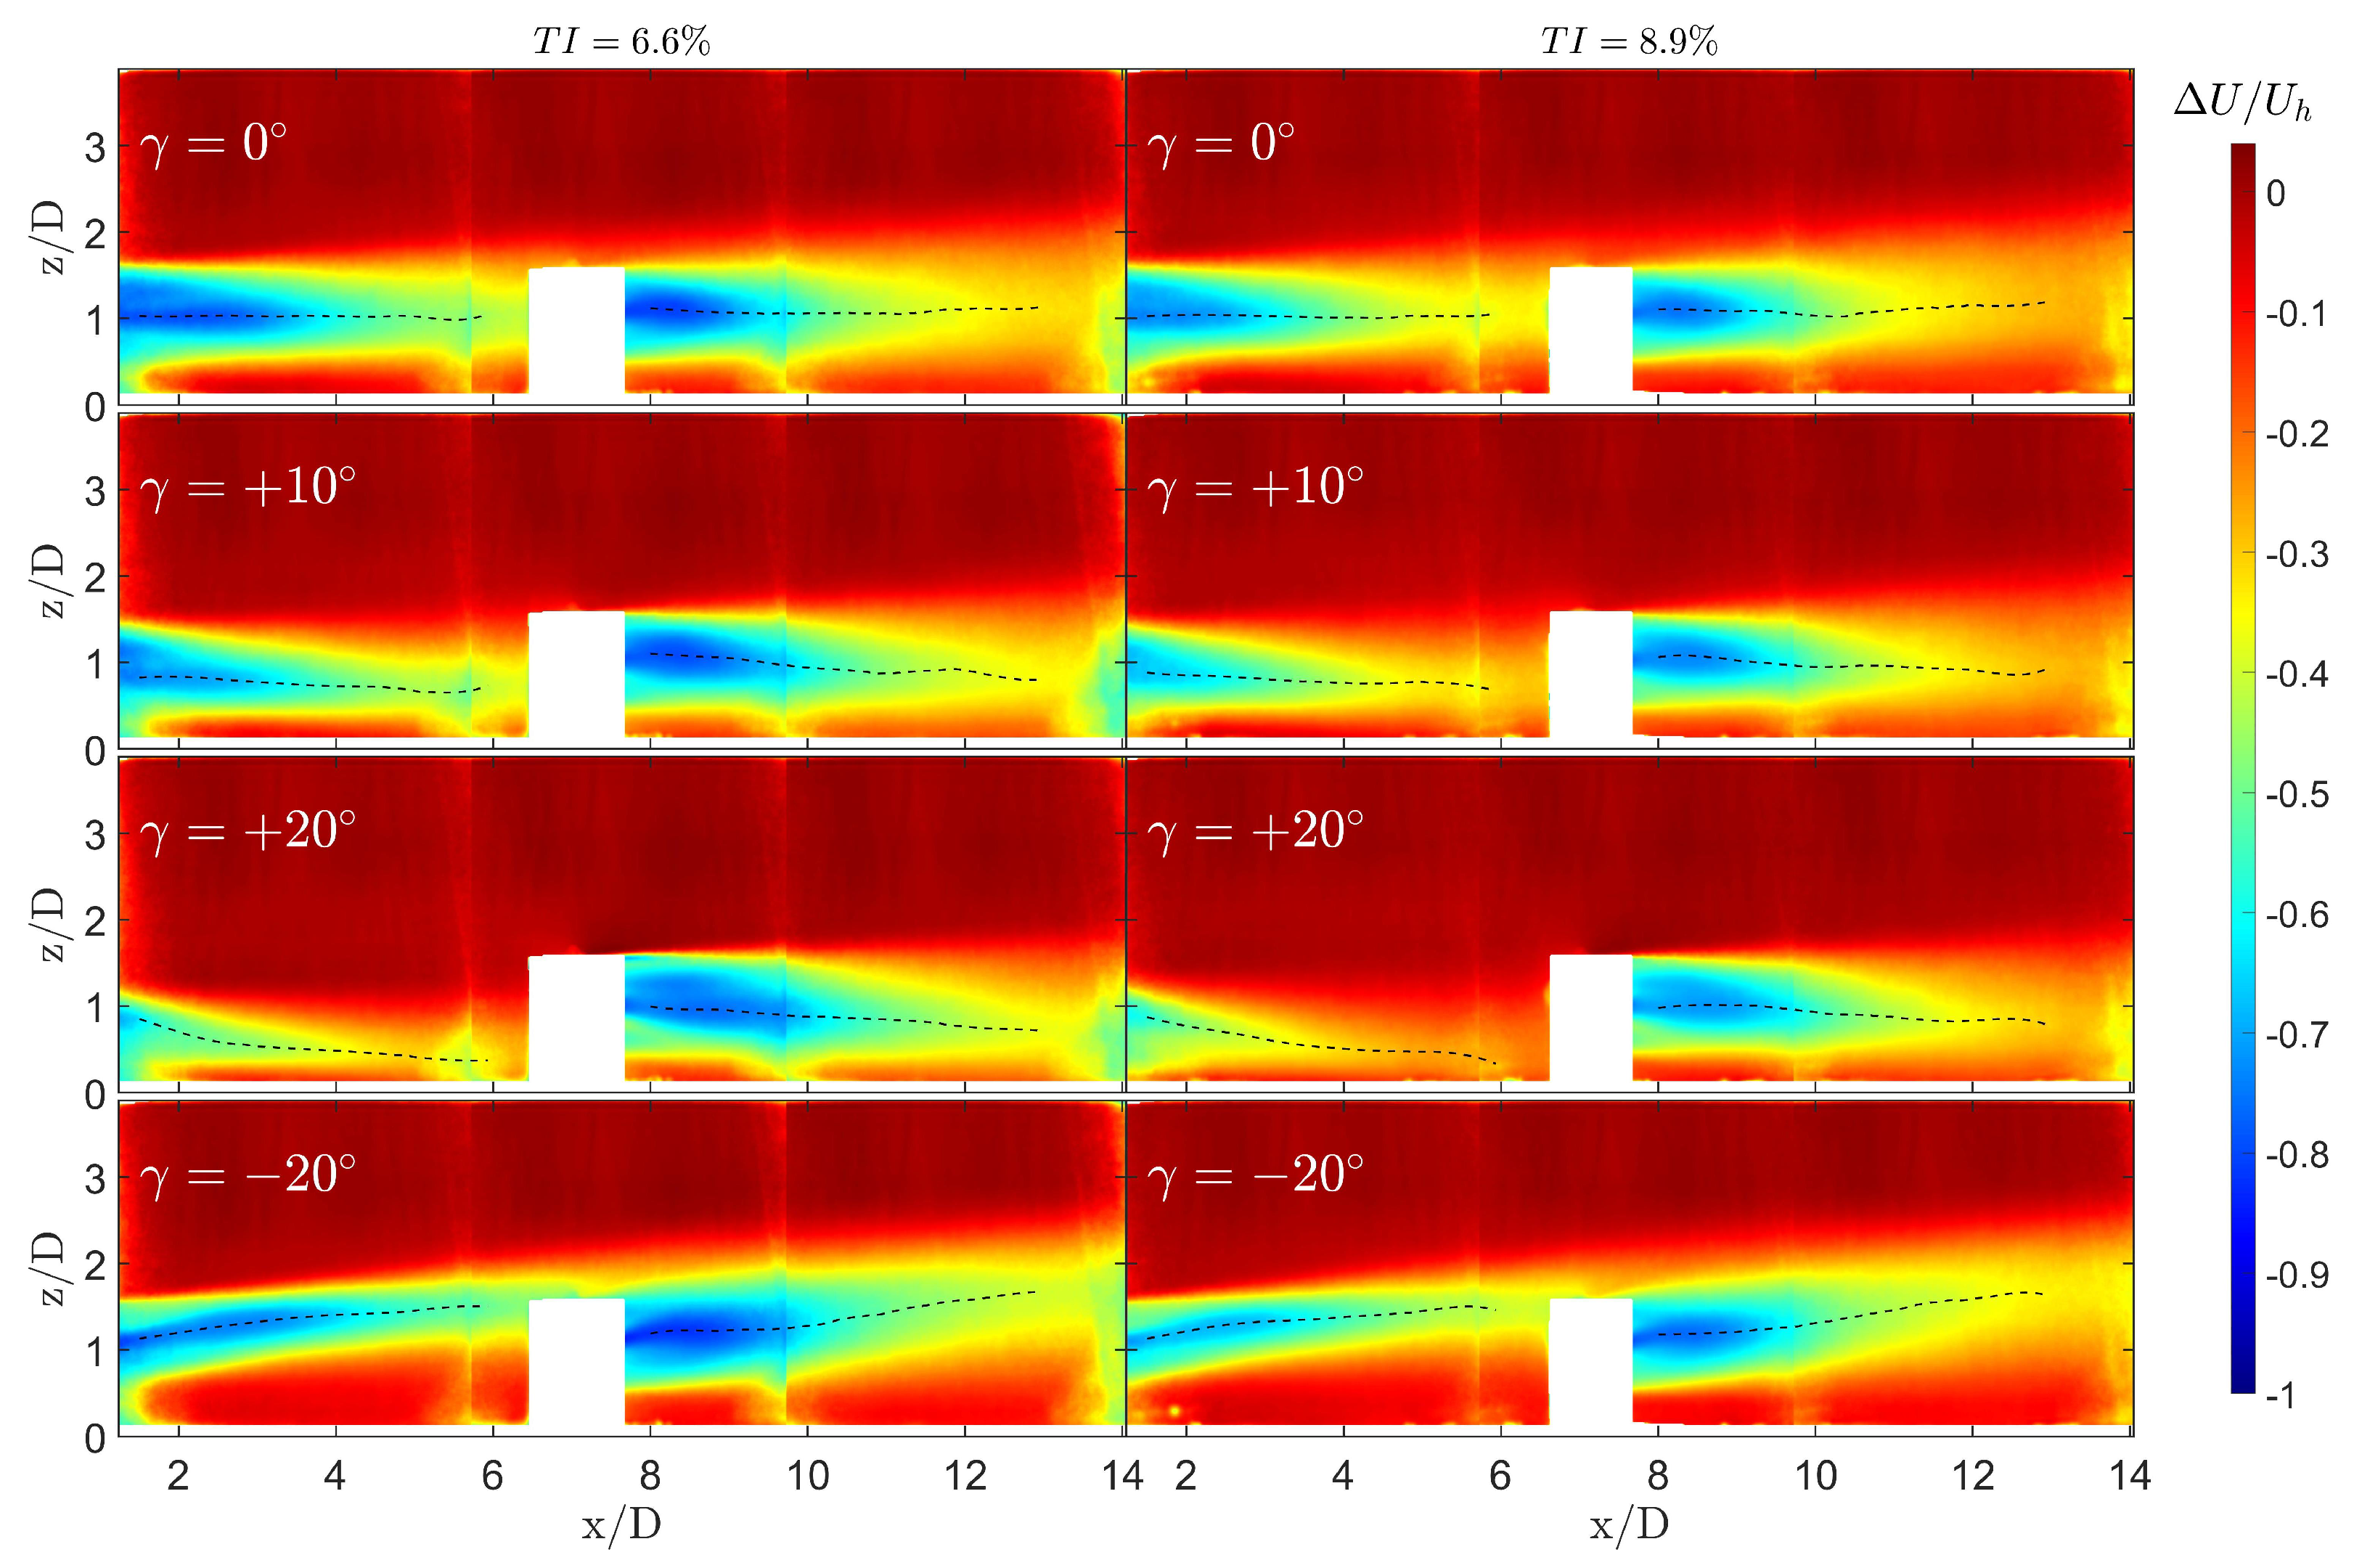
Figure 9 (for ) and Figure 10 (for ) display contour plots of the normalized mean streamwise velocity deficit along with the trajectory of the wake’s center (i.e., where the highest streamwise velocity deficit is encountered). For a more comprehensive comparison of the wake deflection across the four configurations, Figure 11 presents the trajectories of the centers of the wakes. The deflections of both wakes clearly increased with the increase in the tilt angle. This is understandable since the vertical component of the thrust force and, therefore, because of the conservation of momentum, the induced vertical velocity in the wake increased with the tilt angle. Similarly, lower streamwise velocity deficit values were encountered as the tilt angle increased. This aspect is further discussed in Section 3.2.2. Additionally, Figure 9, Figure 10 and Figure 11 illustrate the impact of tilting the upstream turbine on the deflection of the downstream turbine’s wake.
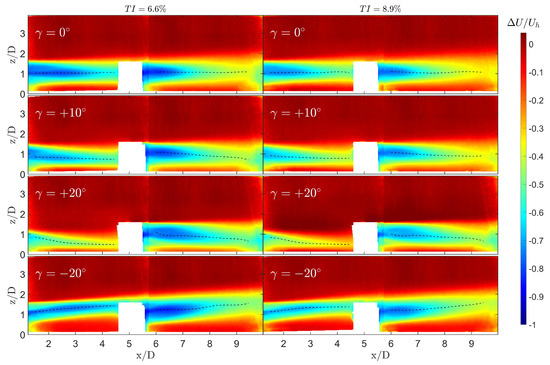
Figure 9.
Contour plots of the normalized mean streamwise velocity deficits under different tilt angles in the two-turbine wind farm (). The black dashed lines represent the center of the wake.
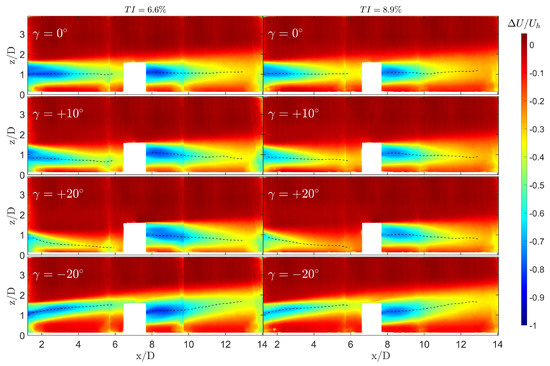
Figure 10.
Contour plots of the normalized mean streamwise velocity deficits under different tilt angles in the two-turbine wind farm (). The black dashed lines represent the center of the wake.
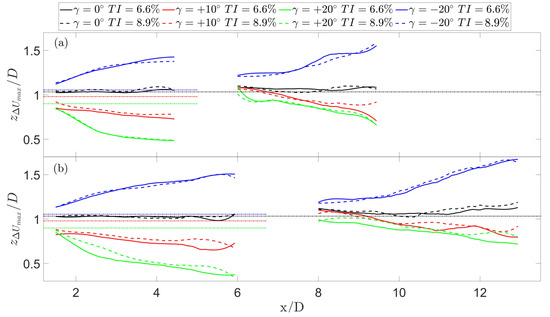
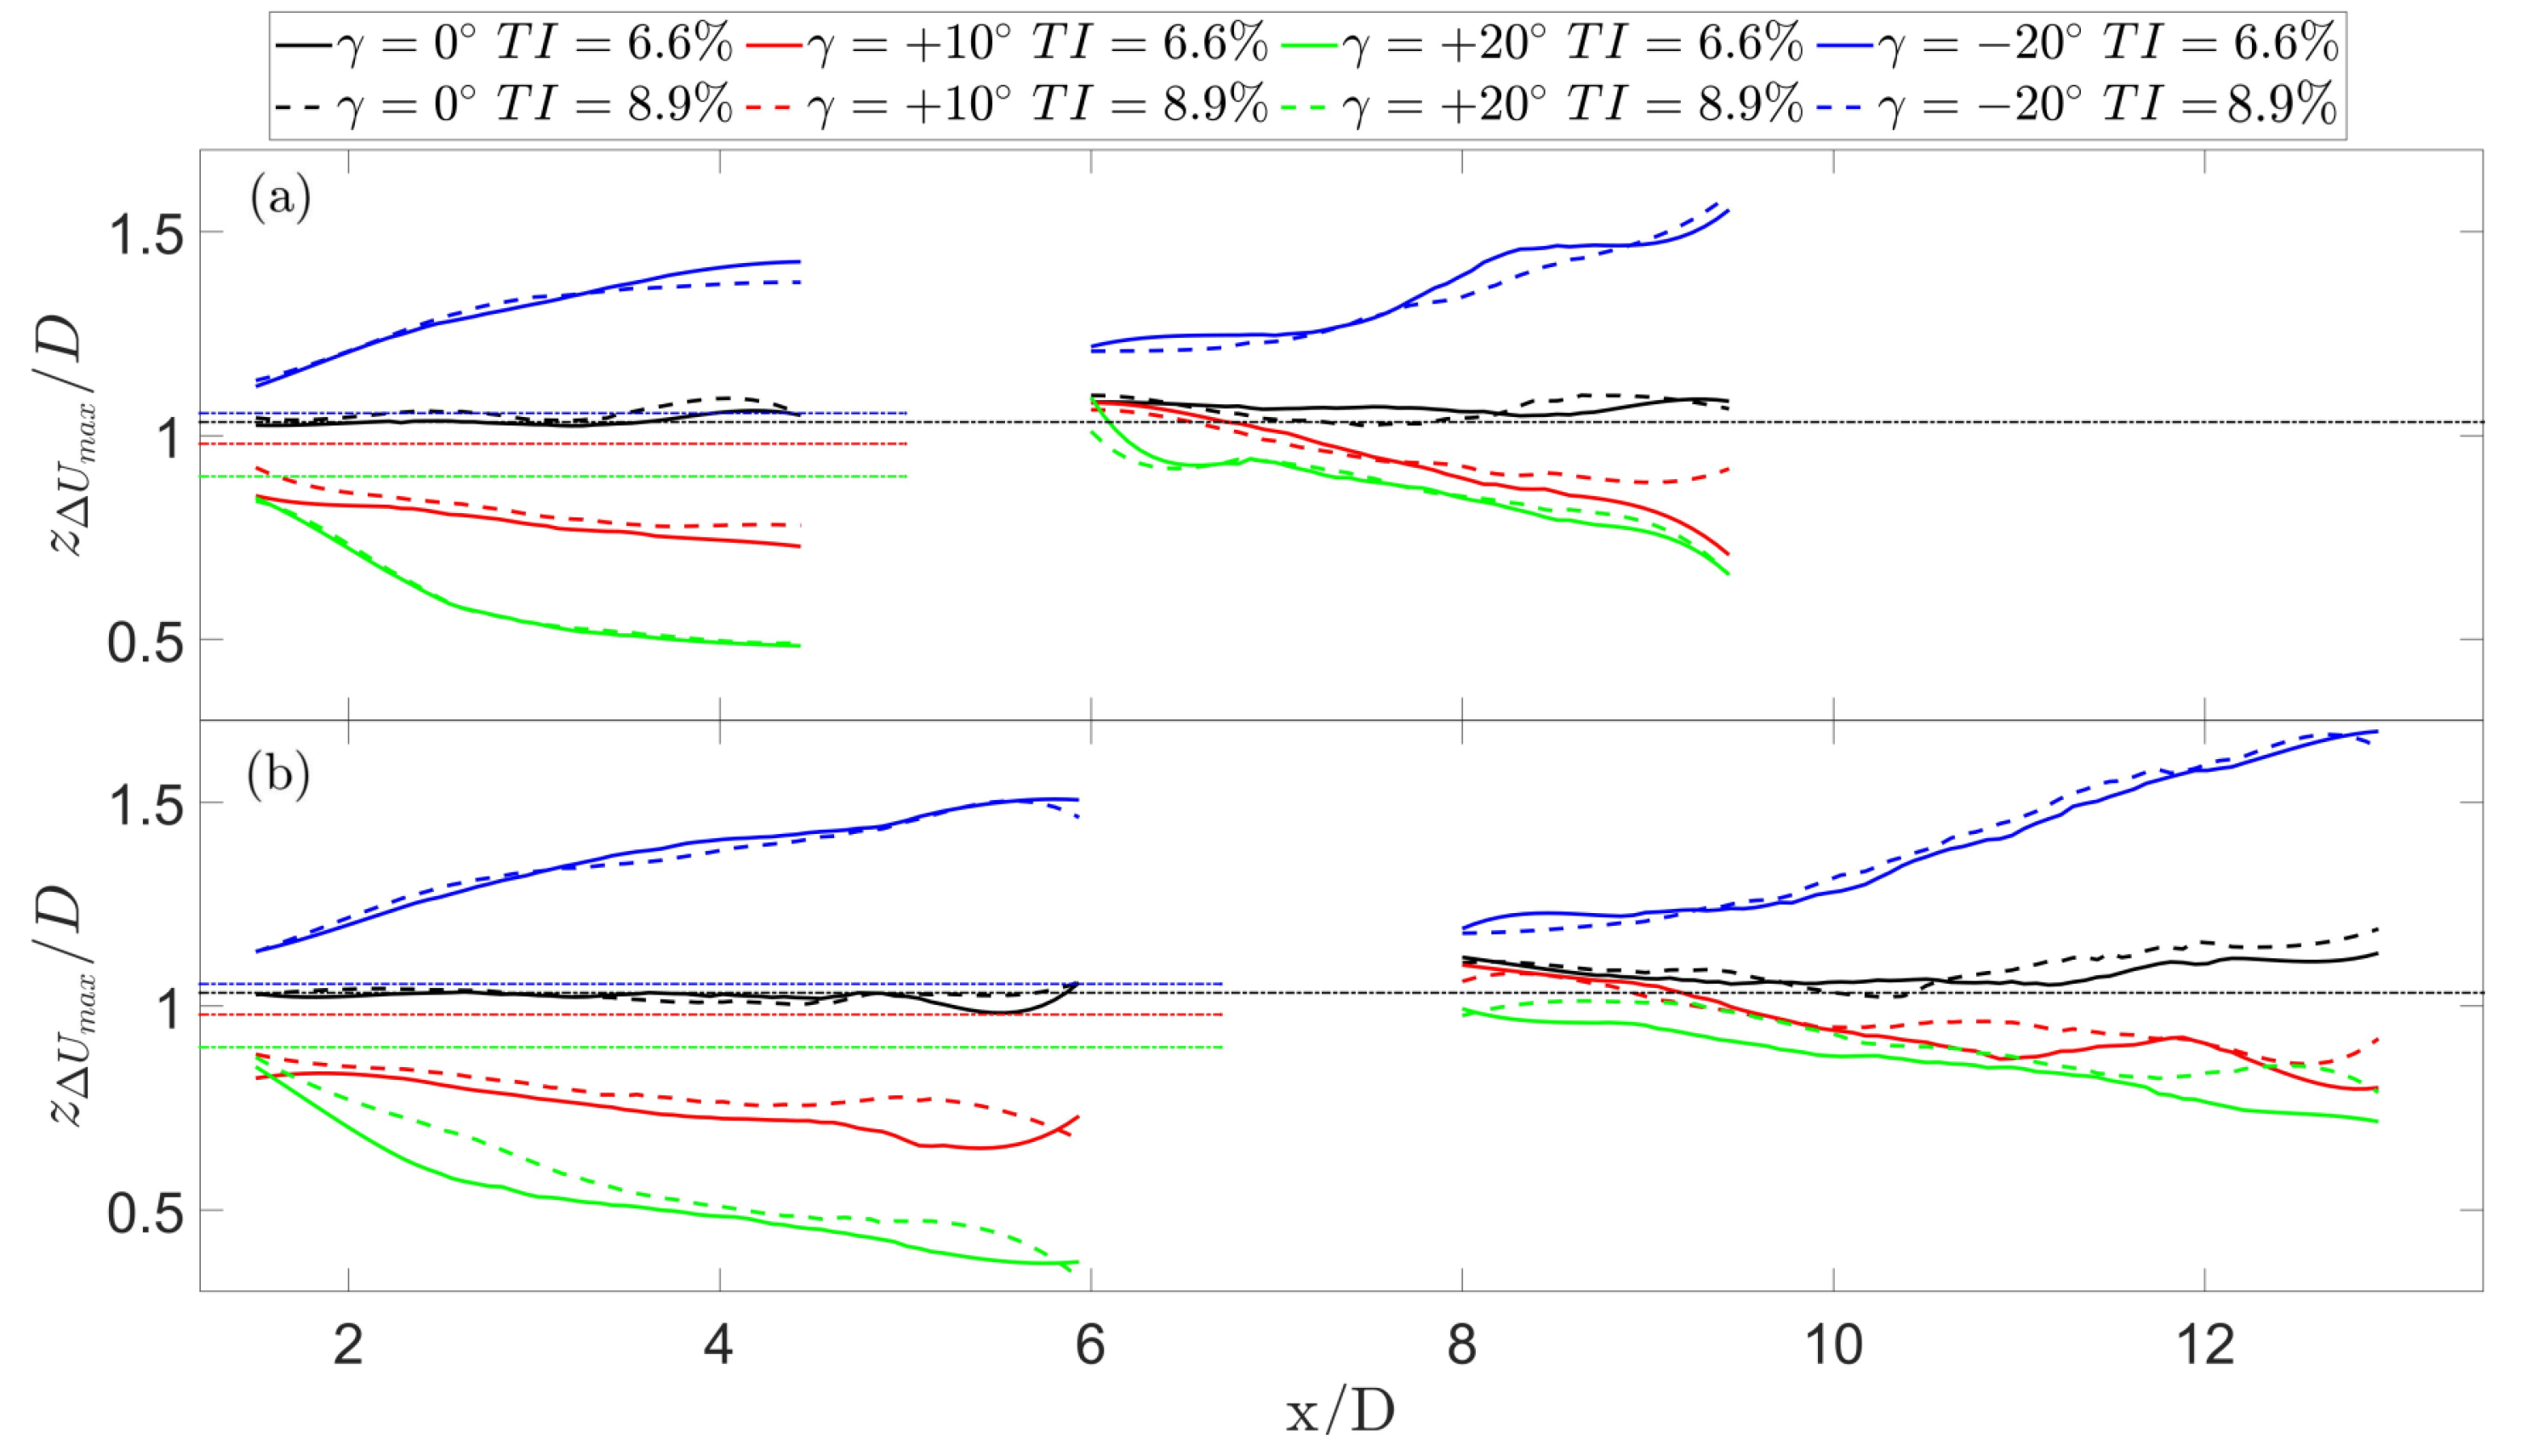
Figure 11.
Wake deflection, measured as the evolution of the height of the wake’s center. The dashed lines show the hub height for each of the tilt angles. (a) 5D streamwise turbine spacing, and (b) 7D streamwise turbine spacing.
To quantify the upstream turbine wake deflection caused by tilting, we must consider the difference in the hub height across each configuration. Given that the baseline case (i.e., ) exhibited minimal wake deflection, the values presented in Table 1 represent the height difference between the wake’s center and the hub height. It is important to note that the hub height of the downstream turbine remained fixed, corresponding to . Positive tilt angles deflected the wake toward the ground, and the wake deflection was characterized by an initial decrease down to , especially for , after which the wake was redirected because of floor blockage. In contrast, negative tilt angles induced a consistent upward deflection of the wake. Throughout the wake, positive tilt angles consistently exhibited higher deflection levels compared to negative ones (see Table 1). These findings align with those reported in [16]. Differences in turbine wake deflection between positive and negative tilt angles could be caused by variations in the global turbine parameters (e.g., power or thrust coefficient) or localized effects (e.g., the relative position of the high thrust area in relation to the deflection, localized pressure changes, etc.). From a global point of view, the power measurements indicate power coefficients of and for low turbulence levels and and for high turbulence levels for and , respectively. The marginal difference in the power coefficient between positive and negative angles suggests that the deflection disparity stemmed from local effects. From a local perspective, several factors could explain the near-wake deflection differences. One factor could be the variation in the thrust force across the rotor due to the incoming shear. The highest local thrust force occurred at the top of the turbine rotor, leading to a strong and direct downward deflection of the wake during forward tilting. Conversely, during backward tilting, the upper half of the rotor may have experienced a greater influence from turbine induction, leading to lower vertical velocities induced by the vertical component of the thrust force. Even if the vertical component of the thrust and the induced vertical velocity are assumed to be the same for both forward and backward tilts, the flow toward which the wake deflects differed due to wind shear. Forward tilting induced a deflection of the wake toward a region with lower energy flow, characterized by a diminished horizontal component of velocity. Consequently, this resulted in a comparatively increased deflection magnitude. Conversely, backward tilting directed the wake toward a higher energy outer flow, leading to a relatively reduced deflection magnitude. In conclusion, the dissimilarity between positive and negative tilt angles becomes apparent due to the shear within the incoming boundary layer. The asymmetric wake deflection patterns described for positive and negative tilt angles can explain the trend observed in the power measurements. For positive tilt angles, the flow above the turbine, characterized by high speed and low turbulence intensity, was pulled into the wake space [19]. On the other hand, for negative tilt angles, the downstream turbine experienced a low-speed, highly turbulent flow from below the turbine’s rotor level (see Figure 9 and Figure 10).

Table 1.
Wake deflection, calculated as the distance from the wake’s center to the hub height.
The deflection of the upstream turbine wake does not appear to be influenced by the level of turbulence intensity. This observation is consistent with the fact that, as previously mentioned, the deflection of the wake results from the vertical velocity induced by the vertical component of the thrust force, which is generally independent of the turbulence intensity level, particularly in the near-wake region.
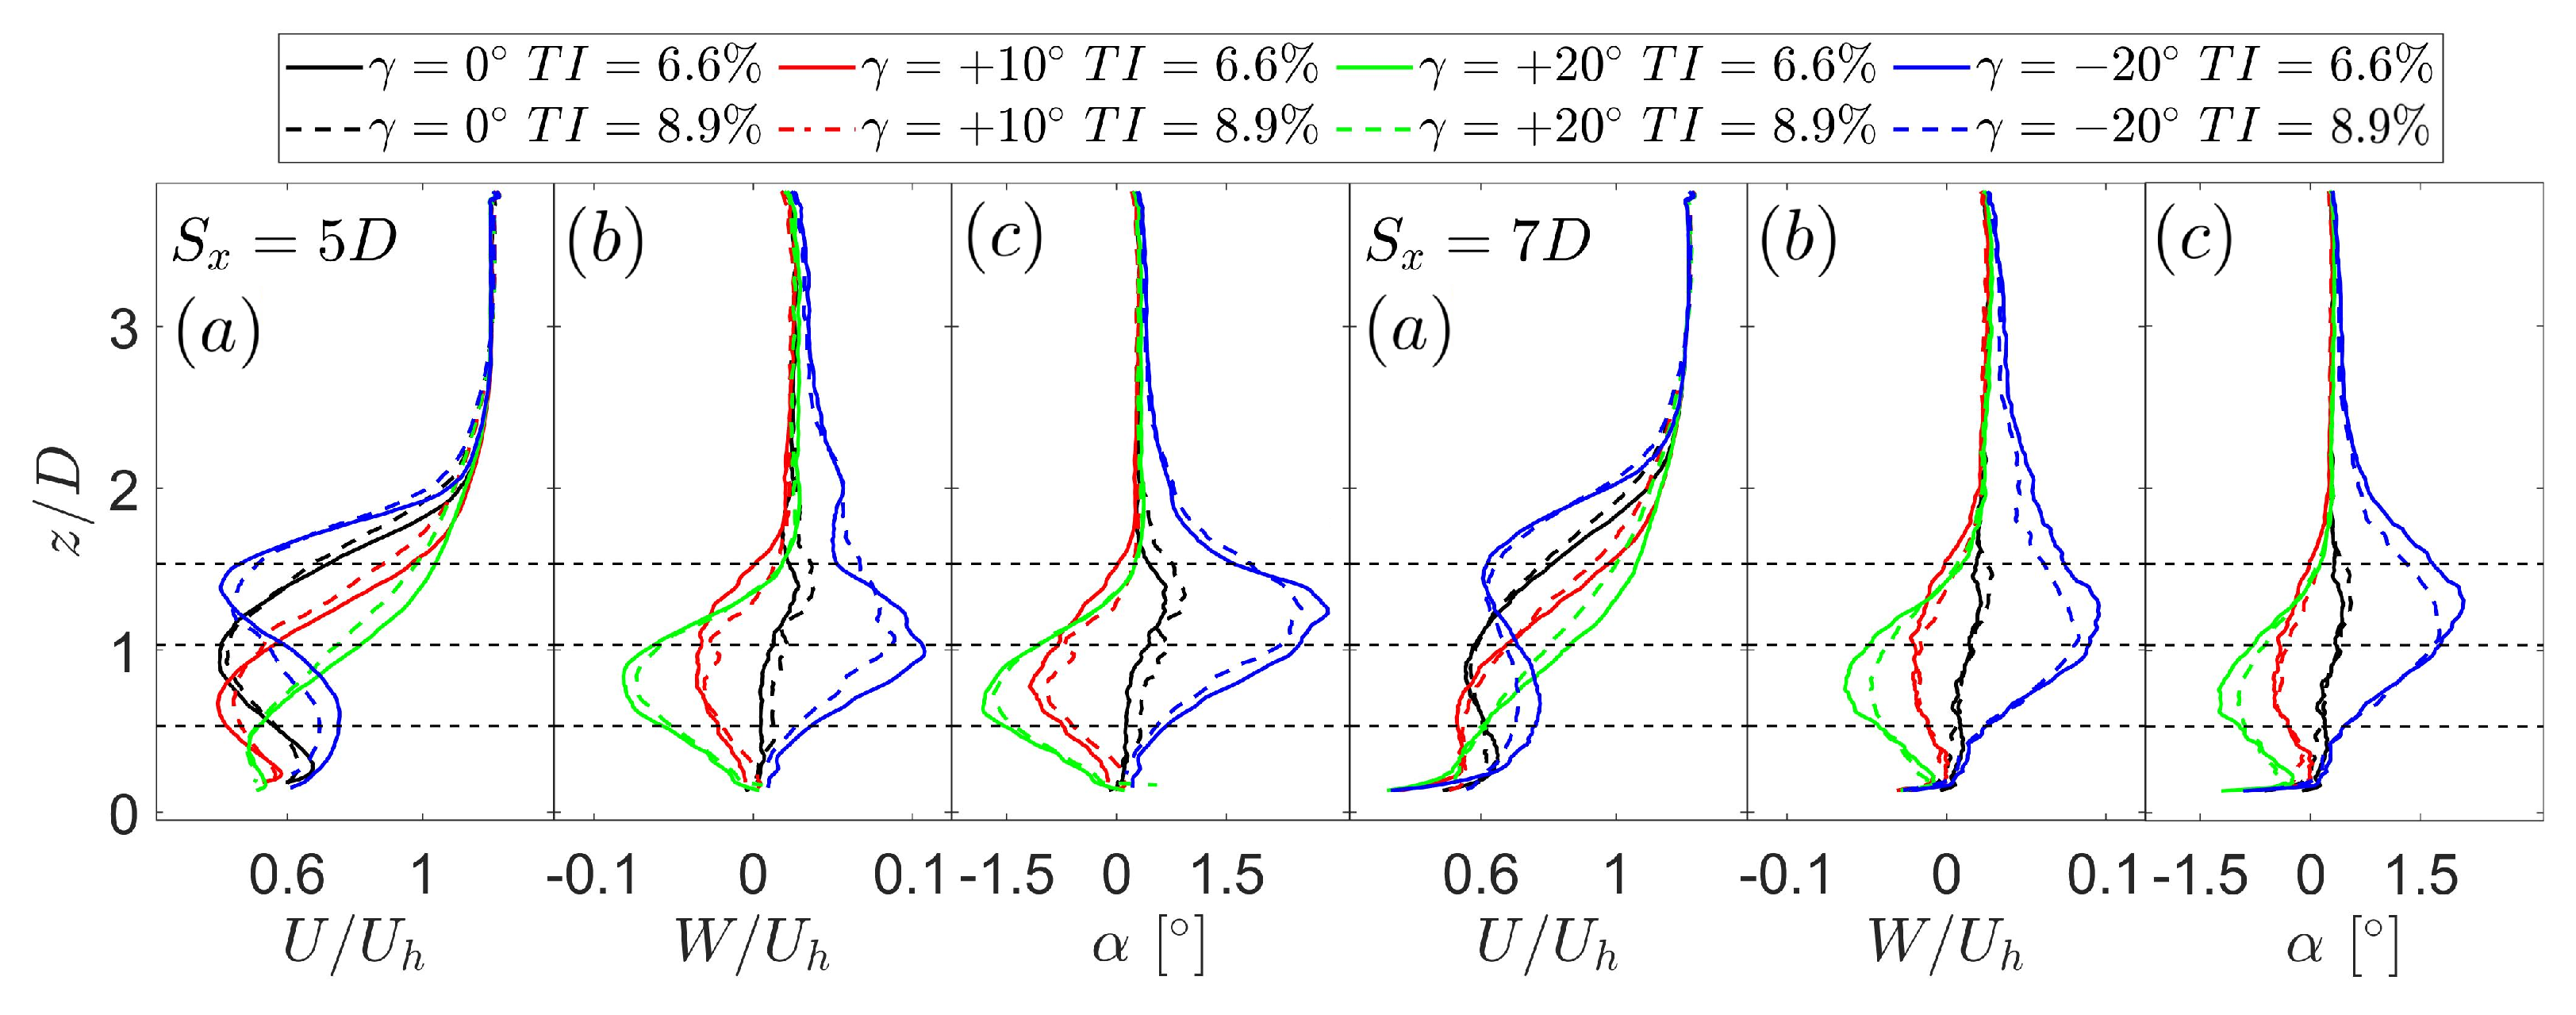
The downstream wind turbine also exhibited increased wake deflection with greater tilt angles of the upstream turbine. This deflection also presented an asymmetry depending on the tilt direction, but an opposite trend was observed. That is, negative tilt angles induced greater deflection compared to positive ones in the downstream turbine’s wake. Figure 12 presents the vertical profiles of the streamwise velocity, the vertical velocity, and the inclination angle (i.e., the angle of the velocity field with respect to the horizontal direction) experienced by the downstream turbine (i.e., 0.5D in front of the downstream turbine). Although the streamwise velocities for and are comparable, with peak values occurring at different heights, the vertical velocity was higher for since the flow was not redirected by any surface. The higher vertical velocity experienced by the downstream turbine for the case caused the wake to have a greater deflection compared to the case.
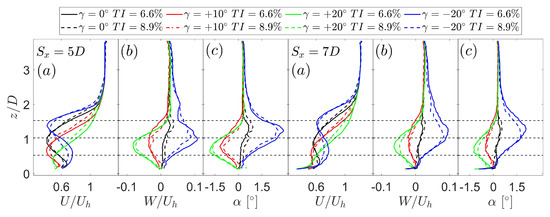
Figure 12.
Vertical profiles of streamwise velocity (a), vertical velocity (b), and inclination angle (c), 0.5D in front of the downstream turbine. The black dashed lines represent the rotor’s top tip, hub height, and bottom tip.
The wake deflection of the downstream turbine was also independent of the turbulence intensity level. An increased level of turbulence intensity barely modified the streamwise and vertical velocity profiles, leading to a very similar inclination angle. When it comes to turbine spacing, a slight reduction in the wake deflection of the downstream turbine was observed for positive tilt angles as spacing increased, but this effect was not significant for negative tilt angles. This is understandable since the wake recovered faster for positive tilt angles (further discussed in Section 3.2.2) and, therefore, lower vertical velocities and inclination angles were experienced by the downstream turbine at higher turbine spacing distances. It is worth noting that greater differences in turbulence intensity may induce varying levels of secondary steering, with higher turbulence intensity potentially reducing secondary steering effects because of increased wake recovery rates.
The shear faced by the downstream turbine, which is related to the loads experienced, decreased as the spacing between the turbines increased. This especially occurred for low tilt angles (e.g., ), as the downstream turbine partially faced the wake of the upstream turbine for lower streamwise turbine spacing. With greater streamwise spacing, both the wake recovery and the absolute deflection at the downstream turbine location increased, resulting in a lower shear across the downstream rotor plane.
3.2.2. Wake Recovery
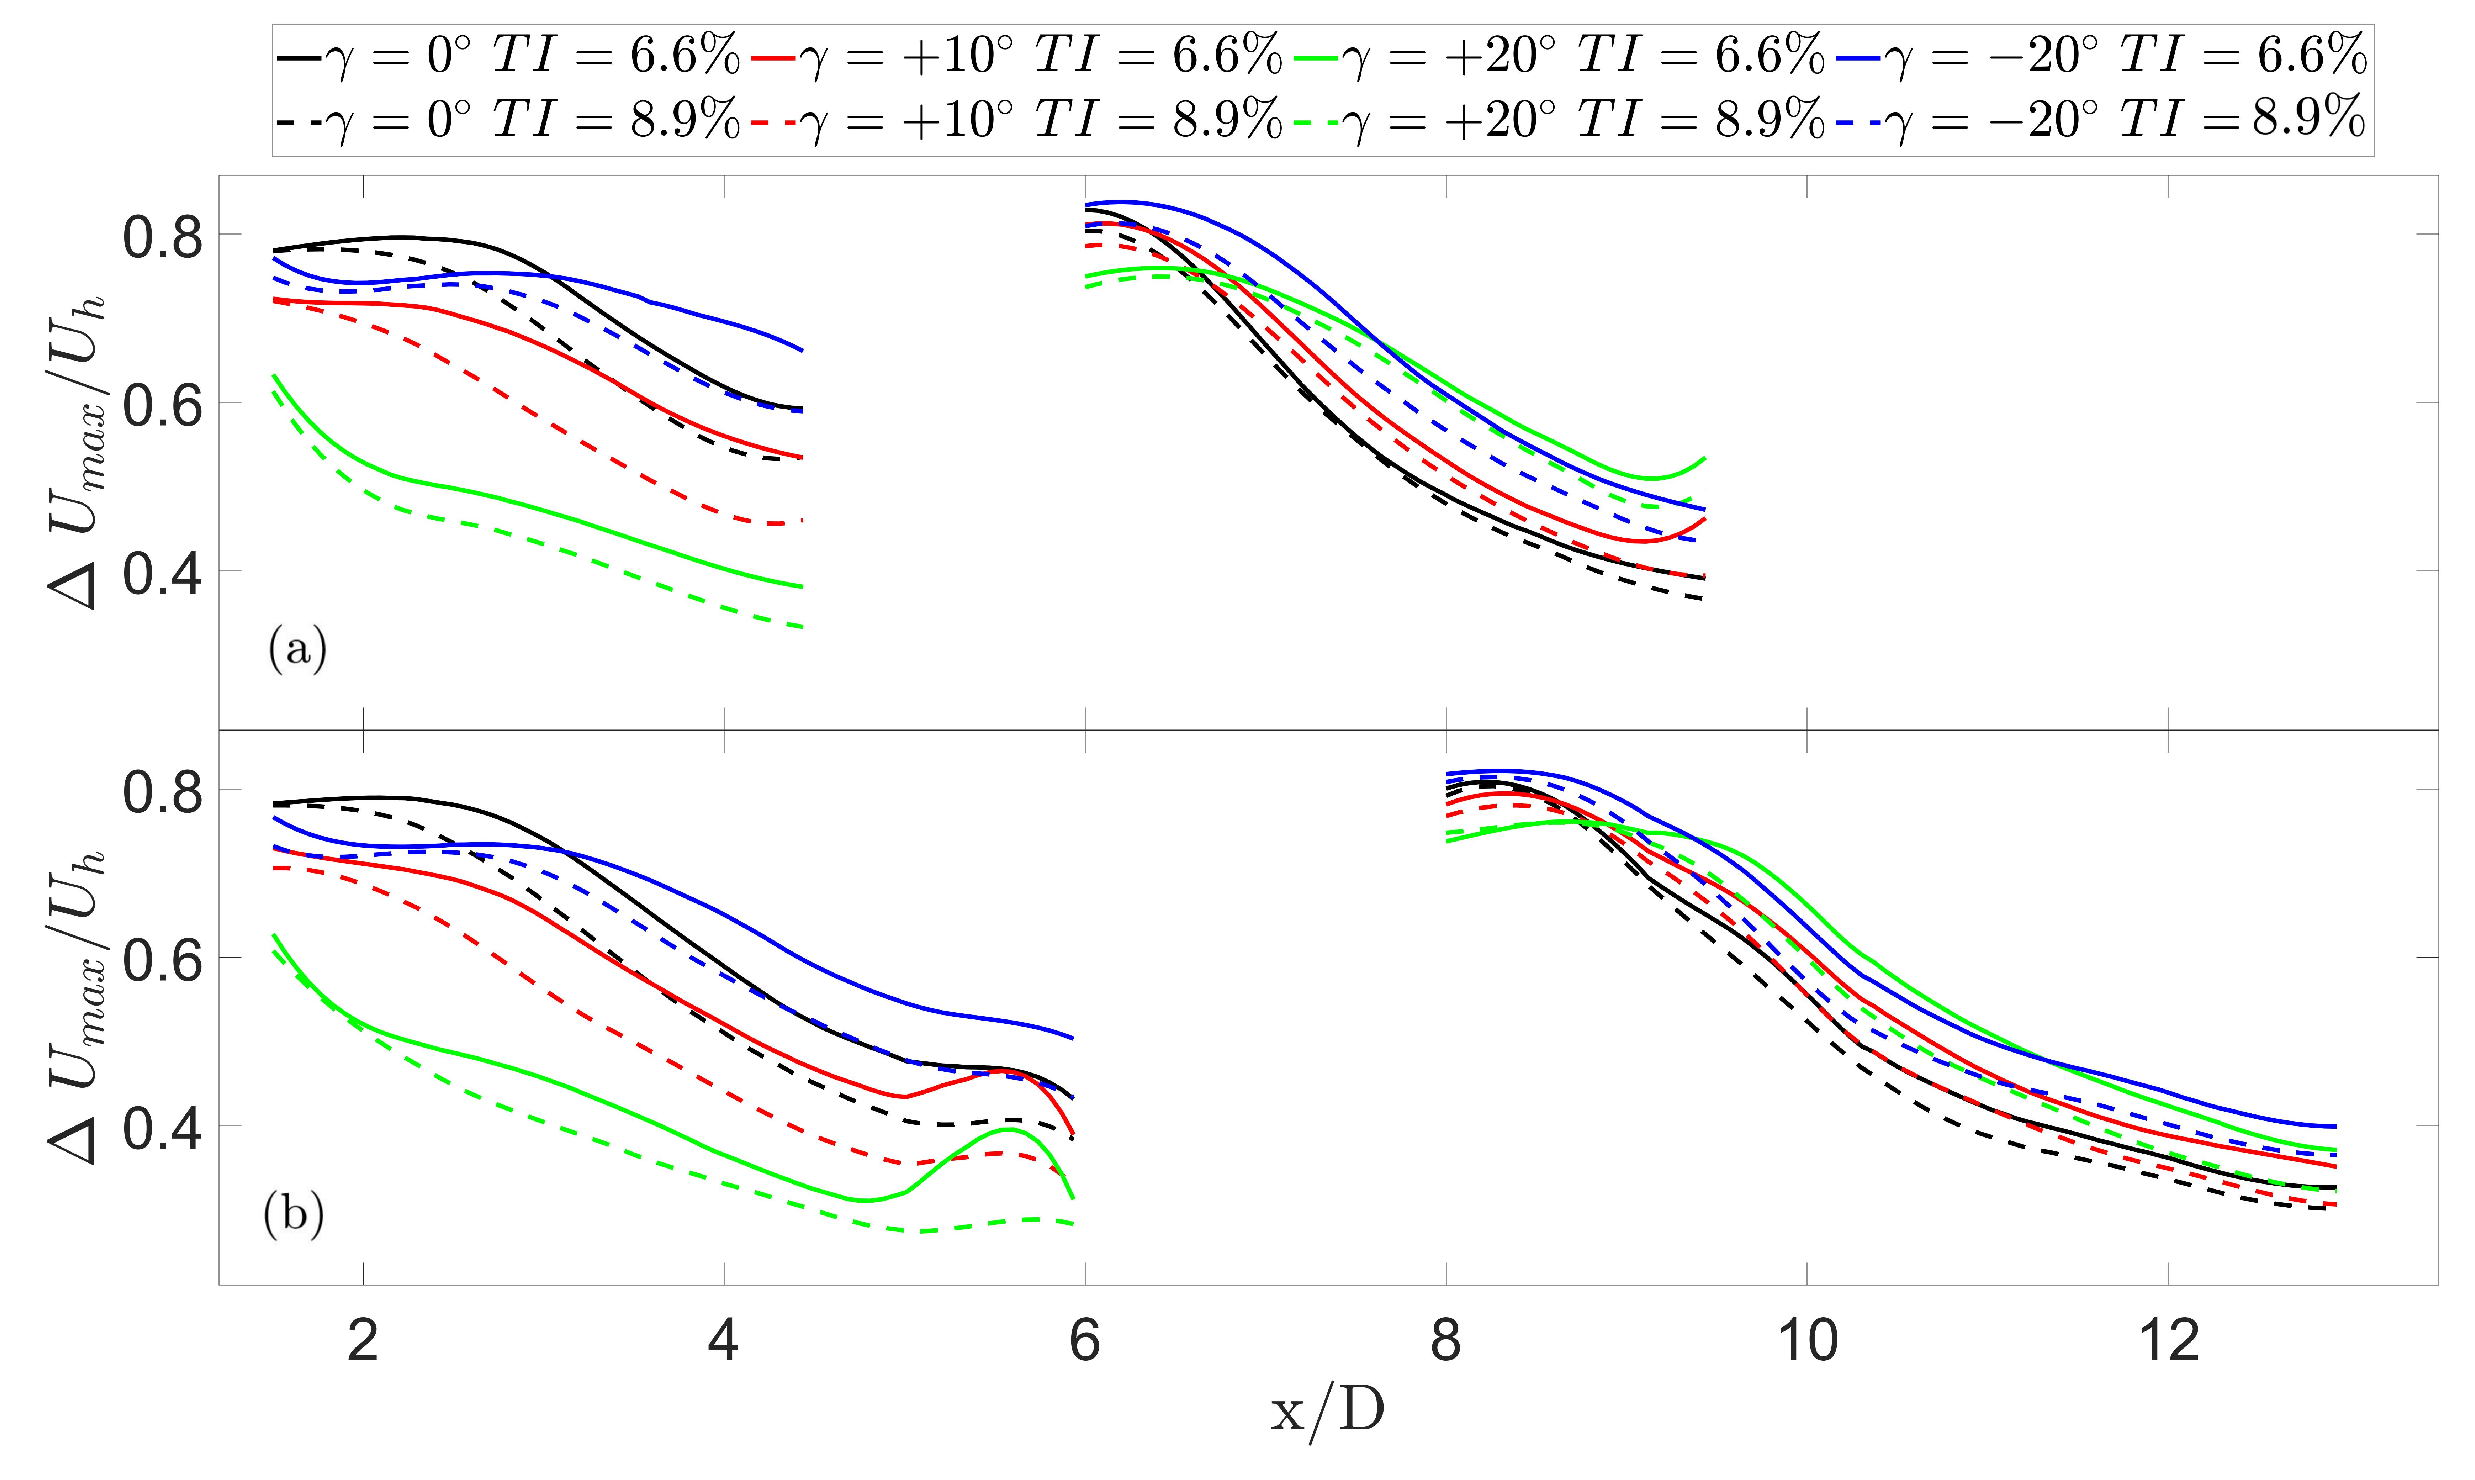
The wake recovery is known to be influenced by ambient inflow characteristics such as turbulence intensity, which affects flow mixing and the entrainment of the outer atmospheric flow into the wake [5]. Moreover, when a turbine is misaligned with respect to the incoming wind, both the projected area on the cross-stream plane and the streamwise component of the thrust decrease as the misalignment angle increases [13]. This results in a reduced velocity deficit in the near-wake region, making the wake weaker. Therefore, the increase in the power extraction of downstream turbines when upstream ones are tilted comes from both the wake deflection and the reduced wake strength. The wake recovery is shown through the deficit decay of the maximum wake velocity, as depicted in Figure 13.
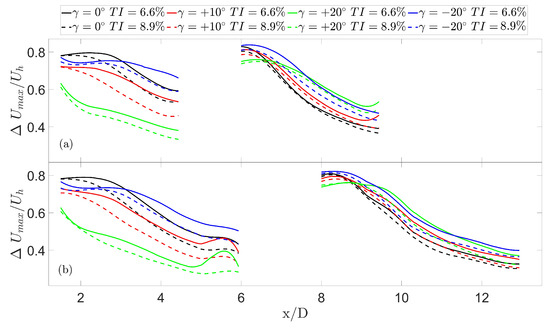
Figure 13.
Wake recovery, measured as the evolution of the maximum velocity deficit. (a) 5D streamwise turbine spacing, and (b) 7D streamwise turbine spacing.
The wake of the upstream turbine recovered faster for positive tilt angles compared to negative ones, particularly up to , after which the wake recovery rate became similar for both cases. Moreover, the magnitude of the tilt angle also had an effect, and the higher tilt led to a clear reduction in the maximum velocity deficit. Positive tilt angles (i.e., downward wake deflecting) pulled high energetic flows into the wake, weakening or even breaking the tip vortices. This enhanced wake mixing and recovery and promoted entrainment. Regarding the ground effect, deflecting the wake toward the ground increased local pressure, which hindered the formation of a counter-rotating vortex pair and reduced the wake’s strength [16]. Conversely, negative tilt angles pushed the wake toward high-energy flow, increasing the shear between the wake and the airflow above the turbine and drawing in low-energy, highly turbulent flow from beneath the turbine. The wake recovery rate of the downstream turbine was slightly slower for high tilt angles. This phenomenon stemmed from the fact that the flow encountered by the downstream turbine featured a lower turbulence intensity due to a weaker upstream turbine wake and wake deflection. The impact of this effect became more evident at shorter streamwise inter-turbine distances, as the upstream turbine’s wake had a reduced space to recover, magnifying the influence of an increase in its tilt angle on the wake recovery of the downstream turbine. In Figure 13, it can be seen that the relatively flat part of the curves associated with the near wake was longer with an increasing tilt angle. This caused the deficit decay (in the far wake) to start at longer downstream distances for higher angles. Moreover, only for , the decay rate in the far wake was smaller with increasing tilt angle. Both effects (longer near wake and slower decay) are consistent with the fact that the downward deflection of the upstream turbine’s wake led to a relatively less turbulent inflow for the second turbine.
The ambient turbulence intensity notably influenced the wake recovery of both turbines, with a more pronounced effect on the upstream one. This phenomenon is understandable and aligns with previous research findings [5,41,42,43], as higher ambient turbulence levels promote increased mixing between the wake and the outer flow. Conversely, increasing the spacing between turbines does not substantially slow down the wake recovery rate.
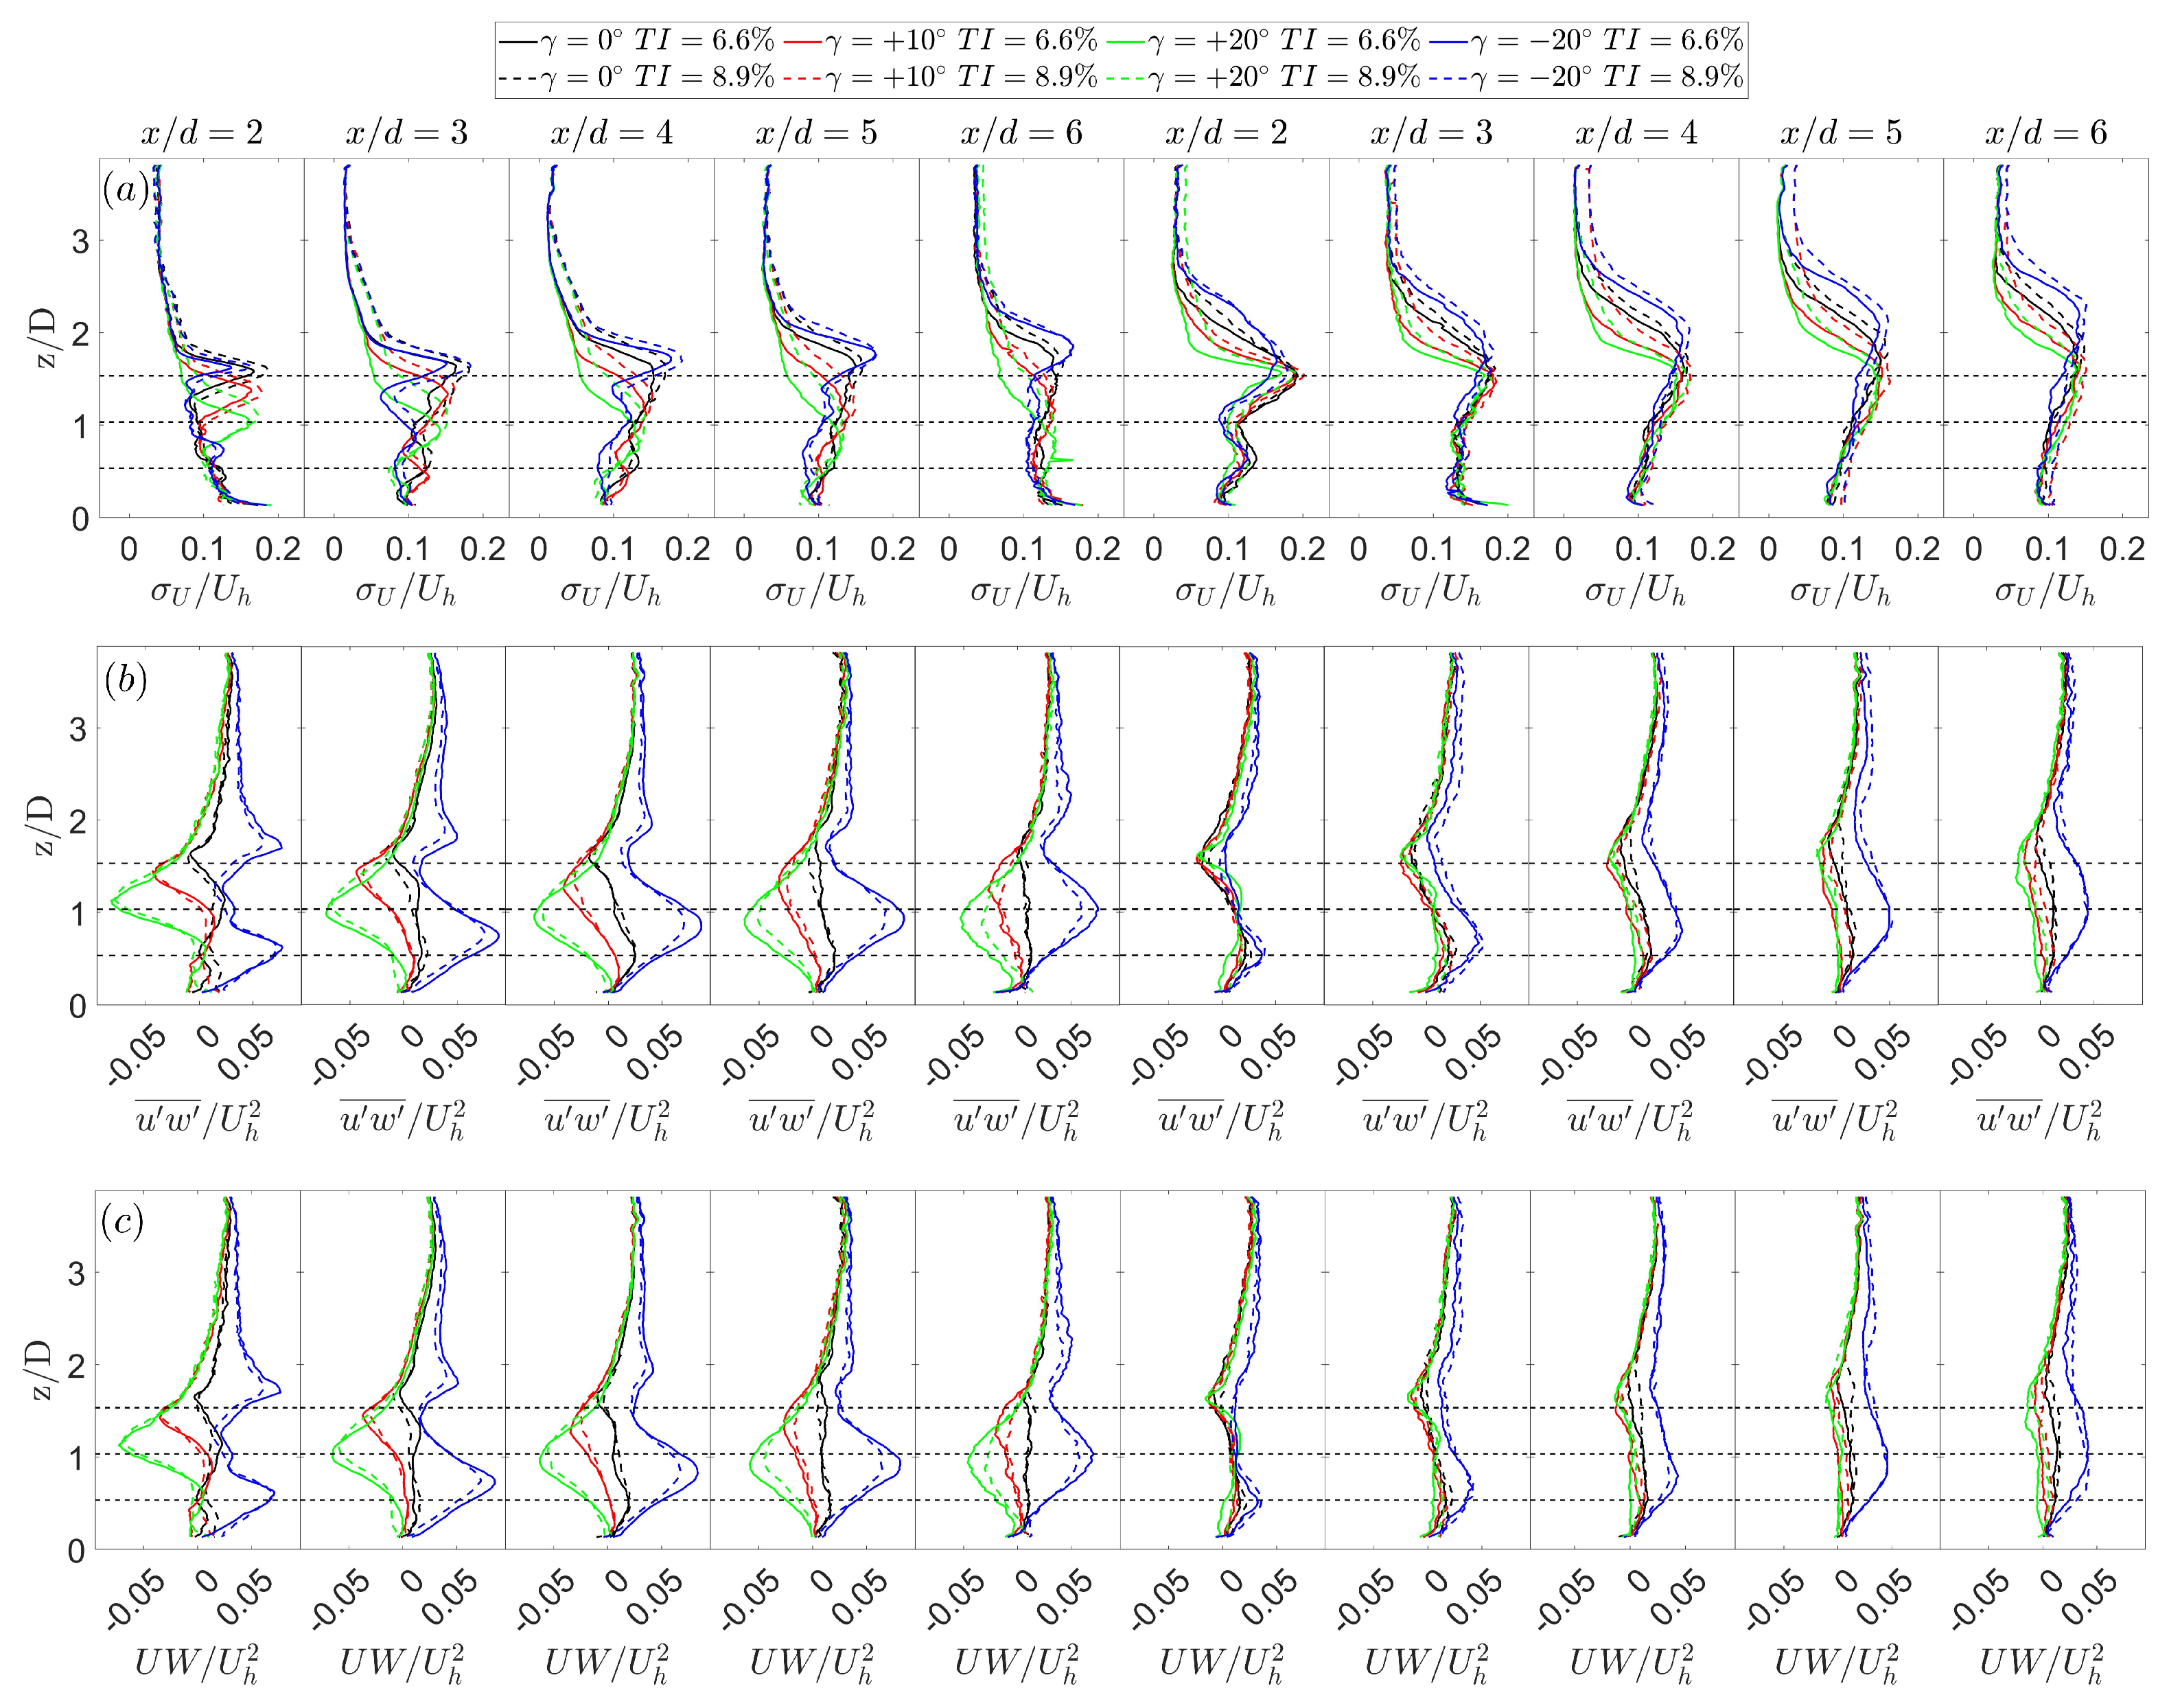
To gain insights into flow entrainment, Figure 14 presents the vertical profiles of the streamwise turbulence intensity , the normalized vertical momentum flux , and the normalized vertical mean flux . Only the profiles corresponding to are shown in Figure 14. In Figure 14a, the streamwise turbulence intensity in the wake of the upstream turbine exhibits a peak at the interface between the wake and the outer flow due to high shear. This peak is more pronounced and lasts longer for negative tilt angles compared to positive ones, as the shear increases when the wake is pushed against the high-energy flow. In the wake of the downstream turbine, a similar peak in turbulence intensity is observed. These peak values are comparable for all four configurations along the wake; however, the height at which they occur differs due to secondary steering effects.
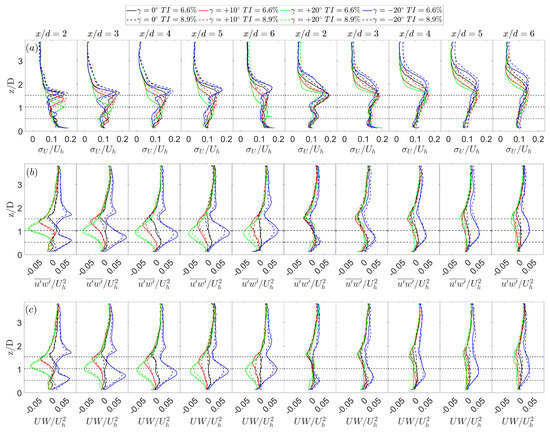
Figure 14.
Vertical profiles of the mean streamwise turbulence intensity (a), the normalized vertical momentum flux (b), and the normalized vertical mean flux (c) in the wakes of both turbines (). The black dashed lines represent the rotor’s top tip, hub height, and bottom tip.
Figure 14b,c provide insights into how the streamwise velocity gain comes from both the turbulent and mean momentum fluxes. In the wake of the upstream turbine, these quantities exhibit very similar patterns, with noticeable distinctions between positive and negative tilt angles. For positive tilt angles, a single prominent peak emerges, aligning with the location of maximum shear. Conversely, for negative tilt angles, both the turbulent and mean momentum fluxes display two peaks: the upper one is associated with the high shear between the wake and the outer flow, whereas the lower peak originates from the airflow beneath the turbine, which is drawn into the wake space. This lower peak dominates the entire wake, indicating that for a negative tilt, wake recovery is primarily driven by the low energetic flow occupying the wake space, rather than the high shear between the wake and the flow above the turbine.
3.2.3. Available Power
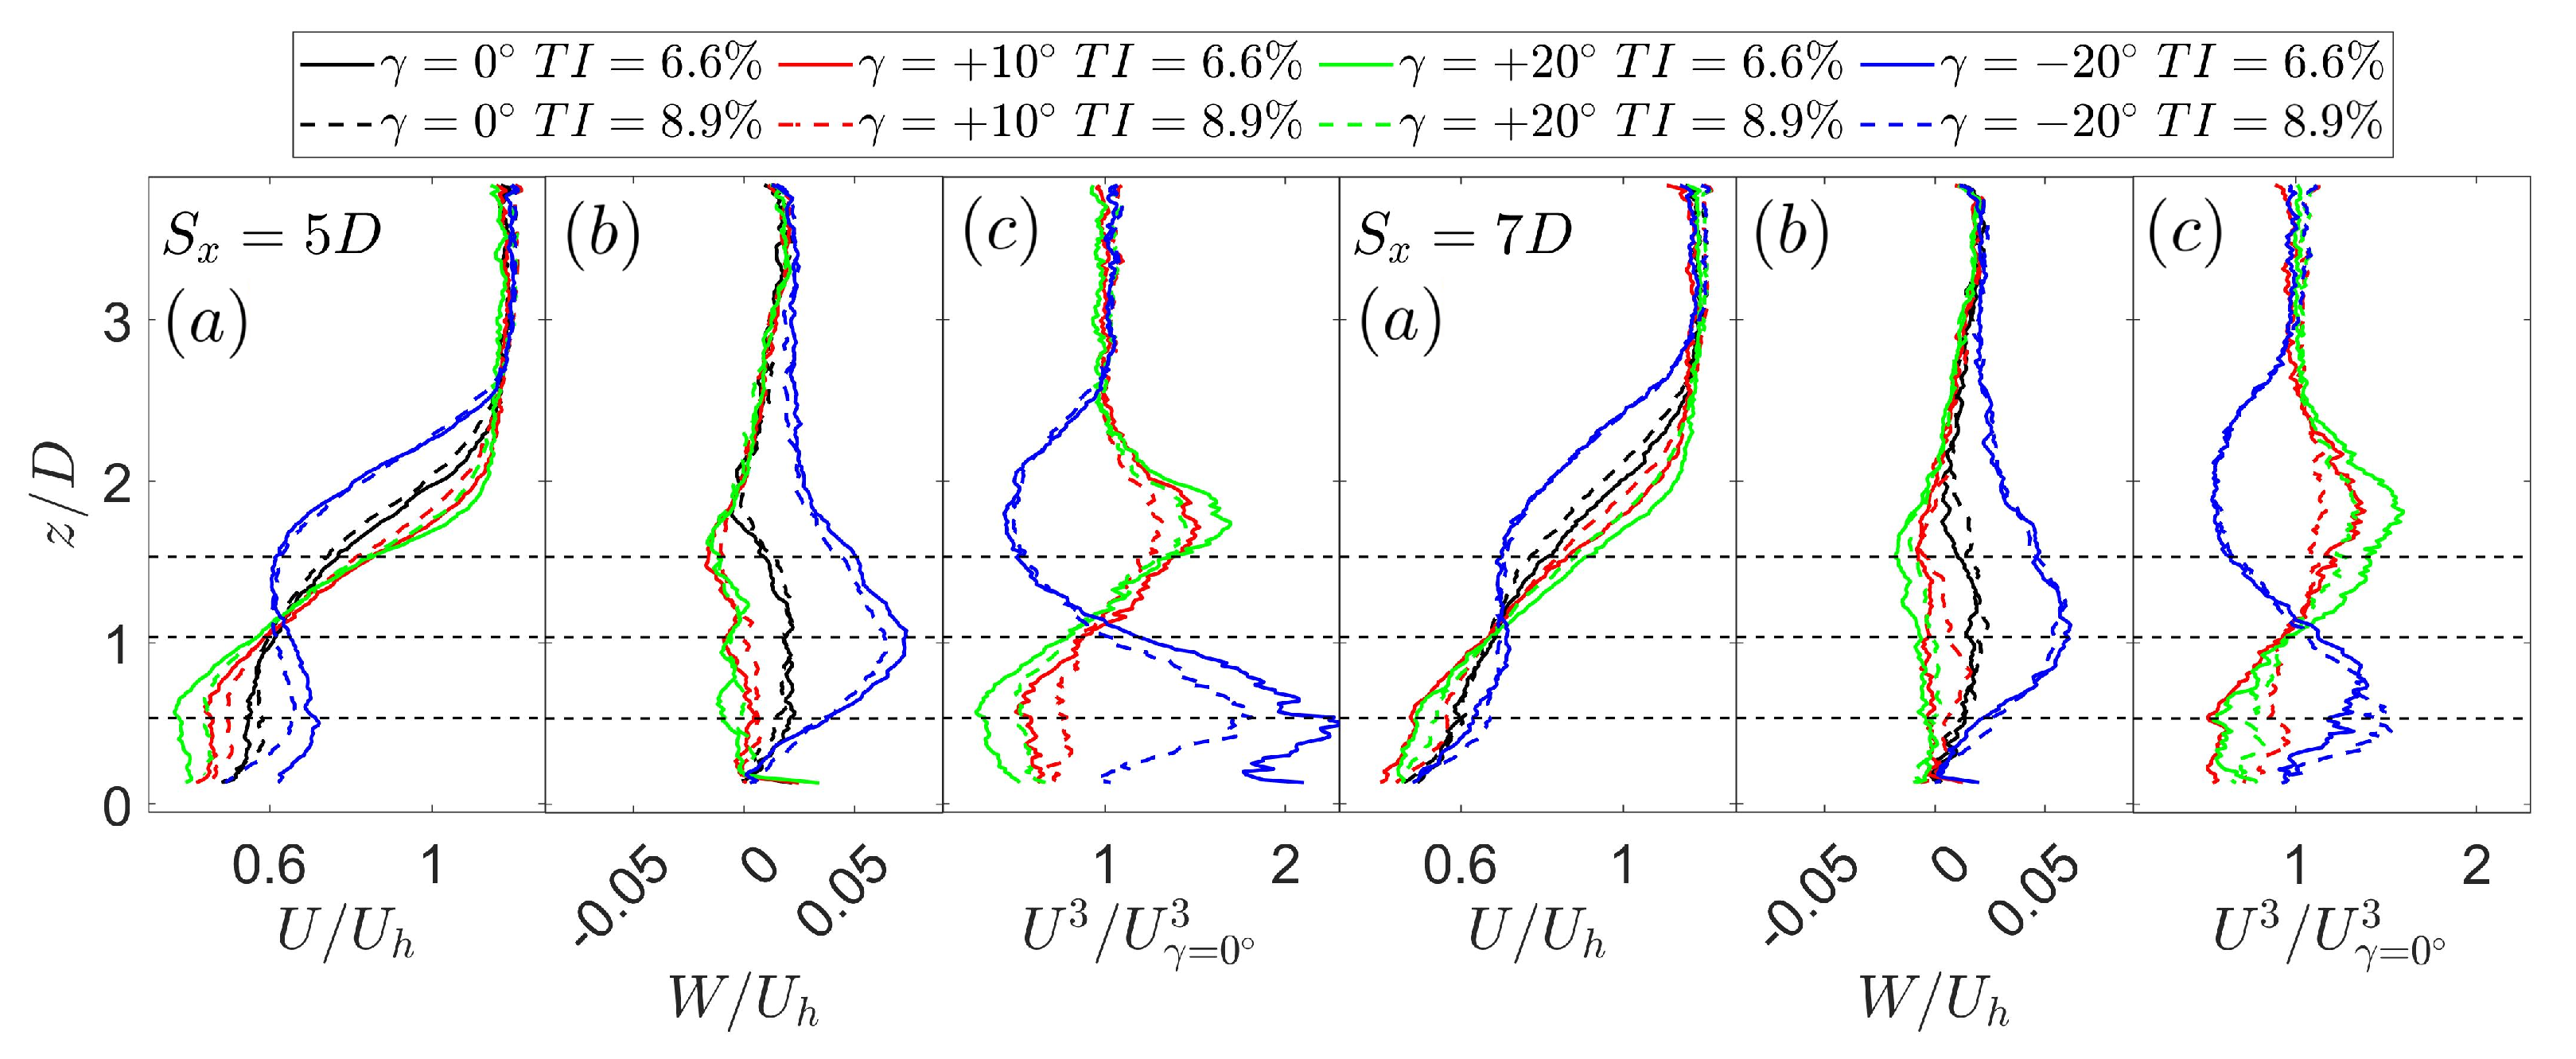
In this section, we examine the impact of tilting the first turbine on a hypothetical third wind turbine. The normalized streamwise and vertical velocity profiles experienced by the hypothetical third wind turbine are shown in Figure 15a,b. Additionally, based on the velocity fields, the vertical variations of available power are shown in Figure 15c. The available power values are normalized with respect to the available power for the configuration with no tilt.
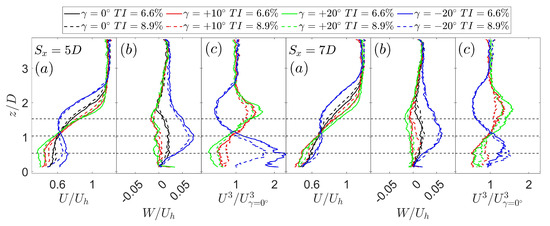
Figure 15.
Vertical profiles of normalized streamwise velocity (a), normalized vertical velocity (b), and normalized available power (c) experienced by a hypothetical third turbine. The black dashed lines represent the rotor’s top tip, hub height, and bottom tip.
When considering the streamwise velocity profiles, it can be observed that positive tilt angles generated high levels of shear at the location of the hypothetical third turbine. This is similar to the effect of low tilt angles in the second turbine since secondary steering caused the hypothetical third turbine to face part of the wake of the second turbine, leading to increased levels of shear. In contrast, the shear level at the location of the hypothetical third turbine diminished compared to the baseline case when the first turbine was tilted negatively. The vertical velocity also exhibited a different tendency between positive and negative tilt angles. The vertical velocity was close to zero across the entire rotor for positive tilt angles due to floor blockage and redirection effects. Conversely, negative tilt angles produced high vertical velocities within the wake of the first turbine (as discussed in Section 3.2.1), leading to increased secondary steering and elevated vertical velocities in the wake of the second turbine, which would be experienced by the hypothetical third turbine.
It is important to note that the impact of tilting the first turbine on the hypothetical third turbine decreased with increased streamwise spacing and turbulence intensity. This attenuation is a consequence of the increased wake recovery under these conditions.
The available power at the position of the hypothetical third wind turbine also exhibited an opposite trend between positive and negative tilt angles. Because of secondary steering, positive tilt angles resulted in significantly lower available power in the lower half of the rotor compared to the baseline case. This contrasts with the increase in available power observed at the upper half of the rotor because of enhanced entrainment. Negative tilt angles yielded the opposite effect. They led to increased available power in the lower half of the rotor, approximately doubling the power at the bottom tip compared to the baseline case, while the available power decreased in the upper half. The negative peak in the streamwise velocity and, consequently, power, could potentially be displaced out of the rotor plane due to secondary steering. This outcome emphasizes the importance of cumulative wake deflection through the gradual reduction of the tilt angle, which has the potential to significantly increase the power gains using tilt control in a wind farm with more turbines.
4. Conclusions and Future Work
In this study, experiments in the boundary layer wind tunnel at the WiRE laboratory of EPFL were conducted to investigate the effectiveness of axial induction control, through the TSR, and tilt control in enhancing a wind farm’s power output. The former was tested in a wind farm of two, three, and five miniature wind turbines, whereas the latter was tested in a two-turbine wind farm under eleven tilt angles, two levels of turbulence intensity, and two levels of streamwise turbine spacing. All experiments were conducted under full wake conditions. Furthermore, this study involved the measurement and characterization of the flow across a two-turbine wind farm implementing tilt control. Power data were acquired using a permanent magnet DC motor, and flow data were captured using stereoscopic particle-image velocimetry (S-PIV). The key findings can be summarized as follows:
- Varying the axial induction factor by modifying the pitch angle is not equivalent to doing so by changing the TSR. In fact, it is theoretically shown that decreasing the AoA through blade pitch control reduces the thrust, whereas doing this through TSR control increases it.
- Static axial induction control is found to be ineffective in increasing the overall power extraction, even in a low-turbulence environment (hub-height turbulence intensity = 4%), regardless of the number of turbines. However, since the decrease in power extraction when the technique is applied is minimal, it could be considered for other purposes, such as balancing the load distribution within a wind farm.
- Negative tilt angles (i.e., upward-deflection tilt) are unable to increase the global power output. Although the downstream turbine experiences a power increase, it is far from compensating for the loss of power output in the upstream turbine, regardless of the turbulence intensity level and the turbine spacing.
- Positive tilt angles lead to a significant increase in the global power extraction, regardless of the turbine spacing and turbulence intensity level. They promote entrainment and draw high-energy flow into the wake space. The power gains observed with only two turbines (e.g., 16.5% for and ) are higher than those obtained through other wake mitigation strategies such as yaw control in a similar environment.
- The maximum power gain and optimal tilt angle decrease with an increase in turbulence intensity or turbine spacing. Furthermore, tilt control appears to be more responsive to changes in turbulence intensity than to variations in turbine spacing.
- The wake deflection increases with the tilt angle. Positive tilt angles induce higher deflection in the wake of a tilted turbine compared to negative ones. However, negative tilt angles induce higher secondary steering because of the higher vertical velocities and inclination angles experienced by the downstream turbine.
- Positive tilt angles promote entrainment from the outer flow, accelerating the wake recovery up to , after which the ground blocks and redirects the flow. The wake of a downstream turbine exhibits an opposite trend and recovers more slowly for high-tilt angles, regardless of the tilt direction. This is due to the lower level of turbulence intensity experienced by the downstream turbine, resulting from wake deflection and increased recovery.
- Tilting the first turbine affects the flow experienced by a hypothetical third wind turbine. Positive angles increase the level of shear, whereas negative angles increase the vertical velocity.
- The available power at the location of a hypothetical third wind turbine shows an increase in the upper half of the rotor and a decrease in the lower half for positive tilt angles. Conversely, negative tilt angles exhibit an opposite trend, primarily due to secondary steering effects.
The cumulative effect of tilting upstream turbines within a large wind farm has not yet been experimentally studied and could be a focus for further research. Additionally, buoyancy effects due to thermal stability could be key in vertical wake deflection and could also be explored in future research. Finally, the literature lacks an analytical model capable of capturing the velocity field in the wake of a tilted wind turbine.
Author Contributions
Conceptualization, G.A.B. and F.P.-A.; methodology, G.A.B. and F.P.-A.; formal analysis, G.A.B.; investigation, G.A.B.; resources, F.P.-A.; data curation, G.A.B.; writing—original draft preparation, G.A.B.; writing—review and editing, F.P.-A.; supervision, F.P.-A.; funding acquisition, F.P.-A. All authors have read and agreed to the published version of the manuscript.
Funding
This work was funded by the European Union Horizon 2020 research and innovation program, Train2Wind project, grant agreement no. 861291. The authors also acknowledge the support of the Swiss National Science Foundation (Grant Number 200021_215288) and the Swiss Federal Office of Energy (Grant No. SI/502135–01).
Data Availability Statement
Data are contained within the article.
Conflicts of Interest
The authors declare that they have no known competing financial interests or personal relationships that could have appeared to influence the work reported in this paper.
References
- International Energy Agency (IEA). World Energy Outlook 2021, WEO2021; IEA: Paris, France, 2021. [Google Scholar]
- International Renewable Energy Agency (IRENA). Renewable Power Generation Costs in 2018; IRENA: Masdar City, United Arab Emirates, 2018; pp. 10,18,23,36. [Google Scholar]
- Nash, R.; Nouri, R.; Vasel-Be-Hagh, A. Wind turbine wake control strategies: A review and concept proposal. Energy Convers. Manag. 2021, 245, 114581. [Google Scholar] [CrossRef]
- Wilson, D.; Rodrigues, S.; Segura, C.; Loshchilov, I.; Hutter, F.; Buenfil, G.L.; Kheiri, A.; Keedwell, E.; Ocampo-Pineda, M.; Özcan, E.; et al. Evolutionary computation for wind farm layout optimization. Renew. Energy 2018, 126, 681–691. [Google Scholar] [CrossRef]
- Porté-Agel, F.; Bastankhah, M.; Shamsoddin, S. Wind-turbine and wind-farm flows: A review. Bound.-Layer Meteorol. 2020, 174, 1–59. [Google Scholar] [CrossRef]
- Weipao, M.; Chun, L.; Jun, Y.; Yang, Y.; Xiaoyun, X. Numerical investigation of wake control strategies for maximizing the power generation of wind farm. J. Sol. Energy Eng. 2016, 138, 034501. [Google Scholar] [CrossRef]
- Wu, Y.T.; Porté-Agel, F. Modeling turbine wakes and power losses within a wind farm using LES: An application to the Horns Rev offshore wind farm. Renew. Energy 2015, 75, 945–955. [Google Scholar] [CrossRef]
- Ghaisas, N.S.; Archer, C.L. Geometry-based models for studying the effects of wind farm layout. J. Atmos. Ocean. Technol. 2016, 33, 481–501. [Google Scholar] [CrossRef]
- Hou, P.; Hu, W.; Soltani, M.; Chen, C.; Chen, Z. Combined optimization for offshore wind turbine micro siting. Appl. Energy 2017, 189, 271–282. [Google Scholar] [CrossRef]
- Van Dijk, M.T.; van Wingerden, J.W.; Ashuri, T.; Li, Y. Wind farm multi-objective wake redirection for optimizing power production and loads. Energy 2017, 121, 561–569. [Google Scholar] [CrossRef]
- Bastankhah, M.; Porté-Agel, F. Wind farm power optimization via yaw angle control: A wind tunnel study. J. Renew. Sustain. Energy 2019, 11, 023301. [Google Scholar] [CrossRef]
- Zong, H.; Porté-Agel, F. Experimental investigation and analytical modelling of active yaw control for wind farm power optimization. Renew. Energy 2021, 170, 1228–1244. [Google Scholar] [CrossRef]
- Bastankhah, M.; Porté-Agel, F. Experimental and theoretical study of wind turbine wakes in yawed conditions. J. Fluid Mech. 2016, 806, 506–541. [Google Scholar] [CrossRef]
- Cossu, C. Wake redirection at higher axial induction. Wind. Energy Sci. 2021, 6, 377–388. [Google Scholar] [CrossRef]
- Fleming, P.; Gebraad, P.M.; Lee, S.; van Wingerden, J.W.; Johnson, K.; Churchfield, M.; Michalakes, J.; Spalart, P.; Moriarty, P. Simulation comparison of wake mitigation control strategies for a two-turbine case. Wind Energy 2015, 18, 2135–2143. [Google Scholar] [CrossRef]
- Bossuyt, J.; Scott, R.; Ali, N.; Cal, R.B. Quantification of wake shape modulation and deflection for tilt and yaw misaligned wind turbines. J. Fluid Mech. 2021, 917, A3. [Google Scholar] [CrossRef]
- Fleming, P.A.; Gebraad, P.M.; Lee, S.; van Wingerden, J.W.; Johnson, K.; Churchfield, M.; Michalakes, J.; Spalart, P.; Moriarty, P. Evaluating techniques for redirecting turbine wakes using SOWFA. Renew. Energy 2014, 70, 211–218. [Google Scholar] [CrossRef]
- Abdelsalam, A.M.; Ramalingam, V. Effect of the tilt angle on the wind turbine performance and wakes. In Proceedings of the Eighth Asia-Pacific Conference on Wind Engineering, Chennai, India, 10–14 December 2013. [Google Scholar]
- Nanos, E.M.; Letizia, S.; Clemente, D.J.B.; Wang, C.; Rotea, M.; Iungo, V.I.; Bottasso, C.L. Vertical wake deflection for offshore floating wind turbines by differential ballast control. In Journal of Physics: Conference Series; IOP Publishing: Bristol, UK, 2020; Volume 1618, p. 022047. [Google Scholar]
- Roddier, D.; Cermelli, C.; Weinstein, A. WindFloat: A floating foundation for offshore wind turbines—Part I: Design basis and qualification process. In Proceedings of the International Conference on Offshore Mechanics and Arctic Engineering, Honolulu, HI, USA, 31 May–5 June 2009; Volume 43444, pp. 845–853. [Google Scholar]
- Scott, R.; Bossuyt, J.; Cal, R.B. Characterizing tilt effects on wind plants. J. Renew. Sustain. Energy 2020, 12, 043302. [Google Scholar] [CrossRef]
- Johlas, H.M.; Schmidt, D.P.; Lackner, M.A. Large eddy simulations of curled wakes from tilted wind turbines. Renew. Energy 2022, 188, 349–360. [Google Scholar] [CrossRef]
- Su, K.; Bliss, D. A numerical study of tilt-based wake steering using a hybrid free-wake method. Wind Energy 2020, 23, 258–273. [Google Scholar] [CrossRef]
- Bay, C.J.; Annoni, J.; Martínez-Tossas, L.A.; Pao, L.Y.; Johnson, K.E. Flow control leveraging downwind rotors for improved wind power plant operation. In Proceedings of the 2019 American Control Conference (ACC), Philadelphia, PA, USA, 10–12 July 2019; IEEE: Piscataway, NJ, USA, 2019; pp. 2843–2848. [Google Scholar]
- Wang, J.; Bottasso, C.L.; Campagnolo, F. Wake redirection: Comparison of analytical, numerical and experimental models. J. Physics Conf. Ser. 2016, 753, 032064. [Google Scholar] [CrossRef]
- Tobin, N.; Hamed, A.M.; Chamorro, L.P. Fractional flow speed-up from porous windbreaks for enhanced wind-turbine power. Bound.-Layer Meteorol. 2017, 163, 253–271. [Google Scholar] [CrossRef]
- Adaramola, M.S.; Krogstad, P.Å. Experimental investigation of wake effects on wind turbine performance. Renew. Energy 2011, 36, 2078–2086. [Google Scholar] [CrossRef]
- Bartl, J.; Sætran, L. Experimental testing of axial induction based control strategies for wake control and wind farm optimization. In Journal of Physics: Conference Series; IOP Publishing: Bristol, UK, 2016; Volume 753, p. 032035. [Google Scholar]
- Campagnolo, F.; Petrović, V.; Bottasso, C.L.; Croce, A. Wind tunnel testing of wake control strategies. In Proceedings of the 2016 American Control Conference (ACC), Boston, MA, USA, 6–8 July 2016; IEEE: Piscataway, NJ, USA, 2016; pp. 513–518. [Google Scholar]
- Frederik, J.A.; Weber, R.; Cacciola, S.; Campagnolo, F.; Croce, A.; Bottasso, C.; van Wingerden, J.W. Periodic dynamic induction control of wind farms: Proving the potential in simulations and wind tunnel experiments. Wind Energy Sci. 2020, 5, 245–257. [Google Scholar] [CrossRef]
- Munters, W.; Meyers, J. Towards practical dynamic induction control of wind farms: Analysis of optimally controlled wind-farm boundary layers and sinusoidal induction control of first-row turbines. Wind Energy Sci. 2018, 3, 409–425. [Google Scholar] [CrossRef]
- Lee, J.; Son, E.; Hwang, B.; Lee, S. Blade pitch angle control for aerodynamic performance optimization of a wind farm. Renew. Energy 2013, 54, 124–130. [Google Scholar] [CrossRef]
- Dilip, D.; Porté-Agel, F. Wind turbine wake mitigation through blade pitch offset. Energies 2017, 10, 757. [Google Scholar] [CrossRef]
- Bastankhah, M.; Porté-Agel, F. A new miniature wind turbine for wind tunnel experiments. Part I: Design and performance. Energies 2017, 10, 908. [Google Scholar] [CrossRef]
- Bastankhah, M.; Porté-Agel, F. A new miniature wind turbine for wind tunnel experiments. Part ii: Wake structure and flow dynamics. Energies 2017, 10, 923. [Google Scholar] [CrossRef]
- Hansen, M. Aerodynamics of Wind Turbines; Routledge: London, UK, 2015. [Google Scholar]
- Revaz, T.; Lin, M.; Porté-Agel, F. Numerical framework for aerodynamic characterization of wind turbine airfoils: Application to miniature wind turbine WiRE-01. Energies 2020, 13, 5612. [Google Scholar] [CrossRef]
- Shapiro, C.R.; Gayme, D.F.; Meneveau, C. Modelling yawed wind turbine wakes: A lifting line approach. J. Fluid Mech. 2018, 841, R1. [Google Scholar] [CrossRef]
- Burton, T.; Jenkins, N.; Sharpe, D.; Bossanyi, E. Wind Energy Handbook; John Wiley & Sons: Hoboken, NJ, USA, 2011. [Google Scholar]
- Munters, W.; Meyers, J. Dynamic strategies for yaw and induction control of wind farms based on large-eddy simulation and optimization. Energies 2018, 11, 177. [Google Scholar] [CrossRef]
- Bastankhah, M.; Porté-Agel, F. A new analytical model for wind-turbine wakes. Renew. Energy 2014, 70, 116–123. [Google Scholar] [CrossRef]
- Hansen, K.S.; Barthelmie, R.J.; Jensen, L.E.; Sommer, A. The impact of turbulence intensity and atmospheric stability on power deficits due to wind turbine wakes at Horns Rev wind farm. Wind Energy 2012, 15, 183–196. [Google Scholar] [CrossRef]
- Chamorro, L.P.; Porté-Agel, F. A wind-tunnel investigation of wind-turbine wakes: Boundary-layer turbulence effects. Bound.-Layer Meteorol. 2009, 132, 129–149. [Google Scholar] [CrossRef]


Disclaimer/Publisher’s Note: The statements, opinions and data contained in all publications are solely those of the individual author(s) and contributor(s) and not of MDPI and/or the editor(s). MDPI and/or the editor(s) disclaim responsibility for any injury to people or property resulting from any ideas, methods, instructions or products referred to in the content. |
© 2023 by the authors. Licensee MDPI, Basel, Switzerland. This article is an open access article distributed under the terms and conditions of the Creative Commons Attribution (CC BY) license (https://creativecommons.org/licenses/by/4.0/).