Article

Study on the Mechanism of Gas Intrusion and Its Transportation in a Wellbore under Shut-in Conditions

1
CNOOC International Limited, Beijing 100028, China
2
School of Petroleum Engineering, China University of Petroleum (East China), Qingdao 266555, China
3
College of Computer Science and Technology, China University of Petroleum (East China), Qingdao 266555, China
*
Author to whom correspondence should be addressed.
Energies 2024, 17(1), 242; https://doi.org/10.3390/en17010242
Submission received: 25 October 2023 / Revised: 20 November 2023 / Accepted: 13 December 2023 / Published: 3 January 2024
(This article belongs to the Topic Advances in Oil and Gas Wellbore Integrity)

Abstract

:
This paper presents a comprehensive study based on multiphase-seepage and wellbore multiphase-flow theories. It establishes a model for calculating the rate of gas intrusion that considers various factors, including formation pore permeability, bottomhole pressure difference, rheology of the drilling fluid, and surface tension. Experiments were conducted to investigate the mechanism of gas intrusion under shut-in conditions, and the experimental results were employed to validate the reliability of the proposed method for calculating the gas intrusion rate. Furthermore, this research explores the transportation rates of single bubbles and bubble clusters in drilling fluid under shut-in conditions. Additionally, empirical expressions were derived for the drag coefficient for single bubbles and bubble clusters in the wellbore. These expressions can be used to calculate gas transportation rates for various equivalent radii of single bubbles and bubble clusters. The initial bubble size of intrusive gas, the transportation speed of intrusive gas in the wellbore, the rate of gas intrusion, and variations in the wellbore pressure after gas intrusion were analyzed. Additionally, a method was developed to calculate the rising velocity of bubble clusters in water based on experimental results. The study reveals that the average bubble size in the bubble cluster is significantly smaller than the size of single bubbles generated from the orifice. When the viscosity of the drilling fluid is low, the transportation velocity of the bubble cluster exhibits a positive correlation with the average bubble diameter. When the average bubble diameter exceeds 1 mm, the bubble velocity no longer varies with changes in the bubble-cluster diameter. The research results provide theoretical support for wellbore pressure prediction and pressure control under shutdown conditions.

1. Introduction

As oil and gas exploration extends into deep and ultra-deep formations, the geological structures encountered during the drilling of oil and gas wellbores become notably complex. Studies show that various factors can lead to the intrusion of formation fluids into these wellbores. During offshore drilling, if gas invasion and overflow are not detected in time, blowouts can rapidly occur. Influx fluids tend to have a high pressure; a gas kick is much more detrimental than a liquid kick due to gas expansion and, as a result, has greater variation in pressure [1]. To ensure the safety of drilling operations and facilitate the rapid progress of drilling, the a precise model for gas intrusion rates and bubble transportation must be developed. Such a model can provide the foundation for predicting wellbore pressure dynamics.
The mechanisms responsible for gas intrusion into the wellbore can be categorized into three classes: differential-pressure gas intrusion, diffusion gas intrusion, and gas intrusion driven by gravity displacement. The present study focuses on the most common mechanism, which is differential-pressure gas intrusion. The majority of gas intrusion models based on differential-pressure gas intrusion were developed using percolation theory. Numerous investigations have considered various factors influencing pressure-differential gas intrusion. For instance, Rommetveit [2] conducted field experiments to investigate the impact of diverse factors on gas intrusion. Stefan and Samuel [3] focused on the pore pressure and permeability of the formation in their prediction model.
To enhance the accuracy of multiphase flow models and simulate gas intrusion accurately, numerous investigations have focused on gas-bubble migration. Gas migration is a crucial process in gas-liquid two-phase flows, and it is also a theoretical and fundamental problem in wellbores during well drilling. Studies show that the mechanisms governing gas migration are closely related to factors such as drilling conditions, properties of the drilling fluid, and gas intrusion into the wellbore. Davies and Taylor [4] proposed a predictive expression for gas slip velocity in various flow types such as Taylor bubble flow, segmented plug flow, and churn flow within a round vertical tube. Harmathy [5] performed experiments and derived an empirical expression for estimating bubble rising velocity in stationary liquids. Wallis [6] studied the flow of gas bubbles in stationary liquids in a round tube and modified the empirical expression proposed by Harmathy for single bubbles. Mendelson, Fan, and Tamiyama [7] introduced different models for the rising velocity of gases in non-Newtonian fluids under various experimental conditions. In recent years, extensive investigations have been carried out focusing on bubble rising behavior, employing advanced experimental equipment and numerical simulation techniques. For instance, Tai Wang et al. [8] studied the fusion of two bubbles along the same axis, finding that bubbles do not fuse when the surface tension is high. Conversely, it was found that bubbles are prone to fragmentation when the surface tension is very low. Liu Yipeng et al. [9] combined the theory of flow transformation with experiments and developed a predictive expression for the formation position of Taylor bubbles in cryogenic pipelines. Krzan et al. [10] performed comprehensive experiments and demonstrated that the addition of a small quantity of ionic surfactant can effectively reduce the rising rate of bubbles in organic solutions. Furthermore, Azzopardi et al. [11] experimentally investigated the rising of large bubbles in highly viscous liquids and established a model for periodic oscillation of the free liquid surface induced by gas lift. Keshavarzi et al. [12] experimentally analyzed the interface deformation during the rise of individual bubbles and validated the theoretical models of VOF and CLSVOF. Cano-Lozano et al. [13] correlated the Rastello linear-rise model for bubbles with the Clift curve-rise model for bubbles, yielding a correlation equation applicable to the calculation of bubble rise velocities for a wide range of bubble diameters and liquid properties. Xiao Kang Yan [14] conducted numerous experiments using a high-speed video system and proposed an equation for predicting the drag coefficient. Khodayar [15] investigated the dynamics of rising bubbles on vertical walls under different wettability conditions, discovering that bubbles with contact angles less than 90° move faster than bubbles with contact angles greater than 90°. Du Jingyu [16] found that bubble lift-off diameter is related to wall superheat, latent heat, liquid velocity, fluid properties, bulk-liquid subcooling, etc. Francesca [17] examined the effects of density and viscosity on the behavior of bubble populations in turbulent channels, highlighting the influence of viscosity on fracture and agglomeration. He Hongbin [18] used numerical simulations to investigate the effects of initial bubble diameter, horizontal spacing and arrangement on the kinematic state of three parallel bubbles.
Recently, gas intrusion in conjunction with engineering challenges has become a hot topic in research. However, the majority of studies have focused on gas intrusion during normal drilling, and only a few comprehensive investigations are related to wells. This gap is especially pronounced in studies on deep-water oil and gas fields located long distances (often more than 300 km) offshore. During these offshore operations, which may also involve lengthy periods of equipment maintenance due to severe weather conditions, gas can intrude into the wellbore and subsequently accumulate at the wellhead. Over time, this accumulation poses a significant risk to open-well operations [19]. In the case of pressure-differential gas intrusion under well shut-in conditions, the behavior of gas-liquid two-phase flow within the wellbore differs from that under other conditions in which gas intrusion occurs, possibly because the drilling fluid cannot flow back out from the wellhead. Studies show that the initial characteristics of the invading gas bubbles and their rising velocity within the wellbore are influenced by a variety of factors, including surface tension, rheological properties, density of the drilling fluid under well shut-in conditions, reservoir properties, and the pressure difference between the reservoir and the wellbore bottom. It is worth noting that the rise speed of intrusion gas bubbles within the wellbore is an important parameter for calculating the wellbore pressure and the total gas intrusion volume. A review of the literature indicates that although numerous investigations have been conducted in the field of wellbore drilling and gas intrusion, further research is required in how characteristics such as the influence of surface tension, rheological characteristics, density of drilling fluids, reservoir properties, and pressure difference between the reservoir and the wellbore bottom influence the size of intrusion gas bubbles and flow patterns of individual and cluster bubbles within the wellbore. With the aim of addressing this shortcoming, the present study investigates the gas intrusion mechanism when gas enters the wellbore due to pressure differences during well shutdown. This investigation considers various formation properties, characteristics of the drilling fluid, and pressure-difference conditions between the formation and the wellbore. The study focuses on the initial size of bubbles, the transportation speed of the intruding gas within the wellbore, and changes in gas intrusion rates. The findings of this article are expected to provide theoretical support for the prediction and control of wellbore pressure under shutdown conditions.
This research holds significant practical value in the field of oil and gas exploration. A thorough understanding and mastery of the mechanism of bubble formation can contribute to accurately predicting and effectively controlling gas intrusion within wellbores. This knowledge, in turn, enhances the efficiency of oil and gas exploration and production while concurrently reducing operational risks. The study of the initial size of bubbles further aids in assessing reservoir hydrocarbons. Monitoring and analyzing the initial size of bubbles yields more precise information about the reservoir, offering a scientific and reliable basis for oil and gas resource evaluation and decision-making in exploration. This expansion of knowledge not only contributes to optimizing production strategies in the course of oil and gas exploration, but also provides robust technical support for the rational development of oil and gas resources, thereby promoting the sustainable development of the oil and gas exploration sector.

2. Visualization of Gas Intrusion

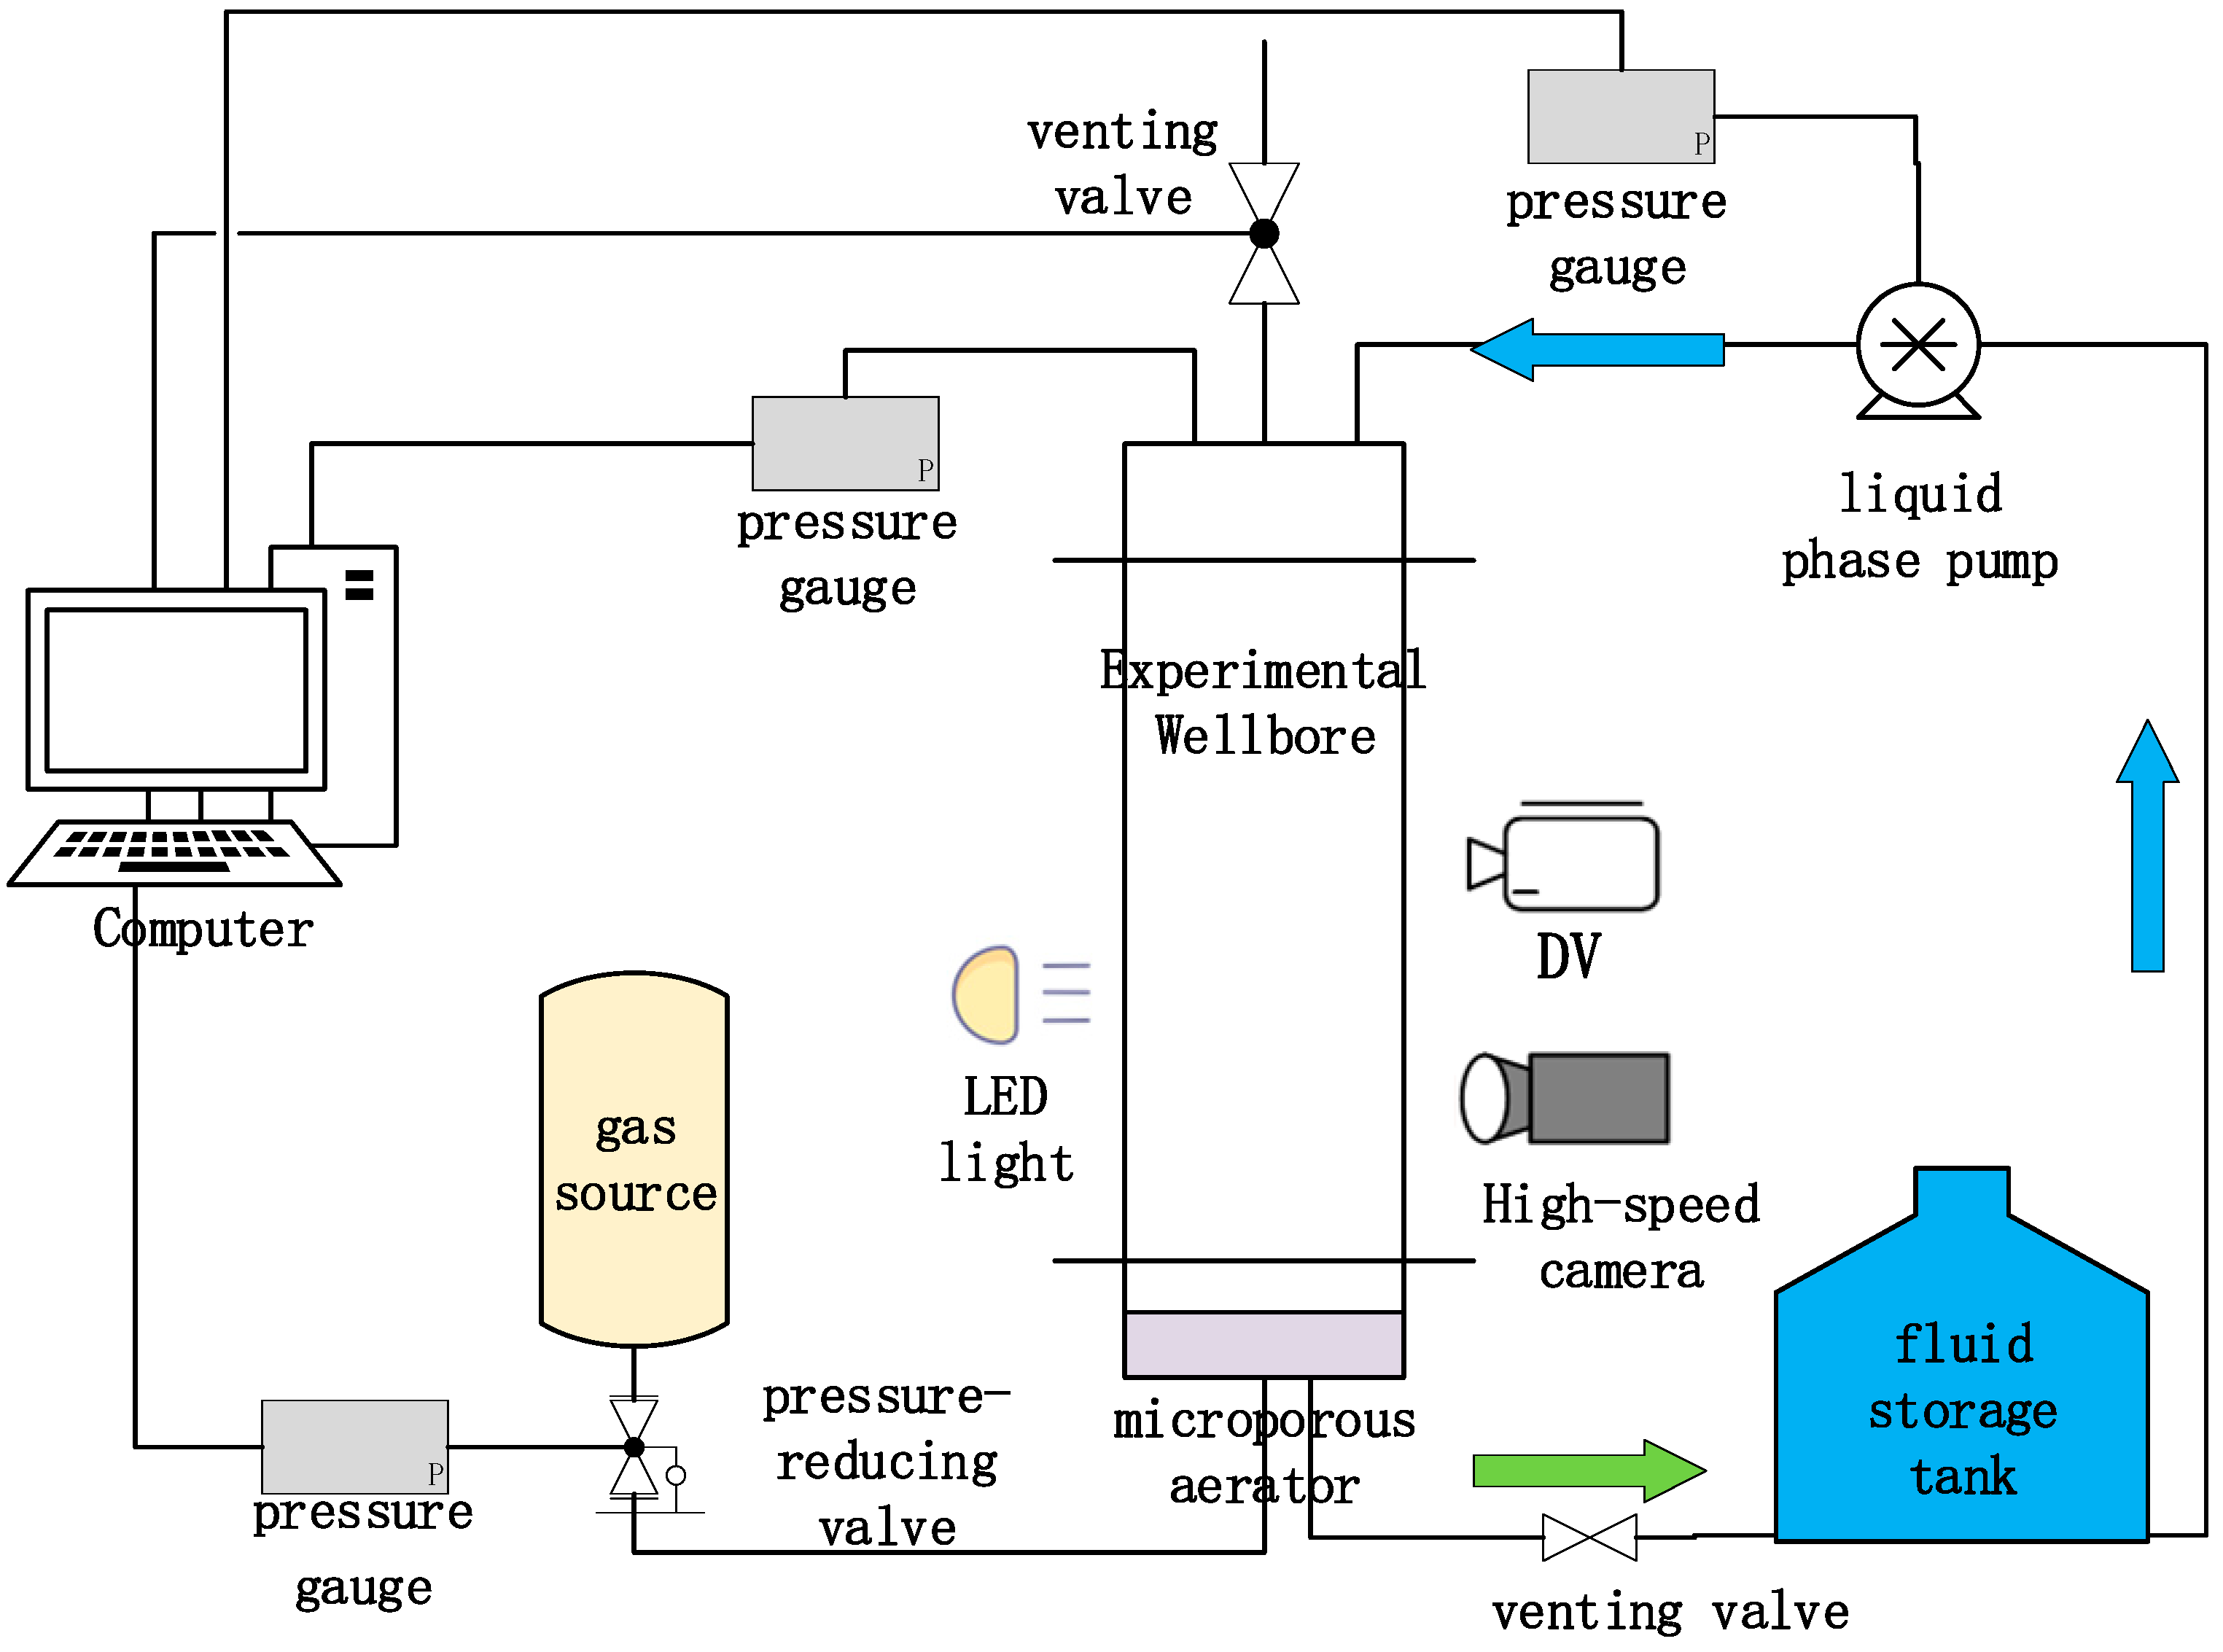
2.1. Experimental System

A schematic of the experimental setup is shown in Figure 1. The experimental setup for simulating gas intrusion under well-shutdown conditions consists of a stratigraphic system, an experimental wellbore system, and a data-acquisition system.
The stratigraphic system consists of a gas source, a pressure-reducing valve, a pressure gauge, a microporous aerator (92 mm diameter, 80 mesh screen) and several valves. During the experiment, gas passes through the microporous aerator and is transported upward in the wellbore in the form of bubble clusters.
The main structure of the experimental wellbore system is constructed from Plexiglas and has an inner diameter of 150 mm, a wall thickness of 10 mm, a height of 1000 mm, and a pressure resistance of 5 MPa. The bottom center of the wellbore is connected to the stratigraphic system, and the side of the wellbore is equipped with a drain hole for discharging the experimental solution. Meanwhile, a scale is provided within the wellbore and on the walls to calibrate the size of air bubbles and the void ratio of the wellbore. The upper part of the wellbore is equipped with a manometer, a liquid-injection hole and an air-vent hole.
The data-acquisition system includes a pressure-acquisition module and an image-acquisition module. The former module consists of a pressure gauge at the gas source and a manometer at the top of the wellbore, which measure the pressure and transmit the collected data to the computer (FPS01W-XD, Changzhou, China). The latter module consists of a high-speed camera (OLYMPUS I-Speed 3, Tokyo, Japan), a DV, and a computer. The high-speed camera has a maximum frame rate of 2000 fps and a pixel accuracy of 13 μm.

2.2. Experimental Materials

Xanthan gum (XC) is a commonly used viscosity enhancer for drilling fluids. In the present study, deionized water and aqueous solutions with various concentrations of xanthan gum were utilized to simulate drilling fluids in the experiments. The experimental process considered the influence of liquid-phase rheology on the gas intrusion speed and the size of the intruding bubbles, while the effects of gas dissolution on the intrusion were ignored. Nitrogen was used as the experimental gas phase. The rheological test results of the experimental solutions with various concentrations of xanthan gum are shown in Figure 2.
The solution rheology was fitted using a power law function with the specific parameters shown in Table 1.

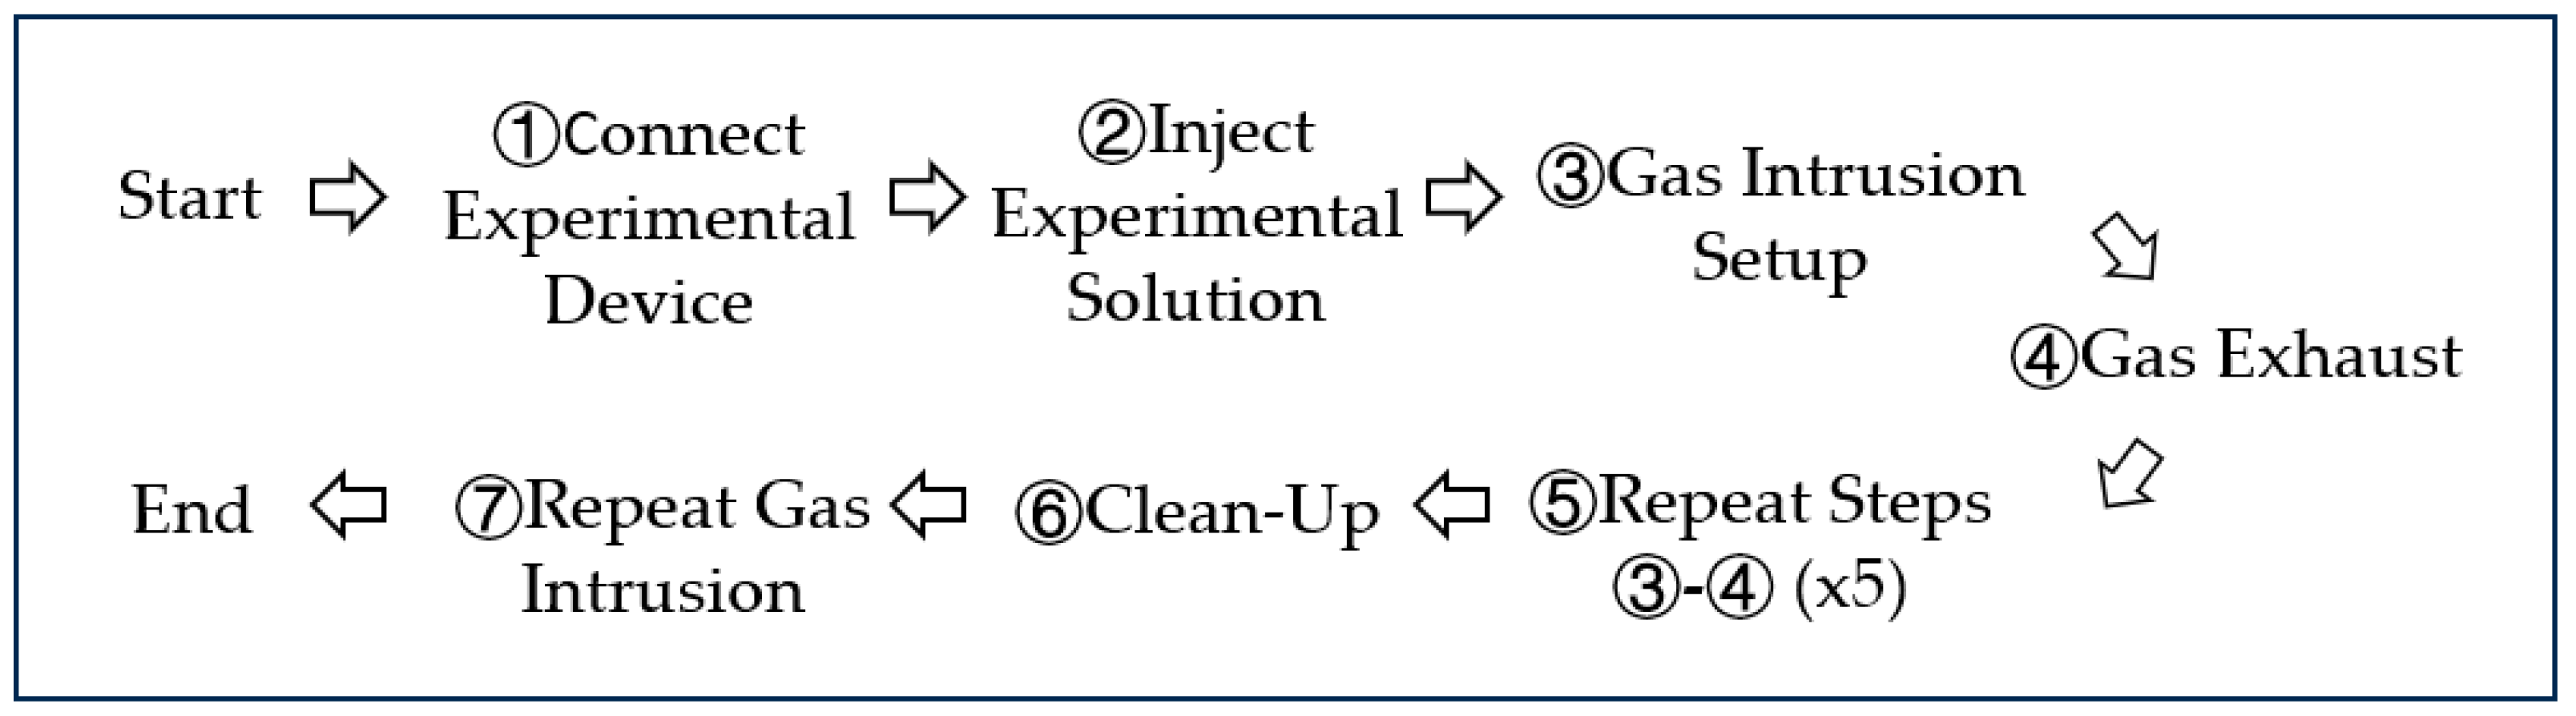
2.3. Experimental Procedure

The experiments were divided into the simulation of gas intrusion into the wellbore under shut-in conditions and the simulation of intruded-gas transportation velocity in the wellbore under shut-in conditions. Prior to the experiment, instruments were calibrated, the connection joints between instruments and pipelines were sealed, and the gas tightness test was conducted across the experimental loop. To minimize experimental errors, each test was repeated five times and the average values were recorded. The main experimental procedures are as follows:
(1)
Simulation of gas intrusion into the wellbore under shut-in conditions
This part of the test consists of six parts as follows (The schematic diagram of the experimental process is shown in Figure 3):
① Connect the experimental device and check its gas tightness;
② Inject the experimental solution into the liquid surface at a height of 70 cm, with the upper part of the air at atmospheric pressure;
③ Close the top exhaust valve of the wellbore, adjust the decompression valve in the system to the set pressure, open the ball valve to inject the formation gas into the wellbore, record variations in the gas pressure within the wellbore using a manometer and record the gas intrusion into the wellbore using a high-speed camera. Additionally, record the size and rising speed of bubbles, as well as the gas level in the gas intrusion using DV;
④ When the pressure in the upper part of the wellbore has stabilized, close the ball valves between the injection system and the wellbore and open the venting valve at the top of the wellbore to exhaust the accumulated gas;
⑤ Repeat steps ③ and ④ 5 times and record the data;
⑥ Adjust the pressure of the formation-simulation system, and repeat steps ③–⑤ to study gas intrusion under different pressure conditions. After the experiment is complete, open the drain valve at the bottom of the wellbore, drain the experimental solution, and inject deionized water to inflate and clean the wellbore 3–5 times. Replace the experimental solution and repeat steps ③–⑥ to simulate gas intrusion under various pressure differentials.
(2)
Obtaining intrusive-gas transportation velocity within the wellbore under shut-in conditions
Bubble-cluster transport velocity experiments were conducted using various solutions under shut-in conditions, following the same experimental procedure described for experiment (1). Subsequently, the microporous aerator was replaced with a 0.5 mm-diameter nozzle, and experiments were conducted to measure the transport velocity of individual bubbles in solutions with various properties. The measurement of bubble speed involves the following steps:
① Time measurement: Set the shooting rate of the high-speed camera to 1000 fps;
② Coordinate conversion: There is a scale within the wellbore with marks at 1 mm intervals along the horizontal direction. In the vertical direction, the heights of the scale lines vary as follows: the ordinary scale line is 3 mm high, the secondary scale line, which occurs every 5 mm, is 4 mm high, and the main scale line, which occurs every 10 mm, is 5 mm high. Use this scale to convert pixel coordinates to mm-scale coordinates, thereby eliminating the “convex lens” effect on the bubble geometry within the circular wellbore;
③ Measurement of geometric features of bubbles: Utilize the Edit-Draw function in Image-Pro Plus (V8.0) software to trace the outline of the selected bubble. Then, use the “count size” function to determine parameters at the center of the bubble, including horizontal and vertical coordinates (X, Y), maximum radius (Rmax), and minimum radius (Rmin). Additionally, use the Measure function to directly measure the geometric features of the bubble;
④ Measurement of bubble rising speed: While observing the movement of bubbles in the camera, select a bubble in the ith frame, measure its geometric features (X1, Y1, R1max, and R1min), record its geometric features in the i + nth frame (X2, Y2, R2max, and R2min), and calculate the average rising speed of bubbles over the test period using the following expression:
u z = Y 2 Y 1 Δ t = Y 2 Y 1 0.001 n

3. Results and Analysis

3.1. Simulation of Gas Intrusion into the Wellbore under Shutdown Conditions

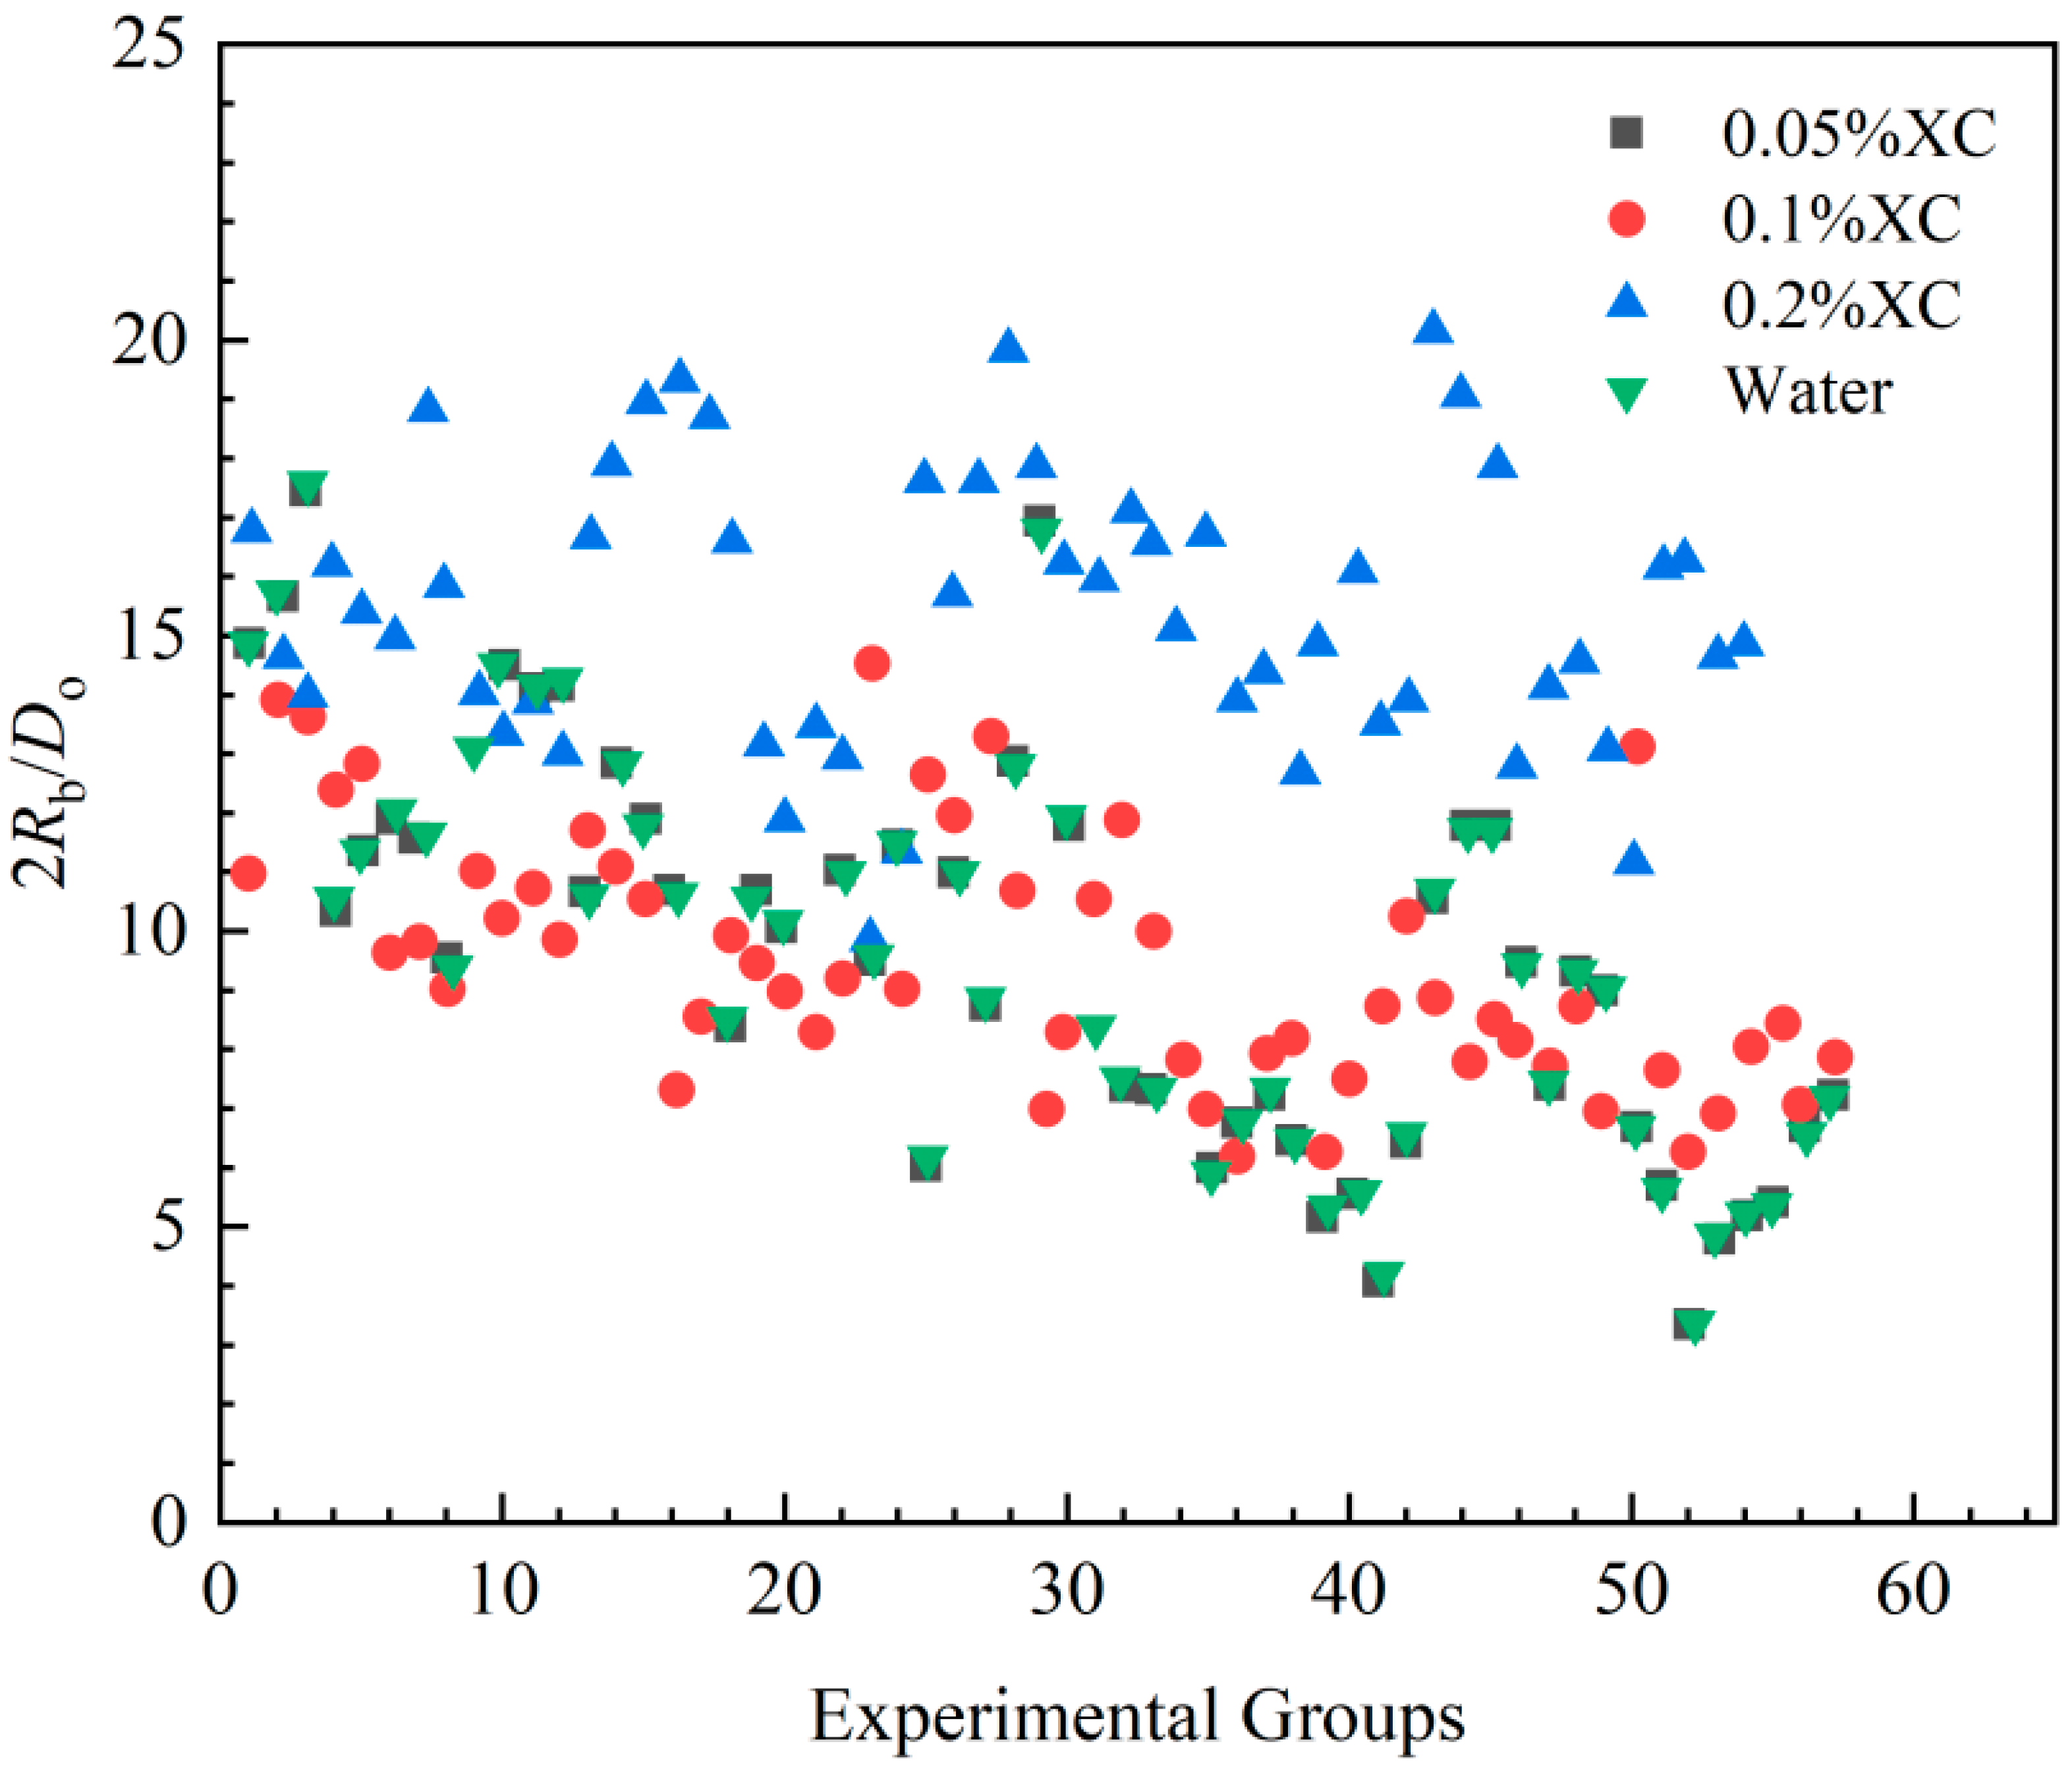
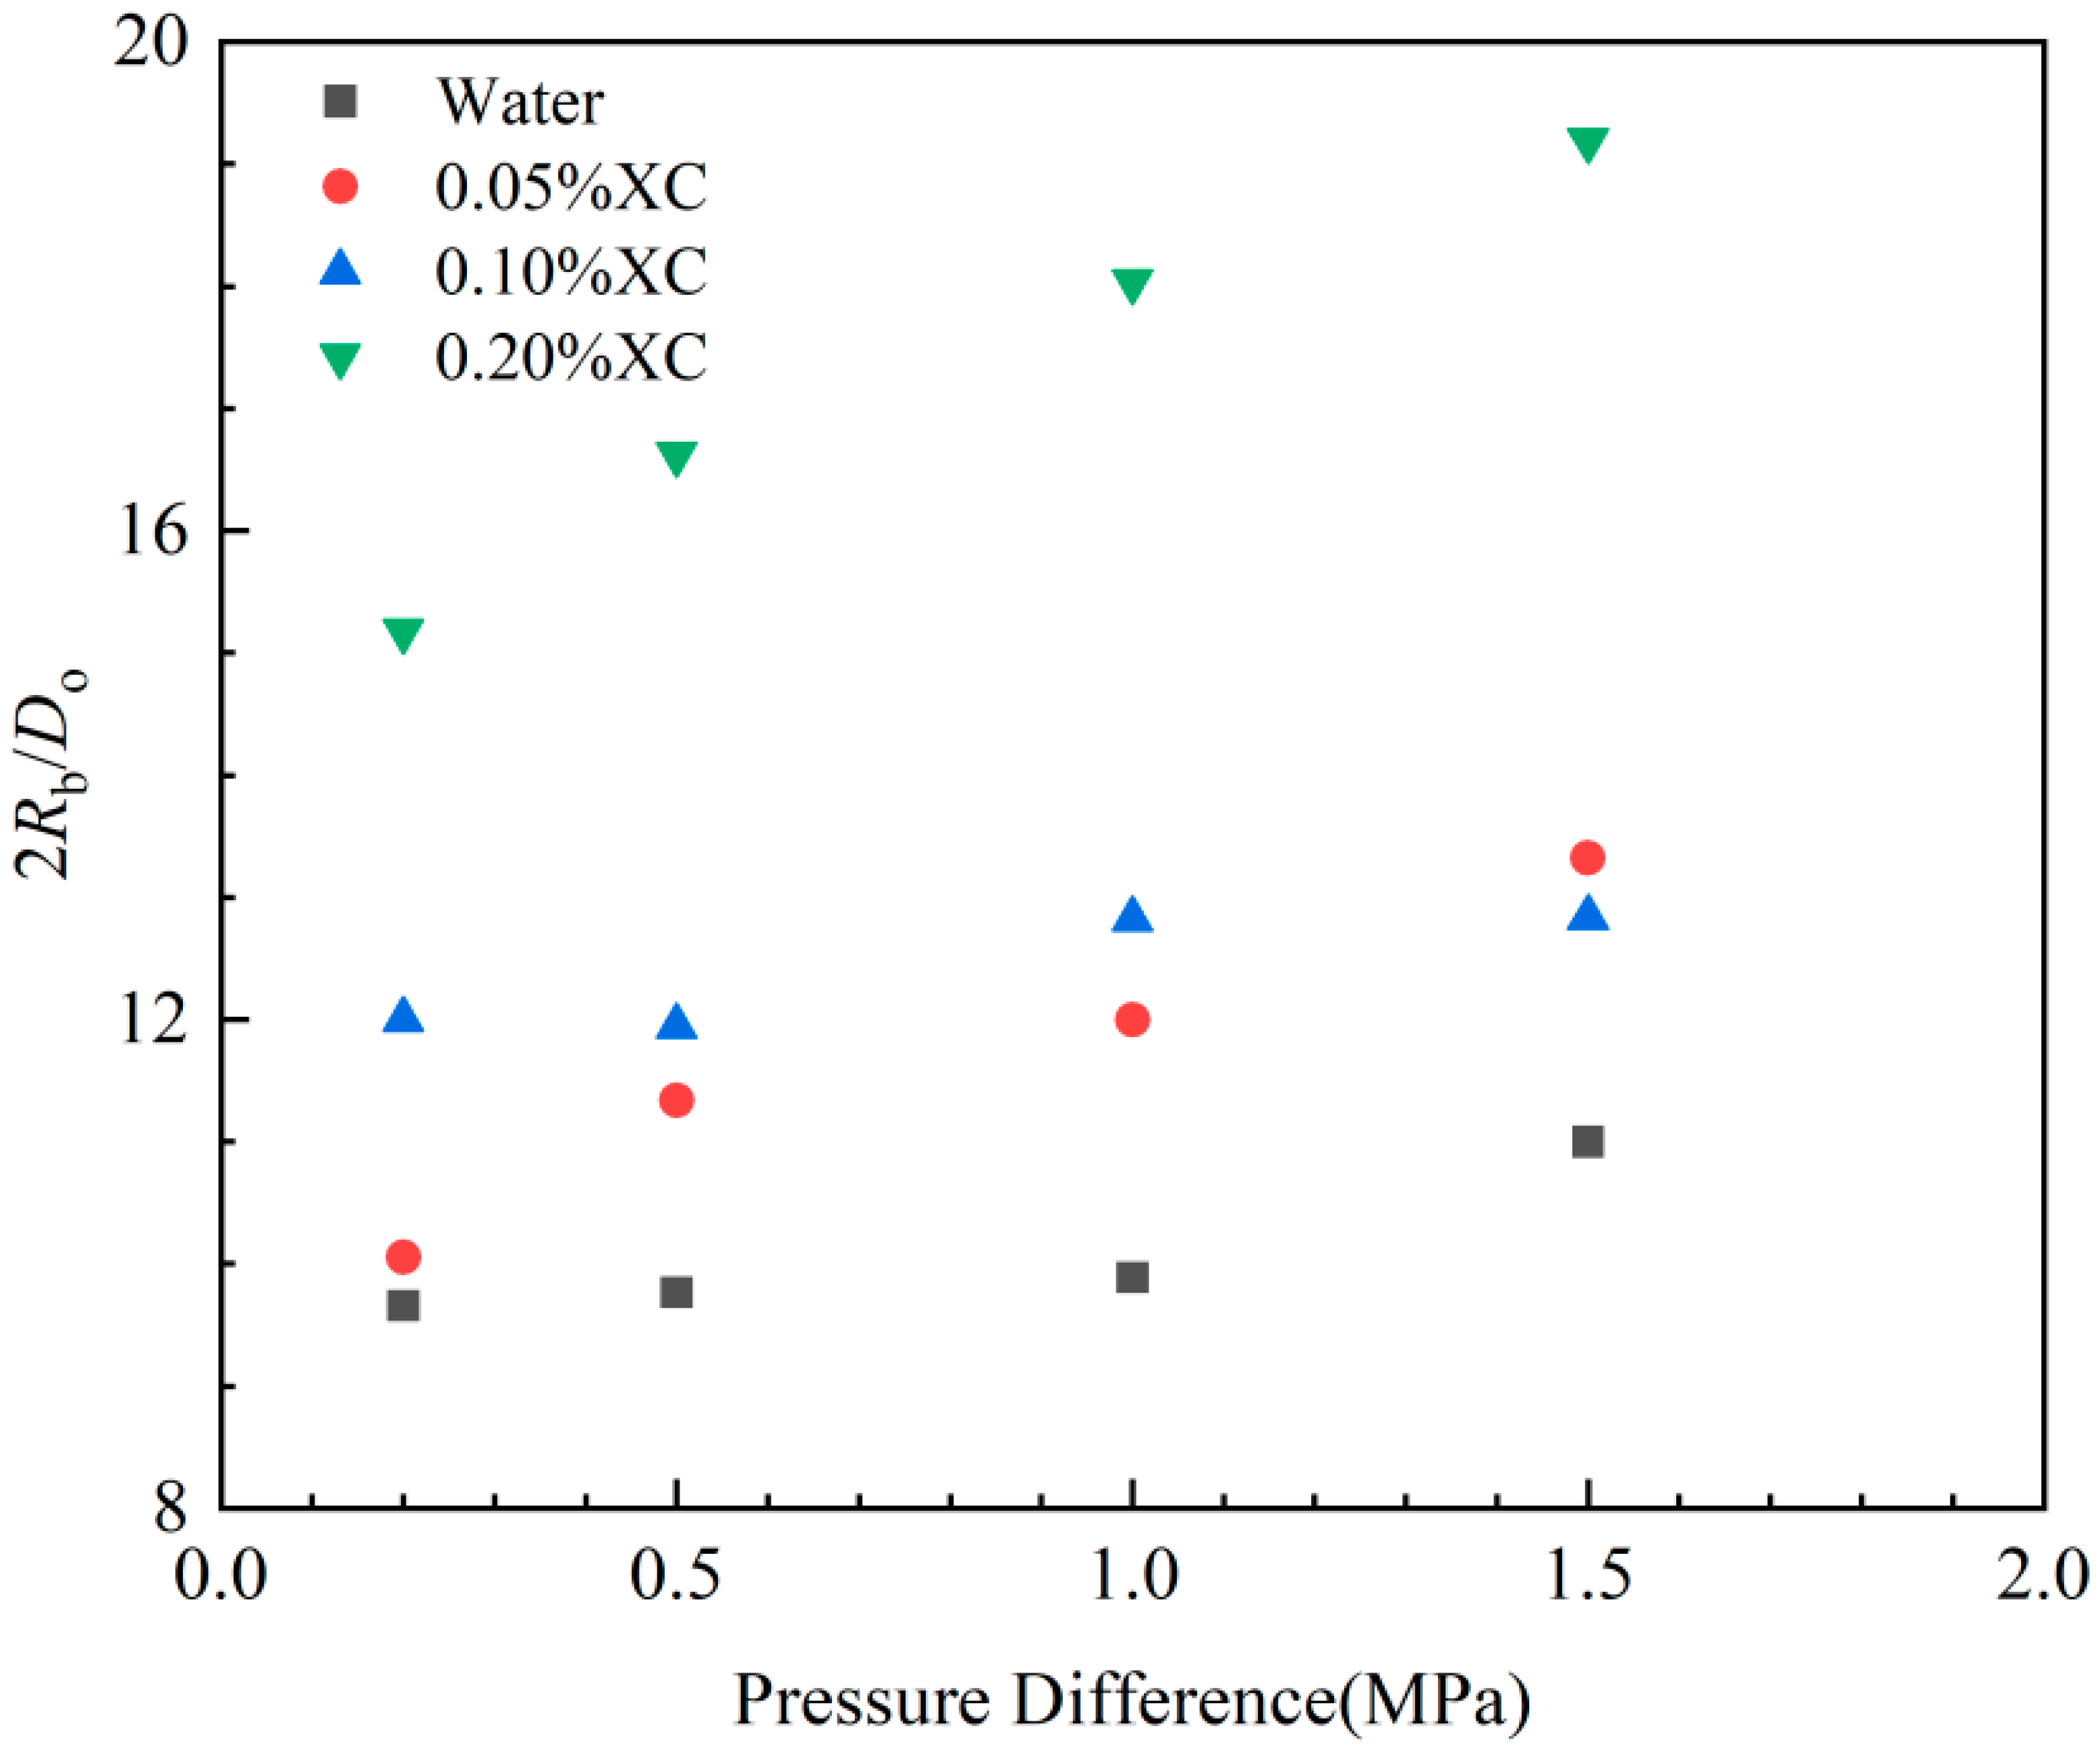
3.1.1. Variations in the Size of the Intrusion Bubbles

The pore diameter of the microporous aerator is 0.178 mm, corresponding to the dimensionless bubble size (2Rb/Do). The experimental results are shown in Figure 4. When the viscosity of the drilling fluid is low, the initial size of intruding bubbles is affected mainly by the surface tension at the orifice when the bubbles are dislodged. Moreover, Figure 4 indicates that there is a positive correlation between the size of intruding bubbles and the viscosity of the liquid phase. The average sizes of bubbles in the 0.05% XC solution and in the aqueous solution are nearly identical. However, the size of bubbles in the 0.05% XC solution is significantly smaller than those observed in the 0.1% and 0.2%XC solutions. In summary, the bubble size in the 0.05% XC solution is significantly smaller than those in the 0.1% and 0.2% XC solutions.
Figure 5 indicates that the average dimensionless diameter of gas bubbles is affected by the pressure difference. More specifically, the greater the pressure difference between the formation and the wellbore, the larger the average size of intruding gas bubbles. This phenomenon may be attributable to the substantial pressure difference between the formation and the wellbore caused by the gas intrusion into the wellbore. Consequent to this pressure difference, the gas seepage rate increases, intruding gas bubbles expand, and the average size of bubbles increases when they detach from the borehole.

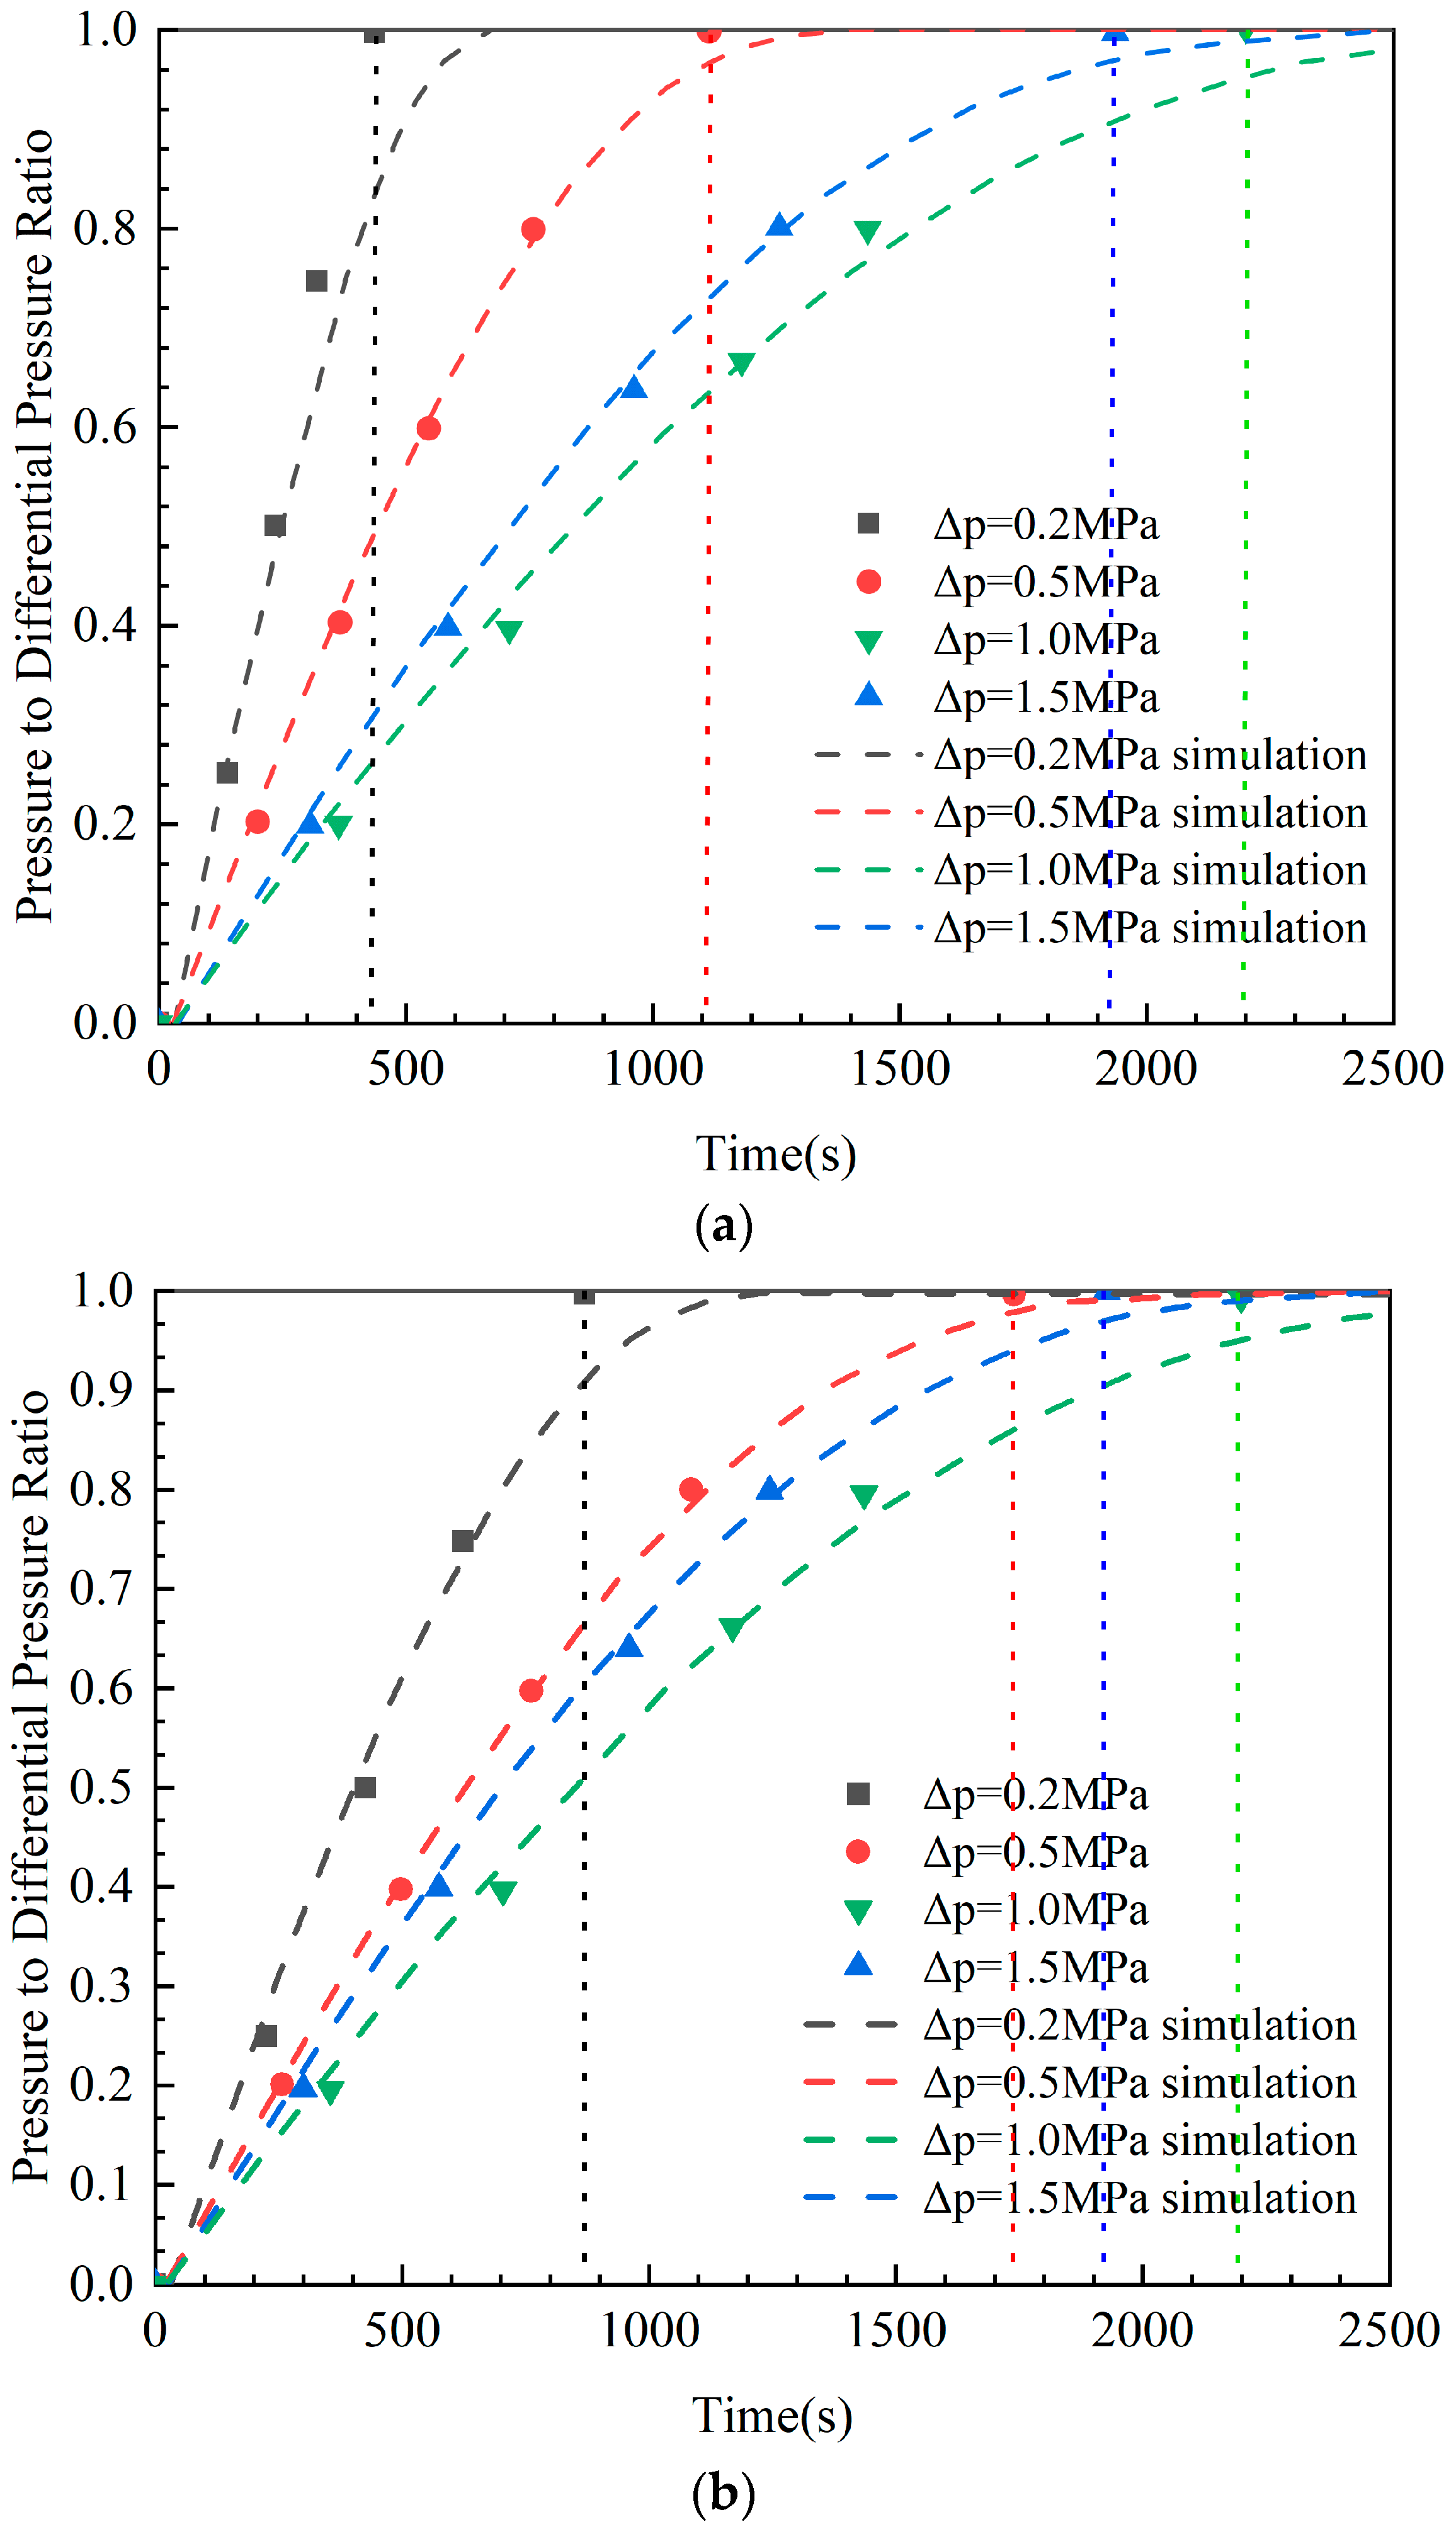
3.1.2. Modeling Gas Intrusion Rate under Shut-in Well Conditions

When a well is shut down after an overflow and the formation pressure exceeds the bottomhole pressure, the formation fluid intrudes into the wellbore due to the pressure difference. The flow behavior can be described using Darcy’s law. As the gas intrusion into the wellbore is an unsteady planar radial seepage process, the unsteady gas intrusion binomial flow equation is employed to describe the seepage process [20]:
p e 2 p w 2 = μ g Z π k h p a T Z a T a ln r e r w Q g + α ρ a 2 π 2 h 2 p a Z T Z a T a 1 r w 1 r e Q g 2
where pe is formation pressure, Pa; pw is the bottomhole pressure, Pa; μg is the average gas viscosity, Pa·s; Z is the gas compression factor at the temperature and pressure of the formation; k is the formation permeability, m2; h is the thickness of the open gas layer, m; pa is the pressure of the standard atmosphere, Pa; T is the formation temperature, K; Za is the gas compression factor under the standard conditions; Ta is the temperature under the standard conditions, K; re is the effective gas intrusion radius, m; rw is the bottomhole radius, m; Qg is the gas intrusion flow rate under standard conditions, m3/s; α is the coefficient of inertial drag caused by turbulence; and ρa is the gas density under standard conditions, g/m3.
With continuous gas intrusion into the wellbore, the wellbore pressure gradually increases and the pressure difference between the formation and the wellbore gradually decreases. As a result, the gas intrusion rate gradually decreases. The total volume of the intruded gas under standard conditions can be obtained using the following expression:
Δ V g = 0 t 1 Q g ( t ) d t
Based on Equation (2), the gas intrusion rate is related to the bottomhole pressure [20]:
A = μ g Z π K h p a T Z a T a ln r e r w
B = α ρ a 2 π 2 h 2 p a Z T Z a T a 1 r w 1 r e
Q g = A 2 + 4 B p e 2 p w 2 ( t ) A 2 B
The total gas intrusion volume under standard conditions can be obtained through the following expression:
Δ V g , b = 0 t 1 A 2 + 4 B p e 2 p w 2 ( t ) A 2 B d t
where t1 is the total intrusion time from the onset of gas intrusion to its cessation, s.
Equation (7) indicates that the total gas intrusion is related to the wellbore pressure, which is affected by numerous factors such as gas rising speed. Therefore, calculating the total gas intrusion requires the establishment of a model for calculating the gas transport velocity. Ignoring the effects of gas expansion on the wellbore pressure, the wellbore pressure is related only to the amount of gas intrusion into the wellbore. In the experiments, the volume of the upper part of the wellbore was denoted as V0, and the temperature was maintained at 290 K. Ignoring the temperature change caused by variations in the pressure, instantaneous wellbore pressure can be calculated using the following expression:
p w ( t ) = P a Z T s V 0 Z a T a Z a T a Z s T s V 0 + Δ V g , b
where Ts is the experimental temperature, K; Zs is the gas compression factor at 0.1 MPa and experimental temperature.
p w ( t ) = P a Z T s Z a T a Z a T a Z s T s V 0 + 0 t 1 A 2 + 4 B p e 2 p w 2 ( t ) A 2 B d t
Equations (3)–(8) can be rewritten in the form below:
p w ( t ) = Z Z s P a + P a T s V 0 Z a T a i = 1 N Z A 2 + 4 B p e 2 p w 2 i N t 1 A 2 B i N t 1
Figure 6 illustrates the distribution of wellbore pressure over time, calculated using Equation (10). The highest wellbore pressures were obtained for water, 0.05% XC solution, 0.1% XC solution and 0.2% XC solution.
Figure 6 indicates that the model predictions align with the experimental results. The results show that as the negative pressure difference between the formation and the wellbore increases, the time from the initiation of gas intrusion to its cessation increases. Meanwhile, as the solution viscosity increases, the time required to reach equilibrium between wellbore pressure and formation pressure after gas intrusion decreases. The changes in the initial size of gas bubbles arising from invading gases in the wellbore are due to variations in solution viscosity: the greater the solution viscosity, the larger the initial size of gas bubbles from invading gases in the wellbore. As a result, less time is needed for invading gases to reach the upper section of the wellbore, thereby rapidly increasing the wellbore pressure.

3.2. Simulation of Intrusive-Gas Transportation Velocity in Wellbore under Shut-in Conditions

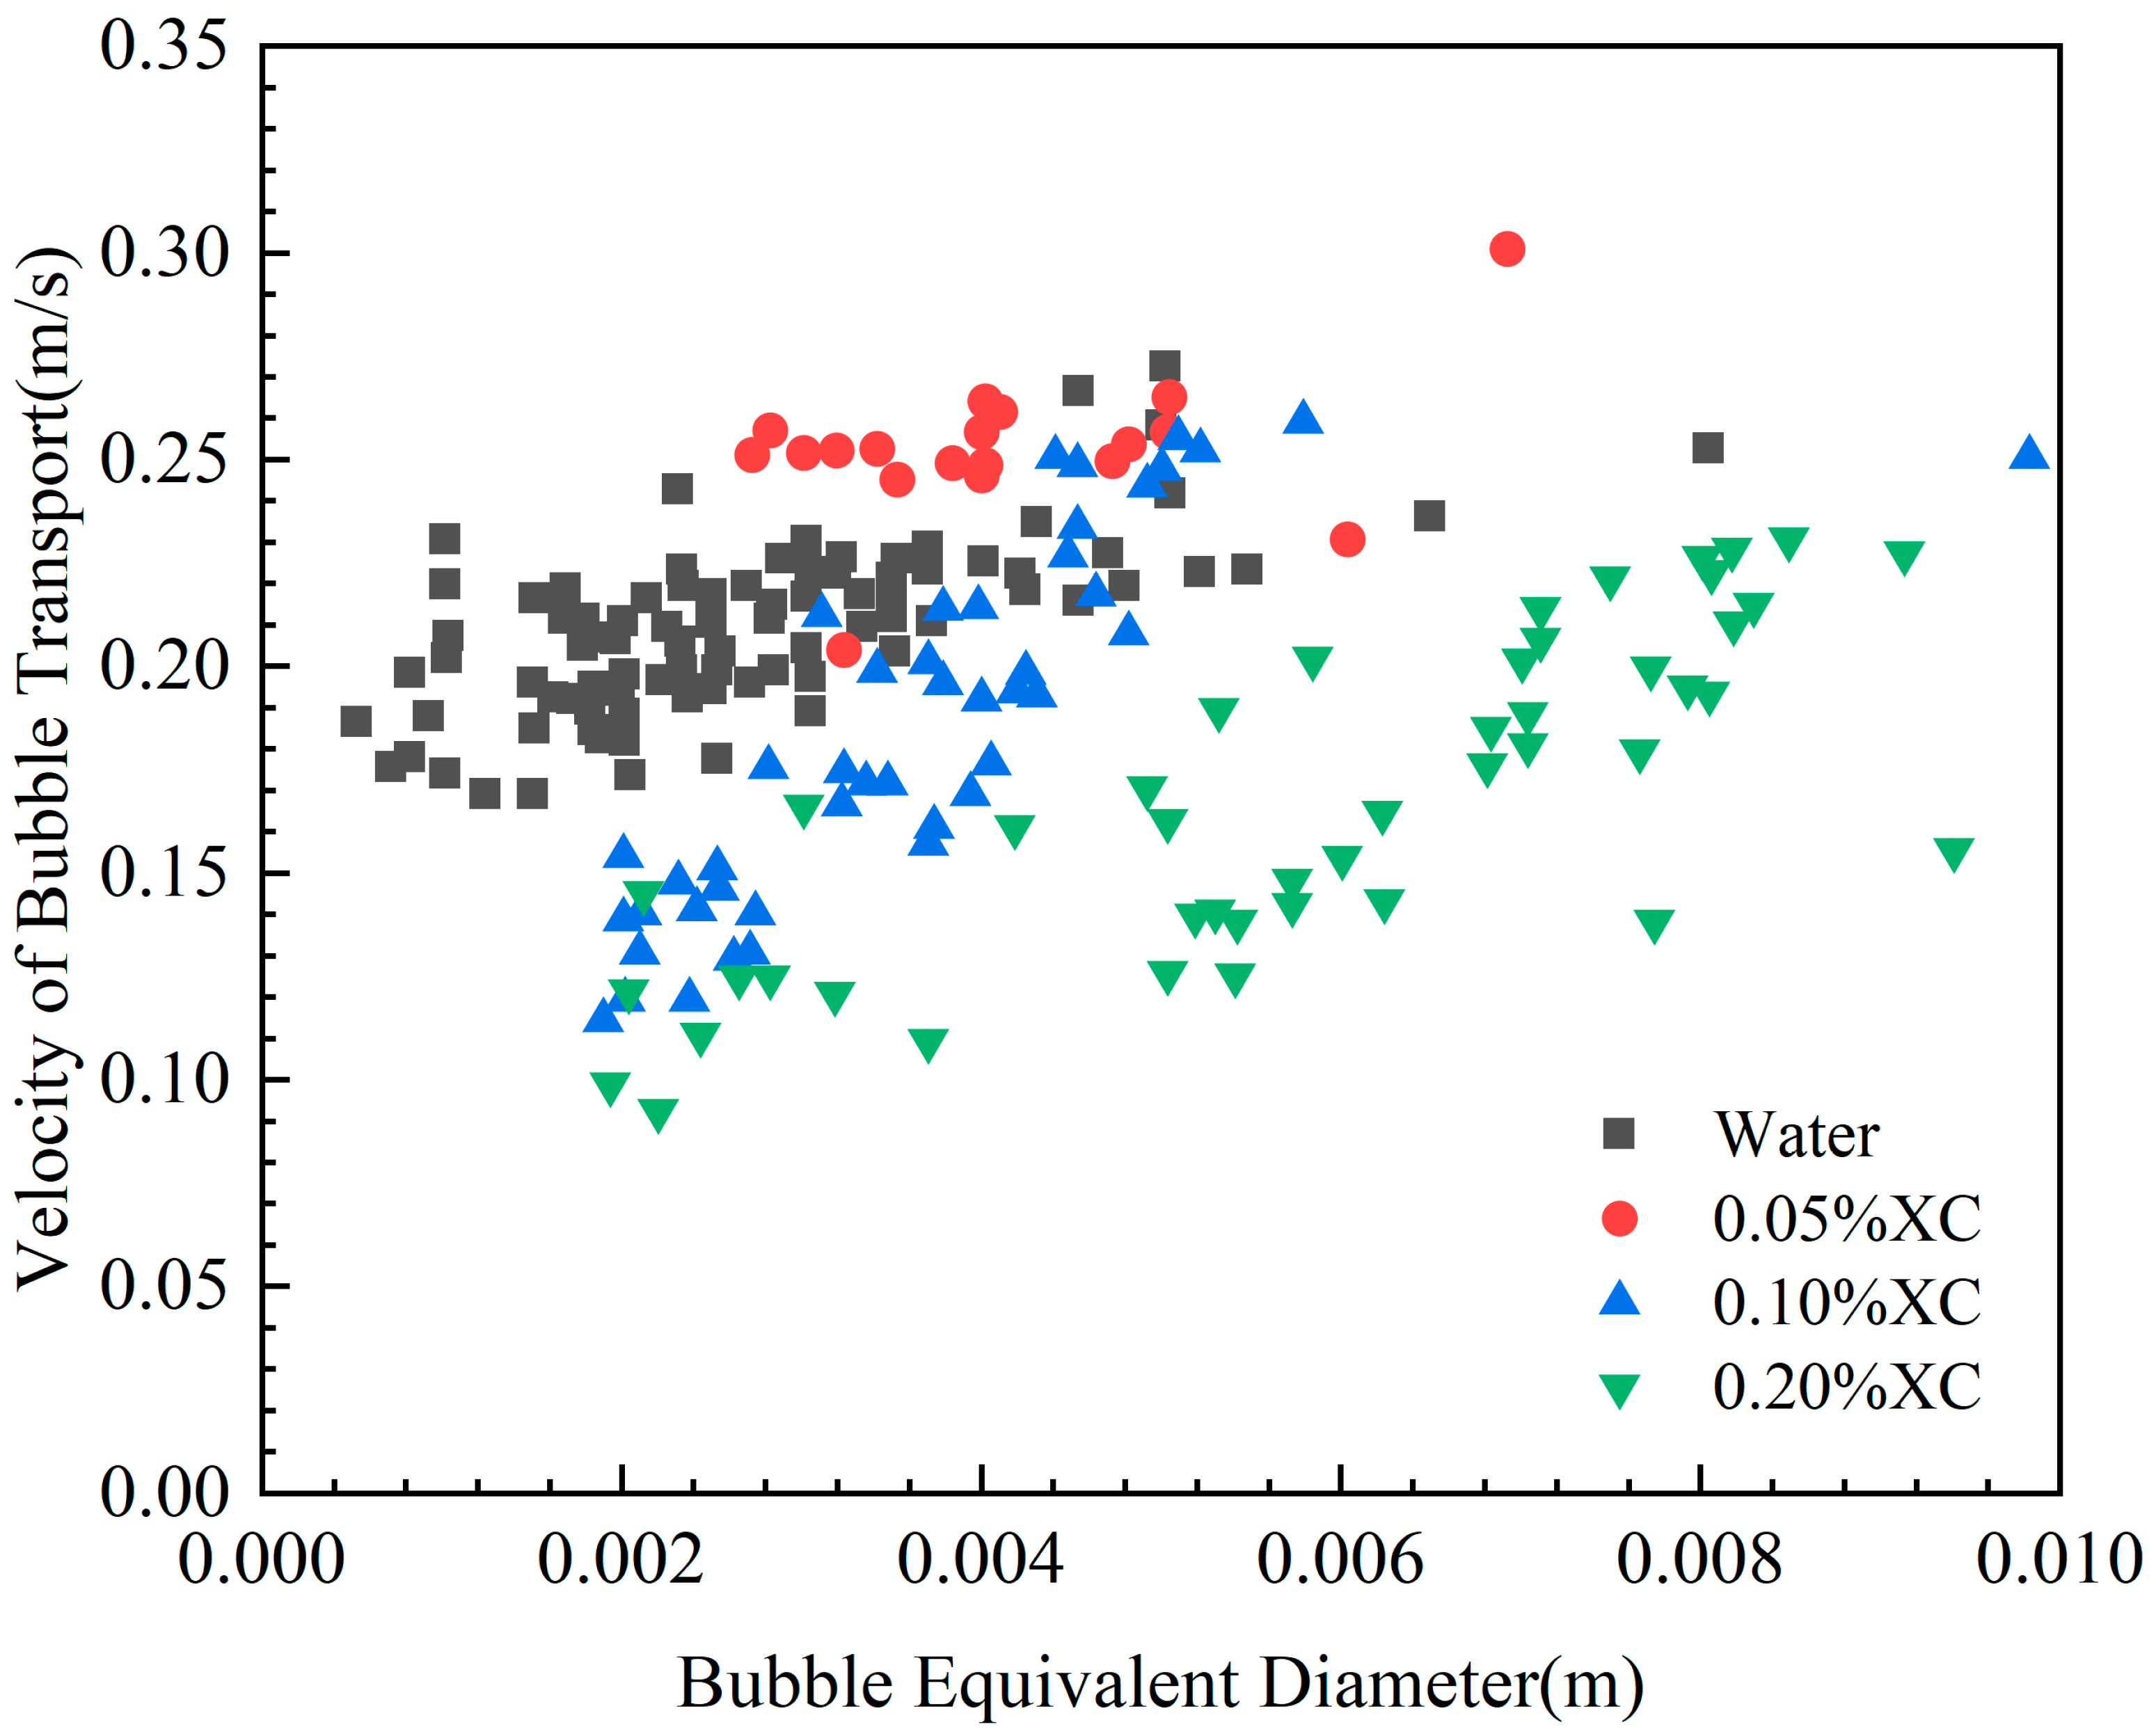
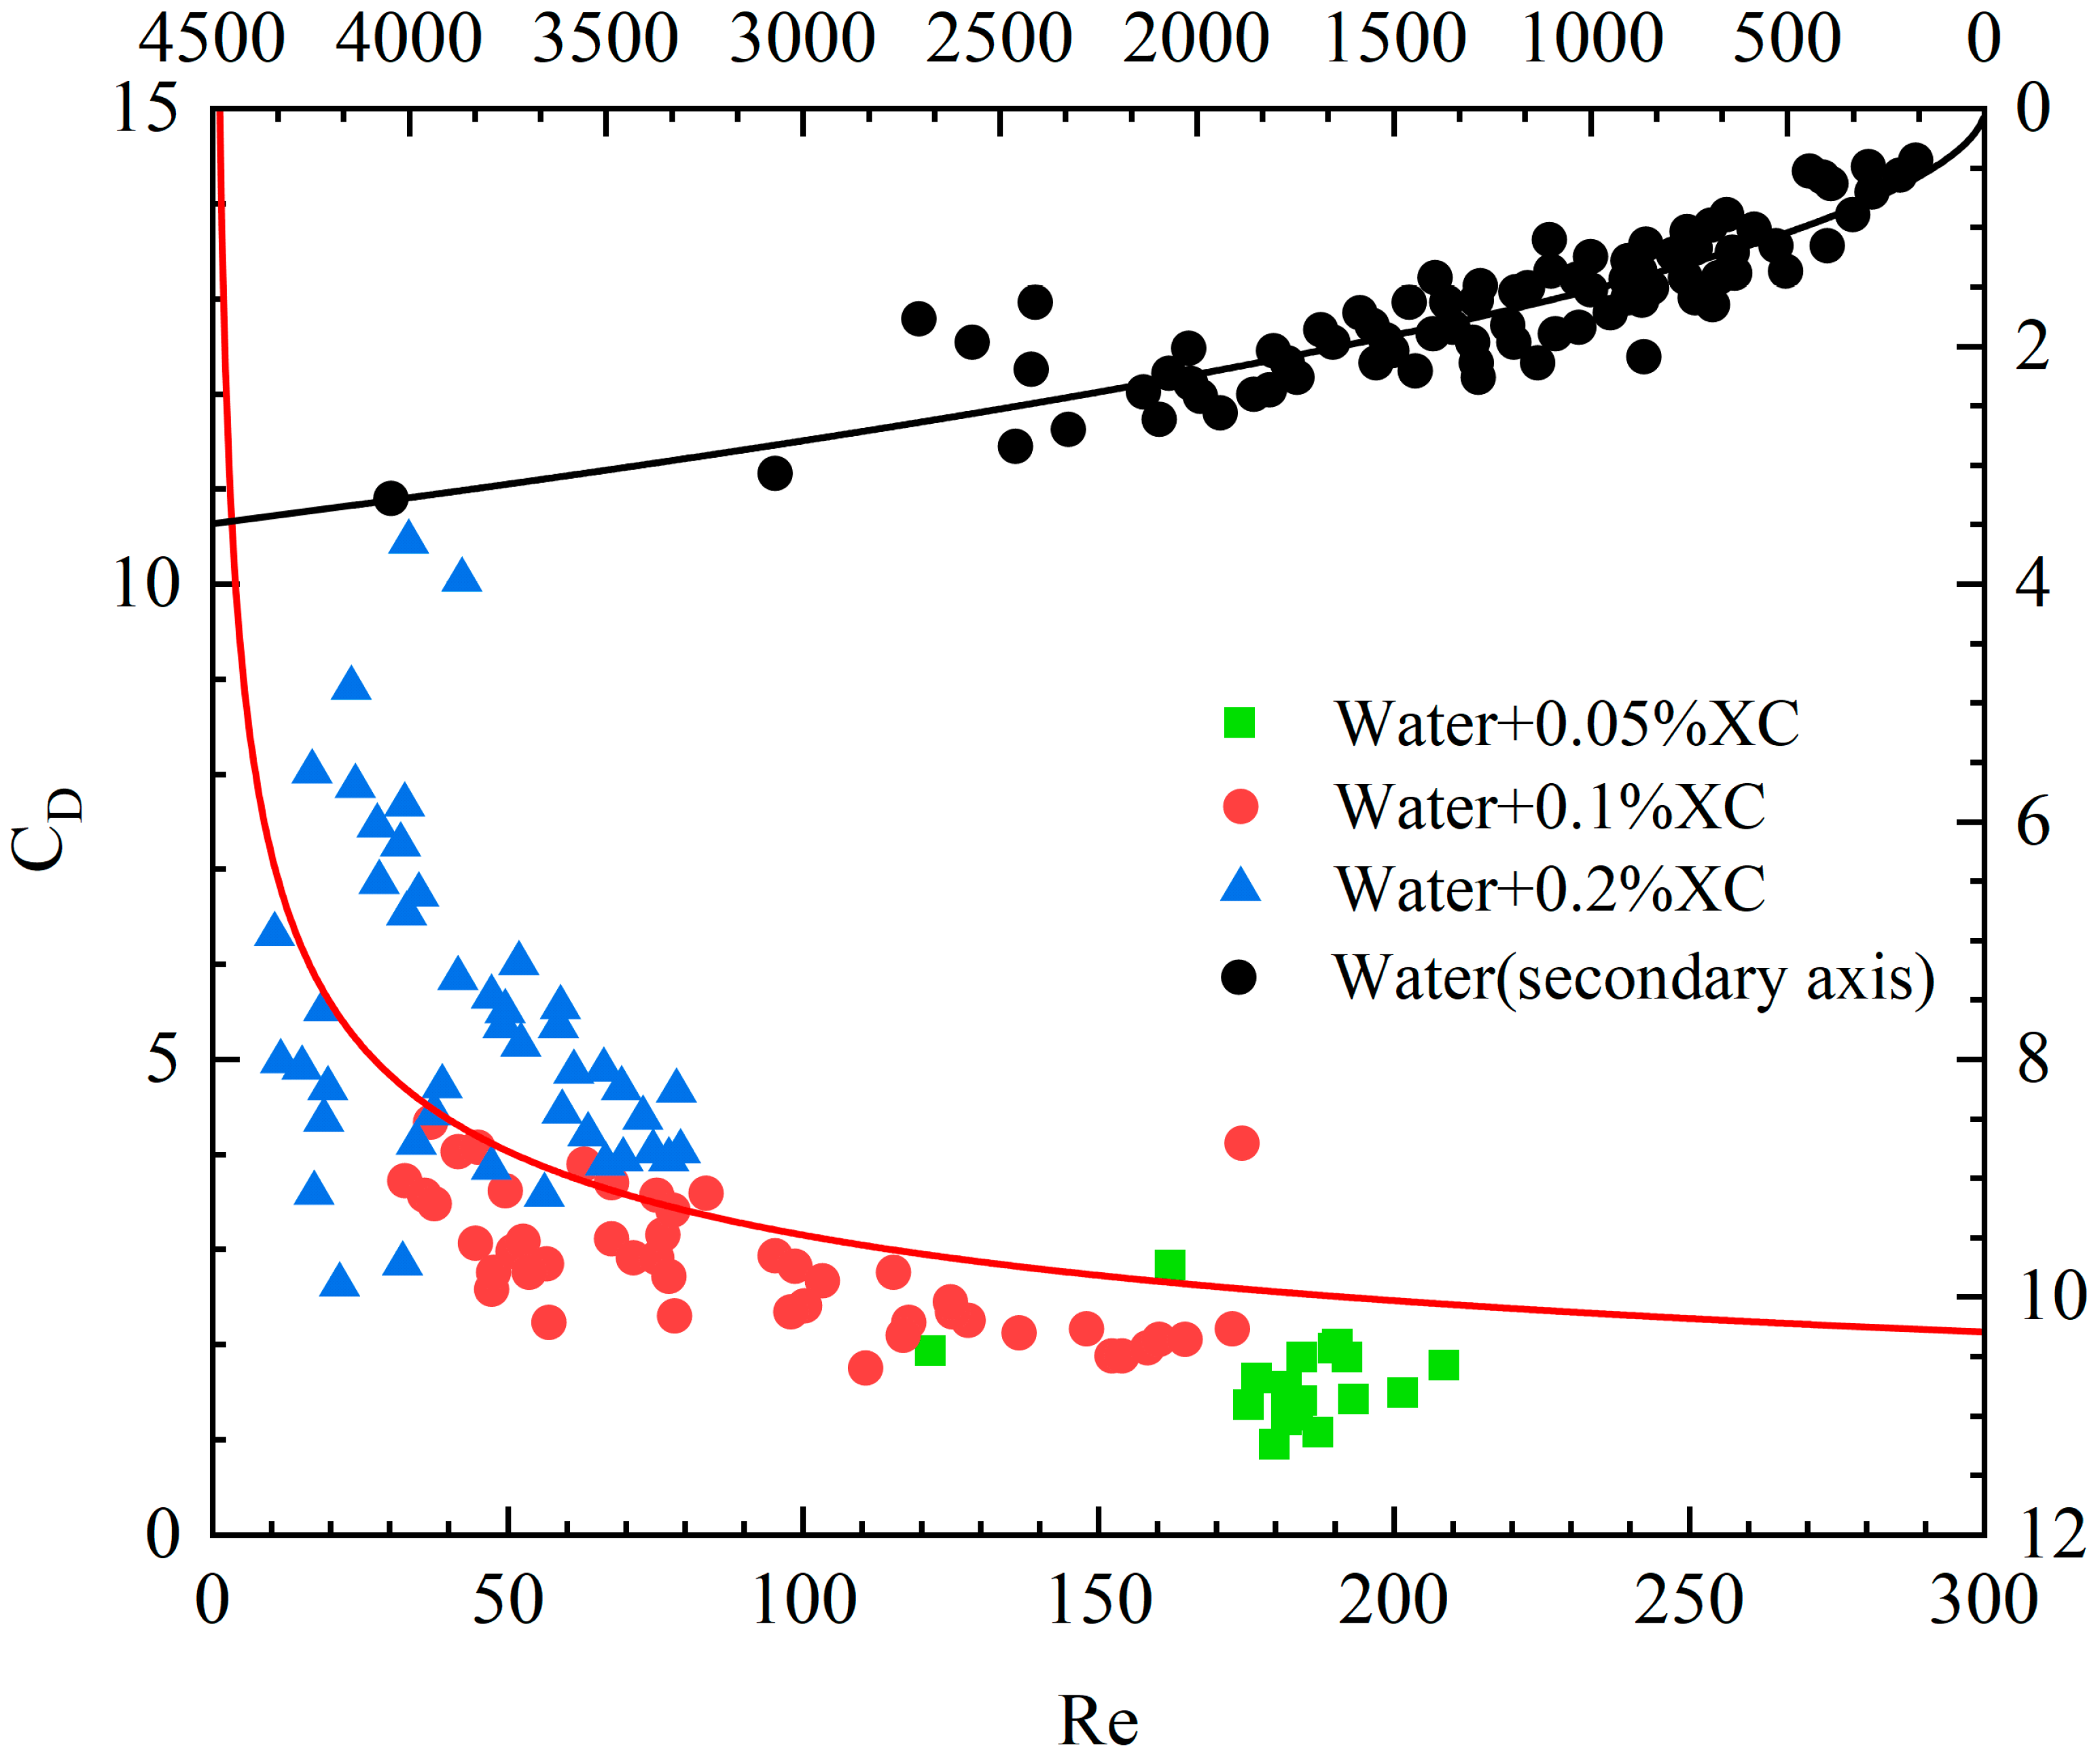
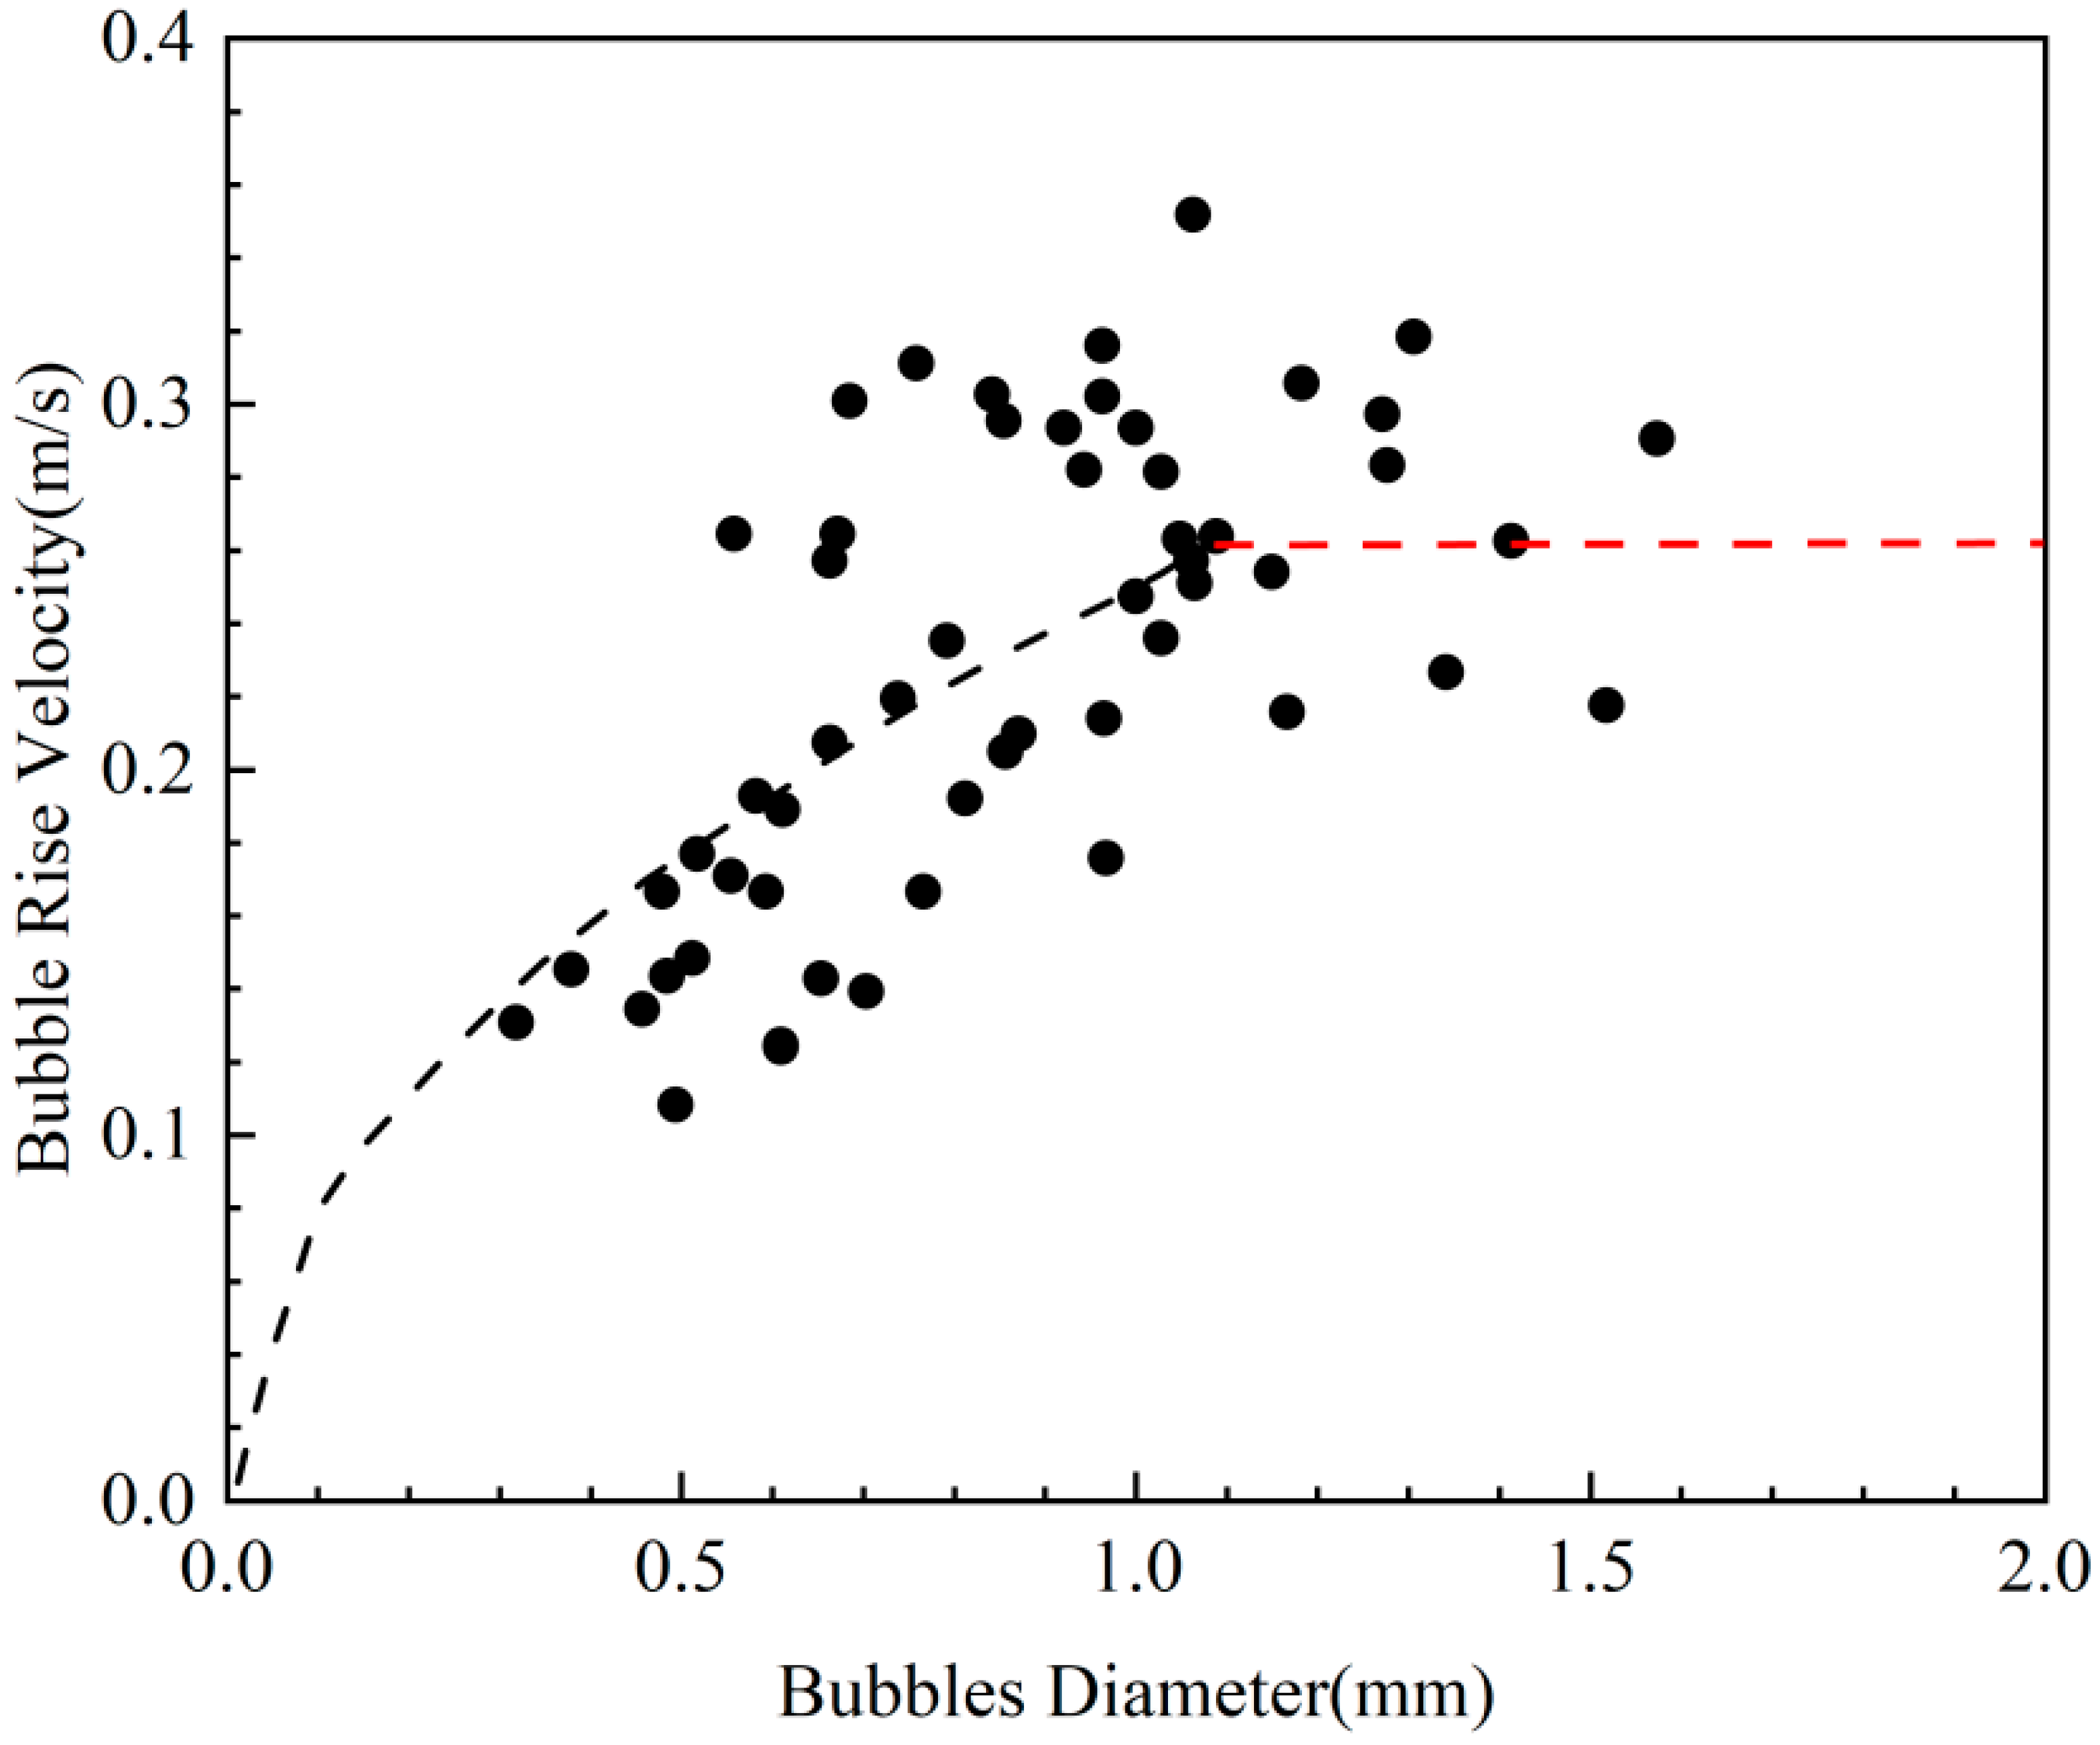
3.2.1. Single-Bubble Transport Experiment

This section describes an investigation of the transportation velocity of individual bubbles in experimental solutions. Variations in the transportation velocity of individual bubbles with the geometry of bubbles in different solutions are shown in Figure 7. When the viscosity of the solution is low, bubbles injected through the orifice are prone to rupture during their ascent, resulting in a smaller average equivalent diameter of bubbles in low-viscosity solutions. In 0.05% XC solution, the bubble speed changes slightly compared to that in water, and the change in bubble speed with increasing bubble equivalent radius is small. However, as solution viscosity increases, the range of bubble equivalent diameters expands. Concurrently, the size variations in the bubble speed with respect to changes in bubble equivalent radius change also increases.
When the equivalent radius of a bubble is small, it experiences resistance from the viscous solution, causing slower ascent. Consequently, the higher the solution viscosity, the slower the bubble rise. On the other hand, as the bubble equivalent radius increases, the bubble rise rate also increases. In this case, bubble transport speed is affected by both viscous forces and buoyancy. Furthermore, when the solution viscosity increases, the equivalent radius of individual bubbles generated at the orifice increases. Consequently, the rise rate of bubbles increases and the buoyant force that pushes bubbles upward becomes more dominant than the viscous force. As a result, the transport speed of bubbles may exceed the transport speed of gas in low-viscosity fluids. The buoyancy force pushes the bubble upward more than the viscous force resists bubble rise, resulting in a bubble upward velocity that may exceed the gas transport velocity in lower-viscosity fluids. In order to elucidate single-bubble transport velocity, the experimental results were analyzed as shown in Figure 8.
As the Reynolds number for bubble transport in water is much larger than that in the XC solution [17], the experimental data in water are represented using the sub-coordinate axes (the left numerical axis is the vertical axis, and the upper numerical axis is the horizontal axis). The red solid line in the figure is the fitted model of the drag force coefficient method with the Reynolds number in the xanthan-gum solution, while the black solid line is the fitted model of the drag force coefficient method with the Reynolds number in the water, in which the intrinsic model for the XC solution follows a power law model, and its parameters are provided in Table 1, with the Reynolds number defined as
Re = 2 ρ u z R b K γ ˙ n 1 = ρ u z R b K u z R b n 1 = ρ u z R b 2 n K u z n 1
The drag force coefficient CD is defined as [21]
C D = 8 g ρ l ρ g R b 3 ρ l u z 2
An empirical relationship between the drag coefficient and Reynolds number for bubbles in water and XC solution is derived by fitting the experimental data:
C D , X C = 22.136 ± 3.88 Re 0.432 ± 0.046
The empirical relationship for the drag coefficient in water is as follows:
C D , w = ( 0.0292 ± 0.004 ) Re 0.568 ± 0.029

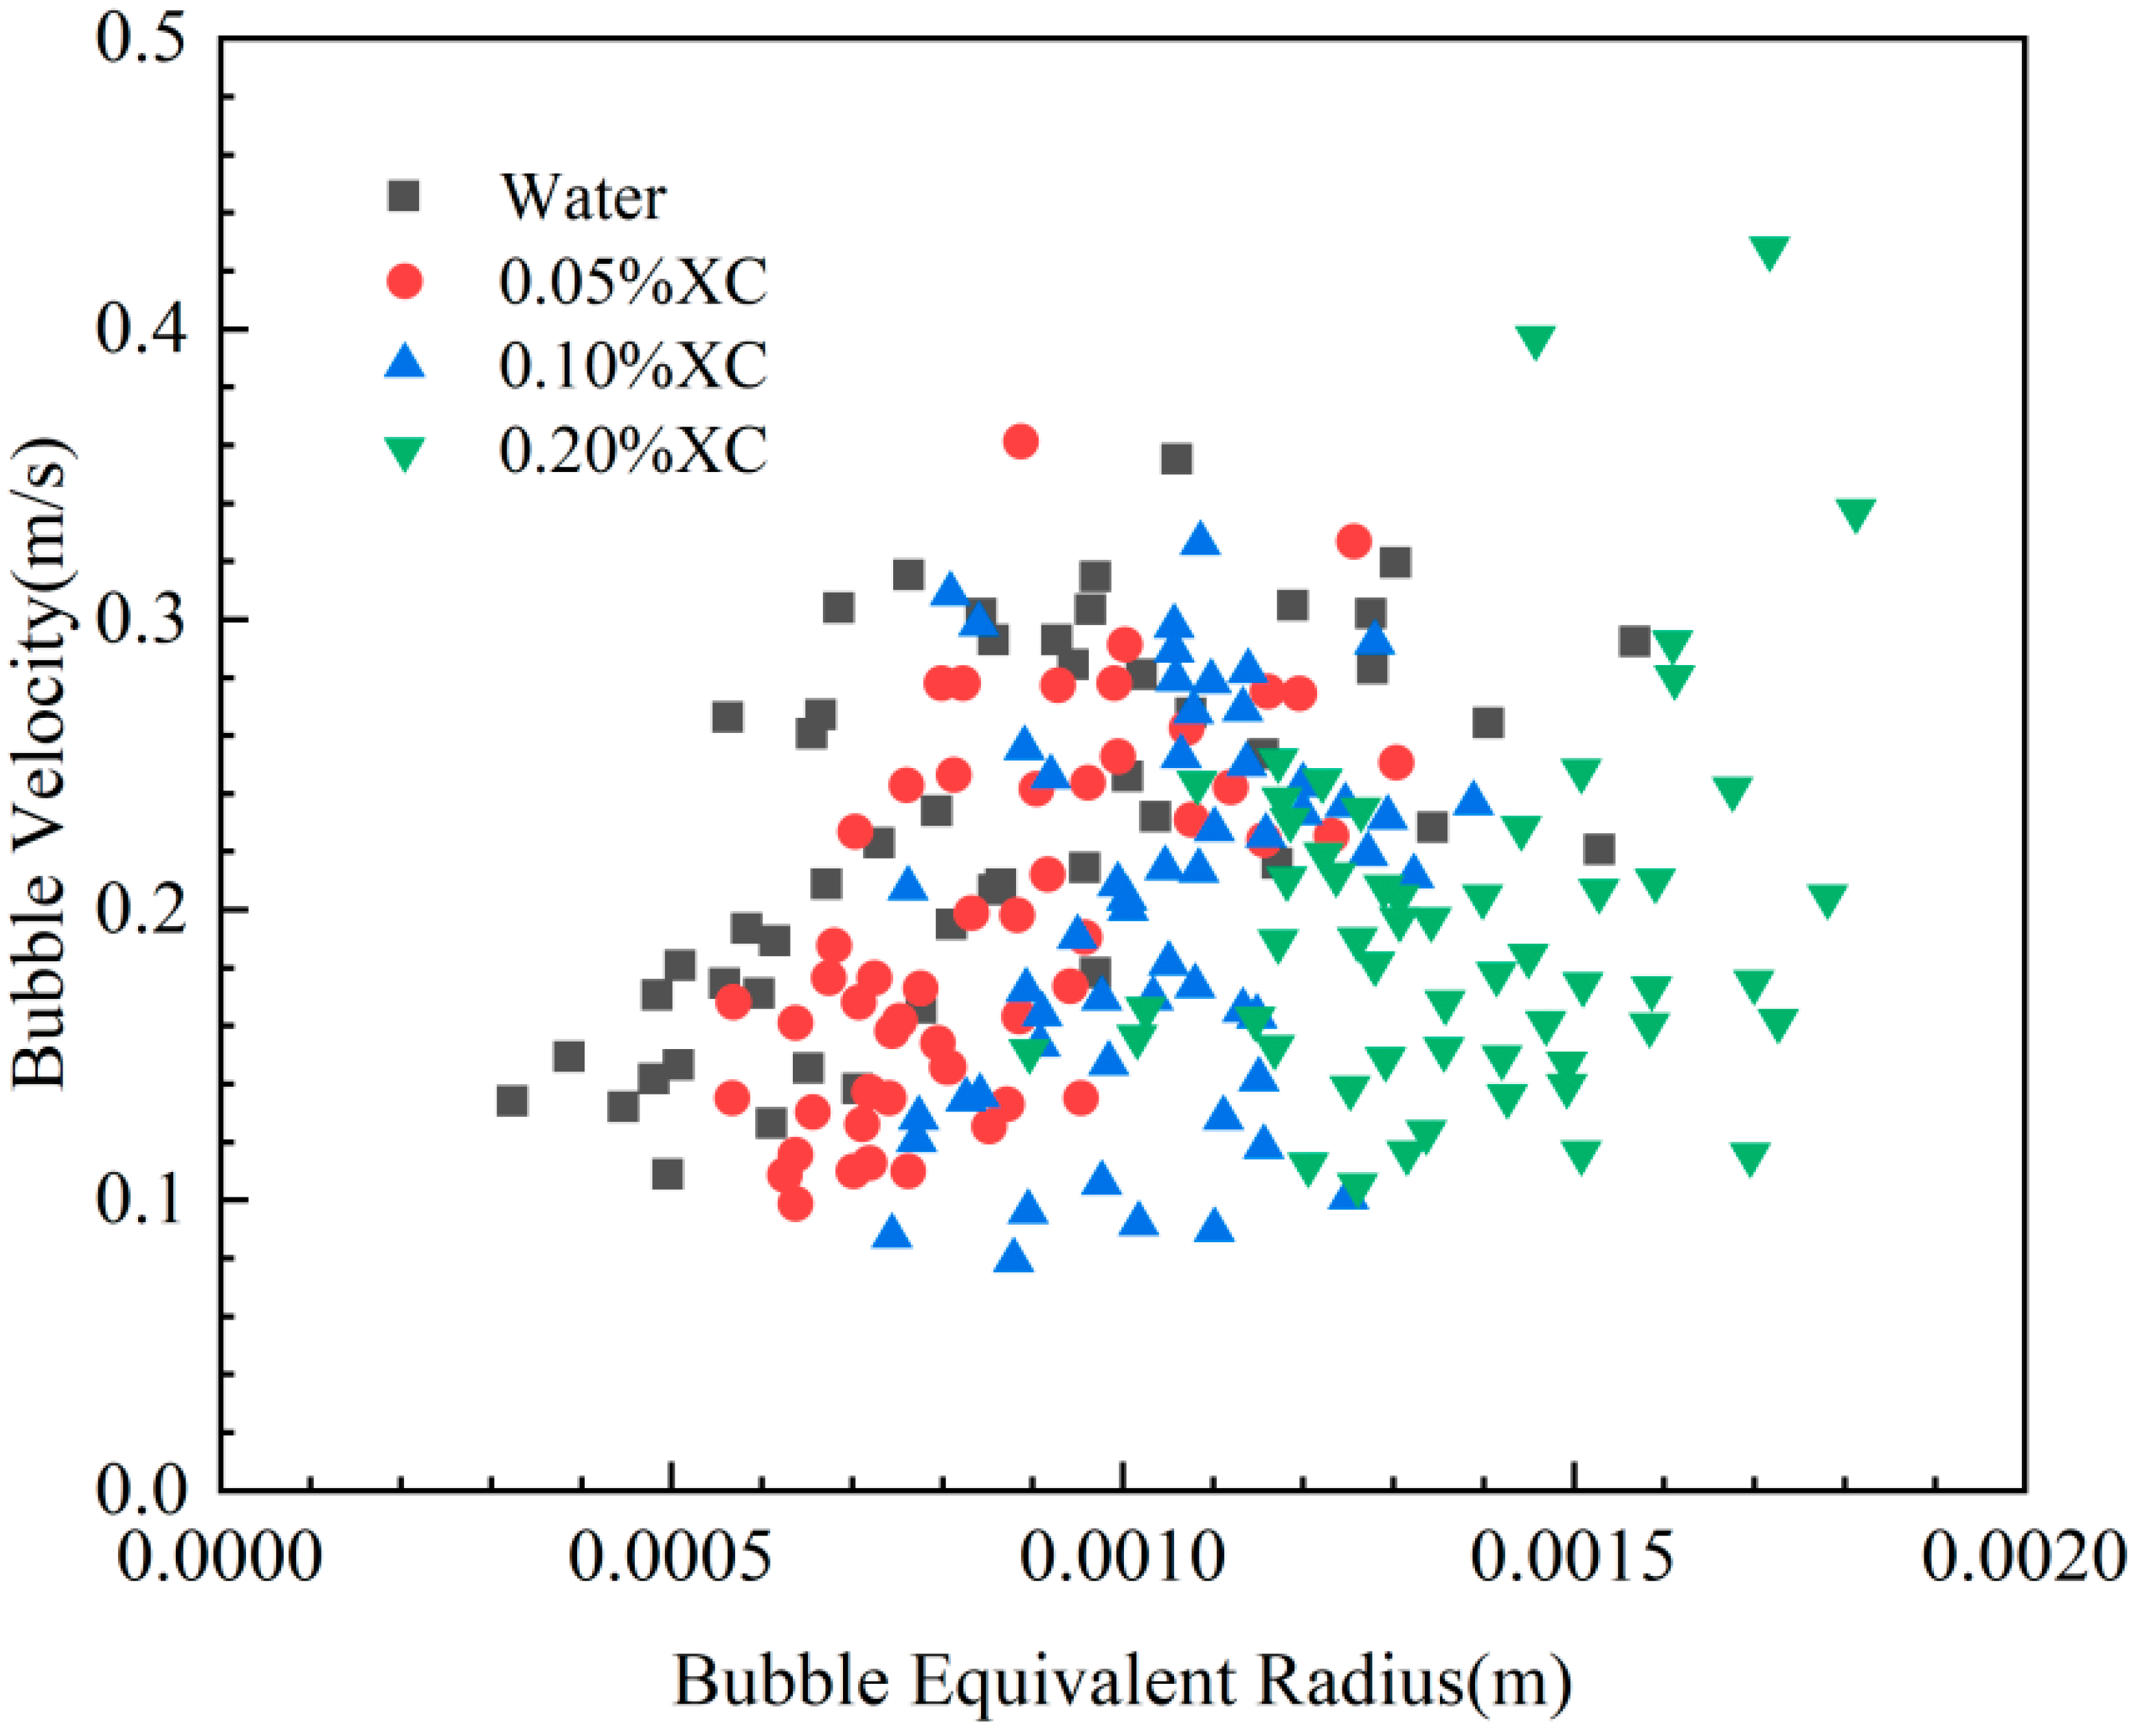
3.2.2. Experiments on the Transport of Bubble Populations

When gas intrudes into the wellbore due to the pressure difference between the formation and the bottom of the well, the gas typically passes through the porous medium in the form of a bubble cluster. It is worth noting that the transport speed of a bubble cluster differs from that of an individual bubble. This section describes the experimentally investigation of the transport speed of bubble clusters in the wellbore under various gas intrusion conditions.
Compared with single bubbles injected through an orifice, intruding gas bubbles in porous media exhibit a smaller average size. The maximum equivalent bubble radius observed in the experiments for a bubble cluster was 1.81 mm, as shown in Table 2 and Figure 9. However, it should be noted that the gas rise velocity of a bubble cluster is typically greater than that of a single bubble of the same size.
In contrast to the positive correlation between the rise velocity of individual bubbles and their equivalent radius, the velocity of gas transport within a bubble cluster exhibits a positive correlation with the equivalent radius of bubbles when the viscosity of the liquid phase is low. However, when the viscosity is high, no correlation is detected between the gas transport velocity and the equivalent radius of bubbles. In order to investigate the transportation velocity of a bubble cluster in the wellbore, a dimensionless analysis of the bubble-cluster transportation velocity was carried out.
The following relationship between the bubble Reynolds number and the drag coefficient during bubble rise was established through fitting based on experimental results shown in Figure 10.
C D , X C = ( 27.12 ± 3.7 ) Re 0.955 ± 0.045
Figure 11 reveals that the bubble-cluster transport velocity in water is related to its equivalent radius. The black dashed line represents the predicted migration speed curve when the equivalent radius is less than 1 mm, while the red dashed line represents the predicted migration speed curve when the equivalent radius is greater than 1 mm. The bubble-cluster transport velocity in water can be calculated using the following expressions:
u z = 2.5 g R b R b 1   mm
u z = 0.26   m / s   R b 1   mm

4. Conclusions

The present study incorporates the theories of multiphase seepage and multiphase flow in wellbores to investigate gas intrusion into a wellbore induced by differential pressure after well shutdown. In this context, a model was established to calculate the rate of gas intrusion, considering various parameters including the porosity of the formation, permeability of the formation, pressure difference between the formation and the wellbore, rheology of the drilling fluid, and surface tension. The experimental results were utilized to validate the prediction model for the initial size of gas bubbles and the calculation method for gas intrusion rates.
(1) Ignoring the change in wellbore pressure caused by the upward movement of gas, the lower the viscosity of the drilling fluid, the longer the time needed for the wellbore pressure to reach equilibrium with the formation pressure.
(2) The larger the pressure difference between the formation and the wellbore during gas intrusion, the longer the time needed for the wellbore pressure to reach equilibrium with the formation pressure.
(3) The initial amount of gas intruding into the wellbore and the rate of gas intrusion are crucial factors for calculating the transportation speed of the intruding gas within the wellbore and the changes in the wellbore pressure due to gas intrusion. Based on the experimental results, empirical expressions were established to predict the drag coefficient of single bubbles and bubble clusters flowing in the wellbore. These expressions can be used to calculate the gas transport velocity for different equivalent radii of single bubbles and the average equivalent radius of bubble clusters. Additionally, the calculation method for the rise velocity of bubble clusters in water was derived based on experimental results.
(4) In 0.05% XC solution, the change in bubble velocity compared to that of bubbles in water is negligible. Moreover, the change in bubble velocity with respect to bubble equivalent radius is also small.
(5) As the solution viscosity increases with the change from 0.1% to 0.2% XC solution, the range of bubble equivalent diameters expands. Simultaneously, the magnitude of change in bubble velocity with bubble equivalent radius also increases. The equivalent radius of bubbles within a bubble cluster is significantly smaller than the equivalent radius of single bubbles generated by the orifice.
(6) When the viscosity of the drilling fluid is low, the transportation speed of bubble clusters exhibits a positive correlation with the average bubble diameter. However, when the average bubble diameter exceeds 1 mm, the bubble-cluster transportation speed no longer changes with variations in bubble diameter. On the other hand, when the viscosity of the drilling fluid is high, there is no apparent relationship between the transportation velocity of bubble clusters and bubble equivalent radius. This observation is of great significance when considering the influence of drilling fluid on the bubble transport velocity in multiphase flow modeling.

Author Contributions

Writing—Original Draft, Methodology, H.Z.; Writing—Original Draft, Visualization, M.X.; Data Curation, Validation, Z.L.; Writing—Original Draft, Experiments, J.Y.; Writing—Review & Editing, Funding acquisition, X.W.; Data Curation, Validation, X.L.; Writing—Review & Editing, Funding acquisition, Z.W. All authors have read and agreed to the published version of the manuscript.

Funding

The authors acknowledge the support from the National Key R&D Program of China (2022YFC2806502), National Natural Science Foundation (52004315, U21B2069), Natural Science Foundation of Shandong Province (ZR2020QE113).

Data Availability Statement

Data are contained within the article.

Conflicts of Interest

Xuerui Wang was employed by CNOOC China Limited, Hainan Branch. The remaining authors declare that the research was conducted in the absence of any commercial or financial relationships that could be construed as a potential conflict of interest.

References

  1. Yin, H.; Si, M.; Li, Q.; Zhang, J.; Dai, L. Kick Risk Forecasting and Evaluating during Drilling Based on Autoregressive Integrated Moving Average Model. Energies 2019, 12, 3540. [Google Scholar] [CrossRef]
  2. Rommetveit, R.; Vefring, E.H. Comparison of results from an advanced gas kick simulator with surface and downhole data from scale gas kick experiments in an inclined well. In Proceedings of the SPE Annual Technical Conference and Exhibition, SPE 22558, Dallas, TX, USA, 6–9 October 1991. [Google Scholar]
  3. Stefan, M.; Samuel, G.; Azar, J. Modeling of pressure buildup on a kicking well and its practical application. In Proceedings of the Permian Basin Oil and Gas Recovery Conference, Midland, TX, USA, 27–29 March 1996. [Google Scholar]
  4. Davies, R.M.; Taylor, G. The mechanics of large bubbles rising through extended liquids and through liquids in tubes. Dyn. Curved Front. 1988, 200, 377–392. [Google Scholar]
  5. Harmathy, T.Z. Velocity of large drops and bubbles in media of infinite or restricted extent. Aiche J. 1960, 6, 281–288. [Google Scholar] [CrossRef]
  6. Wallis, G.B. One Dimensional Two-Phase Flows; McGraw-Hill: New York, NY, USA, 1969; pp. 97–112. [Google Scholar]
  7. Fan, W.Y. Study of Bubble Behaviors and Flow Field around Moving Bubble in Non-Newtonian Fluid; Tianjin University: Tianjin, China, 2008. [Google Scholar]
  8. Wang, T.; Li, H.X.; Li, Y. Numerical Investigation on Coaxial Coalescence of Two Gas Bubbles. J. Xi’an Jiaotong Univ. 2013, 47, 1–6. [Google Scholar]
  9. Liu, Y.P.; Wang, P.Y.; Lin, S.N. Correlation of Position of Taylor Bubble Formation in Cryogenic Tube. J. Shanghai Jiaotong Univ. 2013, 47, 1509–1514+1519. [Google Scholar]
  10. Ulaganathan, V.; Krzan, M.; Lotfi, M.; Dukhin, S.; Kovalchuk, V.; Javadi, A.; Gunes, D.; Gehin-Delval, C.; Malysa, K.; Miller, R. Influence of β-lactoglobulin and its surfactant mixtures on velocity of the rising bubbles. Colloids Surf. A Physicochem. Eng. Asp. 2014, 460, 361–368. [Google Scholar] [CrossRef]
  11. Azzopardi, B.J.; Pioli, L.; Abdulkareem, L.A. The properties of large bubbles rising in very viscous liquids in vertical columns. Int. J. Multiph. Flow 2014, 67, 160–173. [Google Scholar] [CrossRef]
  12. Keshavarzi, G.; Pawell, R.S.; Barber, T.J.; Yeoh, G.H. Transient analysis of a single rising bubble used for numerical validation for multiphase flow. Chem. Eng. Sci. 2014, 112, 25–34. [Google Scholar] [CrossRef]
  13. Cano-Lozano, J.C.; Bolaños-Jiménez, R.; Gutiérrez-Montes, C.; Martínez-Bazán, C. The use of volume of fluid technique to analyze multiphase flows: Specific case of bubble rising in still liquids. Appl. Math. Model. 2015, 39, 3290–3305. [Google Scholar] [CrossRef]
  14. Yan, X.; Zheng, K.; Jia, Y.; Miao, Z.; Wang, L.; Cao, Y.; Liu, J. Drag Coefficient Prediction of a Single Bubble Rising in Liquids. Ind. Eng. Chem. Res. 2018, 57, 5385–5393. [Google Scholar] [CrossRef]
  15. Khodayar, J.; Davoudian, S.H. Surface Wettability Effect on the Rising of a Bubble Attached to a Vertical Wall. Int. J. Multiph. Flow 2018, 109, 178–190. [Google Scholar]
  16. Du, J.; Zhao, C.; Bo, H.; Ren, X. The Modeling of Bubble Lift-Off Diameter in Vertical Subcooled Boiling Flow. Energies 2022, 15, 6857. [Google Scholar] [CrossRef]
  17. Mangani, F.; Soligo, G. Influence of density and viscosity on deformation, breakage, and coalescence of bubbles in turbulence. Phys. Rev. Fluids 2022, 7, 34. [Google Scholar] [CrossRef]
  18. He, H.; Liu, Z.; Ji, J.; Li, S. Analysis of Interaction and Flow Pattern of Multiple Bubbles in Shear-Thinning Viscoelastic Fluids. Energies 2023, 16, 5345. [Google Scholar] [CrossRef]
  19. Guo, Y.L. Study on Gas Invasion Mechanism and Wellbore Pressure during Well Shut-In in Deepwater Drilling. Ph.D. Thesis, China University of Petroleum, Qingdao, China, 2018. [Google Scholar]
  20. Zhang, J.; Du, D.; Hou, J. Seepage Mechanics of Oil and Gas Reservoirs, 2nd ed.; China University of Petroleum Press: Dongying, China, 2009. (In Chinese) [Google Scholar]
  21. Sun, B.; Guo, Y.; Wang, Z.; Yang, X.; Gong, P.; Wang, J.; Wang, N. Experimental study on the drag coefficient of single bubbles rising in static non-Newtonian fluids in wellbore. J. Nat. Gas Sci. Eng. 2015, 26, 867–872. [Google Scholar] [CrossRef]
Figure 1. Schematic of gas intrusion test system.
Energies 17 00242 g001
Figure 2. The rheology properties of experiment solutions.
Energies 17 00242 g002
Figure 3. The experimental flow chart.
Energies 17 00242 g003
Figure 4. Distribution of dimensionless bubble diameter.
Energies 17 00242 g004
Figure 5. Plot of dimensionless bubble diameter against pressure difference.
Energies 17 00242 g005
Figure 6. Variations in the wellbore pressure during gas intrusion for various concentrations of XC solution. (a) Variations of the wellbore pressure over time for water; (b) Variations in the wellbore pressure over time for a 0.05% XC solution; (c) Variations in the wellbore pressure over time for a 0.1% XC solution; (d) Variations in the wellbore pressure over time for a 0.2% XC solution.
Energies 17 00242 g006aEnergies 17 00242 g006b
Figure 7. Velocity of a single bubble versus equivalent bubble radius.
Energies 17 00242 g007
Figure 8. The drag coefficient for various Reynolds numbers.
Energies 17 00242 g008
Figure 9. Velocity distribution of bubbles plotted against equivalent bubble radius.
Energies 17 00242 g009
Figure 10. Plot of the drag coefficients for various Re numbers.
Energies 17 00242 g010
Figure 11. The velocity of a bubble cluster in water.
Energies 17 00242 g011
Table 1. Properties of experimental materials.
TypeConsistency Factor K
(Pa·sn)
Fluidity Index nDensity
(kg·m−3)
Surface Tension
(N·m−1)
Water0.011100072.35
0.05% XC0.072240.51458100073.67
0.1% XC0.123770.48544100074.24
0.2% XC0.343370.43297100075.05
0.4% XC1.283810.34793100076.75
Table 2. Range of bubble velocity and equivalent radius.
TypeRange of Bubble Equivalent Radius (mm)Bubble Velocity Range (mm/s)
Single BubbleBubble GroupSingle BubbleBubble Group
Water0.5–80.32–1.6170–267110–330
0.05% XC2.7–6.90.56–1.29213–303100–360
0.1% XC2–9.80.74–1.43116–25977.9–321
0.2% XC1.9–9.40.89–1.8195–231106–428
Disclaimer/Publisher’s Note: The statements, opinions and data contained in all publications are solely those of the individual author(s) and contributor(s) and not of MDPI and/or the editor(s). MDPI and/or the editor(s) disclaim responsibility for any injury to people or property resulting from any ideas, methods, instructions or products referred to in the content.

