Article

A Comparative Investigation of the Emissions of a Heavy-Duty Diesel Engine under World Harmonized Transient Cycle and Road Spectrum Cycle

1
Naval Architecture and Shipping College, Guangdong Ocean University, Zhanjiang 524088, China
2
School of Automotive and Transportation Engineering, Shenzhen Polytechnic, Shenzhen 518005, China
*
Author to whom correspondence should be addressed.
Energies 2024, 17(1), 7; https://doi.org/10.3390/en17010007
Submission received: 11 October 2023 / Revised: 4 December 2023 / Accepted: 11 December 2023 / Published: 19 December 2023
(This article belongs to the Topic Advanced Technologies and Methods in the Energy System)

Abstract

:
In the present study, detailed comparative experiments on a heavy-duty diesel engine used in the world harmonized transient cycle (WHTC) and road spectrum reversely deduced cycle (RSRDC, which was derived from a road test) were carried out. Fuel consumption and gaseous and particulate pollutants, along with some engine operation parameters, were measured transiently; thus, specific emissions can be calculated. Results showed that the BSFC of WHTC and RSRDC was 201.8 and 210 g/kW·h, respectively, because the real road driving cycle (RSRDC) had wider operating point distributions and more points located in the low-efficiency zone relative to WHTC. Thus, WHTC operations exhibited higher raw CO (abundant CO formation needed a specific temperature threshold) and NOx but lower HC. Furthermore, with aftertreatment, all pollutants met the newest China regulation limit. Finally, transient emissions were analyzed in detail. Although the specific emissions of some pollutants were similar in value for both cycles, transient processes may largely be different. Therefore, the current study is meaningful, and we not only provide broad and detailed information but also directly compare two types of operations (one is a real road driving cycle) in the laboratory: this is rarely discussed in the literature.

1. Introduction

Currently, as one of the most widely used power sources, internal combustion engines (ICEs) produce vast quantities of harmful pollutants [1,2]. The China Mobile Source Environmental Management Annual Report (2022) [3] illustrates that, during 2021 in China, motor vehicles emitted 7.683, 2.004, 5.821, and 0.069 million tons of carbon monoxide (CO), hydrocarbon (HC), oxynitride (NOx), and particulate matter (PM), respectively. Heavy-duty trucks are the main contributors of NOx (accounting for 76.1% of total mobile sources) and PM (accounting for 51.5% of total mobile sources). Therefore, urgent investigations with respect to heavy-duty emission control are necessary.
Moreover, emission regulations have become increasingly rigorous for most countries [4]. The European Union (EU) is planning to implement Euro 7, and China will implement Euro 6b very soon. Additionally, emission regulations need to consider substantial amounts of real driving parameters, such as road grade [5], driving cycle/pattern [6], application city/region and topography [7], etc. Among these factors, the driving cycle is the most important aspect that impacts fuel consumption and emissions [8], and all regulations also stipulate the laboratory test procedure. However, for the road test, regulations have difficulty determining the specific vehicle velocity and road section due to the large range of vehicle applications; only the velocity range (for each driving mode, such as urban, rural, and highway driving modes) and total power are recommended. Furthermore, in order to represent broader driving conditions around the world, the EU (and some other regions) updated the test procedure from the new European driving cycle (NEDC) to the worldwide harmonized light-duty test procedure (WLTP) and worldwide harmonized transient cycle (WHTC) test for light-duty and heavy-duty vehicles, respectively, in September 2017. Indeed, WHTC is more dynamic and aggressive [9]. As shown in Table 1, WHTC is more stringent than that of the portable emissions measurement system (PEMS) road test.
With respect to WHTC test procedures, many investigations have been carried out in both industrial and academic communities. Bai et al. [11] reduced NOx emissions via exhaust thermal management, and thermal effects also increased the NO2/NOx ratio, which can reduce NOx. Our previous study [12] illustrated that by optimizing the intake throttle’s opening degree (thus optimizing exhaust temperatures) under WHTC operations, NOx can be maximally decreased by 43%. Duan et al. [13] even used electrically heated catalysts during the low-load cold start procedure, and it shortened the time range of exhaust gas temperatures at position of post-diesel oxidation catalysts (DOCs) by 767 s to reach 138 °C. Thus, the pollutants’ conversion efficiencies were significantly improved. Fontaras et al. [14] used a chassis dyno test under the world harmonized vehicle cycle (WHVC), which was taken from WHTC to verify the simulation of CO2 emissions and fuel consumption via the vehicle energy consumption calculation tool (VECTO), and the results showed that the deviation between calculations and measurements was approximately ±2–4%. García et al. [15] compared the emissions and performance between the dual-mode dual-fuel (DMDF) mode and reactivity-controlled compression ignition (RCCI)/conventional diesel combustion (CDC) mode under WHVC operations, and the results showed that the difference in emitted gaseous pollutants between these two modes was substantial. Baek et al. [16] also compared the emissions of a bus fueled by diesel and liquefied petroleum gas (LPG) under WHVC driving (via the chassis dynamometer test) conditions. It was observed that CO2-equivalent N2O and CH4 emissions from diesel vehicles were 3.6 times higher than that of LPG, and nucleation mode particle emissions were 2–3 times higher from diesel vehicles.
However, although WHVC is derived from WHTC, its application is still limited in laboratory tests, which may not reflect real driving conditions. For example, Park et al. [17] measured 109 light-duty vehicles on roads in South Korea, and they observed that the average on-road NOx emissions of Euro 5 and Euro 6b diesel vehicles were about five times higher than the emissions listed in EU regulations (laboratory emission limits). This illustrates that laboratory test procedures cannot reflect every zone’s on-road condition. Thus, an on-board monitoring (OBM) system is necessary. Moreover, PEMS plays an increasingly important role in emission statistics and the development of emission factors [18]. With respect to road tests (especially for PEMS measurements), there were substantial investigations in the literature. Zhang et al. [19] observed good agreements between OBM and PEMS results, with an average relative error of ~15% in Beijing, China. Zhang et al. [20] investigated exhaust emissions from a logistics transportation vehicle via a PEMS, and the effects of speed, acceleration, and engine load on emissions were discussed. Yu et al. [21] used a PEMS to collect emission and driving behavior data, which can be used to improve eco-driving. Yao et al. [22] performed PEMS measurements for China III and IV in-use diesel trucks, and Zhu et al. [23] performed PEMS measurements for China V and VI vehicles. The results showed significant emission reduction benefits with respect to regulation development: for example, a 15.9% reduction in CO2 and a 28.8% reduction in CO from China V to China VI. Progress was also obviously observed via PEMS measurements carried out from Euro IV to VI [24]. However, as stated by Giechaskiel et al. [25], more investigations with respect to the robustness and accuracy of PEMS are needed, especially for heavy-duty diesel vehicles. Giechaskiel et al. [26] estimated that the worst-case margin of PEMS is 0.43. Thus, an estimation of the closeness between road and laboratory tests is still needed. Additionally, determining a connection between emissions (including gaseous and solid pollutants) and engine parameters (such as specific power, speed, etc.) is necessary for emission prediction and control strategy [27]. Furthermore, a direct and “fair” comparison between road driving and laboratory tests is also needed.
To fill this gap, in the present study, we carry out a significant attempt. We collect engine operation parameters via road tests on a heavy-duty diesel truck and then carry out a comparative laboratory test on operation cycles that are collected from the road test and WHTC. During laboratory tests, fuel consumption and some operation parameters (such as air flow rate and temperature) and pollutants (including gaseous and particulate) are measured for direct comparison. Due to this, the matching degree of WHTC relative to road driving—not only with respect to specific emissions but also detailed influencing processes and patterns—can be explored. This can be useful in promoting the development of regulations.

2. Materials and Methods

2.1. The Tested Engine and Vehicle

A heavy-duty six-cylinder diesel engine was investigated in the current study. The engine was developed specifically for heavy trucks. Thus, it is a road vehicle engine that experiences all types of working conditions (idling, cruise, acceleration/deceleration, etc.), and its parameters are provided in Table 2. Moreover, the parameters of aftertreatment, including DOC, diesel particulate filter (DPF), selective catalytic reduction (SCR), and ammonia slip catalyst (ASC), are listed in Table 3. For the road test, an N3-type vehicle (truck with a total design weight of >12,000 kg) that is equipped with this engine is used. The maximum total weight of this truck is 25,000 kg, the driving mode is 6x4, the design’s highest speed is 120 km/h, and it has 16 manual gear ratios with a main reduction ratio of 2.846. Finally, the tested engine is fueled using the Chinese #0 diesel fuel, and its properties are listed in our previous study [12].

2.2. Experimental Instruments

For the road test, the location and vehicle speed are transiently recorded via a global positioning system (GPS); this is the same method used in the study carried out by Zhang et al. [28]. Since 2013, China has introduced European on-board diagnostics (OBD) in China IV heavy-duty vehicle (HDV) standards and enhanced the OBD requirements for China VI. The latest generation of OBD systems (OBD-III) can track vehicle operating information and pollution emissions in real time [29]. OBD can be connected using a 16-pin connector/socket, and details can be observed in Ref. [30]. Thus, the vehicle’s speed is also derived from OBD, and the error between the GPS and OBD is less than 1%. The engine’s speed can be directly read via OBD, but the engine’s torque is obtained via Equation (1) (factual and ffriction are directly read from OBD):
T a c t u a l = ( f a c t u a l f f r i c t i o n ) × T r e f
where Tactual is the real output torque, factual is the fraction of actual torque, ffriction is the fraction of friction torque, and Tref is the engine reference torque, which is already calibrated by the engine manufacturer (it is a known value).
Moreover, during road driving, engine coolant and exhaust temperatures are monitored via K-type temperature sensors (with an uncertainty of ±0.15 °C).
The engine is tested on a Horiba engine dynamometer with a control accuracy of ±1.0% FS. The temperatures of the engine’s coolant/oil and intake/exhaust air are measured via corresponding temperature sensors (with an uncertainty of ±0.15 °C). The intake mass flow is measured via an air flow meter, Toceil (Shanghai)-LEF300, with an accuracy of ±0.5%. Moreover, an AVL 7351 CST fuel meter (accuracy is 1.2 g/h) is used to measure fuel consumption.
Most importantly, emission sampling and analysis instruments are listed in Table 4. The sampling system comprises a dilution system (Horiba CVS-ONE, HORIBA, Ltd., Kyoto, Japan). The gaseous emission analyzer is a Horiba MEXA-7200D (HORIBA, Ltd., Kyoto, Japan); in this analyzer, total hydrocarbon (THC) is determined via the flame ionization detector (FID) method, and the non-methane hydrocarbon (NMHC) level is measured using a flame ionization detector with a non-methane cutter (NMC-FID), while CO and CO2 are measured using non-dispersive infrared (NDIR) spectroscopy, and NOx is measured using a chemiluminescence detector (CLD). Finally, the particle number (PN) is instantaneously measured via a Horiba MEXA-2000SPCS (HORIBA, Ltd., Kyoto, Japan) with a diluter temperature of 191 ± 10 °C and evaporation tube temperature of 350 ± 10 °C such that the volatile particle removal efficiency is ≥99% (measured via C40). All instruments are within the calibration range.

2.3. Experimental Scenarios and Procedures

There are two experimental scenarios: WHTC and RSRDC. WHTC was taken directly from China’s national standard GB 1769-2018 [10], while RSRDC was indirectly derived from the backward deduction of a road test. Therefore, the road test was first performed, as illustrated in Figure 1, according to the truck’s application target range. More importantly, the road test must meet the requirements of PEMS testing in EU [31] and China [10] (we compared the requirements between the EU standard [31] and China standard [10], and most requirements were the same except for the road condition proportion and corresponding average vehicle speed; see below for details. In such cases, we referred to the Chinese standard). The specific requirements and our testing parameters are listed below:
  • The truck was driven between the point of departure (Taojia Twon of Chongqing City, China) and the destination position (Qingmuguan Twon of Chongqing City, China), which comprised a typical path for the truck’s application. The entire trip took ~3000 s, including about 20% urban roads, 25% suburb roads, and 55% motorways (required by GB 1769-2018 [10]). While EU standards require the inclusion of 30% urban driving, 25% rural driving, and 45% motorway driving for PEMS testing, we referred to the Chinese standard in these aspects because this vehicle type is used in China.
  • The average speed required by the Chinese standard is 13–30 km/h, 45–70 km/h, and >70 km/h with respect to urban–rural driving, rural driving, and motorway driving, respectively. Our road test’s average speed was 27 km/h, 63 km/h, and 83 km/h for the above three phases, respectively. Of course, EU standards regulate higher average speeds for each driving phase, and again, we used the Chinese standard in this respect.
  • At the beginning of the test, the atmospheric pressure was 97.2 kPa, relative humidity was 46.9%, and the temperature was 28 °C. All these parameters meet the requirements of both standards. Then, according to the standard, the vehicle was warmed up until the coolant temperature reached 70 °C and the test began.
  • The standard required that the vehicle loading rate should be between 10 and 100% of the maximum cargo capacity. During road driving, the truck was loaded at 11.1% of the maximum cargo capacity.
There are too many other minor requirements to list, but we checked each according to the standard in the road test. However, it is noted that the engine cycle operation of the road test was 2.1 times that of the WHTC, which did not satisfy the requirement of PEMS testing (the accumulative operation of the test vehicle needs to reach 4–7 times that of the WHTC cycle operation). In summary, our road cycle satisfied the “PEMS Testing Operating Conditions”, with the exception of cycle operations. Nevertheless, the main goal of the current study is to investigate driving condition effects on vehicle emissions and the corresponding controls. Moreover, we also needed to explore how close real driving conditions are (the driving route is an important application scenario) compared to WHTC. Thus, this road test is worth investigating. Finally, during the trip, engine coolant and exhaust temperatures were monitored and vehicle speed and engine speed/load were recorded for the next engine bench test. This obtained engine operating condition is called RSRDC.
Next, engine bench testing was comparatively performed under WHTC and RSRDC. In both cases, the obtained engine speed and torque values were fed to the engine dynamometer. The engine speed can be directly controlled by the electric dynamometer, while torque was utilized by the dynamometer (via electricity generation) when the engine produced torque; in contrast, under negative torque values, the dynamometer reversely motored the engine according to the torque values.
A similar test is described in detail in our previous study [12]. Moreover, the experiments were carried out based on the Chinese national standard GB 1769-2018 [10]. Briefly, the engine was installed in a test cell (the layout is shown in Figure 1) with standard air conditions (25 ± 1 °C temperature and 101.3 ± 0.1 kPa pressure), and all sampling and measuring instruments were prepared and warmed. Then, the engine was started in cold conditions (coolant, lubricant, and accessories should be within the temperature range of 20–30 °C), and it was warmed up. The engine was operated at 75–100% of the maximum power conditions until coolant and lubricant temperatures reached normal service demand values (~85 °C for the coolant and ~100 °C for the lubricant) at ± 2%, and this was maintained for at least 2 min.
Then, a hot WHTC was performed. After that, the engine was stopped, and a coolant temperature of ~85 °C and lubricant temperatures close to 100 °C were reached. Finally, the RSRDC cycle was tested. During each cycle, the engine was strictly controlled according to speed and torque evolutions, as shown in Figure 2. Please note that RSRDC did not exhibit negative torque values. In fact, during road driving, the engine was also reversely motored by the vehicle under some conditions, such as downhill roads. Nevertheless, unlike laboratory conditions, during road driving, the negative torque changed instantaneously (for example, according to the slope gradient). Under these conditions, the engine did not record negative torque values (and the vehicle was not affected by the degree of negative torque because the vehicle did not consume fuel during those conditions) but exhibited all values as zero. However, this treatment did not impact our experiments and results, because at those moments, the fuel supply was cut off, resulting in no BSFC or emissions. Meanwhile, gaseous and particulate emissions were instantaneously sampled and recorded before (referred to as raw emission) and after aftertreatment (referred to as tailpipe emissions), respectively, using the corresponding instruments (as depicted in the last section). It is noted that although the specific weight of PM (g/kW·h) is also limited by regulations, unfortunately, the weight of PM was not measured in the current study due to the limitations of our measurement facility. However, PN was measured instantaneously during the test, and it can also be used as an indicator for analyzing PM’s emission status because PN exhibits a very positive correlation relative to black carbon, especially for direct injection engines [32]. In addition, other parameters, such as coolant/lubricant temperatures, intake flow rate, fuel flow rate, exhaust temperature, etc., were also measured. Because the road test was performed after being warmed up, only the hot start results were compared between the two cycles in the current study.
In order to compare to national regulations and carry out comparisons between two cycles, transient emissions should be converted to brake-specific emissions (BSEs). The BSE of each species is calculated using Equation (2):
B S E j ,   o r   P N = i = 1 n E m a s s j ,   o r   # ,   i × W F i i = 1 n P ( n ) i × W F i
where BSEj, or PN is the brake-specific emission (g/kW·h of gaseous pollutants or #/kW·h for PN) species j. Emassj, i is the emission mass rate (g/h) of each species j at moment i, which is calculated via Equation (3). In contrast, for PN, E#,i is the emission number rate (#/h) at moment i, and it can be estimated via Equation (4). P(n)i is the engine power (kW) at moment i, and WFi is the weighting coefficient (can be consulted in the national standard according to the operating condition).
E m a s s j , i = V d i l u , i × 60 × ρ j × 10 3 × k h × C j × 10 6
E # , i = V d i l u , i × 60 × C P N
Here, Vdilu,i is the dilute gas flow rate (L/min), ρi is the density of species j (mg/L), Cj denotes dilute gas concentrations (corrected by background value) of species j (ppm), CPN denotes PN concentrations in dilute gas (corrected by background value) (#/L), and kh is the humidity correction factor of NOx, which is calculated via Equation (5):
k h = 1 1 0.0329 × ( H 10.71 )
H = 6.211 × R a × P a P B R a × P × 10 2
where H denotes absolute humidity (g water/kg dry air), which is calculated via Equation (6); Ra denotes environmental air relative humidity (%); Pa denotes saturated vapor pressure (kPa) at atmospheric temperatures; and PB denotes indoor air pressure (kPa).

3. Results and Discussion

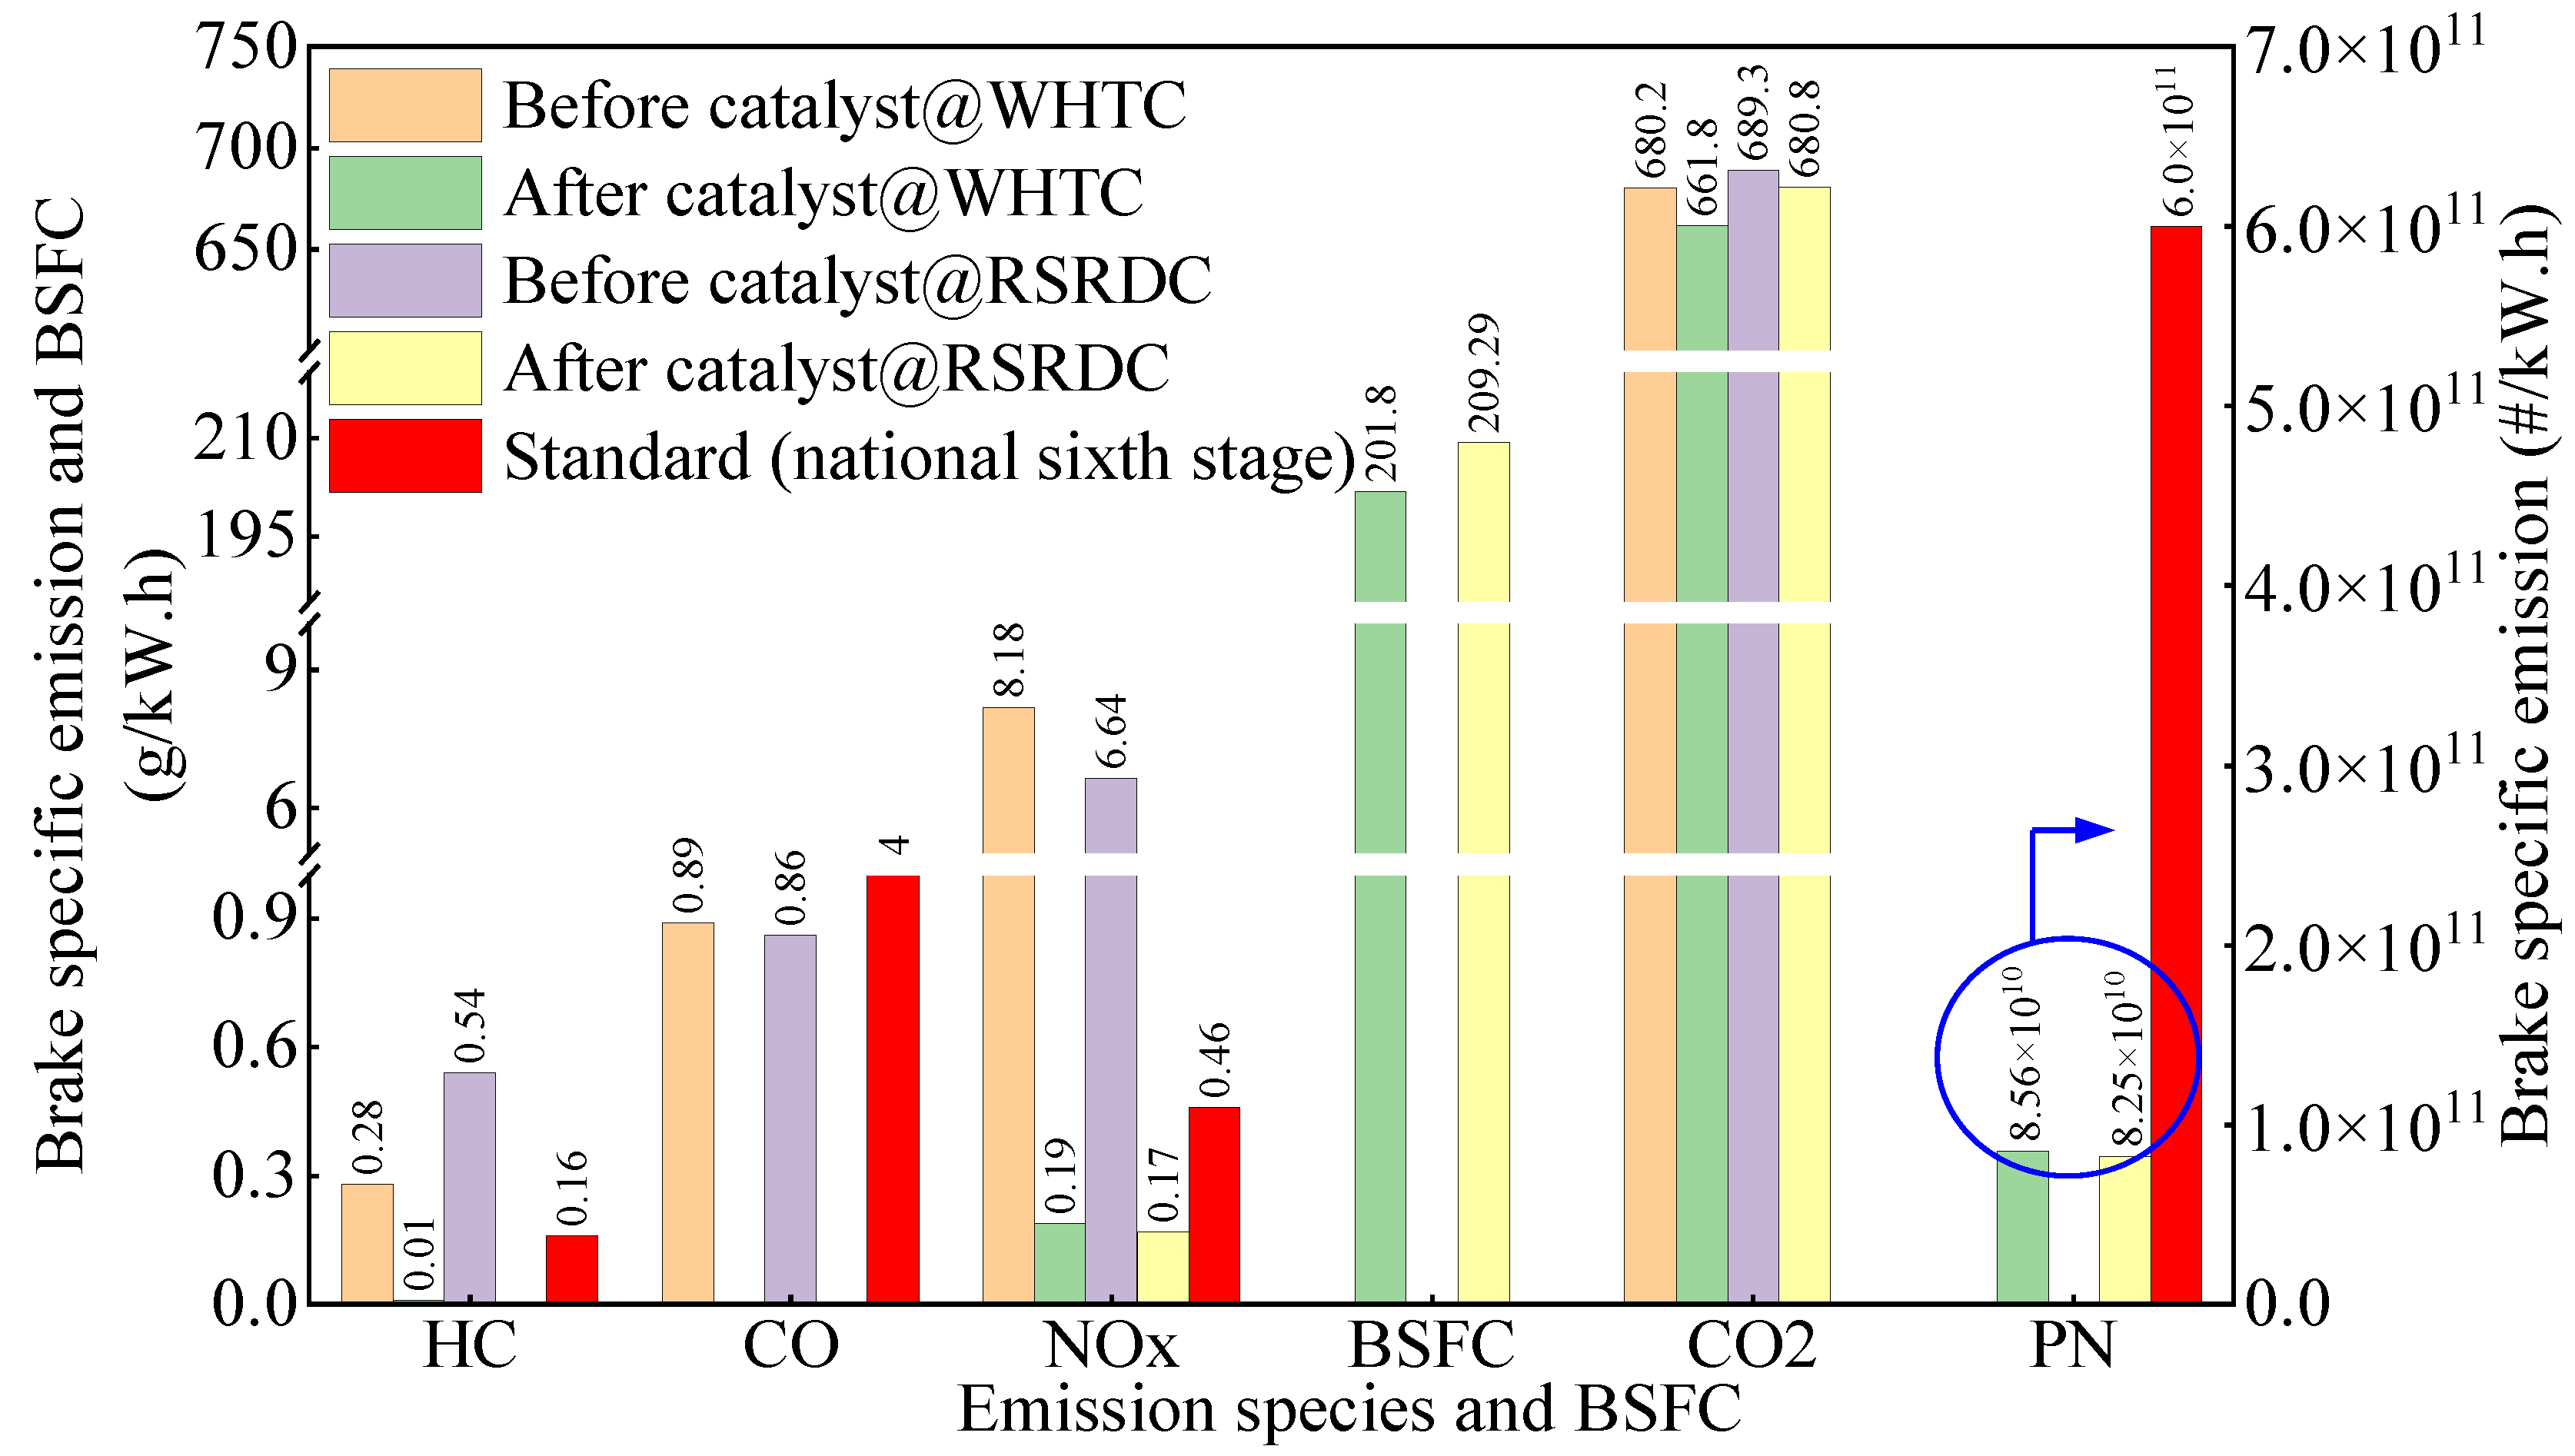
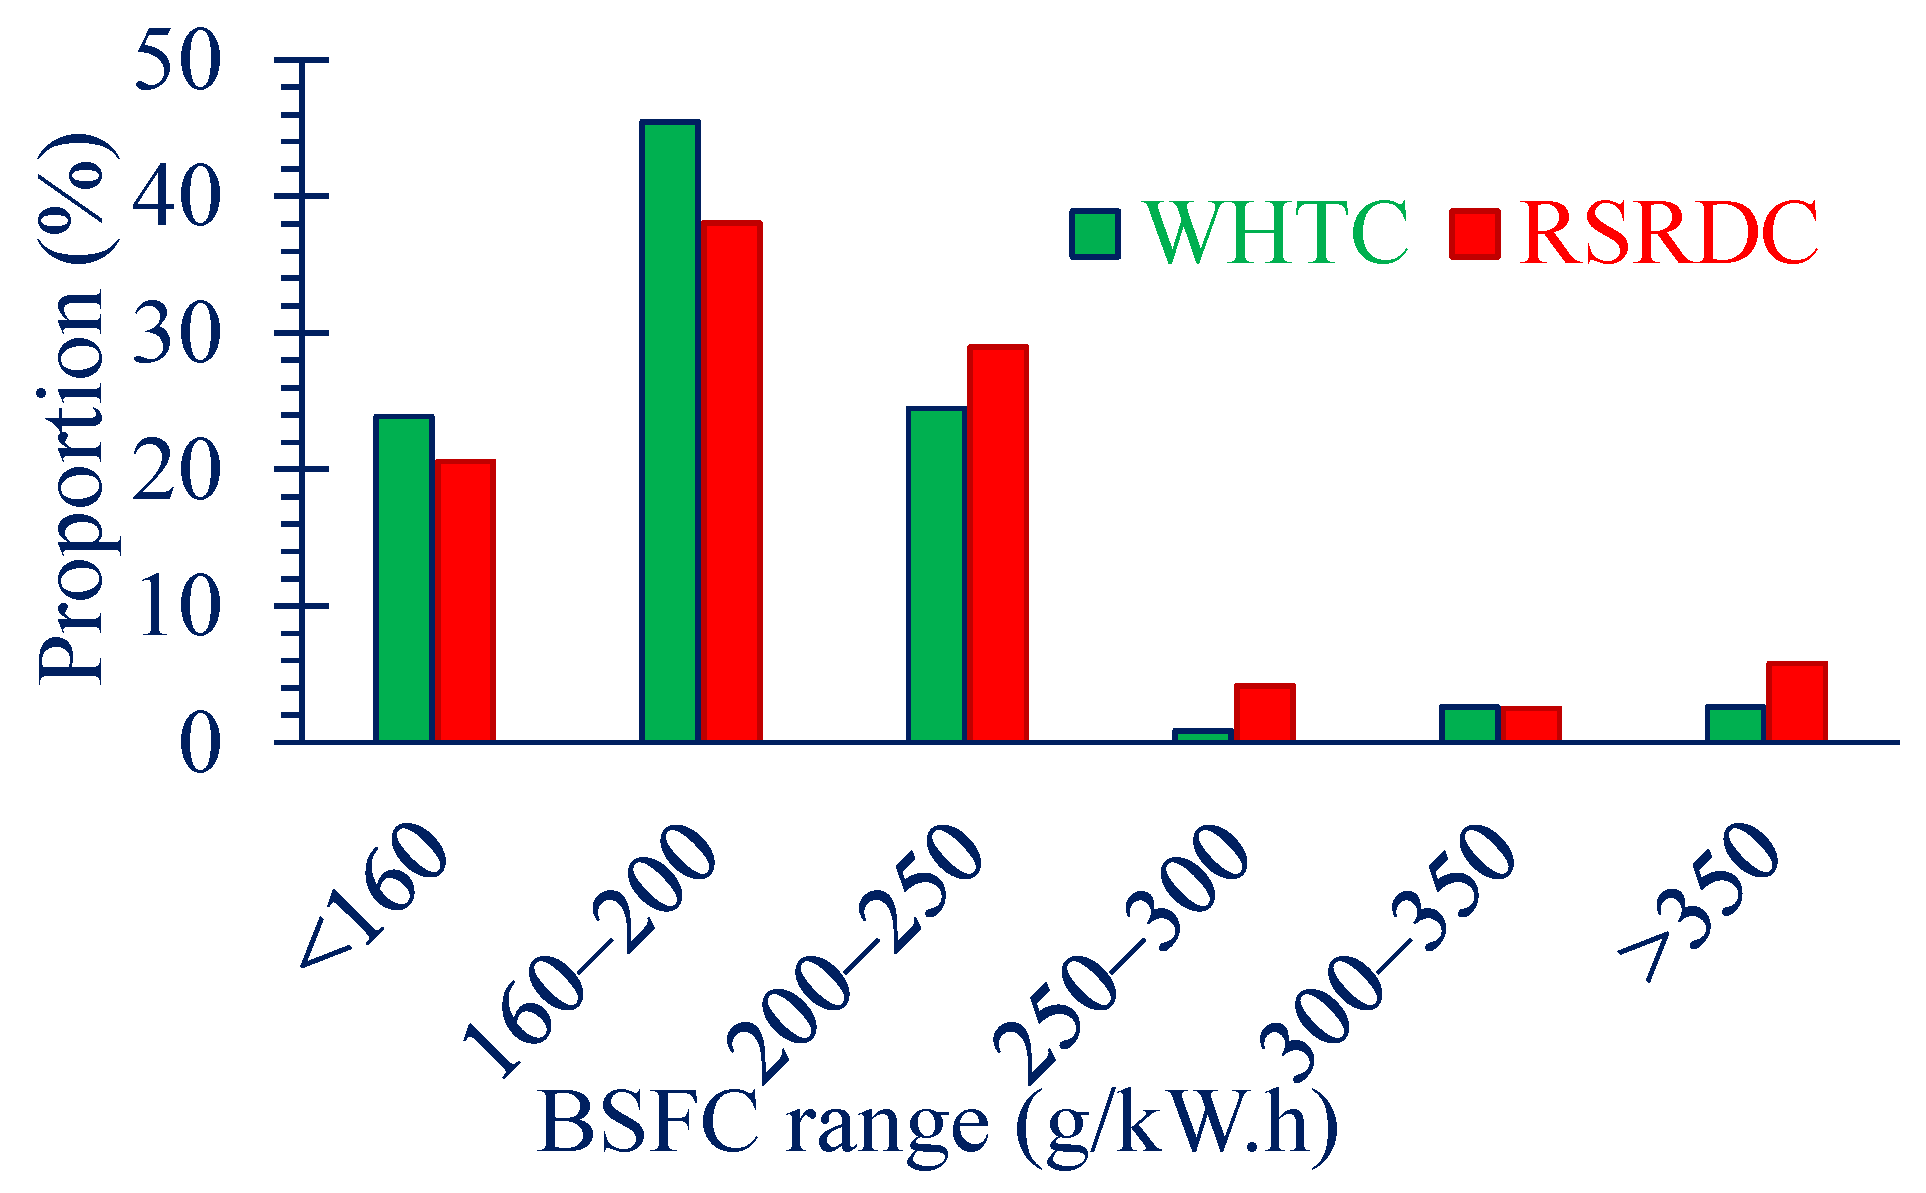
3.1. Fuel Consumption and Specific Emissions

The BSEs of gaseous emissions and PN, along with brake-specific fuel consumption (BSFC), are provided in Figure 3 (the BSFC is not affected by emission measurements, and PN was not measured before the catalyst). The results illustrate that the BSFC of WHTC and RSRDC is 201.8 and 210 g/kW·h, respectively. This can be explained via Figure 4 (fuel consumption map) and Figure 5 (proportion distribution of engine operating points). From these figures, we can summarize some features: (1) during real driving (RSRDC), the operating points exhibit a wider distribution (also see Figure 2); (2) this means that during road driving, more operating points are located within the low-efficiency zone. In the blue dotted circle zone (bottom right corner of Figure 4), the WHTC has almost no extreme operating points (BSFC > 400 g/kW·h), while many operating points are located within this zone for RSRDC (see Figure 4b); moreover, the proportion of BSFC > 350 g/kW·h is only 2.6% for WHTC, while it is 5.8% for the RSRDC. (3) For the very-low-BSFC zone (<160 g/kW·h, which can be referred to as fuel cutting), the proportion is 23.9% and 20.6% for the WHTC and RSRDC, respectively. This means that the deceleration operation is relatively higher under WHTC operations (see Figure 2).
From WHTC to RSRDC, the BSFC increases by about 3.7%, but specific CO2 emissions only increase by about 1.3% (for raw CO2 emissions). Generally, CO2 increases linearly relative to fuel consumption [33]. This means that WHTC exhibits higher combustion efficiency (in this case, during combustion, more CO will be converted to CO2 with substantial heat release; thus, CO2 formation rates can, to some extent, indicate combustion efficiency [34]). Namely, reduction of a small portion of CO2 is a consequence of worse combustion when changing operations from WHTC to RSRDC. Additionally, from Figure 3, a decrease in CO2 catalysts is observed, and this is because some CO2 is absorbed by the aftertreatment system (there are a total of four reactor types in the pollution control system); the absorption amplitude is almost the same for both cycles.
For pollutants, as mentioned above, under WHTC operations, the engine exhibits higher combustion efficiency; therefore, the raw emitted HCs (before catalyst) of WHTC are substantially lower than that of RSRDC, as shown in Figure 3. However, Yildiz et al. [35] tested the engine at very low loads (100 N.m torque; steady-state operation), and HC emissions were only 0.097 g/kW·h, which are substantially lower than our results (both cycles). Thus, even at low engine loads, under steady-state operations, the engine usually has better in-cylinder processes. The raw CO emission of Yildiz et al. [35] was 0.749 g/kW·h, which was also lower than our results. For our raw CO, the specific emission of WHTC is slightly higher than that of RSRDC (although CO is also a product of incomplete combustion, higher combustion temperatures benefit its formation to some degree). The higher raw NOx formation of WHTC also indicates its higher combustion temperature (also corresponding to higher combustion efficiencies).
Finally, after aftertreatment purification, all emitted pollutants were lower than the regulation limits after the application of catalysts. For CO, the results even meet regulation demands without aftertreatment. For HC and CO, they almost decrease to zero (only a very small portion of WHTC can be observed). Moreover, the tailpipe-specific HC and CO emissions of the current study were lower than those of Bai et al. [11], who also performed tests under WHTC. For NOx, the conversion efficiency is 98% and 97.8% for WHTC and RSRDC, respectively. Additionally, PN is about one order of magnitude lower than the regulation limit (6 × 10¹¹ #/kW·h). Next, some operation parameters (such as exhaust temperature and operating point distribution) were combined, and detailed pollutant formation and purification processes were analyzed.

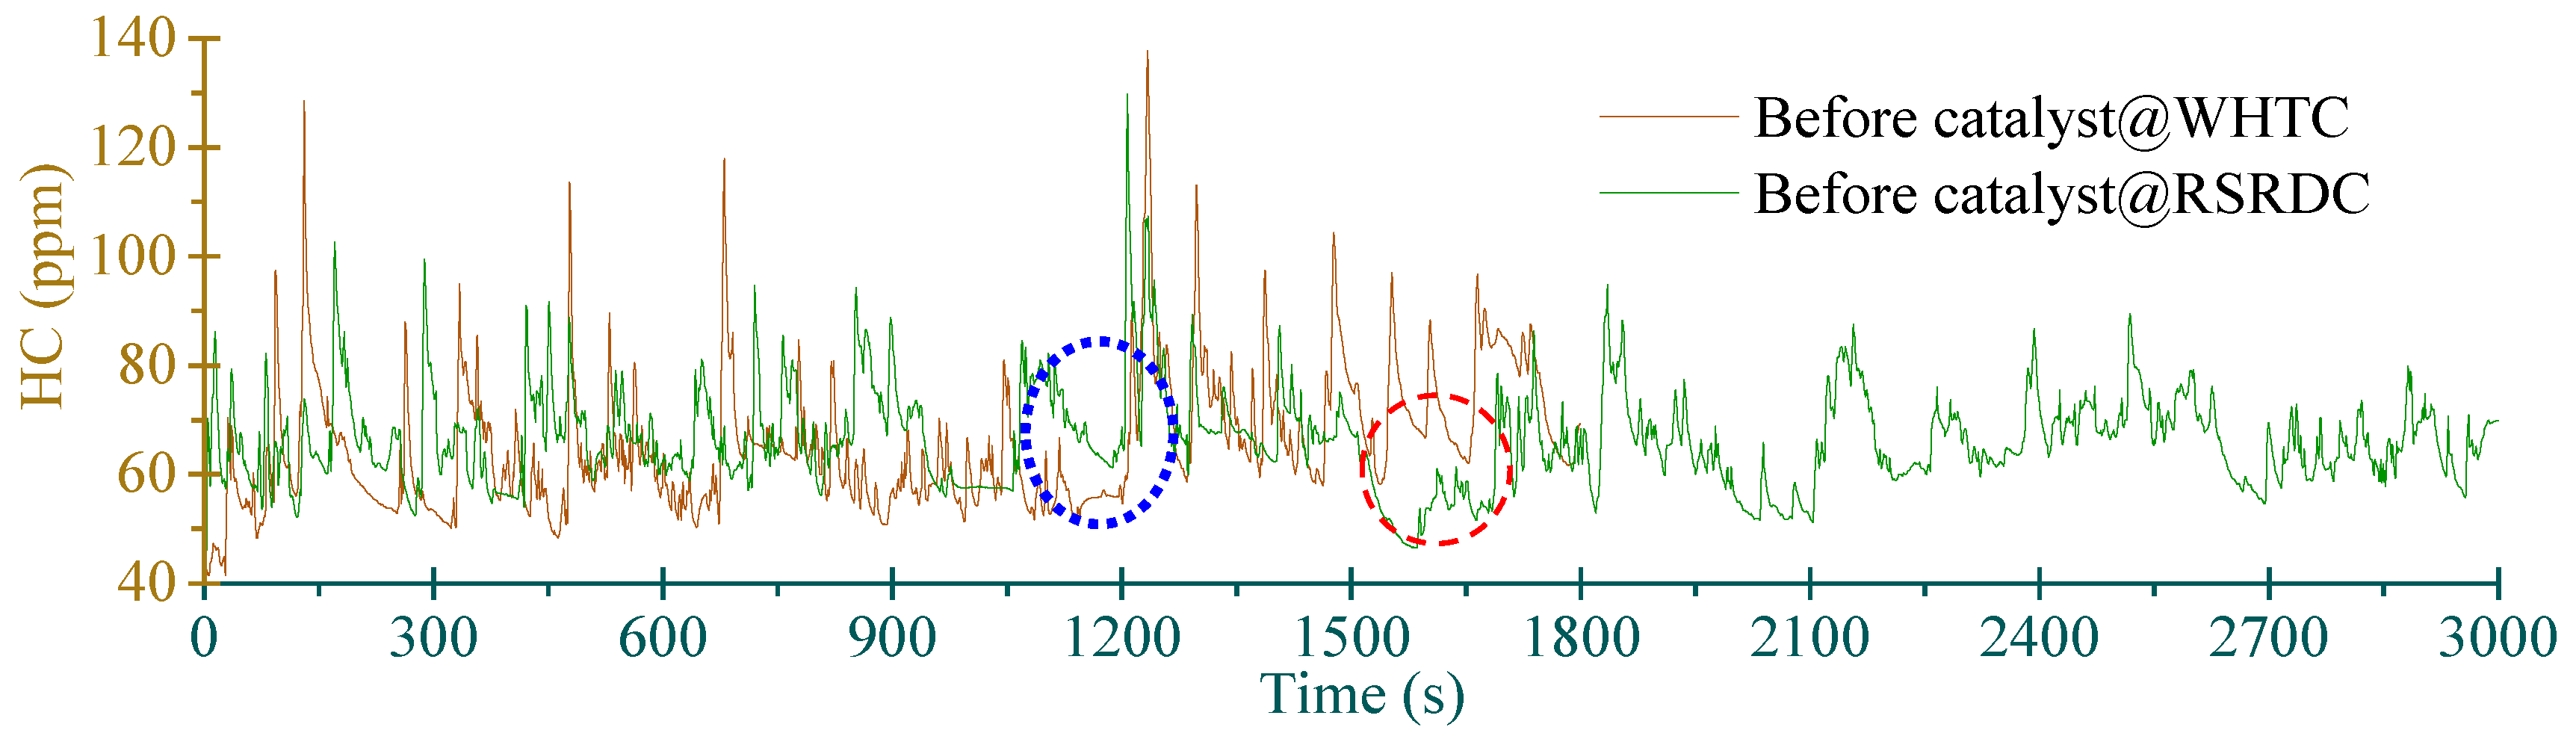
3.2. Transient Emissions: HC

The tailpipe HC emission (after catalyst) curves for both cycles are flat, and the values are very close to zero. Thus, only the values of raw emissions are provided in Figure 6. Indeed, for diesel engines (especially for meeting the national six-stage emission regulation), HC emissions are very low under the hot start cycle, while under cold start cycles, engines require a relatively richer fuel/air ratio to maintain cold drivability [36], resulting in higher raw HC emissions [37]. Returning to the current investigation, under hot start cycles, the operating point is a key factor that impacts emissions. A fast load change will generate higher HC levels [38]. For instance, at approximately 1250 s, WHTC generates more HC than RSRDC, and this is mainly due to the more drastic load change in WHTC (see Figure 2). However, overall, RSRDC emitted more HC as it had more operating points that were located in the low-efficiency zone (e.g., Figure 4 and Figure 5), as shown in Figure 2; the shaded zones further indicate that the amplitude of the fluctuation of RSRDC (especially for engine loads) is higher than that of WHTC.
Additionally, lower flame temperatures (especially for post-flame) lead to higher HC levels because these mixtures within the crevice volume are released during the post-combustion stage, and temperatures that are too low hinder their oxidation. We did not measure in-cylinder temperatures during the experiments; thus, exhaust temperatures were used to indirectly reflect the chamber’s status, as shown in Figure 7. However, the operating point also needs to be combined in order to explain pollutant formation. For example, at approximately 1600 s (marked by a red circle), the exhaust temperature of RSRDC was low because engine load and speeds were very low (the vehicle decelerated; see Figure 2); thus, HC emissions were very low. However, at close to 1120 s (marked by a blue circle), the exhaust temperature was almost the same for both cycles, but the raw HC of RSRDC was higher relative to WHTC. During this phase, the RSRDC has higher speed and lower load spans (Figure 2); thus, even the energy input from the two cycles was similar. RSRDC combustion was worse than WHTC due to lower atomization/combustion times at high speeds, resulting in increased HC emissions.
As investigated by Kang et al. [39], at a ratio of Pt:Pd = 1:1 (which is very close to the ratio used in this study), the conversion efficiencies of most hydrocarbons (such as C2H4 and C7H8) came close to 100% at 200 °C, except for C2H6 (but this was not detected in diesel engines [40]). Lefort et al. [41] even observed that most light alkenes can be completely converted at about 180 °C, and the light-off temperature of some alkanes (such as propane) is 260–320 °C (this depends on the concentration). As shown in Figure 7, the exhaust temperature is sufficient for completely converting HC; thus, HC levels were close to zero after the application of the catalytic converter in the current investigation.

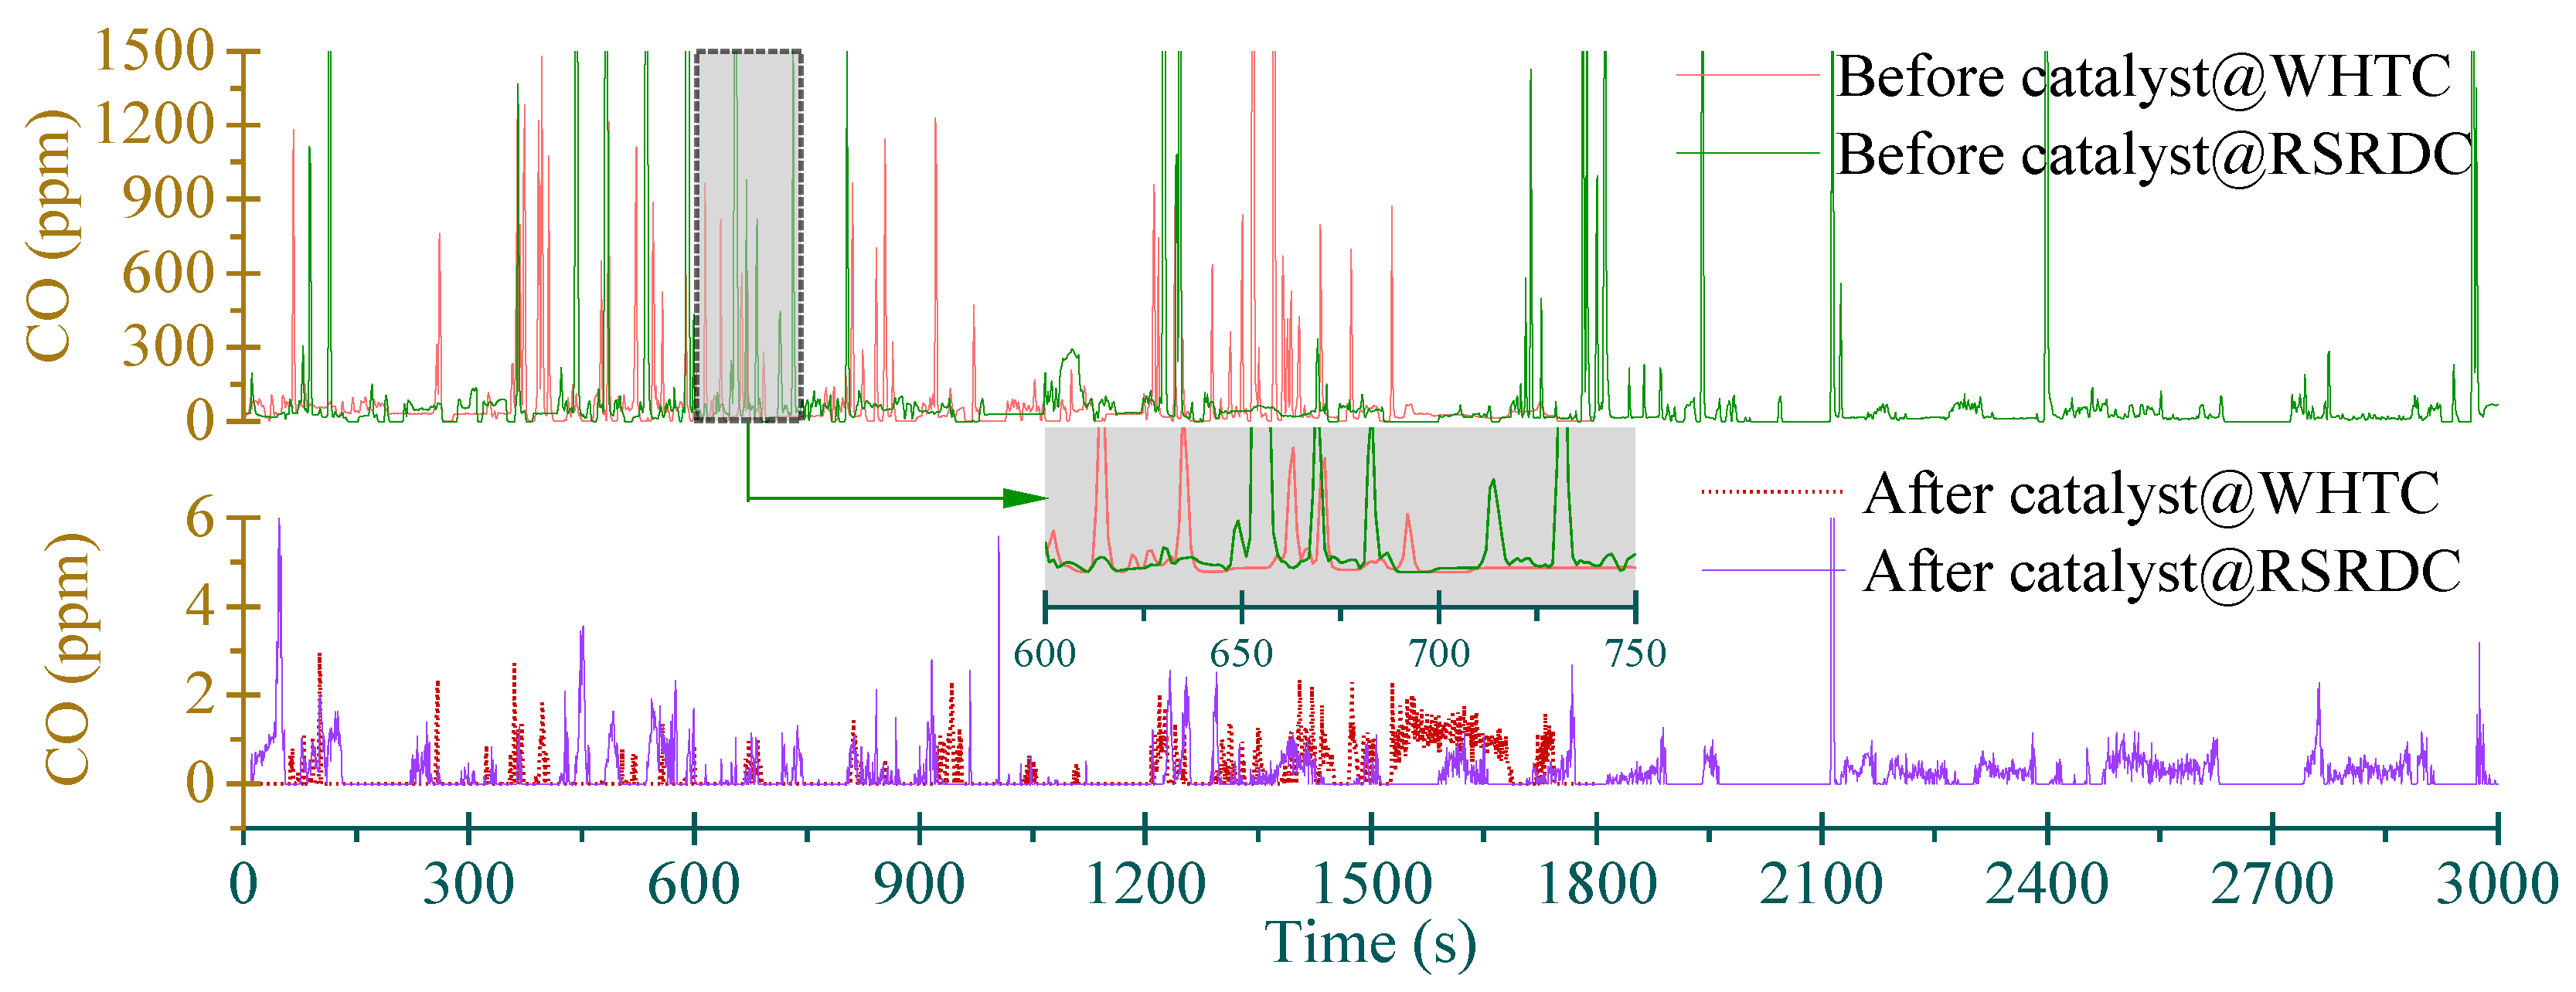
3.3. Transient Emissions: CO

CO emissions were also low for advanced diesel engines, as shown in Figure 8, and as mentioned above, the CO emissions for both cycles meet the newest regulation requirements even without aftertreatment. Compared to HC, CO fluctuates much more sharply during the two cycles. This may mainly be a result of the following: first, unlike HC, CO is a pure component, and its intermediate state is much less than HC. Second, the threshold of CO formation is higher than HC, although both are products of incomplete combustion. Moreover, the formation of CO requires high temperatures (CO products are mainly obtained via the decomposition of HCO) [42]. If combustion temperatures are lower than about 1800 K, CO formation times are long [43]. Thus, engine loads that are too low will hinder CO formation. Third, the absolute value of CO (measured in ppm) is much larger than the value of HC; thus, it appears to be more drastic because of the larger y-axis span (compared between Figure 6 and Figure 8).
Therefore, even the difference in raw HC between the two cycles is large, and the difference in raw CO is small (Figure 3 and Figure 8). The highest value is about 1500 ppm for both cycles. This further verifies the second point above: namely, the RSRDC exhibits more incomplete combustion operating points (see Figure 4 and Figure 5). Therefore, although the RSRDC generates more incomplete combustion products (such as HC or a portion of CO), the combustion temperature of the WHTC is higher relative to RSRDC, which can generate more CO. This factor surpasses incomplete combustion in the CO formation; thus, finally, the WHTC’s raw CO slightly exceeds that of the RSRDC. Additionally, the CO formation phase is different between the two cycles, as shown in Figure 8 (observed more clearly in the shaded zone). This is mainly attributed to the evolution of operating points during the cycles: for example, from 600 to 650 s, the WHTC operates at smaller engine loads (Figure 2) relative to RSRDC; thus, it emits more CO.
As shown in Table 3, the catalyst is Pd/Pt (the relative ratio is 19:20) for DOC (for diesel engines, DOC can almost completely convert CO [44]). This grouping is good for CO conversion, because Pt can lower CO’s light-off temperature [45] and Pd favors conversion under higher temperatures [46]. Thus, CO is oxidized to near-zero levels (Figure 3 or Figure 8) via the catalytic reactor, and this is mainly carried out by reactions (7)–(9) (where * is the active site on the catalyst’s surface) [47].
CO + OH = CO2 + H
CO* + O* = CO2* + *
CO* + OH* = CO2* + H*

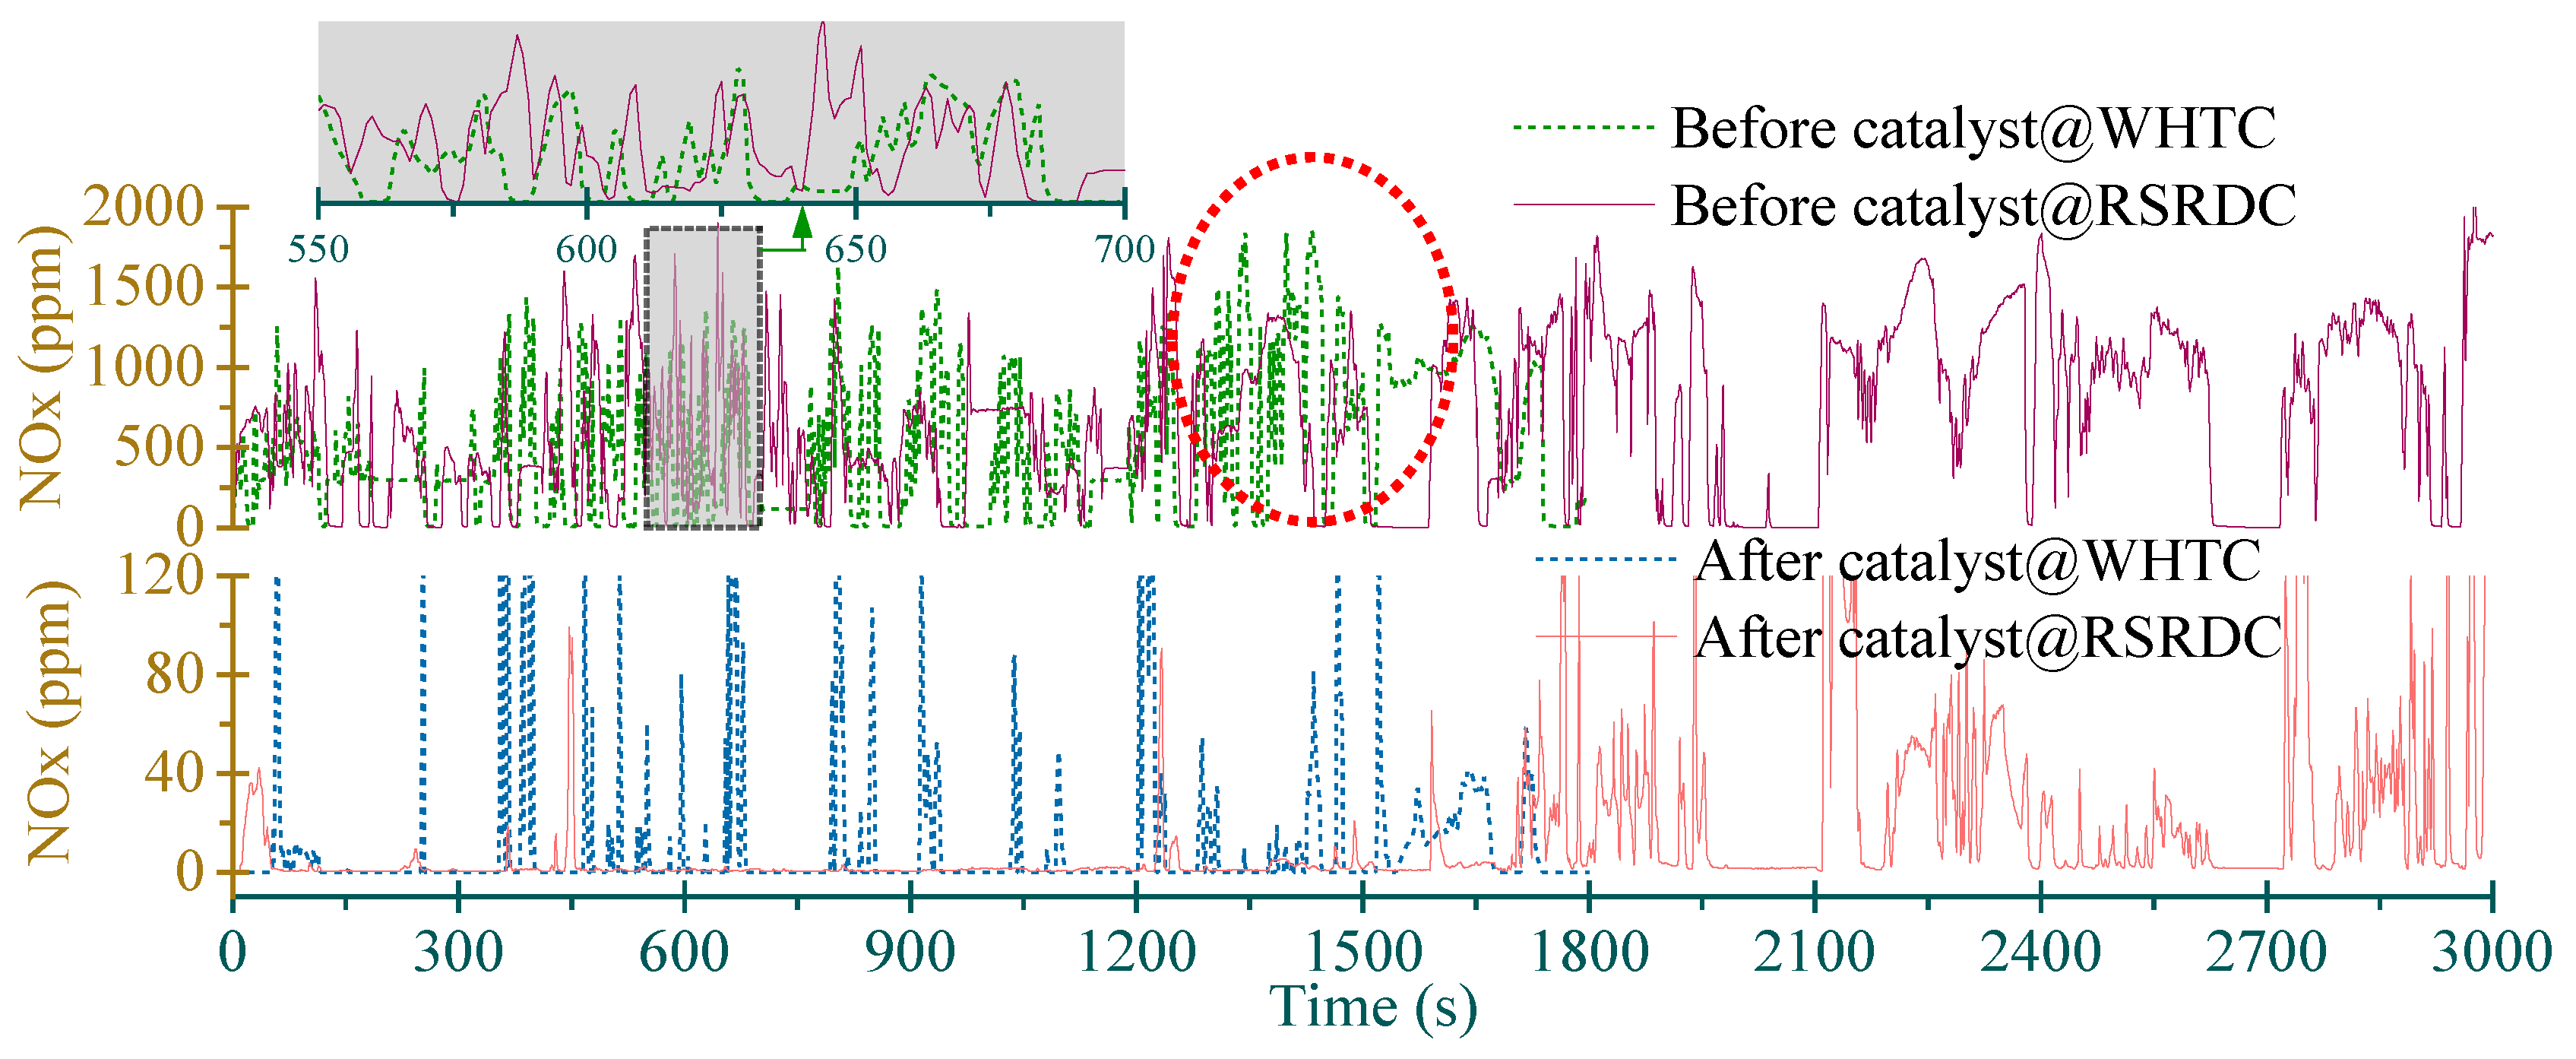
3.4. Transient Emissions: NOx

As shown in Figure 3, the overall NOx of WHTC is higher than that of RSRDC, and this illustrates that the in-cylinder combustion status of WHTC is better (resulting in higher combustion temperature) relative to RSRDC. We can analyze this phenomenon, from the following perspectives, combined with the transient results shown in Figure 9. Firstly, the peak value of NOx is usually largely formed in slightly lean fuel/air mixtures, but in conditions that are too lean, NOx exhibits fewer formations because flame temperatures are too low for generating atomic oxygen [48]. For example, for gasoline engines, NOx is favored within the range of excess air coefficients: (λ) = 1.05–1.08 [49]. Moreover, from our previous study [50], the NOx emissions of diesel engine concentrates are observed at approximately λ = 1.1–1.3, which is a leaner and wider emission line than that observed in gasoline engines. In the current study, λ can be calculated indirectly via the intake’s air flow rate and fuel consumption rate, and the average λ is 8.6 and 7.8 under the WHTC and RSRDC (λ values above 25 are omitted), respectively. From our previous study [51], it was also observed that diesel engines always operate at substantially leaner levels than the favored NOx range. Although the average λ of RSRDC is lower relative to WHTC, the evolutions (not shown here) show that the λ of RSRDC changes more drastically, and WHTC exhibits a higher proportion of operating points that are concentrated at λ = 2–3. This means that WHTC operations exhibit better combustion (fuel consumption is slightly lower than RSRDC), resulting in higher combustion temperatures. Thus, combustion temperatures contribute to the difference in NOx formation between the two cycles to a large extent. For example, during the period at approximately 600 s (marked by the shadow zone in Figure 9), the exhaust temperature of WHTC is lower than that of RSRDC (Figure 7). Thus, WHTC emits lower NOx levels relative to RSRDC. On the contrary, at approximately 1500 s (marked by the dotted red circle in Figure 9), the exhaust temperature of WHTC is much higher than that of RSRDC (Figure 7). Thus, during this phase, WHTC emits much higher NOx levels than RSRDC. Additionally, for both cycles, the NOx formation amount generally increases with time because there is an increase in temperature (Figure 7).
However, with respect to the NOx conversion, it is not linearly dependent on exhaust temperatures. From Ref. [45], the highest NOx conversion temperature window is 300–350 °C, while Khivantsev et al. [52] observed that in Cu-zeolite SCR (the catalyst used in the current study), the requirement for temperatures is low, but nitrosyl ions (NO+) are the key intermediates for NO reduction. Thus, the exhaust temperature is sufficient for SCR, but during the late stage of the RSRDC, NOx levels are still high (lower panel of Figure 9). Therefore, other factors need to be considered, such as the space velocity of exhaust gas. The connection between space velocity and NOx conversion efficiency is provided in Figure 10, along with data from Santos and Costa [53]. Overall, the tendency is not as clear as that reported by Santos and Costa [53] (see the zones marked by blue circles), because the space velocity range they tested is much wider. However, indeed, NOx conversion efficiency decreases relative to space velocity. Under some operating points (marked in the circle), it drops drastically; this means that some other factors also contribute to NOx conversion (this topic will be our concern in future studies). Nevertheless, the overall NOx conversion is very high (see Figure 3).

3.5. Transient Emissions: PN

Compared to our previous study on a non-road diesel engine [51], the PN−specific emission of the current study is one order of magnitude higher. Moreover, from transient results, as shown in Figure 11, the current PN emission rate is one order of magnitude higher. Jathar et al. [54] observed that engines emitted more PM2.5 and elemental carbon (EC) during idle operations compared to loading conditions, while Huang et al. [55] demonstrated that PN increases with respect to the load. In this study, PM is also measured by counting numbers (this means that almost all PM components are soot). As shown in Figure 11b, overall, the PN emission rate changes relative to engine loads. However, at very high loads (for example, at approximately 1395 s), combustion temperatures may be too high, which hinders the formation of heavier polycyclic aromatic hydrocarbons (PAHs, which are important soot precursors) as they are decomposed. Moreover, the radicals that assist PAH growth may be lower in number at very high temperatures [56]. This finding is similar to that of Simonen et al. [57]. In addition, Napolitano et al. [58] experimentally observed that long idle phases were characterized by low particle emissions, and this was evidenced via the phase of 75–125 s of the WHTC operation (Figure 11a).
Comparing WHTC and RSRDC operations, the PN-specific emission is very close for both cycles (that of WHTC is very slightly higher; see Figure 3). However, the PN rate’s evolution is different from WHTC to RSRDC. During the first 200 s (Figure 11a), overall, the PN rate of RSRDC is higher relative to WHTC, but during the first 30 s, WHTC emits substantially more particles, and this may be because combustion deteriorates more during the start stage as the engine’s speed and load are both lower. On the contrary, at the stage of 1300–1500 (Figure 11b), the combustion status is generally good (see Figure 7; the exhaust temperature is higher for WHTC) and also emits the most particles for WHTC operations (thus, WHTC generates more PN than RSRDC). Therefore, improved combustion tends to generate carbon components that are close to being pure (smaller particles). Thus, there is an increase in PN (but the particulate weight may be lighter). Additionally, an increase in dynamical engine load change in WHTC also contributes to higher PN emissions during this stage.

4. Conclusions

In the present study, detailed comparative experiments between WHTC and RSRDC (which were derived from road tests) were carried out. Gaseous and particulate pollutants, along with some engine operation parameters, were measured transiently. Some important findings were obtained. The BSFC of WHTC and RSRDC was 201.8 and 210 g/kW·h, respectively, and the operating point distribution for both cycles was also analyzed. The real road driving cycle (RSRDC) had wider operating point distributions, and more points were located in the low-efficiency zone relative to WHTC. Thus, WHTC operations achieved higher raw CO (abundant CO formation needed a specific temperature threshold) and NOx levels but lower HC levels. However, with aftertreatment, all pollutants (including gaseous and particulate) met the newest Chinese regulation limit (even the raw CO met this requirement). Finally, transient emissions were analyzed in detail. Similar specific emissions of some species between the two cycles existed, while detailed processes may largely be different between them. For example, PN-specific emissions were very close between WHTC and RSRDC. However, during the first 200 s, the WHTC emitted fewer particles (while it emitted more particles during the first 30 s). On the contrary, at the stage of 1300–1500, the WHTC generated more particles due to its better combustion status and more drastic change in engine load. Therefore, although both cycles can meet emission limitations from the viewpoint of regulations, the operating points and detailed pollutant generation process were different among them. Thus, the results of the current study are meaningful, and they can enhance our understanding with respect to the difference between regulatory tests and real driving conditions. Of course, only one driving route was tested in the current study, and more road tests (including more driving routes and more weight-loaded cases) are needed to expand the scope of this investigation.

Author Contributions

Conceptualization, B.D.; methodology, L.Z.; validation, W.Y. and C.S.; formal analysis, C.S.; writing—original draft preparation, B.D.; writing—review and editing, W.Y.; project administration, L.Z.; funding acquisition, L.Z. All authors have read and agreed to the published version of the manuscript.

Funding

This research was funded by Shenzhen Polytechnic Research Foundation, grant number 6021310020K and LHRC20200402; Department of Natural Resources Guangdong Province, China, grant numbers 2022-32 and 2023-51; and program for scientific research start-up funds of Guangdong Ocean University.

Data Availability Statement

The data presented in this study are available on request from the corresponding author.

Conflicts of Interest

The authors declare no conflict of interest.

Abbreviations

WHTCworld harmonized transient cycle
RSRDCroad spectrum reversely deduced cycle
ICEsinternal combustion engines
COcarbon monoxide
HChydrocarbon
THCtotal hydrocarbon
NOxoxynitride
PMparticulate matter
PNparticle number
EUEuropean Union
NEDCnew European driving cycle
WLTPworldwide harmonized light-duty test procedure
DOCdiesel oxidation catalyst
WHVCworld harmonized vehicle cycle
VECTOvehicle energy consumption calculation tool
DMDFdual-mode dual-fuel
RCCIreactivity-controlled compression ignition
CDCconventional diesel combustion
LPGliquefied petroleum gas
PEMSportable emissions measurement system
OBMon-board monitoring
DPFdiesel particulate filter
SCRselective catalytic reduction
ASCammonia slip catalyst
EGRexhaust gas recirculation
HDVheavy-duty vehicle
GPSglobal positioning system
OBDon-board diagnostics
FIDflame ionization detector
NMHCnon-methane hydrocarbon
NMC-FIDflame ionization detector with non-methane cutter
NDIRnon-dispersive infrared
CLDchemiluminescence detector
BSEbrake-specific emission
BSFCbrake-specific fuel consumption
ECelemental carbon
PAHspolycyclic aromatic hydrocarbons

References

  1. Duan, X.; Feng, L.; Liu, H.; Jiang, P.; Chen, C.; Sun, Z. Experimental investigation on exhaust emissions of a heavy-duty vehicle powered by a methanol-fuelled spark ignition engine under world Harmonized Transient Cycle and actual on-road driving conditions. Energy 2023, 282, 128869. [Google Scholar] [CrossRef]
  2. Deng, B.; Chen, Z.; Sun, C.; Zhang, S.; Yu, W.; Huang, M.; Hou, K.; Ran, J.; Zhou, L.; Chen, C.; et al. Key design and layout factors influencing performance of three-way catalytic converters: Experimental and semidecoupled numerical study under real-life driving conditions. J. Clean. Prod. 2023, 425, 138993. [Google Scholar] [CrossRef]
  3. China Mobile Source Environmental Management Annual Report. Ministry of Ecology and Environment of the People’s Republic of China. 2022. Available online: https://www.mee.gov.cn/hjzl/sthjzk/ydyhjgl/202212/t20221207_1007111.shtml (accessed on 28 April 2023). (In Chinese)
  4. Wu, Y.; Zhang, S.; Hao, J.; Liu, H.; Wu, X.; Hu, J.; Walsh, M.P.; Wallington, T.J.; Zhang, K.M.; Stevanovic, S. On-road vehicle emissions and their control in China: A review and outlook. Sci. Total Environ. 2017, 574, 332–349. [Google Scholar] [CrossRef] [PubMed]
  5. Costagliola, M.A.; Costabile, M.; Prati, M.V. Impact of road grade on real driving emissions from two Euro 5 diesel vehicles. Appl. Energy 2018, 231, 586–593. [Google Scholar] [CrossRef]
  6. Gordon, T.D.; Presto, A.A.; Nguyen, N.T.; Robertson, W.H.; Na, K.; Sahay, K.N.; Zhang, M.; Maddox, C.; Rieger, P.; Chattopadhyay, S.; et al. Secondary organic aerosol production from diesel vehicle exhaust: Impact of aftertreatment, fuel chemistry and driving cycle. Atmos. Meas. Tech. 2014, 14, 4643–4659. [Google Scholar] [CrossRef]
  7. Giraldo, M.; Huertas, J.I. Real emissions, driving patterns and fuel consumption of in-use diesel buses operating at high altitude. Transp. Res. Part D 2019, 77, 21–36. [Google Scholar] [CrossRef]
  8. Shahariar, G.H.; Bodisco, T.A.; Zare, A.; Sajjad, M.; Jahirul, M.; Van, T.C.; Bartlett, H.; Ristovski, Z.; Brown, R.J. Impact of driving style and traffic condition on emissions and fuel consumption during real-world transient operation. Fuel 2022, 319, 123874. [Google Scholar] [CrossRef]
  9. Bodisco, T.; Zare, A. Practicalities and Driving Dynamics of a Real Driving Emissions (RDE) Euro 6 Regulation Homologation Test. Energies 2019, 12, 2306. [Google Scholar] [CrossRef]
  10. GB 17691-2018; Limits and Measurement Methods for Emissions from Diesel Fuelled Heavy-Duty Vehicles (CHINA VI). National Standard of The People’s Republic of China: Beijing, China, 2018. (In Chinese)
  11. Bai, S.; Han, J.; Liu, M.; Qin, S.; Wang, G.; Li, G. Experimental investigation of exhaust thermal management on NOx emissions of heavy-duty diesel engine under the world Harmonized transient cycle (WHTC). Appl. Therm. Eng. 2018, 142, 421–432. [Google Scholar] [CrossRef]
  12. Wu, D.; Deng, B.; Li, M.; Fu, J.; Hou, K. Improvements on performance and emissions of a heavy duty diesel engine by throttling degree optimization: A steady-state and transient experimental study. Chem. Eng. Process. Process. Intensif. 2020, 157, 108132. [Google Scholar] [CrossRef]
  13. Duan, L.-S.; Tan, P.-Q.; Liu, J.-T.; Liu, Y.; Chen, Y.-J.; Lou, D.-M.; Hu, Z.-Y. Emission characteristics of a diesel engine with an electrically heated catalyst under cold start conditions. J. Clean. Prod. 2022, 380, 134965. [Google Scholar] [CrossRef]
  14. Fontaras, G.; Grigoratos, T.; Savvidis, D.; Anagnostopoulos, K.; Luz, R.; Rexeis, M.; Hausberger, S. An experimental evaluation of the methodology proposed for the monitoring and certification of CO2 emissions from heavy-duty vehicles in Europe. Energy 2016, 102, 354–364. [Google Scholar] [CrossRef]
  15. García, A.; Monsalve-Serrano, J.; Roso, V.R.; Martins, M.E.S. Evaluating the emissions and performance of two dual-mode RCCI combustion strategies under the World Harmonized Vehicle Cycle (WHVC). Energy Convers. Manag. 2017, 149, 263–274. [Google Scholar] [CrossRef]
  16. Baek, S.; Kim, K.; Cho, J.; Myung, C.-L.; Park, S. Assessment of gaseous, particulate, and unregulated emissions from diesel compression ignition and LPG direct injection spark ignition minibus vehicles under the world harmonized vehicle cycle on a chassis dynamometer. Fuel 2021, 294, 120392. [Google Scholar] [CrossRef]
  17. Park, J.; Shin, M.; Lee, J.; Lee, J. Estimating the effectiveness of vehicle emission regulations for reducing NOx from light-duty vehicles in Korea using on-road measurements. Sci. Total Environ. 2021, 767, 144250. [Google Scholar] [CrossRef]
  18. O’Driscoll, R.; ApSimon, H.M.; Oxley, T.; Molden, N.; Stettler, M.E.; Thiyagarajah, A. A Portable Emissions Measurement System (PEMS) study of NOx and primary NO2 emissions from Euro 6 diesel passenger cars and comparison with COPERT emission factors. Atmos. Environ. 2016, 145, 81–91. [Google Scholar] [CrossRef]
  19. Zhang, S.; Zhao, P.; He, L.; Yang, Y.; Liu, B.; He, W.; Cheng, Y.; Liu, Y.; Liu, S.; Hu, Q.; et al. On-board monitoring (OBM) for heavy-duty vehicle emissions in China: Regulations, early-stage evaluation and policy recommendations. Sci. Total Environ. 2020, 731, 139045. [Google Scholar] [CrossRef]
  20. Zhang, Q.; Wu, L.; Yang, Z.; Zou, C.; Liu, X.; Zhang, K.; Mao, H. Characteristics of gaseous and particulate pollutants exhaust from logistics transportation vehicle on real-world conditions. Transp. Res. Part D 2016, 43, 40–48. [Google Scholar] [CrossRef]
  21. Yu, Q.; Yang, Y.; Xiong, X.; Sun, S.; Liu, Y.; Wang, Y. Assessing the impact of multi-dimensional driving behaviors on link-level emissions based on a Portable Emission Measurement System (PEMS). Atmos. Pollut. Res. 2021, 12, 414–424. [Google Scholar] [CrossRef]
  22. Yao, Z.; Wu, B.; Wu, Y.; Cao, X.; Jiang, X. Comparison of NOx emissions from China III and China IV in-use diesel trucks based on on-road measurements. Atmos. Environ. 2015, 123, 1–8. [Google Scholar] [CrossRef]
  23. Zhu, X.-H.; He, H.-D.; Lu, K.-F.; Peng, Z.-R.; Gao, H.O. Characterizing carbon emissions from China V and China VI gasoline vehicles based on portable emission measurement systems. J. Clean. Prod. 2022, 378, 134458. [Google Scholar] [CrossRef]
  24. Papadopoulos, G.; Ntziachristos, L.; Tziourtzioumis, C.; Keramydas, C.; Lo, T.-S.; Ng, K.-L.; Wong, H.-L.A.; Wong, C.K.-L. Real-world gaseous and particulate emissions from Euro IV to VI medium duty diesel trucks. Sci. Total Environ. 2020, 731, 139137. [Google Scholar] [CrossRef] [PubMed]
  25. Giechaskiel, B.; Schwelberger, M.; Delacroix, C.; Marchetti, M.; Feijen, M.; Prieger, K.; Andersson, S.; Karlsson, H.L. Experimental assessment of solid particle number Portable Emissions Measurement Systems (PEMS) for heavy-duty vehicles applications. J. Aerosol Sci. 2018, 123, 161–170. [Google Scholar] [CrossRef]
  26. Giechaskiel, B.; Clairotte, M.; Valverde-Morales, V.; Bonnel, P.; Kregar, Z.; Franco, V.; Dilara, P. Framework for the assessment of PEMS (Portable Emissions Measurement Systems) uncertainty. Environ. Res. 2018, 166, 251–260. [Google Scholar] [CrossRef]
  27. Rodríguez, R.A.; Virguez, E.A.; Rodríguez, P.A.; Behrentz, E. Influence of driving patterns on vehicle emissions: A case study for Latin American cities. Transp. Res. Part D 2016, 43, 192–206. [Google Scholar] [CrossRef]
  28. Zhang, S.; Peng, D.; Li, Y.; Zu, L.; Fu, M.; Yin, H.; Ding, Y. Study on the real-world emissions of rural vehicles on different road types. Environ. Pollut. 2021, 273, 116453. [Google Scholar] [CrossRef] [PubMed]
  29. Lv, Z.F.; Zhang, Y.Z.; Ji, Z.; Deng, F.Y.; Shi, M.S.; Li, Q.W.; He, M.; Xiao, L.; Huang, Y.N.; Liu, H.; et al. A real-time NOx emission inventory from heavy-duty vehicles based on on-board diagnostics big data with acceptable quality in China. J. Clean. Prod. 2023, 422, 138592. [Google Scholar] [CrossRef]
  30. Malik, M.; Nandal, R. A framework on driving behavior and pattern using On-Board diagnostics (OBD-II) tool. Mater. Today: Proc. 2021, 80, 3762–3768. [Google Scholar] [CrossRef]
  31. EU: Heavy-Duty Truck and Bus Engines: OCE and ISC PEMS Testing. Available online: https://dieselnet.com/standards/eu/hd_isc.php (accessed on 1 December 2023).
  32. Zheng, X.; He, L.; He, X.; Zhang, S.; Cao, Y.; Hao, J.; Wu, Y. Real-Time Black Carbon Emissions from Light-Duty Passenger Vehicles Using a Portable Emissions Measurement System. Engineering 2022, 16, 73–81. [Google Scholar] [CrossRef]
  33. Mickūnaitis, V.; Pikūnas, A.; Mackoit, I. Reducing Fuel Consumption and CO2 Emission in Motor Cars. Transport 2007, 22, 160–163. [Google Scholar] [CrossRef]
  34. Shim, E.; Park, H.; Bae, C. Intake air strategy for low HC and CO emissions in dual-fuel (CNG-diesel) premixed charge com-pression ignition engine. Appl. Energy 2018, 225, 1068–1077. [Google Scholar] [CrossRef]
  35. Yildiz; Caliskan, H.; Mori, K. Effects of cordierite particulate filters on diesel engine exhaust emissions in terms of pollution prevention approaches for better environmental management. J. Environ. Manag. 2021, 293, 112873. [Google Scholar] [CrossRef] [PubMed]
  36. Iliyas; Zahedi-Niaki, H.M.; Eić, M. One-dimensional molecular sieves for hydrocarbon cold-start emission control: Influence of water and CO2. Appl. Catal. A Gen. 2010, 382, 213–219. [Google Scholar] [CrossRef]
  37. Iodice, P.; Senatore, A.; Langella, G.; Amoresano, A. Effect of ethanol–gasoline blends on CO and HC emissions in last generation SI engines within the cold-start transient: An experimental investigation. Appl. Energy 2016, 179, 182–190. [Google Scholar] [CrossRef]
  38. Kozina; Radica, G.; Nižetić, S. Analysis of methods towards reduction of harmful pollutants from diesel engines. J. Clean. Prod. 2020, 262, 121105. [Google Scholar] [CrossRef]
  39. Kang, S.B.; Hazlett, M.; Balakotaiah, V.; Kalamaras, C.; Epling, W. Effect of Pt:Pd ratio on CO and hydrocarbon oxidation. Appl. Catal. B Environ. 2018, 223, 67–75. [Google Scholar] [CrossRef]
  40. Schauer, J.J.; Kleeman, M.J.; Cass, G.R.; Simoneit, B.R.T. Measurement of Emissions from Air Pollution Sources. 2. C1 through C30 Organic Compounds from Medium Duty Diesel Trucks. Environ. Sci. Technol. 1999, 33, 1578–1587. [Google Scholar] [CrossRef]
  41. Lefort; Herreros, J.M.; Tsolakis, A. Reduction of Low Temperature Engine Pollutants by Understanding the Exhaust Species Interactions in a Diesel Oxidation Catalyst. Environ. Sci. Technol. 2014, 48, 2361–2367. [Google Scholar] [CrossRef]
  42. Westbrook, C.K.; Dryer, F.L. Chemical kinetic modeling of hydrocarbon combustion. Prog. Energy Combust. Sci. 1984, 10, 1–57. [Google Scholar] [CrossRef]
  43. Bougrine, S.; Richard, S.; Michel, J.-B.; Veynante, D. Simulation of CO and NO emissions in a SI engine using a 0D coherent flame model coupled with a tabulated chemistry approach. Appl. Energy 2014, 113, 1199–1215. [Google Scholar] [CrossRef]
  44. Chen, D.; Wang, T.; Yang, T.; Li, G.; Chen, Y.; Qiao, T. Effects of EGR combined with DOC on emission characteristics of a two-stage injected Fischer-Tropsch diesel/methanol dual-fuel engine. Fuel 2022, 329, 125451. [Google Scholar] [CrossRef]
  45. Hauff, K.; Tuttlies, U.; Eigenberger, G.; Nieken, U. A global description of DOC kinetics for catalysts with different platinum loadings and aging status. Appl. Catal. B Environ. 2010, 100, 10–18. [Google Scholar] [CrossRef]
  46. Simmance, K.; Thompsett, D.; Wang, W.; Thiebaut, B. Evaluation of perovskite catalysts prepared by flame spray pyrolysis for three-way catalyst activity under simulated gasoline exhaust feeds. Catal. Today 2019, 320, 40–50. [Google Scholar] [CrossRef]
  47. Zeng, F.; Hohn, K.L. Modeling of three-way catalytic converter performance with exhaust mixture from natural gas-fueled engines. Appl. Catal. B Environ. 2016, 182, 570–579. [Google Scholar] [CrossRef]
  48. Saravanan, S.; Nagarajan, G.; Anand, S.; Sampath, S. Correlation for thermal NOx formation in compression ignition (CI) engine fuelled with diesel and biodiesel. Energy 2012, 42, 401–410. [Google Scholar] [CrossRef]
  49. Dernotte, J.; Mounaim-Rousselle, C.; Halter, F.; Seers, P. Evaluation of Butanol–Gasoline Blends in a Port Fuel-injection, Spark-Ignition Engine. Oil Gas Sci. Technol. Rev. IFP 2010, 65, 345–351. [Google Scholar] [CrossRef]
  50. Feng, R.; Li, G.; Sun, Z.; Hu, X.; Deng, B.; Fu, J. Potential of emission reduction of a turbo-charged non-road diesel engine without aftertreatment under multiple operating scenarios. Energy 2023, 263, 125832. [Google Scholar] [CrossRef]
  51. Hu, S.; Deng, B.; Wu, D.; Hou, K. Energy flow behavior and emission reduction of a turbo-charging and EGR non-road diesel engine equipped with DOC and DPF under NRTC (non-road transient cycle). Fuel 2021, 305, 121571. [Google Scholar] [CrossRef]
  52. Khivantsev, K.; Kwak, J.-H.; Jaegers, N.R.; Koleva, I.Z.; Vayssilov, G.N.; Derewinski, M.A.; Wang, Y.; Aleksandrov, H.A.; Szanyi, J. Identification of the mechanism of NO reduction with ammonia (SCR) on zeolite catalysts. Chem. Sci. 2022, 13, 10383–10394. [Google Scholar] [CrossRef]
  53. Santos, H.; Costa, M. Evaluation of the conversion efficiency of ceramic and metallic three way catalytic converters. Energy Convers. Manag. 2008, 49, 291–300. [Google Scholar] [CrossRef]
  54. Jathar, S.H.; Sharma, N.; Galang, A.; Vanderheyden, C.; Takhar, M.; Chan, A.W.; Pierce, J.R.; Volckens, J. Measuring and modeling the primary organic aerosol volatility from a modern non-road diesel engine. Atmos. Environ. 2020, 223, 117221. [Google Scholar] [CrossRef]
  55. Huang, H.; Zhu, J.; Lv, D.; Wei, Y.; Zhu, Z.; Yu, B.; Chen, Y. Development of a reduced n-heptane-n-butylbenzene-polycyclic aromatic hydrocarbon (PAH) mechanism for engine combustion simulation and soot prediction. Energy 2018, 165, 90–105. [Google Scholar] [CrossRef]
  56. Liu, P.; Li, Z.; Roberts, W.L. The growth of PAHs and soot in the post-flame region. Proc. Combust. Inst. 2019, 37, 977–984. [Google Scholar] [CrossRef]
  57. Simonen, P.; Kalliokoski, J.; Karjalainen, P.; Rönkkö, T.; Timonen, H.; Saarikoski, S.; Aurela, M.; Bloss, M.; Triantafyllopoulos, G.; Kontses, A.; et al. Characterization of laboratory and real driving emissions of individual Euro 6 light-duty vehicles—Fresh particles and secondary aerosol formation. Environ. Pollut. 2019, 255, 113175. [Google Scholar] [CrossRef]
  58. Napolitano, P.; Di Maio, D.; Guido, C.; Borla, E.M.; Torbati, R. Experimental investigation on particulate filters for heavy-duty natural gas engines: Potentialities toward EURO VII regulation. J. Environ. Manag. 2023, 331, 117204. [Google Scholar] [CrossRef]
Figure 1. The diagrammatic demonstration of experimental scenario and procedure.
Energies 17 00007 g001
Figure 2. The operating cycles (WHTC and RSRDC) of engine bench testing.
Energies 17 00007 g002
Figure 3. The brake−specific fuel consumption and emissions of gaseous and particulate emissions for each cycle (the Y−axis of PN is on the right, see the circle and arrow).
Energies 17 00007 g003
Figure 4. The distribution of operating points under two cycles: (a) WHTC, (b) RSRDC.
Energies 17 00007 g004
Figure 5. The proportion distribution of engine operating points estimated from Figure 4.
Energies 17 00007 g005
Figure 6. The HC concentrations before aftertreatment (raw emission) during WHTC and RSRDC cycles.
Energies 17 00007 g006
Figure 7. The transient exhaust temperature during WHTC and RSRDC cycles.
Energies 17 00007 g007
Figure 8. CO concentrations before and after aftertreatment during the WHTC and RSRDC cycles.
Energies 17 00007 g008
Figure 9. The transient NOx emission with and without aftertreatment under two cycles.
Energies 17 00007 g009
Figure 10. The NOx conversion efficiency against exhaust flow space velocity under two cycles, and the results in bottom left−hand corner are adopted from Ref. [53].
Energies 17 00007 g010
Figure 11. The transient PN emission with aftertreatment under two cycles: (a) during 0–200 s phase, (b) during 1300–1500 s phase.
Energies 17 00007 g011
Table 1. Comparison of emission limits between WHTC and PEMS [10].
TitleWHTCPEMS
CO (mg/kW·h)40006000
THC (mg/kW·h)160/
NOx (mg/kW·h)460690
PM (mg/kW·h)10/
PN (#/kW·h)6.0 × 10111.2 × 1012
Table 2. Engine specifications.
ItemContent
Engine typeFour-stroke and in-line six-cylinder, water-cooled
Aspiration modeTurbo-charging with intercooling
Fuel supply modeElectronic control high-pressure common rail, direct injection
Exhaust gas recirculation (EGR) modeHigh-pressure EGR with water-cooler
Bore (mm)132
Stroke (mm)157
Compression ratio18.4
Idle speed (rpm)600 ± 100
Max speed (rpm)2100
Rated power (kW/rpm)412/1800
Max torque (N·m/rpm)2593/1000–1400
Table 3. Parameters of aftertreatment.
ItemDOC
Size (diameter × length)Φ304.8 mm × 127 mm
Cell density (cpsi)400
Catalysts and ratiosPt:Rh:Pd = 19:0:20
Catalyst mass0.74 g/L
Coated material (support)Al2O3
Substrate materialCordierite
Structure patternHoneycomb-shaped monolith
SCR (2 reactors connected in parallel)
Size (diameter × length)Φ304.8 mm × 177.8 (front)/88.9 (rear) mm
Cell density (cpsi)600
CatalystCu-zeolite
Substrate materialCordierite
Structure patternHoneycomb-shaped monolith
ASC
Size (diameter × length)Φ304.8 mm × 63.5 mm
Cell density (cpsi)600
CatalystPt
Catalyst mass0.71 g/L
Coated material (support)Al2O3
Substrate materialCordierite
Structure patternHoneycomb-shaped monolith
DPF
Size (diameter × length)Φ304.8 mm × 203.2 mm
Cell density (cpsi)300
Catalysts and ratiosPt:Rh:Pd = 4:0:1
Catalyst mass0.071 g/L
Coated material (support)Al2O3
Substrate materialCordierite
Structure patternHoneycomb-shaped with wall-flow channels
Table 4. The technical parameters of emission sampling and measurement instruments.
Instrument NameManufacturer/TypeMeasurement RangeAccuracy
Gas sampling systemHoriba CVS-ONE (HORIBA, Ltd., Kyoto, Japan)<30 m3/min/
PM sampling systemHoriba DLS-7200E (HORIBA, Ltd., Kyoto, Japan)65–130 L/min±5.0%
Gas analyzerHoriba MEXA-7200D (HORIBA, Ltd., Kyoto, Japan)CO(L): 0–5000 ppm
CO2: 0–6%vol
HC: 0–2500 ppm
NOx: 10–5000 ppm
CH4: 0–2500 ppm
±1.0% FS
Particle counterHoriba MEXA-2000SPCS (HORIBA, Ltd., Kyoto, Japan)0–50,000 #/cm3 (after dilution)Counting efficiency: 50 ± 12% (23 nm); ≥90% (41 nm)
Disclaimer/Publisher’s Note: The statements, opinions and data contained in all publications are solely those of the individual author(s) and contributor(s) and not of MDPI and/or the editor(s). MDPI and/or the editor(s) disclaim responsibility for any injury to people or property resulting from any ideas, methods, instructions or products referred to in the content.

