Article

Biodiesel from Bark and Black Liquor—A Techno-Economic, Social, and Environmental Assessment

1
Department of Mechanics and Maritime Sciences, Maritime Environmental Sciences, Chalmers University of Technology, Hörselgången 4, 412 96 Gothenburg, Sweden
2
IVL Swedish Environmental Research Institute, Aschebergsgatan 44, 411 33 Gothenburg, Sweden
3
IVL Swedish Environmental Research Institute, Valhallavägen 81, 114 28 Stockholm, Sweden
4
Industrial Process and Energy Systems Engineering (IPESE), École Polytechnique Fédérale de Lausanne, 1951 Sion, Switzerland
*
Author to whom correspondence should be addressed.
Energies 2024, 17(1), 99; https://doi.org/10.3390/en17010099
Submission received: 10 November 2023 / Revised: 12 December 2023 / Accepted: 21 December 2023 / Published: 23 December 2023
(This article belongs to the Special Issue Conversion of Biomass to Fuel and Commodity Chemicals)

Abstract

:
A techno-economic assessment and environmental and social sustainability assessments of novel Fischer–Tropsch (FT) biodiesel production from the wet and dry gasification of biomass-based residue streams (bark and black liquor from pulp production) for transport applications are presented. A typical French kraft pulp mill serves as the reference case and large-scale biofuel-production-process integration is explored. Relatively low greenhouse gas emission levels can be obtained for the FT biodiesel (total span: 16–83 g CO2eq/MJ in the assessed EU countries). Actual process configuration and low-carbon electricity are critical for overall performance. The site-specific social assessment indicates an overall positive social effect for local community, value chain actors, and society. Important social aspects include (i) job creation potential, (ii) economic development through job creation and new business opportunities, and (iii) health and safety for workers. For social risks, the country of implementation is important. Heat and electricity use are the key contributors to social impacts. The estimated production cost for biobased crude oil is about 13 €/GJ, and it is 14 €/GJ (0.47 €/L or 50 €/MWh) for the FT biodiesel. However, there are uncertainties, i.e., due to the low technology readiness level of the gasification technologies, especially wet gasification. However, the studied concept may provide substantial GHG reduction compared to fossil diesel at a relatively low cost.

1. Introduction

To avoid the devastating consequences of climate change due to greenhouse gas (GHG) emissions and to meet global and European climate goals, the use of fossil fuels needs to decrease through energy conservation, increased energy efficiency, and switching to non-fossil-energy sources [1,2]. In the transport sector, which accounts for 22% of global carbon dioxide (CO2) emissions, a switch to renewable resources is vital [3,4]. In 2018, domestic and international transport in the European Union (EU), the world’s third-largest emitter of GHGs, were responsible for 29% of total EU GHG emissions [5].
About 62% of all European newly registered vehicles in 2021 consisted of diesel- and petrol-driven vehicles [6]. However, low-carbon renewable fuels and alternative powertrains such as electric vehicles still account for only a minor share of the vehicle fleet due to the renewal time of the fleet. The average age of EU cars is 12 years [7]. The share of electric vehicles is increasing, mainly for smaller vehicles, as it is more challenging to electrify heavy transport and aviation [8]. Particularly in the short and medium terms, biomass-based transport fuels (biofuels) and other non-fossil fuels need to be introduced to a greater extent. The share of energy from renewable sources used for transport in the EU preliminarily reached 10.2% in 2021 [9]. Except for Sweden, Finland, and Estonia, most countries have not yet reached the 14% target in the updated Renewable Energy Directive (REDII) [10].
Policies and targets for the introduction of renewable fuels in the EU member states vary. Sweden, Germany, and Czechia promote the use of biofuels with relatively high GHG emission reduction potential [11], and some member states have specific targets for advanced biofuels increasing from, for example, 0.05% in Germany and 0.5% in Finland in 2020 to 0.5% and 10% in 2025 and 2030, respectively [11,12]. When referring to advanced biofuels, the European Commission addresses the conversion of specific feedstocks, mainly waste and residue streams [10,10], which are in focus in this paper.
Biodiesel may be used in conventional diesel engines to fully substitute fossil diesel or through blending. Biodiesel can be produced from various biomass feedstocks such as crops conventionally used for food production, dedicated energy crops, and agricultural or forest residues. The use of residues is less critical in terms of land use, deforestation, competition with food production, and water depletion during oil crop cultivation, and is promoted in REDII [13,14,15,16].
Bark and black liquor are significant residue streams extracted from pulp industry processes, currently burned to generate steam and electricity for the pulping process while the cooking chemicals required for the pulping process are recovered. However, they may be further processed and converted to more valuable products like transport biofuels, promoting a more efficient resource use. Globally, the pulp and paper industries produce about 170 million tonnes of black liquor (as dry solids) yearly, with a total energy content of about 2 EJ (560 TWh) [17]. Thus, black liquor represents a significant biomass source in countries with large pulp and paper industries such as Sweden and Finland [17]. A quantity of about 12 million tonnes of bark is also generated by European pulp mills [17], and about 6 million tonnes of bark at European sawmills [18].
The overarching aim of this paper is to assess the performance of a novel biomass-to-liquid (BtL) pathway based on bark and black liquor in terms of techno-economic performance and social and environmental sustainability performance. More specifically, this paper analyses (i) the techno-economic feasibility of the studied BtL process integrated at a pulp mill; (ii) the life-cycle environmental impact of the implementation of the BtL process in terms of climate change, acidification, eutrophication, and abiotic depletion; and (iii) the social impacts of the implementation of the BtL process for different stakeholders such as workers, local communities, society and value chain actors, and the parts of the system that contribute to social impacts.
The assessment is part of the European Horizon 2020 project PulpAndFuel [19], aiming at developing a novel BtL route. The final products include biobased FT diesel, jet fuels, waxes, and other chemicals. Fischer–Tropsch synthesis is performed with syngas from the gasification of dry and wet residue streams in the form of bark and black liquor recovered from pulp mills referenced in EU countries. The BtL process is novel in the sense that it combines the fixed-bed dry gasification of bark and hydrothermal supercritical water gasification of black liquor with the aim of obtaining an optimal syngas for the FT synthesis. One potential advantage with the use of hydrothermal supercritical water gasification is that it enables black liquor to be treated without drying, which saves energy in the pulp mill’s evaporation plant. The process can potentially also be extended to other residues. In a recent review, thermochemical production pathways, for example, biodiesel-gasification-based pathways (like the ones explored in this study), were also indicated to have a high unexploited potential [20].
As the studied BtL concept is still emerging, assessments of its techno-economic, social, and environmental aspects shed light on the strengths, potential weaknesses, and uncertainties associated with integrating a pulp mill with fuel production processes, which can aid in making more substantiated decisions for implementing sustainable biofuel systems. In addition, the challenge of assessing emerging technologies using process simulation and data-demanding life cycle assessment (LCA) methods is demonstrated.
Sustainability assessments have been widely employed to assess and compare biodiesel production derived from various feedstocks (including crops, process residues, and waste streams) globally, as shown by [21,22,23,24,25,26,27,28,29]; see Table 1. However, most of these studies primarily focused on environmental impacts as evidenced by [22,23,25,26,27,28,29], indicating that up to 80% GHG reduction can be achieved compared to fossil fuels in the case of hydrothermal liquefaction. On the other hand, [21] evaluated both environmental and economic aspects, and [24] assessed all three aspects of sustainability. A comparison of biodiesel production from 15 different biomasses showed that using waste cooking oil as a resource has the best sustainability performance, followed by biodiesel production from tallow [24]. In terms of social aspects of fossil fuels and biofuels, Ekener-Petersen et al. [30] concluded that country of origin has a larger impact on social risks than fuel type. The scarcity of the literature evaluating all three pillars of sustainability (Table 1) indicates the need for more comprehensive sustainability assessment of biodiesel production covering the three aspects.
The present study is novel in the following two aspects: (i) it represents an initial assessment of the sustainability performance of a novel BtL pathway that combines the fixed-bed dry gasification of bark and hydrothermal supercritical water gasification of black liquor to produce syngas for customized FT synthesis to produce primarily biobased FT diesel and (ii) provides a sustainability assessment of the emerging BtL pathway including assessments of economic, environmental, and social aspects, which is not commonly found for biodiesel production pathways in the literature.

2. Materials and Methods

The studied system and the methods used for the techno-economic, social, and environmental assessments are described in this section.

2.1. System Description and Modelling

The studied BtL pathway is based on implementing Fischer–Tropsch (FT) biodiesel production at an existing kraft pulp mill in France where bark and black liquor are generated as residues from pulp production. The BtL process consists of three main parts: (i) black liquor gasification (and processing of the gas), (ii) bark gasification (and processing), and (iii) fuel synthesis (see Figure 1).
The models of the BtL processes, considering relevant mass flows, flow compositions, heat and electricity demands, were integrated with a pulp mill model, yielding a superstructure for pulp production and potential fuel synthesis [31,32]. Economic optimization was applied to determine the process design for different scenarios [31,32]. The superstructure of process models and the solution generation approach were based on the work of Granacher et al. [31,32]. A summary of the process models for BtL (adapted from Granacher et al. [31]) relevant to this research follows. Further details can be found in [31,32] and in the Supplementary Materials.

2.1.1. Conversion of Black Liquor to Hydrogen

In the hydrolysis and salt separation (1) step, the weak black-liquor stream is disintegrated into smaller molecules in the hydrolysis stage through a decomposition reaction, and inorganic cooking chemicals are removed in a salt separator. The use of hydrothermal supercritical water gasification (SCWG) (2) enables wet biomass such as black liquor to be treated without drying. Non-catalytic reaction is considered, resulting in hydrogen-rich syngas, and gasification is taking place at 600 °C and 250 bar [31]. For gas separation (3) and cleaning (4) and hydrogen purification, three units of high- and low-pressure flash separation, amine scrubbing, and pressure swing adsorption are considered. The crude synthesis gas at the outlet of the gasifier is passed through a turbine to recover mechanical energy, and amine scrubbing is applied, followed by pressure swing adsorption to purify the hydrogen.

2.1.2. Conversion of Bark via Gasification

The pretreated powdered bark (5) (having correct moisture content and texture) is fed into the entrained-flow (EF) gasifier (6) with pressurized oxygen or steam to produce syngas. Processes after the gasifier consist of cooling quench and cold gas cleaning (7). In the water gas shift reactor (8), a part of the CO in the syngas reacts with water to produce carbon dioxide and hydrogen at moderate temperature.

2.1.3. Fuel Synthesis and Upgrading

The FT synthesis process (9) consists of a catalytic non-selective exothermal reaction in which syngas is converted to hydrocarbons. Upgrading (10) represents removal of gases in a knockout drum. To produce a diesel, the crude needs to be further upgraded. The FT crude is assumed to be transported to a refinery to produce biodiesel and other products. Alternatively, a hydrocracker can be used. Using a hydrocracker may be more costly than processing the crude at a refinery, but it has the advantage that it can occur in close connection to the biofuel production site.

2.2. Scenario Development

Two scenarios for combined pulp and biofuel production were tested: a pilot-scale/reference scenario and a large-scale scenario, both defined by a certain required yield of biofuels (detailed in Table 2). The pilot-scale scenario is used as basis for the LCA (presenting result per energy unit) as this scenario includes detailed descriptions of each process. However, the LCA result is also presented for the large-scale scenario, applying upscaling. The large-scale scenario is used for the techno-economic analysis (TEA) to ensure that the TEA results are related to a realistic commercial scale of the process. Bark is imported to the mill in this scenario since the amount of bark generated from the pulp production is not sufficient for producing the desired amount of biofuel. Both scenarios consider energy integration between the pulp mill and the BtL process, as described in [31,32].
Environmental impacts are assessed for implementation of the assessed BtL pathway at case-study pulp mills assumed to be located in selected European countries (including Finland, Sweden, Germany, and Portugal) having considerable pulp and paper industries [17]. The same process model has been used, but applying country-specific data. The GHG performance is compared with relevant sustainability criteria governing biofuels in the EU (e.g., REDII).

2.3. System Bounderies

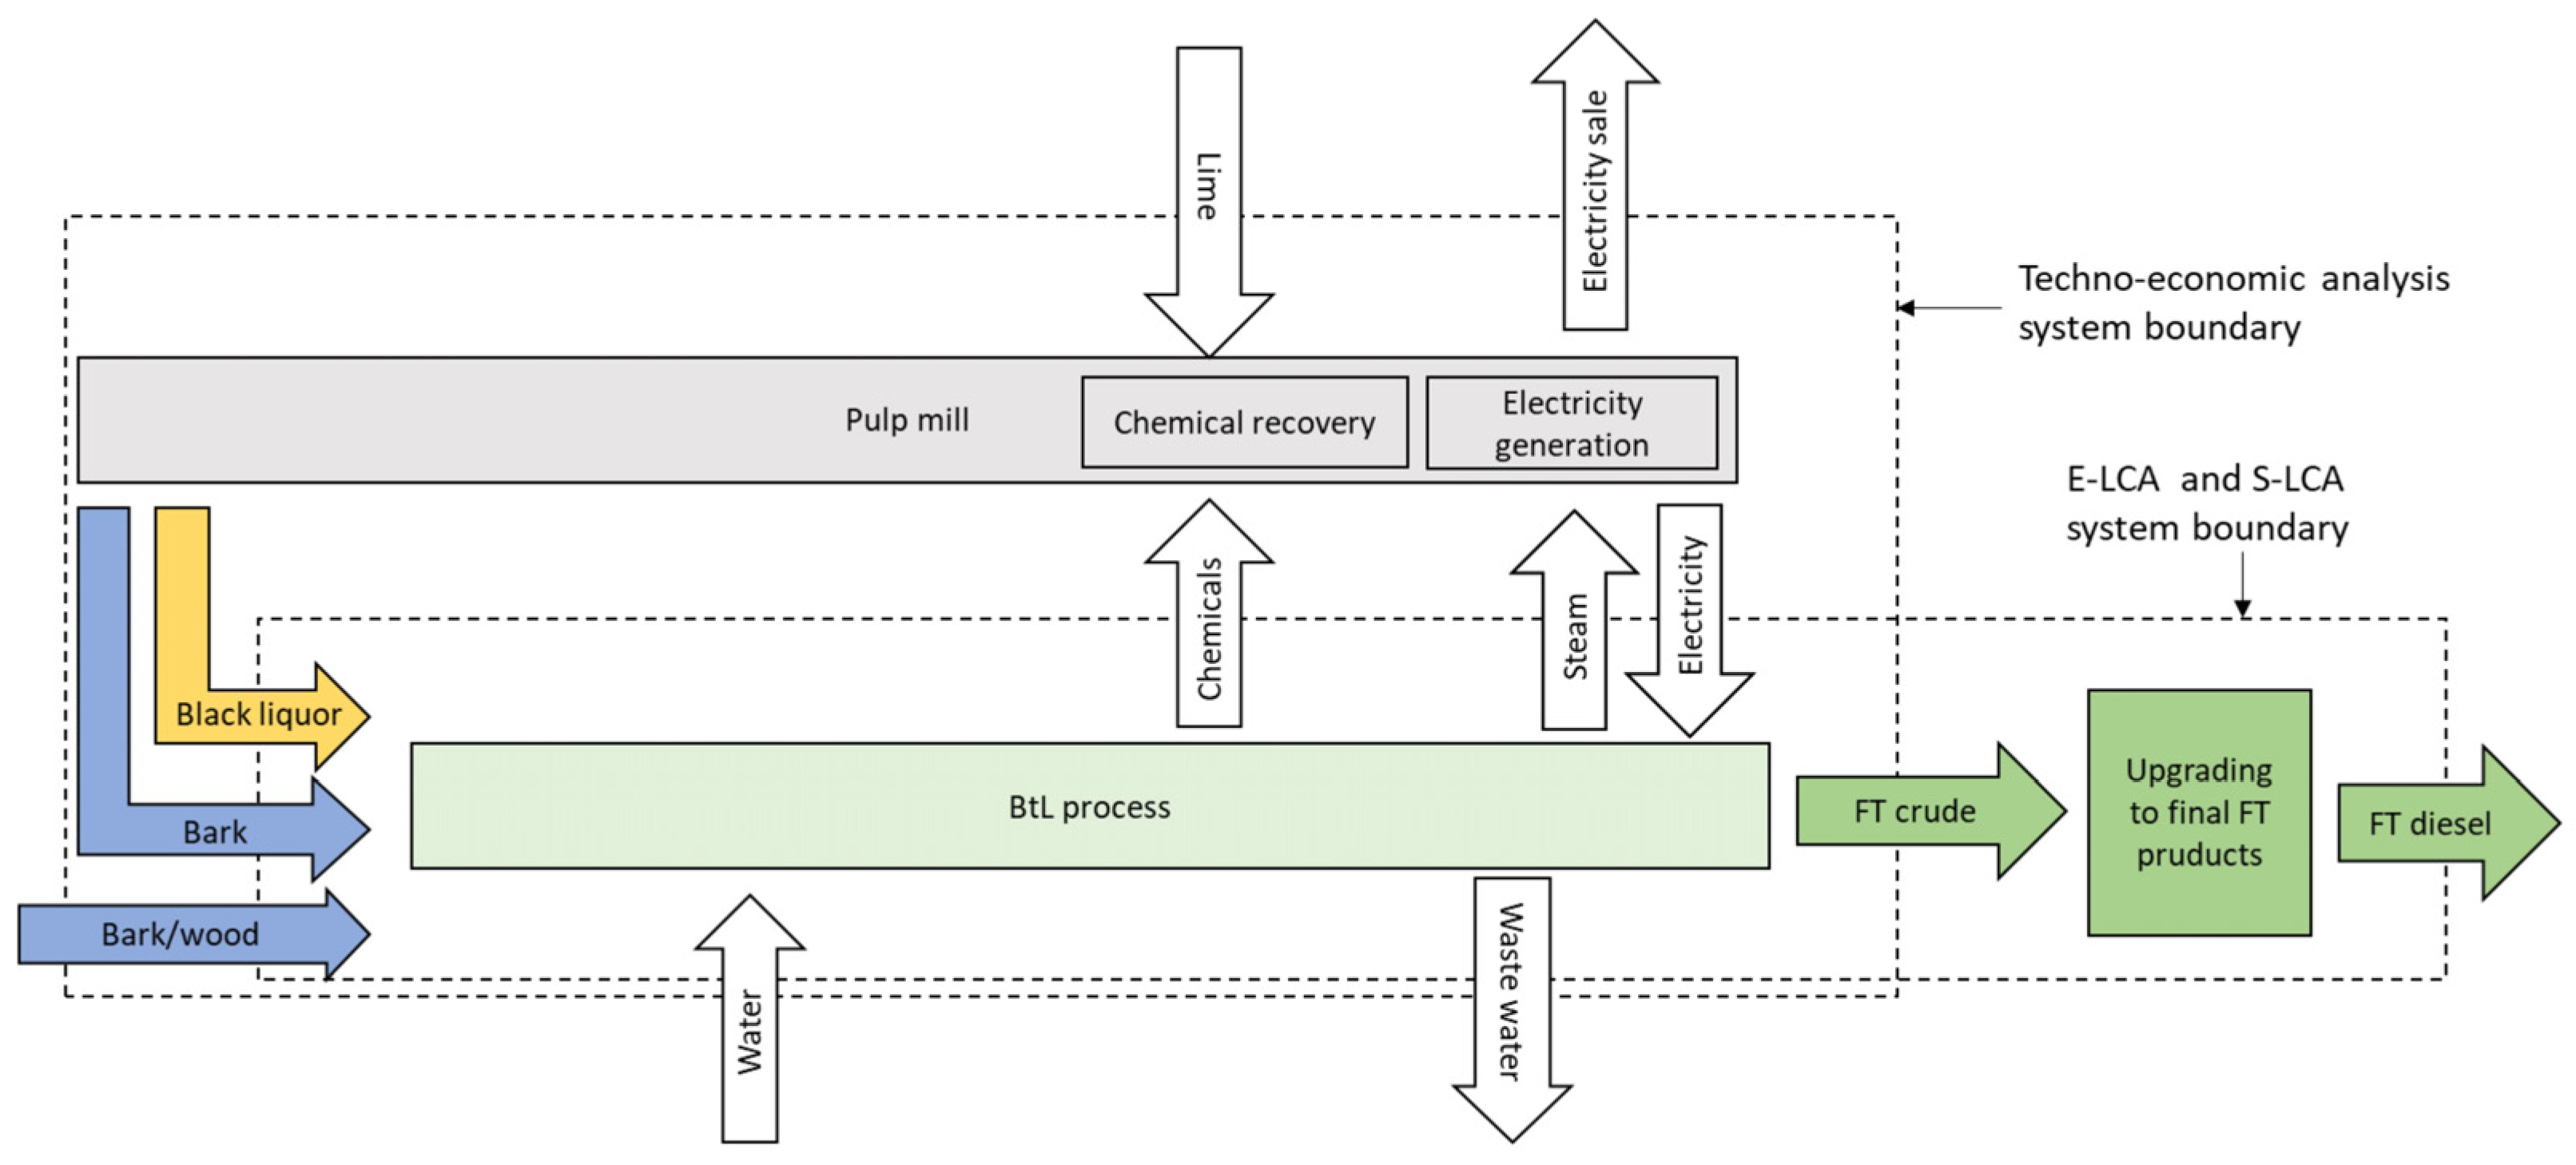
In the LCA, the system boundary mainly covers the BtL process (Figure 2), but with exchange of heat and electricity with the pulp mill, to facilitate comparison with the REDII sustainability criteria. The investigated system covers bark and black liquor residues generated in a pulp mill all the way to the production of biodiesel, including the crude fuel upgrading in a refinery. In the social impact assessment, the same system boundary is adopted. However, in the TEA, a pulp mill system perspective is applied to assess the economic impact for the pulp mill of introducing the BtL process while also considering changes at the pulp mill, e.g., electricity sales and use of lime (Figure 2). The production cost for FT crude is estimated since the business model is considered to comprise sale of FT crude to a refinery for further refining into FT diesel and other final products.

2.4. Environmental Sustainability Assessment

An LCA aims to quantify the environmental impacts that arise from material inputs and outputs, like energy use or air emissions, over a product’s entire life cycle to assist policy makers or consumers in making decisions that will benefit the environment [33]. Here, LCA is applied to assess the potential environmental impacts of the studied BtL pathway if implemented in selected EU countries. The LCA relies on the European standards of ISO 14040, ISO 14044, and REDII, where the latter contains specific LCA methodology for the calculation of GHG emissions for biofuels. The LCA covers four main steps: (1) goal and scope definition, (2) life cycle inventory, (3) life-cycle impact assessment, and (4) interpretation of results.
The goal of the LCA is to study selected environmental indicators connected to the implementation of the studied BtL pathway. The functional unit (FU) is 1 MJ of biodiesel, which is in line with REDII. The processes covered and system boundaries are shown in Figure 2 (and are further described in Supplementary Materials). The CML 2001 method (August 2016 version) is employed to assess environmental impacts since it is a widely used methodology in European context. The included environmental indicators are climate change, acidification, eutrophication, and abiotic depletion. Ecoinvent database v3.7 is utilized as the background source of life cycle inventory (LCI) data, and the Gabi software version 10.7 is used for LCA modelling. Table S1 in Supplementary Materials presents the main inventory data of the system. These data were derived from the system modeling described in Section 2.1 and the Supplementary Materials. The LCA is performed for the pilot-scale scenario but is also presented for the upscaled large-scale case. A sensitivity assessment analyzing the impact on climate change of a case with 100% renewable electricity mix or increased process optimization/integration is also included.
The carbon abatement cost (In €/kg CO2eq)—a measure of how cost-effectively different fuel types reduce climate impact—is calculated as the difference between the production cost of the BtL fuel and fossil diesel (€/GJ) divided by the difference between the GHG emissions for the fossil diesel and the BtL fuel (kg CO2eq/GJ).

2.5. Techno-Economic Analysis

The TEA contains the calculation of operational expenditures (OPEXs) and capital expenditures (CAPEXs). The production cost is calculated based on OPEXs, CAPEXs, and the production volume. CAPEXs represent the investment cost in the BtL process and other necessary additional equipment such as water treatment equipment (see the table in Section 3.1). CAPEX is estimated using the methodology and correlations described by Turton and Shaeiwitz [34], which considers multiplication factors that define the size and capacity of different equipment components. The methodology is based on so-called grass roots cost, considering all necessary steps to construct a completely new plant ready to function.
The CAPEX estimate includes direct costs (e.g., purchase of equipment and modules) and indirect costs (e.g., engineering). The grass roots cost estimation starts with the equipment purchase cost (free on board). Then, three overhead costs are added (bare module cost, total module cost, grass roots cost). The total module cost represents the cost of making small to moderate expansions or alterations to an existing facility. Bare module cost is considered as an intermediate step to calculate other costs. Estimates in literature, cost estimates obtained from suppliers of equipment, and cost estimates made by engineering firms are also included. For the most expensive units, e.g., EF gasifier, hydrothermal gasifier, and FT reactor, further sources are investigated. These alternative investment costs (presented in the table in Section 3.1) are used for the sensitivity analysis. Investment estimates in the literature are adopted with a scale factor to obtain an estimate of the relevant size evaluated, following Equation (1):
C1/C2 = (V1/V2)α
here, C is equipment cost, V is capacity, and α represents the effect of economy of scale. C1 and V1 refer to the unknown investment and C2 and V2 refer to the known investment. For a given size of the unknown investment, C1 can be calculated. When α is equal to 1, no economy of scale is obtained, while the lower α is, the stronger effect of economy of scale is. This paper assumes α = 0.7 if not otherwise stated. To account for inflation, the Chemical Engineering Plant Cost Index for year 2021 [35] has been applied to transform older references to 2021 cost level.
OPEXs include revenues and operational costs (detailed in the table in Section 3.1). Revenues are obtained from the main product (FT crude) and from byproducts (electricity). The fixed operational costs—depreciation, financial costs, maintenance, and labor costs—are calculated as functions of CAPEX (assumptions in the table in Section 3.1). The variable costs are results from the modelling of a large-scale BtL process (143 ktonnes crude/year). Depreciation and financial costs are calculated based on assumptions for economic parameters such as interest rate and economic lifetime. The biomass cost (bark) used is 5.6 €/GJ (20 €/MWh). This value is the average of the interval found in [36], and it also corresponds to a long-term biomass cost used by, for example, Lönnqvist and Hansson [37]. For comparison, the Baltic spot price of wood chips during March 2023 was 6.7 €/GJ [38]. The electricity sales price is set to 0.058 €/kWh, which was the average sale price in France in 2018–2019 [39]. Maintenance and labor costs are assumed to be 5% of CAPEX [40].

Sensitivity Analysis

The biomass cost, investment cost (different parts of CAPEX) and electricity sales price are varied in a sensitivity analysis. First (as presented in the table in Section 3.1.1), (i) the biomass cost is varied between 2.2 and 9.2 €/GJ (8 and 33 €/MWh, based on the highest and lowest biomass cost found by the literature review in [36]), (ii) the component investment costs are also varied with the intervals presented in the table in Section 3.1 and (iii) the electricity sales price is varied ±50% (which aim to reflect the large volatility and uncertainty in future electricity prices). Then for a second case, the biomass cost, the other cost parameters and the electricity sales price are instead varied with ±50% individually.

2.6. Social Sustainability Assessment

Social life cycle assessment (S-LCA) methodology following the reference scale approach in UNEP guidelines [41] is applied to evaluate social performance and hotspots of the proposed system. S-LCA is carried out at two levels: (1) hotspot-level analysis and (2) site-specific analysis. For the former, the social hotspot database (SHDB) [42] and the life cycle inventory generated for the LCA were used. SHDB covers 57 sectors and uses the Global Trade Analysis Project, which is an input–output model that contains trade data for the covered sectors [42]. Relevant sectors for each input/output in the inventory were chosen from SHDB to identify social risks for production of 1 MJ of biodiesel. Impact category results for labor rights and decent work, Health and Safety, Human Rights, and Governance and Community were calculated using the social hotspot 2019 category method. Each result is presented in medium-risk-hour equivalent, which determines the number of hours worked by employees for each process unit and considers the level of risk associated with the indicator evaluated [43].
In the site-specific analysis, implementation of the BtL process at an already existing pulp mill in Sweden is assumed. Data were collected through semi-structured interviews with two experts on the development of the specific BtL process and one expert working as a human rights director in the Swedish pulp and paper sector. Four stakeholder categories (Worker, Local Community, Value Chain Actors, and Society) and five relevant impact subcategories were chosen for further investigation. These include Health and Safety (linked to Worker), Access to Material Resources (Local Community), Promoting Social Responsibility (Value Chain Actors), and Contribution to Economic Development and Technology Development (both for Society). Reference scales from −2 to 2 for the impact subcategories were adopted based on [41,44,45]. A value of 2 represented high performance and −2, low performance. The detailed methodology adapted specifically for the site-specific analysis can be found in [46].

3. Results

The techno-economic, social, and environmental performance of the assessed BtL pathway is presented in this section.

3.1. Techno-Economic Analysis

Table 3 details CAPEXs and references used for the cost estimate for each component for a large-scale plant with a production capacity of 143 ktonnes of FT crude per year. The CAPEX for this investment corresponds to approximately 270 M€. The two gasifiers, the SCWG and EF gasifier, represent the largest costs among the components, followed by the FT synthesis, the cobalt catalyst, and drying and torrefaction. The cost for upgrading the FT crude oil to diesel and other fractions at a refinery is estimated assuming that the cost of the hydrocracker represents the upper limit for upgrading, since it is likely cheaper to treat the FT crude in a refinery. Investment costs for a hydrocracker correspond to 45.6 M€ for the considered capacity [47]. When including the hydrocracker, the CAPEX amounts to about 315 M€.
Haarlemmer and Boissonnet [56] have made a literature survey of investment and production cost estimates for synthetic fuels that shows a large variation in EF gasifier cost estimates (135%) and a smaller variation in EF gasifiers for biomass (33%). However, for the latter, there are fewer estimates to compare. The uncertainty in investment costs for different components (see alternative costs in Table 3) is related to the Technology Readiness Level (TRL), which varies for different components. Hydrothermal gasification has TRL 3 while EF gasification and FT synthesis for BtL both have TRL 4 [19].
The OPEX is detailed in Table 4. The largest share of the OPEX is represented by the cost of biomass (55%) followed by depreciation and financial costs (29%) and maintenance and labor costs (15%). The estimated crude production cost is about 12.8 €/GJ (corresponding to about 46 €/MWh, 573 €/tonnes, or 0.43 €/L). The production cost of FT diesel is estimated at 13.9 €/GJ (or 50 €/MWh or 0.47 €/L), assuming a cost for upgrading to biodiesel at a refinery that corresponds to the cost of a hydrocracker [47]. However, the cost for upgrading at a refinery could be somewhat lower, which would then result in a somewhat lower biodiesel production cost.
Different crude cuts (i.e., the proportions of the different products obtained from the FT crude, such as FT diesel, bio-wax, bio-naphta, and bio-liquefied petroleum gas) will also affect the profitability of the biodiesel. Bio-products are estimated to have a higher value than their fossil equivalence [60]. The bio-wax is estimated to have an even higher value than the FT diesel [60,61]. Thus, a cut that maximizes the proportion of bio-wax could make the biodiesel production more profitable although more bio-wax and less FT diesel would be produced.

3.1.1. Sensitivity Analysis

The FT crude production cost varies from 8.1 to 24.7 €/GJ (29–89 €/MWh) in the sensitivity analysis using the uncertainty intervals from the literature for biomass and investment costs (Table 5). When varying each of the assessed parameters, ±50% the FT crude production cost varies with changes in the biomass cost (9–17 €/GJ), changes in investment cost (11–15 €/GJ), and from 12 to 14 €/GJ for changes in electricity sales prices. Both the biomass cost and the investment cost are important parameters for the crude production cost. However, the investment cost is found to be more uncertain than the biomass cost, and variation in investment costs results in a larger spread of the production cost.

3.1.2. Cost Estimates from Literature

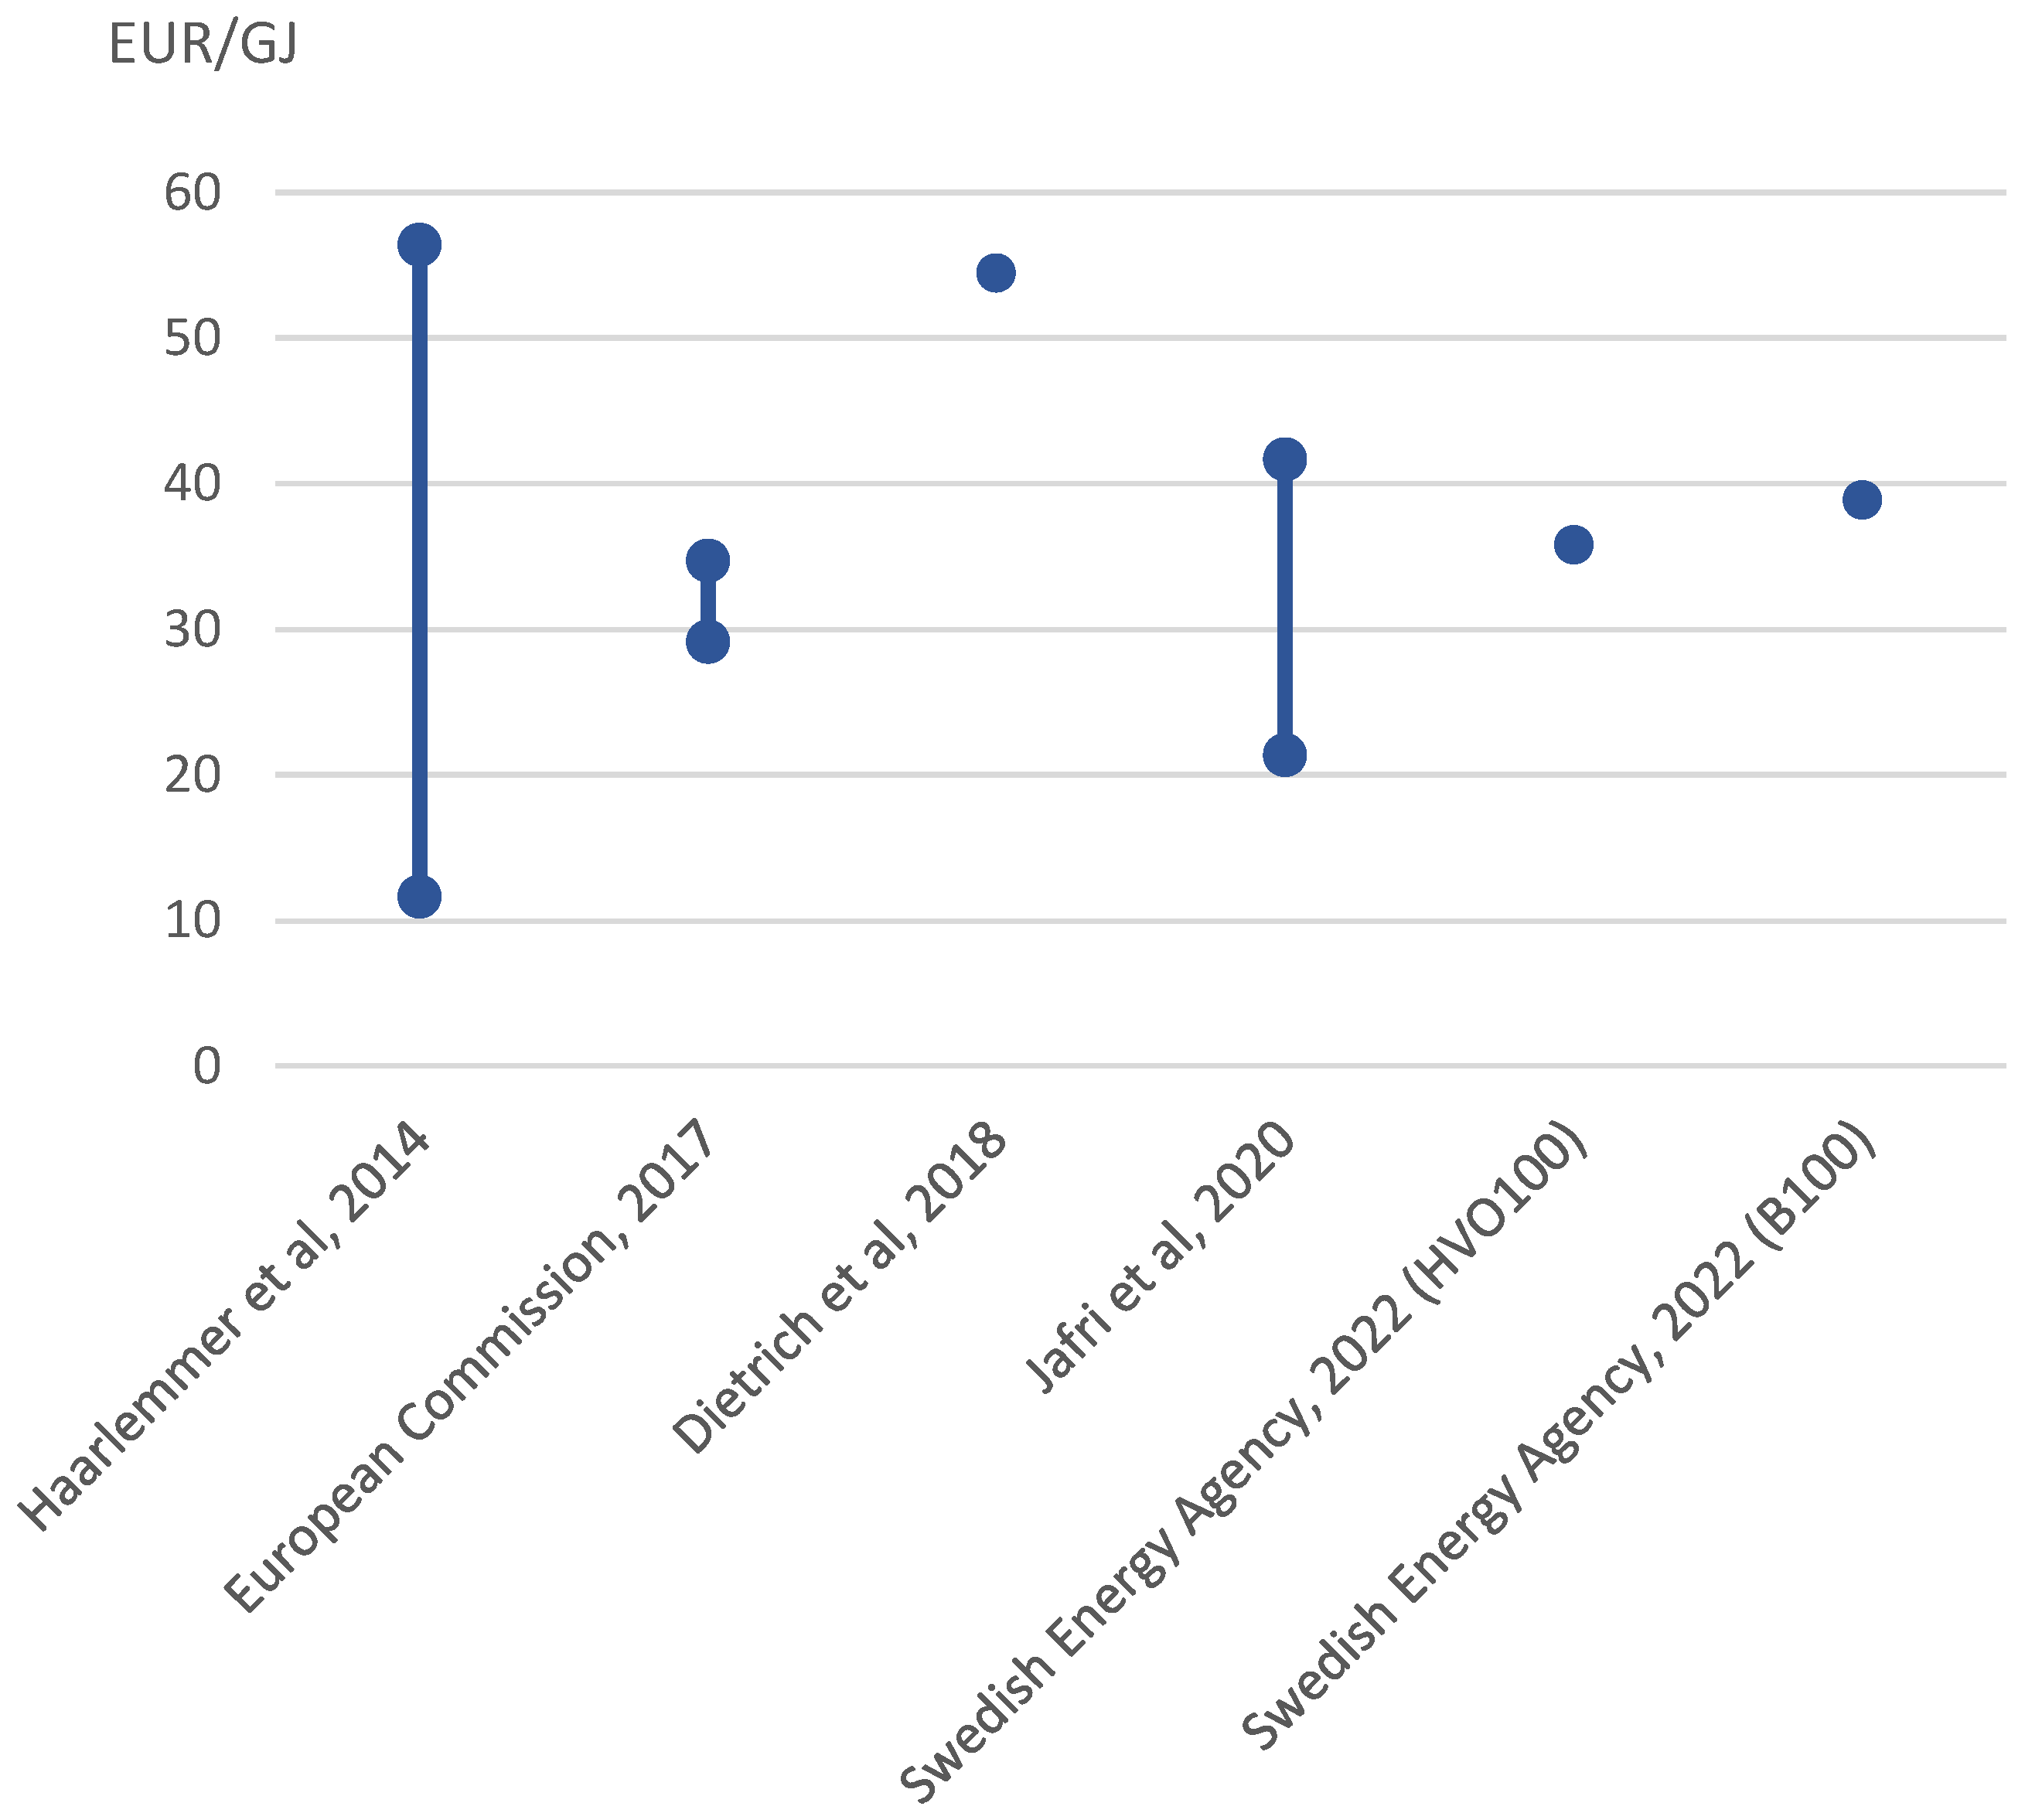
In Figure 3, production cost estimates for various BtL pathways, including upgrading to the final biodiesel product, from the literature are shown. The European Commission’s Sustainable Transport Forum evaluates a wide range of advanced BtL pathways; the pathways based on wood feedstock and FT syntheses are included in Figure 3 [62]. In Haarlemmer and Boissonnet’s work [56], cost estimates for 34 BtL routes based on the gasification of biomass, including both forest and agricultural residues as well as dedicated crops such as salix, from 23 publications are presented. Ref. [63] estimates the production cost for a BtL pathway based on the gasification of woodchips. Ref. [64] evaluates five BtL pathways based on black liquor lignin separation with hydrotreatment or black liquor gasification, with or without combination with electrolysis, including the effects of integration with pulp mills, similar to this paper. In Figure 3, also, actual production costs for hydrotreated vegetable oil (HVO100) in Sweden (mainly produced from tall oil) at 36 €/GJ, and pure biodiesel produced from rapeseed (B100) at 39 €/GJ, based on data provided by all major Swedish producers, are included [65].
The cost estimates in Figure 3 vary between 11.7 and 56.4 €/GJ, which is the span found by Haarlemmer and Boissonnet [56]. However, it is more relevant to compare the estimate in this study with [64], which estimates the cost for more similar production pathways based on black liquor as being 21.4–41.7 €/GJ. The estimated production cost of FT diesel in this paper, at 13.9 €/GJ, is low in comparison to other relevant production pathways.

3.2. Environmental Assessment

A comparison of four environmental impacts of the studied BtL pathway when assumed to be implemented in five EU countries is shown in Figure 4 and in Table 6. The emissions reported are the total emissions released/saved during the life cycle of the BtL system, with the system boundaries, as depicted in Figure 2, being based on the FU of 1 MJ biodiesel production. Both emission sources like electricity and heat and tap water consumption as well as wastewater treatment and landfilling are responsible for emissions while heat recovery and credit for methanol (which is replaced by the use of wastewater from the process as a renewable carbon source in the wastewater treatment plant) and sulfur recovery contribute to emission saving through the process.
Overall, the results indicate that heat and electricity have the highest contributions in all impact categories for all countries (combined share: over 60%). In specific impact categories, electricity with shares of 30–75% and 20–80% has the largest effect in the global warming and abiotic depletion categories, respectively. Heat has the largest influence in eutrophication and acidification impacts (40–50%) for all countries except Germany and Portugal. Heat recovery is important in the studied process set up. Hence, electricity and heat consumption in the BtL system are found to be key for further improving the overall environmental performance of the system. Credit for methanol makes emission saving for abiotic depletion and global warming (GWP) potential.
In terms of global warming, the impacts of 1 MJ biodiesel production for the investigated countries vary from 16 to 83 g CO2eq/MJ (Table 6). Negative GHG emissions are obtained from the credit for methanol and heat recovery. On the other hand, global warming is dominated by electricity use. The electricity requirements of biomass pretreatment, gasification, and gas cleaning are the main contributors to GWP. Other processes such as wastewater treatment, tap water consumption, sulfur recovery, and landfill only contribute a small share to the GWP.
Abiotic depletion potential (ADP, measured in the unit gSb) also has negative contributions due mainly to the avoided heat and, to a minor extent, avoided methanol, resulting in some reduction in net ADP (−25 and −32.6 g Sb/MJ biodiesel for avoided heat and methanol, respectively). The principal positive contributor to abiotic depletion is the electricity required by the system, which varies from 97.6 g Sb/MJ biodiesel for Sweden to 2340 g Sb/MJ biodiesel for Germany.
The dominating factor for AP is the contribution related to the heat consumption by the system. This factor changes in a span of 0.2–0.4 g SO2eq/MJ biodiesel for considered cases. Like for AP, heat demand by the system plays the significant role in eutrophication potential (EP), varying from 0.07 to 0.2 g PO4eq/MJ biodiesel for various cases. In addition, wastewater treatment is another responsible contributor for EP, which values, as an average, 0.012 g PO4eq/MJ biodiesel. Wastewater treatment has a considerable impact on eutrophication due to nitrogen and phosphorus contents in wastewater.
Figure 5 shows the contribution to the assessed environmental impacts of different processes relevant to the BtL system for the reference case of France, expressed in percentages. The dominating process in GWP is gasification, which accounts for 39% of the total impact. The reason is the electricity use, which, in many countries is partly provided by fossil fuels. Around two-thirds of France’s electricity were supplied by nuclear power in 2021, and the rest came from fossil fuels like oil, while in Sweden, hydropower is the main source for electricity generation, which is followed by nuclear power and a growing contribution from wind.
The indicator of ADP is connected to the inputs of fossil fuels in the system. The key contribution process to ADP is also gasification, representing 52%, which is mainly linked to the air separation unit. The ADP impact is also caused by the gas cleaning unit (32%), along with the pretreatment process (10%). Both are closely linked to heat consumption, which is generally produced by fossil fuels in France (mainly from gas with fossil fuel share of 40%). Fuel upgrading is the only process that presents negative environmental impacts since the avoided products of heat and methanol are both considered as subsets of this process. This mainly influences ADP. Fuel upgrading represents approximately 6% of APD.
Gas cleaning contributes the largest environmental impact in terms of EP and AP, accounting for 40% and 35% for each impact, respectively. This is followed by gasification, which accounts for 20% of both these impact categories. The pretreatment and post-treatment processes also influence these categories. Sulfur and sulfur oxides in the fossil fuels (for heat and electricity use) are considered the primary factors causing acidification. The refinery process has only considerable effects on GWP and AP, accounting for 19% and 18% of each impact, respectively. The largest sources of GHG and acidic pollutant emissions at the refinery are stationary fuel combustion units such as steam boilers, process furnaces, and process heaters.
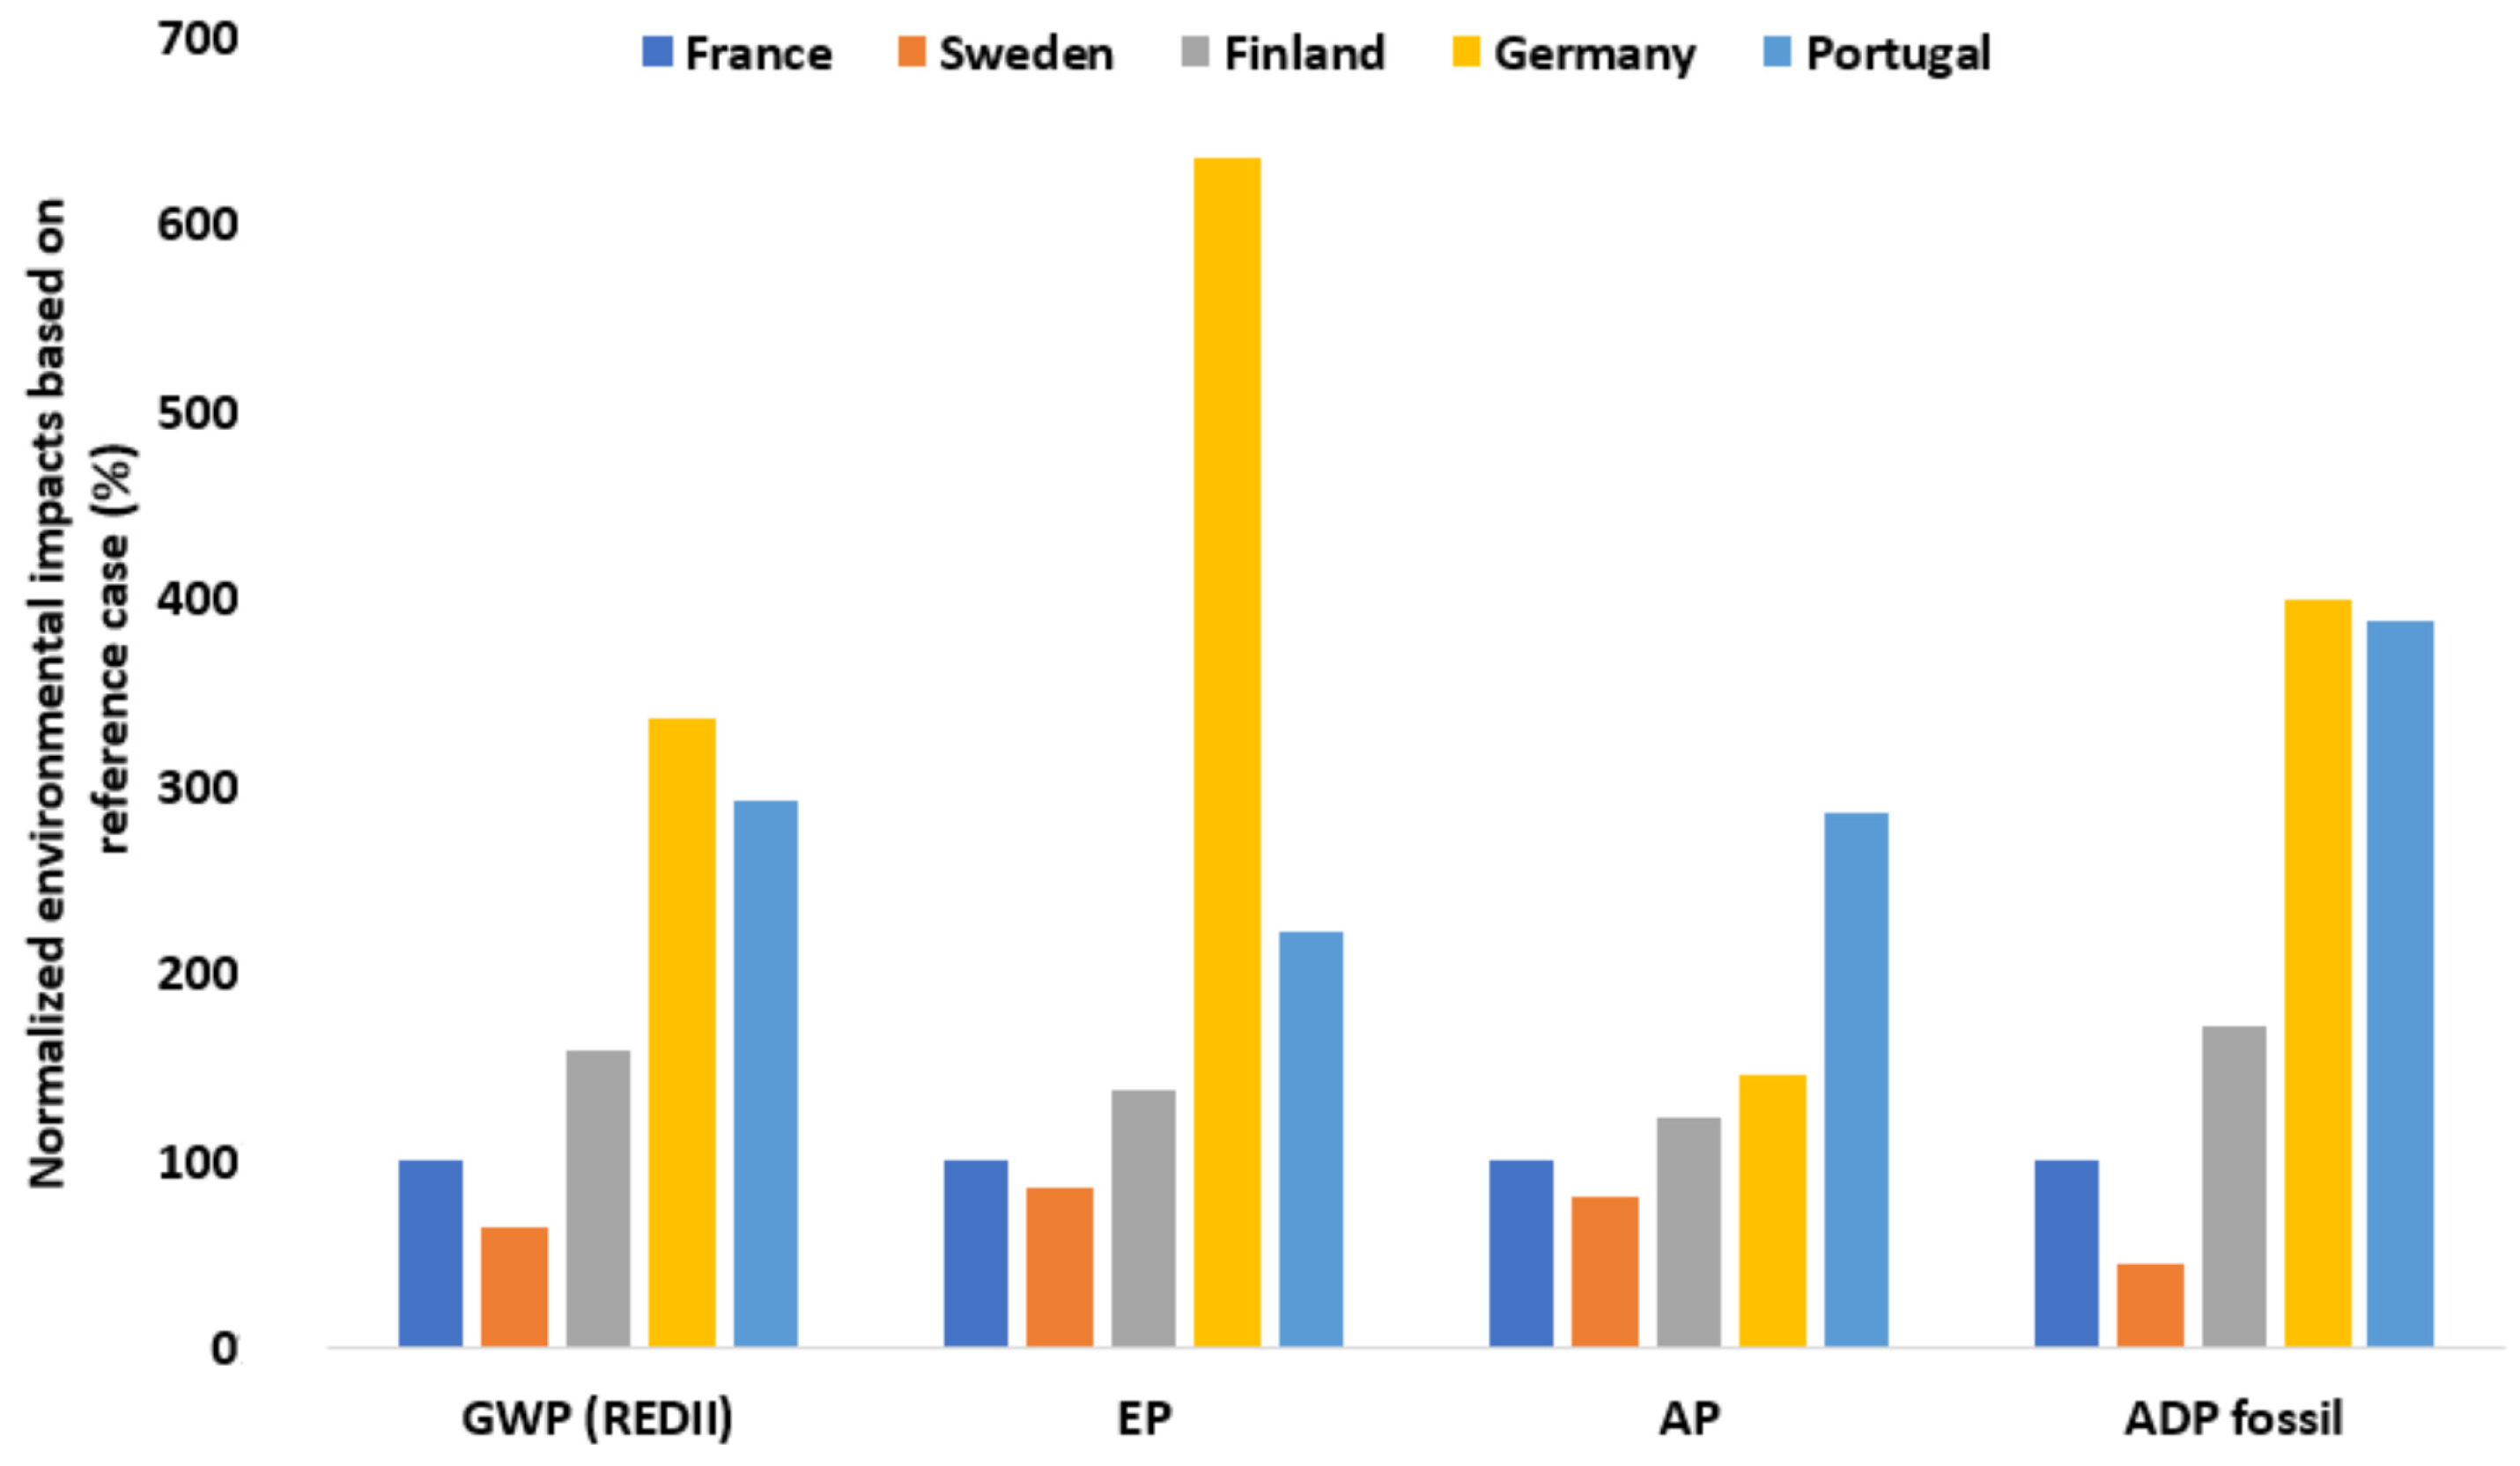
A comparison of various environmental impacts for the five studied countries is shown in Figure 6 in the form of their normalized respective proportions based on the reference case (i.e., France). Applying the BtL system in Sweden shows the lowest environmental impact. This is due to the high share of non-fossil electricity generation in Sweden and the fact that heating is supplied mainly through bioenergy-based district heating and heat pumps.
The BtL system employed in Finland causes higher impacts than in France (on average, 1.4 times higher). The running BtL system in Germany has the highest impact in all environmental categories except AP since the electricity generation in Germany is dominated by fossil-fuel sources (mostly coal and gas) and heating is supplied by natural gas, liquid gas, or biogas. Portugal mostly uses natural gas, hydroelectricity, and coal to produce electricity, with natural gas power being the largest contributor. Natural gas combustion leads to considerable emissions of CO2, SO2, CH4, and N2O which makes the BtL system in Portugal the one with the highest acidification potential (AP) impact.
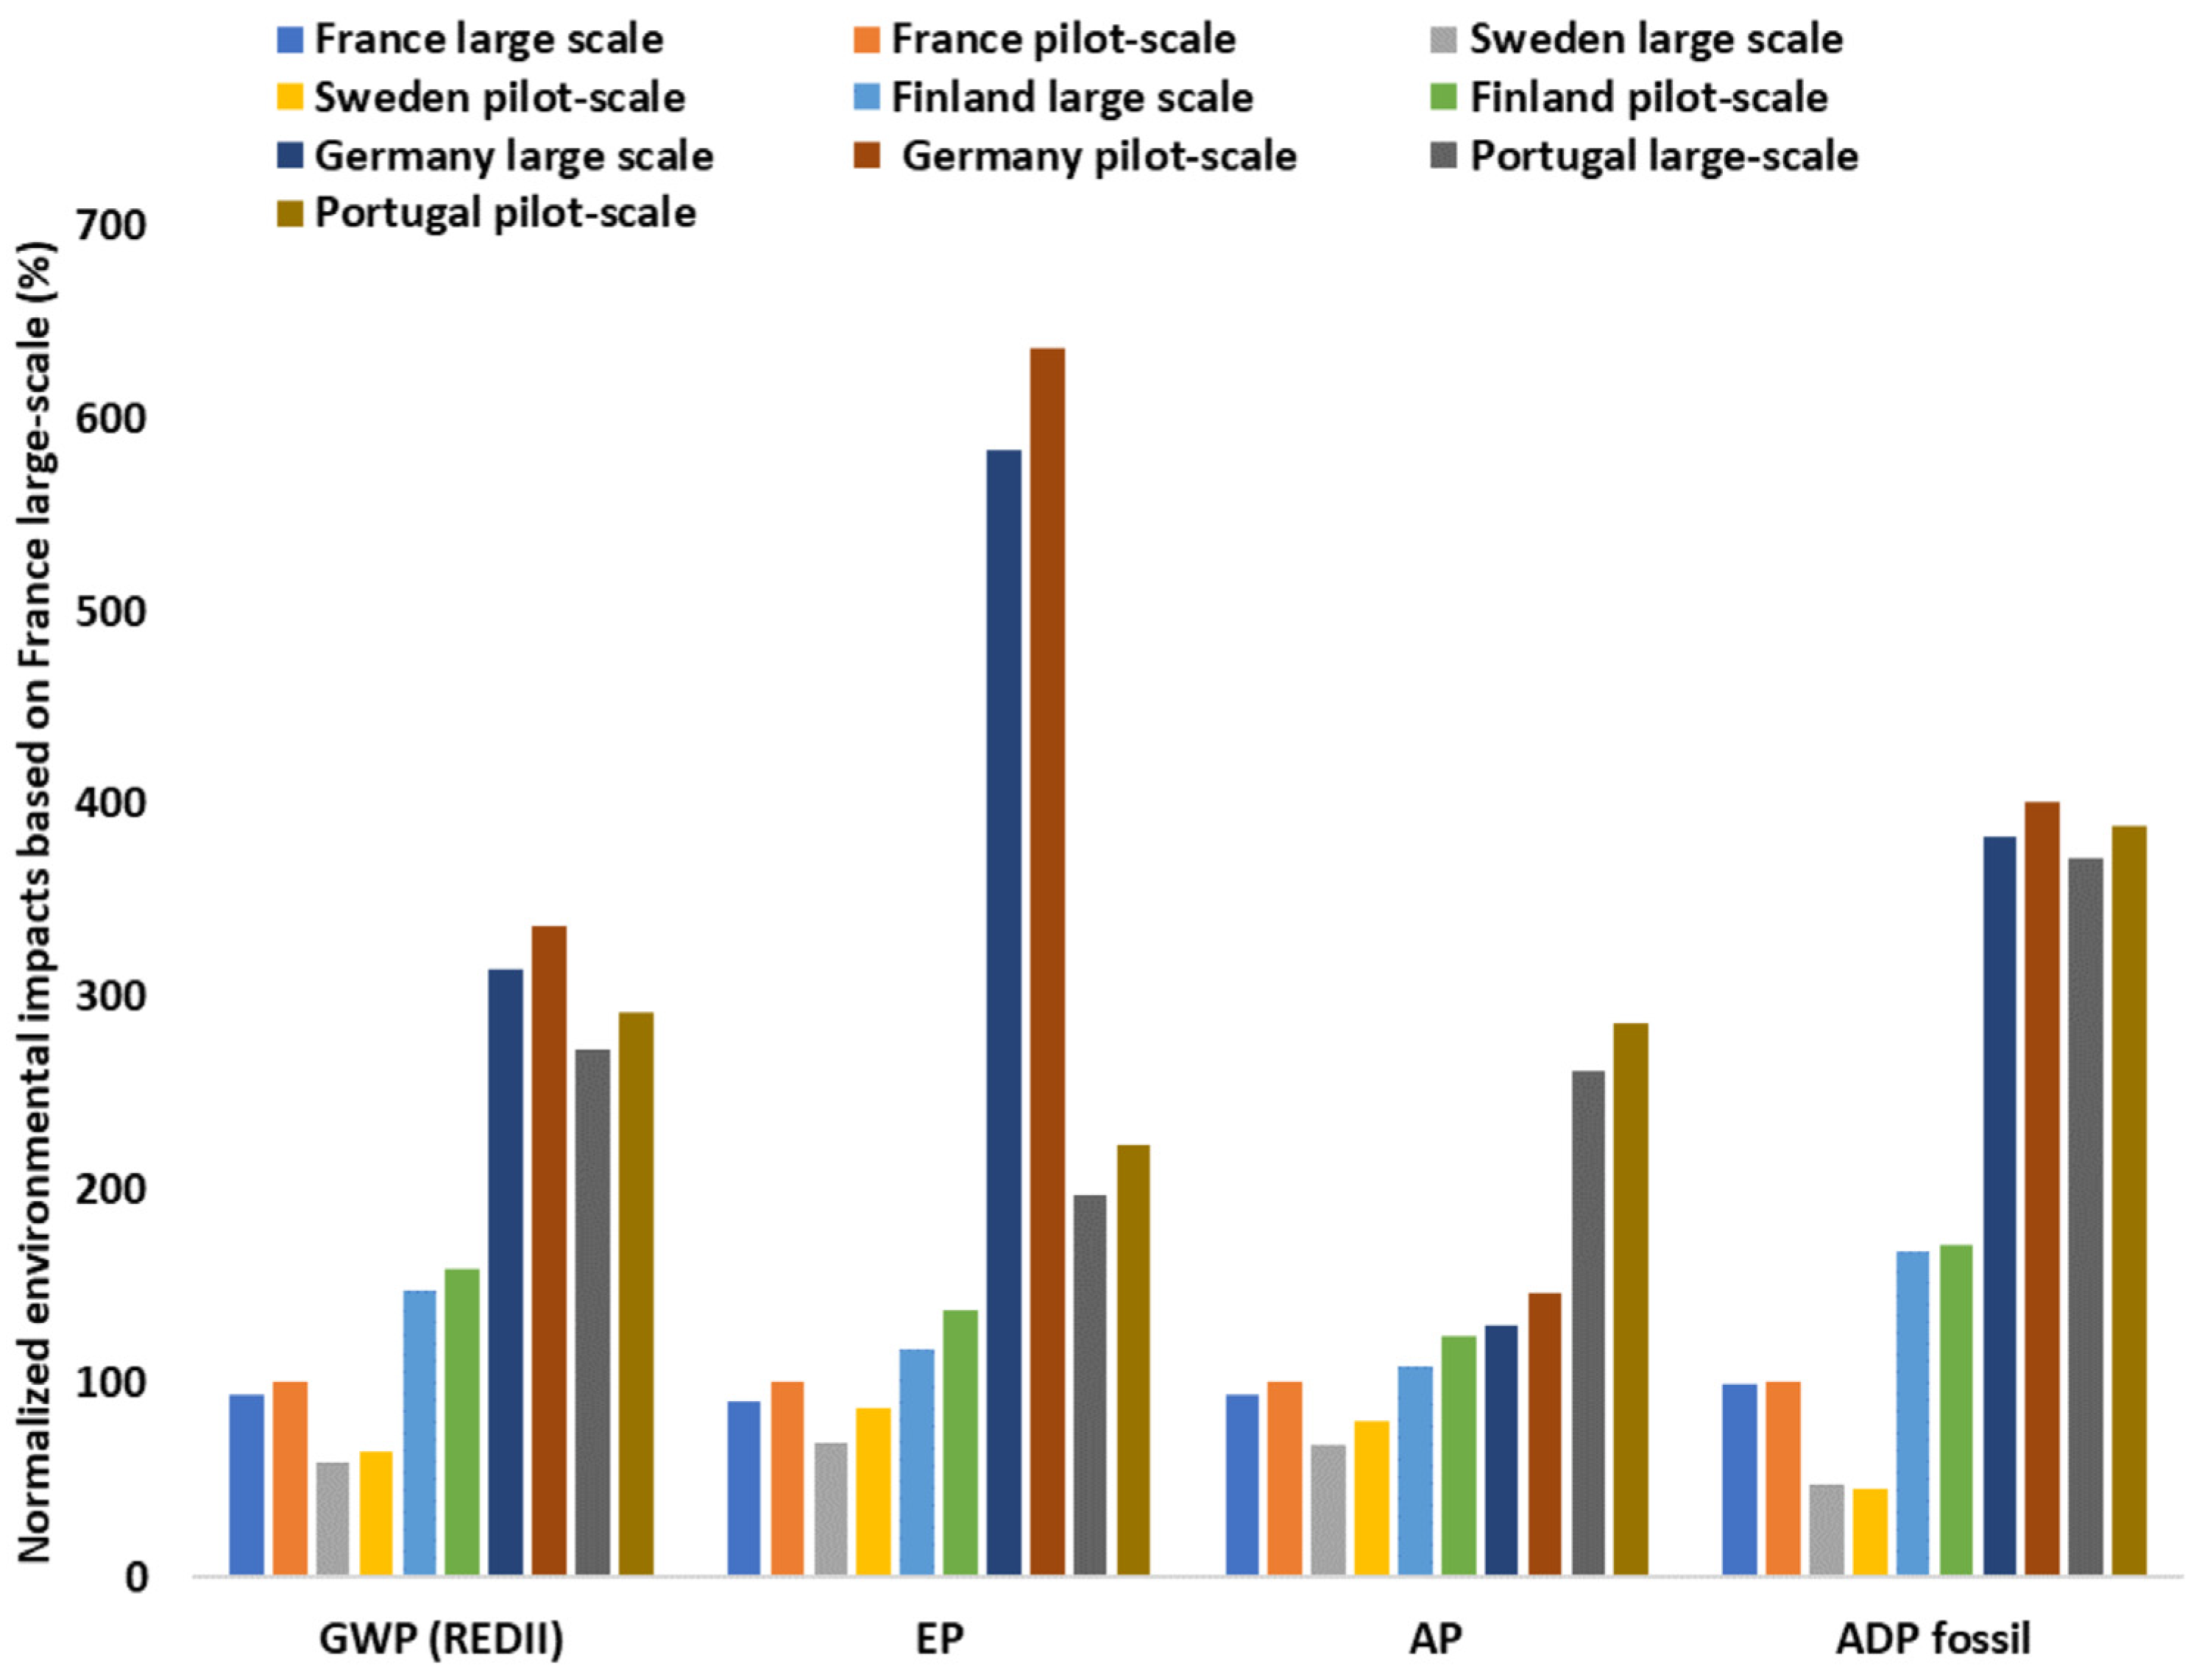
The environmental impacts for the large-scale case of France are presented in Figure 7, normalized to the reference case results. The assessment show that the GWP is reduced by 6–10% compared to the reference case for the different countries when a larger facility is assumed. The impacts on eutrophication, acidification and abiotic depletion potential are reduced by 8–21%, 6–16%, and 3–17%, respectively for the different countries.
Electricity produced with 100% wind power instead of the national electricity grid mix is assumed to be used for the BtL fuel production in a sensitivity analysis used to illustrate the potential GHG reduction for the studied concept in case it is allowed to assume that electricity used for the production originates completely in renewable energy sources or if increased process optimization/integration is applied. In this case, the climate impact corresponds to 12.7–14.1 g CO2eq/MJ of FT biodiesel for all the investigated countries.
The carbon abatement cost corresponds to −0.5 to −0.07 €/kg CO2eq when including the GHG performance in all the assessed countries and assuming a production cost of 19.4 €/GJ for fossil diesel [65]. A negative carbon abatement cost means that it is more economically beneficial to use the biofuel option rather than its fossil counterpart, given correct cost estimates. For the cost interval for the BtL fuels at 9.2–25.8 €/GJ (from sensitivity analysis) and the GHG interval for the assessed countries, the carbon abatement cost corresponds to −0.9 to 0.6 €/kg CO2eq. This can be compared to the carbon abatement interval of −0.04–0.4 €/kg CO2eq for a variety of biofuels, presented in [66], which confirms the low BtL-production-cost estimate in this study.

3.3. Social Sustainability Assessment

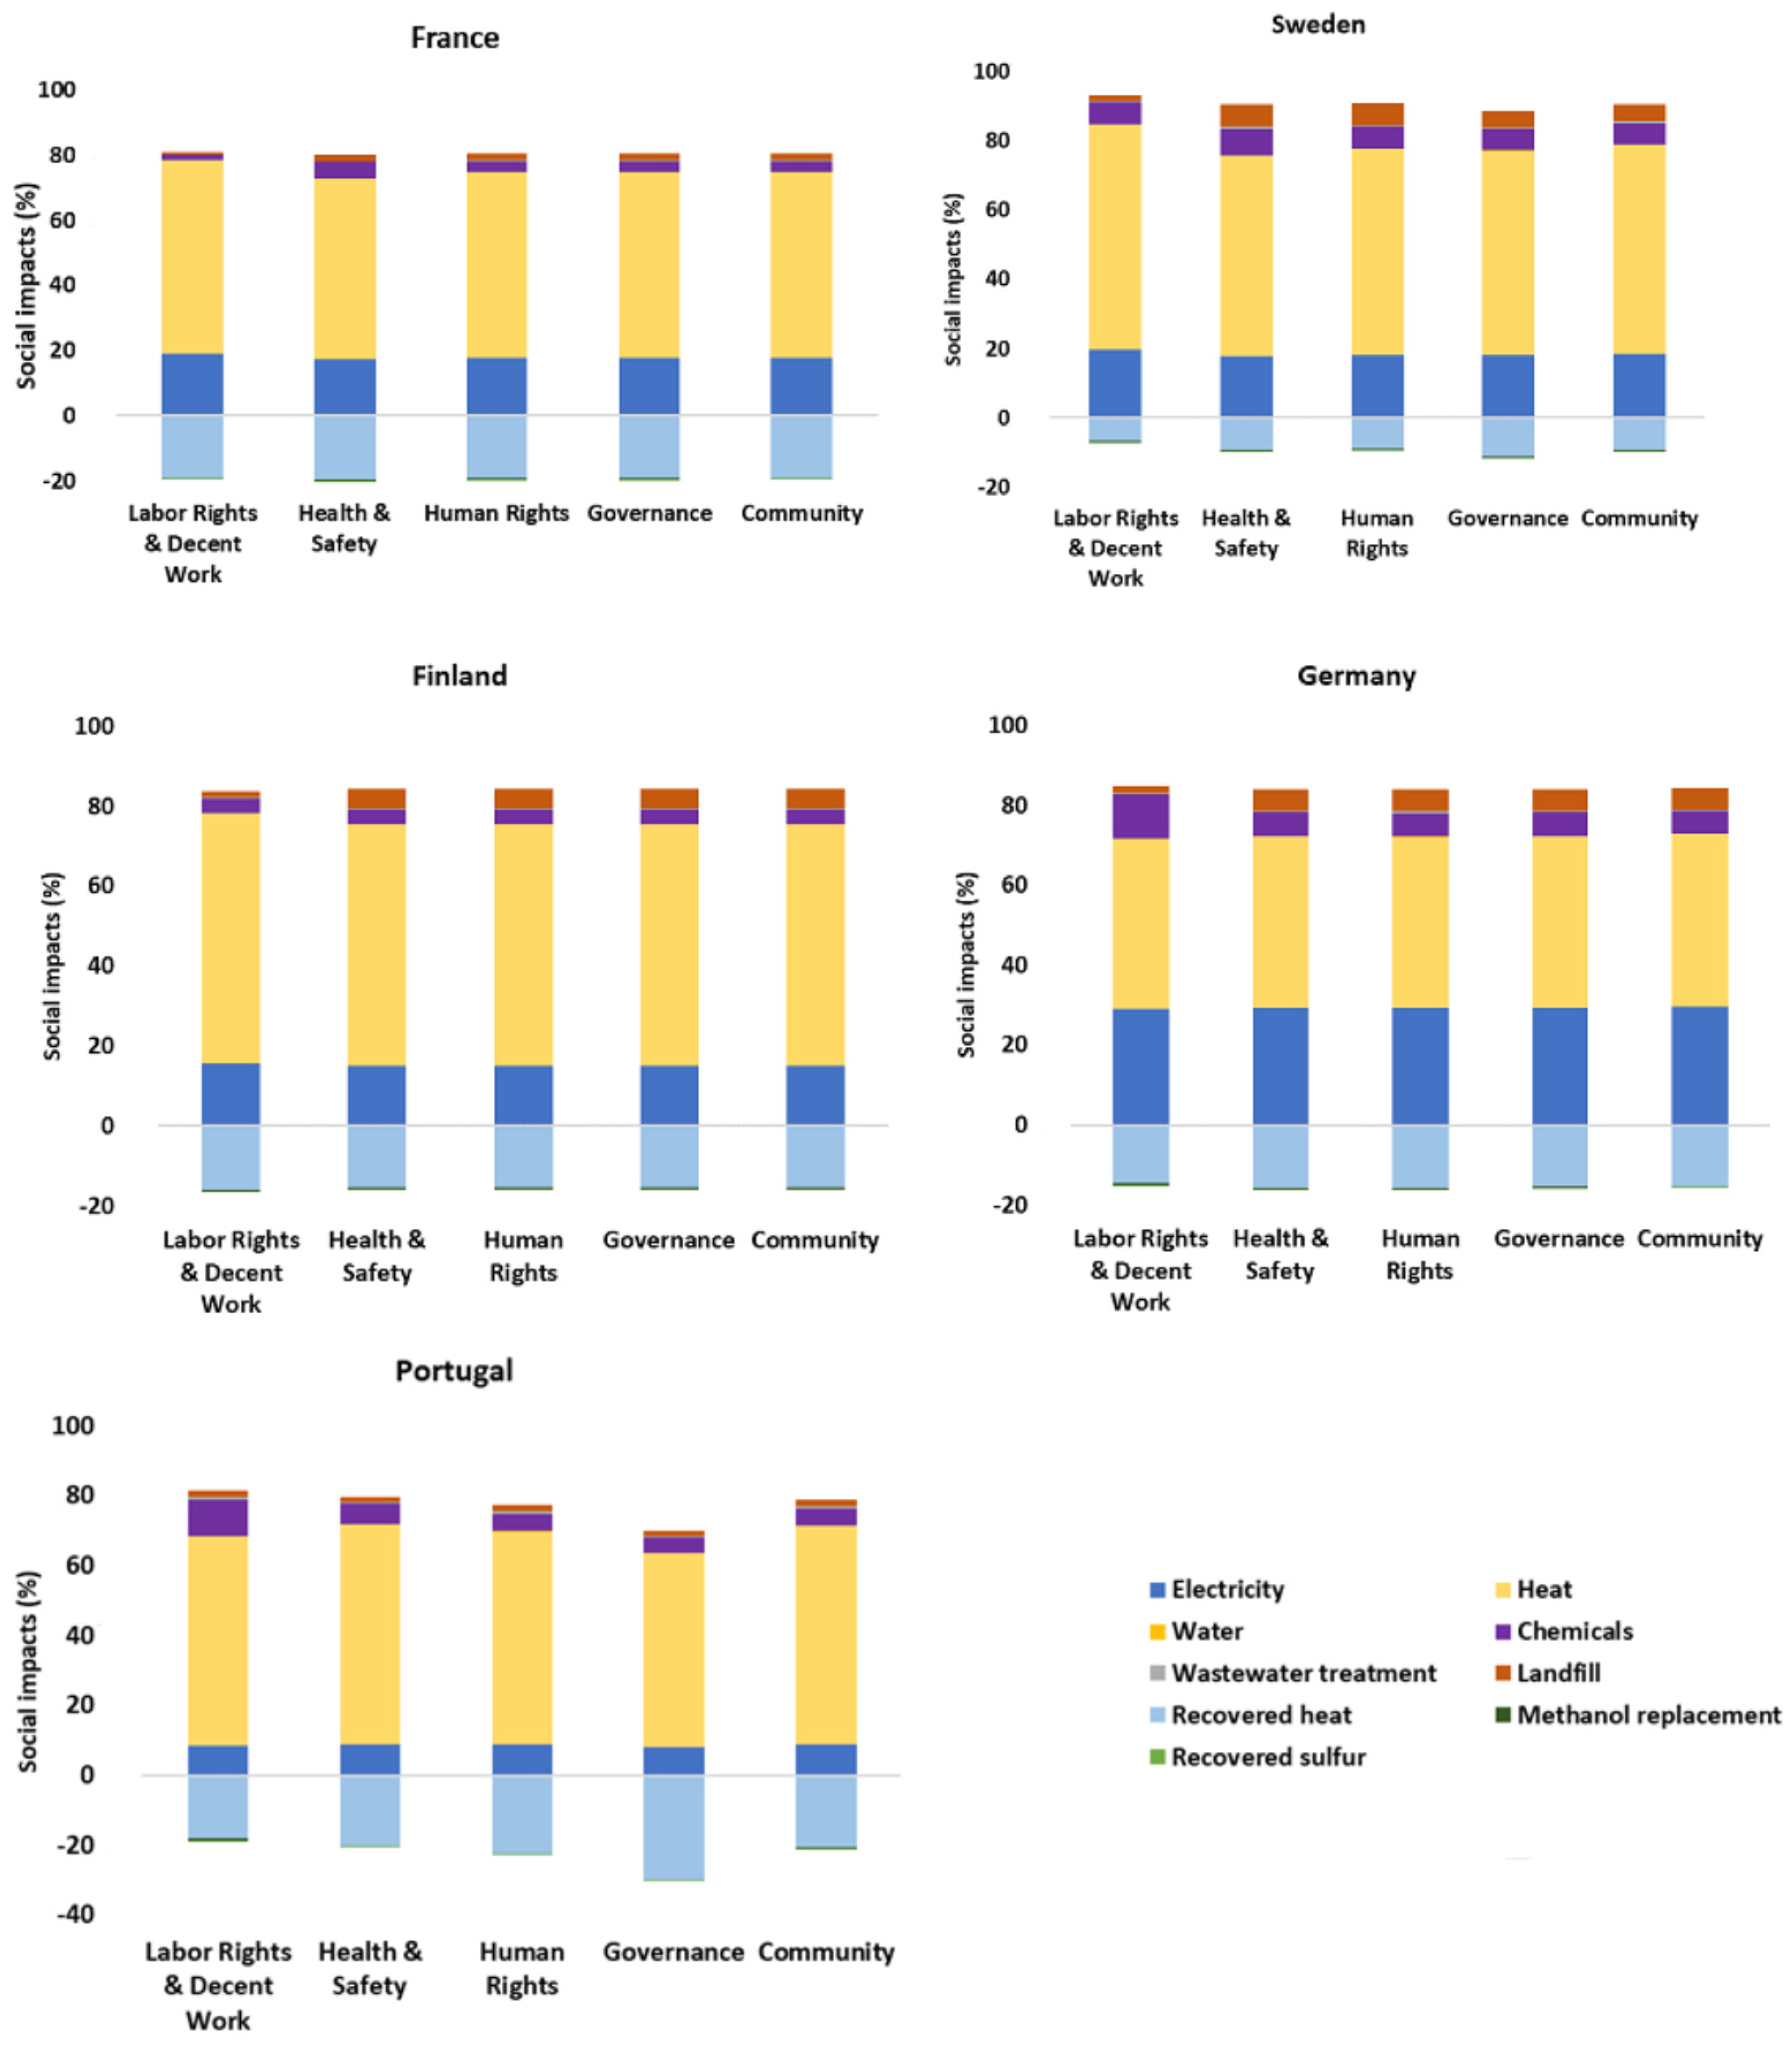
Figure 8 presents the social impacts linked to the implementation of the BtL system for all countries, expressed as the contribution to the total social impact of all input/outputs. For all investigated countries, heat and electricity consumption in the BtL process are the major contributors to social impact according to the hotspot analysis. Therefore, heat recovery during the process decreases the social impact in total. In Germany, electricity consumption makes a larger contribution to the social impact compared to other countries. The contributions to social impact of chemicals and landfills are small for all countries, but vary. The values of impact categories in medium risk hours are given in Table S2 in the Supplementary Materials.
The total social impacts in all investigated countries related to the French case are given in Figure 9. The countries have different strengths and weaknesses. Sweden has the lowest impacts in Health and Safety and Governance, but the Human Rights and Community impacts should be further investigated. Finland has the highest impacts in Human Rights (eight times that of France). Portugal has the highest impact in terms of Labor Rights and Decent Work and Health and Safety and the second highest impact in the Community category, but, on the other hand, it has one of the lowest impacts in Human Rights and Governance. In a possible application in France, Governance-related social issues in the Legal System and Corruption subcategories should be evaluated, further according to this assessment.
Site-specific analysis results showed that on the reference scale from −2 to 2, Health and Safety can be ranked as 1 since occupational health and safety policy exists in the sector and risks are assessed systematically. Access to Material Resources is given the highest score because the BtL process uses the residues of the pulp mill and contributes to less consumption of material resources. In addition, waste-stream management is improved constantly. Promoting Social Responsibility and Technology Development also receive the highest scores, whereas Contribution to Economic Development receives a score of 1. The site-specific social assessment indicates an overall positive social effect for the local community, value chain actors, and society if the studied concept is implemented. Important social aspects include (i) job creation potential at the pulp mill, but also for suppliers of equipment; (ii) economic development through job creation, new business opportunities, and technology development; and (iii) health and safety for the workers due to the new process. The details of the site-specific analysis can be found in [46].

4. Discussion and Conclusions

The findings in terms of the techno-economic, social, and environmental performance of the BtL pathway in focus are discussed in this section, which ends with the main conclusions of the study and future research needs.

4.1. Environmental Performance Is Promising but Varies

The climate impact from FT biodiesel production for the investigated countries varies considerably. The corresponding GHG saving, estimated based on REDII (and its fossil fuel comparator of 94 g CO2eq/MJ [10]), is 12–83% (pilot scale). Thus, low-carbon electricity, or further process integration and optimization, is needed for the biodiesel produced from pulp mill residues by the developed BtL process to be a viable option for all investigated countries. Large-scale production will also lower the environmental impacts. However, the climate impact is promising in some countries, also, with the current assumptions.
Electricity and heat consumption are the main contributors to all the assessed environmental impacts of the studied BtL process (including, in addition to climate impact, eutrophication, acidification, and the depletion of resources), which is confirmed by the literature, e.g., [24]. A sustainability investigation of biodiesel production from 15 different biomasses [24] showed that fuel and electricity consumption during the biodiesel production is the major contributor to GHG emissions, even though the level of contribution varies for routes that uses different biomass resources. As the BtL pathway explored in this study is based on residues, it does not directly contribute to the demand for more questionable raw materials from a sustainability perspective.
The S-LCA showed that two levels of analysis provide different yet complementary results. The results provided using data from SHDB [42] can be used to determine most critical social issues linked to the implementation of the studied BtL process in different countries. Site-specific analysis makes it possible to focus on the facility and positive aspects like the contribution of a new application in technology and economic development. These results can be considered for decision making and policy implications for BtL process implementation. When formulating policies, as proposed also by Ekener-Petersen et al. [30], stringent procurement standards for social performance should be established for both fossil fuels and biofuels.
Limitations of the social impact assessment include the relatively low number of interviewees for site-specific S-LCA (due to the low TRL) and the general lack of applications of emerging technologies for site-specific S-LCAs wherein the approach can be followed, as site-specific S-LCA is generally conducted for processes in actual plants. The views from a broader set of relevant stakeholders linked to the BtL pathway could improve the findings from the S-LCA [46].

4.2. Production Cost Estimate Is Low but Uncertain

The production cost of FT biodiesel is estimated at 13.9 €/GJ (or 50 €/MWh or 0.47 €/L), and the corresponding cost for the crude (which is upgraded to diesel) at 12.8 €/GJ (or 46 €/MWh or 0.43 €/L). According to the sensitivity analysis, the crude production cost may vary between 8.1 and 24.7 €/GJ (diesel production cost: 9.2–25.8 €/GJ). The estimated production cost is low in comparison to estimates in literature (see Section 3.1.2). The main difference is the CAPEX estimate. CAPEX affects the production considerably. It is associated with large uncertainties, which can be explained by the low TRL. Thus, further research is needed to better estimate the costs as the technology matures.
The biomass cost is important for the OPEX as it also affects the production cost substantially. The biomass cost used, 5.6 €/GJ (20 €/MWh), based on [36,37], is, however, in the same magnitude as other estimates in the literature, and does not explain the low production cost. The actual production cost is also affected by the crude cut, i.e., whether FT diesel or bio-wax production is maximized [60,61]. Since the bio-wax commands a higher price, a larger bio-wax cut could lower the FT diesel production cost, but would also imply lower diesel production.
Haarlemmer and Boissonnet [56] describe how cost estimates in general tend to increase as technologies mature and know-how is accumulated up to a certain point when the estimated costs start to decrease. This point typically occurs when the first demonstration plant is built [56]. As the studied BtL pathway is novel, this could partly explain the relatively low-cost estimate of this pathway compared to many alternatives, and the production cost could thus increase as more research is conducted.
Limitations of the study include that the environmental LCA and the techno-economic assessment are based on process simulation and not data collected from an actual plant, in addition to additional general uncertainties linked to the assessment of emerging technologies with low TRL (or where at least part of the process has a relatively low TRL) using LCA and techno-economic assessment. Also, assumptions made in the underlying sources used for the techno-economic assessment may have influenced the estimate.
An important incentive for pulp mills to incorporate the BtL process is the potential to alleviate bottlenecks in pulp production caused by the limitations of recovery boilers [64]. This could potentially represent large economic savings for a pulp mill.
The profitability could improve further if the BtL process is implemented at a pulp mill of a larger scale. The TEA has been performed based on data from a pulp mill situated in France, with a pulp production volume about half the size of the average pulp mills in Sweden and Finland, where 60% of the paper pulp in Europe is produced [17]. In larger-scale mills, larger biomass volumes will be available internally, which could reduce the logistics cost. The allocation of the BtL process at a Swedish or Finnish pulp mill would also change the economic prerequisites in terms of the price levels for commodities such as electricity and water. Also, the biomass market prices vary locally depending on transportation distances.
For pulp mill owners, the findings of this study indicate that there are promising BtL pathways, which are possible to integrate with pulp mills, to explore further and to invest in to broaden a business. For this BtL pathway to be feasible, it is necessary to establish a business model and cooperation among key actors including a biofuel producer, a refinery, and, preferably, a large-scale pulp mill open for process integration. One example of a similar actor constellation is the company Sunpine. Sunpine was founded by the oil company Preem and by Swedish forest companies. Preem owns refineries in Sweden that receive a biocrude from Sunpine based on forest residues [67]. However, the proper business model is context-dependent.
The relatively low production cost and, in some cases, high climate performance of the studied BtL fuel (resulting in a relatively low carbon abatement cost compared to other biofuels) indicates that it would be attractive on markets promoting biofuels with high climate performance in relation to the production cost, such as the reduction quota in Sweden or the German and Czech equivalences [11]. The actual production cost is, however, crucial for the performance. The studied BtL fuel would also be attractive on the advanced fuels market since its feedstocks are within the list of approved feedstocks in REDII [10]. Thus, to support the assessed BtL pathway, the implementation of national policies promoting biofuels with high climate performance in relation to cost, such as reduction quotas, as well as specifically promoting so-called advanced fuels in more countries, is needed. This could also include investment support for BtL pathways integrated with pulp mills.

4.3. Conclusion and Future Perspectives

The assessed BtL pathway has promising performance in terms of economic, environmental, and social impacts. The techno-economic analysis indicates a low but uncertain production cost for the BtL concept (due to a low TRL). The LCA shows potential for low climate and other environmental impacts, albeit with large variation depending on the country of implementation. Social hotspot analysis concludes that the most important negative social impacts are related to the use of electricity and heat. However, the importance of the types of social impact differs between countries. On the other hand, site-specific social assessment finds an overall positive potential social impact in terms of, for example, promoting social responsibility, access to resources, and technology development linked to the implementation of the BtL process. Heat recovery, e.g., through integration with the pulp mill, is important to reduce the negative impact in terms of both environmental and social impacts.
In this study, an assessment covering all three aspects of sustainability has been conducted on an early design stage of a new process. In terms of future research, the studied BtL pathway and, particularly, the hydrothermal supercritical water gasification of black liquor needs to be developed further from a technical perspective. The development of the process will provide updated data for the environmental and techno-economic assessments and will improve the accuracy of these further. Linked to this, also, the impact on the environmental and economic performance of the possibility to further enhance the process integration and optimization of the processes needs to be assessed further. In addition, to estimate the actual GHG performance and other environmental impacts of a specific biodiesel production chain based on the explored BtL concept linked to a specific pulp mill, an environmental LCA needs to be conducted for the final setting up of the production process as it may differ somewhat from the process proposed in this project for technical and economic reasons.
In terms of social impacts, it would be valuable if all relevant stakeholders that would be affected by the process implementation explored in this study could be interviewed in future studies. This includes specialists working with the various process steps, workers and managers at mills, and the local community who live nearby the pulp mill. This would improve the understating of the impact on each stakeholder. Also, an assessment of social impacts should be conducted after the potential implementation of the assessed BtL fuel pathway. This is because the findings of early-stage assessments may differ from the results of the same assessment performed after the implementation of the technology at an industrial scale.

Supplementary Materials

The following supporting information can be downloaded at: https://www.mdpi.com/article/10.3390/en17010099/s1, Figure S1: Simplified process flow diagram of Kraft process; Figure S2: Process diagram for the BtL process; Table S1: Main inventory data of the FT system (Functional Unit: 1 MJ biodiesel), materials (kg), energy (MJ), and wastewater (m3); Table S2: Total social impacts in medium-risk-hour equivalents for implementation of the PulpAndFuel concept in different countries; and Text S1: System description of a kraft mill.

Author Contributions

Conceptualization, N.E. (Nilay Elginoz), J.H., S.K., T.L. and S.P.; methodology, N.E. (Nilay Elginoz), J.G., S.P., S.K. and T.L.; validation, N.E. (Nilay Elginoz), J.H., S.K., T.L. and S.S.; formal analysis, N.E. (Nilay Elginoz), J.G., S.K., T.L. and S.P.; investigation, N.E. (Nora Efraimsson), N.E. (Nilay Elginoz), J.G., J.H., F.H., S.J., S.K., T.L., P.H., S.P., S.S. and K.T.; data curation, J.G., F.H. and K.T.; writing—original draft preparation, N.E. (Nilay Elginoz), J.H., S.K., T.L. and S.S.; writing—review and editing, N.E. (Nilay Elginoz), J.H., S.K., T.L. and S.S; visualization, N.E. (Nilay Elginoz), S.K., T.L. and S.S.; supervision, N.E. (Nilay Elginoz), J.H. and S.K.; project administration, S.K.; funding acquisition, J.H. All authors have read and agreed to the published version of the manuscript.

Funding

This research was funded by the European Union’s Horizon 2020 research and innovation program under grant agreement N.818011, i.e., it was performed within the framework of the Pulp and Fuel project (Pulp and Paper Industry Wastes to Fuel). The project Mistra Carbon Exit Phase 2, DIA 2016/12, funded by Mistra—the Swedish Foundation for Strategic Environmental Research—is also acknowledged.

Data Availability Statement

Some of the data presented in this study are available on request from the corresponding author. The data are not publicly available since they are mixed with 3rd-party data. Restrictions apply to the availability of the latter data. Data were obtained from various industrial partners and those data are available in the case of permission from the specific third parties.

Acknowledgments

It is a pleasure to thank all the PulpAndFuel project partners for their support to this study.

Conflicts of Interest

The authors declare no conflict of interest. The funders had no role in the design of the study; in the collection, analyses, or interpretation of data; in the writing of the manuscript; or in the decision to publish the results.

Abbreviations

APAcidification potential
BtLBiomass-to-liquid
CAPEX Capital expenditures
EF Entrained flow
EPEutrophication potential
EUEuropean Union
FUFunctional unit
FTFischer–Tropsch
GHGGreenhouse gas emissions
GWPGlobal warming potential
LCALife cycle assessment
OPEXOperational expenditures
REDIIUpdated Renewable Energy
SCWGSupercritical water gasification
SHDBSocial hotspots database
S-LCASocial life cycle assessment
TEATechno-economic analysis
TRLTechnology Readiness Level

References

  1. Safarian, S.; Unnthorsson, R.; Richter, C. Hydrogen production via biomass gasification: Simulation and performance analysis under different gasifying agents. Biofuels 2022, 13, 717–726. [Google Scholar] [CrossRef]
  2. Safarian, S. To what extent could biochar replace coal and coke in steel industries? Fuel 2023, 339, 127401. [Google Scholar] [CrossRef]
  3. EIA. Transportation Sector Energy Consumption. 2016. Available online: https://www.eia.gov/outlooks/ieo/pdf/transportation.pdf (accessed on 7 March 2023).
  4. EIA. Global Greenhouse Gas Emissions by the Transportation Sector. 2014. Available online: https://transportgeography.org/contents/chapter4/transportation-and-environment/greenhouse-gas-emissions-transportation/ (accessed on 7 March 2023).
  5. ICCT. Transport Could Burn up the EU’s Entire Carbon Budget. 2021. Available online: https://theicct.org/transport-could-burn-up-the-eus-entire-carbon-budget/ (accessed on 7 March 2023).
  6. Zandt, F. Diesel and Petrol Cars Losing Ground in the EU. 2021. Available online: https://www.statista.com/chart/26037/market-share-of-cars-registered-in-the-eu-by-fuel-type/ (accessed on 7 March 2023).
  7. ACEA. Average Age of the EU Vehicle Fleet, by Country. 2023. Available online: https://www.acea.auto/figure/average-age-of-eu-vehicle-fleet-by-country/ (accessed on 10 June 2023).
  8. ACEA. Electrification Trends Worldwide. 2023. Available online: https://www.acea.auto/news/electrification-trends-worldwide/ (accessed on 2 March 2023).
  9. European Environment Agency. Share of Energy from Renewable Sources Used in Transport in EUROPE. 2022. Available online: https://www.eea.europa.eu/data-and-maps/daviz/share-of-renewable-energy-10/#tab-chart_10 (accessed on 7 March 2023).
  10. European Commission. Renewable Energy Directive. 2018. Available online: https://eur-lex.europa.eu/legal-content/EN/TXT/?uri=uriserv:OJ.L_.2018.328.01.0082.01.ENG&toc=OJ:L:2018:328:TOC (accessed on 4 February 2023).
  11. United States Department of Agriculture. Biofuel Mandates in the EU by Member State. 2022. Available online: https://apps.fas.usda.gov/newgainapi/api/Report/DownloadReportByFileName?fileName=Biofuel%20Mandates%20in%20the%20EU%20by%20Member%20State%20-%202022_Berlin_European%20Union_E42022-0044.pdf (accessed on 20 May 2023).
  12. ePure. Overview of Biofuels Policies and Markets across the EU-27 and the UK. 2020. Available online: https://www.epure.org/wp-content/uploads/2021/01/201104-DEF-REP-Overview-of-biofuels-policies-and-markets-across-the-EU-Nov.-2020.pdf (accessed on 20 May 2023).
  13. Murray, J.W. Limitations of oil production to the IPCC scenarios: The new realities of US and Global oil production. BioPhys. Econ. Resour. Qual. 2016, 1, 13. [Google Scholar] [CrossRef]
  14. Mo, W.; Xiong, Z.; Leong, H.; Gong, X.; Jiang, L.; Xu, J.; Su, S.; Hu, S.; Wang, Y.; Xiang, J. Processes simulation and environmental evaluation of biofuel production via Co-pyrolysis of tropical agricultural waste. Energy 2022, 242, 123016. [Google Scholar] [CrossRef]
  15. Ala’a, H.; Osman, A.I.; Jamil, F.; Mehta, N.; Al-Haj, L.; Coulon, F.; Al-Maawali, S.; Al Nabhani, A.; Kyaw, H.H.; Myint, M.T.Z.; et al. Integrating life cycle assessment and characterisation techniques: A case study of biodiesel production utilising waste Prunus Armeniaca seeds (PAS) and a novel catalyst. J. Environ. Manag. 2022, 304, 114319. [Google Scholar] [CrossRef]
  16. Gouran, A.; Aghel, B.; Nasirmanesh, F. Biodiesel production from waste cooking oil using wheat bran ash as a sustainable biomass. Fuel 2021, 295, 120542. [Google Scholar] [CrossRef]
  17. CEPI. Key Statistics 2021—European Pulp & Paper Industry. 2022. Available online: https://www.cepi.org/wp-content/uploads/2022/07/Key-Statistics-2021-Final.pdf (accessed on 18 April 2023).
  18. Food and Agriculture Organization of the United Nations. Forestry Production and Trade. 2023. Available online: https://unece.org/sites/default/files/2023-04/DP94-TF2022-web.pdf (accessed on 18 April 2023).
  19. European Commission. Grant Agreement Number 818011 Pulp and Fuel. 2018. Available online: https://cordis.europa.eu/project/id/818011 (accessed on 11 June 2023).
  20. Jha, S.; Nanda, S.; Acharya, B.; Dalai, A.K. A Review of Thermochemical Conversion of Waste Biomass to Biofuels. Energies 2022, 15, 6352. [Google Scholar] [CrossRef]
  21. Rajaeifar, M.A.; Akram, A.; Ghobadian, B.; Rafiee, S.; Heijungs, R.; Tabatabaei, M. Environmental impact assessment of olive pomace oil biodiesel production and consumption: A comparative lifecycle assessment. Energy 2016, 106, 87–102. [Google Scholar] [CrossRef]
  22. Rajaeifar, M.A.; Ghobadian, B.; Safa, M.; Heidari, M.D. Energy life-cycle assessment and CO2 emissions analysis of soybean-based biodiesel: A case study. J. Clean. Prod. 2014, 66, 233–241. [Google Scholar] [CrossRef]
  23. Rajaeifar, M.A.; Tabatabaei, M.; Abdi, R.; Latifi, A.M.; Saberi, F.; Askari, M.; Zenouzi, A.; Ghorbani, M. Attributional and consequential environmental assessment of using waste cooking oil-and poultry fat-based biodiesel blends in urban buses: A real-world operation condition study. Biofuel Res. J. 2017, 4, 638. [Google Scholar] [CrossRef]
  24. Safarian, S.; Sattari, S.; Hamidzadeh, Z. Sustainability assessment of biodiesel supply chain from various biomasses and conversion technologies. BioPhys. Econ. Resour. Qual. 2018, 3, 6. [Google Scholar] [CrossRef]
  25. Rahimi, V.; Karimi, K.; Shafiei, M.; Naghavi, R.; Khoshnevisan, B.; Ghanavati, H.; Mohtasebi, S.S.; Rafiee, S.; Tabatabaei, M. Well-to-wheel life cycle assessment of Eruca Sativa-based biorefinery. Renew. Energy 2018, 117, 135–149. [Google Scholar] [CrossRef]
  26. Khoshnevisan, B.; Rafiee, S.; Tabatabaei, M.; Ghanavati, H.; Mohtasebi, S.S.; Rahimi, V.; Shafiei, M.; Angelidaki, I.; Karimi, K. Life cycle assessment of castor-based biorefinery: A well to wheel LCA. Int. J. Life Cycle Assess. 2018, 23, 1788–1805. [Google Scholar] [CrossRef]
  27. Hosseinzadeh-Bandbafha, H.; Nizami, A.S.; Kalogirou, S.A.; Gupta, V.K.; Park, Y.K.; Fallahi, A.; Sulaiman, A.; Ranjbari, M.; Rahnama, H.; Aghbashlo, M.; et al. Environmental life cycle assessment of biodiesel production from waste cooking oil: A systematic review. Renew. Sustain. Energy Rev. 2022, 161, 112411. [Google Scholar] [CrossRef]
  28. anak Erison, A.E.; Tan, Y.H.; Mubarak, N.M.; Kansedo, J.; Khalid, M.; Abdullah, M.O.; Ghasemi, M. Life cycle assessment of biodiesel production by using impregnated magnetic biochar derived from waste palm kernel shell. Environ. Res. 2022, 214, 114149. [Google Scholar] [CrossRef] [PubMed]
  29. Canabarro, N.I.; Silva-Ortiz, P.; Nogueira, L.A.H.; Cantarella, H.; Maciel-Filho, R.; Souza, G.M. Sustainability assessment of ethanol and biodiesel production in Argentina, Brazil, Colombia, and Guatemala. Renew. Sustain. Energy Rev. 2023, 171, 113019. [Google Scholar] [CrossRef]
  30. Ekener-Petersen, E.; Höglund, J.; Finnveden, G. Screening potential social impacts of fossil fuels and biofuels for vehicles. Energy Policy 2014, 73, 416–426. [Google Scholar] [CrossRef]
  31. Granacher, J.; Nguyen, T.V.; Castro-Amoedo, R.; McDonald, E.C.; Maréchal, F. Enhancing biomass utilization by combined pulp and fuel production. Front. Energy Res. 2022, 10, 979502. [Google Scholar] [CrossRef]
  32. Granacher, J.N.; Tuong-Van, S.M.; François, S. Energy Integration Model N1. In Pulp and Paper Industry Waste to Fuel; École Polytechnique Fédérale de Lausanne: Lausanne, Switzerland, 2021. [Google Scholar]
  33. Kannangara, M.; Bensebaa, F.; Vasudev, M. An adaptable life cycle greenhouse gas emissions assessment framework for electric, hybrid, fuel cell and conventional vehicles: Effect of electricity mix, mileage, battery capacity and battery chemistry in the context of Canada. J. Clean. Prod. 2021, 317, 128394. [Google Scholar] [CrossRef]
  34. Turton, R.; Bailie, R.C.; Whiting, W.B.; Shaeiwitz, J.A. Analysis, Synthesis, and Design of Chemical Processes; Pearson Education: London, UK, 2018. [Google Scholar]
  35. Maxwell, C. Cost Indices. 2023. Available online: https://www.toweringskills.com/financial-analysis/cost-indices/ (accessed on 8 October 2023).
  36. Haarlemmer, G.; Boissonnet, G.; Imbach, J.; Setier, P.A.; Peduzzi, E. Second generation BtL type biofuels—A production cost analysis. Energy Environ. Sci. 2012, 5, 8445–8456. [Google Scholar] [CrossRef]
  37. Lönnqvist, T.; Hansson, J.; Klintbom, P.; Furusjö, E.; Holmgren, K. Drop-in the Tank or a New Tank? 2021. Available online: https://f3centre.se/en/renewable-transportation-fuels-and-systems/ (accessed on 23 January 2023).
  38. Baltpool. Biomass and Heat Trade Statistics March of 2022. 2023. Available online: https://www.baltpool.eu/en/biomass-and-heat-trade-statistics-march-of-2022/ (accessed on 10 June 2023).
  39. Statista. 2022. Available online: https://www.statista.com/statistics/1267500/eu-monthly-wholesale-electricity-price-country/ (accessed on 11 June 2023).
  40. Peduzzi, E. Biomass to Liquids: Thermo-Economic Analysis and Multi-Objective Optimisation. Ph.D. Thesis, École Polytechnique Fédérale de Lausanne, Lausanne, Switzerland, 2015. [Google Scholar]
  41. Benoît Norris, C.; Traverzo, M.; Neugebauer, S.; Ekener, E.; Schaubroeck, T.; Russo Garrido, S. Guidelines for Social Life Cycle Assessment of Products and Organizations 2020; United Nations Environment Programme: Nairobi, Kenya, 2020. [Google Scholar]
  42. Benoit Norris, C.; Bennema, M.; Norris, G. The Social Hotspots Database V4; NewEarth B: Lois Ln, ME, USA, 2019. [Google Scholar]
  43. Marting Vidaurre, N.A.; Jurišić, V.; Bieling, C.; Magenau, E.; Wagner, M.; Kiesel, A.; Lewandowski, I. Social assessment of miscanthus cultivation in Croatia: Assessing farmers’ preferences and willingness to cultivate the Crop. GCB Bioenergy 2023, 15, 916–931. [Google Scholar] [CrossRef]
  44. Goedkoop, M.J.; Indrane, D.; de Beer, I.M. Product Social Impact Assessment Handbook-2020; PRé Sustainability: Amersfoort, The Netherlands, 2020. [Google Scholar]
  45. Herrera Almanza, A.M.; Corona, B. Using social Life Cycle Assessment to analyze the contribution of products to the Sustainable Development Goals: A case study in the textile sector. Int. J. Life Cycle Assess. 2020, 25, 1833–1845. [Google Scholar] [CrossRef]
  46. Efraimsson, N.; Johnsson, S. Potential Social Impacts of a Possible Implementation of the Pulp & Fuel Concept for Producing Biofuels at a Pulp Mill. Bachelor’s Thesis, University of Borås, Borås, Sweden, 2022. Available online: http://urn.kb.se/resolve?urn=urn:nbn:se:hb:diva-27955 (accessed on 23 January 2023).
  47. Swanson, R.M.; Platon, A.; Satrio, J.A.; Brown, R.C. Techno-economic analysis of biomass-to-liquids production based on gasification. Fuel 2010, 89, S11–S19. [Google Scholar] [CrossRef]
  48. Gasafi, E.; Reinecke, M.Y.; Kruse, A.; Schebek, L. Economic analysis of sewage sludge gasification in supercritical water for hydrogen production. Biomass Bioenergy 2008, 32, 1085–1096. [Google Scholar] [CrossRef]
  49. Ulrich, G.D. A Guide to Chemical Engineering Process Design and Economics; Wiley: New York, NY, USA, 1984. [Google Scholar]
  50. Xu, J.; Zhang, X.; Cheng, J.J. Pretreatment of corn stover for sugar production with switchgrass-derived black liquor. Bioresour. Technol. 2012, 111, 255–260. [Google Scholar] [CrossRef] [PubMed]
  51. Stewart, M.; Arnold, K. Gas-Liquid and Liquid-Liquid Separators; Gulf Professional Publishing: Houston, TX, USA, 2008. [Google Scholar]
  52. Micheletti, A. Innovation at Top Industrie. In Proceedings of the General Assembly of the PulpAndFuel Project, Trondheim, Norway, 14 June 2022. [Google Scholar]
  53. Santa, R. Overview of innovations for the pulp and paper industry. In Proceedings of the General Assembly of the PulpAndFuel Project, Trondheim, Norway, 14 June 2022. [Google Scholar]
  54. Andersson, J.; Lundgren, J.; Marklund, M. Methanol production via pressurized entrained flow biomass gasification—Techno-economic comparison of integrated vs. stand-alone production. Biomass Bioenergy 2014, 64, 256–268. [Google Scholar] [CrossRef]
  55. Stigsson, C.C.; Furusjö, E.; Börjesson, P. Sunalfa, System Oriented Analysis of Processes for Renewable Fuels from Forest Raw Material. 2021. Available online: https://f3centre.se/app/uploads/FDOS-14-2021_P46969-1_SR-210517.pdf (accessed on 6 March 2023).
  56. Haarlemmer, G.; Boissonnet, G.; Peduzzi, E.; Setier, P.A. Investment and production costs of synthetic fuels—A literature survey. Energy Environ. Sci. 2014, 66, 667–676. [Google Scholar] [CrossRef]
  57. Eurostat. Gas Prices by Type of Users. 2022. Available online: https://ec.europa.eu/eurostat/databrowser/view/ten00118/default/table?lang=en (accessed on 10 June 2023).
  58. Boucher, J. Recent updates of the processes at Pulp Mill Fibre Excellence. In Proceedings of the General Assembly of the PulpAndFuel Project, Trondheim, Norway, 14 June 2022. [Google Scholar]
  59. Hedman, F.; Tjus, K.; Sellin, J.; Karlsson, J.; Särnbratt, M.; Kanders, L. PulpAndFuel D2.4 Effluent Management (Confidential Report); IVL Swedish Environmental Research Institute: Stockholm, Sweden, 2023. [Google Scholar]
  60. Economics, M. Industrial Transformation 2050—Pathways to Net-Zero Emissions from EU Heavy Industry; University of Cambridge Institute for Sustainability Leadership (CISL): Cambridge, UK, 2019. [Google Scholar]
  61. Electricity supply, district heating and supply of natural gas 2020. In Final Statistics; Statistics Sweden: Solna, Sweden, 2021.
  62. European Commission. Building Up the Future Cost of Biofuel. 2018. Available online: https://op.europa.eu/en/publication-detail/-/publication/13e27082-67a2-11e8-ab9c-01aa75ed71a1 (accessed on 23 January 2023).
  63. Dietrich, R.U.; Albrecht, F.G.; Maier, S.; König, D.H.; Estelmann, S.; Adelung, S.; Bealu, Z.; Seitz, A. Cost calculations for three different approaches of biofuel production using biomass, electricity and CO2. Biomass Bioenergy 2018, 111, 165–173. [Google Scholar] [CrossRef]
  64. Afri, Y.; Wetterlund, E.; Mesfun, S.; Rådberg, H.; Mossberg, J.; Hulteberg, C.; Furusjö, E. Combining expansion in pulp capacity with production of sustainable biofuels—Techno-economic and greenhouse gas emissions assessment of drop-in fuels from black liquor part-streams. Appl. Energy 2020, 279, 115879. [Google Scholar] [CrossRef]
  65. Survailance Report Regarding Tax Exemption for Pure and High Blend-in Biofuels during 2021; Swedish Energy Agency: Eskilstuna, Sweden, 2022.
  66. Hansson, J.; Nojpanya, P.; Ahlström, J.; Furusjö, E.; Lundgren, J.; Gustavsson Binder, T. Costs for Reducing GHG Emissions from Road and Air Transport with Biofuels and Electrofuels; IVL Swedish Environmental Research Institute: Stockholm, Sweden, 2023. [Google Scholar]
  67. Hellsmark, H.; Hansen, T. A new dawn for (oil) incumbents within the bioeconomy? Trade-offs and lessons for policy. Energy Policy 2020, 145, 111763. [Google Scholar] [CrossRef]
Figure 1. Process map for FT fuel production. Wet gasification includes steps 1–4 (marked in yellow), dry gasification includes steps 5–8 (marked in blue), and FT synthesis and upgrading includes steps 9–10 (marked in green).
Energies 17 00099 g001
Figure 2. System boundaries used in the techno-economic assessment and environmental and social life cycle assessment, respectively.
Energies 17 00099 g002
Figure 3. Estimated production cost of BtL in literature [57,63,64,65,66]. In case the reference used presents an interval this is indicated with a line in the figure.
Energies 17 00099 g003
Figure 4. Environmental impacts of the assessed BtL system when assumed to be implemented in five different EU countries, illustrated via the share for each impact of different factors (−20 refers to −20). WW: wastewater, GWP: global warming potential, REDII: renewable energy directive, AP: acidification potential, EP: eutrophication potential, and ADP: abiotic depletion potential.
Energies 17 00099 g004
Figure 5. Contribution of various processes to the environmental impacts from the reference case of France. −20 refers to −20. GWP: global warming potential, REDII: renewable energy directive, AP: acidification potential, EP: eutrophication potential, and ADP: abiotic depletion potential.
Energies 17 00099 g005
Figure 6. Normalized environmental impacts in relation to the French reference case. GWP: global warming potential, REDII: renewable energy directive, AP: acidification potential, EP: eutrophication potential, and ADP: abiotic depletion potential.
Energies 17 00099 g006
Figure 7. Normalized environmental impacts for pilot and large-scale cases in relation to the French case. GWP: global warming potential, REDII: Renewable energy directive, AP: acidification potential, EP: eutrophication potential, and ADP: abiotic depletion potential.
Energies 17 00099 g007
Figure 8. The contribution by different input/outputs to the total social impact for the studied social impact categories in the hotspot analysis. −20 refers to −20.
Energies 17 00099 g008
Figure 9. Comparison of total social impacts in different countries based on the hotspot level analysis.
Energies 17 00099 g009
Table 1. Brief overview of selected recent sustainability assessments of biodiesel pathways and their coverage of sustainability aspects. Covered aspects are marked with X.
Sustainability Aspects Covered
ReferencesEnvironmentalEconomicSocial
[22,23,25,26,27,28,29]X
[21]XX
[24]XXX
Table 2. Basic characteristic of the two assessed BtL scenarios, large-scale and pilot-scale, including raw materials, FT crude production, and change in electricity export (increase marked with + and decrease with −) from the case-study pulp mill.
PropertyLarge-ScalePilot-Scale
Biomass energy content (bark and black liquor) [PJ/year]10.8
Bark [tonnes TS/year]490,0008000
Black liquor [tonnes TS/year]86,0001200
FT crude production [tonnes/year]143,0001800
Changed electricity export [MWh/year]+189,000−14,000
Table 3. Estimated investment cost of the different components in the assessed BtL fuel process for the large-scale scenario. Alternative investment cost estimates for some of the costly components used for the sensitivity are also presented.
ComponentGrass Roots Cost
[M€]
SourceAlternative Grass Roots Cost
[M€]
Source
Hydrothermal gasification (including hydrolysis, salt separator, SCWG) 74.1[35,48]15–499[34,48,49,50,51,52]
Acid gas removal and Pressure Swing Adsorption3.9 -
Drying and torrefaction17[53]17–21[34,40,49,53]
Entrained flow gasifier 61.5[35,47]8–134[34,49,54,55]
Cold gas cleaning8.1[34,40,49]-
FT synthesis 45.9[35,47]10–45.9[34,35,40,47,49]
Water Gas Shift12.9[34,40,49]12.9–17[34,40,49,53]
Cobalt catalyst25.5 -
Upgrading5.6 -
Water treatment15.1 -
Total CAPEX269.6
Table 4. OPEX.
Table 4. OPEX.
Revenues[M€/year]Assumptions and Sources
Electricity sales14.358 €/MWh: average sale price for France, 2019–2020 [39]
Fixed costs[€/year]Assumptions and sources
Depreciation and financial costs26.610% of CAPEX:
Depreciation = 1/economic lifetime = 1/20 yrs = 5%
Financial costs = interest rate 5%
Maintenance and labor costs13.55% of CAPEX [40]
Variable costs[€/year]Assumptions and sources
Natural gas0.327.5 €/GJ [57]: average price for France, 2018–2020. Medium-sized industries, without taxes.
Fresh water0.0140.02 €/m3 [58]
Biomass feedstock50.15.6 €/GJ [36,37]
Water treatment4.5Based on cost estimates for treatment of actual wastewater streams from multiple processes in the BtL pathway used for experimental analysis [59]
Cooling0.63Mainly electricity [39]
Disposal0.48Mostly disposal of lime mud (calcium carbonate)
Table 5. Sensitivity analysis of FT crude production cost.
Crude Production Cost (€/GJ)Assumptions
8.1Biomass: 2.2 €/GJ; Electricity sales price: 58 €/MWh; investment cost: 269.6 M€
18.1Biomass: 9.2 €/GJ; Electricity sales price: 58 €/MWh; investment cost: 269.6 M€
9.4Investment cost: 121 M€; Biomass: 5.6 €/GJ; Electricity sales price: 58 €/MWh
24.7Investment cost: 760 M€; Biomass: 5.6 €/GJ; Electricity sales price: 58 €/MWh
11.7Electricity sales price: 87 €/MWh; Biomass: 5.6 €/GJ; investment cost: 269.6 M€
13.9Electricity sales price: 29 €/MWh; Biomass: 5.6 €/GJ; investment cost: 269.6 M€
Table 6. Total environmental impacts of the assessed BtL system when assumed to be implemented in five different EU countries. GWP: global warming potential, REDII: renewable energy directive, AP: acidification potential, EP: eutrophication potential, and ADP: abiotic depletion potential.
Impact IndicatorsFranceSwedenFinlandGermanyPortugal
GWP (g CO2eq/MJ)22.616.139.583.372.7
EP (g phosphate, PO4 eq/MJ)0.060.050.090.400.14
AP (g SO2eq/MJ)0.190.150.230.280.54
ADP fossil (g Sb/MJ)0.260.120.451.051.02
Disclaimer/Publisher’s Note: The statements, opinions and data contained in all publications are solely those of the individual author(s) and contributor(s) and not of MDPI and/or the editor(s). MDPI and/or the editor(s) disclaim responsibility for any injury to people or property resulting from any ideas, methods, instructions or products referred to in the content.