Article

Numerical Investigation of Interventions to Mitigate Heat Stress: A Case Study in Dubai

Innovative Technologies Laboratory, University of Picardie Jules Verne, 80000 Amiens, France
*
Author to whom correspondence should be addressed.
Energies 2024, 17(10), 2242; https://doi.org/10.3390/en17102242
Submission received: 19 March 2024 / Revised: 17 April 2024 / Accepted: 25 April 2024 / Published: 7 May 2024

Abstract

:
Urbanization and changes in microclimate have negative impacts on outdoor thermal comfort, making urban design more important. This study aims to improve outdoor thermal comfort in a local climate zone (LCZ) in Dubai using computational fluid dynamics (CFD) methods. This study evaluates cooling interventions, such as vegetation, architectural, and pavement material, using Reynolds-averaged Navier–Stokes (RANS) equations and the SIMPLE scheme. The results show that a combination of cooling interventions affects the average temperature between 4.44 °C and 6.14 °C. Light-colored ground material has a 5.4 °C cooling effect in the LCZ compared with dark-colored materials. The predicted mean vote (PMV) method is used to compare outdoor thermal comfort and the results show that thermal sensation in the LCZ improves from warm to slightly cool. Lastly, the most effective cooling interventions are, in order, shade structures, trees, chimneys, and bushes.

1. Introduction

Almost half of the world’s population prefers urban areas for living and this rate is predicted to reach 68% in the 2050s, as indicated by United Nations (UN) World Urbanization Prospects [1]. However, urban areas are more vulnerable because of the effect of urban heat islands (UHIs), high density, and pollution [2,3]. Consequently, in the context of climate change, heat waves are more persistent, longer in duration, and stronger, increasing thermal risks for the residents of urban areas [4]. Different factors that impact the UHI effect include urban structures, the thermophysical properties of the structures, and anthropogenic heat discharge. The temperature difference between urban and rural regions usually ranges from 3 to 5 °C during the day, but the difference can reach as high as 12 °C because of the moderate radiation of the heat from urban surfaces around evening time [5,6]. Also, heatwave periods are increasingly reoccurring in the current atmosphere, and it is known to be a serious and major threat to the health of human beings throughout the world [7]. Therefore, research studies regarding the determination of UHI intensity and improvement in city structures are increasing in volume [8,9].
By selecting heat mitigation strategies for our research in Dubai’s local climate zones (LCZs), we carefully considered their performance in various climatic contexts. This involved examining studies from regions with similar climatic characteristics to Dubai, such as arid or semi-arid climates, to gauge the suitability and efficacy of specific interventions. Additionally, insights gleaned from experiments conducted in contrasting climates informed our decision-making process, allowing us to tailor our approach to the unique environmental conditions of our study area [10,11].
Deviation between the numerical model and the experiments is crucial for a successful research study. For the numerical modeling of an LCZ considering wind flow and heat transfer mechanism (conduction, convection, and radiation effects), computational fluid dynamics (CFD) methods are commonly used. Fatima and Chaudhry focused on the verification of a numerical method by the implementation of experiments in a local climate zone (LCZ) in Dubai (UAE). For this purpose, a steady-state CFD model with Reynolds-average Navier–Stokes (RANS) equations was performed in the ANSYS Fluent environment. Obtained temperature values from the LCZ were compared between the numerical and experimental studies and it was observed that the error rate was acquired at 10.67%. Toparlar et al. performed a CFD model that included unsteady RANS equations with the realizable k-ε turbulence model by employing an ANSYS Fluent environment for the modeling of an LCZ in Rotterdam, the Netherlands [12]. During the numerical study, wind flow and heat transfer (conduction, convection, and radiation) effects were considered, and it was seen that the average deviation between the numerical and experimental studies reached 7.9% [13].
Kang et al. focused on the verification of cooling intervention modeling by using CFD methods for the mitigation of UHI intensity in LCZs. In an experimental environment, wind speed (WS) and turbulent kinetic energy values after a specimen tree model were measured to validate the CFD method. At the end of the study, it was observed that pedestrian wind comfort could be improved with the use of trees. The impact of pavement materials on the UHI was focused on by Hendel et al. in a lab-scale environment [14]. It was found that the thermophysical properties of pavement materials were crucial for the UHI, and granite sidewalk pavement especially showed cool behavior during the day. Furthermore, the effects of the asphalt and concrete pavement materials on the UHI were also investigated by Acharya et al. [15]. Numerical studies showed that the asphalt surface temperature was warmer than concrete, and albedo values of materials played an important role in the surface temperature of the pavement.
A microscale area in the city center of Cairo (Egypt) was modeled in the ENVImet environment for the mitigation of UHI intensity by Aboelata and Sodoudi [16]. Three different scenarios (30% tree, 50% tree, and 30% tree + 70% grass) were investigated in summer day conditions, and the scenario with 50% trees offered the best thermal comfort at about a 3 °C difference. An experiment on the contribution of vegetation to the mitigation of UHI during a heatwave day in Freiburg (Germany) was performed by Lee et al., who showed that trees on grassland led to the mitigation of UHI up to 2.7 °C [17]. The effects of the different construction methods and materials on UHI intensity in Vienna (Austria) were analyzed by Teichmann et al. [18]. The SIMPLE algorithm with the k-ε turbulence model was preferred for the numerical modeling approach. It was concluded that the albedo and heat capacity of the material were important for UHI intensity. Xu et al. analyzed the effects of split-type air conditioners on UHI intensity in Kent Vale (Singapore) with a new UHI modeling tool developed and combined with the OpenFOAM environment to solve governing equations [19]. It was concluded that UHI could be improved by increasing the reflectivity of the building materials. The urban canopy effects on UHI intensity under different weather conditions were investigated by Ming et al. [20]. In the ANSYS Fluent environment, the SIMPLE algorithm with the second-order scheme was performed, and the porous media model was found suitable for the prediction of UHI intensities in the central regions of cities. Shahidan et al. focused on the outdoor and building environment cooling concerning the combination of vegetation and pavement materials [21]. An average temperature reduction of 2.7 °C and 29% cooling load mitigation was concluded by the simulations.
The literature demonstrates that various cooling interventions can effectively mitigate urban heat island (UHI) intensities in local climate zones (LCZs). In line with this, our study aims to enhance outdoor thermal comfort in the LCZ of Dubai (UAE) through different cooling interventions, namely vegetation, architecture, and material color, drawing comparisons with the experiments conducted by Fatima and Chaudhry. Initially, each cooling intervention was scrutinized individually to elucidate its specific contribution to UHI mitigation. Subsequently, these interventions were integrated within the LCZ to assess their combined impact on reducing UHI intensity. Our research significantly contributes to the existing literature by providing a succinct summary of numerical modeling approaches for various cooling interventions. Additionally, it offers noteworthy insights into flow characteristics and their implications on UHI, ultimately concluding that the amalgamation of cooling interventions can substantially alleviate UHI while concurrently enhancing outdoor thermal comfort.
The paper is organized as follows: the microclimate area taken as a baseline is detailed in Section 2, along with the problem statement and the methodology to solve it; the computational technique and the numerical model are outlined in Section 2; Section 3 presents the investigation of different cooling interventions; the paper ends with a discussion and conclusion in Section 4.

2. Materials and Methods

2.1. Problem Description

This subsection starts with the definition of the investigated LCZ and presents the study structure, research parameters, and limitations.

2.1.1. The Local Climate Zone

In the present paper, a local climate zone (LCZ) in Dubai (UAE) was taken as a reference to study mitigating its urban heat island (UHI) effects. A satellite view of the investigated LCZ is shown in Figure 1; the LCZ was situated at the southeast side of Dubai (Lat: 25.129, Lon: 55.416). In this LCZ, the main vegetation was fauna and flora, with no water bodies around. There were Sabkha plains with desert hyacinths on the east side of this LCZ, while ghaf trees were on the north side.
Under these conditions, this LCZ was found to be appropriate for research investigations on cooling interventions to be assessed against the baseline published by Fatima and Chaudhry [22]. There were a total of four buildings in this LCZ, as shown in Figure 2a, which were 88 m wide, 132 m long, and 20 m tall. Besides the morphologic definition of this LCZ, the temperature distributions at the pedestrian level under different cooling interventions were collected from ten different monitoring campaigns (Figure 2b). The experiments carried out by Fatima et al. on 2 February 2015 served as a reference for the precise locations of these monitoring operations.

2.1.2. Study Structure and Parameters

The present research aims to study the effects of different cooling interventions to mitigate the UHI effect on the considered LCZ; the steps of the current study are as follows:
  • Validation of the numerical method based on experiments and the definition of the UHI characteristics in the LCZ;
  • Validation of the numerical methods on the estimation flow characteristics around the vegetation or architectural interventions, and radiative material effect on energy balance by comparison with the experiments in the literature;
  • As explained in Table 1, the investigation of different cooling interventions is performed in this LCZ followed by the mitigation rates of each intervention on UHI;
  • Evaluation of the cumulative contribution by the combined interventions on UHI.
After the definition of the base reasons for UHI in this LCZ, cooling interventions were emplaced separately in this LCZ and effects on the temperature distribution at the pedestrian level were investigated. The settlement of the combined cooling interventions was implemented based on the constraints obtained by Chen et al.’s study, as detailed in Figure 3 [23]. In this LCZ, the green-colored interventions are referred to as trees, and brown-colored geometries are referred to as shade structures. Furthermore, there are two chimneys indicated by purple.
Interventions that were analyzed in the referenced LCZ are summarized in Table 1. Each parameter was also investigated under different WSs up to 10 m/s to explore the contribution to the mitigation of UHI in this LCZ.
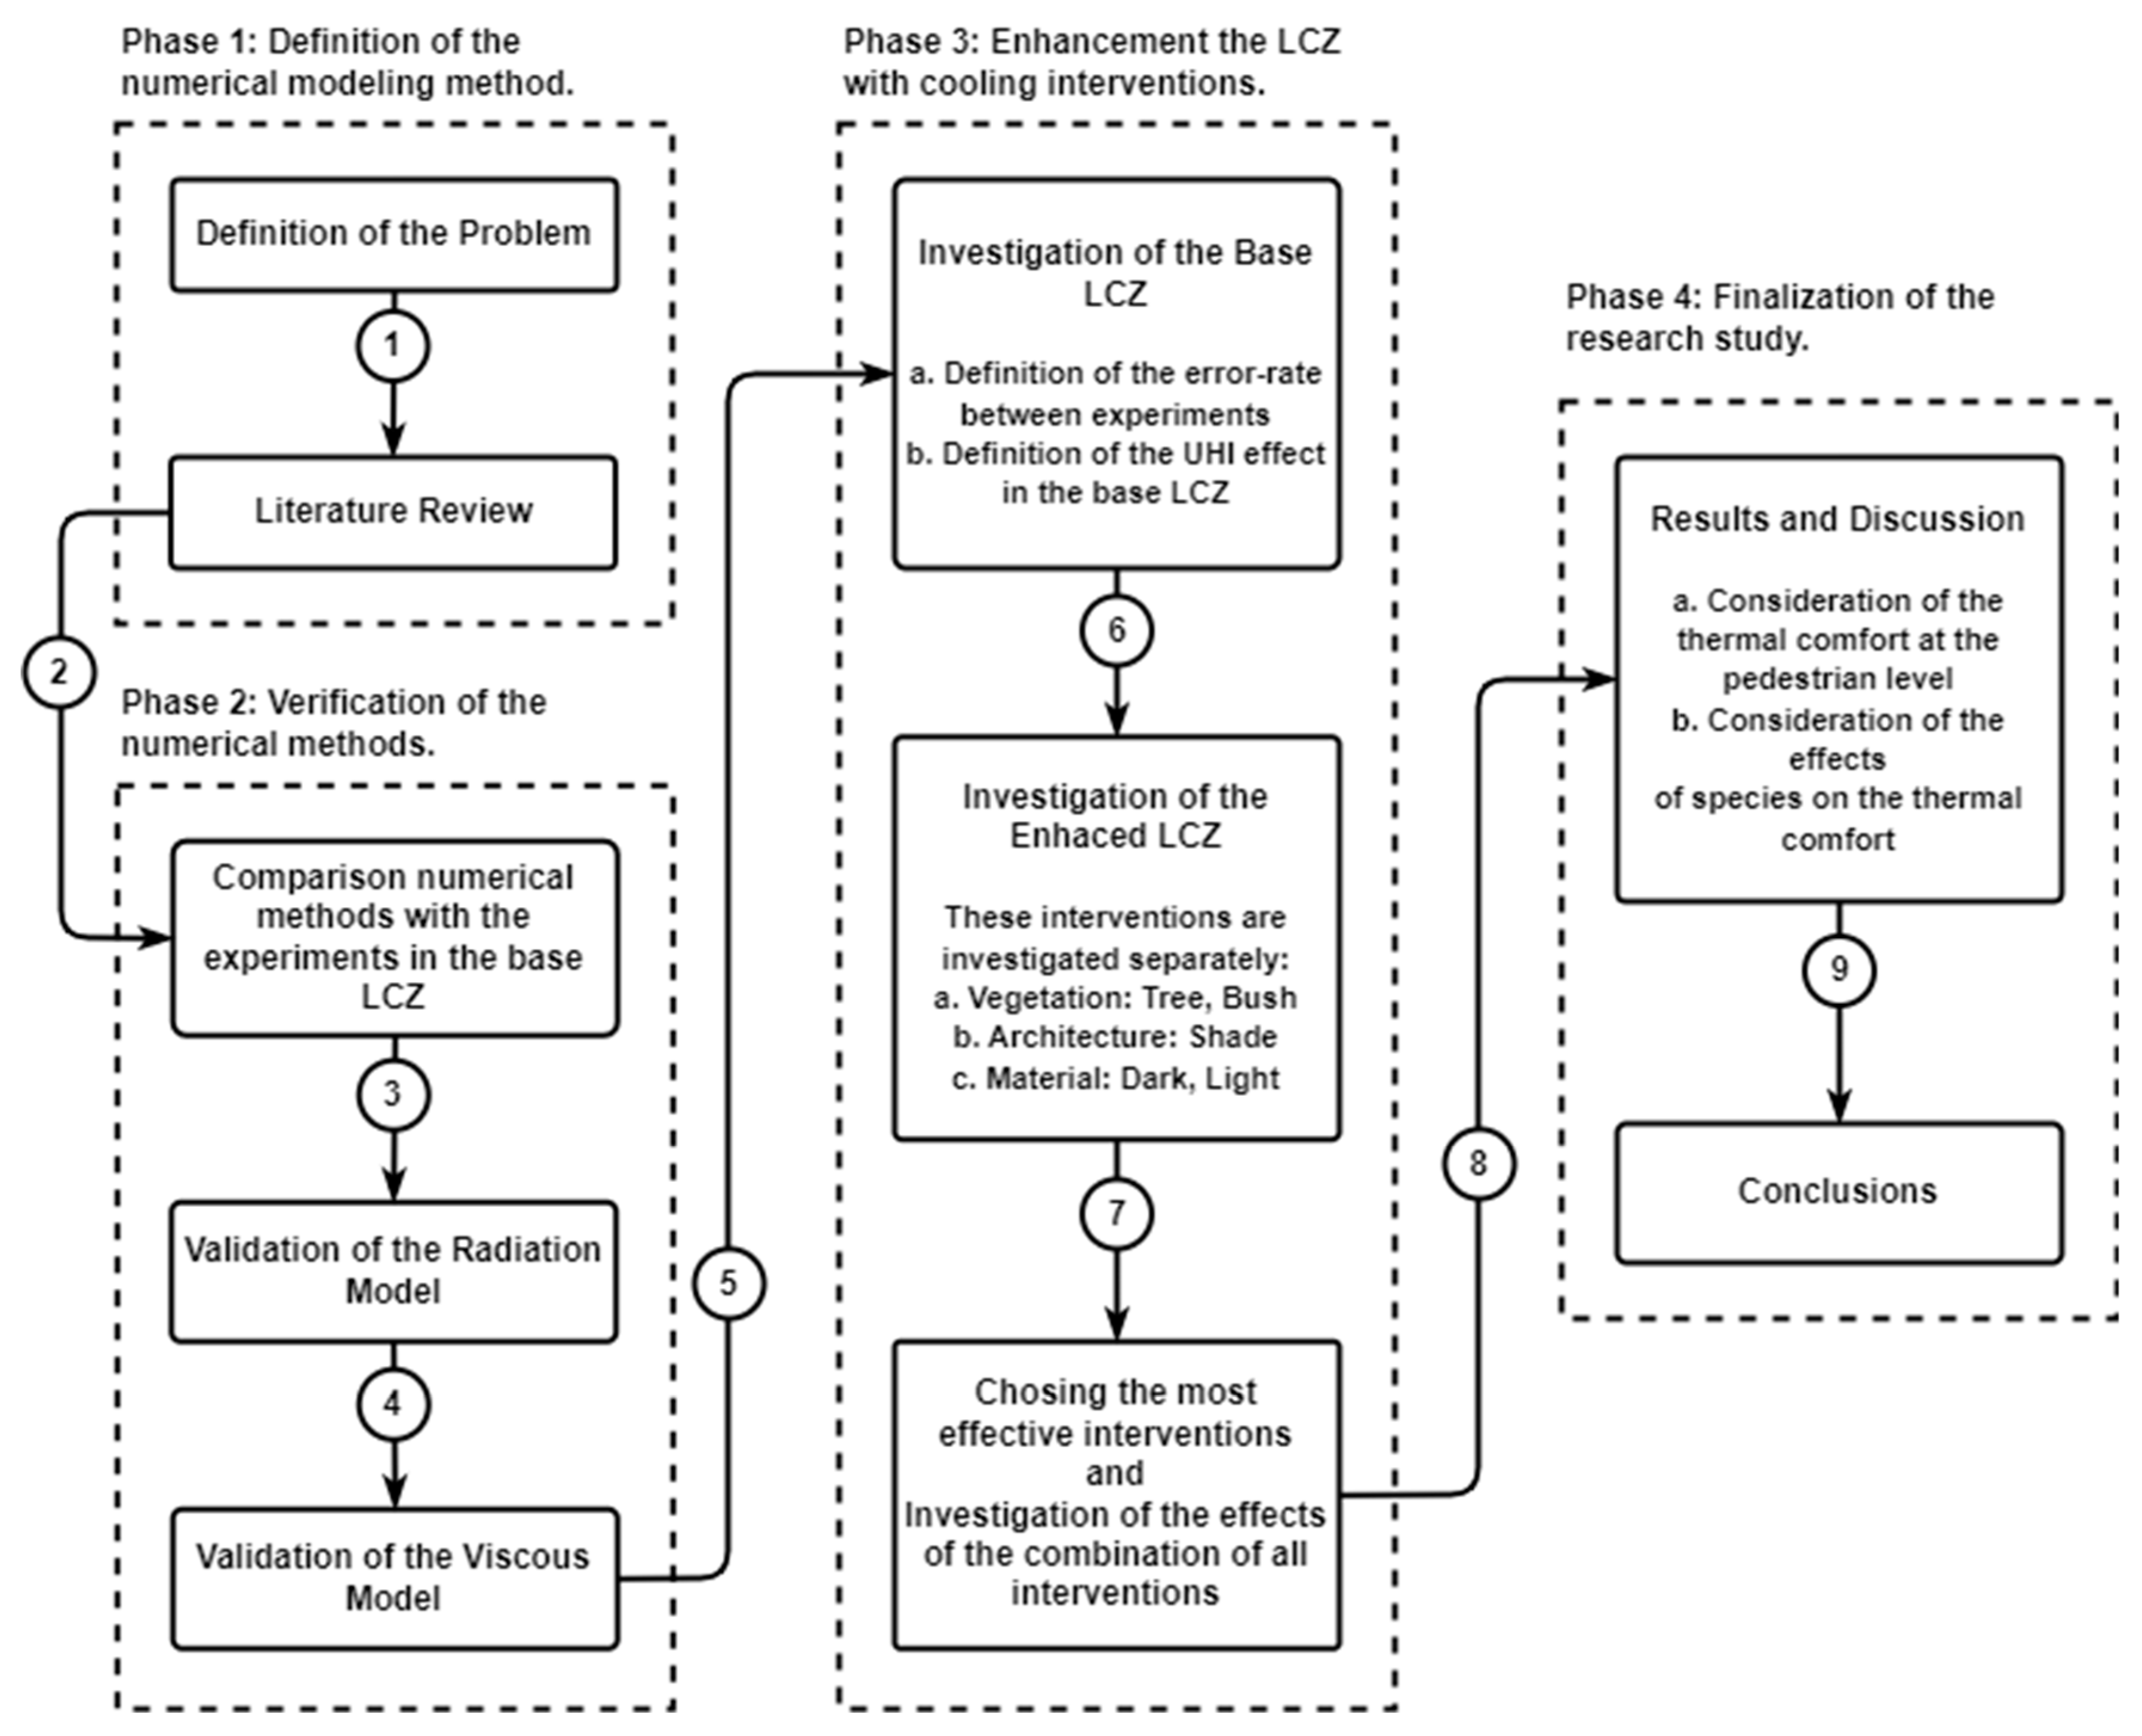
The overall framework of the study is represented in Figure 4 and is explained below:
  • Phase 1: Starts with the definition of the problem followed by the literature research. At the end of this phase, the exact numerical methods are defined for modeling the LCZ;
  • Phase 2: Deals with the verification of the numerical methods for the different types of cooling interventions. Here, the radiation and viscous models are tested for comparisons with experiments;
  • Phase 3: Starts with the investigation of the base LCZ to define the UHI intensity. Cooling interventions (vegetation, architecture, and material) are emplaced in the LCZ and investigated separately to define the rate of improvements. At the end of this phase, cooling interventions are combined and investigated to define the cumulative rate of improvement in UHI intensity;
  • Phase 4: considers the effects of each cooling intervention and thermal comfort at the pedestrian level in the LCZ.

2.1.3. Methodology and Limitations

To optimize the CFD costs while obtaining the most possible realistic results, some restrictions are considered as follows:
  • To minimize the cost of the research study, a CFD modeling method is preferred and the desired CFD method is compared to experiments for different modeling approaches such as fluid dynamics and radiative heat transfer to minimize the error rate;
  • The investigated LCZ, building details (windows, doors, etc.), and weather conditions are restricted to simplify the CFD modeling method;
  • Air pollution and indoor air quality effects are not considered;
  • Cooling interventions are limited to three different groups (vegetation, material, and architecture);
  • While some important aspects of thermal comfort are taken into account, not all components, such as relative humidity or clothing insulation, are considered;
  • The PMV method is used to quantify the thermal comfort in the LCZ [24]. During the comparison of thermal comfort, the relative humidity (%), metabolic rate (met), and clothing level (clo) are assumed to be constant and, respectively, set to 50%, 1 met, and 0.61 clo [25,26].
With these limitations, this paper’s main contribution is to evaluate the benefits of various interventions (trees, shrubs, chimneys, and shade structures) to improve outdoor thermal comfort. To achieve this, the genuine case study from Fatima’s paper, which provides experimental data, is used as a baseline. The proposed CFD modeling approach starts by validating the numerical model on the baseline LCZ. Interventions are then implemented to highlight their benefits. For further studies, the proposed CFD modeling approach may be tested under different geographic scales such as mesoscale, and meteorological conditions may be categorized according to annual yield to highlight the effects of interventions.

2.2. Problem Description

This subsection starts with the setting up of computational domain sizes, grid discretization, and the definition of the boundary conditions, and is followed by verification of the defined numerical modeling approach.

2.2.1. Computational Domain and Grid

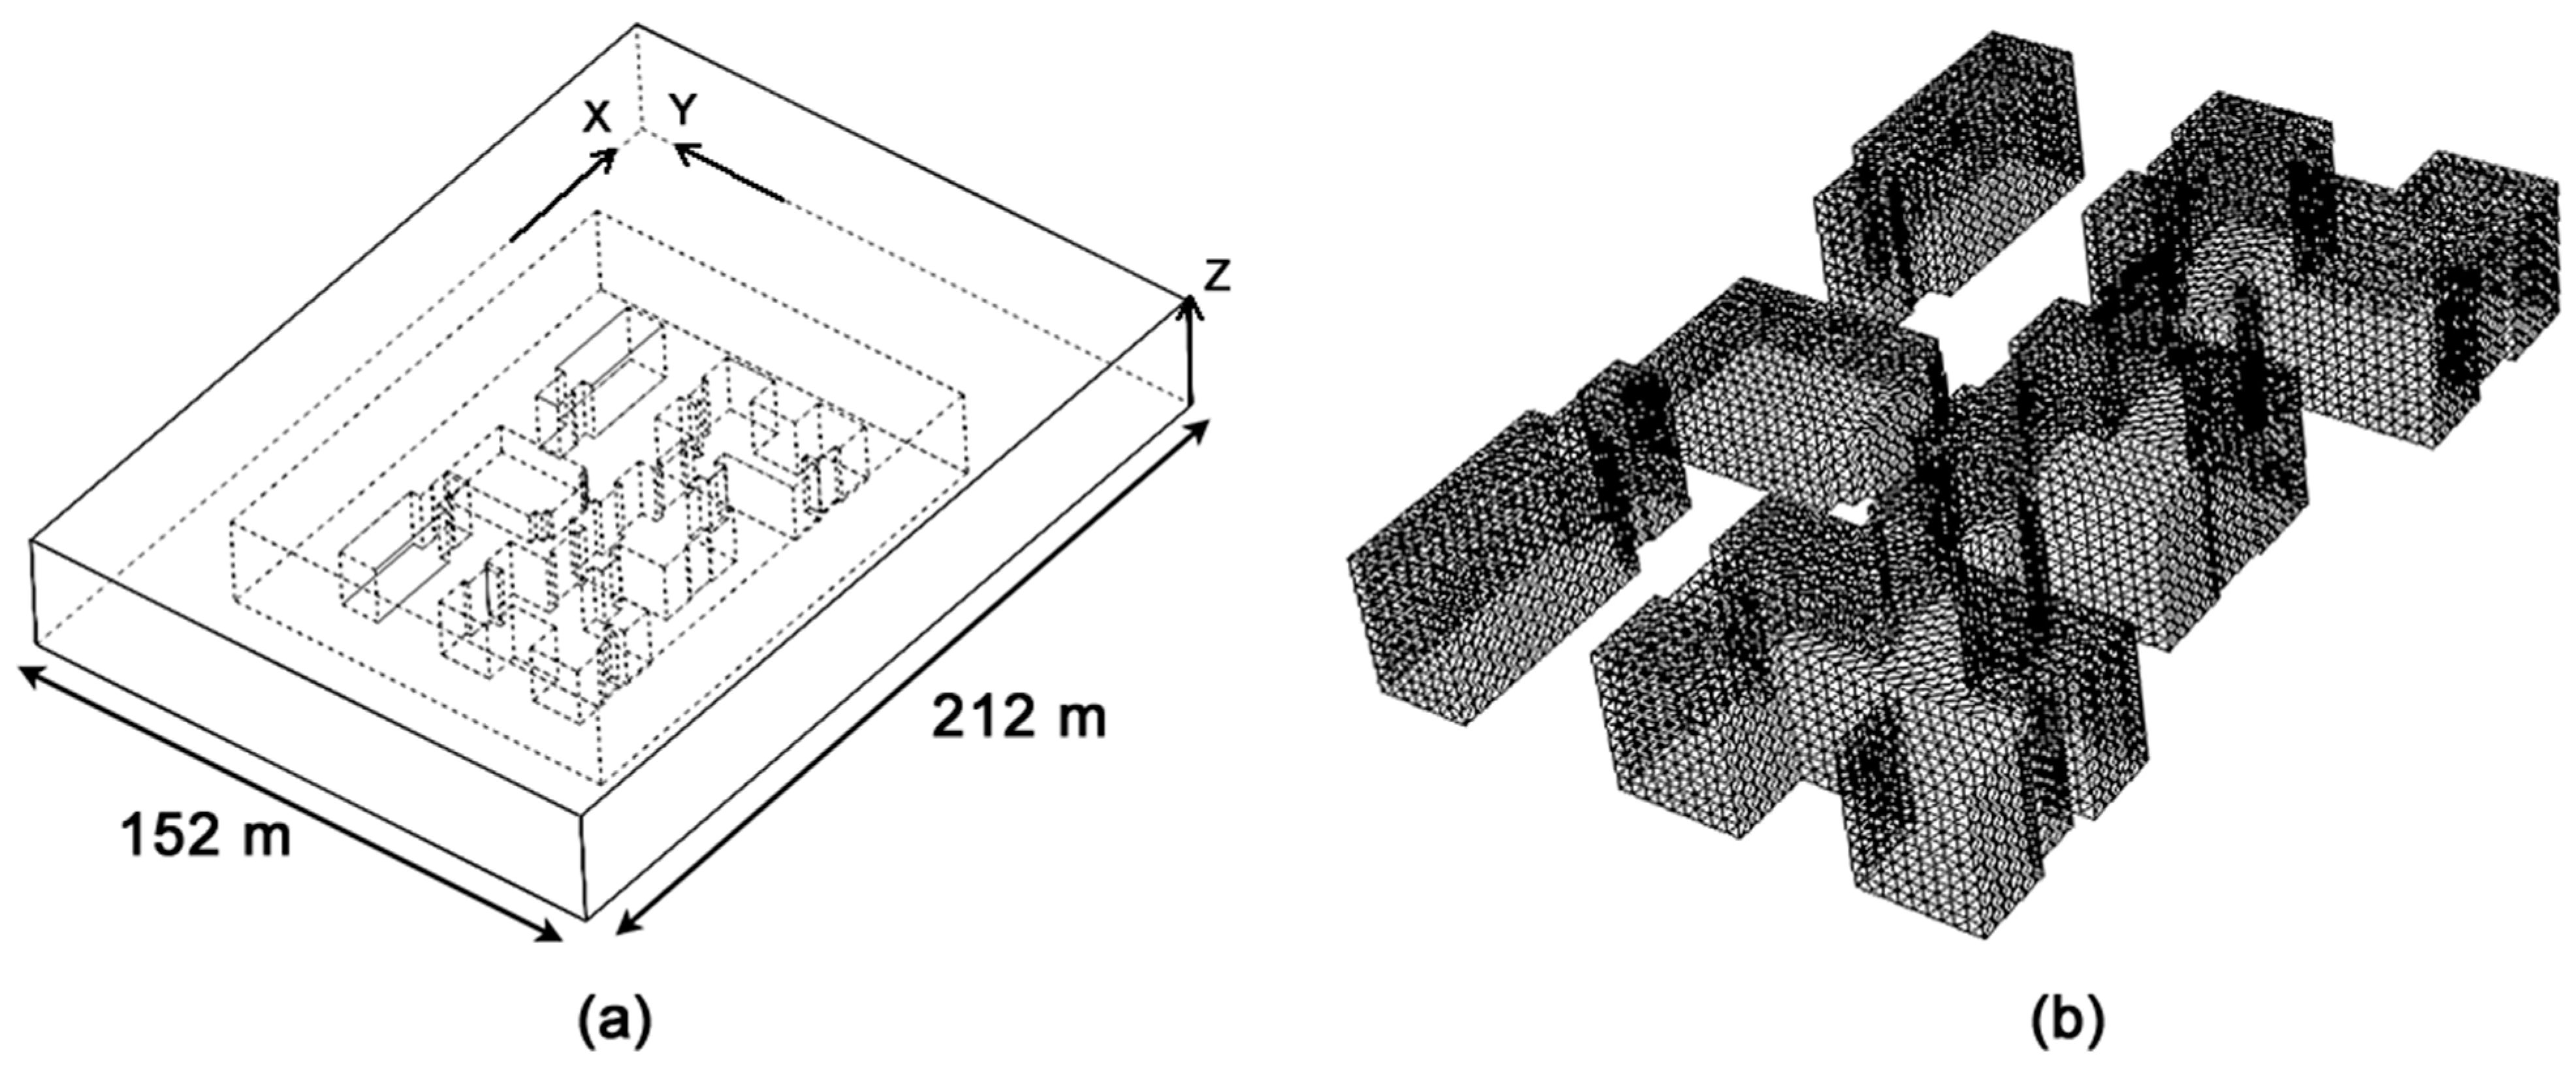
The local climate zone (LCZ) is modeled inside two rectangular subdomains and the outer subdomain has dimensions of 212 m length, 152 m width, and 40 m height (Figure 5a). To create high-quality grids connecting the buildings in the computational domain, they are precisely modeled and divided into splits. Based on the assumptions provided by van Hooff and Blocken, the computational grid is generated, and it consists of 8,353,485 tetrahedral cells with a minimum near-wall grid size of 0.5 m (Figure 5b) [27,28]. The maximum blockage ratio is 2.4%, which is less than the recommended value of 3% [29]. The precise prediction of the flow pattern around structures or understanding the real characteristics of separate flows close to barriers is crucial in CFD simulations. Therefore, a minimum of ten fine grids on one side of the buildings is recommended to obtain characteristics of separating flows around the buildings in the LCZ [30].
Additionally, it is advised to conduct an independent investigation to guarantee compatibility of the mesh structure of the CFD study at the conclusion of the grid discretization study [28]. From a coarser mesh with 200,000 cells to a finer mesh with 8,353,485 cells, a mesh independence study is conducted. To determine the appropriate mesh structure for subsequent CFD research instances, the temperature value at the fifth point (Figure 2b) in the local microclimate area is taken into consideration during the mesh independence analysis. The mesh independence study also helps to find the right mesh structure for computational costs. Results show that the error rate of the temperature values at the fifth point between other mesh structures is found to be acceptable after 6,500,000 cells (Figure 6).

2.2.2. Boundary Conditions

A schematic illustration of boundary conditions (BCs) is given in Figure 7 and the lateral and top boundaries (green dashed and straight lines in Figure 7) of the rectangular computational domain are defined as symmetry BCs (i.e., zero normal velocity and gradients) that enforce a parallel flow [28]. The glazing temperatures of the building in this LCZ are delineated by color-coded lines in Figure 7: 25 °C for the east side (purple), 42 °C for the south side (blue), 26 °C for the north side, and 30 °C for the west side (orange). Moreover, the wall temperature of the building is defined as 37 °C, highlighted in black within the figure. The entry and exit boundaries of the rectangular computational domain are defined as velocity inlet and pressure outlet BCs.
The outlet pressure BC defines an outflow condition based on the flow pressure at the exit boundary of the computational domain. The velocity of the inlet flow boundary of the computational domain requires profile conditions of neutral vertical wind velocity profile (U) on the ground, whereas the pressure outlet boundary requires free pressure specification with zero static pressure. At the inlet of the computational domain, the logarithmic mean WS profile [30,32] is given by
U z = u * κ ln z + z 0 z 0 ,
Turbulent kinetic energy (κ) (m2/s2) and turbulence dissipation rate (ε) (m2/s3) are given by [33,34]
k = u * 2 C μ ,
ε z = u * 3 κ z + z 0 ,
where u* represents the atmospheric boundary layer friction velocity, κ is the von Karman constant (=0.42), z is the specified height, z0 is the aerodynamic roughness length, and Cμ = 0.09. On the walls (ground and buildings), the standard wall functions are used in the combination of the sand grain-based roughness modification. The relation between roughness height (ks) and roughness constant (Cs) is determined from their relationship with z0 [26,32,35]. Roughness height can be expressed as
k s = 9.793   z 0 C s ,
Material specifications of the ground used in this study were obtained from Asaeda et al.s’ experiment and can be found in Table 2 [36]. However, in this study, the indoor conditions of buildings in the computational domain were not considered. Therefore, windows and indoor spaces of buildings were not modeled in CFD simulations, meaning there was no transmissivity in considering the building surfaces. The sun’s direction and the diffuse portion of the total radiation to the surface were calculated with the solar ray-tracing module of ANSYS Fluent.
The preferred modeling methods for this study are shown in Table 3. Three-dimensional (3D) RANS equations were solved with the realizable k-ε turbulence model for the modeling of turbulent flow characteristics and its effect on heat transfer. The discrete ordinates (DO) model was preferred for the modeling of radiative heat transfer. The SIMPLE scheme was evaluated for pressure–velocity coupling and spatial discretization in the second order. Convergence criteria for mass and momentum equations were defined as 10−6 and, for the energy equation, 10−7.
As indicated in Stavrakakis et al.s’ review study, ENVI-met stood out, with a strong compilation of prevailing urban physics phenomena, but it was noted that Phoenix needs to develop and incorporate user-defined models [37]. Furthermore, ENVI-met has limited turbulence modeling options and a very-high CPU load with convergence time demand. ANSYS Fluent has many options for turbulence and radiation models, flexibility, easiness of grid generation, and faster convergence rate compared with other CFD software. Because of these advantages and disadvantages, ANSYS Fluent 2022 R2 was preferred for the investigation of outdoor thermal comfort in the specified LCZ in the present study.
Specifically, pedestrian-level analysis was conducted to assess the comfort levels of individuals. The PMV method was chosen for this purpose, following the methodologies outlined in Rezaei Rad et al.’s study, which examined the effects of urban complex morphology on thermal comfort in the Gheytariyeh neighborhood. Similarly, Barakat et al.’s research emphasized the importance of urban design for human thermal comfort in hot and arid climates, discussing advanced simulation methods. The results of these studies highlight the effectiveness of the PMV method in evaluating pedestrian-level thermal comfort [24,38]. Therefore, in this study, the PMV method was utilized to assess thermal comfort at the pedestrian level within the specified LCZ.

2.2.3. Model Validation

In this subsection, two different numerical modeling approaches were studied and summarized as follows:
  • A developed numerical model in the present study was validated for the exhibition of hotspots in the specified LCZ and the reduction of the error rate based on the experiments of Fatima and Chaudhry;
  • The numerical method was investigated and validated for the radiative material effects on thermal behavior based on the experiments of Asaeda et al.;
  • The numerical model was also validated for the finding of the downwind of a windbreak by comparison with the experiments of Kang et al. [39].
Temperature measurements taken from ten different monitoring campaigns, as shown in Figure 2b, were shared by Fatima and Chaudhry. The numerical model developed in this study was executed under identical operating conditions as those in Fatima and Chaudhry’s study, as depicted in Figure 7, and without considering pavement material. Comparison between our numerical model and Fatima and Chaudhry’s experiments revealed an average temperature difference of 6.1%, as illustrated in Figure 8a. This means that the numerical results were 4.57% closer to the experiments than Fatima and Chaudhry’s. Therefore, the authors may attribute the variances observed in numerical studies to the improved mesh structure of the current LCZ model in the present study.
Heat flux between air and ground interface under different pavement materials was investigated experimentally by Asaeda et al. Experiments were operated in an open space and temperature values of the ground interface were measured at different depths. Based on Asaeda et al.s’ experiment, the free stream temperature was taken as 32 °C and the wind velocity was 0.6 m/s in one direction only. The temperature distributions in the varied depths of the pavement block are shown in Figure 8b and the average differences between experiments and numerical studies were observed at 0.85 °C, showing consistency with our results [40,41].
Kang et al. focused on numerical modeling of the flow characteristics of trees and implemented a validation study based on Kurotani’s experiments [42]. Measurements of the airspeed values after the tree were collected from Kurotani’s experiments and compared with the developed numerical model in this study. The results and comparisons with six different research studies are given in Figure 9. Given the observed disparity between experimental studies and our numerical model, it was deemed appropriate for this study that the difference was minor on the flow dynamics influenced by specific plant species, such as trees [42,43].
The proposed approach suggests that numerical simulations like CFD can utilize geometric shape descriptors, yet its effectiveness may vary across different scenarios, potentially impacting model accuracy [43,44]. Olivieri et al. reported that the air temperature error was approximately 10%, meeting acceptable thresholds for numerical simulations [45,46]. Additionally, Wilkinson et al. hypothesized that the surface pressure distribution around tall buildings can be predicted with less than 20% error, indicating potential reliability for practical use [44]. Hence, these findings support the alignment of our proposed numerical model with the outcomes of the referenced experiments, reinforcing its validity and applicability.

3. Results

3.1. Assessment of the Base Local Climate Zone

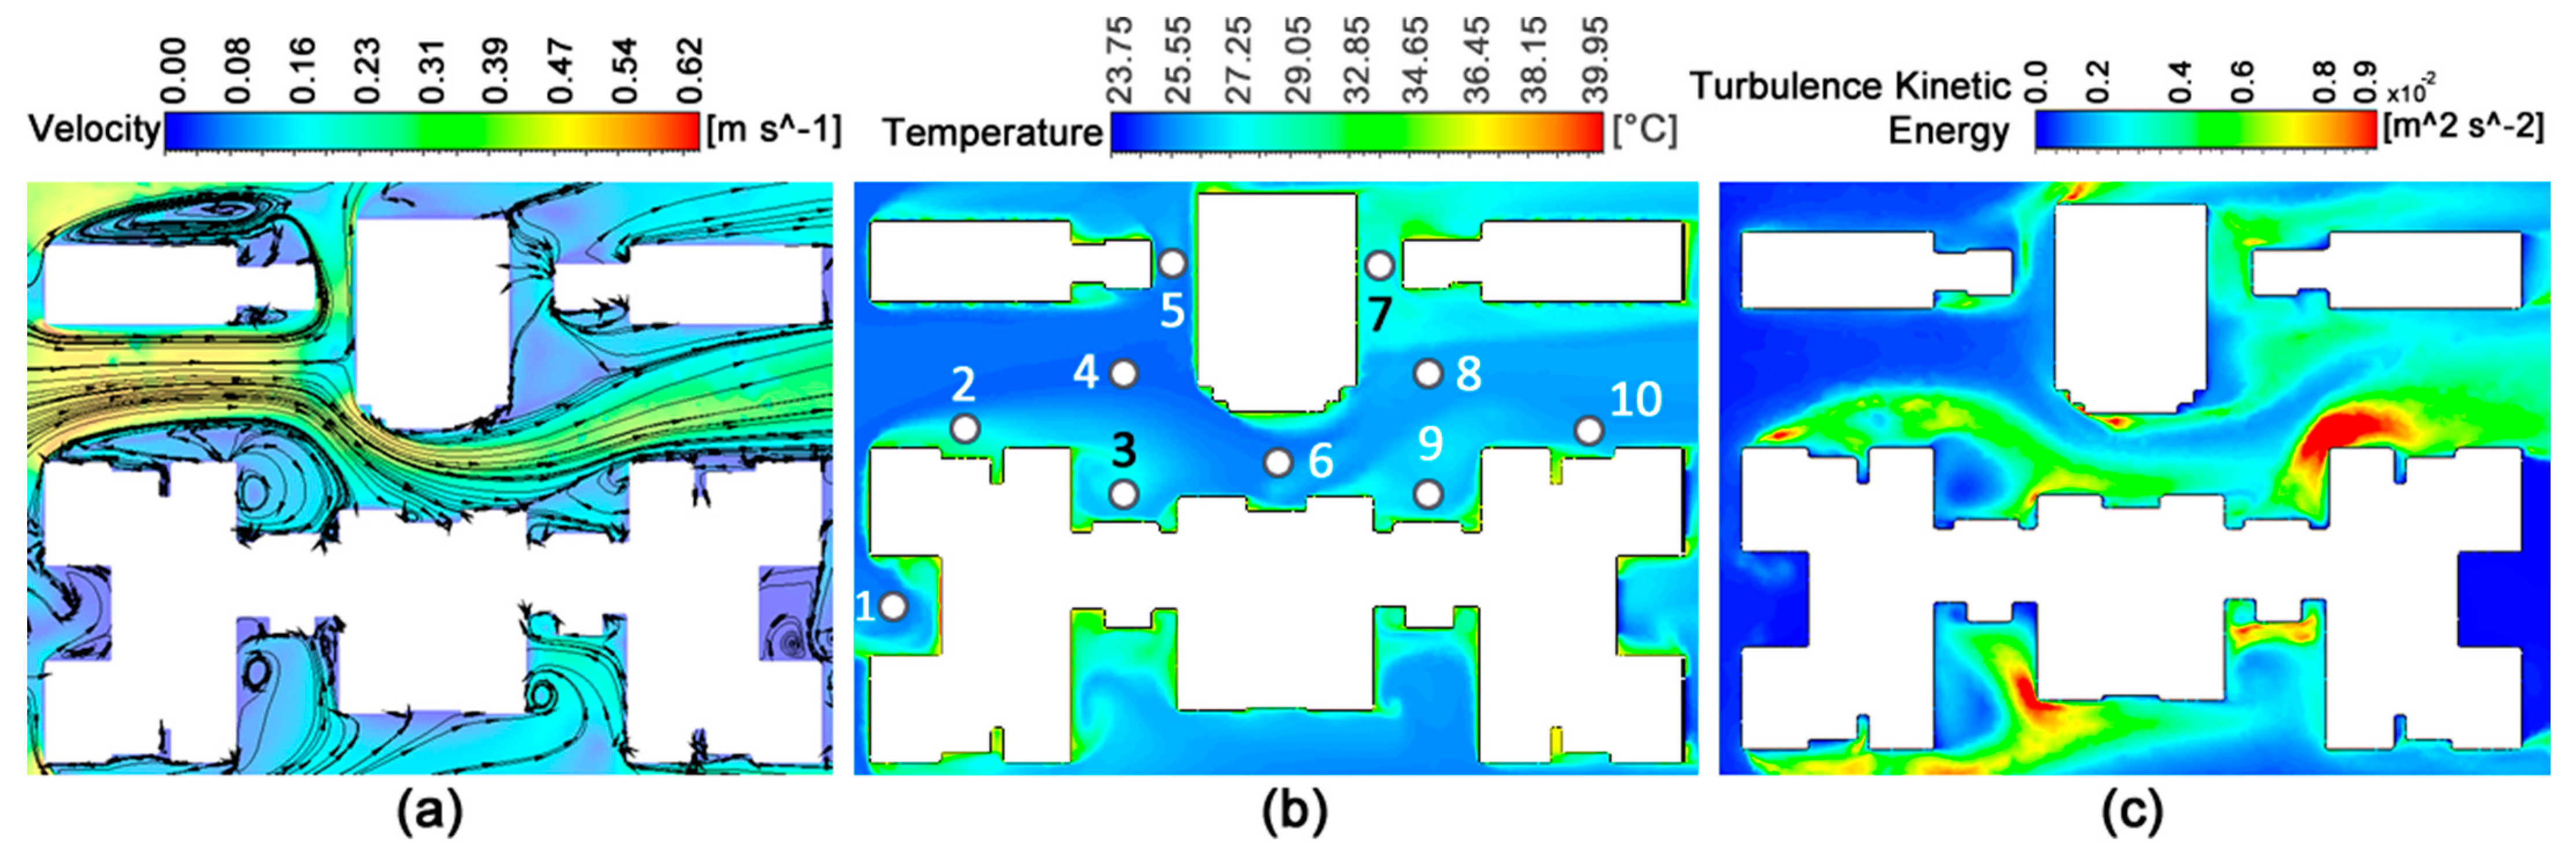
In this section, the LCZ is investigated under the boundary conditions indicated in Section 3.2 to identify the wind flow characteristics and their impact on UHI. Wind velocity, ambient temperature, and turbulence kinetic energy distributions obtained by numerical studies are shown in Figure 10 for a velocity inlet boundary of 0.4 m/s. The maximum WS was measured in the main hall of the LCZ at 0.64 m/s. Wind flow was found to be blocked from the south side of the buildings (Figure 10a) and the generated heatwaves were observed, particularly at monitoring campaigns 3, 7, and 9 (Figure 10b).
Furthermore, the temperature distributions observed on monitoring campaigns are numerically shown in Table 4. As stated in this table, the average temperatures gathered from the experimental and numerical studies were 24.6 °C and 26.2 °C. This implies that there was a 6.1% difference between experiments and numerical studies implemented in the present study.
During the experiments, the lowest temperature was measured on the fifth monitoring campaign, and the second lowest temperature distribution was observed at the exit hall of the microclimate area (points 8, 9, 10). Outcomes for the implemented numerical study also supported this kind of temperature distribution. Contrary to cooler areas in this LCZ, the distribution of the turbulence kinetic energy at monitoring campaigns 1 and 4 was quite low, so wind flow was not enough to achieve the cooling effect in these areas.
It seemed that turbulence kinetic energy distribution with wind flow in the investigated LCZ contributed to increasing outdoor thermal comfort. For this reason, while the effects of vegetation and architectural interventions on outdoor thermal comfort are investigated in the next subsection, the flow characteristics obtained in this subsection will be considered.

3.2. Effects of Cooling Interventions on Outdoor Thermal Comfort

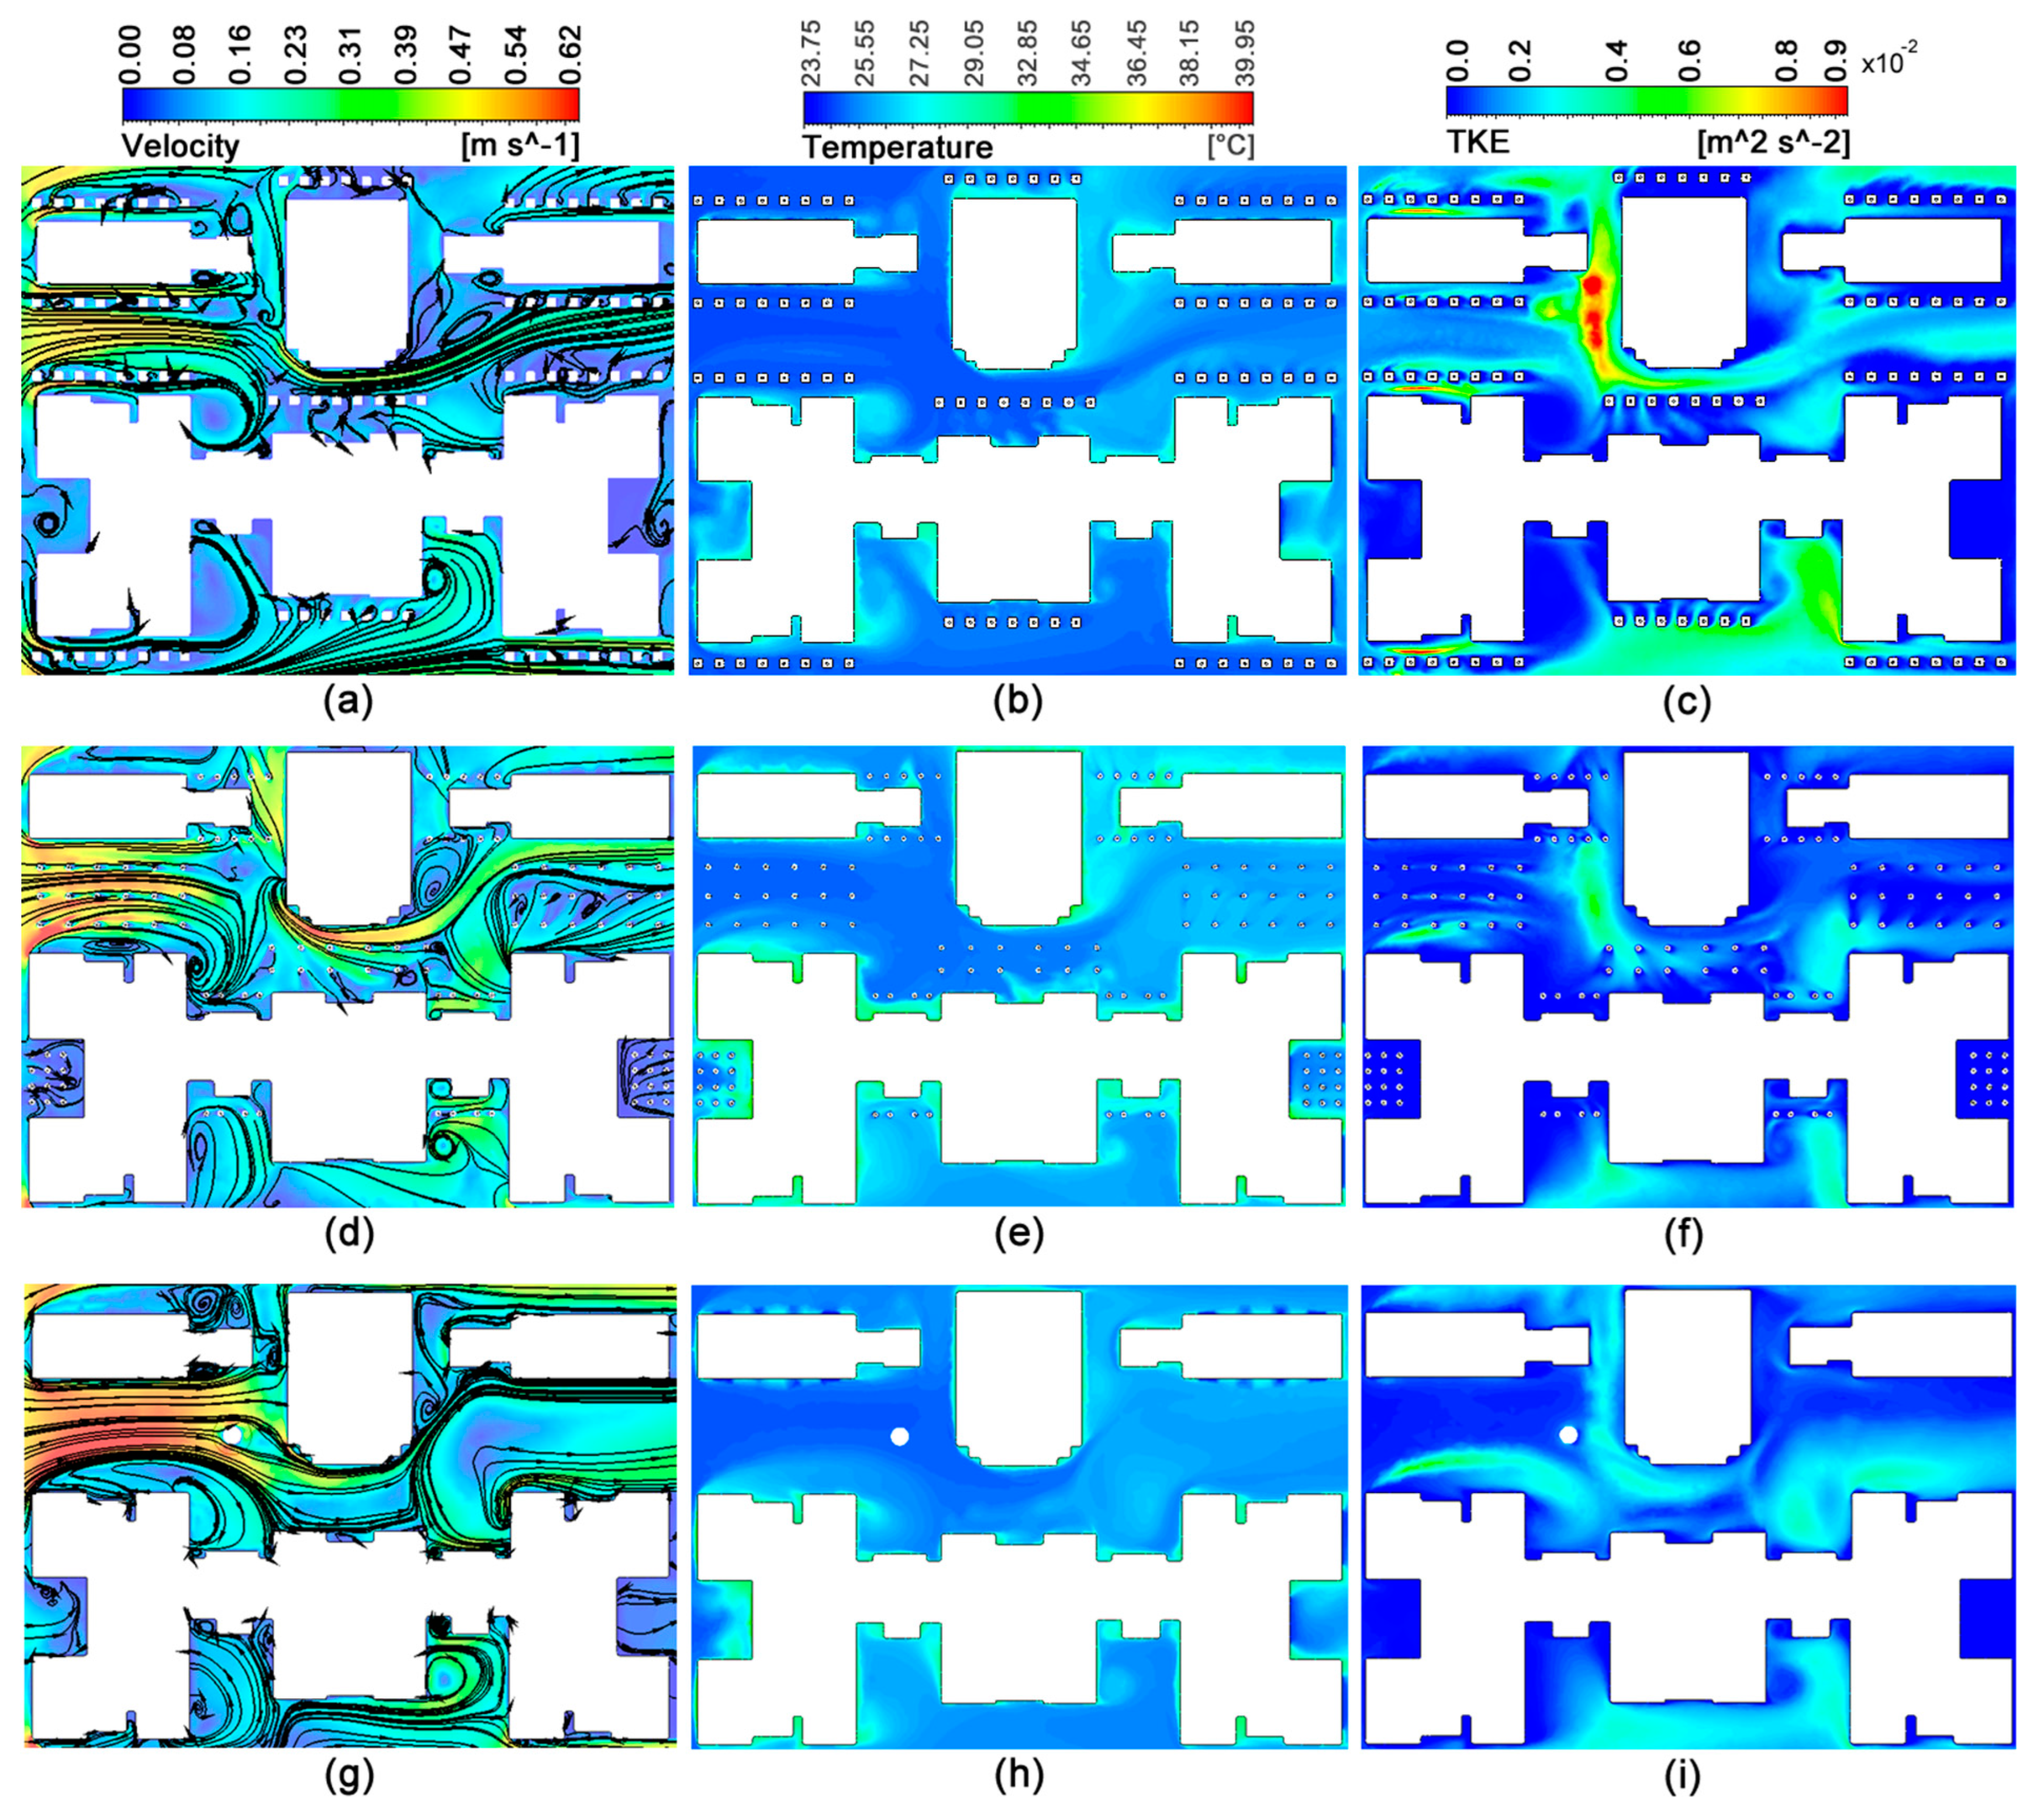
In this subsection, the effects of vegetation (tree and bush), architectural components (chimney and shade structures), and different pavement materials (light- and dark-colored) are investigated under different wind speeds to define the increased rate of outdoor thermal comfort in the LCZ. Wind velocity/streamlines, ambient temperature, and turbulence kinetic energy distributions with the effects of tree, bush, and chimney are given in Figure 11. The results show that trees located in front of buildings directed the wind flows and increased the wind velocity around these buildings. Furthermore, one could see improvements in outdoor thermal comfort at the pedestrian level, especially for the trees and chimneys, as summarized in Table 5 When the wind flow was set at 0.4 m/s with tree specimens, the local areas’ average temperature value was 25.5 °C, meaning it was 1.44 °C cooler than the baseline LCZ. Bushes placed in the main hall of the LCZ were not as effective as the trees on the temperature distribution. The average temperature in the enhanced LCZ was 26.2 °C, meaning it was 0.74 °C cooler than the baseline LCZ. It was also observed that the chimney placed on the first square of the main hall regulated the wind flow through the exit of the main hall. The average temperature in the enhanced LCZ was 25.6 °C, meaning it was 1.34 °C cooler than the base LCZ.
The results of each scenario are summarized in Table 5, with a scale at the top of the table that refers to the average temperature at the pedestrian level of each scenario. The blue color refers to the coldest scenario, while red corresponds to the hottest scenario. The hottest scenario was observed for the asphalt (dark-colored) material on the ground, and concrete (light-colored) pavement material was 1.3 °C cooler than the asphalt material. Shade structures were placed in the main hall and the best improvement was observed by shade structures that were 8.31% cooler than the baseline LCZ; 5.35% and 4.97% cooling performance on the average temperature distributions were obtained by tree and chimney scenarios. After the investigation of each scenario separately, a joint scenario was considered combining trees, bushes, chimneys, shade structures, and concrete (light-colored) ground material, with the following configuration as indicated in Figure 3: trees in front of the buildings, bushes in the center of the main hall, chimneys in two squares of the main hall, and shade structures covering 23.85% of the main hall. Wind velocity/streamlines, ambient temperature, and turbulence kinetic energy distributions at WS = 0.4 m/s are given in Figure 12. The findings from this combined scenario were a 16.48% (4.44 °C) improvement on the temperature distributions in the LCZ.
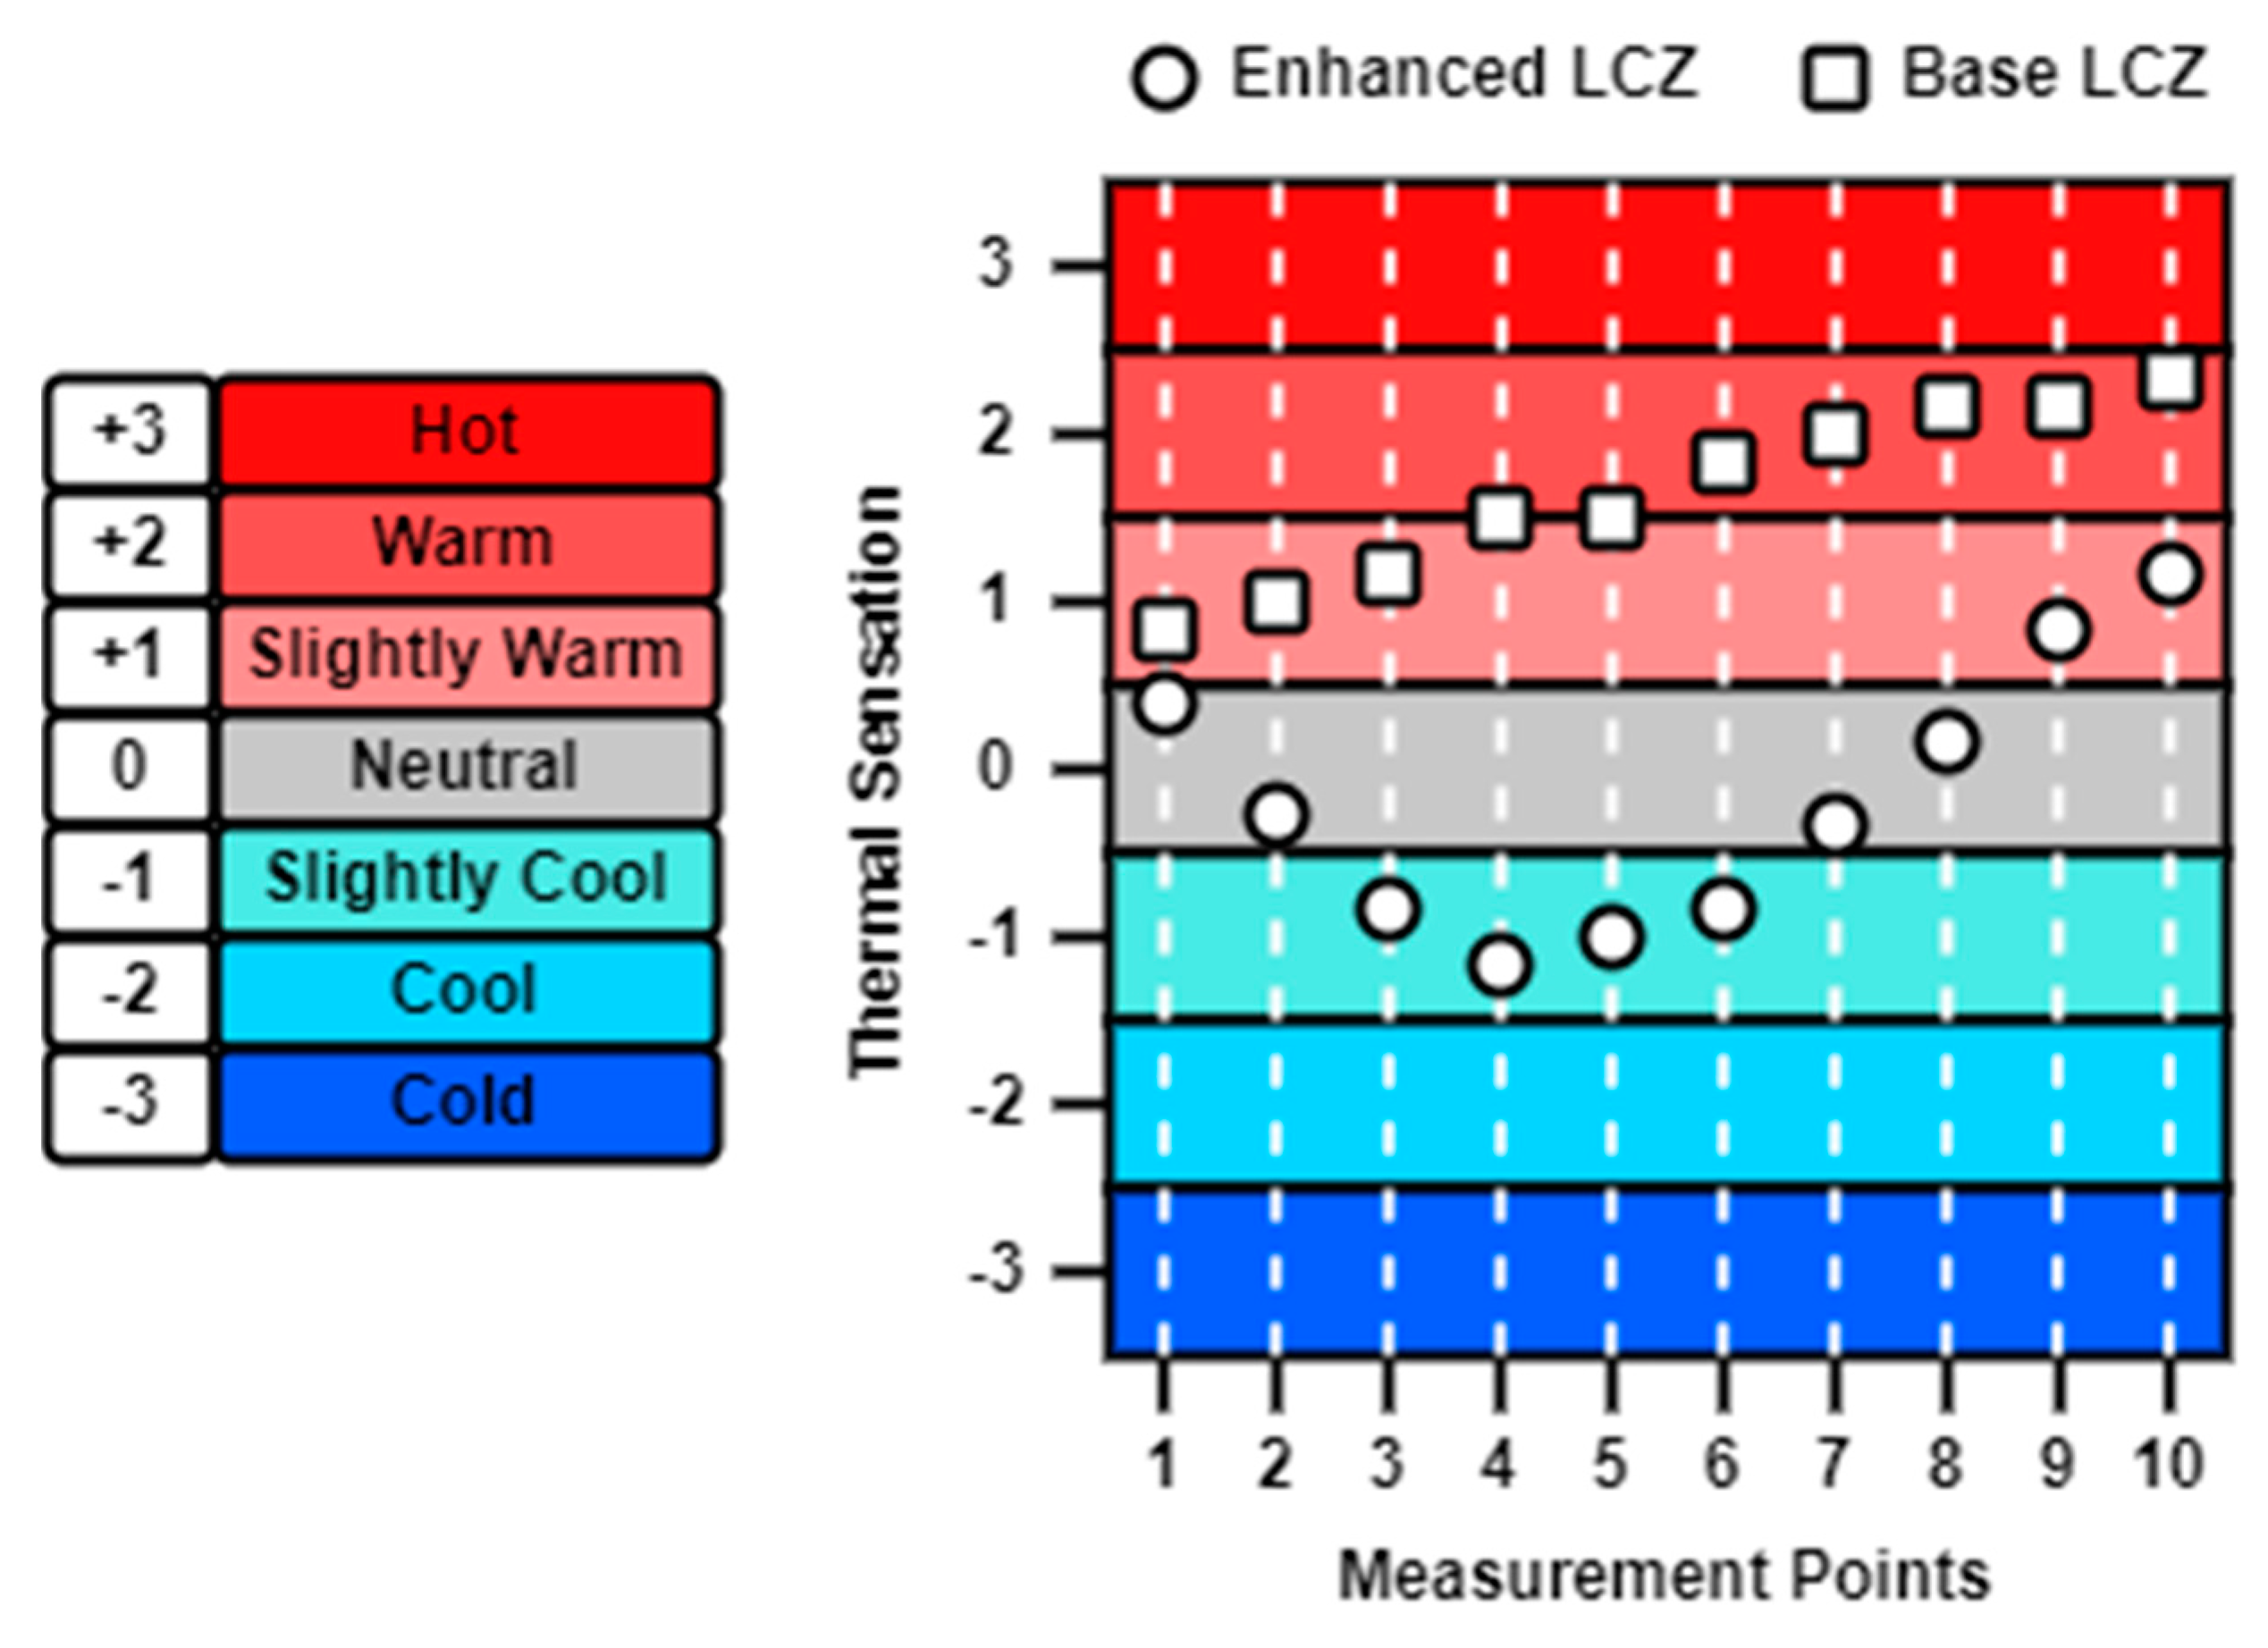
The comparison of the outdoor thermal comfort calculated with the PMV method between the baseline and the enhanced LCZ for a velocity inlet of 0.4 m/s is shown in Figure 13. For the enhanced LCZ, the outdoor thermal comfort showed an improvement trend until the fifth monitoring campaign, then it started approaching the outdoor thermal comfort of the baseline LCZ. However, the values of the outdoor thermal comfort indices of the enhanced LCZ were more comfortable than the baseline LCZ in all monitoring campaigns. The greatest difference in outdoor thermal comfort was observed in the fourth monitoring campaign. At this point, when the enhanced LCZ was slightly cool, the baseline LCZ was observed as warm. In the last monitoring campaign (10th), outdoor thermal comforts of the enhanced and base LCZs were seen as slightly warm and warm.

4. Discussion and Conclusions

This study concentrated on enhancing outdoor thermal comfort at the pedestrian level within a local climate zone (LCZ) in Dubai, UAE, employing various cooling interventions, such as vegetation, architectural adjustments, and alterations in pavement material color. This study started with the verification of the CFD modeling method based on the available measurements in the literature. Then, different cooling interventions were investigated separately to mitigate heat stress. At the end of this study, the cooling interventions were combined to show the cumulative impact on outdoor thermal comfort in the LCZ.
Validation of CFD modeling method: Fatima and Chaudhry’s findings, citing a 10.67% average deviation between numerical and experimental studies, initially set the benchmark for this investigation [31]. However, upon validating our CFD modeling method against their experiments, we observed a lower average deviation of 6.1%, suggesting a tighter alignment between our numerical simulations and the empirical data. This discrepancy prompted a critical examination of mesh structures within our LCZ, potentially accounting for divergent numerical results compared with Fatima and Chaudhry’s findings.
Result Reliability: As outlined in Section 2.2.3, the reliability of the results was ensured by initially comparing various modeling techniques with experimental studies from the literature, utilizing the computational fluid dynamics (CFD) method employed in this study. This meticulous approach allowed for the identification of the most accurate modeling techniques, ensuring that the ongoing scenario investigations proceeded with minimal error rates.
Effectiveness of implemented cooling interventions: The efficacy of cooling interventions within the LCZ was thoroughly scrutinized, revealing noteworthy impacts on outdoor thermal comfort. Shade structures emerged as the standout, exerting a cooling effect ranging from 8.31% to 14.25%, making them the prime choice for mitigating heat stress. In comparison, trees and chimneys followed suit, offering cooling contributions spanning from 5.35% to 14.99% and 4.97% to 11.28%, respectively. Even bushes, though modest in their effect, still managed to contribute significantly, ranging from 2.75% to 9.43%. This comprehensive analysis underscores the complex interplay between various interventions and their tangible effects on outdoor thermal conditions within urban environments.
Impact of the combined scenario: The amalgamation of multiple interventions in the combined scenario yielded remarkable enhancements in outdoor thermal comfort, showcasing a cooling effect ranging from 16.48% to 22.79%. This substantial improvement underscores the synergistic impact of integrating various strategies to combat heat stress within the urban environment. Additionally, the choice of light-colored pavement material emerged as a crucial factor, exhibiting a notably superior cooling effect when compared with its dark-colored counterpart. These findings challenge conventional practices and underscore the importance of material selection in urban design for optimizing thermal comfort.
Consideration of wind flow characteristics: this study highlights the importance of considering wind flow characteristics and their impact on urban heat island (UHI) intensity within the LCZ, with areas exhibiting higher turbulence kinetic energy showing greater cooling performance.
Confirmation through PMW method: The PMV method confirmed the effectiveness of cooling interventions during the monitoring period, showing consistent improvements in outdoor thermal comfort across all campaigns in the enhanced LCZ compared with the baseline. These results validate the interventions’ efficacy and highlight their collective role in reducing heat stress in urban areas, emphasizing the importance of empirical methods in assessing the impact of urban design on human comfort.
In conclusion, the findings of this study validate the numerical modeling approach and provide valuable insights for future microclimate modeling studies in urban areas. Future research directions may include expanding the CFD modeling approach to different geographic scales and investigating the long-term effects of interventions on UHI intensity.

Author Contributions

T.B.K.; Conceptualization, methodology, simulation, formal analysis, writing—original draft, A.R.; conceptualization, methodology, formal analysis, validation, writing—review and editing, final version. All authors have read and agreed to the published version of the manuscript.

Funding

This research received no external funding.

Data Availability Statement

The original contributions presented in the study are included in the article, further inquiries can be directed to the corresponding author.

Conflicts of Interest

The authors declare no conflicts of interest.

References

  1. Ritchie, H.; Roser, M. Urbanization; Our World in Data, Global Change Data Lab: Oxford, UK, 2018. [Google Scholar]
  2. Founda, D.; Santamouris, M. Synergies between Urban Heat Island and Heat Waves in Athens (Greece), during an extremely hot summer (2012). Sci. Rep. 2017, 7, 10973. [Google Scholar] [CrossRef]
  3. Hamilton, I.; Stocker, J.; Evans, S.; Davies, M.; Carruthers, D. The impact of the London Olympic Parkland on the urban heat island. J. Build. Perform. Simul. 2014, 7, 119–132. [Google Scholar] [CrossRef]
  4. Yow, D.M. Urban Heat Islands: Observations, Impacts, and Adaptation. Geogr. Compass 2007, 1, 1227–1251. [Google Scholar] [CrossRef]
  5. Mentaschi, L.; Duveiller, G.; Zulian, G.; Corbane, C.; Pesaresi, M.; Maes, J.; Stocchino, A.; Feyen, L. Global long-term mapping of surface temperature shows intensified intra-city urban heat island extremes. Glob. Environ. Chang. 2022, 72, 102441. [Google Scholar] [CrossRef]
  6. Soltani, A.; Sharifi, E. Daily variation of urban heat island effect and its correlations to urban greenery: A case study of Adelaide. Front. Arch. Res. 2017, 6, 529–538. [Google Scholar] [CrossRef]
  7. Patz, A.J.; McGeehin, A.M.; Bernard, S.M.; Ebi, K.L.; Epstein, P.R.; Grambsch, A.; Gubler, D.J.; Reither, P.; Romieu, I.; Rose, J.B.; et al. The potential health impacts of climate variability and change for the United States: Executive summary of the report of the health sector of the U.S. National Assessment. Environ. Health Perspect. 2000, 108, 367–376. [Google Scholar] [CrossRef]
  8. Kim, S.W.; Brown, R.D. Urban heat island (UHI) intensity and magnitude estimations: A systematic literature review. Sci. Total. Environ. 2021, 779, 146389. [Google Scholar] [CrossRef]
  9. Kotharkar, R.; Ramesh, A.; Bagade, A. Urban Heat Island studies in South Asia: A critical review. Urban Clim. 2018, 24, 1011–1026. [Google Scholar] [CrossRef]
  10. Talebsafa, S.; Taheri Shahraeini, M.; Yang, X.; Rabiei, M. Impact of Providing Shade on Outdoor Thermal Comfort during Hot Season: A Case Study of a University Campus in Cold Semi-arid Climate. Renew. Energy Res. Appl. 2023, 4, 209–224. [Google Scholar]
  11. Rad, H.R.; Khodaee, Z.; Ghiai, M.M.; Arjmand, J.T.; Assad, M.E.H. The quantitative assessment of the effects of the morphology of urban complexes on the thermal comfort using the PMV/PPD model (a case study of Gheytariyeh neighborhood in Tehran). Int. J. Low-Carbon Technol. 2021, 16, 672–682. [Google Scholar] [CrossRef]
  12. Toparlar, Y.; Blocken, B.; Vos, P.; van Heijst, G.; Janssen, W.; van Hooff, T.; Montazeri, H.; Timmermans, H. CFD simulation and validation of urban microclimate: A case study for Bergpolder Zuid, Rotterdam. J. Affect. Disord. 2015, 83, 79–90. [Google Scholar] [CrossRef]
  13. Toparlar, Y.; Blocken, B.; Maiheu, B.; van Heijst, G. A review on the CFD analysis of urban microclimate. Renew. Sustain. Energy Rev. 2017, 80, 1613–1640. [Google Scholar] [CrossRef]
  14. Hendel, M.; Parison, S.; Grados, A.; Royon, L. Which pavement structures are best suited to limiting the UHI effect? A laboratory-scale study of Parisian pavement structures. J. Affect. Disord. 2018, 144, 216–229. [Google Scholar] [CrossRef]
  15. Acharya, T.; Riehl, B.; Fuchs, A. Effects of Albedo and Thermal Inertia on Pavement Surface Temperatures with Convective Boundary Conditions—A CFD Study. Processes 2021, 9, 2078. [Google Scholar] [CrossRef]
  16. Aboelata, A.; Sodoudi, S. Evaluating urban vegetation scenarios to mitigate urban heat island and reduce buildings’ energy in dense built-up areas in Cairo. J. Affect. Disord. 2019, 166, 106407. [Google Scholar] [CrossRef]
  17. Lee, H.; Mayer, H.; Chen, L. Contribution of trees and grasslands to the mitigation of human heat stress in a residential district of Freiburg, Southwest Germany. Landsc. Urban Plan. 2016, 148, 37–50. [Google Scholar] [CrossRef]
  18. Teichmann, F.; Baumgartner, C.M.; Horvath, A.; Luisser, M.; Korjenic, A. Simulation of urban microclimate with uhiSolver: Software validation using simplified material data. Ecol. Process. 2021, 10, 67. [Google Scholar] [CrossRef]
  19. Xu, M.; Bruelisauer, M.; Berger, M. Development of a new urban heat island modeling tool: Kent Vale case study. Procedia Comput. Sci. 2017, 108, 225–234. [Google Scholar] [CrossRef]
  20. Ming, T.; Lian, S.; Wu, Y.; Shi, T.; Peng, C.; Fang, Y.; de Richter, R.; Wong, N.H. Numerical Investigation on the Urban Heat Island Effect by Using a Porous Media Model. Energies 2021, 14, 4681. [Google Scholar] [CrossRef]
  21. Shahidan, M.F.; Jones, P.J.; Gwilliam, J.; Salleh, E. An evaluation of outdoor and building environment cooling achieved through combination modification of trees with ground materials. J. Affect. Disord. 2012, 58, 245–257. [Google Scholar] [CrossRef]
  22. Fatima, S.F.; Chaudhry, H.N. Steady-state CFD modelling and experimental analysis of the local microclimate in Dubai (UAE). Sustain. Build. 2017, 2, 5. [Google Scholar] [CrossRef]
  23. Chen, T.; Yang, H.; Chen, G.; Lam, C.K.C.; Hang, J.; Wang, X.; Liu, Y.; Ling, H. Integrated impacts of tree planting and aspect ratios on thermal environment in street canyons by scaled outdoor experiments. Sci. Total. Environ. 2021, 764, 142920. [Google Scholar] [CrossRef]
  24. Jendritzky, G.; Nübler, W. A model analysing the urban thermal environment in physiologically significant terms. Arch. Meteorol. Geophys. Bioclimatol. Ser. B 1981, 29, 313–326. [Google Scholar] [CrossRef]
  25. Khalili, S.; Fayaz, R.; Zolfaghari, S.A. Analyzing outdoor thermal comfort conditions in a university campus in hot-arid climate: A case study in Birjand, Iran. Urban Clim. 2022, 43, 101128. [Google Scholar] [CrossRef]
  26. Sugiono, S.; Hardiningtyas, D. Thermal comfort investigation based on predicted mean vote (PMV) Index using computation fluid dynamic (CFD) Simulation (Case Study: University of Brawijaya, Malang-Indonesia). Int. Sci. Index 2014, 8, 612–618. [Google Scholar]
  27. Blocken, B.; Janssen, W.; van Hooff, T. CFD simulation for pedestrian wind comfort and wind safety in urban areas: General decision framework and case study for the Eindhoven University campus. Environ. Model. Softw. 2012, 30, 15–34. [Google Scholar] [CrossRef]
  28. Van Hooff, T.; Blocken, B. Coupled urban wind flow and indoor natural ventilation modelling on a high-resolution grid: A case study for the Amsterdam ArenA stadium. Environ. Model. Softw. 2010, 25, 51–65. [Google Scholar] [CrossRef]
  29. Franke, J.; Hellsten, A.; Schlünzen, K.; Carissimo, B. Best practice guideline for the cfd simulation of flows in the urban environment—A summary. In Proceedings of the 11th Conference on Harmonisation within Atmospheric Dispersion Modelling for Regulatory Purposes, Cambridge, UK, 2–5 July 2007; Cambridge Environmental Research Consultants: Cambridge, UK, 2007. [Google Scholar]
  30. Tominaga, Y.; Mochida, A.; Murakami, S.; Sawaki, S. Comparison of various revised k–ε models and LES applied to flow around a high-rise building model with 1:1:2 shape placed within the surface boundary layer. J. Wind Eng. Ind. Aerodyn. 2008, 96, 389–411. [Google Scholar] [CrossRef]
  31. Allegrini, J.; Carmeliet, J. Coupled CFD and building energy simulations for studying the impacts of building height topology and buoyancy on local urban microclimates. Urban Clim. 2017, 21, 278–305. [Google Scholar] [CrossRef]
  32. Olivieri, F.; DI Perna, C.; D’Orazio, M.; Olivieri, L.; Neila, J. Experimental measurements and numerical model for the summer performance assessment of extensive green roofs in a Mediterranean coastal climate. Energy Build. 2013, 63, 1–14. [Google Scholar] [CrossRef]
  33. Setaih, K. Cfd modeling as a tool for assessing outdoor thermal comfort conditions in urban settings in hot arid climates. J. Inf. Technol. Constr. (ITcon) 2014, 19, 248–269. [Google Scholar]
  34. Allegrini, J.; Carmeliet, J. Simulations of local heat islands in Zürich with coupled CFD and building energy models. Urban Clim. 2018, 24, 340–359. [Google Scholar] [CrossRef]
  35. Harris, R. The structure of strong winds. In Proceedings of the CIRIA Conference on Wind Engineering in the Eighties, London, UK, 12–13 November 1980; Construction Industry Research and Information Association (CIRIA): London, UK, 1981. [Google Scholar]
  36. Asaeda, T.; Ca, V.T.; Wake, A. Heat storage of pavement and its effect on the lower atmosphere. Atmospheric Environ. 1996, 30, 413–427. [Google Scholar] [CrossRef]
  37. Stavrakakis, G.M.; Katsaprakakis, D.A.; Damasiotis, M. Basic Principles, Most Common Computational Tools, and Capabilities for Building Energy and Urban Microclimate Simulations. Energies 2021, 14, 6707. [Google Scholar] [CrossRef]
  38. Barakat, A.; Ayad, H.; El-Sayed, Z. Urban design in favor of human thermal comfort for hot arid climate using advanced simulation methods. Alex. Eng. J. 2017, 56, 533–543. [Google Scholar] [CrossRef]
  39. Kang, G.; Kim, J.-J.; Choi, W. Computational fluid dynamics simulation of tree effects on pedestrian wind comfort in an urban area. Sustain. Cities Soc. 2020, 56, 102086. [Google Scholar] [CrossRef]
  40. Liu, J.; Srebric, J.; Yu, N. Numerical simulation of convective heat transfer coefficients at the external surfaces of building arrays immersed in a turbulent boundary layer. Int. J. Heat Mass Transf. 2013, 61, 209–225. [Google Scholar] [CrossRef]
  41. Zeeshan, M.; Ali, Z.; Sajid, M.; Ali, M.; Usman, M. Modelling the cooling effectiveness of street trees with actual canopy drag and real transpiration rate under representative climatic conditions. J. Build. Perform. Simul. 2022, 1–14. [Google Scholar] [CrossRef]
  42. Kurotani, Y.; Kiyota, N.; Kobayashi, S. Windbreak Effect of Tsuijimatsu in Izumo: Part. 2. Proc. Archit. Inst. Jpn. 2001, 745–746. [Google Scholar]
  43. Mirzaei, P.A.; Carmeliet, J. Dynamical computational fluid dynamics modeling of the stochastic wind for application of urban studies. J. Affect. Disord. 2013, 70, 161–170. [Google Scholar] [CrossRef]
  44. Wilkinson, S.; Hanna, S.; Hesselgren, L.; Mueller, V. Inductive aerodynamics’ computation and performance. In Proceedings of the 31st International Conference on Education and research in Computer Aided Architectural Design in Europe (eCAADe 2013), Delft, The Netherlands, 18–20 September 2013; pp. 29–48. [Google Scholar]
  45. Olivieri, F.; Sassenou, L.-N.; Olivieri, L. Potential of Nature-Based Solutions to Diminish Urban Heat Island Effects and Improve Outdoor Thermal Comfort in Summer: Case Study of Matadero Madrid. Sustainability 2024, 16, 2778. [Google Scholar] [CrossRef]
  46. Azimi, Z.; Kashfi, S.S.; Semiari, A.; Shafaat, A. Outdoor thermal comfort in open transitional spaces with limited greenery in hot summer/cold winter climates. Discov. Environ. 2024, 2, 31. [Google Scholar] [CrossRef]
Figure 1. Satellite view taken in 2023 from Google Inc. of the investigated LCZ.
Energies 17 02242 g001
Figure 2. Dimensions of the investigated LCZ (a), and monitoring campaigns for temperatures at pedestrian level (b).
Energies 17 02242 g002
Figure 3. (a) Isometric, (b) top, (c) views of the enhanced area with vegetation and architectural interventions.
Energies 17 02242 g003
Figure 4. Overall framework of this study.
Energies 17 02242 g004
Figure 5. Schematic illustration of the computational domain (a) and the computational grid on the building surfaces (b) (8,353,485 cells).
Energies 17 02242 g005
Figure 6. Grid independence study.
Energies 17 02242 g006
Figure 7. Schematic illustration of the boundary conditions [12,31].
Energies 17 02242 g007
Figure 8. Comparisons of CFD modeling approaches on the referenced study of Fatima and Chaudhry (a) and material effect studies of Asaeda et al. and Acharya et al. (b) [15,22,36].
Energies 17 02242 g008
Figure 9. Measurement points (a) and compared velocity distribution with trees (b) [30,39,42].
Energies 17 02242 g009
Figure 10. Wind speed and streamlines (a), temperature and their monitoring campaigns (b), and turbulence kinetic energy (c) distributions at the pedestrian level.
Energies 17 02242 g010
Figure 11. Wind velocity/streamlines (a,d,g), ambient temperature (b,e,h), and turbulence kinetic energy (c,f,i) distributions at the pedestrian level (WS: 0.4 m/s, tree: (ac), bush: (df), chimney: (gi)).
Energies 17 02242 g011
Figure 12. Wind velocity/streamlines (a), ambient temperature (b), turbulence kinetic energy (c) distributions of the combined scenario (tree + bush + chimney + shade structure + concrete ground material).
Energies 17 02242 g012
Figure 13. Comparison of the outdoor thermal comfort between the base and enhanced LCZs.
Energies 17 02242 g013
Table 1. Physical specifications of cooling interventions.
GroupParameterDefinition
VegetationTree2 m width, 7m height, and 37 trees in total.
Bush1.5 m diameter, 1.2 m height, and 52 bushes in total.
MaterialDark-ColoredThermophysical properties were obtained from Asaeda et al.s’
Light-Coloredexperiment and applied on the ground separately.
ArchitectureChimney10 m height, 7 m diameter at the ground, and 3 m at the top. Two chimneys in total.
Shade Structure23.85% of the area covered in the main hall of this LCZ.
CombinedCombination of the best interventions as indicated above.
Table 2. Thermophysical properties of ground materials (own elaboration based on data from [36]).
MaterialDensity (kg/m3)Specific Heat (J/kgK)Thermal Conductivity (W/mK)Emissivity (ε) Reflectivity
Asphalt22436330.740.940.10
Concrete180011501.690.940.45
Table 3. Specifications of cooling interventions.
Modeling Methods and Boundary Conditions
Turbulence modelRealizable k-ε
Radiation modelDiscrete ordinates (DO)
Pressure–velocity couplingSIMPLE
Spatial discretizationSecond order
Convergence criteria10−6 (mass and momentum)/10−7 (energy)
Near-wall treatmentStandard wall functions
Outdoor thermal comfortPredicted mean vote (PMV)
Inlet velocity temperature0.4, 2, 4, 6, 8, 10 m/s–27 °C
Wall temperature37 °C
Glazing temperatures (east, north, south, west)25 °C, 26 °C, 42 °C, 30 °C
Table 4. Temperature distributions in the monitoring campaigns and average temperature differences.
Points12345678910Avg.
Experiments (°C)26.525.424.526.222.825.023.324.523.424.024.6
Numerical (°C)27.426.626.626.825.226.825.925.724.725.926.2
Differences (%)3.34.57.92.29.56.710.04.75.37.36.1
Table 5. Average temperature values in different scenarios.
Coolest Hottest
Case Study Air Speed (m/s)
0.4246810
GroupRankSpeciesAverage Temperature (°C)
Vegetation Tree25.524.724.423.823.222.9
Bush26.225.825.525.124.724.4
Architecture Chimney25.625.324.824.724.323.9
Shade24.724.423.923.523.423.1
Material Asphalt29.429.128.928.828.628.5
Concrete28.127.727.527.427.227.1
Combined 22.522.121.821.321.120.8
Disclaimer/Publisher’s Note: The statements, opinions and data contained in all publications are solely those of the individual author(s) and contributor(s) and not of MDPI and/or the editor(s). MDPI and/or the editor(s) disclaim responsibility for any injury to people or property resulting from any ideas, methods, instructions or products referred to in the content.