

Factoring Building Refurbishment and Climatic Effect into Heat Demand Assessments and Forecasts: Case Study and Open Datasets for Germany

Abstract
:1. Introduction
- What progress can be forecasted in thermal refurbishment and reducing building heat demand in Germany? Would this progress be adequate to achieve greenhouse gas neutrality in the building stock?
- How do heat demand reductions differ in relation to efficiency standards of thermal refurbishments?
2. Materials and Methods
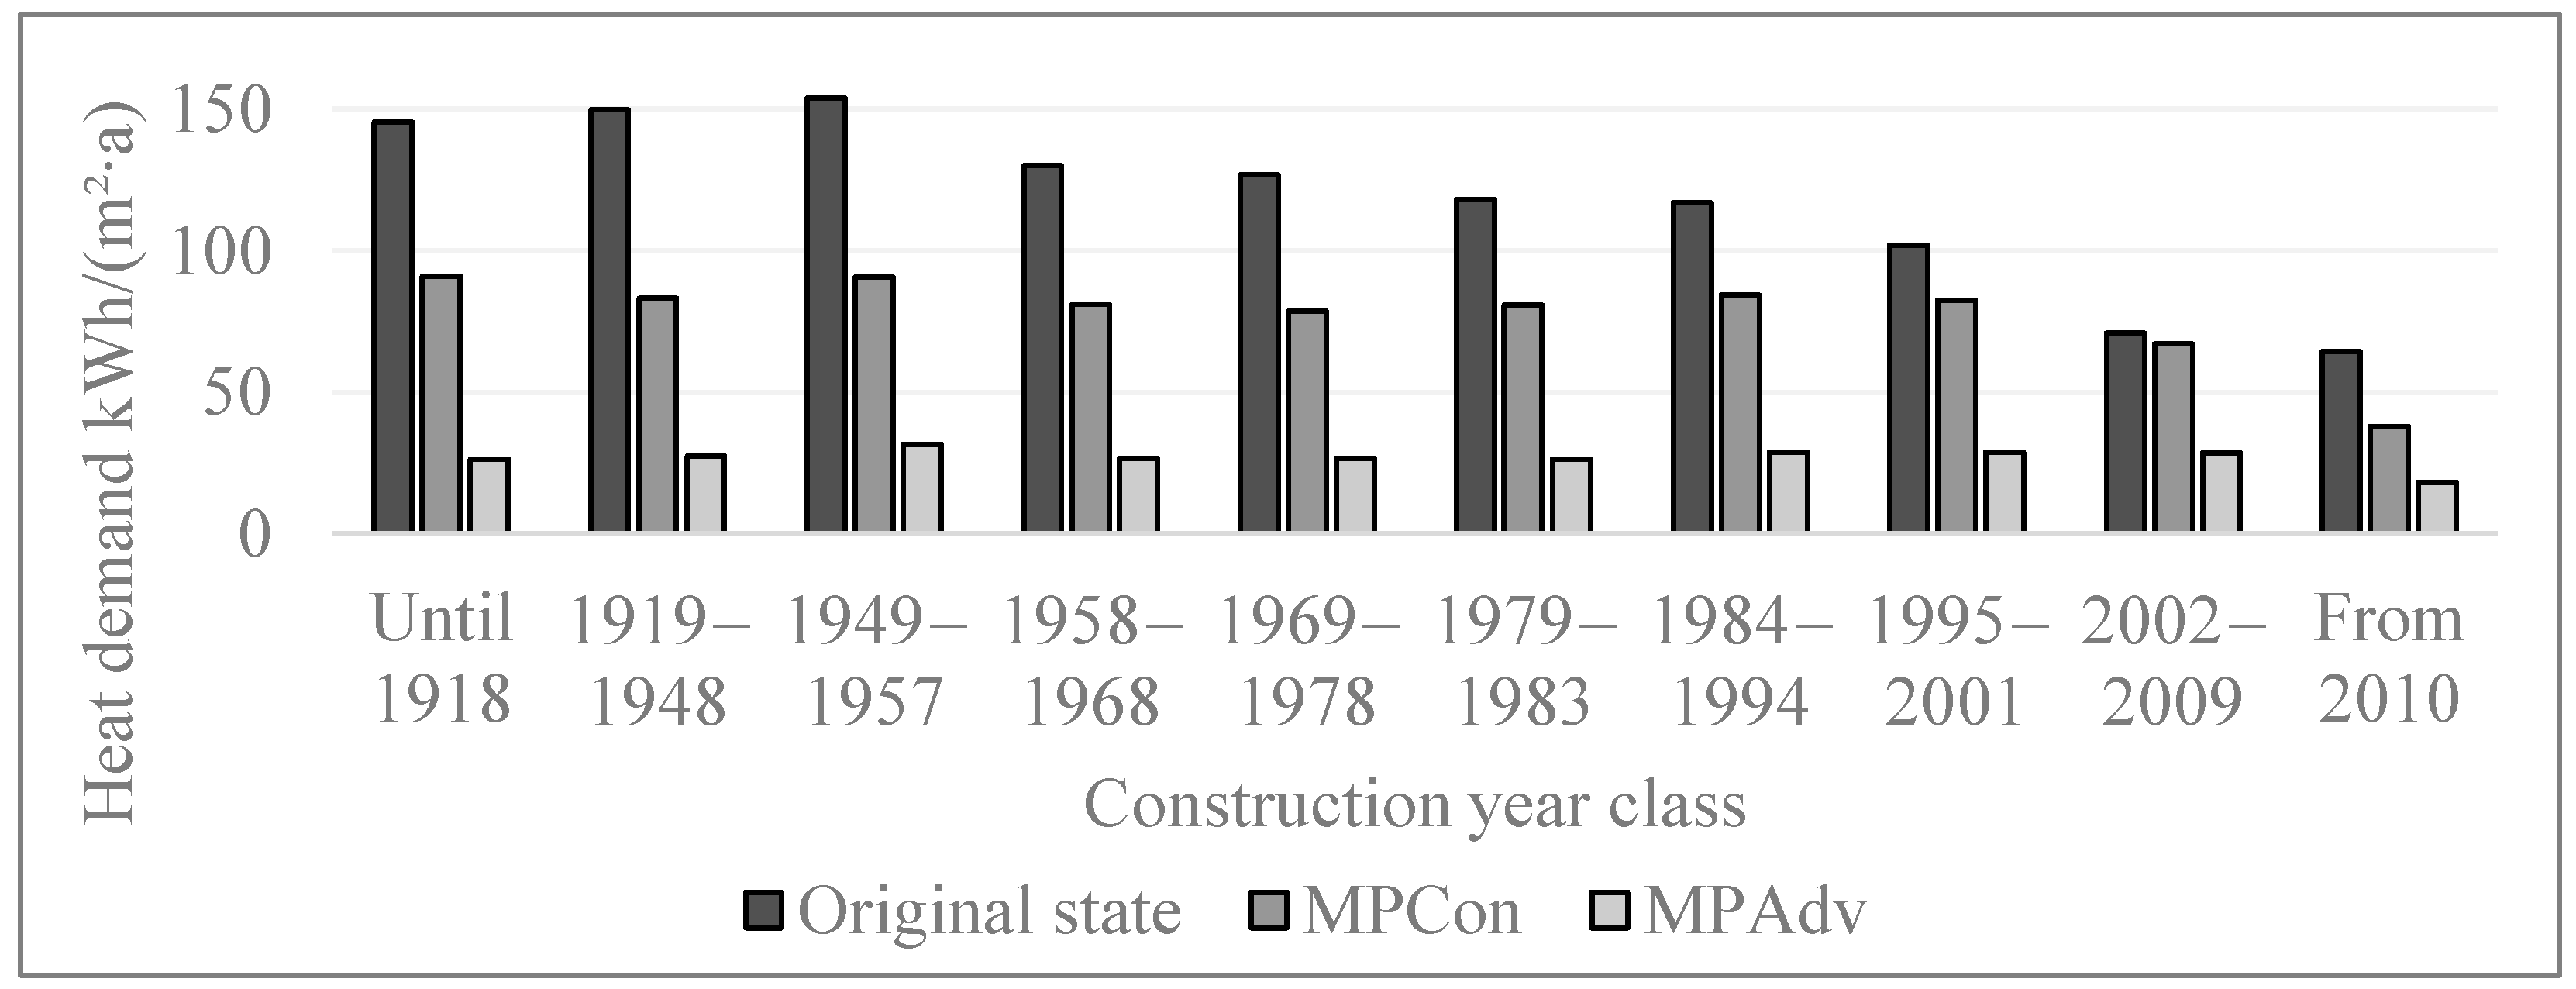
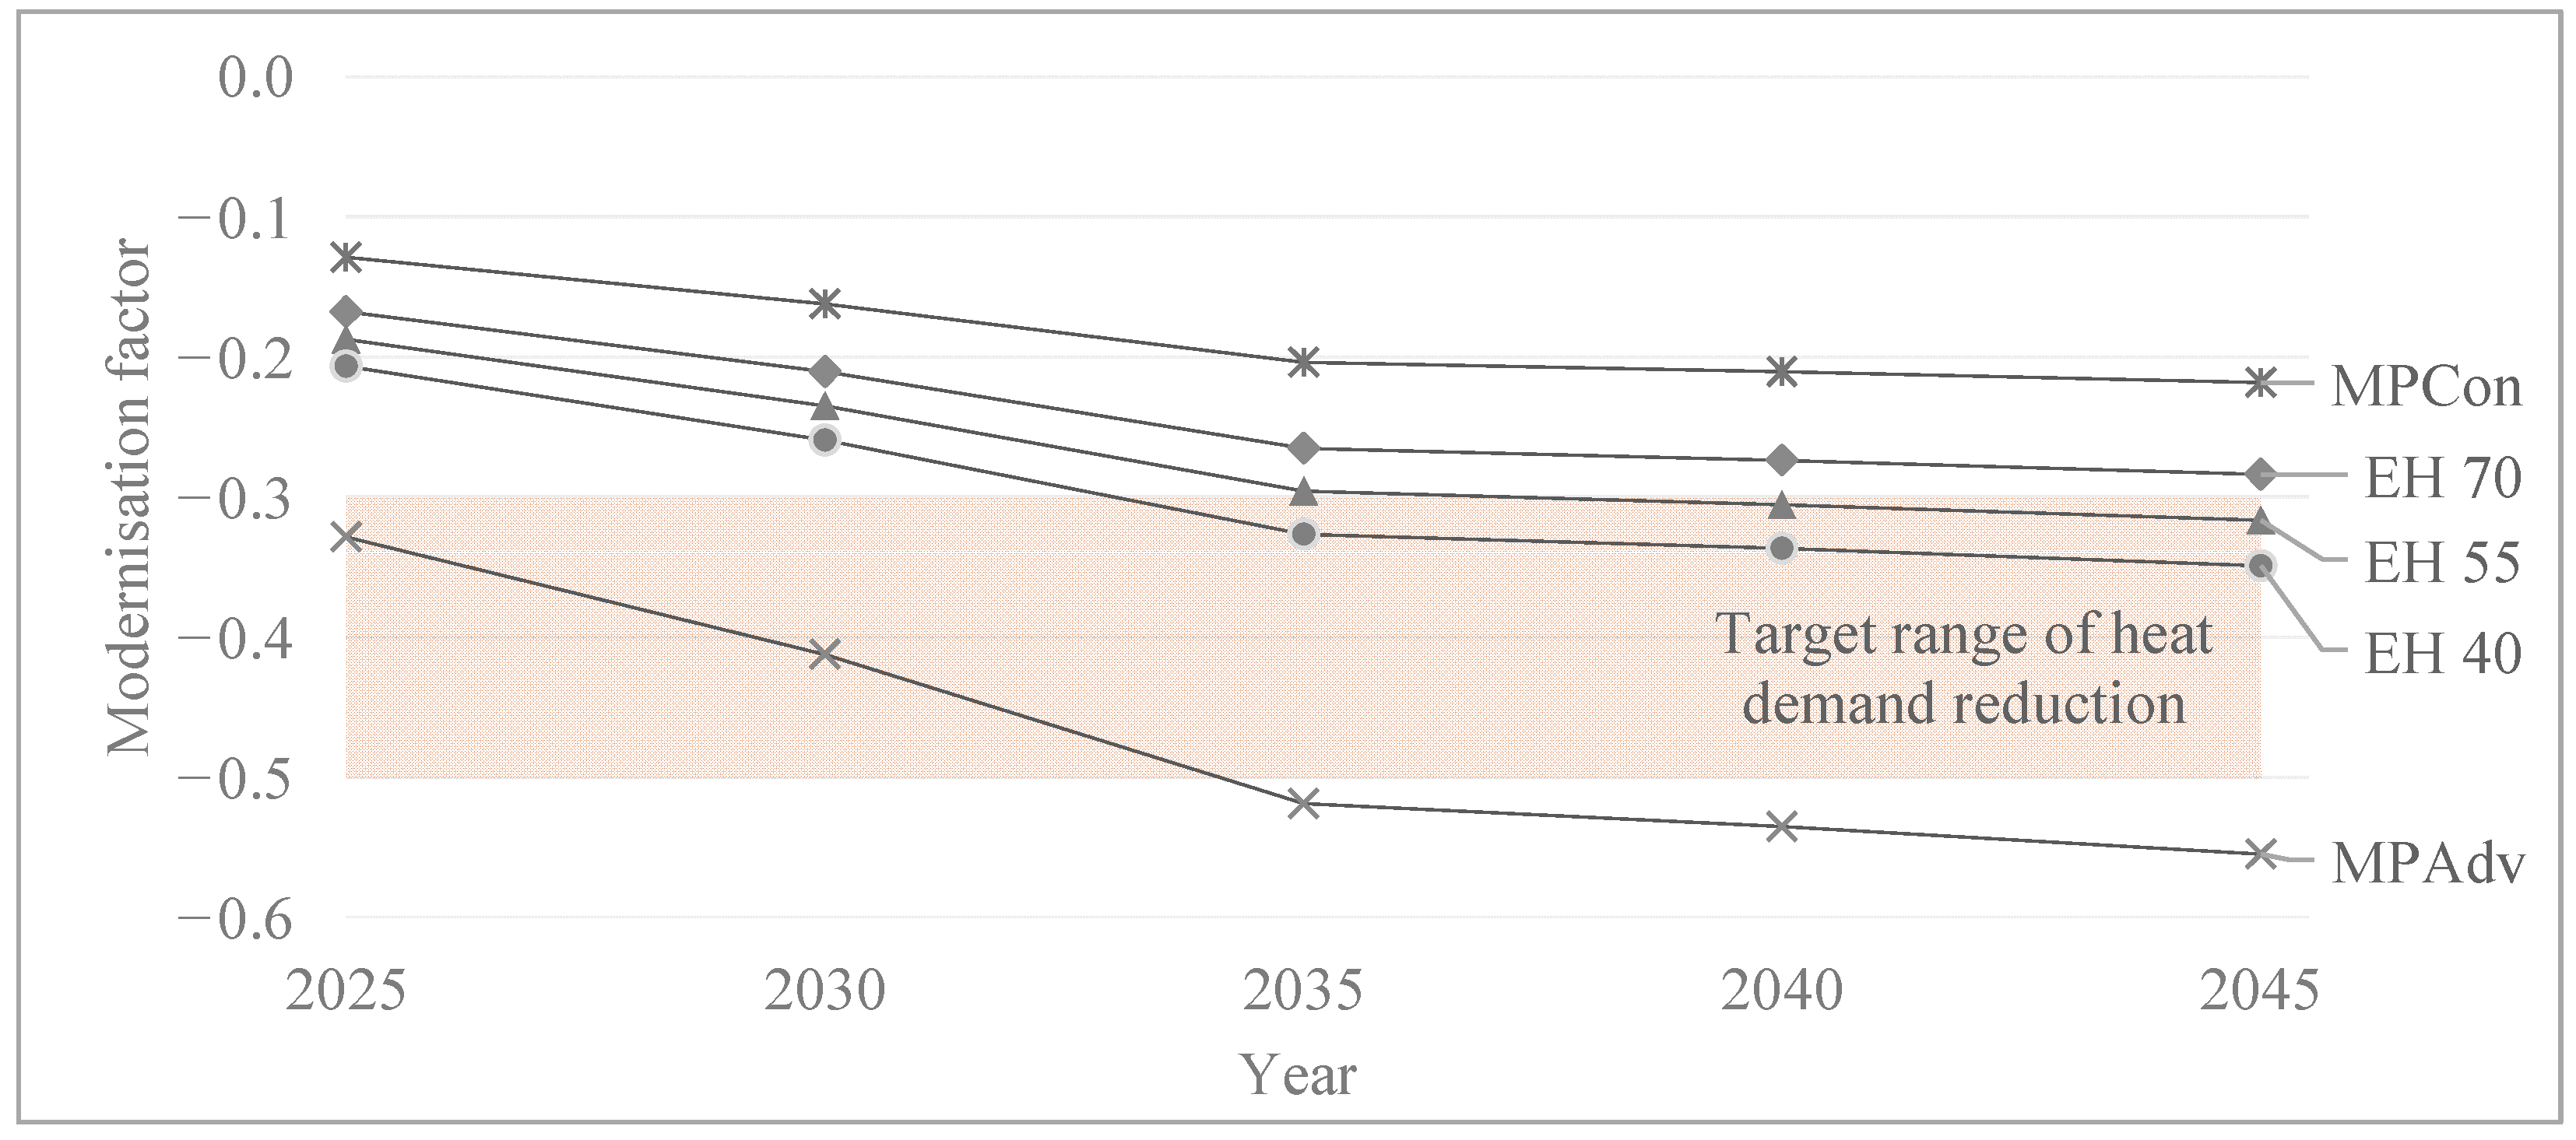
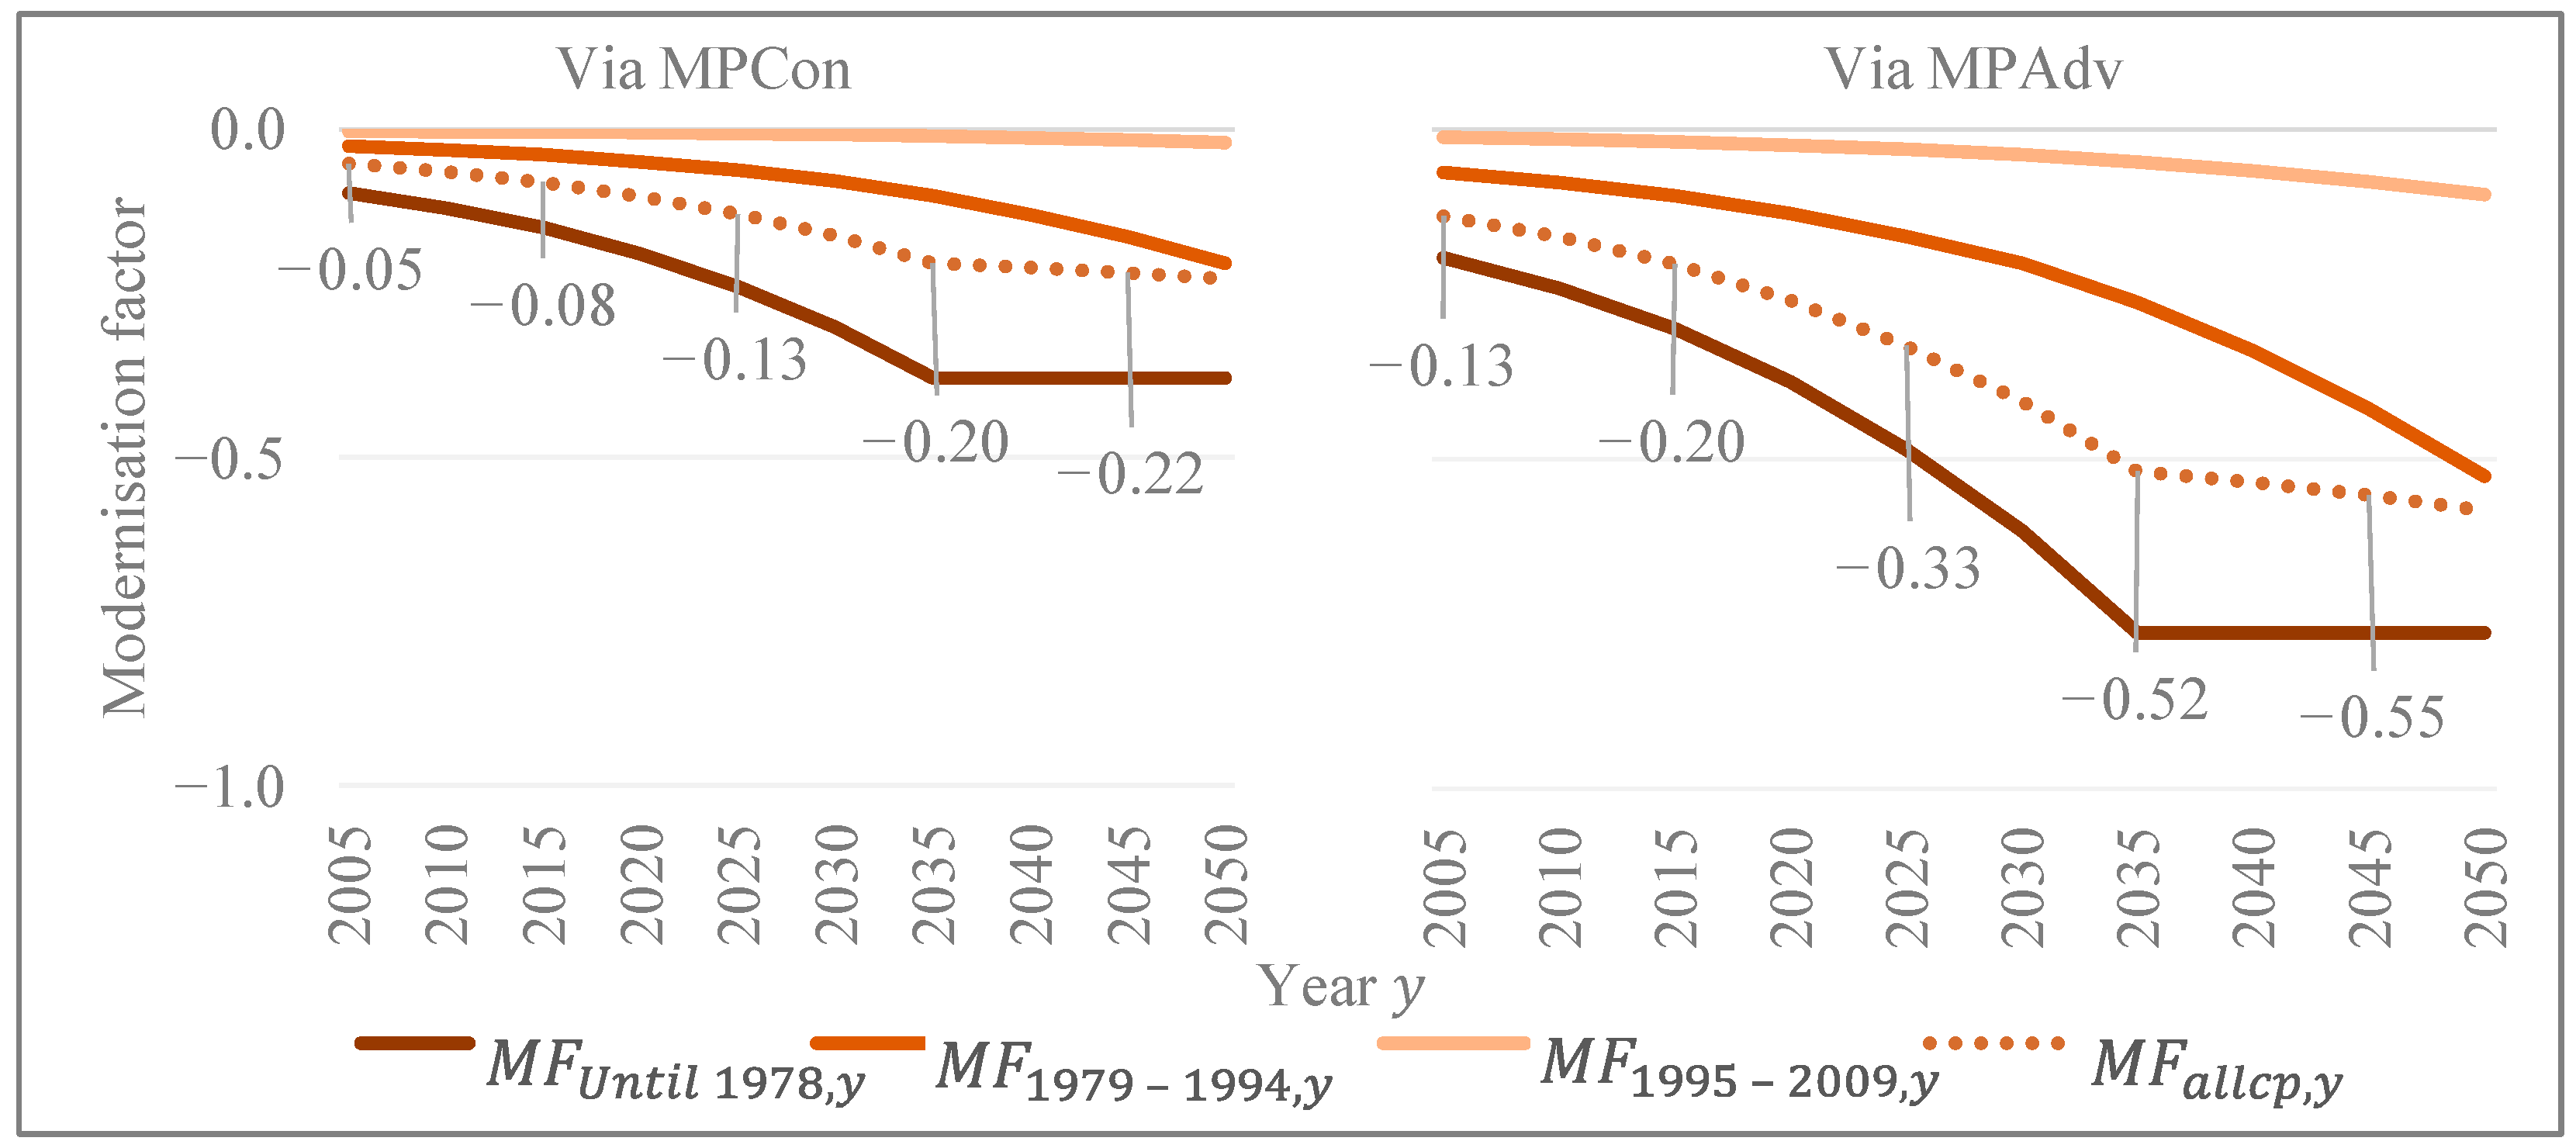
- MPCon with the “conventional” energy efficiency level corresponds to the practical implementation if the minimum standards of the Energy Saving Ordinance (EnEV) are met. For existing buildings, the minimum requirements on thermal insulation were adopted in the current “German Buildings Energy Act (Gebäudeenergiegesetz, GEG)” [41]. The GEG requirements correspond to a moderate reduction of the space heating demand [42].
- MPAdv with the “advanced” energy efficiency level corresponds to the thermal protection standard of passive houses.
- The Efficiency House (EH) standards EH 70, EH 55 and EH 40 have, respectively, 30%, 45% and 60% less energy demand than buildings constructed or refurbished according to the mandatory GEG standard. These savings relate to primary energy demand. However, in line with [13,43] they can roughly be extrapolated to final and useful energy demand.
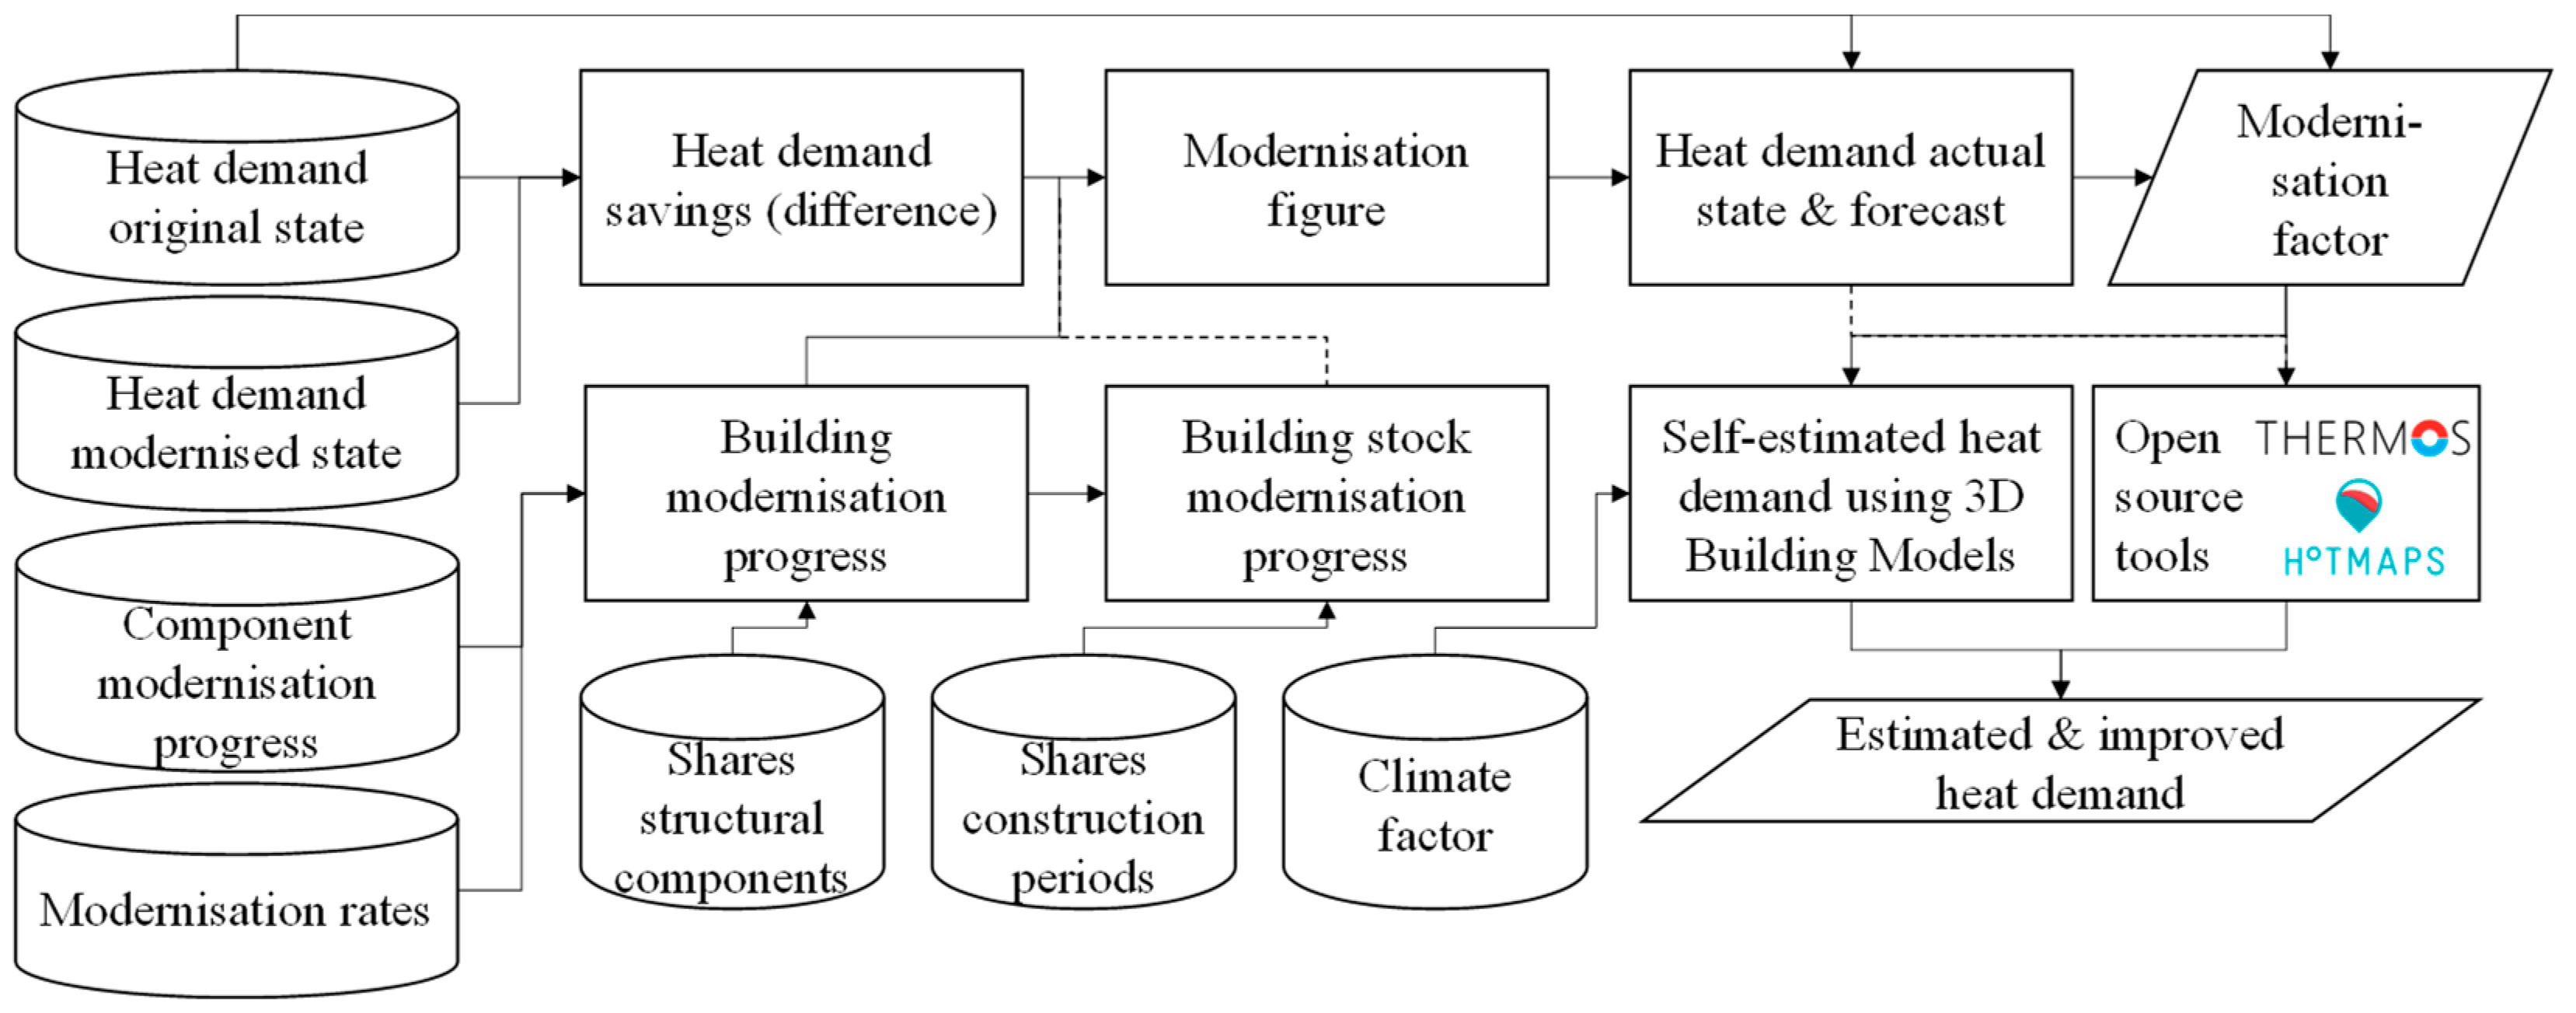
2.1. Impact and Key Figures of Modernisation
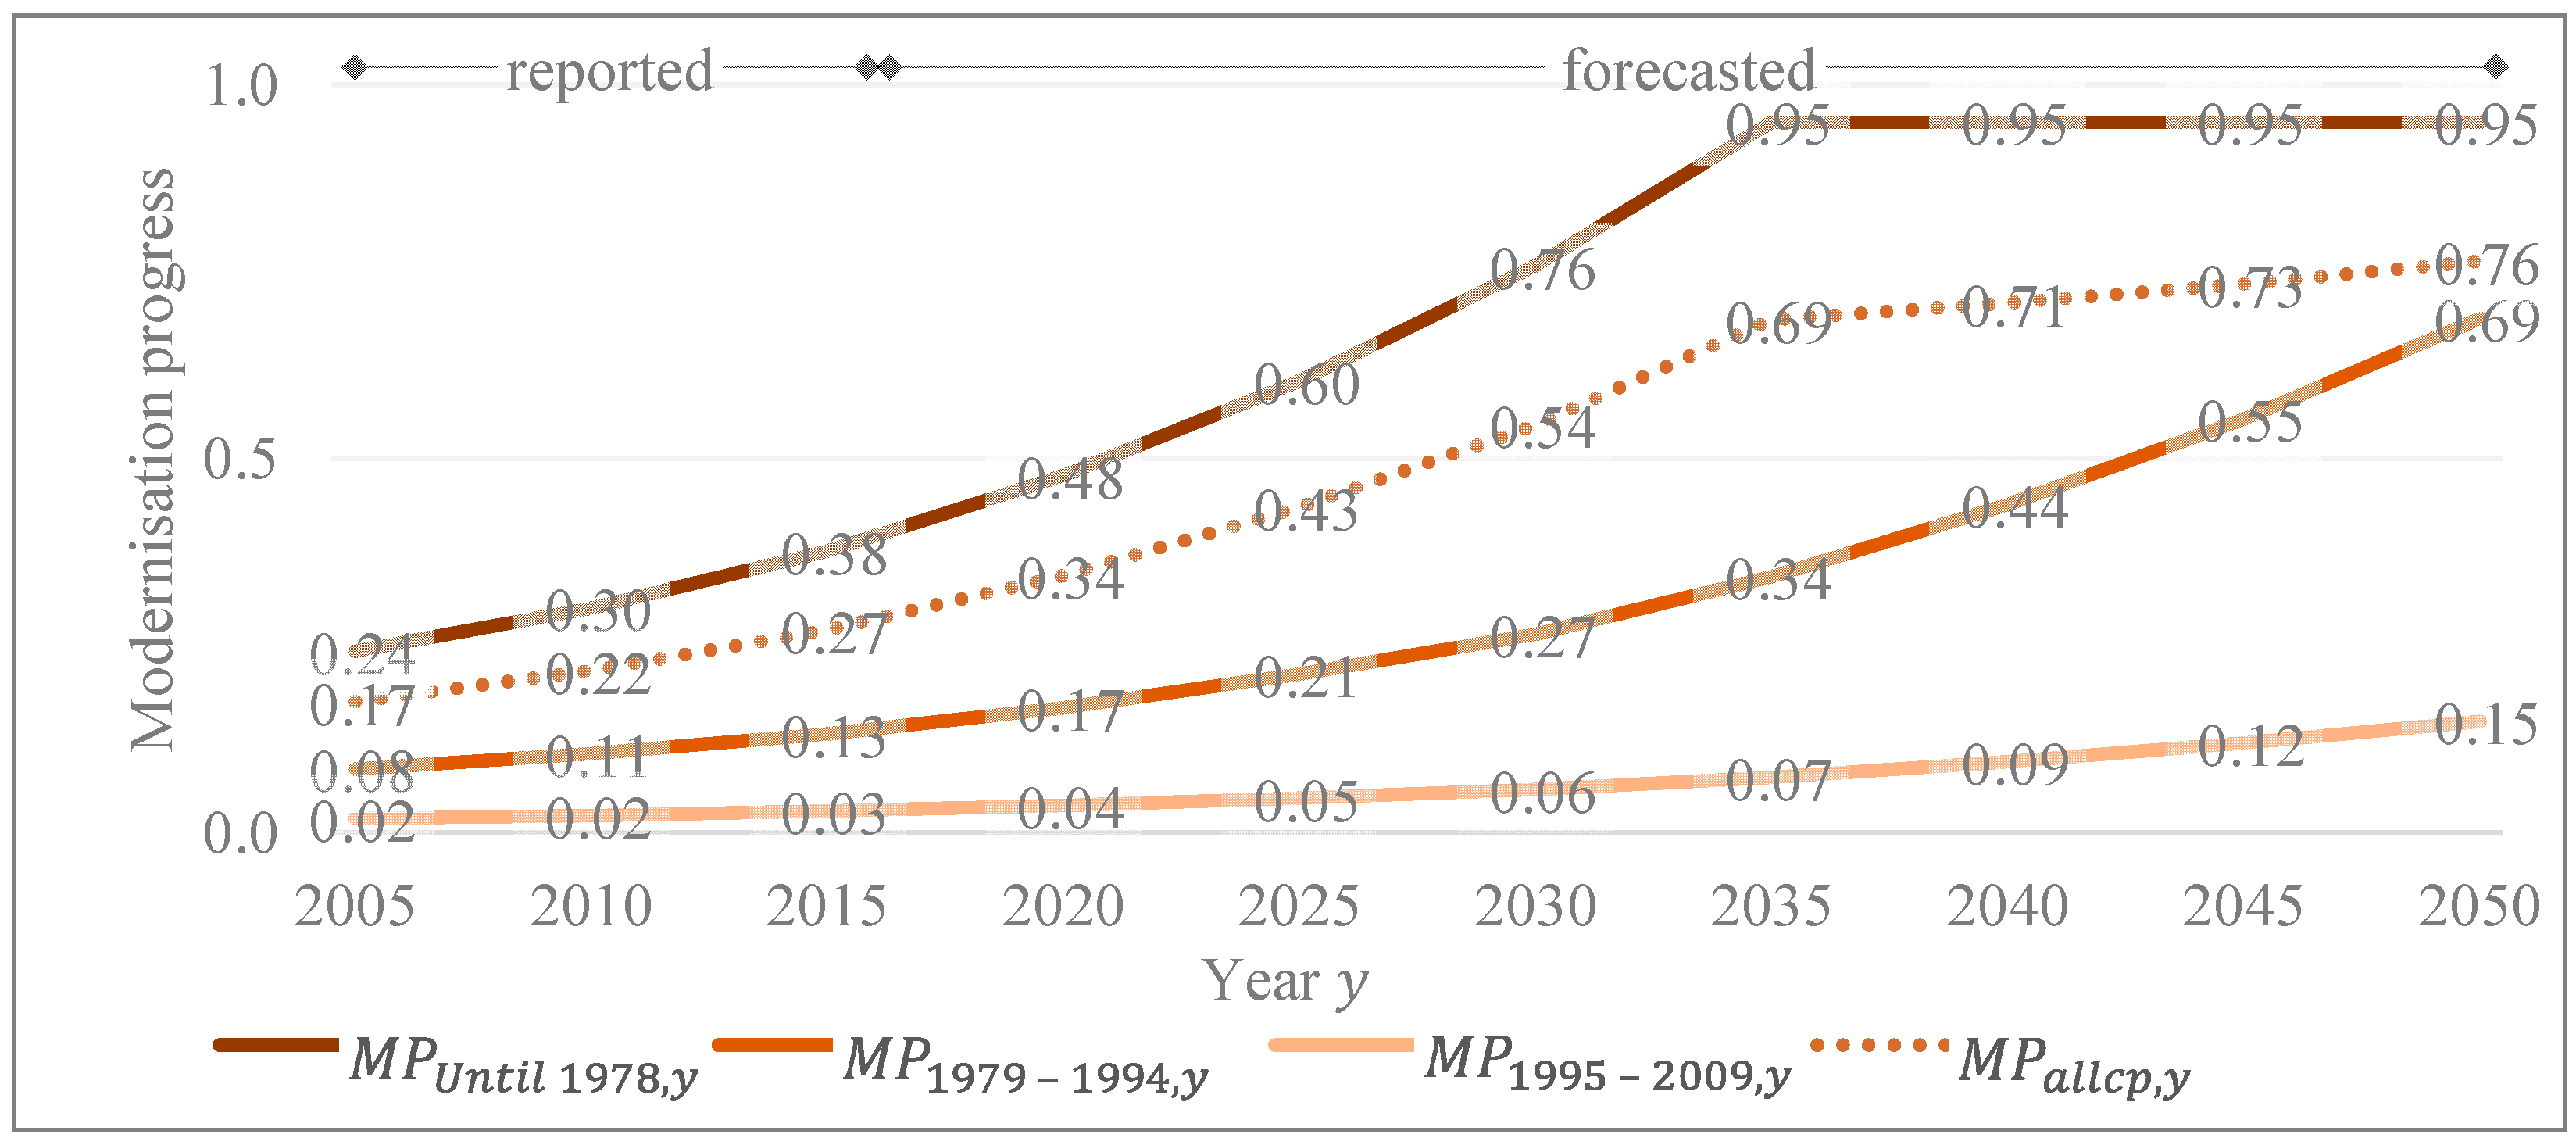
- Modernisation figure in kWh/(m2∙a) quantifies the reduction in heat demand expected in year as a result of the modernisation progress until that year.
- Modernisation factor expresses the factor by which the heat demand is expected to decrease in year as a result of the modernisation progress until that year.
- Adjusted heat demand in kWh/(m2∙a) describes the specific heat demand in year .
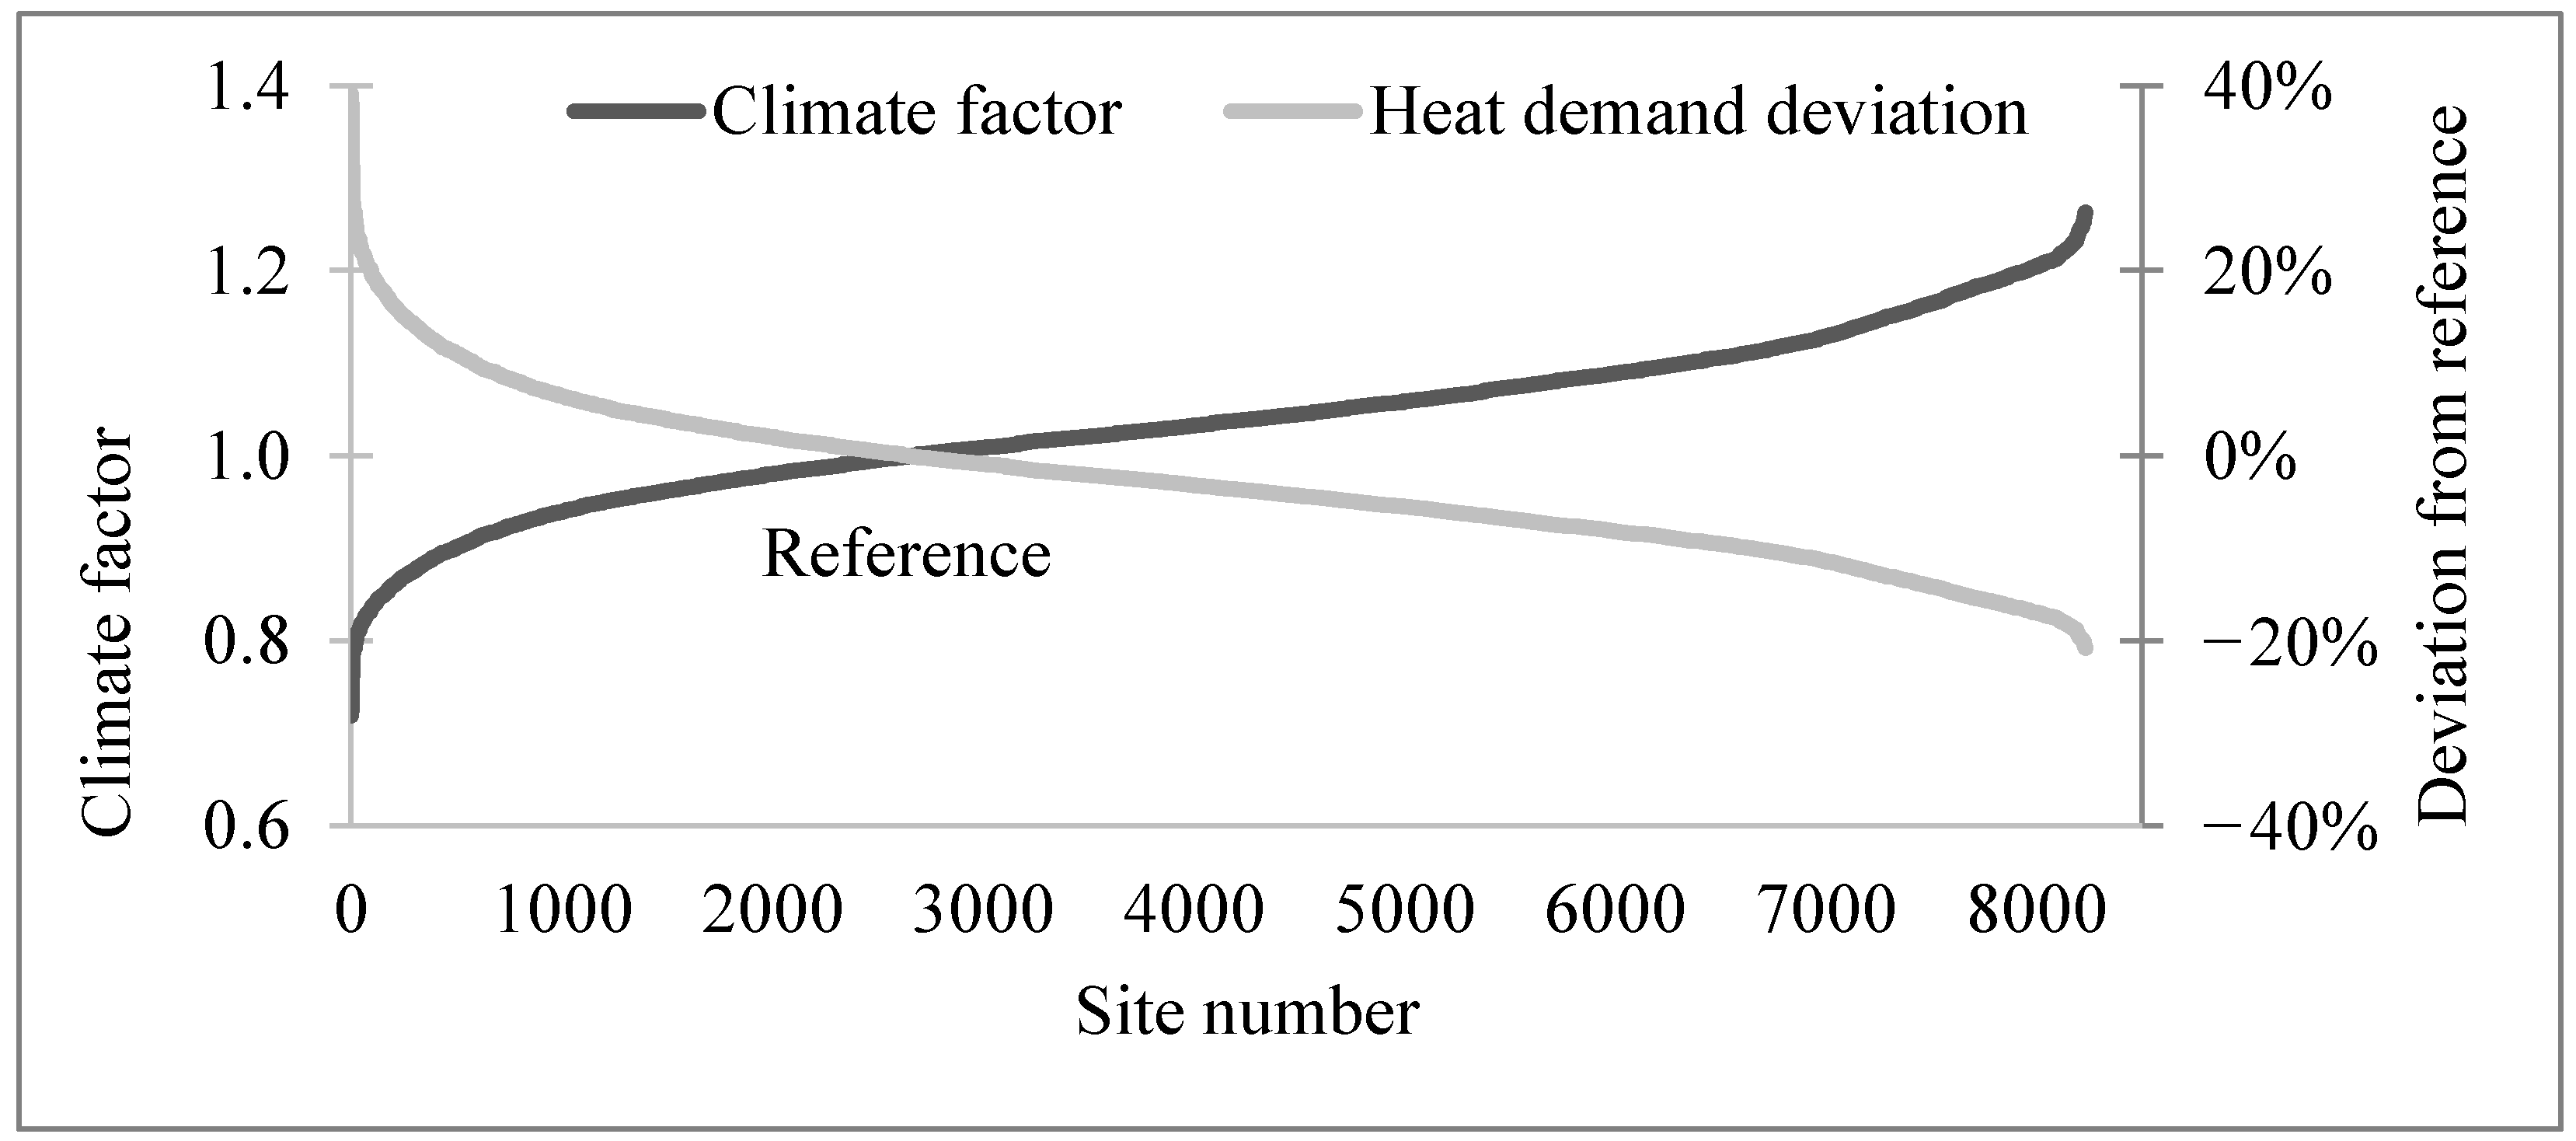
2.2. Climate Factor
2.3. Application in the Selected Tools
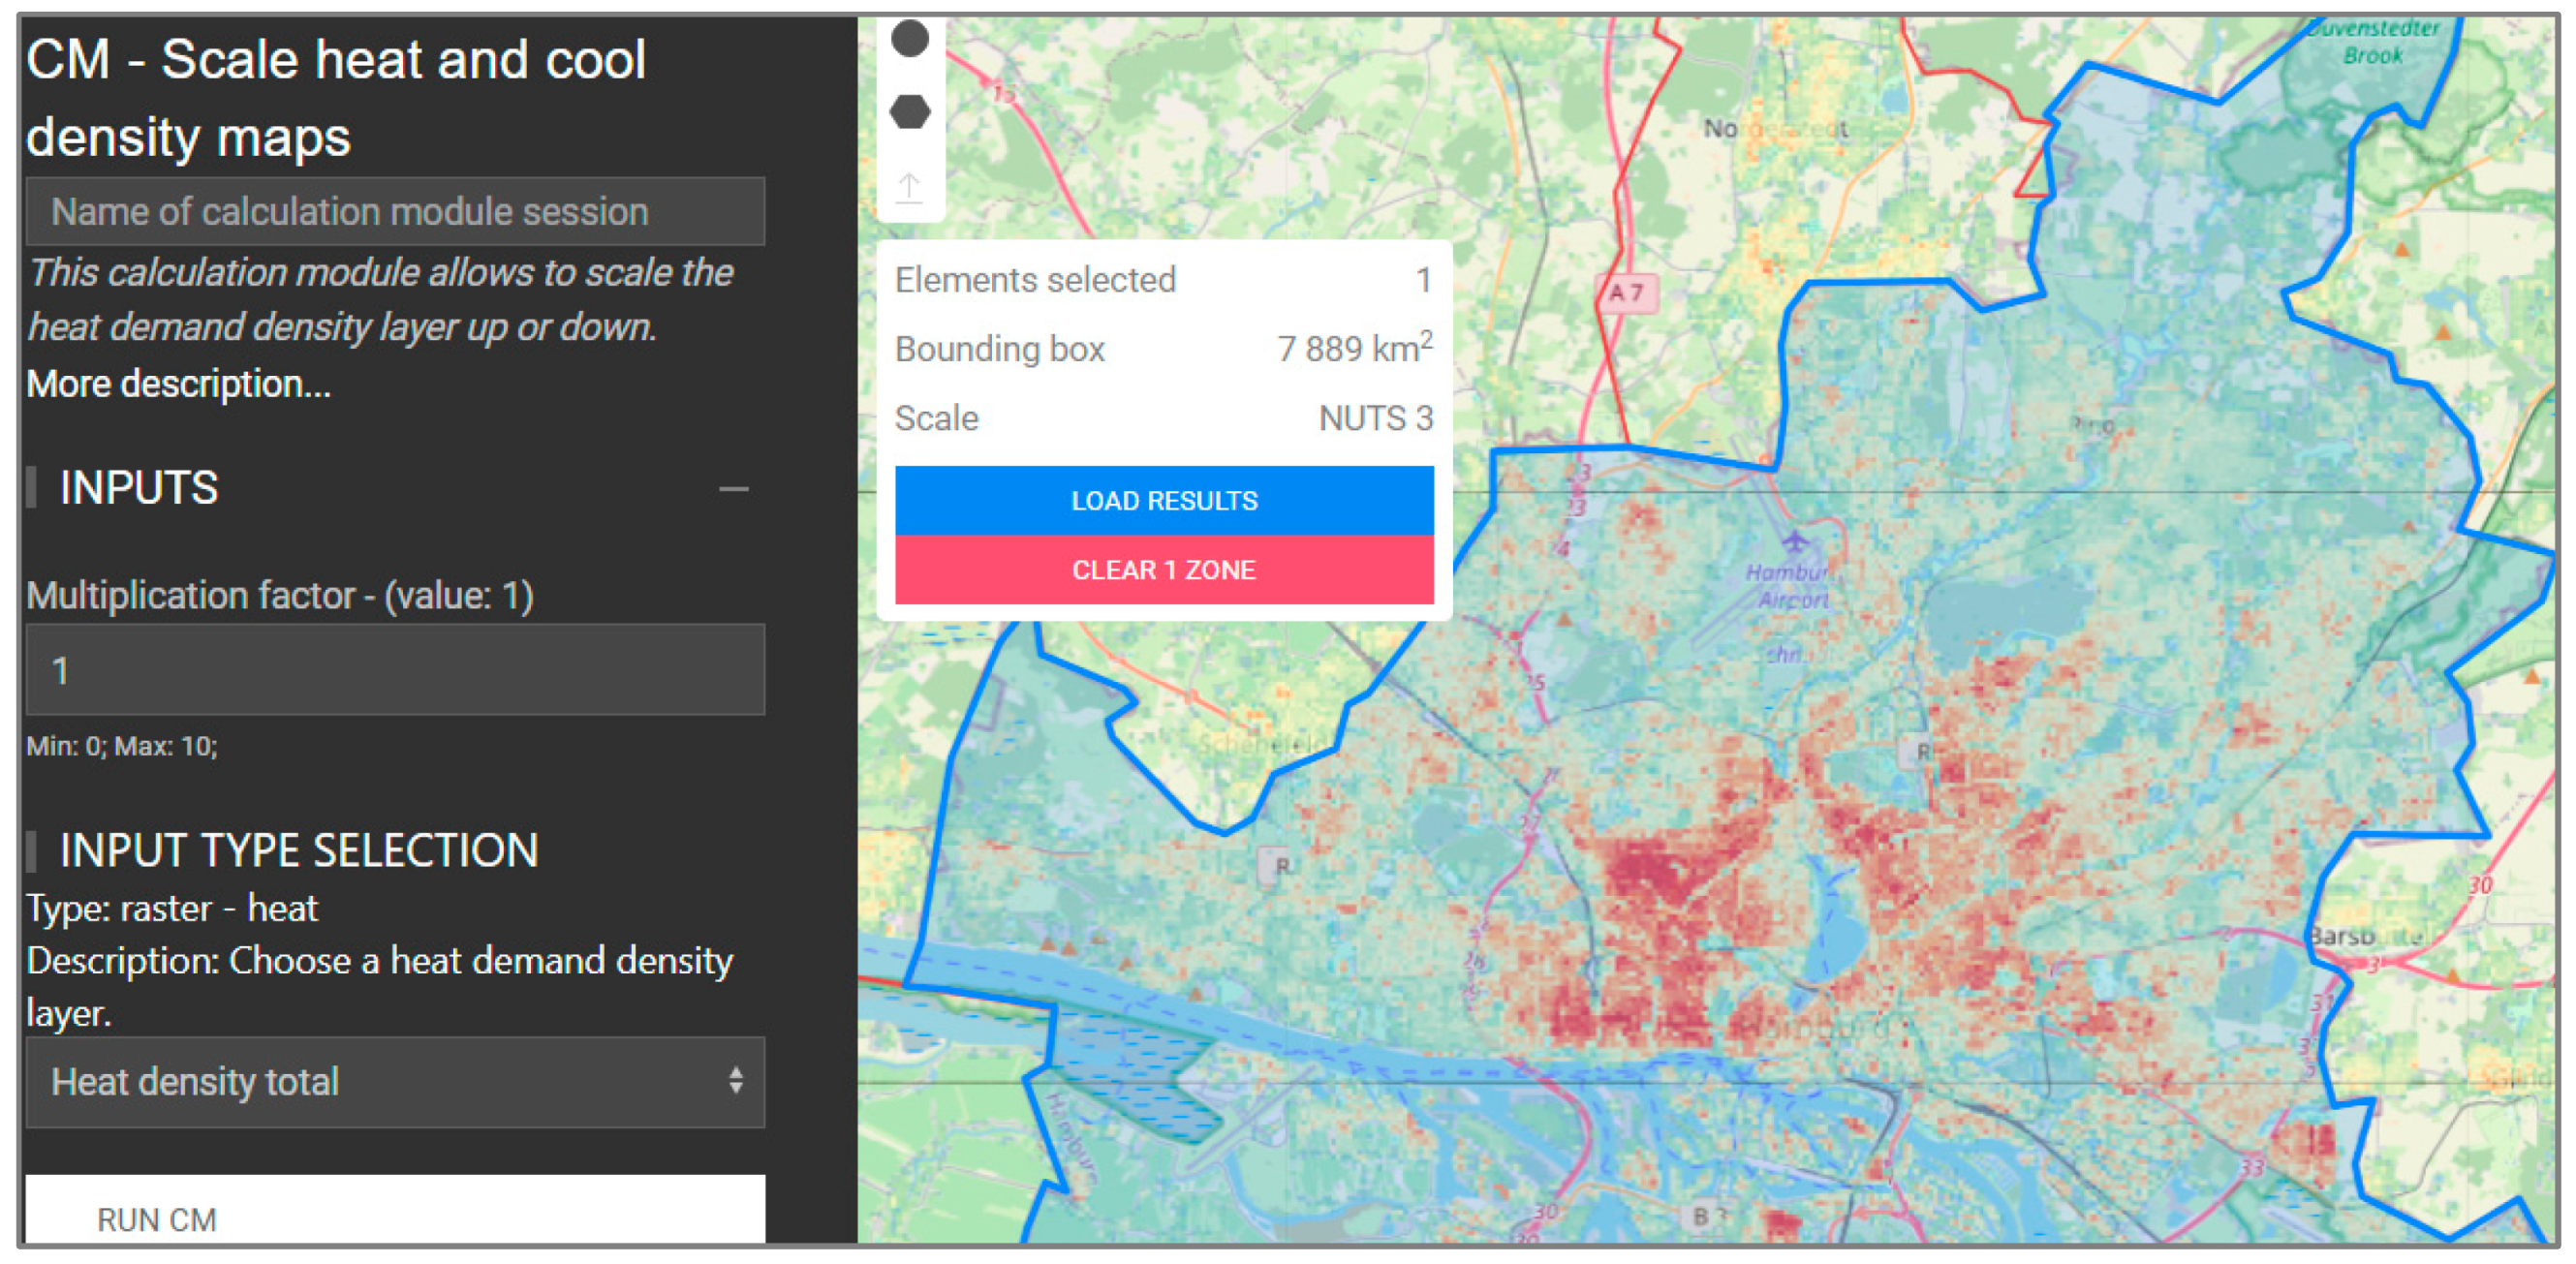
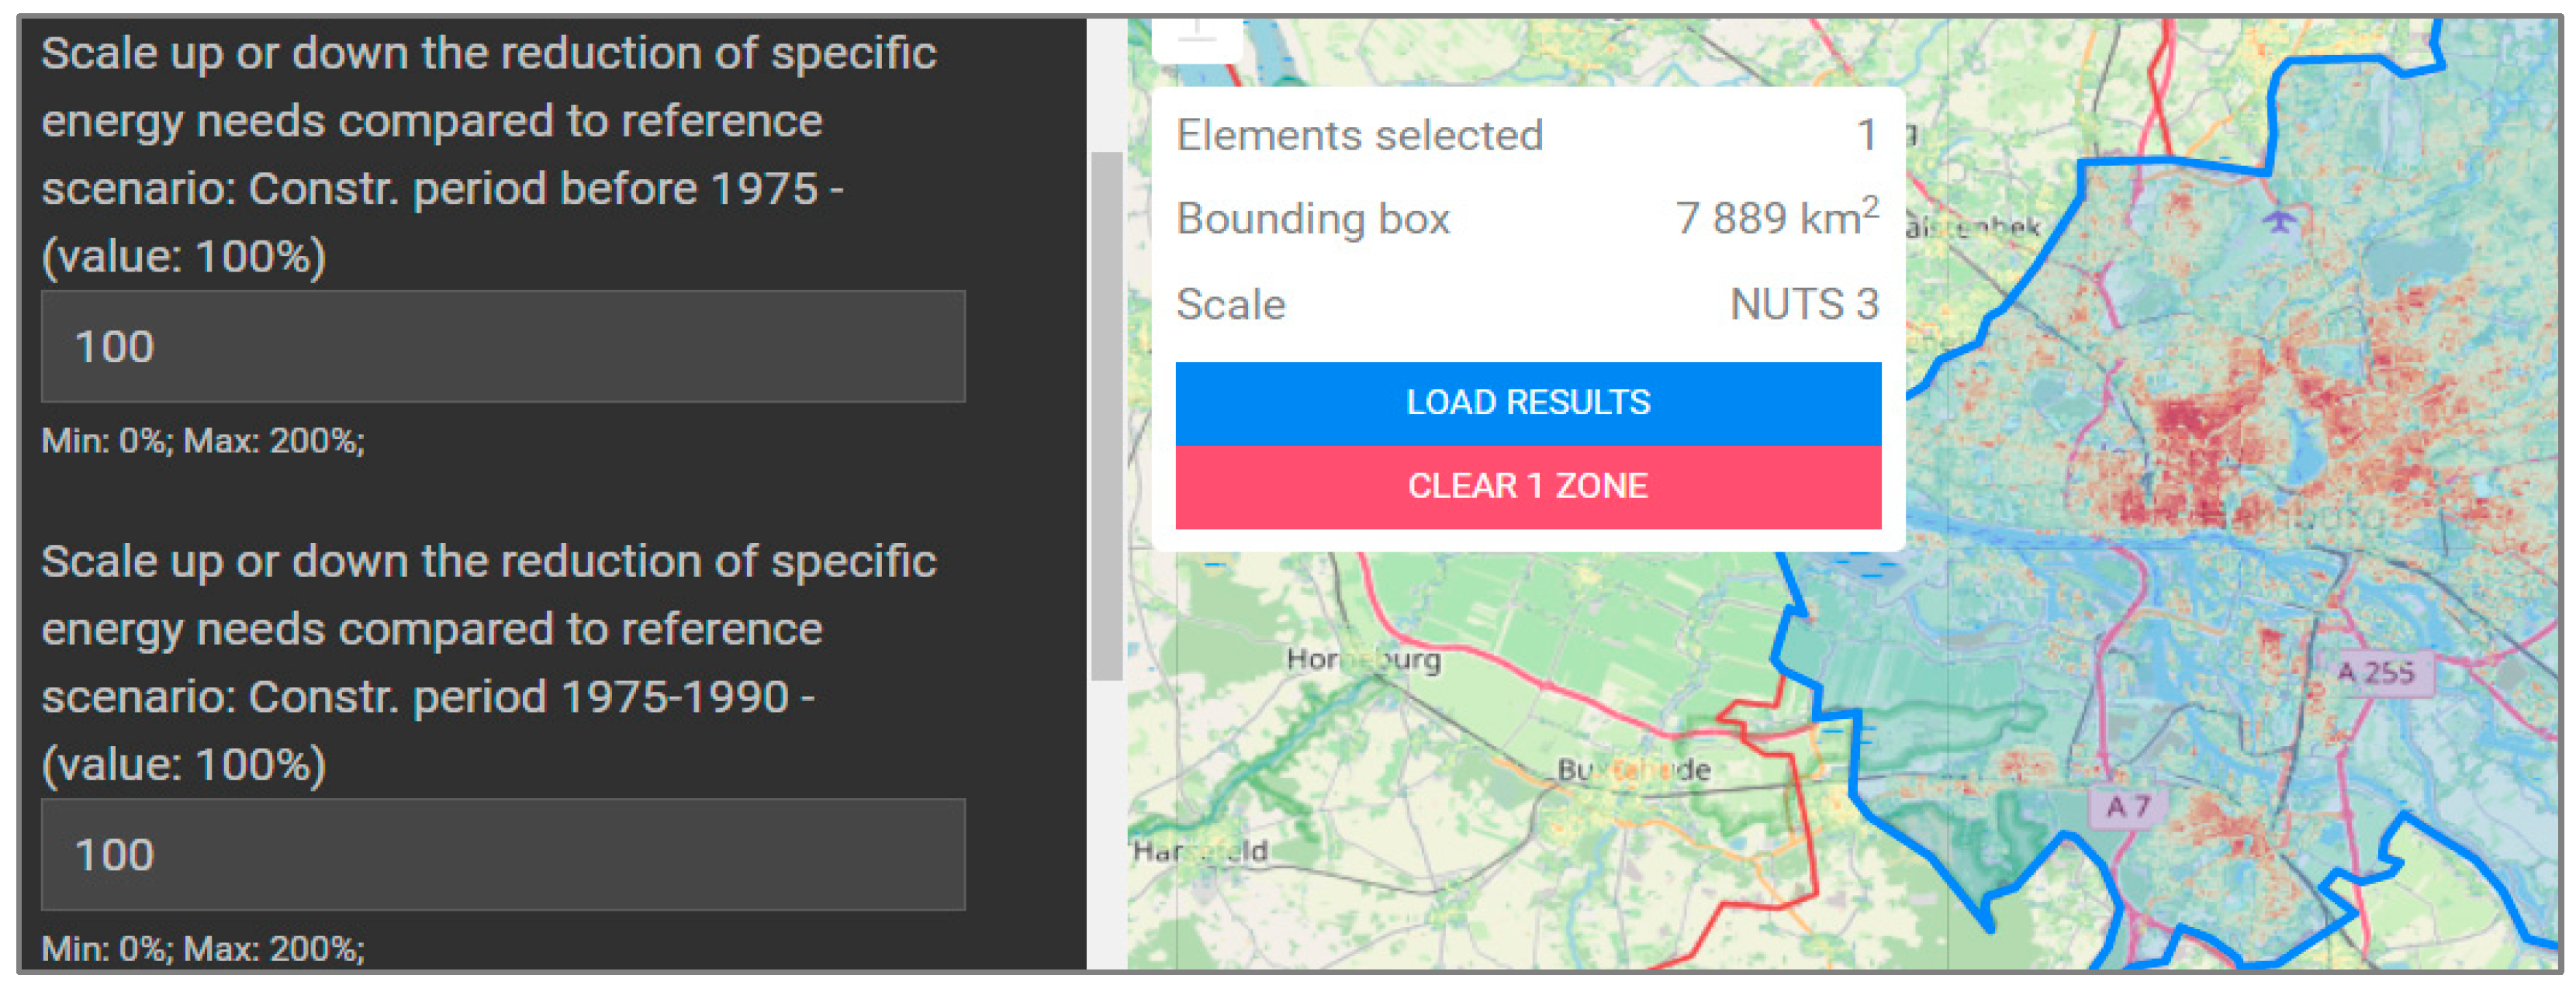
2.3.1. Application in Hotmaps
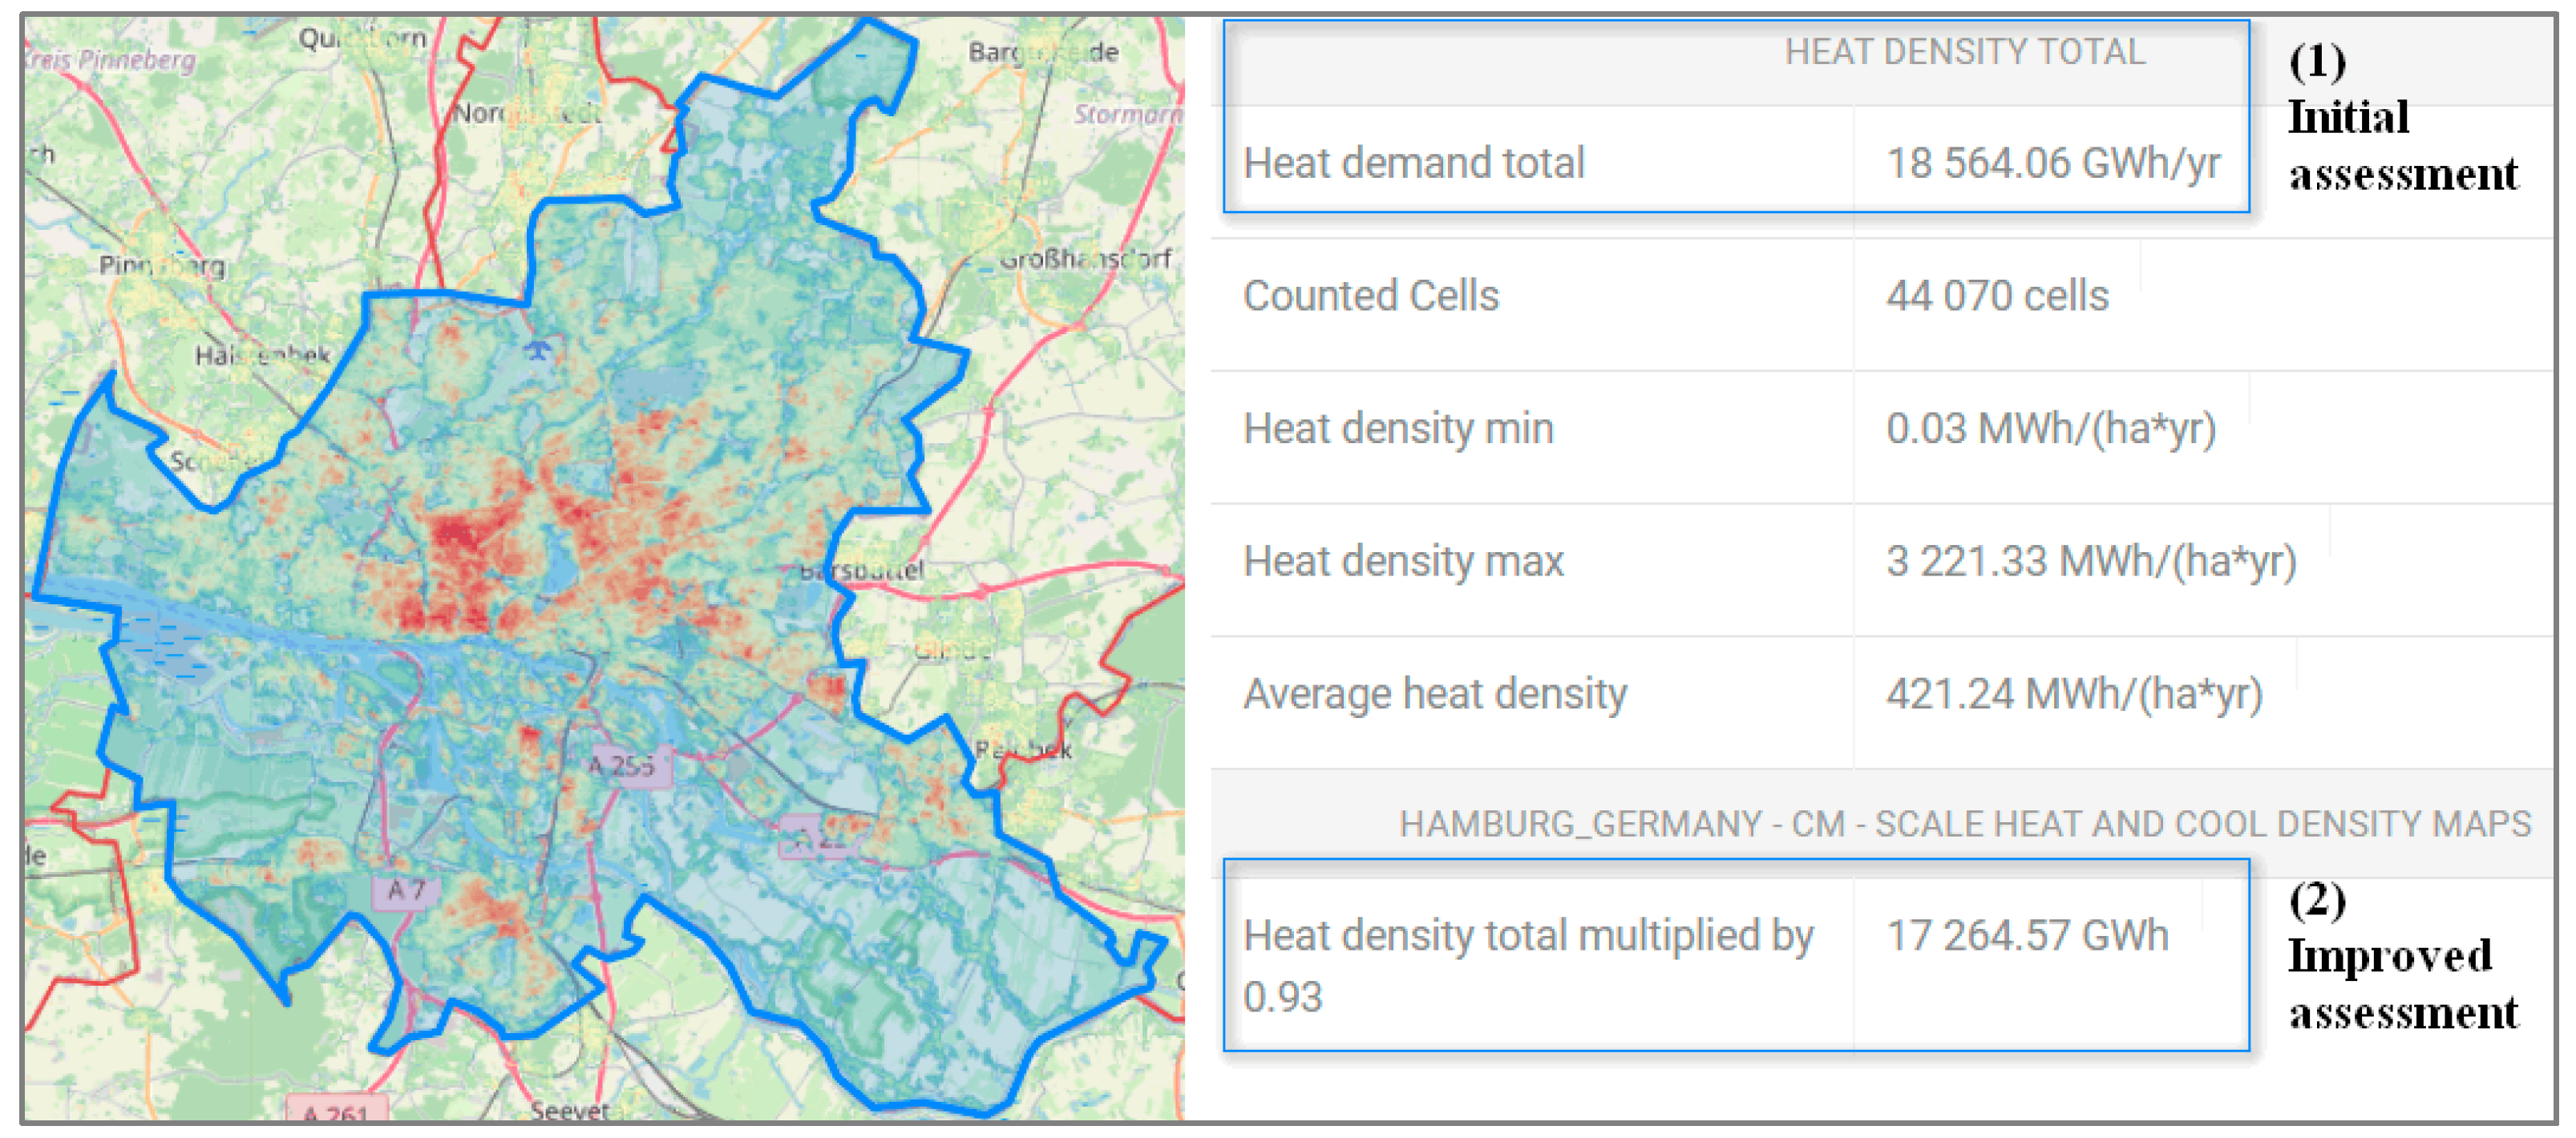
- CM—Scale heat density maps: This calculation module allows to scale the heat demand density up or down for the total building stock of a city (value: Min. 0; Max. 10). Thus, a scaling value enables to reduce the calculated heat demand to zero or to increase it by a factor of ten.
- CM—Demand projection: This calculation module allows to scale the specific heat demand up or down for each building construction period (value: Min. 0%; Max. 200%). Thus, a scaling value enables to reduce the calculated heat demand to zero or double it at maximum.
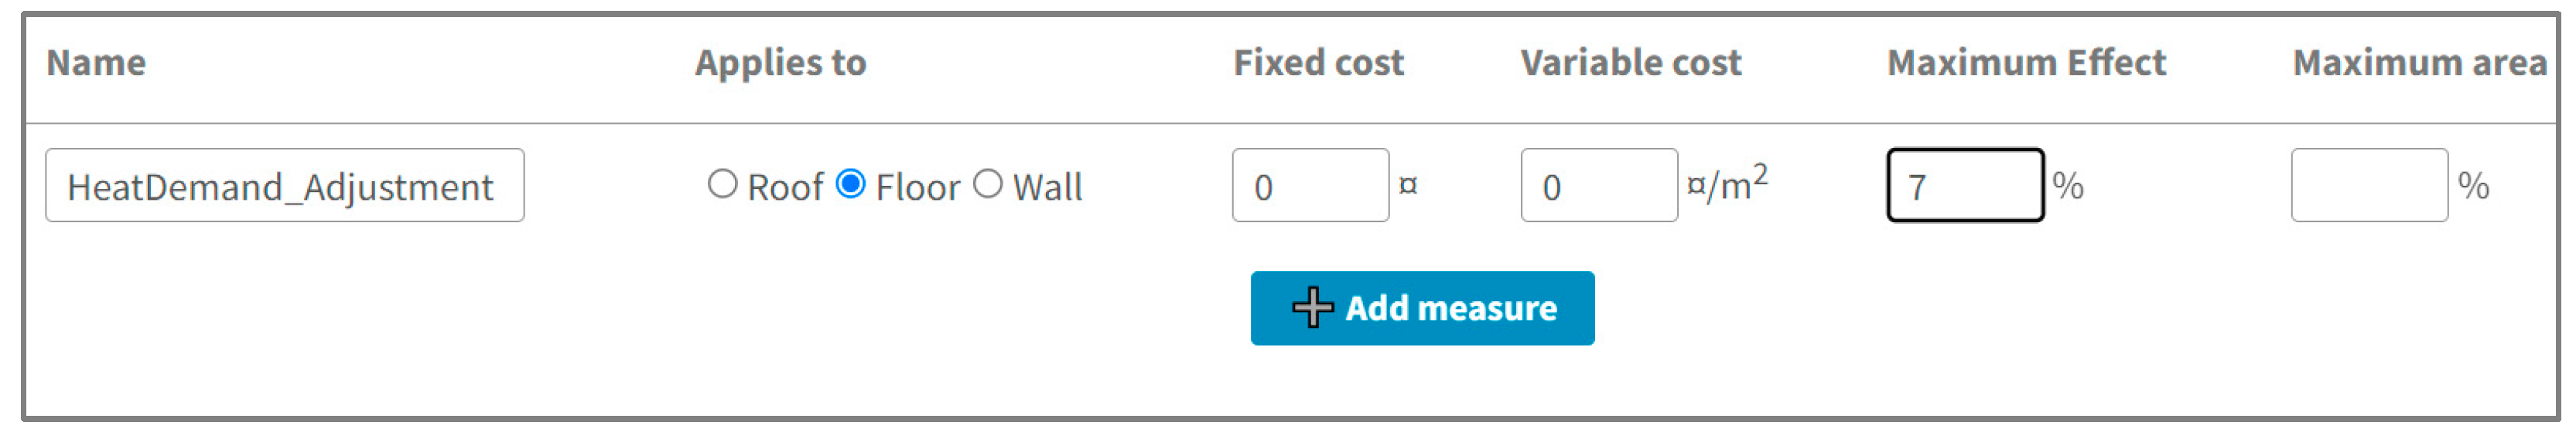
2.3.2. Application in THERMOS
2.3.3. Application in Heat Cadastre Hamburg
- By adjusting the specific heat demand values for self-performed assessments.
- By adjusting an already estimated heat demand.
3. Results and Application
3.1. Findings for Germany
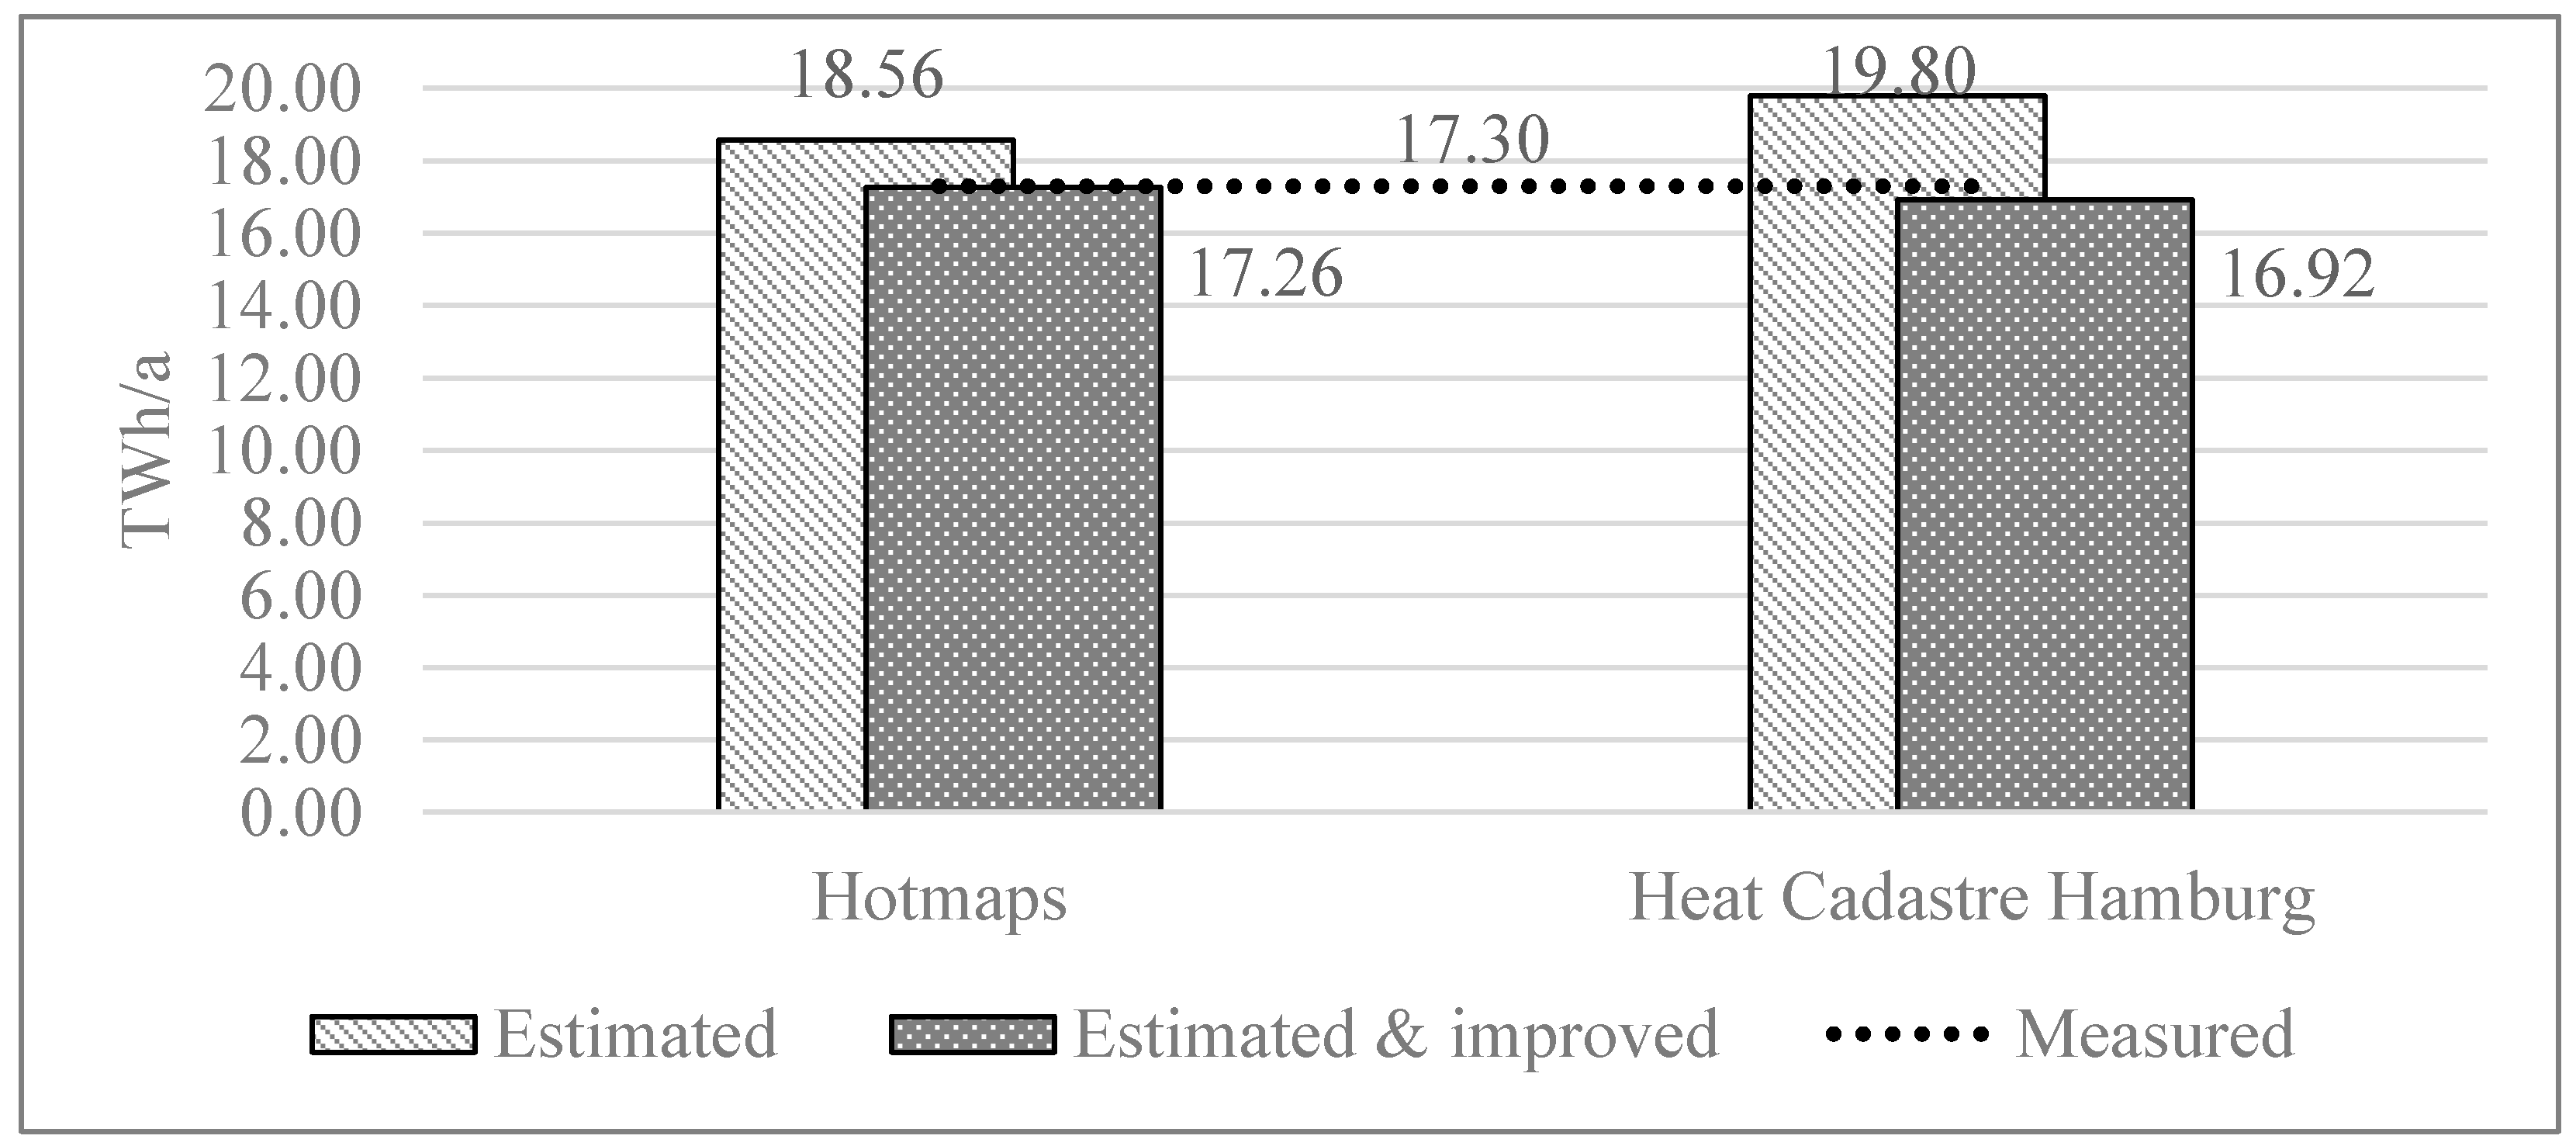
3.2. Application and Validation for Hamburg
- Information on the real heat consumption of the city is available.
- Heat demand assessments carried out based on different databases and methods.
- The approaches are well documented, comprehensible and replicable.
4. Discussion
5. Conclusions and Outlook
- If refurbishments are carried out in accordance with the current German Buildings Energy Act GEG, a maximum reduction in heat demand of only ca. 22% can be achieved by the target year 2045. Likewise, the efficiency targets stated are not achievable by implementing the Efficiency House standard EH 70, which has a 30% lower heat demand than specified in GEG.
- The minimum requirements, as set forth by the GEG, must be at least adjusted to match the EH 55 standard, featuring a 45% lower heat demand. This adaptation enables the attainment of the targets as early as 2035.
- Adopting standards higher than EH 55, such as EH 40 and the Passive House Standard, certainly enables the attainment of the target. However, this introduces cost-effectiveness concerns and the widely debated implementation challenges in existing buildings, which emanate from factors like building regulations, urban planning, fire safety, and limited public acceptance.
- The proposed amendments to the Energy Performance of Buildings Directive (EPBD) require buildings to attain a minimum energy performance of Class D by 2033. This will affect over 6 million houses, which amount to about 30% of the German residential buildings. Although this will accelerate refurbishment progress in Germany, it will fall short of achieving the targets due to its exclusive focus on two “worst-performing buildings” classes and the moderate efficiency improvements, especially given the presence of additional classes A+ and H within the GEG rating scale.
Supplementary Materials
Author Contributions
Funding
Data Availability Statement
Conflicts of Interest
Abbreviations
| AB | Apartment Block |
| CM | Calculation Module |
| DWD | Deutscher Wetterdienst |
| EH | Efficiency House |
| EnEV | Energy Saving Ordinance |
| EPBD | Energy Performance of Buildings Directive |
| EPC | Energy Performance Certificate |
| GEG | German Buildings Energy Act |
| HDDs | Heating Degree Days |
| LiDAR | Light Detection and Ranging |
| MFH | Multi-family House |
| MP | Modernisation package |
| MPAdv | Advanced Modernisation Package |
| MPCon | Conventional Modernisation Package |
| OSM | OpenStreetMap |
| SFH | Single-family House |
| TH | Terraced House |
| WschVO | Ordinance on thermal protection |
References
- AGEB. Anwendungsbilanzen zur Energiebilanz Deutschland: Endenergieverbrauch nach Energieträgern und Anwendungszwecken 2011 bis 2021. Arbeitsgemeinschaft Energiebilanzen e.V. 2022. Available online: https://ag-energiebilanzen.de/wp-content/uploads/2023/01/AGEB_21p2_V3_20221222.pdf (accessed on 13 March 2023).
- Weiler, V.; Lust, D.; Brennenstuhl, M.; Brassel, K.-H.; Duminil, E.; Eicker, U. Automatic dimensioning of energy system com-ponents for building cluster simulation. Appl. Energy 2022, 313, 118651. [Google Scholar] [CrossRef]
- Riechel, R.; Walter, J. Kurzgutachten Kommunale Wärmeplanung. Deutsches Institut für Urbanistik. 2022. Available online: https://www.umweltbundesamt.de/sites/default/files/medien/479/publikationen/texte_12-2022_kurzgutachten_kommunale_waermeplanung.pdf (accessed on 4 December 2023).
- Heitkoetter, W.; Medjroubi, W.; Vogt, T.; Agert, C. Regionalised heat demand and power-to-heat capacities in Germany—An open dataset for assessing renewable energy integration. Appl. Energy 2020, 259, 114161. [Google Scholar] [CrossRef]
- Vering, C.; Maier, L.; Breuer, K.; Krützfeldt, H.; Streblow, R.; Müller, D. Evaluating heat pump system design methods towards a sustainable heat supply in residential buildings. Appl. Energy 2022, 308, 118204. [Google Scholar] [CrossRef]
- Vering, C.; Otto, A.; Mortimer, M.; Mehrfeld, P.; Müller, D. ACoolHeaD: Framework for Automated Cooling and Heating Demand calculations using spatially and temporally resolved building performance simulations applied to the estimation of heating demand in Germany. Energy Build. 2021, 252, 111442. [Google Scholar] [CrossRef]
- The Press and Information Office of the Federal Government. Intergenerational Contract for the Climate: Climate Change Act: Climate Neutrality by 2045. Available online: https://www.bundesregierung.de/breg-de/themen/klimaschutz/climate-change-act-2021-1936846 (accessed on 23 November 2022).
- George, J.F.; Werner, S.; Preuß, S.; Winkler, J.; Held, A.; Ragwitz, M. The landlord-tenant dilemma: Distributional effects of carbon prices, redistribution and building modernisation policies in the German heating transition. Appl. Energy 2023, 339, 120783. [Google Scholar] [CrossRef]
- Maruf, M.N.I. Open model-based analysis of a 100% renewable and sector-coupled energy system–The case of Germany in 2050. Appl. Energy 2021, 288, 116618. [Google Scholar] [CrossRef]
- Zeyen, E.; Hagenmeyer, V.; Brown, T. Mitigating heat demand peaks in buildings in a highly renewable European energy system. Energy 2021, 231, 120784. [Google Scholar] [CrossRef]
- Hansen, K.; Connolly, D.; Lund, H.; Drysdale, D.; Thellufsen, J.Z. Heat Roadmap Europe: Identifying the balance between saving heat and supplying heat. Energy 2016, 115, 1663–1671. [Google Scholar] [CrossRef]
- Palzer, A.; Henning, H.-M. A comprehensive model for the German electricity and heat sector in a future energy system with a dominant contribution from renewable energy technologies—Part II: Results. Renew. Sustain. Energy Rev. 2014, 30, 1019–1034. [Google Scholar] [CrossRef]
- Thamling, N.; Rau, D.; Kemmler, A.; Holm, A. Hintergrundpapier zur Gebäudestrategie Klimaneutralität 2045. Gutachten im Auftrag des Bundesministeriums für Wirtschaft und Klimaschutz. 2022. Available online: https://www.bmwk.de/Redaktion/DE/Publikationen/Klimaschutz/gebaeudestrategie-klimaneutralitaet-2045.pdf?__blob=publicationFile&v=6 (accessed on 10 April 2023).
- Chambers, J.; Zuberi, M.; Streicher, K.N.; Patel, M.K. Geospatial global sensitivity analysis of a heat energy service decarboni-sation model of the building stock. Appl. Energy 2021, 302, 117592. [Google Scholar] [CrossRef]
- Streicher, K.N.; Padey, P.; Parra, D.; Bürer, M.C.; Schneider, S.; Patel, M.K. Analysis of space heating demand in the Swiss residential building stock: Element-based bottom-up model of archetype buildings. Energy Build. 2019, 184, 300–322. [Google Scholar] [CrossRef]
- Streicher, K.N.; Padey, P.; Parra, D.; Bürer, M.C.; Patel, M.K. Assessment of the current thermal performance level of the Swiss residential building stock: Statistical analysis of energy performance certificates. Energy Build. 2018, 178, 360–378. [Google Scholar] [CrossRef]
- Yang, X.; Hu, M.; Heeren, N.; Zhang, C.; Verhagen, T.; Tukker, A.; Steubing, B. A combined GIS-archetype approach to model residential space heating energy: A case study for the Netherlands including validation. Appl. Energy 2020, 280, 115953. [Google Scholar] [CrossRef]
- Dochev, I.; Peters, I.; Seller, H.; Schuchardt, G.K. Analysing district heating potential with linear heat density. A case study from Hamburg. Energy Procedia 2018, 149, 410–419. [Google Scholar] [CrossRef]
- Pezzutto, S.; Zambotti, S.; Croce, S.; Zambelli, P.; Garegnani, G.; Scaramuzzino, C.; Pascuas, R.P.; Haas, F.; Exner, D.; Lucchi, E.; et al. Hotmaps Open Data Set for the EU28: D2.3 WP2 Report. 2019. Available online: https://www.hotmaps-project.eu/wp-content/uploads/2018/03/D2.3-Hotmaps_for-upload_revised-final_.pdf (accessed on 30 November 2022).
- Möller, B.; Wiechers, E.; Persson, U.; Grundahl, L.; Connolly, D. Heat Roadmap Europe: Identifying local heat demand and supply areas with a European thermal atlas. Energy 2018, 158, 281–292. [Google Scholar] [CrossRef]
- Kuriyan, K.; Shah, N. A combined spatial and technological model for the planning of district energy systems. J. Sustain. Energy Plan. Manag. 2019, 21, 8. [Google Scholar] [CrossRef]
- Centre for Sustainable Energy (CSE). Thermal Energy Resource Modelling and Optimisation System (THERMOS, Grant Agreement No. 723636). Available online: https://www.thermos-project.eu/tool-users/thermos-ambassadors/ (accessed on 27 September 2022).
- Aunedi, M.; Pantaleo, A.M.; Kuriyan, K.; Strbac, G.; Shah, N. Modelling of national and local interactions between heat and electricity networks in low-carbon energy systems. Appl. Energy 2020, 276, 115522. [Google Scholar] [CrossRef]
- Hotmaps. Hotmaps the Open Source Mapping and Planning Tool for Heating and Cooling. Available online: https://www.hotmaps.eu/map (accessed on 8 December 2022).
- Müller, A.; Hummel, M.; Kranzl, L.; Fallahnejad, M.; Büchele, R. Open Source Data for Gross Floor Area and Heat Demand Density on the Hectare Level for EU 28. Energies 2019, 12, 4789. [Google Scholar] [CrossRef]
- Pezzutto, S.; Croce, S.; Zambotti, S.; Kranzl, L.; Novelli, A.; Zambelli, P. Assessment of the Space Heating and Domestic Hot Water Market in Europe—Open Data and Results. Energies 2019, 12, 1760. [Google Scholar] [CrossRef]
- Flensburg. Halmstad and Aalborg Universities, Pan-European Thermal Atlas (Peta). Available online: https://heatroadmap.eu/peta4/ (accessed on 17 February 2023).
- Jimenez-Navarro, J.-P.; Kavvadias, K.; Filippidou, F.; Pavičević, M.; Quoilin, S. Coupling the heating and power sectors: The role of centralised combined heat and power plants and district heat in a European decarbonised power system. Appl. Energy 2020, 270, 115134. [Google Scholar] [CrossRef]
- Dochev, I.; Seller, H.; Peters, I. Assigning Energetic Archetypes to a Digital Cadastre and Estimating Building Heat Demand. An Example from Hamburg, Germany. Environ. Clim. Technol. 2020, 24, 233–253. [Google Scholar] [CrossRef]
- IZES Institut für ZukunftsEnergieSysteme. Wärmekataster Saarland. 2017. Available online: https://geoportal.saarland.de/ (accessed on 10 July 2020).
- LUBW Landesanstalt für Umwelt Baden-Württemberg, Energieatlas Baden-Württemberg. Available online: https://www.energieatlas-bw.de/ (accessed on 18 March 2022).
- Miocic, J.M.; Krecher, M. Estimation of shallow geothermal potential to meet building heating demand on a regional scale. Renew. Energy 2022, 185, 629–640. [Google Scholar] [CrossRef]
- Zhou, Q.; Zhang, Y.; Chang, K.; Brovelli, M.A. Assessing OSM building completeness for almost 13,000 cities globally. Inter-Natl. J. Digit. Earth 2022, 15, 2400–2421. [Google Scholar] [CrossRef]
- Statistische Ämter des Bundes und der Länder, Ergebnisse des Zensus 2011 zum Download: Bevölkerungs- und Wohnungszählung 2011. Available online: https://www.zensus2011.de (accessed on 23 March 2020).
- Eurostat. Population and Housing Censuses. Available online: https://ec.europa.eu/eurostat/web/population-demography/population-housing-censuses (accessed on 24 February 2023).
- Loga, T.; Diefenbach, N.; Stein, B.; Born, R. Typology Approach for Building Stock Energy Assessment: Scientific Report Ger-many. Further Development of the German Residential Building Typology, Institute for Housing and Environment. 2012. Available online: https://episcope.eu/fileadmin/tabula/public/docs/scientific/DE_TABULA_ScientificReport_IWU.pdf (accessed on 23 November 2021).
- Cischinsky, H.; Diefenbach, N. Datenerhebung Wohngebäudebestand 2016. Datenerhebung zu den Energetischen Merkmalen und Modernisierungsraten im Deutschen und Hessischen Wohngebäudebestand; IWU Institute for Housing and Environment GmbH: Darmstadt, Germany, 2018. [Google Scholar]
- Diefenbach, N.; Clausnitzer, K.-D.; Cischinsky, H.; Rodenfels, M. Datenbasis Gebäudebestand: Datenerhebung zur Energetischen Qualität und zu den Modernisierungstrends im Deutschen Wohngebäudebestand; Institut Wohnen und Umwelt: Darmstadt, Germany; Bremer Energie-Institut: Bremen, Germany, 2010; Available online: http://datenbasis.iwu.de/dl/Endbericht_Datenbasis.pdf (accessed on 15 September 2020).
- IWU. TABULA WebTool: National Residential Building Typologies. Available online: https://episcope.eu/building-typology/tabula-webtool/ (accessed on 1 June 2023).
- Loga, T.; Stein, B.; Diefenbach, N.; Born, R. Deutsche Wohngebäudetypologie: Beispielhafte Maßnahmen zur Verbesserung der Energieeffizienz von Typischen Wohngebäuden—“Typology Approach for Building Stock Energy Assessment”, EPISCOPE—“Energy Performance Indicator Tracking Schemes for the Continous Optimisation of Refurbishment Processes in European Housing Stocks” Erarbeitet im Rahmen der EU-Projekte TABULA, 2nd ed.; IWU: Darmstadt, Germany, 2015. [Google Scholar]
- Ingenieurekammer-Bau, B. GEG 2020 und Änderungen GEG 2023: Gebäudeenergiegesetz Leitfaden für Bauherren und Anwender. 2022. Available online: https://www.bayika.de/bayika-wAssets/docs/beratung-und-service/download/0043_bayika_geg-gebaudeenergiegesetz-leitfaden-bauherren-anwender.pdf (accessed on 10 May 2023).
- Galvin, R. Net-zero-energy buildings or zero-carbon energy systems? How best to decarbonize Germany’s thermally inefficient 1950s-1970s-era apartments. J. Build. Eng. 2022, 54, 104671. [Google Scholar] [CrossRef]
- Slonski, M.; Schrag, T. Linear Optimisation of a Settlement Towards the Energy-Plus House Standard. Energies 2019, 12, 210. [Google Scholar] [CrossRef]
- Diefenbach, N. Wege zum Klimaneutralen Wohngebäudebestand. Darmstadt. 2015. Available online: https://www.wohnungsmarktbeobachtung.de/bund-und-laender/bak/ht2015/ht2015/pdf-iwu (accessed on 27 June 2021).
- Diefenbach, N.; Malottki, C.; Enseling, A.; Loga, T.; Cischinsky, H.; Stein, B.; Hörner, M.; Grafe, M. Maßnahmen zur Umsetzung der Ziele des Energiekonzepts im Gebäudebereich—Zielerreichungsszenario. In BMVBS-Online-Publikation; Bundesministerium für Verkehr, Bau und Stadtentwicklung (BMVBS): Berlin, Germany, 2013. [Google Scholar]
- Diefenbach, N.; Loga, T.; Stein, B. Szenarienanalysen und Monitoringkonzepte im Hinblick auf die Langfristigen Klimaschutzziele im Deutschen Wohngebäudebestand: Bericht im Rahmen des Europäischen Projekts EPISCOPE; Institut Wohnen und Umwelt: Darmstadt, Germany, 2015; Available online: https://www.iwu.de/fileadmin/publikationen/gebaeudebestand/episcope/2015_IWU_DiefenbachEtAl_Szenarienanalysen-und-Monitoringkonzepte.pdf (accessed on 4 December 2023).
- Volland, B.; Farsi, M.; Lasvaux, S.; Padey, P. Service Life of Building Elements: An Empirical Investigation. 2019. Available online: https://www.econstor.eu/bitstream/10419/213486/1/1687400857.pdf (accessed on 4 December 2023).
- DWD Deutscher Wetterdienst. Climate Factors (KF) for Energy Consumption Certificates. Deutscher Wetterdienst (DWD), CDC-Newsletter Nr. 13. 2021. Available online: https://www.dwd.de/DE/klimaumwelt/cdc/newsletter_archiv/cdc_newsletter_13.pdf?__blob=publicationFile&v=2 (accessed on 28 February 2023).
- DWD Deutscher Wetterdienst, Klimafaktoren (KF) für Energieverbrauchsausweise. Available online: www.dwd.de/DE/leistungen/klimafaktoren/klimafaktoren (accessed on 28 February 2023).
- Loga, T.; Großklos, M.; Landgraf, K. Klimadaten für die Realbilanzierung: Grundlagen des Tools “Gradtagzahlen-Deutschland.xlsx”; IWU: Darmstadt, Germany, 2020; Available online: https://www.iwu.de/fileadmin/publikationen/energie/mobasy/2020_IWU_LogaGrossklosLandgraf_MOBASYTeilberichtKlimadatenRealbilanzierung.pdf (accessed on 4 December 2023).
- Kennard, H.; Oreszczyn, T.; Mistry, M.; Hamilton, I. Population-weighted degree-days: The global shift between heating and cooling. Energy Build. 2022, 271, 112315. [Google Scholar] [CrossRef]
- Berger, M.; Worlitschek, J. A novel approach for estimating residential space heating demand. Energy 2018, 159, 294–301. [Google Scholar] [CrossRef]
- THERMOS Project Consortium, Help: THERMOS Network Model User Interface. Available online: https://tool.thermos-project.eu/help/network/interface.html (accessed on 2 March 2023).
- Schumacher, P. RAHMENBEDINGUNGEN DES WÄRMEMARKTES: Interaktion EE-Strom, Wärme und Verkehr. 2015. Available online: https://www.iee.fraunhofer.de/content/dam/iee/energiesystemtechnik/de/Dokumente/workshops/2015_05_01%20-%20Abschlussworkshop_Waerme_2-W%C3%A4rmeszenarien.pdf (accessed on 3 April 2023).
- Salaymeh, A.; Holler, S.; Pieper, F.; Fischer, J. Energieeffizientes Wärmenetz und Modellbetriebe: Biomasse-Integration zur Systemoptimierung in der Energieregion Hümmling mit Ganzheitlichem, Sektorübergreifendem Ansatz (BISON). Schlussbericht, HAWK Hochschule für Angewandte Wissenschaft und Kunst Hildesheim/Holzminden/Göttingen. 2022. Available online: https://www.fnr.de/index.php?id=11150&fkz=22031718 (accessed on 27 September 2022).
- Saatweber, J. Die Bewertung des Heizenergieverbrauchs mit den Gradtagzahlen GTZ: Prüfung der Wirksamkeit von Verbesserungen: Einfache Leistungsbestimmung für Neue Heizgeräte. 2014. Available online: https://www.energieverbraucher.de/files_db/1399274139_1134__12.pdf (accessed on 3 June 2023).
- Official Journal of the European Union. Amendments Adopted by the European Parliament on 14 March 2023 on the Proposal for a Directive of the European Parliament and of the Council on the Energy Performance of Buildings (Recast). 2023. Available online: https://eur-lex.europa.eu/legal-content/EN/TXT/PDF/?uri=CELEX:52023AP0068 (accessed on 26 January 2024).


| Tool | Usage Example | Availability | Databases | Max. Spatial Resolution |
|---|---|---|---|---|
| THERMOS [21,22] | [23] | Worldwide | Mostly OpenStreetMap (OSM); using own LiDAR (Light Detection and Ranging) data is possible. | Building level |
| Hotmaps [19,24,25] | [9,14,26] | Europe | Datasets on population, building stock characteristics, land use and surface-to-volume ratio for calculating the heated gross floor area. | Hectare level |
| Peta atlas [20,27] | [4,28] | Europe | Country-specific per-capita floor area derived from the Eurostat Census 2011. | Hectare level |
| Heat Cadastre Hamburg [18,29] | [29] | German fed. state | Authoritative Real Estate Cadastre Information System (ALKIS) of Hamburg. | Building level |
| Heat Cadastre Saarland [30] | [18,30] | German fed. state | 3D Building Models in Level of Detail 1 (LoD1) and ALKIS of Saarland. | Building level |
| Energy Atlas Baden-Württemberg [31] | [4,32] | German fed. state | Information on building type, building age and floor area derived from the Census 2011. | Hectare level |
| Construction Period | Roof | Wall | Basement | Window |
|---|---|---|---|---|
| Until 1978 | 0.549 | 0.278 | 0.142 | 0.559 |
| 1979–1994 | 0.190 | 0.099 | 0.047 | 0.195 * |
| 1995–2009 | 0.036 | 0.022 | 0.015 | 0.045 * |
| Construction Period | Roof | Wall | Basement | Window |
|---|---|---|---|---|
| Until 1978 | 1.00 | 1.00 | 1.00 | 1.00 |
| 1979–1994 | 2.86 | 2.84 | 2.90 | 2.87 |
| 1995–2009 | 15.12 | 12.76 | 9.10 | 12.34 |
| Structural Component | Share in Envelope |
|---|---|
| Basement | 0.12 |
| Wall | 0.50 |
| Roof | 0.25 |
| Window | 0.13 |
| Construction Period | Share in Housing Stock |
|---|---|
| Until 1978 | 0.64 |
| 1979–1994 | 0.19 |
| 1995–2009 | 0.17 |
Disclaimer/Publisher’s Note: The statements, opinions and data contained in all publications are solely those of the individual author(s) and contributor(s) and not of MDPI and/or the editor(s). MDPI and/or the editor(s) disclaim responsibility for any injury to people or property resulting from any ideas, methods, instructions or products referred to in the content. |
© 2024 by the authors. Licensee MDPI, Basel, Switzerland. This article is an open access article distributed under the terms and conditions of the Creative Commons Attribution (CC BY) license (https://creativecommons.org/licenses/by/4.0/).
Share and Cite
Salaymeh, A.; Peters, I.; Holler, S. Factoring Building Refurbishment and Climatic Effect into Heat Demand Assessments and Forecasts: Case Study and Open Datasets for Germany. Energies 2024, 17, 690. https://doi.org/10.3390/en17030690
Salaymeh A, Peters I, Holler S. Factoring Building Refurbishment and Climatic Effect into Heat Demand Assessments and Forecasts: Case Study and Open Datasets for Germany. Energies. 2024; 17(3):690. https://doi.org/10.3390/en17030690
Chicago/Turabian StyleSalaymeh, Abdulraheem, Irene Peters, and Stefan Holler. 2024. "Factoring Building Refurbishment and Climatic Effect into Heat Demand Assessments and Forecasts: Case Study and Open Datasets for Germany" Energies 17, no. 3: 690. https://doi.org/10.3390/en17030690