
Benedict–Webb–Rubin–Starling Equation of State + Hydrate Thermodynamic Theories: An Enhanced Prediction Method for CO2 Solubility and CO2 Hydrate Phase Equilibrium in Pure Water/NaCl Aqueous Solution System

 ,
,
Abstract
1. Introduction
2. Theory and Methods
2.1. BWRS EOS
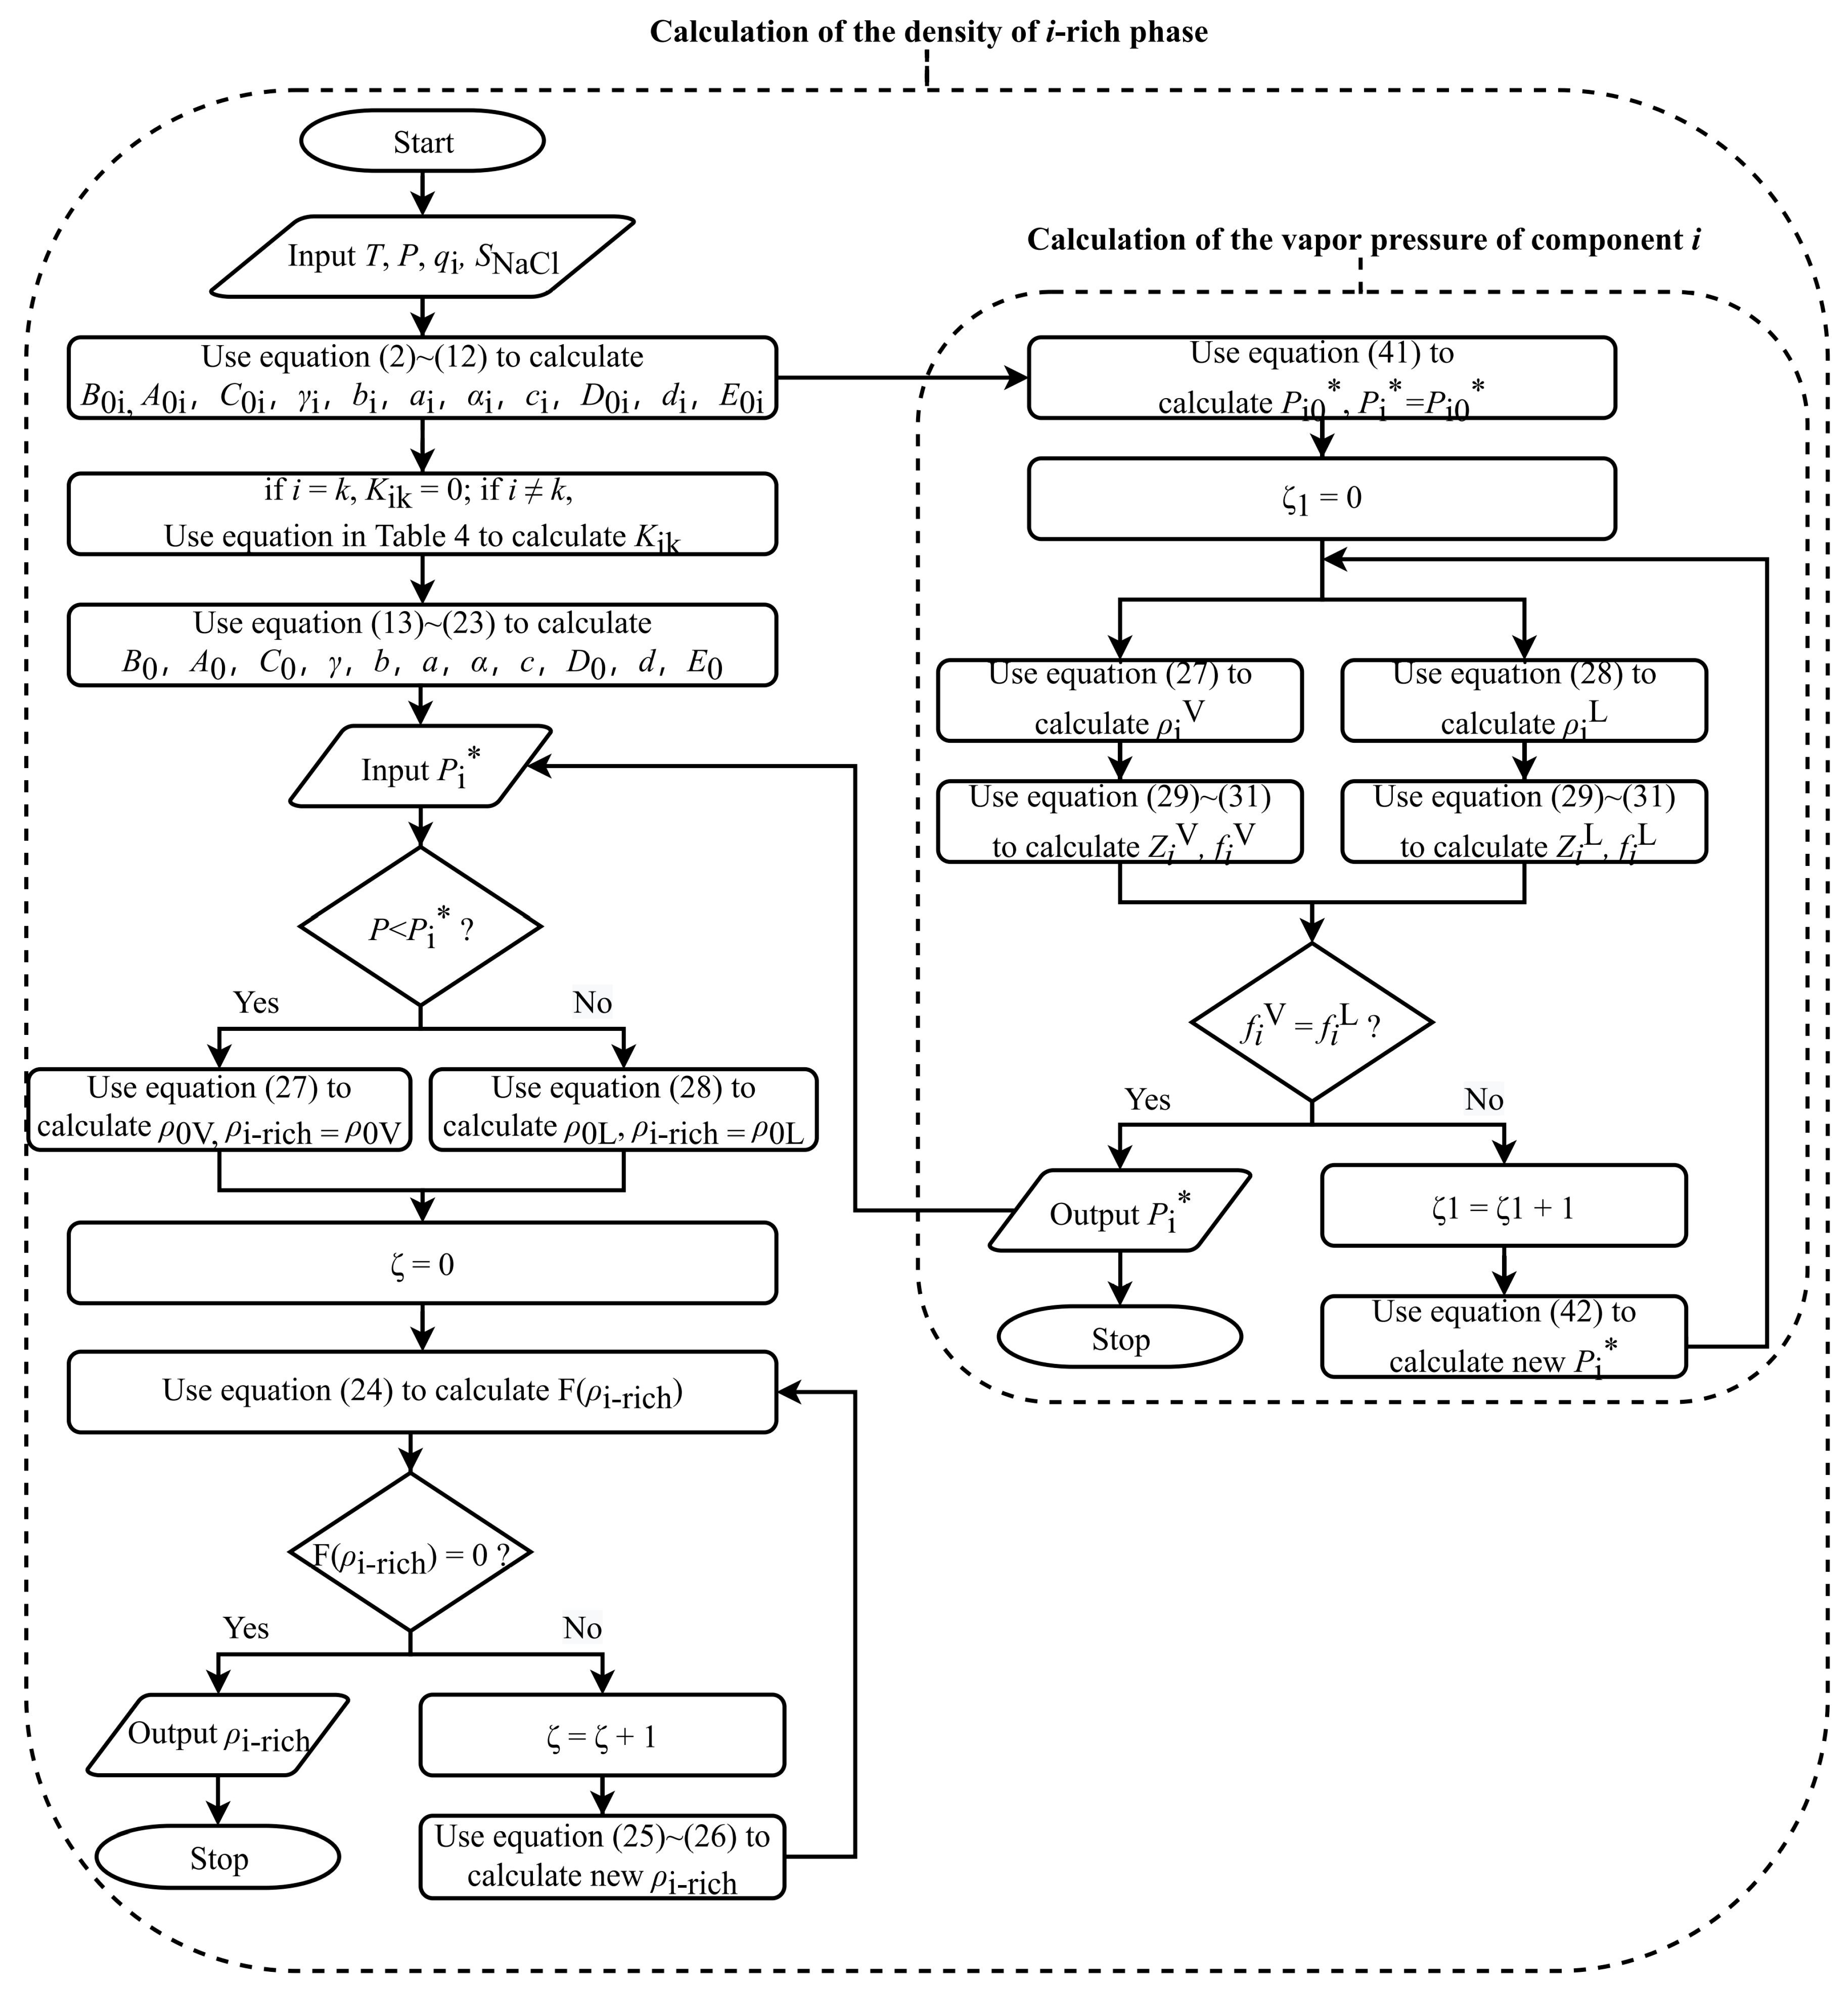
2.1.1. Calculation of Fluid Density
2.1.2. Calculation of Fugacity Coefficients and Fugacity
2.2. Principle of Phase Equilibrium
2.3. Thermodynamic Properties of Systems without Hydrates
2.3.1. Calculation of Vapor Pressure of Component i
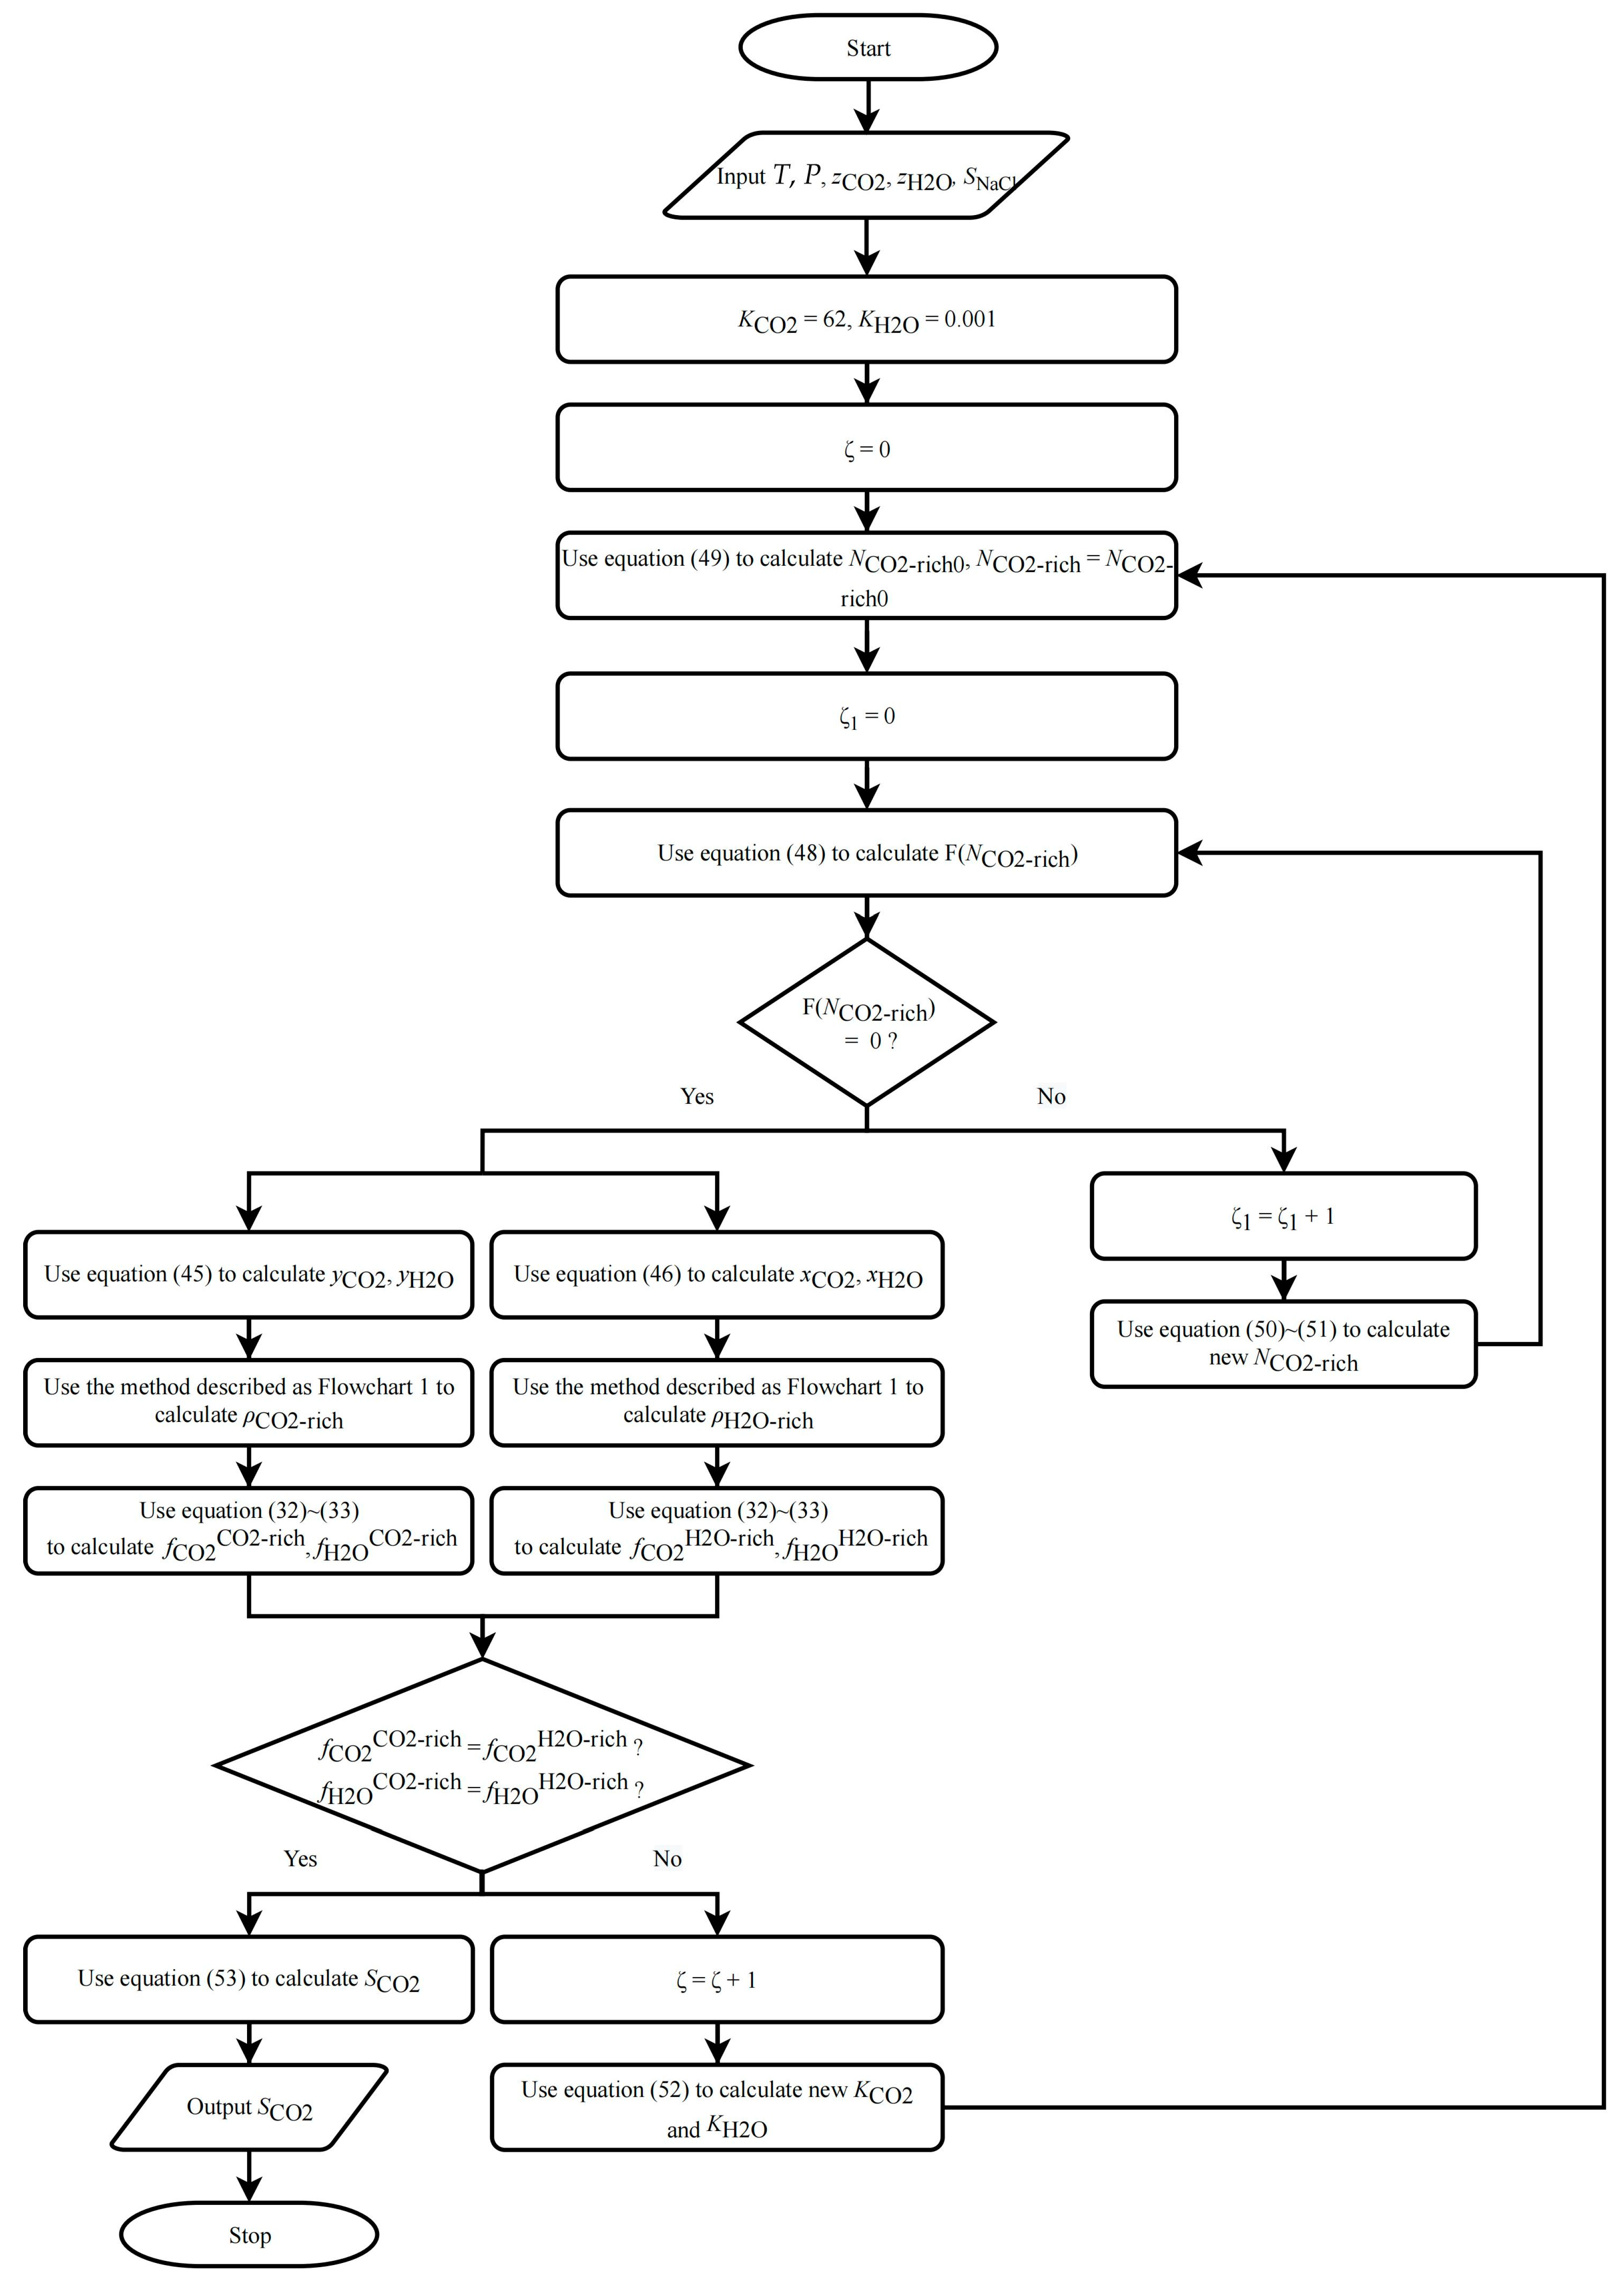
2.3.2. CO2 Solubility in Pure Water/NaCl Aqueous Solution
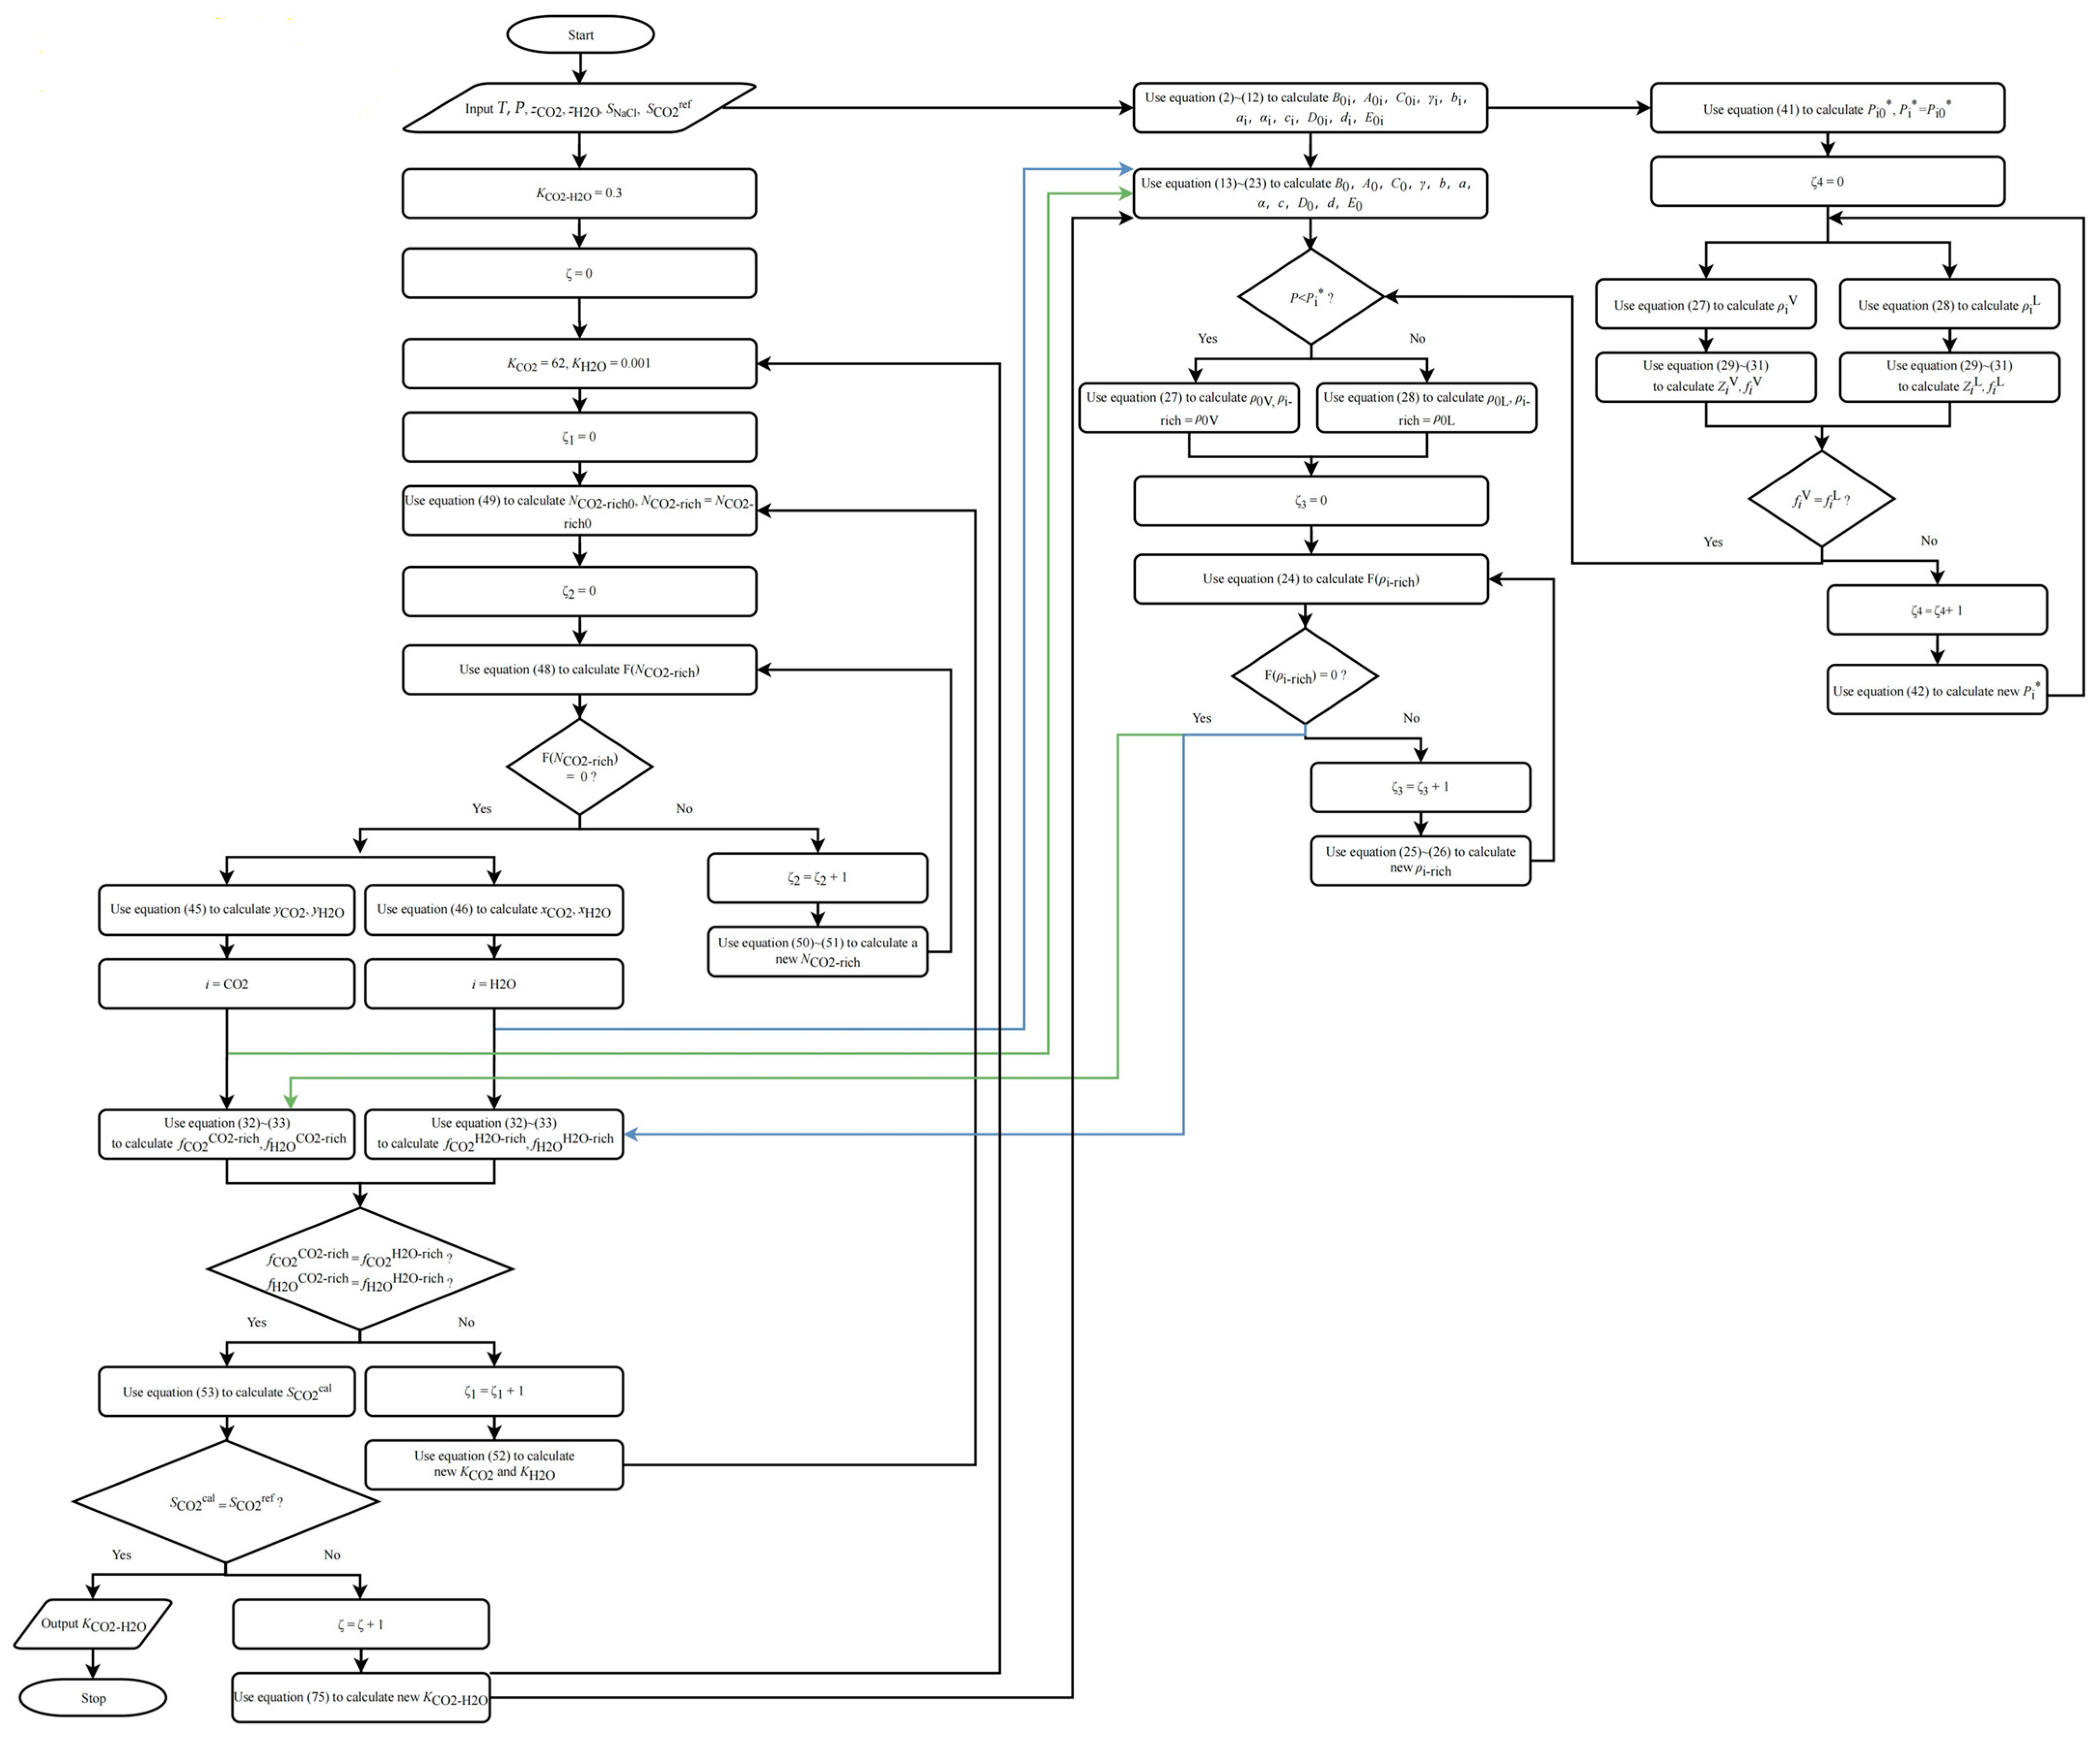
- (1)
- Assume initial values for Ki; recommended values are 62 and 0.001 for CO2 and for H2O, respectively.
- (2)
- Calculate using Equations (48)–(51).
- (3)
- Calculate and using Equations (45) and (46).
- (4)
- Use the method described in Section 2.4.2 to calculate and until Equations (35) and (36) are satisfied. If they are not satisfied, modify and and repeat steps (2) to (3) until they are satisfied. Based on multiple actual simulation results, the recommended method for modifying is:
2.4. Hydrate Thermodynamic Theories
2.4.1. Van der Waals–Platteeuw Model
2.4.2. Calculation of Langmuir Constants
2.4.3. Saito Model and Its Modification
2.4.4. Calculation of H2O Fugacity in CO2 Hydrate Phase
2.5. Thermodynamic Properties of Systems with Hydrates
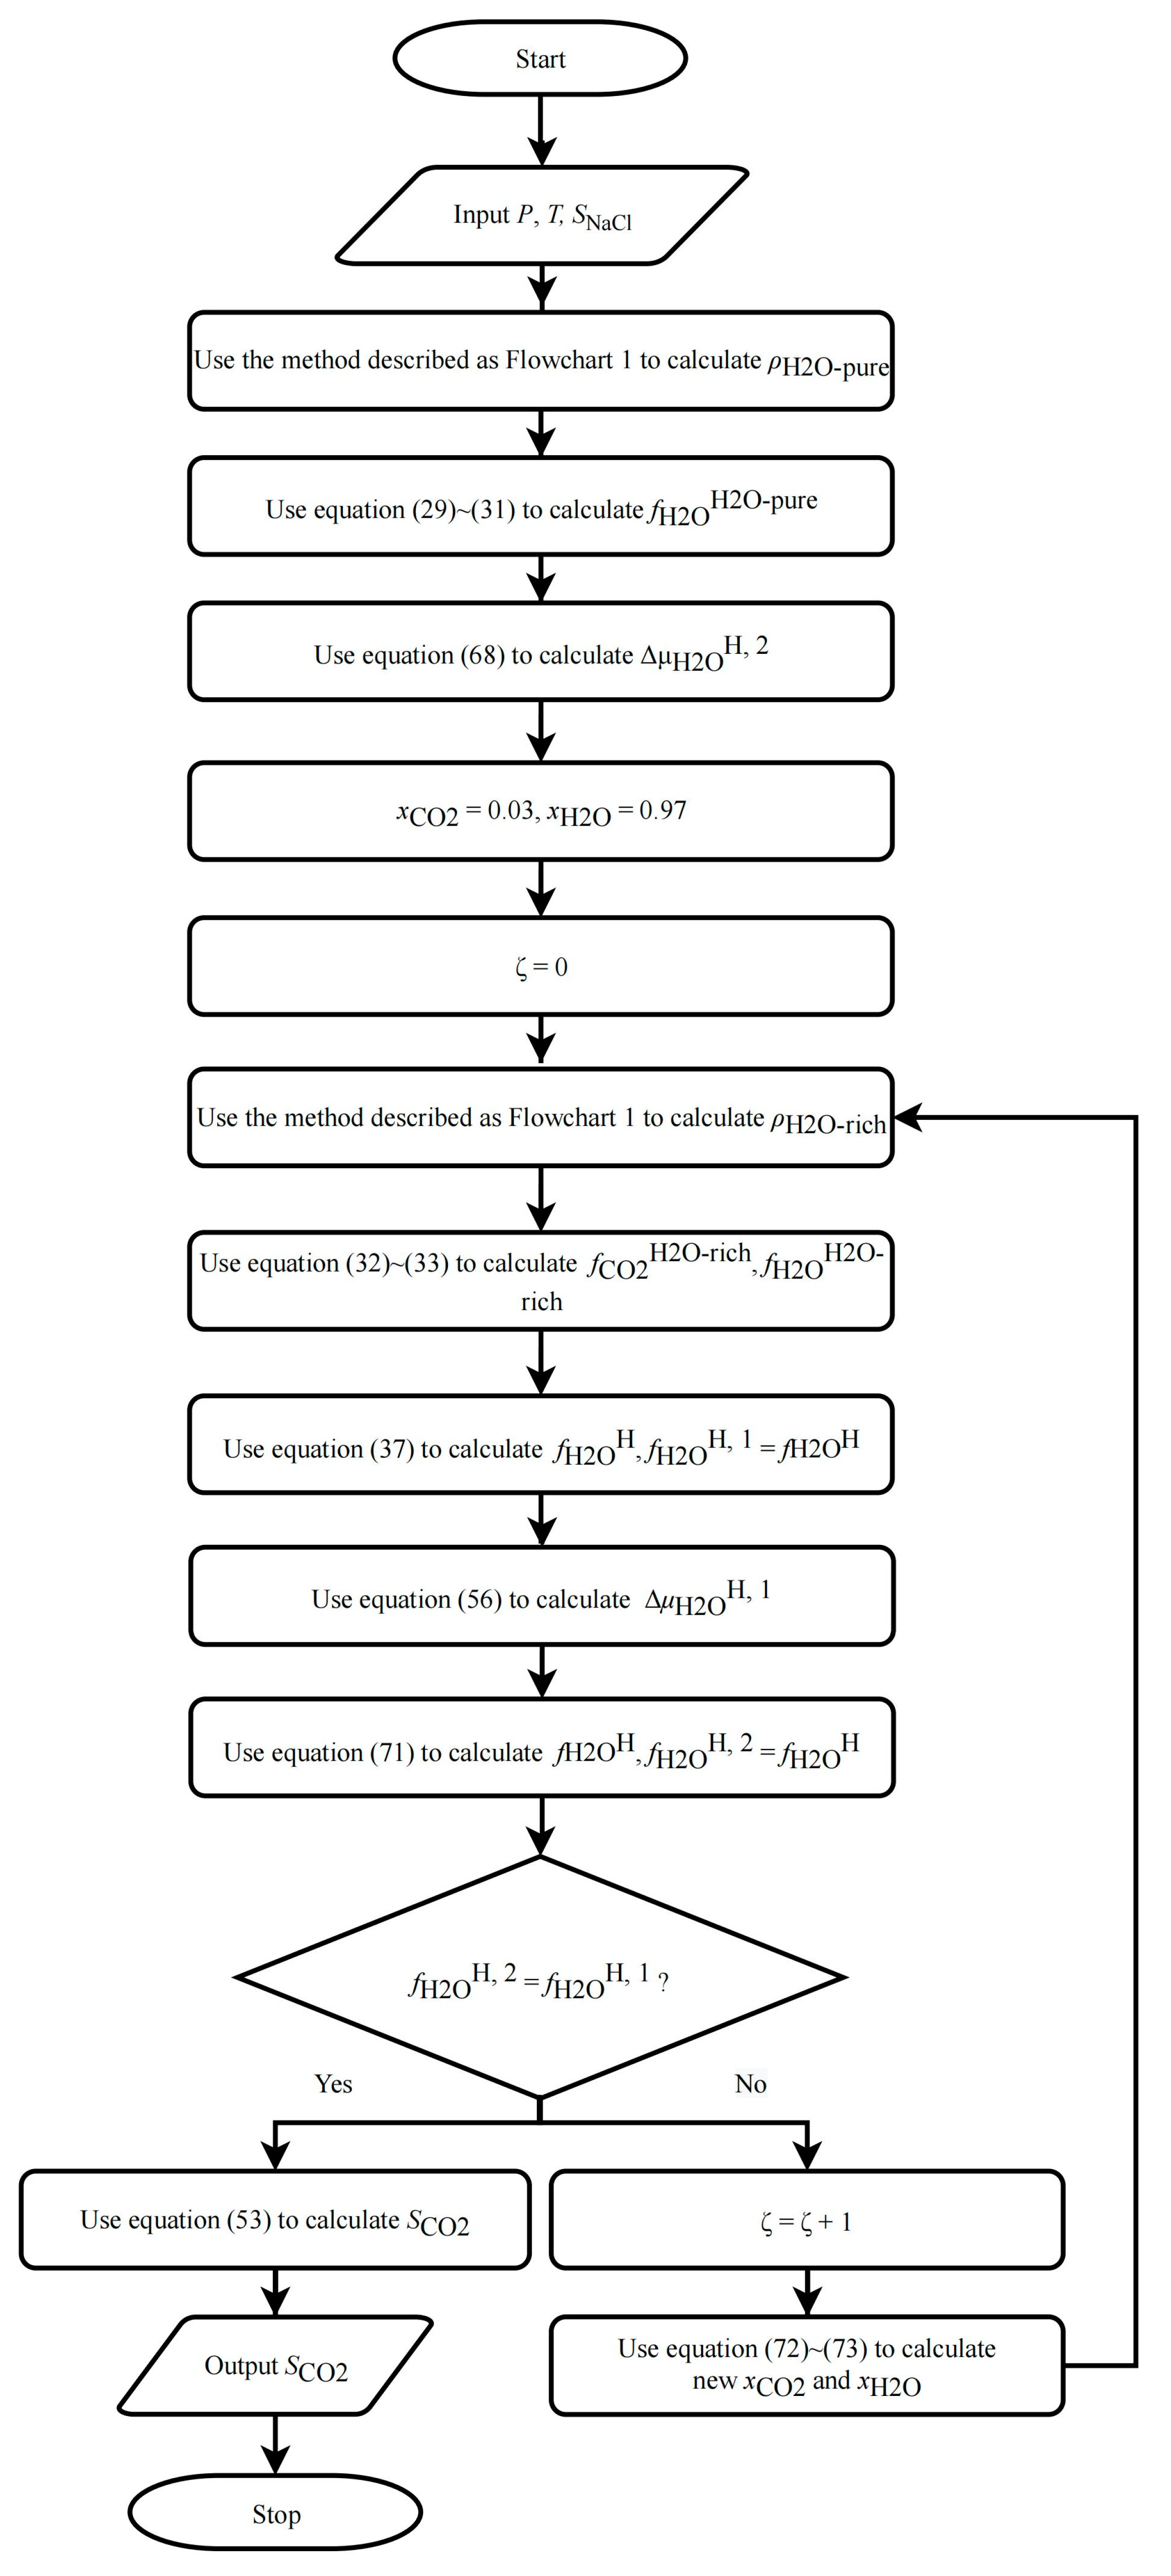
2.5.1. CO2 Solubility in Pure Water/NaCl Aqueous Solution
- (1)
- Use the method described in Section 2.1 to calculate and .
- (2)
- Calculate using Equation (68).
- (3)
- Assume an initial value for , recommended values are 0.03 and 0.97 for CO2 and for H2O, respectively.
- (4)
- Use the method described in Section 2.1.2 to calculate and .
- (5)
- Calculate the first value of using Equation (37) and denote it as .
- (6)
- Calculate using Equation (56).
- (7)
- Calculate the second value of using Equation (71) and denote it as .
- (8)
- Compare and ; if they are not equal, modify using the following equation and repeat steps (4) to (7) until they are equal:
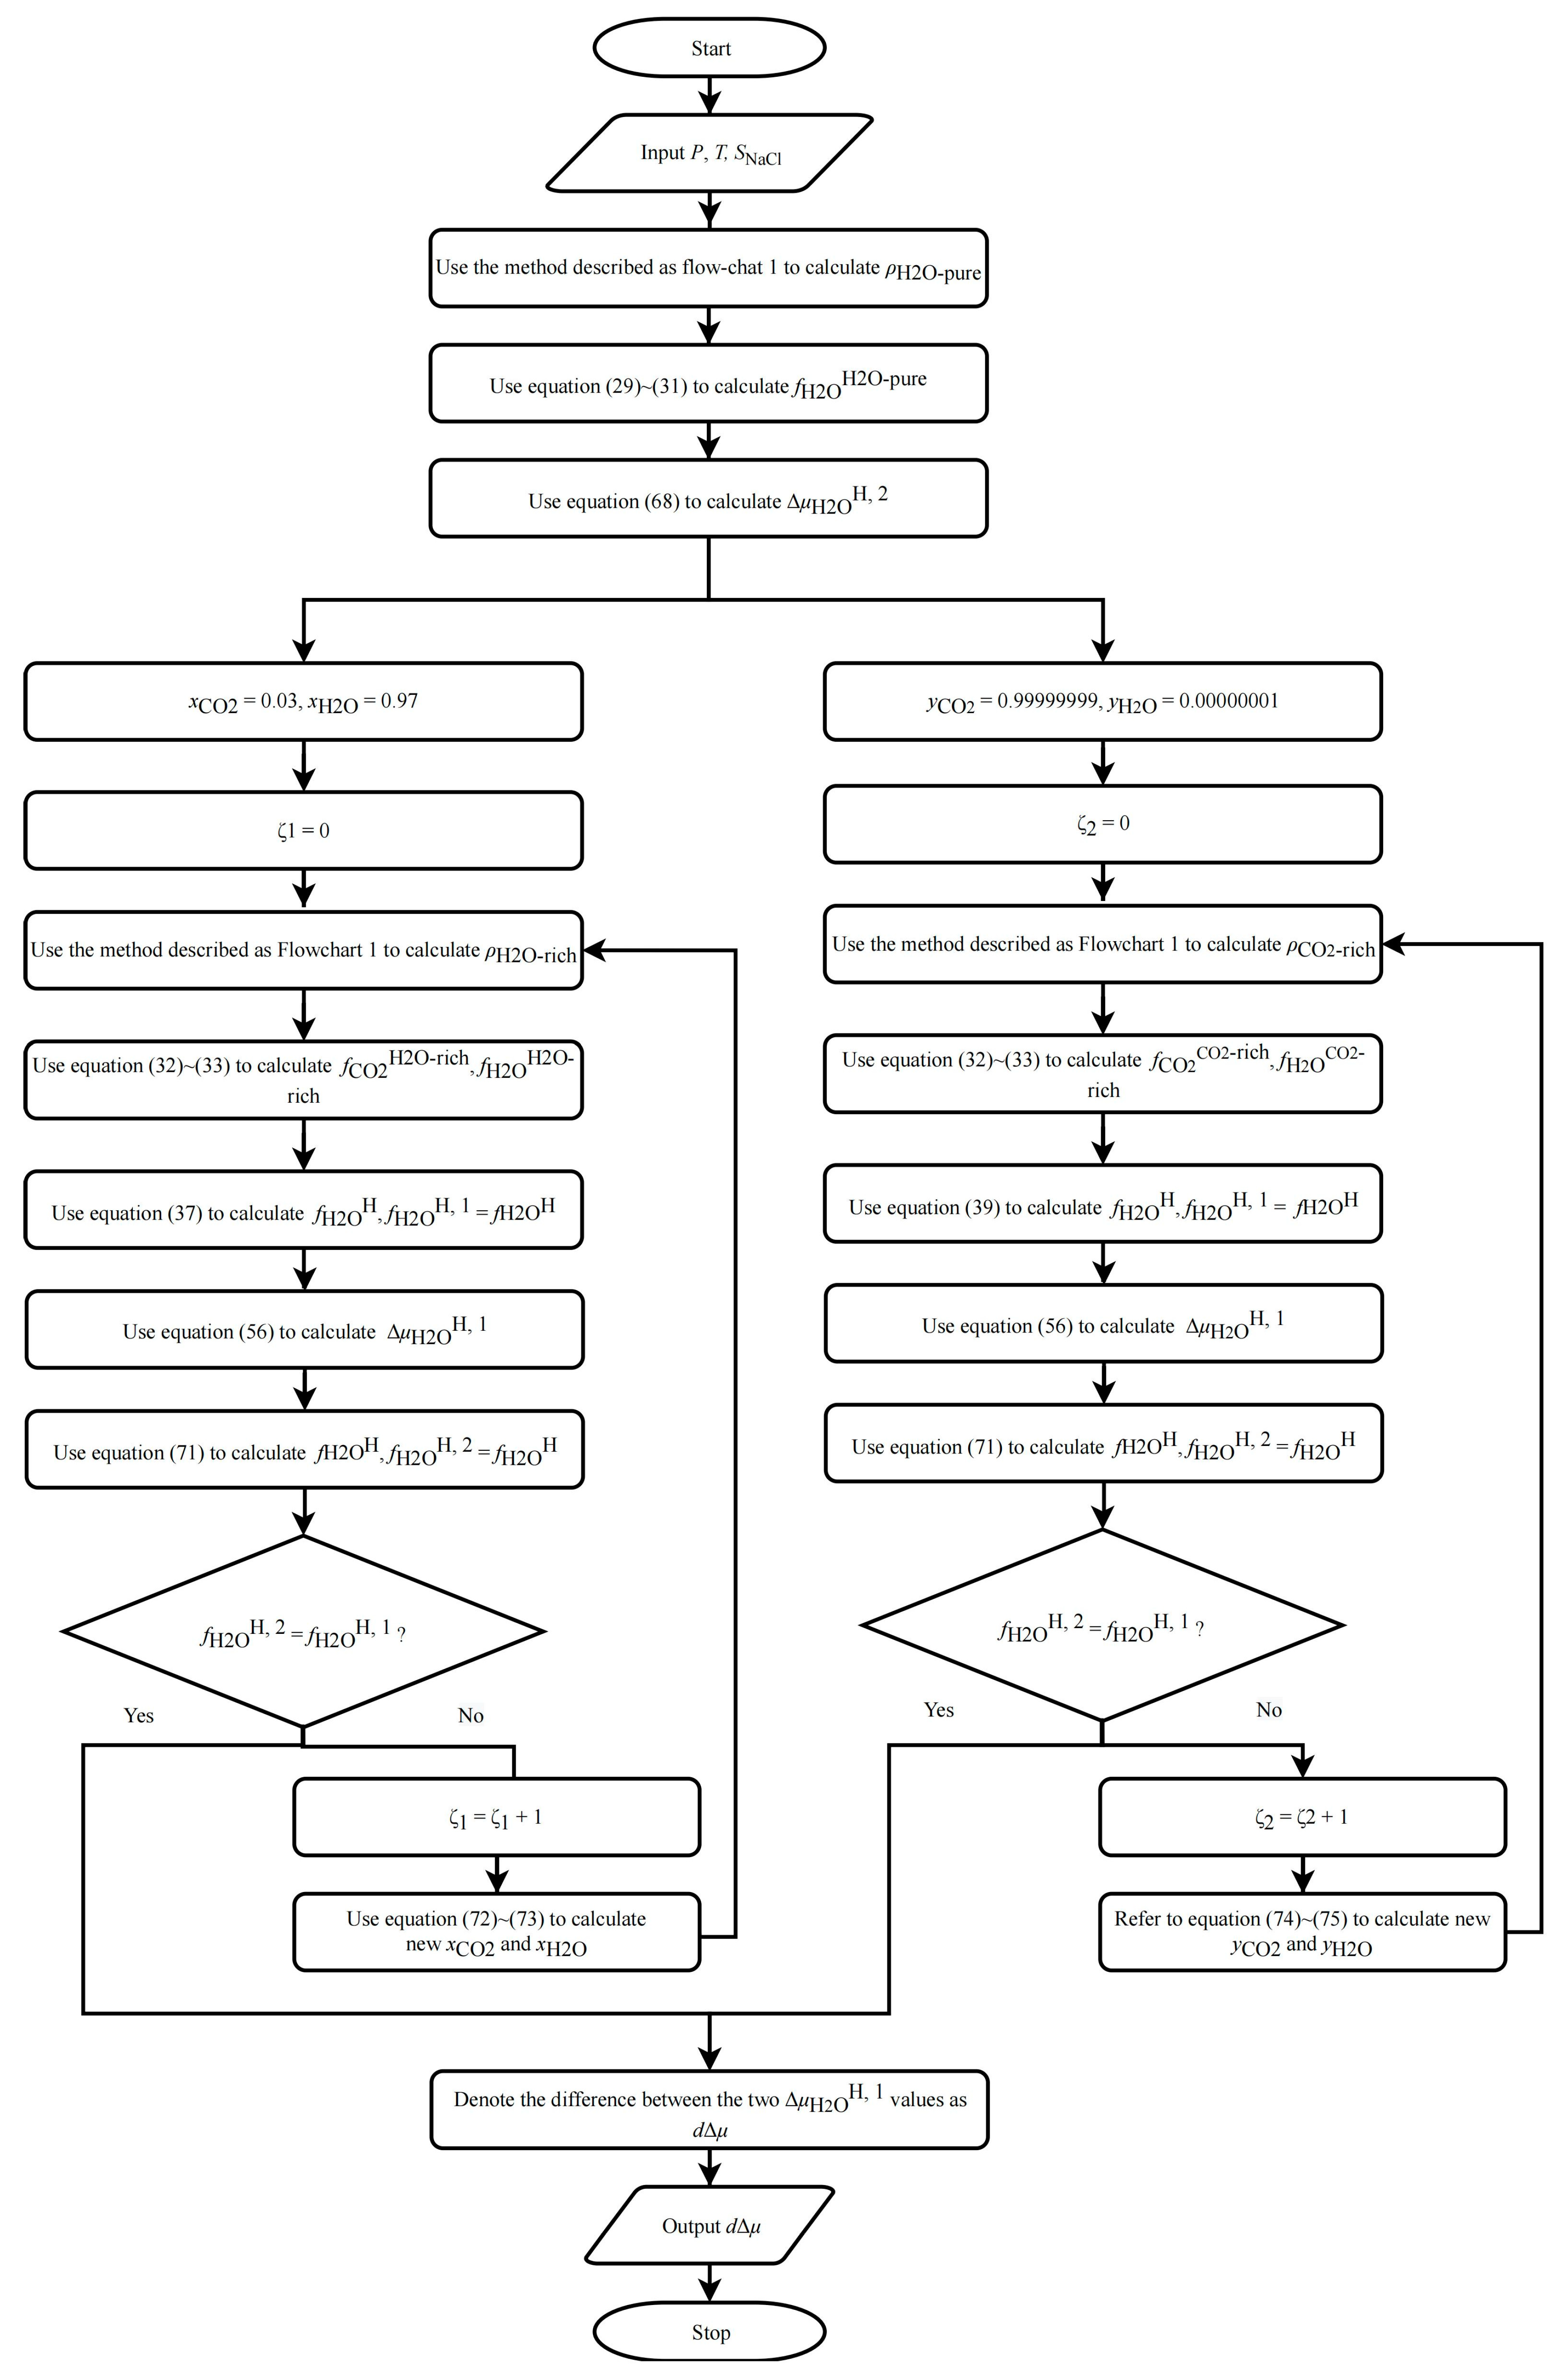
2.5.2. Modification of the VdWP Model
- (1)
- Use the method described in Section 2.1 to calculate and .
- (2)
- Calculate using Equation (68).
- (3)
- Assume an initial value for ; the recommended values are 0.99999999 and 0.00000001 for CO2 and for H2O, respectively.
- (4)
- Use the method described in Section 2.1.2 to calculate and .
- (5)
- Calculate the first value of using Equation (39) and denote it as .
- (6)
- Calculate with , using Equation (56).
- (7)
- Calculate the second value of using Equation (71) and denote it as .
- (8)
- Compare and ; if they are not equal, modify using the following equation and repeat steps (4) to (7) until they are equal:
- (9)
- Use the method described in Section 2.1.2 to calculate .
- (10)
- Calculate the first with using Equation (56).
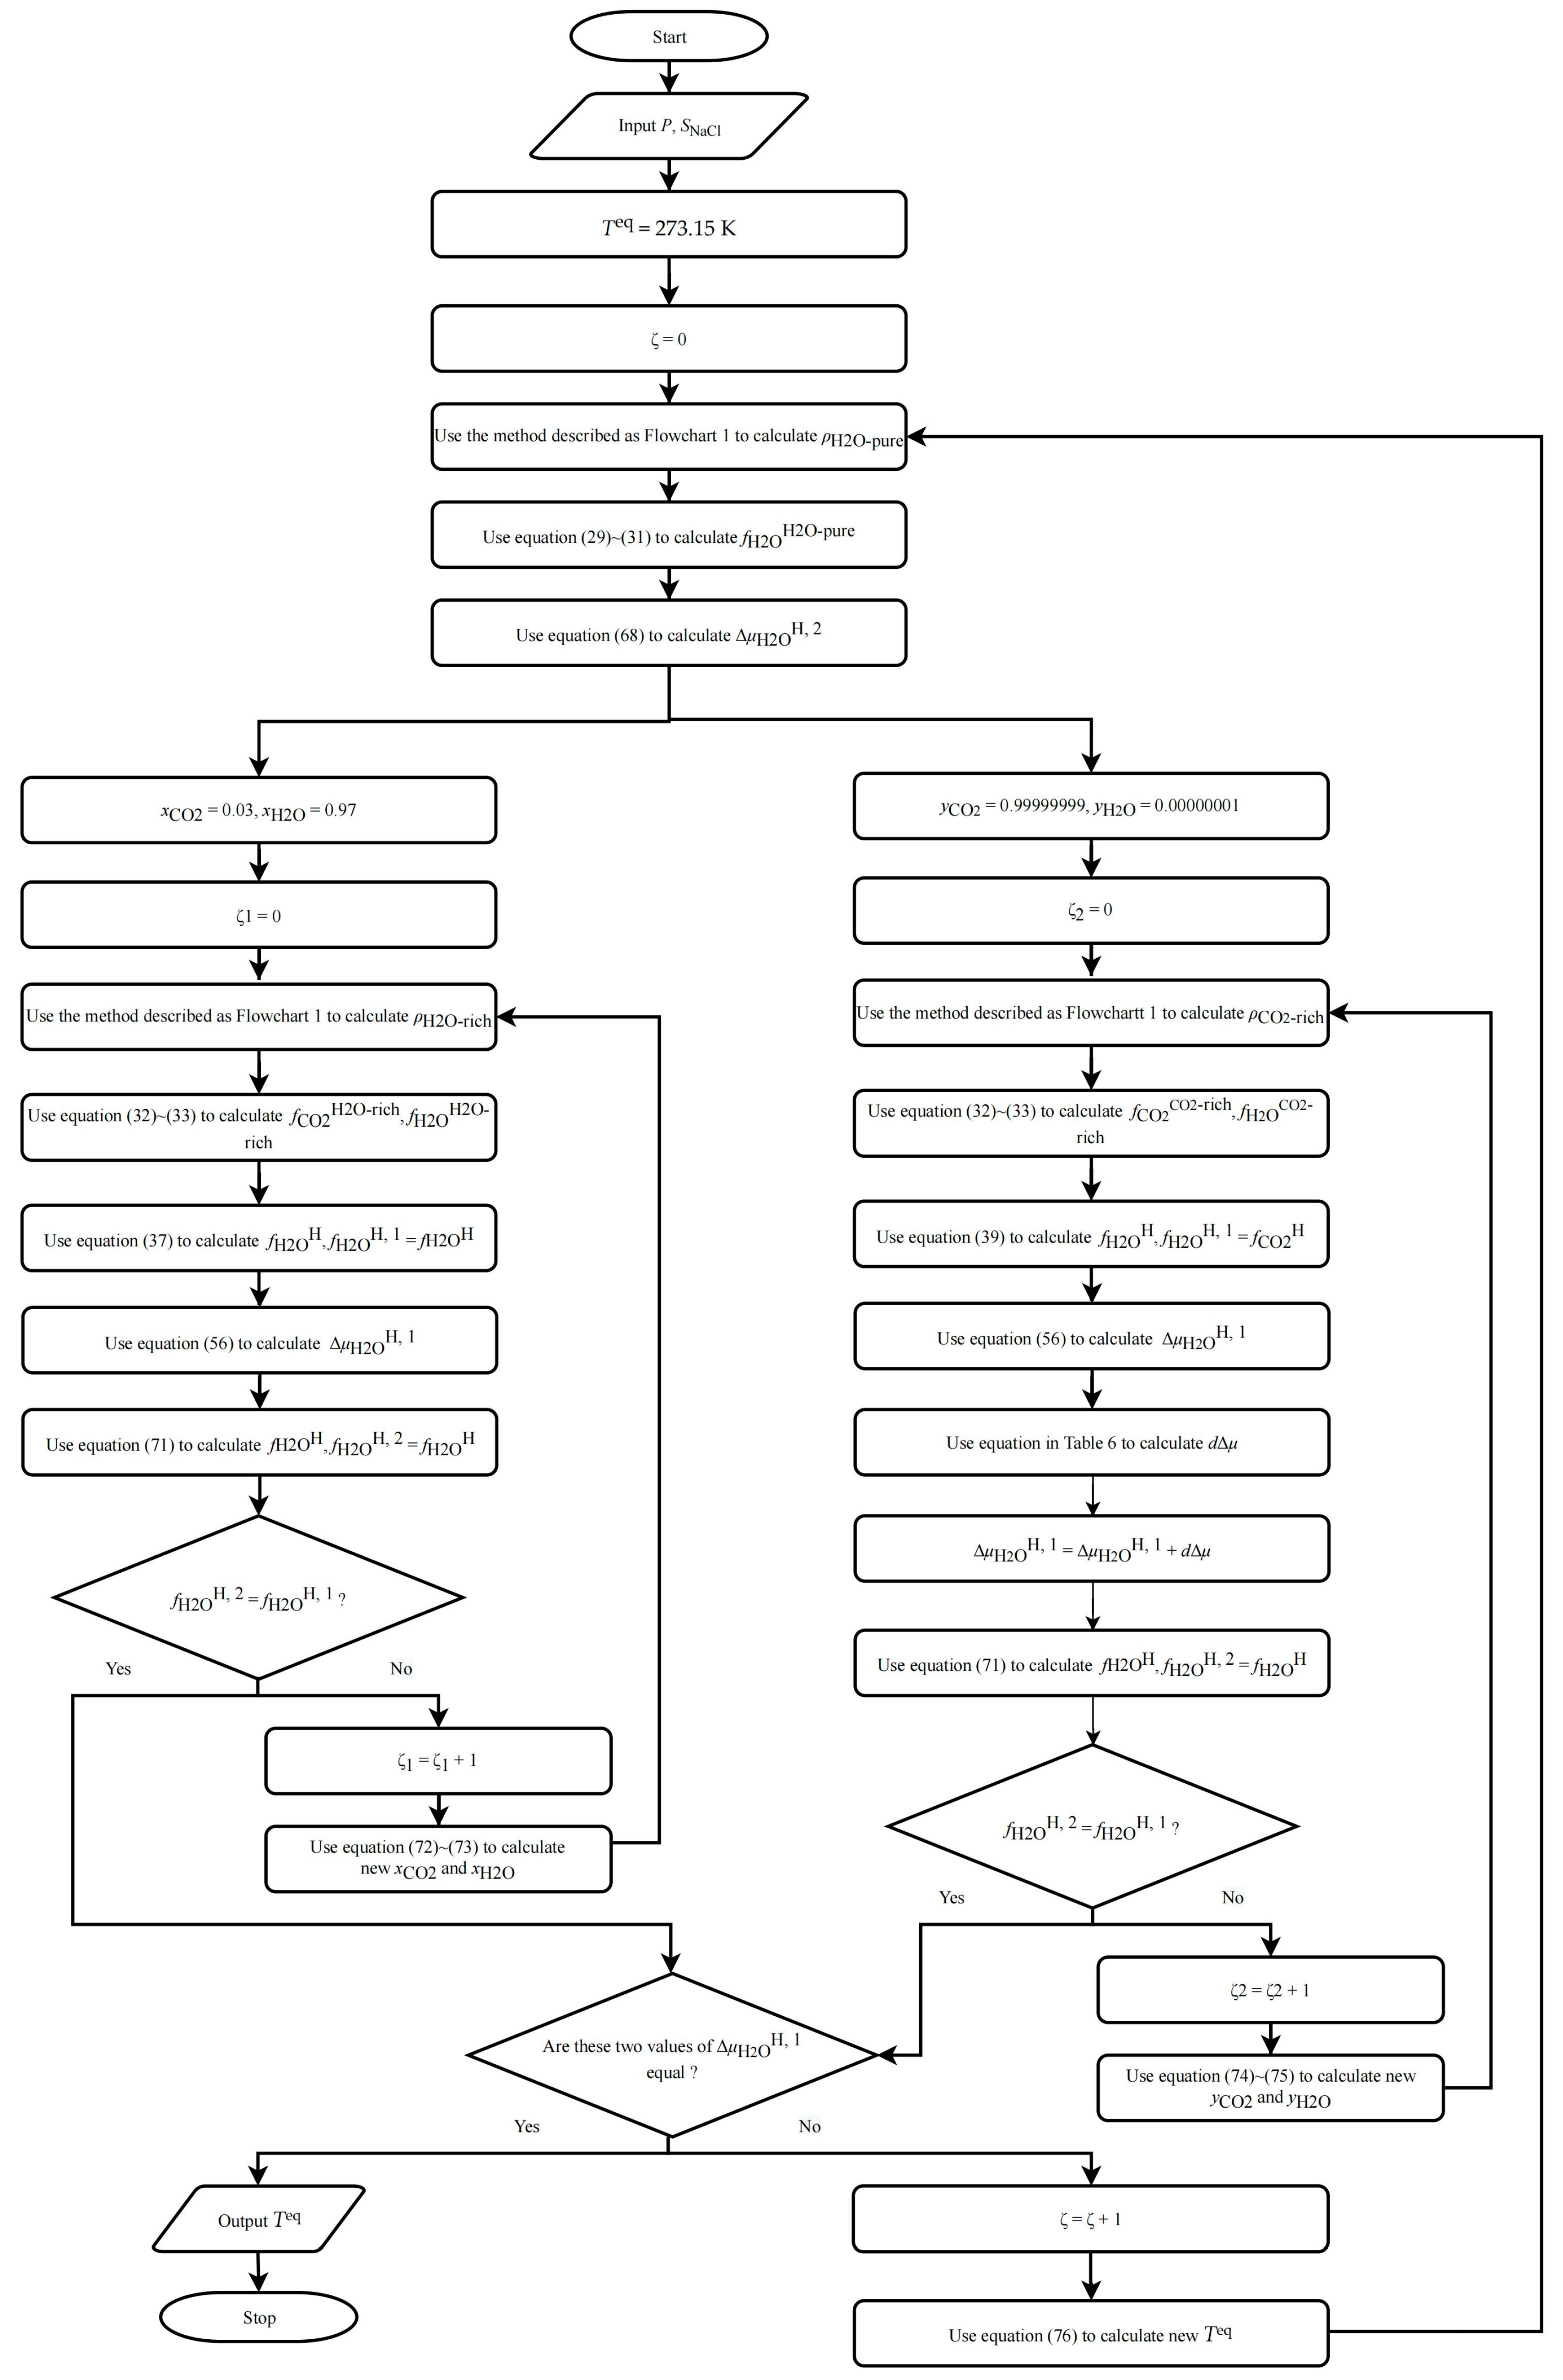
2.5.3. Phase Equilibrium Conditions of CO2–Pure Water/NaCl Aqueous Solution–CO2 Hydrate
- (1)
- Assume an initial value for , such as 273.15 K.
- (2)
- Use the method described in Section 2.5.1 to predict and , and calculate the first with , following steps (4) to (6) in Section 2.5.1.
- (3)
- Follow steps (1) to (10) in Section 2.5.2 to calculate a value and add a value to it as the second value of .
- (4)
- Compare the difference between the two values; if they are not equal, modify with the following equation and repeat steps (2) to (3) until they are equal:
2.6. Modification of BWRS EOS
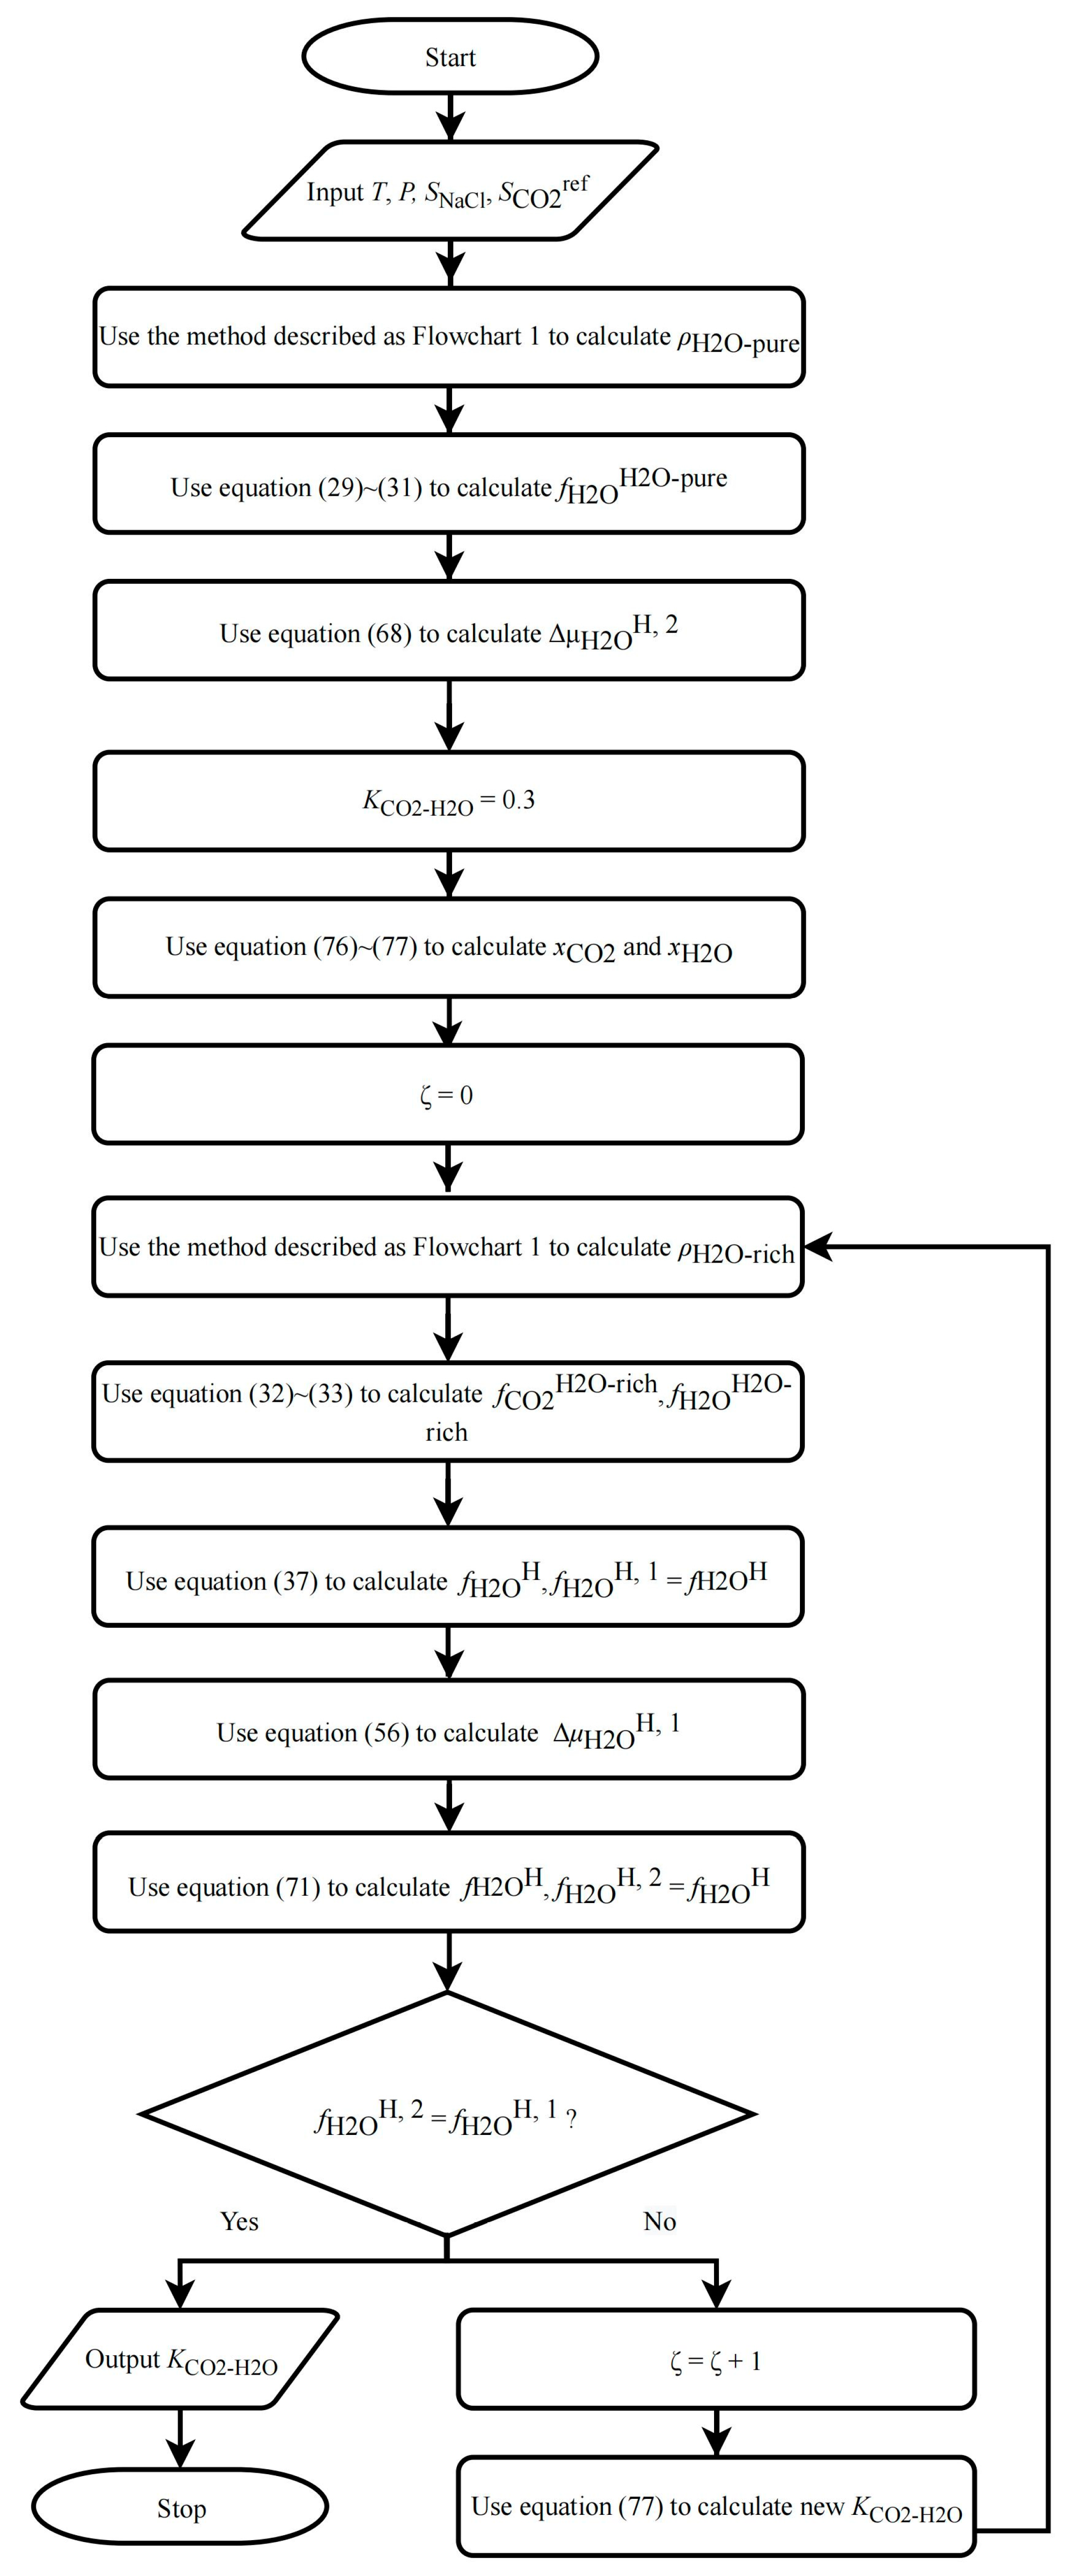
- (1)
- Assume an initial value for ; the recommended value is 0.3.
- (2)
- Use the method described in Section 2.3.2 to predict the mole fraction of CO2 and H2O in the H2O-rich phase, and , at pure water/NaCl aqueous solution equilibrium.
- (3)
- Calculate CO2 solubility () using Equation (53).
- (4)
- Compare with ; if they are not equal, modify using the following equation and repeat steps (2) and (3) until they are equal:
- (1)
- Use the method described in Section 2.1 to calculate and .
- (2)
- Calculate using Equation (68).
- (3)
- Assume an initial value of 0.2 for .
- (4)
- Calculate and according to as follows:
- (5)
- Use the method described in Section 2.1.2 to calculate and .
- (6)
- Use Equation (37) to calculate the first value and denote it as .
- (7)
- Calculate using Equation (56).
- (8)
- Use Equation (71) to calculate the second value and denote it as .
- (9)
- If is not equal to , modify using Equation (77) and repeat steps (5) to (8) until they are equal.
2.7. Statistics and Screening of Reported Experimental Data
3. Results and Discussion
3.1. Modification of BWRS EOS
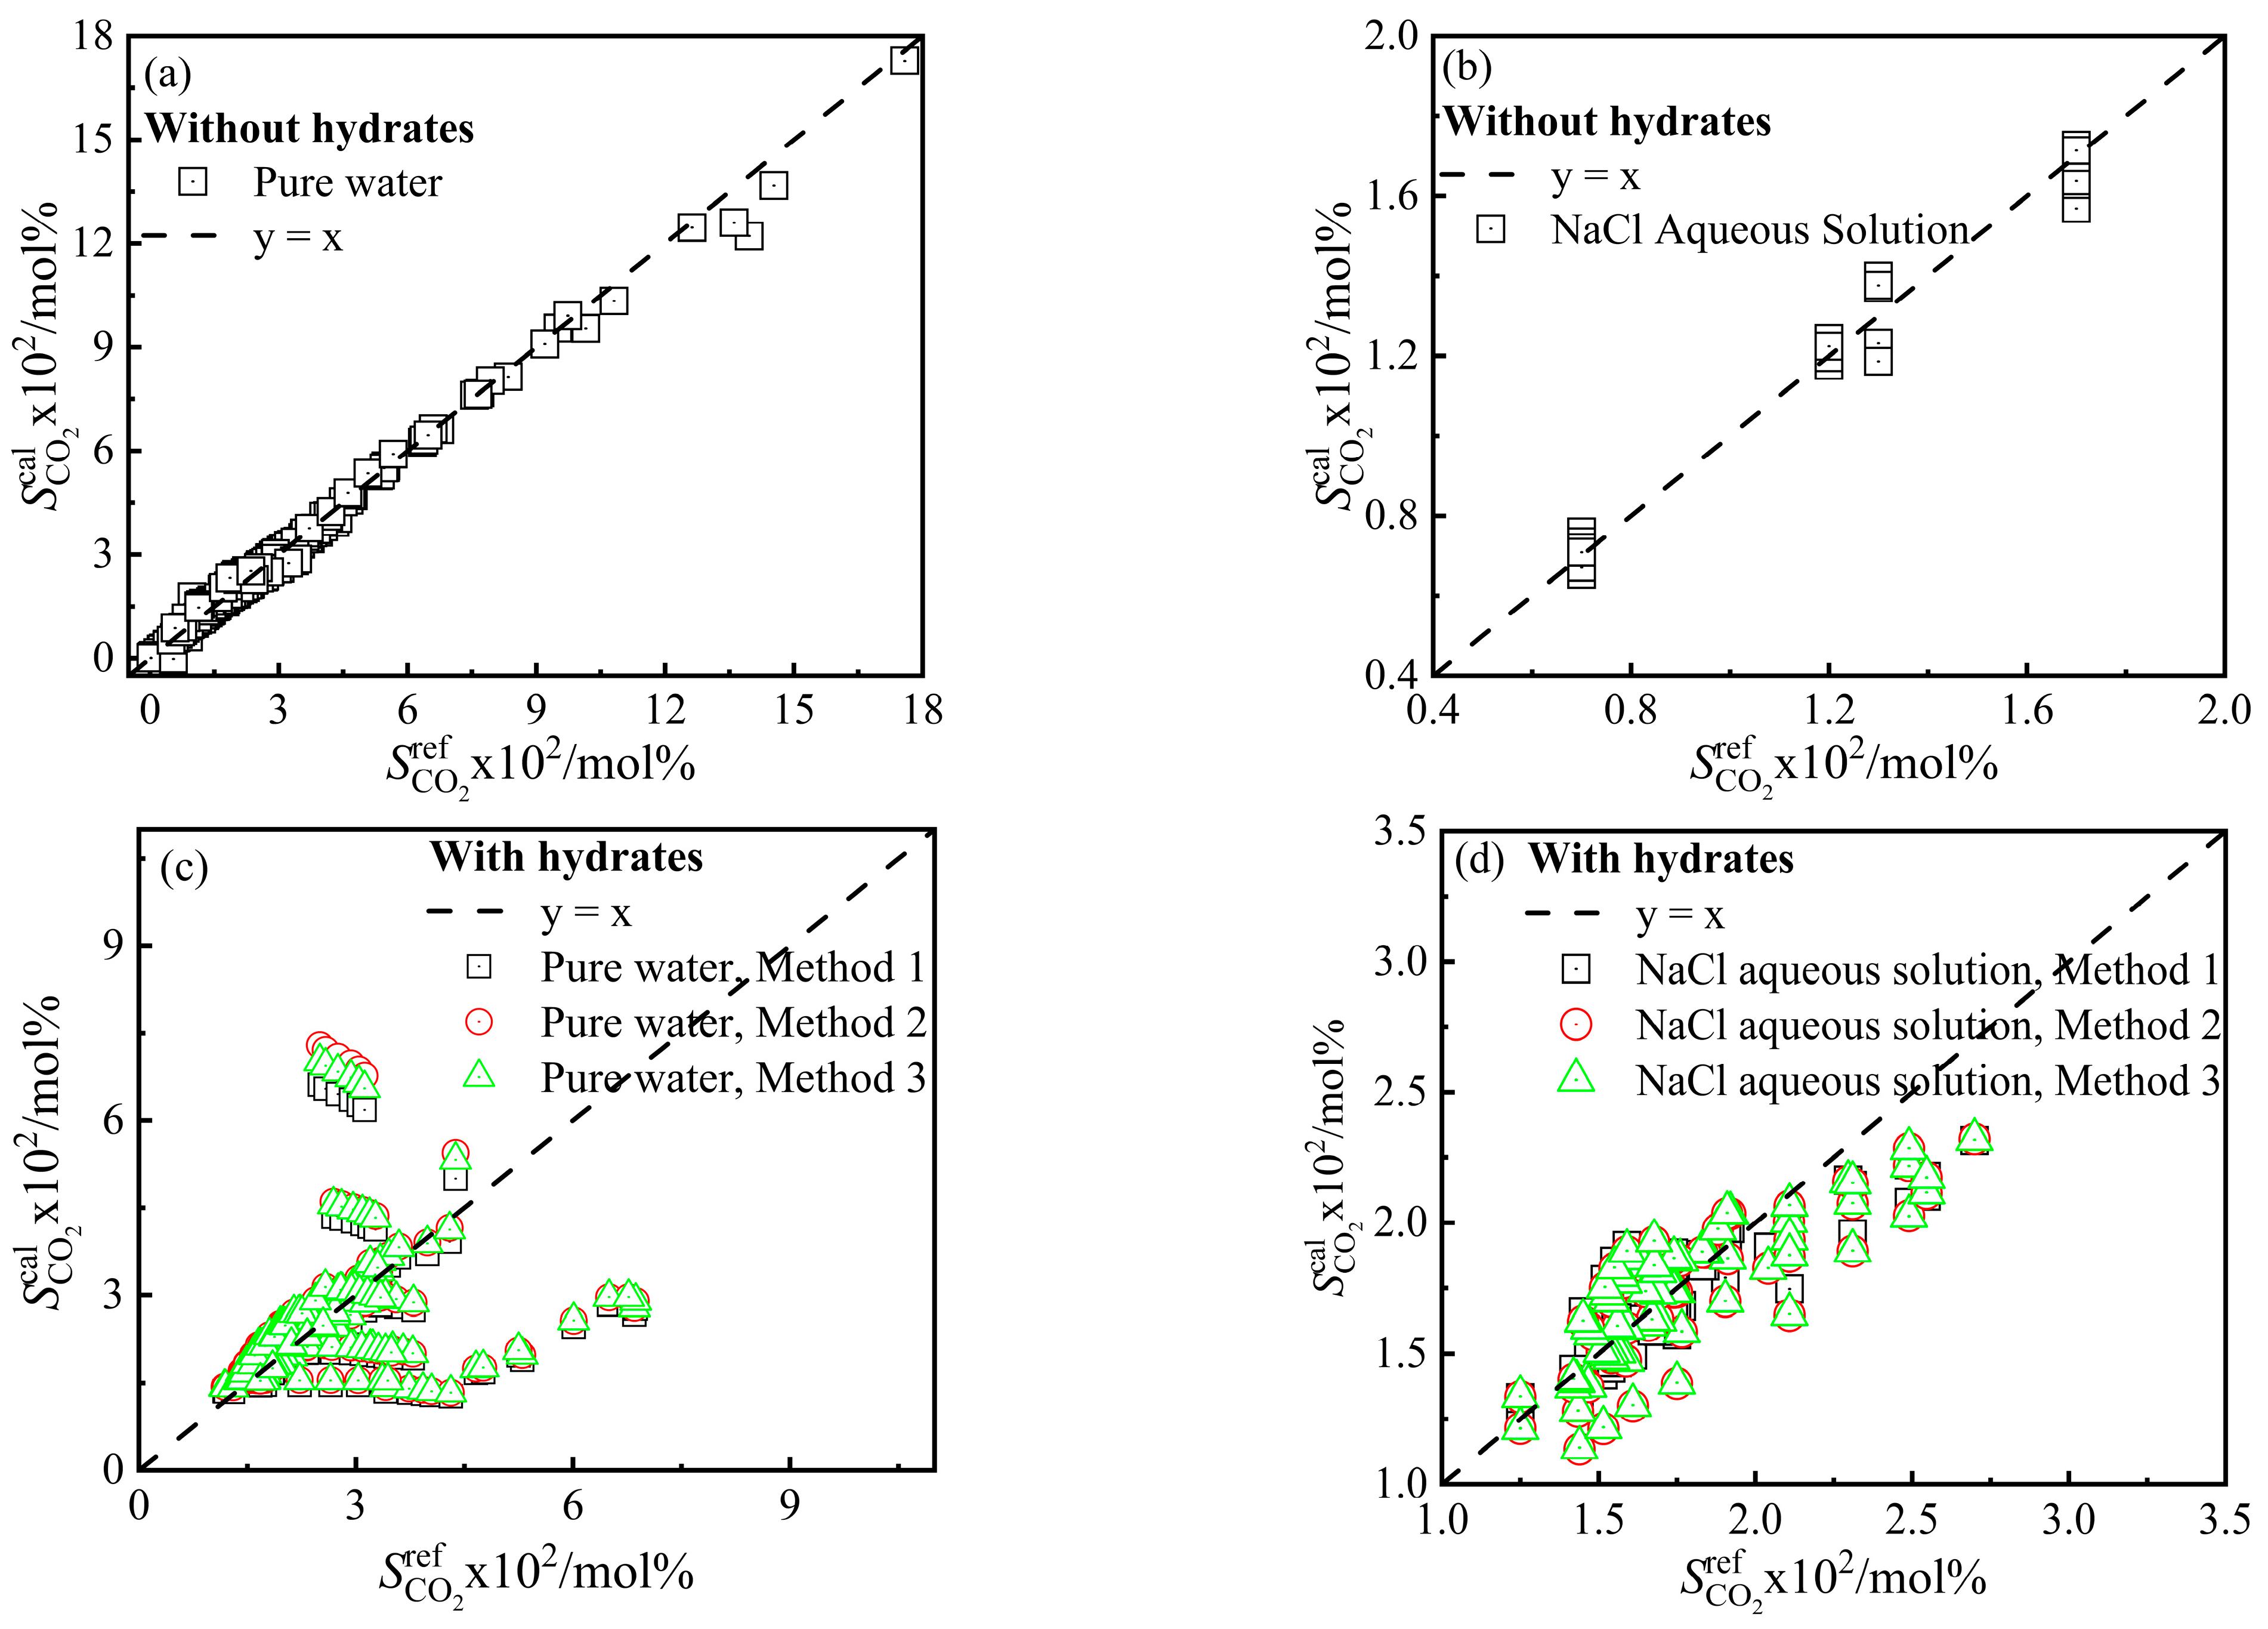
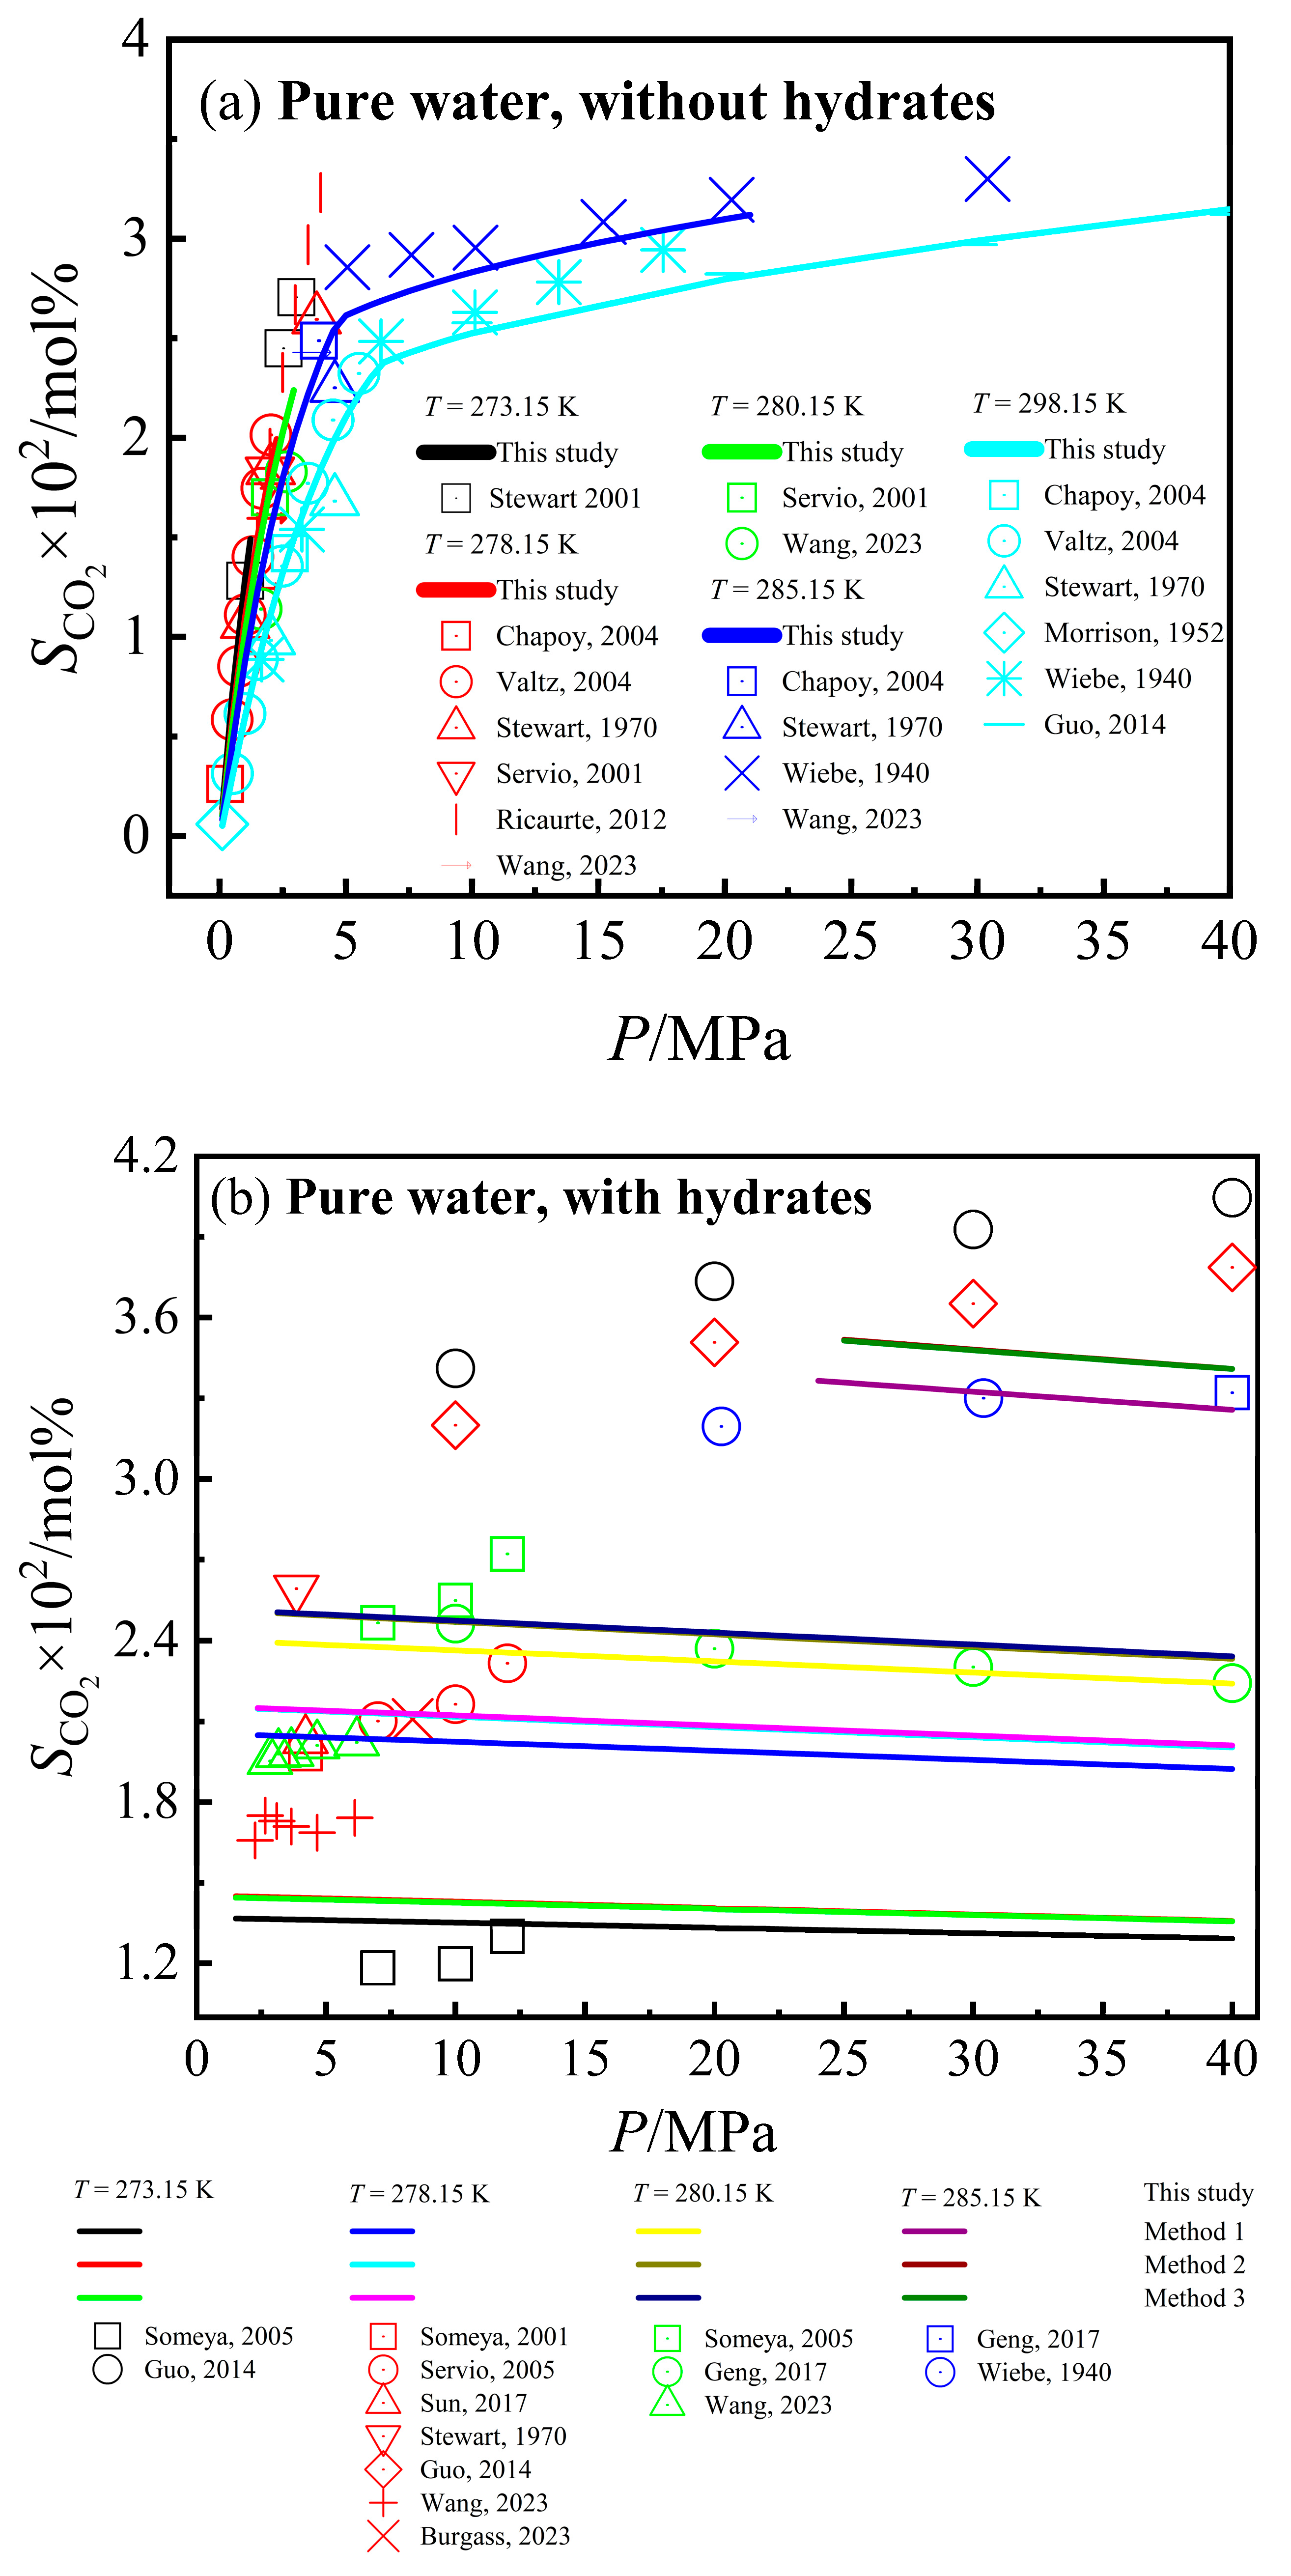
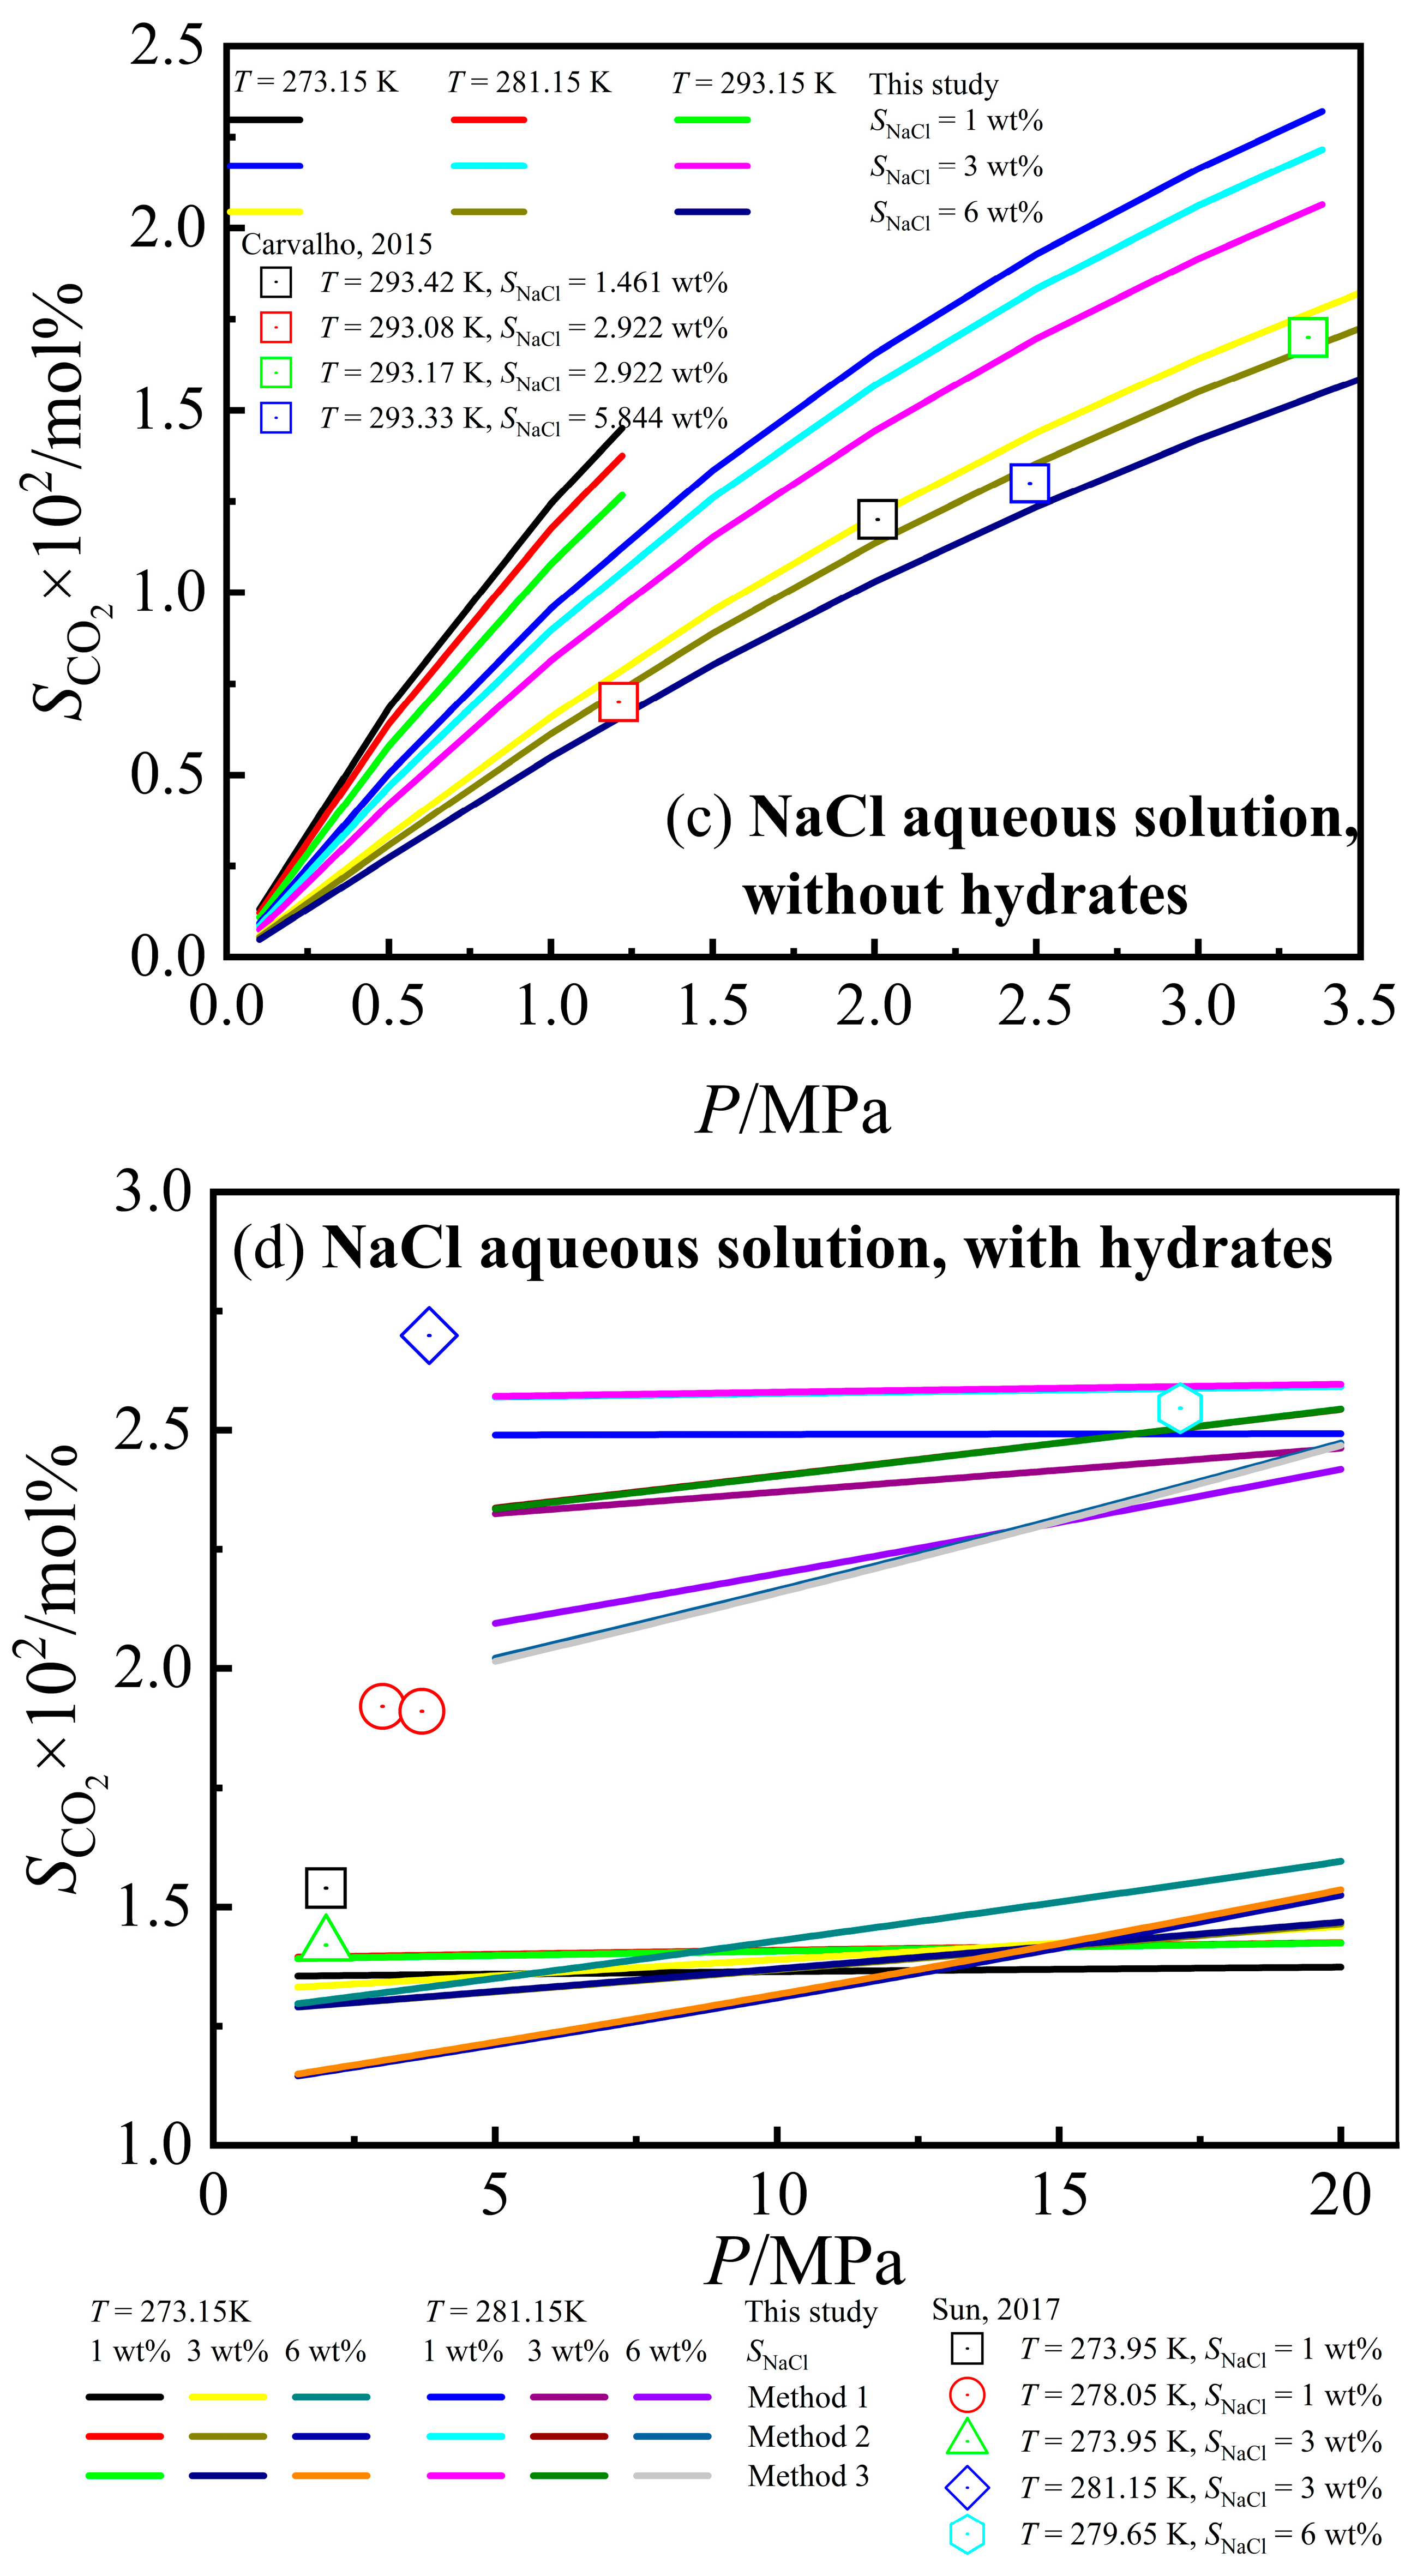
3.2. Calculation Results of CO2 Solubility
3.3. Modification of VdWP Model
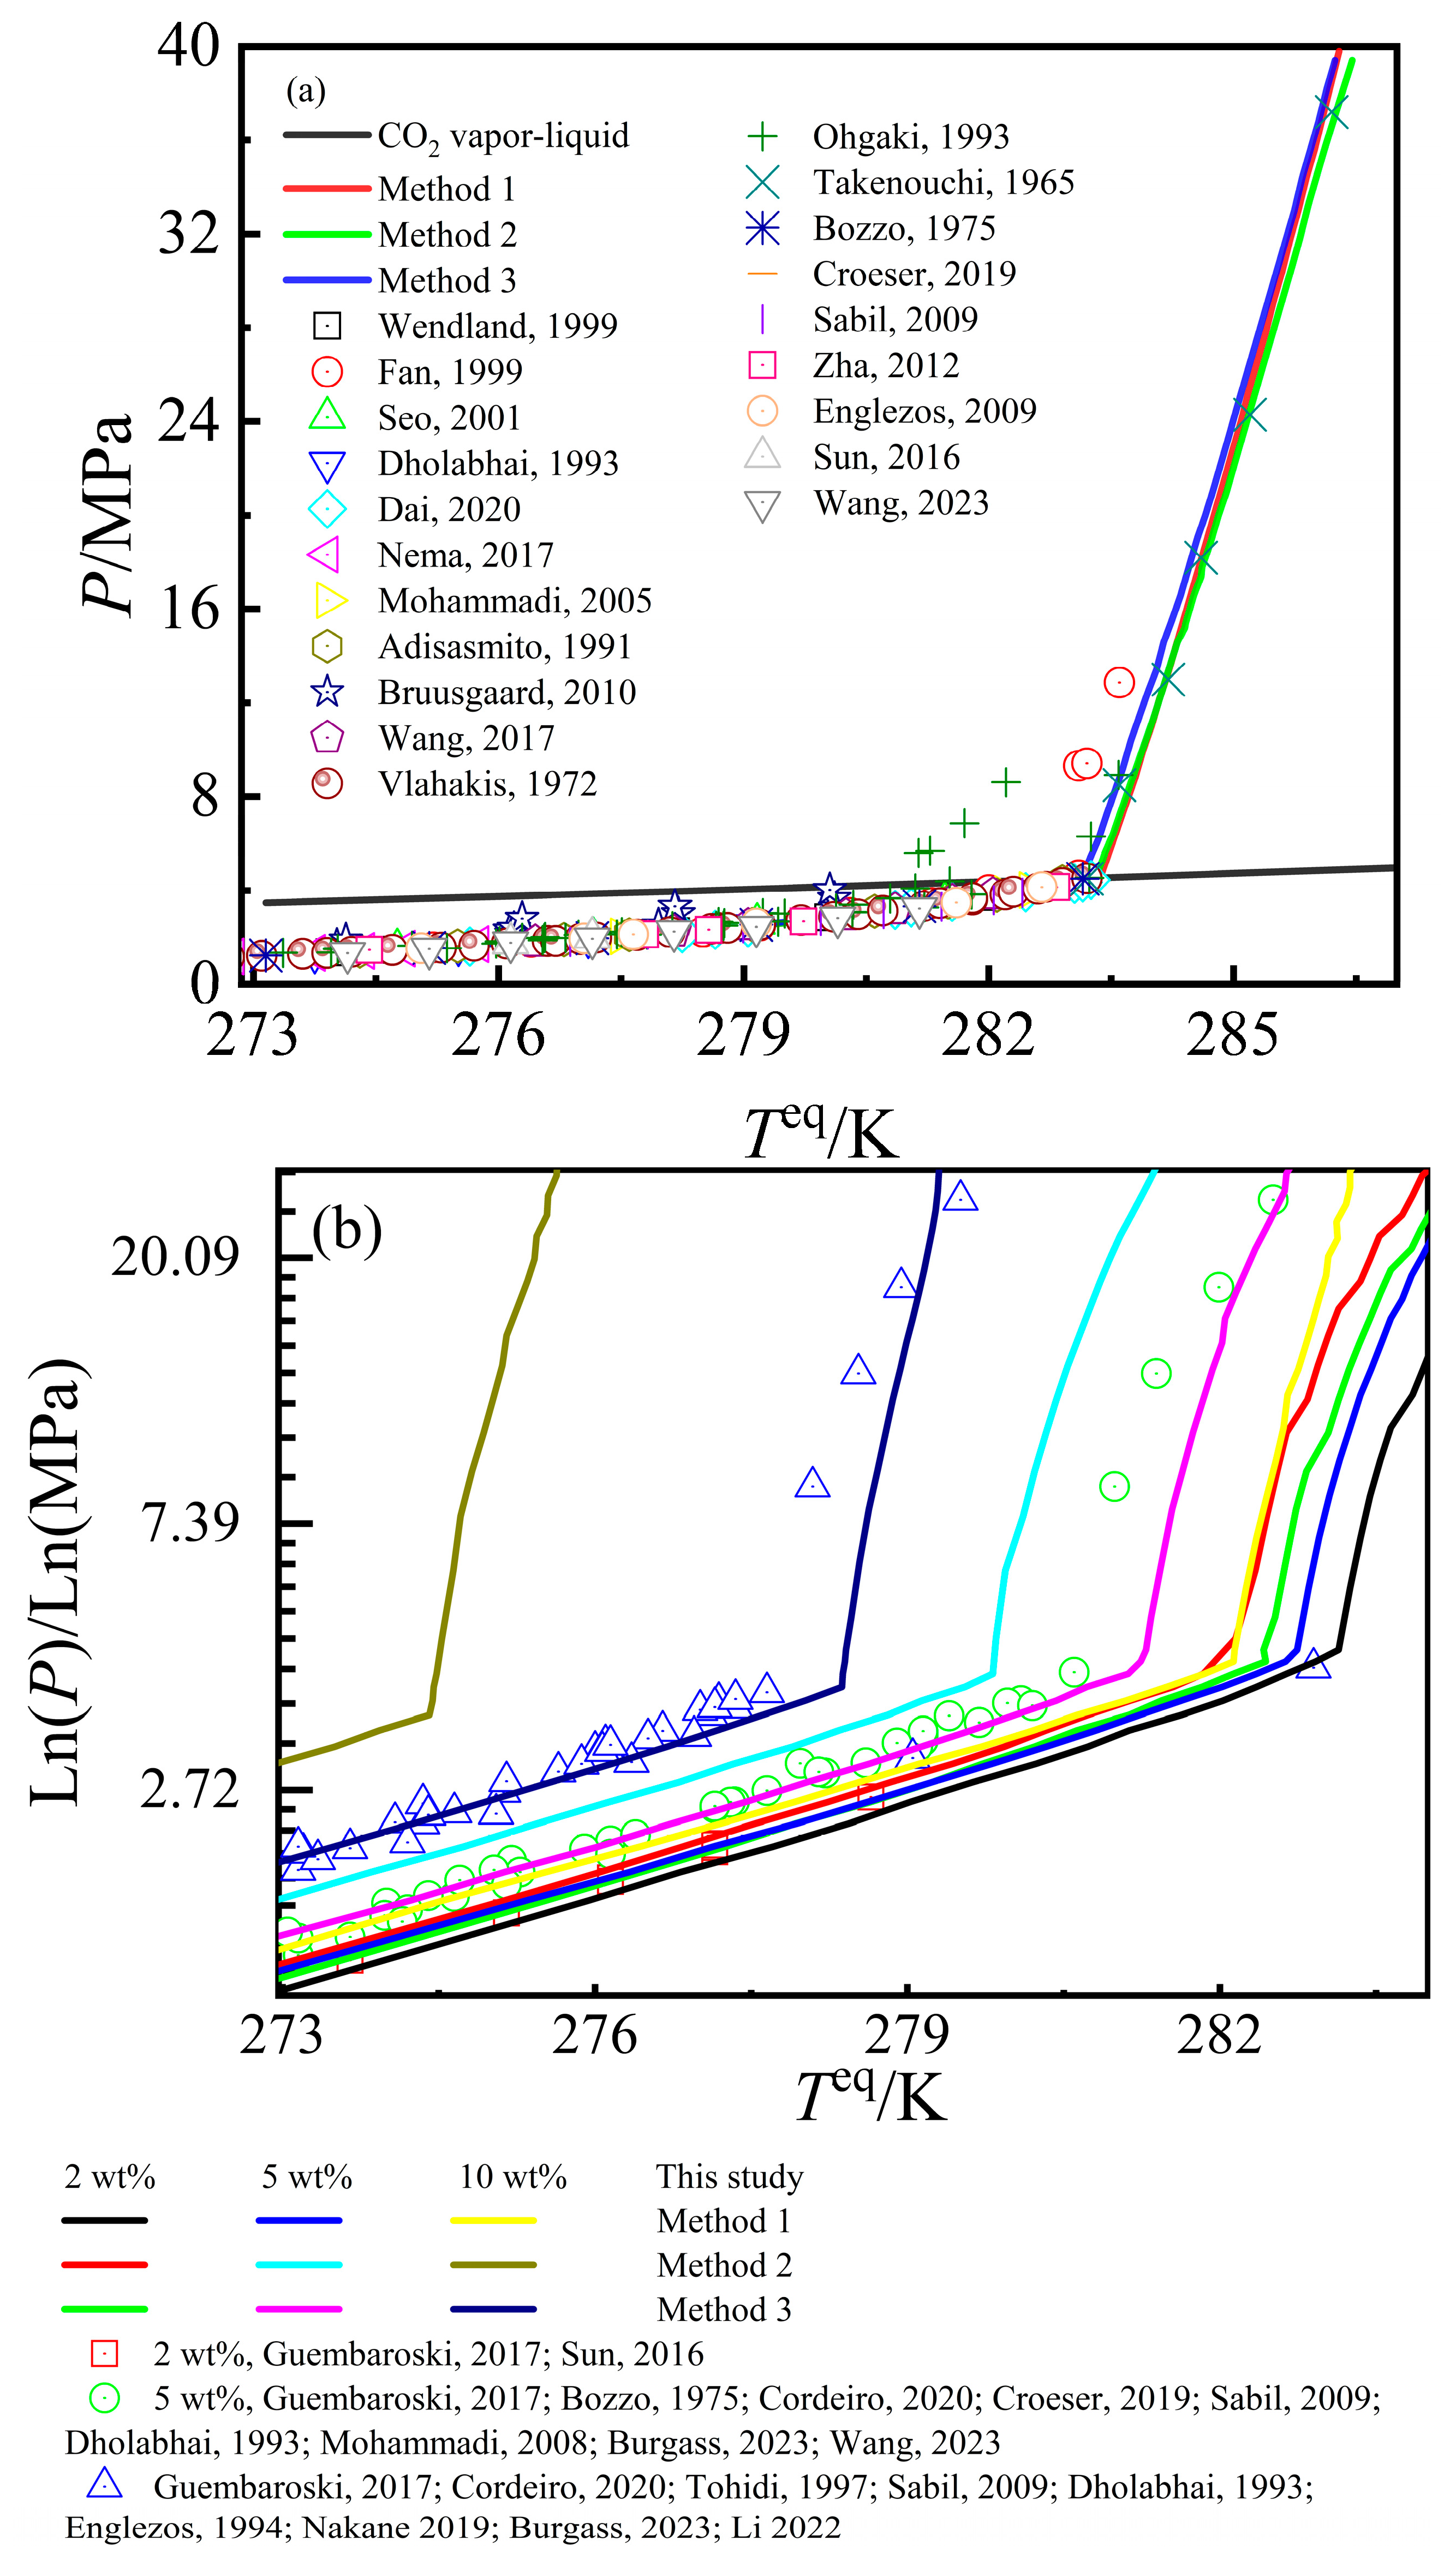
3.4. Calculation Results of CO2–Pure Water/NaCl Aqueous Solution–CO2 Hydrate Phase Equilibrium Conditions
4. Conclusions
Author Contributions
Funding
Data Availability Statement
Conflicts of Interest
Nomenclature
| system pressure, MPa | |
| system temperature, K | |
| molar density of fluid, mol∙mL−1 | |
| R | ideal gas constant, 8.314 J∙mol−1∙K−1 |
| i, k | components i and k |
| , , , , b, a, , c, , d, | parameters in the BWRS EOS |
| , , , , , , , , , | parameters in the BWRS EOS related to component i |
| critical density of component i, | |
| i | critical temperature of component i, |
| acentric factor of component i, | |
| critical pressure of component i, | |
| , | universal parameters for the calculation of parameters in the BWRS EOS |
| proportion of component i in a particular phase of the mixed fluid, mol% | |
| interaction coefficient between component i and k | |
| function form of BWRS EOS | |
| derivative form of | |
| density calculated from the ‘n’-th iteration, mol∙mL−1 | |
| density calculated from the ‘n + 1’-th iteration, mol∙mL−1 | |
| initial density value for iteration for vaporous fluids, mol∙mL−1 | |
| initial density value for iteration for liquid fluids, mol∙mL−1 | |
| φ | fugacity coefficient |
| compressibility factor | |
| fugacity, MPa | |
| fugacity coefficient of component i | |
| fugacity of component i, MPa | |
| fugacity of component i in vapor phase, MPa | |
| fugacity of component i in liquid phase, MPa | |
| fugacity of H2O in H2O-rich phase, MPa | |
| fugacity of H2O in CO2-rich phase, MPa | |
| fugacity of CO2 in H2O-rich phase, MPa | |
| fugacity of CO2 in CO2-rich phase, MPa | |
| fugacity of H2O in hydrate phase, MPa | |
| fugacity of CO2 in hydrate phase, MPa | |
| vapor pressure of component i, MPa | |
| initial value of for iteration, MPa | |
| compressibility factor of vapor phase of the fluid of component i | |
| compressibility factor of liquid phase of the fluid of component i | |
| calculated from the ‘n’-th iteration | |
| calculated from the ‘n + 1’-th iteration | |
| Ki | equilibrium constant of component i between CO2-rich phase and H2O-rich phase |
| mole fraction of component i in CO2-rich phase, mol% | |
| mole fraction of component i in H2O-rich phase, mol% | |
| total mole fraction of component i in fluid phase, mol% | |
| molar phase fraction of CO2-rich phase | |
| molar phase fraction of H2O-rich phase | |
| function form of the Rachford-Rice equation | |
| derivative form of | |
| Initial value of for iteration | |
| calculated from the ‘n’-th iteration | |
| calculated from the ‘n + 1’-th iteration | |
| fugacity of i in H2O-rich phase, MPa | |
| fugacity of H2O in CO2-rich phase, MPa | |
| Ki calculated from the ‘n’-th iteration | |
| Ki calculated from the ‘n + 1’-th iteration | |
| CO2 solubility | |
| mole fraction of CO2 in H2O-rich phase, mol% | |
| mole fraction of H2O in H2O-rich phase, mol% | |
| chemical potential difference of H2O in empty hydrate cavities and in hydrate cavities that contain guest molecule k, J∙mol−1 | |
| moles of j-type hydrate cavities formed by 1 mole of H2O molecules, mol | |
| occupancy of component k in j-type hydrate cavities | |
| fugacity of the guest molecule k, MPa | |
| Langmuir constant | |
| Langmuir constant for small cavities | |
| Langmuir constant for large cavities | |
| chemical potential difference of H2O in empty hydrate cavities and pure water at any temperature and pressure, J∙mol−1 | |
| chemical potential difference of H2O in empty hydrate cavities and pure water at the reference temperature and pressure, 1264.13 J∙mol−1 | |
| enthalpy difference of empty hydrate cavities and pure water at the reference temperature and pressure, −4861.03 J∙mol−1 | |
| molar heat capacity difference of empty hydrate cavities and pure water at the reference temperature and pressure, −38.13 J∙mol−1∙K−1 | |
| enthalpy difference of empty hydrate cavities and pure water at any temperature and pressure, J∙mol−1 | |
| volume difference of empty hydrate cavities and pure water at any temperature and pressure, mL | |
| molar heat capacity difference of empty hydrate cavities and pure water at any temperature and pressure, J∙mol−1∙K−1 | |
| density of empty hydrate cavities, | |
| density of pure water, | |
| relative molecular mass of H2O, 18 g∙mol−1 | |
| fugacity of H2O in empty hydrate phase, MPa | |
| fugacity of H2O in pure water, MPa | |
| calculated value of using Equation (37), MPa | |
| calculated value of using Equation (71), MPa | |
| calculated from the ‘n’-th iteration, mol% | |
| calculated from the ‘n + 1’-th iteration, mol% | |
| calculated from the ‘n’-th iteration, mol% | |
| calculated from the ‘n + 1’-th iteration, mol% | |
| calculated from the ‘n’-th iteration, mol% | |
| calculated from the ‘n + 1’-th iteration, mol% | |
| calculated from the ‘n’-th iteration, mol% | |
| calculated from the ‘n + 1’-th iteration, mol% | |
| customized parameter employed to reconcile the discrepancy of the two values calculated with and , J∙mol−1 | |
| phase equilibrium temperature of CO2–pure water/NaCl aqueous solution–CO2 hydrate, K | |
| calculated from the ‘n’-th iteration, K | |
| calculated from the ‘n + 1’-th iteration, K | |
| interaction coefficient between CO2 and H2O | |
| CO2 solubility, from references, K | |
| CO2 solubility, calculation results, K | |
| phase equilibrium temperature of CO2–pure water/NaCl aqueous solution–CO2 hydrate, from references, K | |
| phase equilibrium temperature of CO2–pure water/NaCl aqueous solution–CO2 hydrate, calculation results, K |
Appendix A

| Ref. | T/K | P/MPa | /wt% | ×102/mol% | N a | ×102/mol% | MaxAE b × 102/mol% | MaxRE c/% | AARD d/% |
|---|---|---|---|---|---|---|---|---|---|
| Pure water without hydrates | |||||||||
| [45] | 274.14~351.31 | 0.19~9.333 | - | 0.262~2.488 | 27 | 0.250~2.418 | −0.158 | −7.276 | 1.734 |
| [46] | 278.22~318.23 | 0.465~7.963 | - | 0.182~2.797 | 47 | 0.162~2.529 | −0.268 | −10.887 | 3.637 |
| [47] | 273.15~298.15 | 1.013~4.560 | - | 0.860~2.706 | 12 | 0.937~2.705 | 0.317 | 18.826 | 6.659 |
| [48] | 278.05~283.15 | 2~3.7 | - | 1.560~2.340 | 6 | 1.652~2.471 | 0.295 | 14.043 | 6.008 |
| [49] | 286.45~347.85 | 0.101 | - | 0.024~0.085 | 19 | 0.012~0.078 | −0.012 | −49.87 | 23.754 |
| [50] | 285.15~313.15 | 2.533~50.663 | - | 0.934~3.300 | 42 | 0.967~3.296 | 0.802 | 81.707 | 4.243 |
| [51] | 298.15 | 1.666~17.551 | - | 0.887~2.944 | 6 | 0.945~2.741 | −0.203 | −6.909 | 5.295 |
| [52] | 273.15~573.15 | 10~120 | - | 0.544~17.582 | 131 | −0.013~17.286 | −1.748 | −102.449 | 3.421 |
| [53] | 274~303 | 1~4 | - | 0.492~3.440 | 49 | 0.520~2.870 | −0.570 | −16.569 | 5.539 |
| [11] | 275.15~286.15 | 0.77~4.65 | - | 0.585~2.526 | 22 | 0.875~2.621 | 0.460 | 49.537 | 21.506 |
| Total | 273.15~573.15 | 0.101~120 | - | 0.024~17.582 | 361 | −0.013~17.286 | −0.017 | −102.449 | 6.060 |
| NaCl aqueous solution without hydrates | |||||||||
| [54] | 293.08~353.23 | 1.02~14.29 | 1.461~11.688 | 0.700~1.800 | 44 | 0.653~2.097 | 0.297 | 16.513 | 4.318 |
| Total | 293.08~353.23 | 1.02~14.29 | 1.461~11.688 | 0.700~1.800 | 44 | 0.653~2.097 | 0.297 | 16.513 | 4.318 |
| Ref. | T/K | P/MPa | /wt% | ×102/mol% | N a | ×102/mol% | MaxAE b × 102/mol% | MaxRE c/% | AARD d/% | ×102/mol% | MaxAE b × 102/mol% | MaxRE c/% | AARD d/% | ×102/mol% | MaxAE b × 102/mol% | MaxREc/% | AARD d/% |
|---|---|---|---|---|---|---|---|---|---|---|---|---|---|---|---|---|---|
| Method 1 | Method 2 | Method 3 | |||||||||||||||
| Pure water with hydrates | |||||||||||||||||
| [55] | 276.15~283.05 | 30 | - | 4.660~6.870 | 9 | 1.673~2.84 | 1.892 | −64.567 | 61.022 | 1.7.5~2.964 | −4.061 | −62.955 | 59.322 | 1.751~2.966 | −4.057 | −62.918 | 59.270 |
| [12] | 277.84~280.98 | 4.99~14.2 | - | 2.010~2.700 | 32 | 1.974~2.538 | 2.052 | −10.733 | 7.408 | 2.066~2.653 | −0.180 | −6.712 | 3.552 | 2.068~2.653 | −0.178 | −6.652 | 3.505 |
| [48] | 273.95~282.95 | 2~6 | - | 1.560~2.810 | 15 | 1.461~2.951 | 0.312 | 12.178 | 6.435 | 1.545~3.088 | 0.444 | 17.361 | 6.731 | 1.539~3.084 | 0.441 | 17.242 | 6.794 |
| [56] | 273.15~283.15 | 7~12 | - | 1.184~3.330 | 33 | 1.348~2.991 | −0.288 | −13.398 | 6.691 | 1.425~3.129 | −0.267 | 21.387 | 5.878 | 1.420~3.125 | −0.265 | 20.880 | 5.787 |
| [57] | 279.1~281.5 | 10.1~20.1 | - | 2.270~2.710 | 10 | 2.18~2.598 | 0.641 | −6.156 | 3.444 | 2.279~2.713 | 0.077 | 3.355 | 1.808 | 2.281~2.715 | 0.080 | 3.468 | 1.856 |
| [58] | 274.06~281.08 | 1.874~23.598 | - | 1.630~2.420 | 30 | 1.467~2.478 | −0.179 | −9.970 | 4.523 | 1.545~2.584 | 0.169 | 8.472 | 3.942 | 1.542~2.588 | 0.173 | 8.674 | 4.049 |
| [60] | 273.95~282.85 | 2~5 | - | 1.550~2.760 | 7 | 1.461~2.934 | −0.381 | −10.392 | 5.421 | 1.545~3.07 | 0.310 | 11.231 | 4.427 | 1.539~3.066 | 0.306 | 11.096 | 4.443 |
| [61] | 276.15~289.05 | 3~90 | - | 1.741~4.295 | 24 | 1.507~3.918 | −0.167 | −13.394 | 4.784 | 1.572~4.155 | 0.258 | −9.695 | 4.810 | 1.573~4.125 | 0.250 | −9.619 | 4.809 |
| [47] | 278.15 | 3.85035 | - | 2.594~2.594 | 1 | 2.044~2.044 | −0.163 | −21.198 | 21.198 | 2.142~2.142 | −0.453 | −17.445 | 17.447 | 2.142~2.142 | −0.452 | −17.434 | 17.434 |
| [50] | 285.15 | 20.265~30.3975 | 3.196~3.300 | 2 | 3.322~3.391 | −0.169 | 6.115 | 3.385 | 3.478~3.554 | 0.358 | 11.207 | 8.303 | 3.472~3.544 | 0.349 | 10.906 | 8.054 | |
| [52] | 273.15~283.15 | 10~120 | 2.981~4.379 | 14 | 1.272~5.001 | −0.377 | −70.493 | 39.678 | 1.335~5.441 | −2.976 | −69.038 | 38.413 | 1.332~5.325 | −2.979 | −69.107 | 38.221 | |
| [53] | 274~278 | 1.5~4 | 1.743~3.440 | 10 | 1.463~2.025 | −0.550 | −57.476 | 36.678 | 1.546~2.122 | −1.894 | −55.058 | 33.323 | 1.541~2.122 | −1.899 | −55.202 | 33.442 | |
| [11] | 274.15~283.15 | 1.33~9.11 | 1.389~2.578 | 62 | 1.477~3.004 | 0.108 | 0.025 | 14.244 | 1.559~3.144 | 0.566 | 29.546 | 19.898 | 1.555~3.139 | 0.561 | 29.546 | 19.819 | |
| [36] | 274.05~280.35 | 8.34~21.11 | 1.677~2.546 | 11 | 1.458~2.378 | −3.039 | −13.075 | 7.174 | 1.538~2.483 | −0.139 | −8.287 | 3.593 | 1.534~2.486 | −0.143 | −8.532 | 3.620 | |
| [59] | 278~293 | 6.44~29.49 | 2.500~3.490 | 24 | 1.936~6.613 | −4.111 | 164.53 | 54.431 | 2.02~7.295 | 4.795 | 191.803 | 61.204 | 2.024~7.013 | 4.513 | 180.504 | 58.572 | |
| Total | 273.15~293.15 | 1.33~120 | 1.184~6.870 | 285 | 1.272~6.613 | −4.111 | 164.531 | 16.438 | 1.335~7.295 | 4.795 | 191.803 | 17.231 | 1.332~7.013 | 4.513 | 180.504 | 16.985 | |
| NaCl aqueous solution with hydrates | |||||||||||||||||
| [11] | 274.15~281.15 | 1.45~3.83 | 3~5 | 1.434~1.670 | 18 | 1.347~2.314 | −0.385 | −14.26 | 4.551 | 1.135~2.321 | −0.378 | −21.139 | 9.743 | 1.141~2.319 | −0.38 | −20.734 | 9.615 |
| [57] | 278.8~280.4 | 10.1~20.1 | 5.844 | 2.310~2.400 | 6 | 1.957~2.257 | −0.414 | −16.611 | 11.408 | 1.891~2.284 | −0.463 | −18.604 | 12.170 | 1.893~2.285 | −0.465 | −18.67 | 12.144 |
| [60] | 273.95~278.15 | 2~8 | 1~3.6 | 1.420~1.585 | 36 | 1.412~1.979 | 0.322 | 20.222 | 7.613 | 1.373~2.035 | 0.299 | 18.796 | 6.519 | 1.374~2.038 | 0.302 | 18.979 | 6.618 |
| [36] | 271.45~279.65 | 8.41~21.79 | 3~6 | 1.250~2.109 | 10 | 1.238~2.177 | −0.444 | −17.442 | 10.059 | 1.214~2.173 | −0.462 | −21.925 | 10.906 | 1.215~2.174 | −0.458 | −21.735 | 10.882 |
| Total | 271.45~281.15 | 1.45~21.79 | 1~5.844 | 1.420~2.400 | 70 | 1.283~2.314 | −0.444 | 20.222 | 7.500 | 1.135~2.284 | −0.463 | −21.925 | 8.459 | 1.141~2.319 | −0.465 | −21.735 | 8.472 |
| Ref. | P/MPa | Teq−ref/K | /wt% | N a | T eq−cal/K | MaxAE b/K | Max RE c/% | AARD d/% | T eq−cal/K | MaxAE b/K | MaxRE c/% | AARD d/% | T eq−cal/K | MaxAE b/K | MaxRE c/% | AARD d/% |
|---|---|---|---|---|---|---|---|---|---|---|---|---|---|---|---|---|
| Method 1 | Method 2 | Method 3 | ||||||||||||||
| Pure water | ||||||||||||||||
| [16] | 0.974~3.85 | 270.34~282.16 | - | 10 | 270.94~282.35 | 0.60 | 0.222 | 0.084 | 270.94~282.34 | 0.60 | 0.222 | 0.070 | 270.93~282.16 | 0.59 | 0.218 | 0.060 |
| [17] | 1.31~12.87 | 273.6~283.6 | - | 13 | 273.6~284.19 | 0.80 | 0.283 | 0.106 | 273.6~284.19 | 0.68 | 0.240 | 0.100 | 273.59~284 | 0.58 | 0.205 | 0.082 |
| [19] | 1.5~3.5 | 274.76~281.46 | - | 4 | 274.74~281.64 | 0.30 | 0.107 | 0.054 | 274.75~281.66 | 0.28 | 0.100 | 0.052 | 274.76~281.56 | 0.19 | 0.068 | 0.027 |
| [20] | 1.34~2.52 | 273.75~279.04 | - | 4 | 273.73~279.13 | 0.10 | 0.036 | 0.026 | 273.73~279.12 | 0.09 | 0.032 | 0.018 | 273.73~279.11 | 0.07 | 0.025 | 0.009 |
| [21] | 1.616~4.452 | 275.65~283.25 | - | 11 | 275.45~283.24 | −0.32 | −0.115 | 0.040 | 275.45~283.25 | −0.31 | −0.111 | 0.037 | 275.42~283.03 | −0.31 | −0.111 | 0.057 |
| [22] | 0.825~1.708 | 269.45~275.75 | - | 10 | 269.45~275.94 | 0.19 | 0.069 | 0.011 | 269.43~275.93 | 0.18 | 0.065 | 0.010 | 269.45~275.85 | −0.12 | −0.044 | 0.010 |
| [23] | 2.048~4.02 | 277.5~282.5 | - | 3 | 277.49~282.59 | 0.09 | 0.032 | 0.022 | 277.49~282.6 | 0.10 | 0.035 | 0.025 | 277.39~282.48 | −0.11 | −0.040 | 0.017 |
| [24] | 1.42~4.37 | 274.3~282.9 | - | 9 | 274.29~283.19 | 0.29 | 0.103 | 0.046 | 274.29~283.1 | 0.20 | 0.071 | 0.038 | 274.3~282.99 | 0.09 | 0.032 | 0.017 |
| [25] | 1.66~4.03 | 274.02~280.12 | - | 12 | 275.7~282.64 | 3.78 | 1.368 | 0.805 | 275.6~282.64 | 3.69 | 1.336 | 0.792 | 275.62~282.44 | 3.59 | 1.299 | 0.759 |
| [26] | 1.81~3.83 | 276.45~282.05 | - | 7 | 276.44~282.34 | 0.29 | 0.103 | 0.052 | 276.44~282.23 | 0.19 | 0.067 | 0.039 | 276.35~282.15 | 0.10 | 0.036 | 0.018 |
| [27] | 1.04~4.509 | 271.6~283.2 | - | 44 | 271.49~283.38 | −0.21 | −0.077 | 0.039 | 271.49~283.29 | −0.22 | −0.081 | 0.039 | 271.48~283.09 | −0.22 | −0.080 | 0.031 |
| [28] | 1.338~8.93 | 273.36~283.59 | - | 40 | 273.75~283.88 | 2.39 | 0.850 | 0.266 | 273.76~283.79 | 2.29 | 0.815 | 0.263 | 273.75~283.61 | 2.08 | 0.740 | 0.236 |
| [29] | 4.5~37.2 | 283.2~286.2 | - | 6 | 283.28~286.28 | 0.20 | 0.071 | 0.032 | 283.29~286.3 | 0.10 | 0.035 | 0.021 | 283.09~286.05 | −0.25 | −0.088 | 0.045 |
| [30] | 1.04162~4.49883 | 271.67~283.15 | - | 7 | 271.56~283.34 | 0.20 | 0.071 | 0.042 | 271.54~283.24 | −0.13 | −0.048 | 0.032 | 271.56~283.14 | −0.12 | −0.043 | 0.025 |
| [31] | 1.24~3.48 | 273.5~281.4 | - | 6 | 273.09~281.67 | −0.41 | −0.150 | 0.063 | 273.1~281.58 | −0.40 | −0.146 | 0.057 | 273.09~281.5 | −0.41 | −0.150 | 0.039 |
| [32] | 1.51~3.9 | 275.12~282.41 | - | 9 | 274.8~282.4 | −0.51 | −0.184 | 0.077 | 274.81~282.41 | −0.44 | −0.159 | 0.076 | 274.82~282.29 | −0.52 | −0.188 | 0.107 |
| [33] | 1.47~4.15 | 274.42~282.83 | - | 5 | 274.61~282.82 | 0.19 | 0.069 | 0.025 | 274.61~282.82 | 0.19 | 0.069 | 0.024 | 274.6~282.62 | −0.21 | −0.075 | 0.059 |
| [34] | 1.542~4.155 | 275.05~282.65 | - | 6 | 275.05~282.84 | 0.29 | 0.104 | 0.039 | 275.04~282.83 | 0.29 | 0.104 | 0.035 | 275.02~282.65 | 0.19 | 0.068 | 0.026 |
| [35] | 1.747~2.023 | 276.15~277.15 | - | 6 | 276.13~277.35 | 0.20 | 0.072 | 0.026 | 276.13~277.34 | 0.19 | 0.069 | 0.025 | 276.04~277.24 | −0.11 | −0.040 | 0.020 |
| [11] | 1.33~3.23 | 274.15~281.15 | - | 8 | 273.75~281.13 | −0.40 | −0.146 | 0.057 | 273.73~281.03 | −0.42 | −0.153 | 0.066 | 273.73~280.93 | −0.42 | −0.153 | 0.077 |
| Total | 0.825~37.2 | 269.45~286.2 | - | 220 | 269.45~286.28 | 3.78 | 1.368 | 0.243 | 269.43~286.30 | 3.69 | 1.336 | 0.245 | 269.45~286.05 | 3.59 | 1.300 | 0.243 |
| NaCl aqueous solution | ||||||||||||||||
| [38] | 1.436~3.919 | 272.15~279.15 | 2~15 | 21 | 273.44~281.24 | 5.79 | 2.128 | 0.836 | 266.83~278.43 | −7.12 | −2.592 | 0.947 | 272.33~279.23 | −0.82 | −0.300 | 0.086 |
| [30] | 1.164~3.983 | 271.67~281.15 | 2.5~7.5 | 16 | 271.97~282.05 | 2.49 | 0.892 | 0.417 | 269.14~280.92 | −2.53 | −0.931 | 0.473 | 271.36~281.43 | 0.48 | 0.172 | 0.07 |
| [37] | 8.500~25.000 | 278.09~282.51 | 5~10 | 8 | 282.37~284.21 | 4.28 | 1.539 | 1.057 | 274.77~281.20 | −3.93 | −1.406 | 0.83 | 278.58~282.50 | 0.49 | 0.176 | 0.105 |
| [42] | 1.517~3.227 | 263.2~276.1 | 10~20 | 8 | 271.99~279.69 | 9.99 | 3.717 | 2.357 | 255.57~273.57 | −9.37 | −3.486 | 2.038 | 263.89~276.68 | 1.39 | 0.517 | 0.245 |
| [41] | 1.866~60.14 | 274.84~284.6 | 4.3 | 14 | 275.85~284.60 | 6.49 | 2.361 | 0.927 | 273.76~282.18 | −6.01 | −2.148 | 0.904 | 274.86~283.20 | 5.39 | 1.961 | 0.813 |
| [31] | 1.310~3.590 | 271.4~279.4 | 5 | 5 | 275.99~286.00 | 1.80 | 0.644 | 0.543 | 273.59~283.17 | −1.43 | −0.502 | 0.364 | 274.89~284.08 | 0.59 | 0.211 | 0.122 |
| [32] | 0.800~4.300 | 267.55~282.9 | 5~10 | 20 | 267.94~281.98 | 3.49 | 1.259 | 0.635 | 265.42~277.89 | −8.43 | −2.980 | 0.918 | 266.84~279.09 | −4.52 | −1.598 | 0.179 |
| [20] | 1.162~3.907 | 263.29~280.92 | 3~20.03 | 25 | 270.42~282.01 | 10.38 | 3.890 | 1.173 | 256.04~280.78 | −7.54 | −2.826 | 0.927 | 264.39~281.31 | 1.98 | 0.746 | 0.178 |
| [43] | 1.189~2.150 | 258.15~262.15 | 25 | 5 | 270.17~275.33 | 13.18 | 5.028 | 3.66 | 249.21~262.65 | −11.93 | −4.551 | 3.449 | 260.72~268.18 | 1.29 | 0.492 | 0.234 |
| [34] | 1.151~3.701 | 267.45~277.35 | 10~15.2 | 13 | 269.43~280.85 | 11.67 | 4.503 | 1.639 | 246.80~274.42 | −11.35 | −4.397 | 2.038 | 258.11~277.83 | −1.31 | −0.490 | 0.203 |
| [40] | 1.283~3.617 | 271.85~279.05 | 3.5~10.5 | 16 | 272.54~280.25 | 4.58 | 1.682 | 0.89 | 265.73~278.71 | −7.23 | −2.634 | 1.051 | 271.44~279.44 | −3.22 | −1.161 | 0.253 |
| [35] | 1.931~2.498 | 276.15~277.15 | 2~4 | 12 | 276.55~280.65 | 2.20 | 0.790 | 0.297 | 273.13~276.95 | −5.92 | −2.121 | 0.46 | 276.15~277.53 | −2.71 | −0.971 | 0.154 |
| [39] | 1.370~3.730 | 271.8~280.2 | 5 | 4 | 278.34~281.50 | 1.30 | 0.464 | 0.439 | 276.42~279.08 | −1.21 | −0.434 | 0.331 | 277.43~280.28 | 0.30 | 0.108 | 0.06 |
| [36] | 0.703~29.316 | 254.75~280.6 | 5~25 | 29 | 264.34~282.40 | 19.47 | 7.438 | 2.353 | 244.90~279.78 | −17.44 | −6.465 | 2.582 | 254.83~281.08 | −3.43 | −1.272 | 0.251 |
| [11] | 1.450~3.830 | 274.15~281.15 | 3~8 | 18 | 274.65~282.01 | 16.97 | 6.405 | 1.114 | 246.15~280.63 | −19.60 | −7.375 | 1.127 | 263.33~281.23 | −2.42 | −0.911 | 0.177 |
| [44] | 0.98~3.82 | 266.15~279.15 | 3.6~10 | 17 | 268.84~281.04 | 3.68 | 1.331 | 0.792 | 262.75~279.05 | −3.40 | −1.277 | −0.588 | 267.75~279.85 | 1.6 | 0.601 | 0.218 |
| Total | 0.703~30.615 | 254.75~284.6 | 2~25 | 231 | 264.34~286.00 | 19.47 | 7.438 | 1.190 | 244.90~283.17 | −19.60 | −7.375 | 1.095 | 254.83~284.08 | 5.39 | 1.961 | 0.210 |
Appendix B
References
- Raza, S.; Ghasali, E.; Raza, M.; Chen, C.; Li, B.S.; Orooji, Y.; Lin, H.J.; Karaman, C.; Maleh, H.K.; Erk, N. Advances in technology and utilization of natural resources for achieving carbon neutrality and a sustainable solution to neutral environment. Environ. Res. 2023, 220, 115135. [Google Scholar] [CrossRef] [PubMed]
- Karimi, M.; Shirzad, M.; Silva, J.A.C.; Rodrigues, A.E. Carbon dioxide separation and capture by adsorption: A review. Environ. Chem. Lett. 2023, 21, 2041–2084. [Google Scholar] [CrossRef] [PubMed]
- Zhao, K.Y.; Jia, C.Q.; Li, Z.H.; Du, X.Z.; Wang, Y.B.; Li, J.J.; Yao, Z.C.; Yao, J. Recent Advances and Future Perspectives in Carbon Capture, Transportation, Utilization, and Storage (CCTUS) Technologies: A Comprehensive Review. Fuel 2023, 351, 128913. [Google Scholar] [CrossRef]
- Deguchi, S.; Degaki, H.; Taniguchi, I.; Koga, T. Deep-Sea-Inspired Chemistry: A Hitchhiker’s Guide to the Bottom of the Ocean for Chemists. Langmuir 2023, 39, 7987–7994. [Google Scholar] [CrossRef]
- Bachu, S. CO2 storage in geological media: Role, means, status and barriers to deployment. Prog. Energy Combust. 2008, 34, 254–273. [Google Scholar] [CrossRef]
- Teng, Y.H.; Zhang, D.X. Long-term viability of carbon sequestration in deep-sea sediments. Sci. Adv. 2018, 4, eaao6588. [Google Scholar] [CrossRef] [PubMed]
- Song, Y.; Jian, W.; Zhang, Y.; Yang, M.; Zhao, J.; Liu, W.; Liu, Y.; Shen, Y. Density Measurement and PC-SAFT/tPC-PSAFT Modeling of the CO2 + H2O System over a Wide Temperature Range. J. Chem. Eng. Data 2014, 59, 1400–1410. [Google Scholar] [CrossRef]
- Cao, X.W.; Wang, H.C.; Yang, K.R.; Wu, S.C.; Chen, Q.; Bian, J. Hydrate-based CO2 sequestration technology: Feasibilities, mechanisms, influencing factors, and applications. J. Petrol. Sci. Eng. 2022, 219, 111121. [Google Scholar] [CrossRef]
- Wang, X.L.; Zhang, F.Y.; Lipinski, W. Research progress and challenges in hydrate-based carbon dioxide capture applications. Appl. Energy 2020, 269, 114928. [Google Scholar] [CrossRef]
- Li, Y.; Yin, Z.; Lu, H.; Xu, C.; Liu, X.; Huang, H.; Chen, D.; Linga, P. Evaluation of amino acid L-leucine as a kinetic promoter for CO2 sequestration as hydrate: A kinetic and morphological study. J. Environ. Chem. Eng. 2023, 11, 111363. [Google Scholar] [CrossRef]
- Wang, X.H.; Xu, X.J.; Cai, J.; Zheng, H.X.; Chen, Y.X.; Pang, W.X.; Yu, Y.; Sun, C.Y.; Chen, G.J. CO2 concentration in aqueous solution from gas-liquid equilibrium system to gas-liquid-hydrate coexistence system. Gas. Sci. Eng. 2023, 115, 205024. [Google Scholar] [CrossRef]
- Yang, S.O.; Yang, I.M.; Kim, Y.S.; Lee, C.S. Measurement and prediction of phase equilibria for water+CO2 in hydrate forming conditions. Fluid. Phase Equilibria 2000, 175, 75–89. [Google Scholar] [CrossRef]
- Uchida, T.; Takagi, A.; Mae, S.; Kawabata, J. Dissolution mechanisms of CO2 molecules in water containing CO2 hydrates. Energy Convers. Manage 1997, 38, S307–S312. [Google Scholar] [CrossRef]
- Giovannetti, R.; Gambelli, A.M.; Castellani, B.; Rossi, A.; Minicucci, M.; Zannotti, M.; Li, Y.; Rossi, F. May sediments affect the inhibiting properties of NaCl on CH4 and CO2 hydrates formation? an experimental report. J. Mol. Liq. 2022, 359, 119300. [Google Scholar] [CrossRef]
- Holzammer, C.; Finckenstein, A.; Will, S.; Braeuer, A.S. How sodium chloride salt inhibits the formation of CO2 gas hydrates. J. Phys. Chem. B 2016, 120, 2452–2459. [Google Scholar] [CrossRef]
- Wendland, M.; Hasse, H.; Maurer, G. Experimental pressure-temperature data on three- and four-phase equilibria of fluid, hydrate, and ice phases in the system carbon dioxide-water. J. Chem. Eng. Data 1999, 44, 901–906. [Google Scholar] [CrossRef]
- Fan, S.-S.; Guo, T.-M. Hydrate Formation of CO2-Rich Binary and Quaternary Gas Mixtures in Aqueous Sodium Chloride Solutions. J. Chem. Eng. Data 1999, 44, 829–832. [Google Scholar] [CrossRef]
- Nakano, S.; Moritoki, M.; Ohgaki, K. High-Pressure Phase Equilibrium and Raman Microprobe Spectroscopic Studies on the CO2 Hydrate System. J. Chem. Eng. Data 1998, 43, 807–810. [Google Scholar] [CrossRef]
- Seo, Y.T.; Lee, H.; Yoon, J.H. Hydrate phase equilibria of the carbon dioxide, methane, and water system. J. Chem. Eng. Data 2001, 46, 381–384. [Google Scholar] [CrossRef]
- Dholabhai, P.D.; Kalogerakis, N.; Bishnoi, P.R. Equilibrium Conditions for Carbon-Dioxide Hydrate Formation in Aqueous-Electrolyte Solutions. J. Chem. Eng. Data 1993, 38, 650–654. [Google Scholar] [CrossRef]
- Dai, M.-L.; Sun, Z.-G.; Li, J.; Li, C.-M.; Huang, H.-F. Effect of n-dodecane on equilibrium dissociation conditions of carbon dioxide hydrate. J. Chem. Thermodyn. 2020, 148, 106144. [Google Scholar] [CrossRef]
- Nema, Y.; Ohmura, R.; Senaha, I.; Yasuda, K. Quadruple point determination in carbon dioxide hydrate forming system. Fluid. Phase Equilibria 2017, 441, 49–53. [Google Scholar] [CrossRef]
- Mohammadi, A.H.; Anderson, R.; Tohidi, B. Carbon monoxide clathrate hydrates: Equilibrium data and thermodynamic modeling. AIChE J. 2005, 51, 2825–2833. [Google Scholar] [CrossRef]
- Adisasmito, S.; Frank, R.J.; Sloan, E.D. Hydrates of Carbon-Dioxide and Methane Mixtures. J. Chem. Eng. Data 1991, 36, 68–71. [Google Scholar] [CrossRef]
- Bruusgaard, H.; Beltrán, J.G.; Servio, P. Solubility measurements for the CH4 + CO2 + H2O system under hydrate–liquid–vapor equilibrium. Fluid. Phase Equilibria 2010, 296, 106–109. [Google Scholar] [CrossRef]
- Wang, M.; Sun, Z.G.; Qiu, X.H.; Zhu, M.G.; Li, C.H.; Zhang, A.J.; Li, J.; Li, C.M.; Huang, H.F. Hydrate Dissociation Equilibrium Conditions for Carbon Dioxide plus Tetrahydrofuran. J. Chem. Eng. Data 2017, 62, 812–815. [Google Scholar] [CrossRef]
- Vlahakis, J.G. The Growth Rate of Ice Crystals: Properties of Carbon Dioxide Hydrate. A Review of Properties of 51 Gas Hydrates; Research and Development Progress Report 830; Syracuse University: Syracuse, NY, USA, 1972. [Google Scholar] [CrossRef]
- Ohgaki, K.; Makihara, Y.; Takano, K. Formation of CO2 Hydrate in Pure and Sea Waters. J. Chem. Eng. Jpn. 1993, 26, 558–564. [Google Scholar] [CrossRef]
- Takenouchi, S.; Kennedy, G.C. Solubility of Carbon Dioxide in NaCl Solutions at High Temperatures and Pressures. Am. J. Sci. 1965, 263, 445. [Google Scholar] [CrossRef]
- Bozzo, A.T.; Hsiao-Sheng, C.; Kass, J.R.; Barduhn, A.J. The properties of the hydrates of chlorine and carbon dioxide. Desalination 1975, 16, 303–320. [Google Scholar] [CrossRef]
- Croeser, N.; Babaee, S.; Naidoo, P.; Ramjugernath, D. Investigation into the use of gas hydrate technology for the treatment of vinasse. Fluid. Phase Equilibria 2019, 492, 67–77. [Google Scholar] [CrossRef]
- Sabil, K.M.; Witkamp, G.-J.; Peters, C.J. Phase equilibria of mixed carbon dioxide and tetrahydrofuran hydrates in sodium chloride aqueous solutions. Fluid. Phase Equilibria 2009, 284, 38–43. [Google Scholar] [CrossRef]
- Zha, L.; Liang, D.-Q.; Li, D.-L. Phase equilibria of CO2 hydrate in NaCl–MgCl2 aqueous solutions. J. Chem. Thermodyn. 2012, 55, 110–114. [Google Scholar] [CrossRef]
- Englezos, P.; Hall, S. Phase equilibrium data on carbon dioxide hydrate in the presence of electrolytes, water soluble polymers and montmorillonite. Can. J. Chem. Eng. 2009, 72, 887–893. [Google Scholar] [CrossRef]
- Sun, D.; Ripmeester, J.; Englezos, P. Phase Equilibria for the CO2/CH4/N2/H2O System in the Hydrate Region under Conditions Relevant to Storage of CO2 in Depleted Natural Gas Reservoirs. J. Chem. Eng. Data 2016, 61, 4061–4067. [Google Scholar] [CrossRef]
- Burgass, R.; Chapoy, A.; Askvik, K.M.; Neeraas, B.O.; Li, X.Y. CO2 hydrate formation in NaCl systems and undersaturated aqueous solutions. Sci. Technol. Energy Transit. 2023, 78, 8. [Google Scholar] [CrossRef]
- Cordeiro, J.C., Jr.; Marcelino Neto, M.A.; Morales, R.E.M.; Sum, A.K. Phase Equilibrium of Carbon Dioxide Hydrates Inhibited with MEG and NaCl above the Upper Quadruple Point. J. Chem. Eng. Data 2020, 65, 280–286. [Google Scholar] [CrossRef]
- Guembaroski, A.Z.; Marcelino Neto, M.A.; Bertoldi, D.; Morales, R.E.M.; Sum, A.K. Phase Behavior of Carbon Dioxide Hydrates: A Comparison of Inhibition Between Sodium Chloride and Ethanol. J. Chem. Eng. Data 2017, 62, 3445–3451. [Google Scholar] [CrossRef]
- Mohammadi, A.H.; Afzal, W.; Richon, D. Gas hydrates of methane, ethane, propane, and carbon dioxide in the presence of single NaCl, KCl, and CaCl2 aqueous solutions: Experimental measurements and predictions of dissociation conditions. J. Chem. Thermodyn. 2008, 40, 1693–1697. [Google Scholar] [CrossRef]
- Nakane, R.; Gima, E.; Ohmura, R.; Senaha, I.; Yasuda, K. Phase equilibrium condition measurements in carbon dioxide hydrate forming system coexisting with sodium chloride aqueous solutions. J. Chem. Thermodyn. 2019, 130, 192–197. [Google Scholar] [CrossRef]
- Ruffine, L.; Trusler, J.P.M. Phase behaviour of mixed-gas hydrate systems containing carbon dioxide. J. Chem. Thermodyn. 2010, 42, 605–611. [Google Scholar] [CrossRef]
- Tohidi, B.; Danesh, A.; Todd, A.C.; Burgass, R.W. Hydrate-free zone for synthetic and real reservoir fluids in the presence of saline water. Chem. Eng. Sci. 1997, 52, 3257–3263. [Google Scholar] [CrossRef]
- Vaessen, R.J.C.; van der Ham, F.; Witkamp, G.J. Eutectic Freeze Crystallization Using CO2 Clathrates. Ann. N. Y. Acad. Sci. 2006, 912, 483–495. [Google Scholar] [CrossRef]
- Li, Y.; Chen, J.; Gambelli, A.M.; Zhao, X.; Gao, Y.; Rossi, F.; Mei, S. In situ experimental study on the effect of mixed inhibitors on the phase equilibrium of carbon dioxide hydrate. Chem. Eng. Sci. 2022, 248, 117230. [Google Scholar] [CrossRef]
- Chapoy, A.; Mohammadi, A.H.; Chareton, A.; Tohidi, B.; Richon, D. Measurement and modeling of gas solubility and literature review of the properties for the carbon dioxide-water system. Ind. Eng. Chem. Res. 2004, 43, 1794–1802. [Google Scholar] [CrossRef]
- Valtz, A.; Chapoy, A.; Coquelet, C.; Paricaud, P.; Richon, D. Vapour-liquid equilibria in the carbon dioxide-water system, measurement and modelling from 278.2 to 318.2K. Fluid. Phase Equilibria 2004, 226, 333–344. [Google Scholar] [CrossRef]
- Stewart, P.B.; Munjal, P. Solubility of Carbon Dioxide in Pure Water, Synthetic Sea Water, and Synthetic Sea Water Concentrates at 5 Degrees to 2k Degrees C and 10-Atm to 45-Atm Pressure. J. Chem. Eng. Data 1970, 15, 67–71. [Google Scholar] [CrossRef]
- Servio, P.; Englezos, P. Effect of temperature and pressure on the solubility of carbon dioxide in water in the presence of gas hydrate. Fluid. Phase Equilibria 2001, 190, 127–134. [Google Scholar] [CrossRef]
- Morrison, T.J. The Salting-out of Non-Electrolytes. Part 1. The Effect of Ionic Size, Ionic Charge, and Temperature. J. Chem. Soc. 1952, 729, 3814–3818. [Google Scholar] [CrossRef]
- Wiebe, R.; Gaddy, V.L. The solubility of carbon dioxide in water at various temperatures from 12 to 40 °C and at pressures to 500 atmospheres: Critical phenomena. J. Am. Chem. Soc. 1940, 62, 815–817. [Google Scholar] [CrossRef]
- Hou, S.X.; Maitland, G.C.; Trusler, J.P.M. Measurement and modeling of the phase behavior of the (carbon dioxide plus water) mixture at temperatures from 298.15 K to 448.15 K. J. Supercrit. Fluid. 2013, 73, 87–96. [Google Scholar] [CrossRef]
- Guo, H.; Chen, Y.; Hu, Q.; Lu, W.; Ou, W.; Geng, L. Quantitative Raman spectroscopic investigation of geo-fluids high-pressure phase equilibria: Part I. Accurate calibration and determination of CO2 solubility in water from 273.15 to 573.15 K and from 10 to 120 MPa. Fluid. Phase Equilibria 2014, 382, 70–79. [Google Scholar] [CrossRef]
- Ricaurte, M.; Torré, J.-P.; Asbai, A.; Broseta, D.; Dicharry, C. Experimental Data, Modeling, and Correlation of Carbon Dioxide Solubility in Aqueous Solutions Containing Low Concentrations of Clathrate Hydrate Promoters: Application to CO2–CH4 Gas Mixtures. Ind. Eng. Chem. Res. 2012, 51, 3157–3169. [Google Scholar] [CrossRef]
- Carvalho, P.J.; Pereira, L.M.C.; Gonçalves, N.P.F.; Queimada, A.J.; Coutinho, J.A.P. Carbon dioxide solubility in aqueous solutions of NaCl: Measurements and modeling with electrolyte equations of state. Fluid. Phase Equilibria 2015, 388, 100–106. [Google Scholar] [CrossRef]
- Aya, I.; Yamane, K.; Nariai, H. Solubility of CO2 and density of CO2 hydrate at 30 MPa. Energy 1997, 22, 263–271. [Google Scholar] [CrossRef]
- Someya, S.; Bando, S.; Chen, B.; Song, Y.; Nishio, M. Measurement of CO2 solubility in pure water and the pressure effect on it in the presence of clathrate hydrate. Int. J. Heat. Mass. Transf. 2005, 48, 2503–2507. [Google Scholar] [CrossRef]
- Kim, Y.S.; Lim, B.D.; Lee, J.E.; Lee, C.S. Solubilities of carbon dioxide, methane, and ethane in sodium chloride solution containing gas hydrate. J. Chem. Eng. Data 2008, 53, 1351–1354. [Google Scholar] [CrossRef]
- Zhang, Y.; Holder, G.D.; Warzinski, R.P. Phase equilibrium in two-phase, water-rich-liquid, hydrate systems: Experiment and theory. Ind. Eng. Chem. Res. 2008, 47, 459–469. [Google Scholar] [CrossRef]
- Teng, H.; Yamasaki, A.; Chun, M.K.; Lee, H. Solubility of liquid CO2 in water at temperatures from 278 K to 293 K and pressures from 6.44 MPa to 29.49 MPa and densities of the corresponding aqueous solutions. J. Chem. Thermodyn. 1997, 29, 1301–1310. [Google Scholar] [CrossRef]
- Sun, Q.; Tian, H.; Guo, X.; Liu, A.; Yang, L. Solubility of CO2 in water and NaCl solution in equilibrium with hydrate. Part II: Model calculation. Can. J. Chem. Eng. 2017, 96, 620–624. [Google Scholar] [CrossRef]
- Geng, L.; Qu, K.; Lu, W.; Jiang, L.; Chou, I.M. In situ Raman spectroscopic study of the pressure effect on the concentration of CO2 in water at hydrate-liquid water equilibrium up to 900 bar. Fluid. Phase Equilibria 2017, 438, 37–43. [Google Scholar] [CrossRef]
- Sun, Q.; Tian, H.; Li, Z.; Guo, X.; Liu, A.; Yang, L. Solubility of CO2 in water and NaCl solution in equilibrium with hydrate. Part I: Experimental measurement. Fluid. Phase Equilibria 2016, 409, 131–135. [Google Scholar] [CrossRef]
- Spycher, N.; Pruess, K.; Ennis-King, J. CO2-H2O mixtures in the geological sequestration of CO2. I. Assessment and calculation of mutual solubilities from 12 to 100 °C and up to 600 bar. Geochim. Cosmochim. Acta 2003, 67, 3015–3031. [Google Scholar] [CrossRef]
- Diamond, L.W.; Akinfiev, N.N. Solubility of CO2 in water from −1.5 to 100 °C and from 0.1 to 100 MPa: Evaluation of literature data and thermodynamic modelling. Fluid. Phase Equilibria 2003, 208, 265–290. [Google Scholar] [CrossRef]
- Akinfiev, N.N.; Diamond, L.W. Thermodynamic model of aqueous CO2–H2O–NaCl solutions from −22 to 100 °C and from 0.1 to 100 MPa. Fluid. Phase Equilibria 2010, 295, 104–124. [Google Scholar] [CrossRef]
- Raji, M.; Dashti, A.; Ghafoori, S.; Bahadori, A.; Chau, K.-W. Estimating mutual solubility of a CO2 in NaCl aqueous solution system using connectionist approaches. Petrol. Sci. Technol. 2022, 40, 2429–2449. [Google Scholar] [CrossRef]
- Mao, S.; Zhang, D.; Li, Y.; Liu, N. An improved model for calculating CO2 solubility in aqueous NaCl solutions and the application to CO2–H2O–NaCl fluid inclusions. Chem. Geol. 2013, 347, 43–58. [Google Scholar] [CrossRef]
- Chang, Y.-B.; Coats, B.K.; Nolen, J.S. A Compositional Model for CO2 Floods Including CO2 Solubility in Water. SPE Reserv. Eval. Eng. 1998, 1, 155–160. [Google Scholar] [CrossRef]
- Spycher, N.; Pruess, K. CO2-H2O mixtures in the geological sequestration of CO2. II. Partitioning in chloride brines at 12–100 °C and up to 600 bar. Geochim. Cosmochim. Acta 2005, 69, 3309–3320. [Google Scholar] [CrossRef]
- Spycher, N.; Pruess, K. A Phase-Partitioning Model for CO2–Brine Mixtures at Elevated Temperatures and Pressures: Application to CO2-Enhanced Geothermal Systems. Transp. Porous Med. 2009, 82, 173–196. [Google Scholar] [CrossRef]
- Duan, Z.; Sun, R. An improved model calculating CO2 solubility in pure water and aqueous NaCl solutions from 273 to 533 K and from 0 to 2000 bar. Chem. Geol. 2003, 193, 257–271. [Google Scholar] [CrossRef]
- Chapoy, A.; Haghighi, H.; Burgass, R.; Tohidi, B. On the phase behaviour of the (carbon dioxide + water) systems at low temperatures: Experimental and modelling. J. Chem. Thermodyn. 2012, 47, 6–12. [Google Scholar] [CrossRef]
- Burgass, R.; Chapoy, A.; Duchet-Suchaux, P.; Tohidi, B. Experimental water content measurements of carbon dioxide in equilibrium with hydrates at (223.15 to 263.15)K and (1.0 to 10.0)MPa. J. Chem. Thermodyn. 2014, 69, 1–5. [Google Scholar] [CrossRef]
- Chapoy, A.; Nazeri, M.; Kapateh, M.; Burgass, R.; Coquelet, C.; Tohidi, B. Effect of impurities on thermophysical properties and phase behaviour of a CO2-rich system in CCS. Int. J. Greenh. Gas Control. 2013, 19, 92–100. [Google Scholar] [CrossRef]
- Di, M.; Sun, R.; Geng, L.; Lu, W. An Accurate Model to Calculate CO2 Solubility in Pure Water and in Seawater at Hydrate–Liquid Water Two-Phase Equilibrium. Minerals 2021, 11, 393. [Google Scholar] [CrossRef]
- Duan, Z.; Sun, R.; Zhu, C.; Chou, I.M. An improved model for the calculation of CO2 solubility in aqueous solutions containing Na+, K+, Ca2+, Mg2+, Cl−, and SO42−. Mar. Chem. 2006, 98, 131–139. [Google Scholar] [CrossRef]
- Pabsch, D.; Held, C.; Sadowski, G. Modeling the CO2 Solubility in Aqueous Electrolyte Solutions Using ePC-SAFT. J. Chem. Eng. Data 2020, 65, 5768–5777. [Google Scholar] [CrossRef]
- Jeon, P.R.; Lee, C.H. Artificial neural network modelling for solubility of carbon dioxide in various aqueous solutions from pure water to brine. J. CO2 Util. 2021, 47, 101500. [Google Scholar] [CrossRef]
- Bertini, M.; Fiaschi, D.; Manfrida, G.; Niknam, P.H.; Talluri, L. Evaluation of the property methods for pure and mixture of CO2 for power cycles analysis. Energy Convers. Manage 2021, 245, 114568. [Google Scholar] [CrossRef]
- Zhao, C.; Lu, D.; Chen, K.; Chi, Y.; Liu, S.; Yuan, L.; Zhang, Y.; Song, Y. Review of Density Measurements and Predictions of CO2–Alkane Solutions for Enhancing Oil Recovery. Energy Fuels 2021, 35, 2914–2935. [Google Scholar] [CrossRef]
- 4—Equations of State. In Developments in Petroleum Science; Danesh, A., Ed.; Elsevier: Amsterdam, The Netherlands, 1998; Volume 47, pp. 129–166. [Google Scholar]
- Smith, R.; Inomata, H.; Peters, C. Chapter 6—Equations of State and Formulations for Mixtures. In Supercritical Fluid Science and Technology; Smith, R., Inomata, H., Peters, C., Eds.; Elsevier: Amsterdam, The Netherlands, 2013; Volume 4, pp. 333–480. [Google Scholar]
- Economou, I. Statistical Associating Fluid Theory: A Successful Model for the Calculation of Thermodynamic and Phase Equilibrium Properties of Complex Fluid Mixtures. Ind. Eng. Chem. Res. 2001, 41, 953–962. [Google Scholar] [CrossRef]
- Starling, K.E. Thermo Data Refined for LPG. Pt. 1. Equation of State and Computer Prediction. Hydrocarb. Process 1971, 50, 101. [Google Scholar]
- Starling, K.E.; Batdorf, P.N.; Kwok, Y.C. Thermo Data Refined for LPG. Pt. 12. Carbon-Dioxide. Hydrocarb. Process 1972, 51, 86. [Google Scholar]
- Duroudier, J.-P. 2—Equations of State and Fugacities. In Thermodynamics; Duroudier, J.-P., Ed.; Elsevier: Amsterdam, The Netherlands, 2016; pp. 51–106. [Google Scholar]
- Riaz, A.; Qyyum, M.A.; Hussain, A.; Islam, M.; Choe, H.; Lee, M. Parametric Analysis of Ortho-to-Para Conversion in Hydrogen Liquefaction. In Computer Aided Chemical Engineering; Yamashita, Y., Kano, M., Eds.; Elsevier: Amsterdam, The Netherlands, 2022; Volume 49, pp. 2017–2022. [Google Scholar]
- Starling, K.E.; Han, M.S. Thermo Data Refined for LPG. Pt. 14. Mixtures. Hydrocarb. Process 1972, 51, 129. [Google Scholar]
- Mills, M.B.; Wills, M.J.; Bhirud, V.L. The Calculation of Density by the Bwrs Equation of State in Process Simulation Contexts. AIChE J. 1980, 26, 902–910. [Google Scholar] [CrossRef]
- Li, Y.H.; Feng, Y.H.; Wang, W.; Zhong, J.B.; Zhang, D.D. Application of BWRS equation of state for calculation of fluid density and viscosity. Petrol. Sci. Technol. 2022, 40, 1423–1436. [Google Scholar] [CrossRef]
- Rackett, H.G. Equation of State for Saturated Liquids. J. Chem. Eng. Data 1970, 15, 514. [Google Scholar] [CrossRef]
- Starling, K.E.; Han, M.S. Thermo Data Refined for LPG. Pt. 15. Industrial Applications. Hydrocarb. Process 1972, 51, 107. [Google Scholar]
- Zudkevitch, D.; Joffe, J. Correlation and Prediction of Vapor-Liquid Equilibria with Redlich-Kwong Equation of State. AIChE J. 1970, 16, 112. [Google Scholar] [CrossRef]
- Edmister, W.C. Applied Hydrocarbon Thermodynamics, Part 4: Compressibility Factors and Equations of State. Petroleum. Refiner. 1958, 37, 173–179. [Google Scholar]
- Rachford, H.H.; Rice, J.D. Procedure for Use of Electronic Digital Computers in Calculating Flash Vaporization Hydrocarbon Equilibrium. J. Pet. Technol. 1952, 195, 327–328. [Google Scholar] [CrossRef]
- Vanderwaals, J.H.; Platteeuw, J.C. Clathrate Solutions. Adv. Chem. Phys. 1959, 2, 1–57. [Google Scholar]
- Chen, G.J.; Guo, T.M. A new approach to gas hydrate modelling. Chem. Eng. J. 1998, 71, 145–151. [Google Scholar] [CrossRef]
- Parrish, W.R.; Prausnitz, J.M. Dissociation Pressures of Gas Hydrates Formed by Gas-Mixtures. Ind. Eng. Chem. Process. Des. Dev. 1972, 11, 26. [Google Scholar] [CrossRef]
- Du, Y.H.; Guo, T.M. Prediction of Hydrate Formation for Systems Containing Methanol. Chem. Eng. Sci. 1990, 45, 893–900. [Google Scholar] [CrossRef]
- Saito, S.; Marshall, D.R.; Kobayashi, R. Hydrates at High Pressures. 2. Application of Statistical Mechanics to the Study of the Hydrates of Methane, Argon, and Nitrogen. AIChE J. 1964, 10, 734–740. [Google Scholar] [CrossRef]
- Holder, G.D.; Corbin, G.; Papadopoulos, K.D. Thermodynamic and Molecular-Properties of Gas Hydrates from Mixtures Containing Methane, Argon, and Krypton. Ind. Eng. Chem. Fund. 1980, 19, 282–286. [Google Scholar] [CrossRef]
- Sun, R.; Duan, Z. Prediction of CH4 and CO2 hydrate phase equilibrium and cage occupancy from ab initio intermolecular potentials. Geochim. Cosmochim. Acta 2005, 69, 4411–4424. [Google Scholar] [CrossRef]
- Henley, H.; Thomas, E.; Lucia, A. Density and phase equilibrium for ice and structure I hydrates using the Gibbs-Helmholtz constrained equation of state. Chem. Eng. Res. Des. 2014, 92, 2977–2991. [Google Scholar] [CrossRef]
- Li, Z.; Dong, M.; Li, S.; Dai, L. Densities and Solubilities for Binary Systems of Carbon Dioxide + Water and Carbon Dioxide + Brine at 59 °C and Pressures to 29 MPa. J. Chem. Eng. Data 2004, 49, 1026–1031. [Google Scholar] [CrossRef]

| Ref. | T/K | P/MPa | System |
|---|---|---|---|
| [45] | 274.14~351.31 | 0.1~12 | Pure water |
| [46] | 278.2~318.2 | 0.1~8 | Pure water |
| [51] | 298.15~448.15 | 0.1~18 | Pure water |
| [53] | 274~303 | 1~4 | Pure water |
| [63] | 285.15~373.15 | 0.1~60 | Pure water |
| [64] | 271.65~373.15 | 0.1~100 | Pure water |
| [65] | 271.65~373.15 | 0.1~100 | NaCl aqueous solution |
| [66] | - | - | NaCl aqueous solution |
| [67] | 273.15~723.15 | 0.1~150 | NaCl aqueous solution |
| [68] | 285.37~373.15 | 0.1~68.948 | Pure water/NaCl aqueous solution |
| [69,70] | 285.15~573.15 | 0.1~60 | Pure water/NaCl aqueous solution |
| [71] | 273~533 | 0.1~200 | Pure water/NaCl aqueous solution |
| [54] | 363 | 0.1~13 | Pure water/NaCl aqueous solution |
| [36,72,73,74] | Above the critical temperature of CO2 and below 283.15 K | 0~50 | Pure water/NaCl aqueous solution |
| [75] | 274~300 | 0.1~100 | Pure water/Sea water |
| [76] | 273~533 | 0.1~200 | Pure water/Aqueous solution containing Na+, K+, Ca2+, Mg2+, Cl−, and SO42− |
| [77] | 298~423 | 0.1~40 | Pure water/NaCl, KCl, MgCl2, CaCl2, NaNO3, KNO3, Mg(NO3)2, and Na2CO3 aqueous solution |
| [78] | 273.15~473.65 | 0.092~71.231 | Pure water/NaCl, KCl, MgCl2, CaCl2, MgSO4, K2SO4, NaHCO3, Na2SO4, and mixed salt aqueous solution |
| Critical Parameters and Acentric Factors | Component i | |
|---|---|---|
| 10.638 | 17.857 | |
| 304.09 | 647.3 | |
| 0.21 | 0.344 | |
| 7.376 | 22.048 | |
| Subscript j | Universal Parameters | |
|---|---|---|
| 1 | 0.4436900 | 0.115 449 |
| 2 | 1.2843800 | −0.920731 |
| 3 | 0.3563060 | 1.708710 |
| 4 | 0.5449790 | −0.270896 |
| 5 | 0.5286290 | 0.349621 |
| 6 | 0.4840110 | 0.754130 |
| 7 | 0.0705233 | −0.044448 |
| 8 | 0.5040870 | 1.322450 |
| 9 | 0.0307452 | 0.179433 |
| 10 | 0.0732828 | 0.463492 |
| 11 | 0.0064500 | −0.022143 |
| System | Method | Equation |
|---|---|---|
| Without hydrate | - | |
| With hydrate | 1 | |
| 2 | ||
| 3 |
| System | Methods | Fitting Data Points | Fitting Accuracy/% | Prediction Data Points | Prediction Error/% |
|---|---|---|---|---|---|
| Pure water without hydrates | - | 251 | 5.293 | 114 | 7.912 |
| NaCl aqueous solution without hydrates | 44 | 4.318 | - | - | |
| Pure water with hydrates | 1 | 119 | 5.953 | 118 | 12.930 |
| 2 | 119 | 4.549 | 118 | 15.174 | |
| 3 | 119 | 4.538 | 118 | 15.154 | |
| NaCl aqueous solution with hydrates | 1 | 70 | 7.500 | - | - |
| 2 | 70 | 8.459 | - | - | |
| 3 | 70 | 8.472 | - | - |
| Method | Equation |
|---|---|
| 1 | |
| 2 | |
| 3 |
| System | Methods | Fitting Data Points | Fitting Accuracy/% |
|---|---|---|---|
| Pure water with hydrates | 1 | 220 | 0.243 |
| 2 | 220 | 0.245 | |
| 3 | 220 | 0.243 | |
| NaCl aqueous solution with hydrates | 1 | 231 | 1.190 |
| 2 | 231 | 1.095 | |
| 3 | 231 | 0.210 |
Disclaimer/Publisher’s Note: The statements, opinions and data contained in all publications are solely those of the individual author(s) and contributor(s) and not of MDPI and/or the editor(s). MDPI and/or the editor(s) disclaim responsibility for any injury to people or property resulting from any ideas, methods, instructions or products referred to in the content. |
© 2024 by the authors. Licensee MDPI, Basel, Switzerland. This article is an open access article distributed under the terms and conditions of the Creative Commons Attribution (CC BY) license (https://creativecommons.org/licenses/by/4.0/).
Share and Cite
You, C.; Chen, Z.; Li, X.; Zhao, Q.; Feng, Y.; Wang, C. Benedict–Webb–Rubin–Starling Equation of State + Hydrate Thermodynamic Theories: An Enhanced Prediction Method for CO2 Solubility and CO2 Hydrate Phase Equilibrium in Pure Water/NaCl Aqueous Solution System. Energies 2024, 17, 2356. https://doi.org/10.3390/en17102356
You C, Chen Z, Li X, Zhao Q, Feng Y, Wang C. Benedict–Webb–Rubin–Starling Equation of State + Hydrate Thermodynamic Theories: An Enhanced Prediction Method for CO2 Solubility and CO2 Hydrate Phase Equilibrium in Pure Water/NaCl Aqueous Solution System. Energies. 2024; 17(10):2356. https://doi.org/10.3390/en17102356
Chicago/Turabian StyleYou, Changyu, Zhaoyang Chen, Xiaosen Li, Qi Zhao, Yun Feng, and Chuan Wang. 2024. "Benedict–Webb–Rubin–Starling Equation of State + Hydrate Thermodynamic Theories: An Enhanced Prediction Method for CO2 Solubility and CO2 Hydrate Phase Equilibrium in Pure Water/NaCl Aqueous Solution System" Energies 17, no. 10: 2356. https://doi.org/10.3390/en17102356
APA StyleYou, C., Chen, Z., Li, X., Zhao, Q., Feng, Y., & Wang, C. (2024). Benedict–Webb–Rubin–Starling Equation of State + Hydrate Thermodynamic Theories: An Enhanced Prediction Method for CO2 Solubility and CO2 Hydrate Phase Equilibrium in Pure Water/NaCl Aqueous Solution System. Energies, 17(10), 2356. https://doi.org/10.3390/en17102356