Abstract
Chemical reactions, mineral diffusion, and deposition are pivotal in understanding the mechanisms of mineral deposition and the formation of seafloor sulfides in the hydrothermal circulation process. To understand the formation process of anhydrite in submarine hydrothermal systems, a computational model that combined component transport and chemical reactions was established and simulated using the mass transport model. The deposition rate of calcium sulfate was defined, and the effects of factors such as porosity, ion concentration, and inflow velocity on the temperature field in the reaction zone were thoroughly investigated. The distribution of temperature, porosity, and velocity during the reaction process was obtained, allowing for the identification of the chemical reaction patterns of certain ions in the early stages of hydrothermal activity. The simulation revealed the occurrence of biochemical reactions between two types of ions, leading to their deposition on the solid framework of a porous medium. With the increase in inflow velocity and solute concentration, the average porosities of the porous medium decreased by 0.495% and 0.468%, respectively, which consequently altered the structure of the rock. Such findings contribute to the inference of formation and extinction mechanisms of seafloor crusts and hydrothermal chimneys.
1. Introduction
In the study of modern hydrothermal circulation in the seafloor, magmatic activity directly influences the composition of hydrothermal fluids. The heating of seawater through magmatic processes results in the leaching of significant quantities of metallic elements, leading to the formation of high-temperature fluids enriched with these elements. Additionally, the interaction between high-temperature, metal-rich hydrothermal fluids and infiltrating seawater, which contains acid radical ions, further modifies the structure of seafloor rocks. In 1965, the American research vessel “Atlantis II” [1] collected black tar-like high-temperature mud in the Red Sea. A year later, the research vessel “Chain” [2] collected deep-sea sediment in the same area, which contained copper, iron, manganese, zinc, and other trace metal elements. In the 1960s, researchers made an intriguing observation of the intercalation of black basalt and white-green sedimentary rocks in mid-ocean ridges, noting subtle variations in rock composition compared with the surrounding environment [3,4]. This finding led to the deduction that cold seawater infiltrates through fractures in the rocks and undergoes chemical reactions with the surrounding lithosphere as it penetrates deeper into the oceanic crust, and then causes dissolution or deposition of rocks, consequently altering their composition and structure. The discovery of super-high-temperature hydrothermal vents and extensive gypsum deposits beneath the oceanic crust in the northern region of Iceland in the late 1990s provided further evidence to support these conclusions [5].
In relation to the origin of sulfides in hydrothermal products on the seafloor [6], a model based on hydrothermal circulation is proposed: cold seawater infiltrates into the oceanic crust, exchanging heat with high-temperature rocks or pre-existing hydrothermal fluids. It then ascends through fractures and eventually erupts on the seafloor, resulting in the formation of hydrothermal sulfides, primarily in the forms of stockwork, veins, chimneys, and mounds. However, some researchers have raised concerns about the limitations of this model, as sulfide deposits have been discovered not only on the seafloor but also deep within the oceanic crust during recent ocean explorations [7]. Bischoff and Dickson made a significant discovery showing that when seawater is heated above 150 °C, calcium ions are leached from basalt and react with seawater to form calcium sulfate precipitates [8]. When heated seawater enters the high-temperature and high-pressure reaction zone and encounters hydrothermal fluids from the reaction zone, precipitation occurs in the mixing zone through the reaction between calcium ions in the hydrothermal fluids and sulfate ions in seawater [9]. This finding suggests that over time, the accumulated high-temperature hydrothermal fluids, which contain a significant amount of leached calcium ions, undergo chemical reactions and precipitation when they come into contact with infiltrating low-temperature seawater enriched in sulfate ions within the reaction zone. Consequently, these calcium sulfate precipitates eventually obstruct rock pores, resulting in modifications to the lithological structure within the crustal reaction zone [10].
Currently, research on the chemical reactions, mineral diffusion, and deposition processes in deep-sea hydrothermal circulation within the oceanic crust is still in its early stages, and several unresolved issues persist. Furthermore, research on the deposition of calcium sulfate in submarine hydrothermal vent areas is primarily focused on the study of these deposits. However, field exploration results have revealed the existence of gypsum accumulation zones in the deeper parts of the oceanic crust. There is currently limited research on the deposition of gypsum in these deep regions of the oceanic crust. These include identifying the sources of metal ions in high-temperature brines deep within the oceanic crust, understanding the origins of acid radical ions in infiltrating seawater at depth, investigating the mechanisms of metal ion precipitation in oceanic crust rocks, and unraveling the complex mechanisms of seafloor mineral deposition. Experimental investigations to address these issues are challenging due to the extreme conditions of high temperature and high pressure, as well as the logistical difficulties associated with deep-sea exploration and the limited access to authentic samples during mining operations. Additionally, substantial human and financial resources are required for such endeavors. Given these challenges, this study adopted a mass transport model, which was simulated using CFD numerical methods as a complementary approach, to investigate and further explore the theoretical aspects of hydrothermal ore-forming models.
2. Model Parameters and Computational Conditions
2.1. Numerical Computation Methods
Computational fluid dynamics (CFD) has rapidly advanced, enabling the simulation of complex fluid phenomena involving flow, heat transfer, radiation, chemical reactions, and more in realistic scenarios. It also allows for the redesign and optimization of existing problems. In comparison with experiments, CFD eliminates irrelevant disturbances and is significantly more cost-effective.
In this study, to solve the governing equations, the computational process involved the following steps:
- (1)
- Establish the governing equations.
- (2)
- Determine the boundary conditions and initial conditions.
- (3)
- Divide the computational domain into a grid.
- (4)
- Discretize the governing equations.
- (5)
- Discretize the initial and boundary conditions.
- (6)
- Specify the control parameters for the solution. The time step was set to 10 s.
- (7)
- Solve the discretized equations. For transient calculations, the PISO (pressure implicit with splitting of operators) algorithm was chosen to ensure stability during equation solving.
- (8)
- Check for convergence. The calculation precision was set to reach a convergence of .
- (9)
- Output the computed results and visualize the data.
Fractured porous media play a crucial role in facilitating the deposition or dissolution of hydrothermal fluids when they react with low-temperature seawater or the surrounding rocks. In this study, numerical simulations were conducted to investigate the chemical reactions and deposition processes within a region of fractured porous media, as illustrated in Figure 1. The computational domain covered an area of 40 cm × 40 cm, with a centrally located fracture characterized by a porosity of 1 (fully open), a fracture aperture (d) of 2 cm, and a fracture length of 40 cm. The initial conditions were defined as follows: the hydrothermal fluid was introduced from the left end, while low-temperature seawater containing sulfate ions entered from the right end. The ambient pressure was set to 20 MPa, which corresponded to a boiling temperature of seawater at 20 MPa of 365.710 °C.
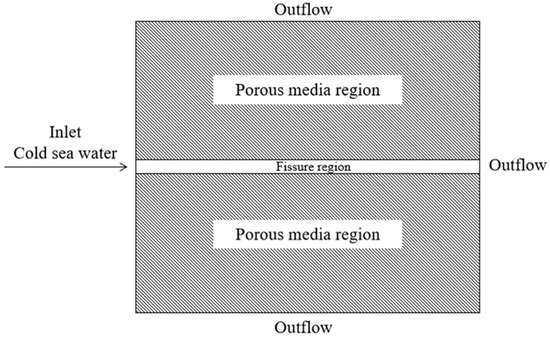
Figure 1.
Physical model of simulation.
To streamline the computational process, several assumptions were made in the model:
- (1)
- The solid framework of the porous media was assumed to be uniform and isotropic, meaning that its properties did not vary spatially or directionally.
- (2)
- The model neglected the effects of radiative heat transfer, dispersion, and viscous dissipation between the solid framework and the fluid phase within the porous media (the deposition of calcium sulfate increased with higher temperatures, and dissolution only occurred when temperatures decreased; however, due to the small variations in the average temperature within the computational domain, the phenomenon of dissolution was very weak and could be neglected).
- (3)
- The solid and fluid phases in the porous media were assumed to be in local thermal equilibrium, meaning that they had the same temperature at each point within the medium.
- (4)
- The model did not consider other ion chemical reactions or reversible reactions; it focused solely on the specific chemical reactions and deposition processes under investigation.
These assumptions helped to simplify the computational complexity and allow for a focused analysis of the targeted chemical reactions and deposition processes in the fractured porous media region.
The model was imported into ICEM (Integrated Computer Engineering and Manufacturing) to generate the required computational mesh. In selecting the mesh model, unstructured meshes were used to expedite the computation and control the mesh size. Due to the investigation of the mixture of sulfate ions and calcium ions, the part where the main channel fracture intersected with the surrounding fracture in the porous media region was discretized with increased refinement. In order to present the mesh configuration clearly, Figure 2 illustrates the mesh, which followed the same meshing approach and is magnified twice the actual computational scale for better visualization.
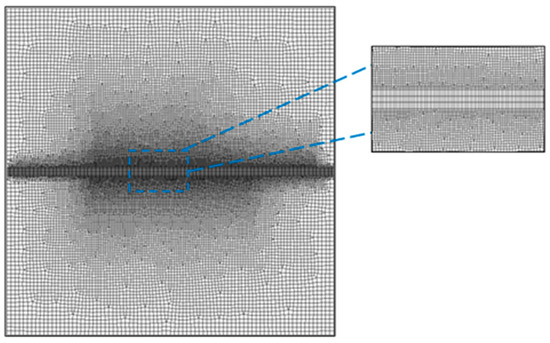
Figure 2.
Mesh visualization of the computational domain.
2.2. Boundary Condition Settings and Parameter Configurations
The seawater, which contains sulfate ions, undergoes preheating before entering the gypsum formation zone. The computational calculations considered the components of calcium ions ( and sulfate ions (. The specific values of various parameters in this model are shown in Table 1 [11,12,13]. No reversible reactions or phenomena of calcium sulfate redissolution were assumed in the model. The sulfate ions entered the fractures at an initial temperature of 150 °C, while the entire computational domain was initially filled with high-temperature hydrothermal fluid at 400 °C, which contained calcium ions. The left boundary was set as a velocity inlet, while the other boundaries were set as free outflow ().

Table 1.
The specific values of various parameters.
2.3. Grid Sensitivity Test
Based on reference [14], for the flow simulation meshing for a single fractured rock mass, the meshing for the computational domain is defined by increasing the number of mesh elements. The mesh was divided into four different configurations, as shown in Table 2.

Table 2.
The total number of mesh elements for different mesh configurations.
Taking a fractured porous medium with a porosity of 0.4 in the porous region and a porosity of 1 in the fracture region as an example, the time required to reach the maximum rate of the chemical reaction was used as the criterion for mesh independence evaluation. The error rates for the four cases were 10.589%, 5.789%, 3.256%, and 0.778%, respectively. Therefore, it can be concluded that the mesh model corresponding to level 4 should be chosen.
2.4. Mathematical Model
2.4.1. Mass Transport and Chemical Reaction Model
The conservation equation for the i-th species was as follows:
where represents the mass fraction of the specific substance, and represents the net generation rate of chemical reactions, which is explained separately below. represents the rate at which individual source phases were generated. In the context of chemical reactions, there were three substances involved in the entire system. Therefore, two mass transport equations were necessary, ensuring that the sum of the mass fractions equaled 1.
- (1)
- Mass diffusion in a laminar flow
Equation (1) describes the diffusion flux, denoted as , which represents the movement of substance , with units of . The diffusion flux is generated by the concentration gradient. In the case of laminar flow occurring within rock pores at extremely low velocities, the expression for can be expressed as follows:
where represents the mass diffusion coefficient of substance i, and represents the thermal diffusion coefficient of substance i.
- (2)
- Mass transport in the energy equation
In the case of multi-component mixed flow, the diffusion of substances leads to the transfer of enthalpy. This phenomenon has a significant influence on the distribution of enthalpy within the system.
- (3)
- Laminar finite-rate model
In the laminar finite-rate model, the influence of turbulence fluctuations is not taken into account. The reaction rate can be determined using the Arrhenius equation [15]. By summing up the Arrhenius reaction sources for the relevant chemical reactions, the net source term for chemical substance can be calculated. This study involved single chemical reaction, specifically the reaction between and to form precipitate. It is a first-order reaction.
The equation is
represents the molar mass of the -th substance, and represents the production rate of the -th substance in the v-th reaction and it is given by
Here, C represents the concentration of the reactants, measured in moles per mole. The reaction rate constant is defined as follows:
represents the pre-exponential factor with a value of , ∆E represents the activation energy of the reaction with a value of 5.059 kJ/kmol, and R is the gas constant with a value of 8.314 kJ/(mol∙K).
- (4)
- The deposition rate of
After the formation of , a gradual deposition phenomenon takes place. The rate of calcium sulfate depositing in saline water is influenced by the temperature and can be described using the following equation:
K represents the coefficient governing the nucleation rate, which is influenced by the temperature. represents the concentration of the generated calcium sulfate, measured in mol/mol.
2.4.2. Calculation of the Porous Media Region
- (1)
- Variation in the Porosity of the Porous Media
Due to the precipitation of resulting from chemical reactions, the porous medium becomes plugged, leading to a subsequent reduction in porosity. The porosity can be determined by equating the weight of the solid framework to the initial mass of the rock plus the mass of the generated precipitate. The equation is given by
where represents the density of the rock and was assigned a value of 2650 kg/m3. represents the initial porosity of the porous medium. represents the mass concentration of the precipitate, measured in kg/kg. represents the density of the solid and has a value of 2960 kg/m3.
- (2)
- Porous media solid skeleton properties
The occurrence of chemical reactions results in the deposition of calcium sulfate onto the solid framework of the porous medium. As a result, the original solid framework no longer remains composed solely of a single type of rock, causing changes in the physical properties of the porous media’s solid framework. To determine the specific altered properties, a user-defined function (UDF) was employed to define the variation in the solid framework properties.
Density:
Here, and represent the molar fractions occupied by the original solid framework rock and the precipitate, respectively.
Thermal conductivity:
and represent the thermal conductivities of the original solid framework rock and the precipitate, respectively, and are measured in W/(m·K).
Specific heat capacity:
Here, and represent the specific heat capacities of the original solid framework and the precipitate, respectively, and are measured in J/(kg·K).
2.4.3. Basic Parameters for Porous Rocks
- (1)
- Porosity
The porosity of a porous medium is defined as the ratio of void volume to total volume and can be expressed as follows:
Here, represents the void volume, and represents the total volume.
- (2)
- Inertial Resistance Coefficient
The inertial resistance coefficient represents the ratio of inertial resistance to the acceleration of fluid flow within the porous medium. The Kozeny–Carman equation was used to calculate the resistance coefficient:
- (3)
- Effective Thermal Conductivity
The thermal conductivity of a porous rock is influenced by the thermal conductivity of the rock matrix itself and the thermal conductivity of the fluid filling the pores. When considering the coupling between the fluid and solid phases, the effective thermal conductivity is modified. The relationship between the effective thermal conductivity and the porosity can be described by
As the porosity of the rock increases, the effective thermal conductivity decreases.
2.5. Chemical Reaction Model Validation
The dissolution and deposition of rocks caused by chemical reactions in the process of submarine hydrothermal circulation typically occur over long time scales and large spatial scales. It is challenging to accurately replicate these processes in both experimental and simulation settings, as conducting sedimentation experiments under approximate laboratory conditions often requires a considerable amount of time and is impractical. Therefore, in this section, the obtained results were compared with empirical data from previous studies to validate the accuracy of the simulations (Figure 3).
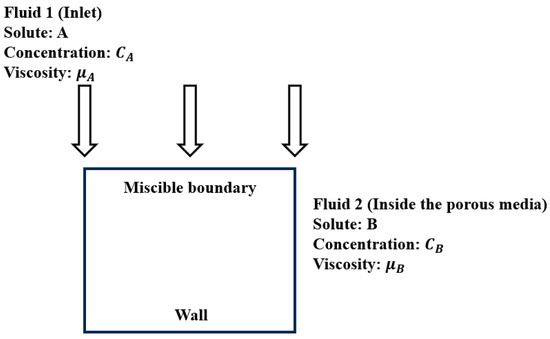
Figure 3.
Physical model [16].
In porous media, two fluids containing chemical solutes come into contact along an interface. Chemical solutes react through the interface, thereby altering fluid properties, such as density and viscosity. Moreover, if there exist density or viscosity gradients at the interface, density or viscosity fingering phenomena may occur during fluid transport. This study investigated the impact of the mixing reaction between two saturated solutions, namely, A + B → C, on the density fingering phenomena in a homogeneous two-dimensional model. The model had dimensions of 1.5 m in length and 1 m in width. Both solutions were assumed to be incompressible and isothermal. Solute A dissolved into fluid 2 through a partially miscible upper boundary, without any reverse mass transfer. The dissolved A and B reacted to generate solute C [16]. As shown in Figure 4, as fluid 1 infiltrated and solute A reacted with solute B to form solute C, the simulated results of the average within the domain resembled the distribution observed in the study.
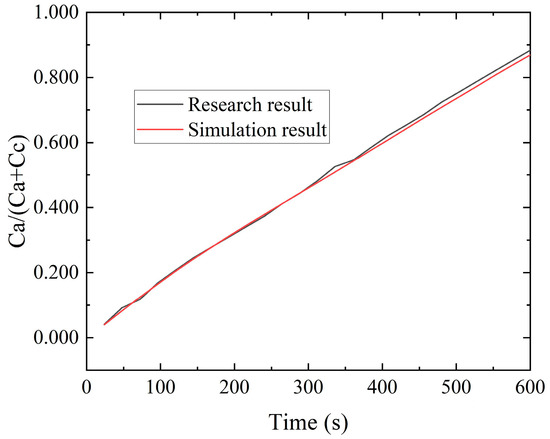
Figure 4.
The average volume of solute A in the mixed fluid.
3. Results and Discussion
In this section, we focus on the previously described model and first discuss the entire process of chemical reactions between two ions in the porous media region. Subsequently, we explore the effects of various influencing factors, namely, porosity, ion concentration, and inflow velocity, on the chemical reactions.
3.1. Chemical Reaction and Heat Transfer Analysis in Fractured Porous Media Region
In the simulation of the - species transport model simulated in the fractured porous media region, the following initial conditions were considered at different time points: t = 750 years, 1500 years, 2250 years, and 3000 years. An analysis was conducted to examine the variations in porosity, velocity, temperature, and concentration field.
- (1)
- Porosity Variation
Figure 5 illustrates the distribution of porosity at different time intervals. The initial porosity of the porous media region is represented by the red color and had a value of 0.4. The green color indicates a decrease in porosity caused by the deposition of , resulting in a reduction in porosity within the porous media framework. In the intermediate fracture region, the aperture was set to 1, corresponding to a porosity of 1. The deposition of in this region was minimal, significantly less than in the porous media region. Consequently, the porosity within the fracture remains unchanged and was equal to 1. This section specifically focuses on discussing the variation in porosity within the porous media region on both sides of the fracture.

Figure 5.
Distributions of the porosity at different times.
From Figure 5 and Figure 6, it can be observed that the porosity decreased in the X-direction on both sides of the fracture, including the inlet region, as the reacted with to form precipitates. It was determined that the Péclet number (), which represents the ratio of convective transport rate to diffusive transport rate, was greater than 1. This indicated that convective transport slightly dominated over diffusive transport, causing most of the sulfate ions to flow within the fracture and diffuse into the porous media regions on both sides.

Figure 6.
Distribution maps of sulfate ion concentration at different times.
Ions naturally diffuse from areas of high concentration to areas of low concentration, and since the sulfate ion concentration is the highest at the inlet, diffusion initially occurs near the inlet region. In the absence of chemical reactions, ion diffusion would typically exhibit a triangular shape. However, in this study, an arc-shaped edge was observed at the inlet, indicating that the deposition of in the porous media region altered the porosity and hindered ion diffusion.
- (2)
- Analysis of Flow and Heat Transfer
According to Figure 7, the temperature of the seawater containing was lower compared with the temperature inside the porous media. This temperature difference drove convective heat transfer, resulting in heat transfer from the porous media to the incoming flow.
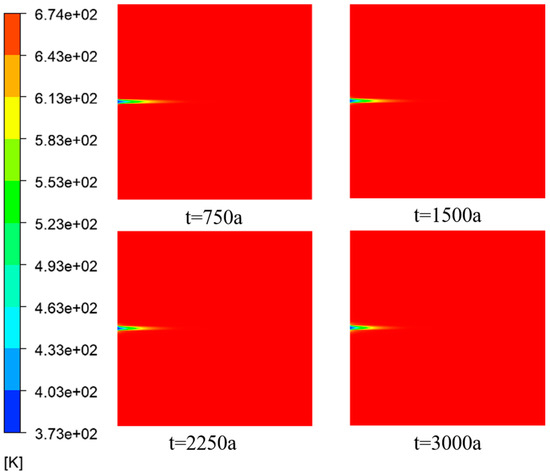
Figure 7.
Temperature distribution cloud maps at different times.
From Figure 8, it is evident that there was a significant temperature difference at the inlet section of the fissure. Along the X-direction, the temperature difference between the fissure and the porous media region gradually diminished until it eventually reached equilibrium with the temperature of the hot fluid.
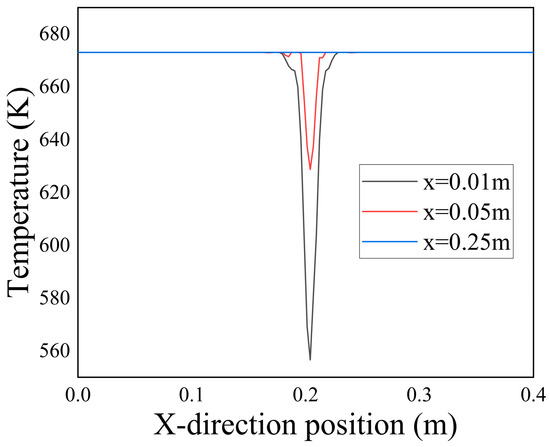
Figure 8.
Temperature distributions along the Y-axis at different X positions.
From Figure 9, it can be observed that in the near-inlet region, the incoming low-temperature seawater maintained a consistent temperature, indicating minimal heat exchange with the surrounding porous media. As the flow progressed, the low-temperature seawater gradually diffused into the surrounding porous media, resulting in a widening temperature difference along the Y-axis at the inlet. Additionally, the rate at which the temperature difference expanded decreased gradually as the flow continued. This was attributed to the deposition of at the interface between the two fluids, which hindered the heat transfer through the flow.

Figure 9.
Temperature distributions along the Y-axis at X = 0.1 m at different times.
From Figure 10, it can be observed that the inlet velocity within the computational domain was relatively low. Combined with Figure 11, it is evident that the velocity first increased and then decreased within the range of . The reasons for this phenomenon are as follows: First, due to the low resistance within the fractures, there was a converging effect on the fluid. Second, the reduced porosity on both sides of the fractures, as shown in Figure 5, hindered the mixing of the two types of ions and restricted the diffusion, causing more low-temperature seawater to flow through the fractures. However, as the flow progressed, the maximum velocity within the fractures gradually decreased. This phenomenon could be attributed to the heightened intermingling of seawater and hydrothermal fluid, resulting in an increased degree of mixing and a reduction in temperature and density disparities within the flow field.
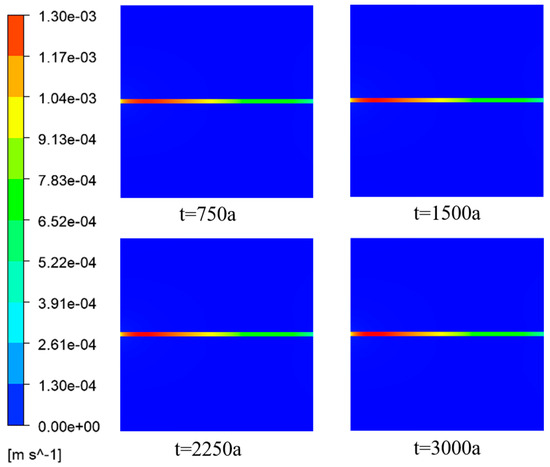
Figure 10.
Velocity distributions at different times.
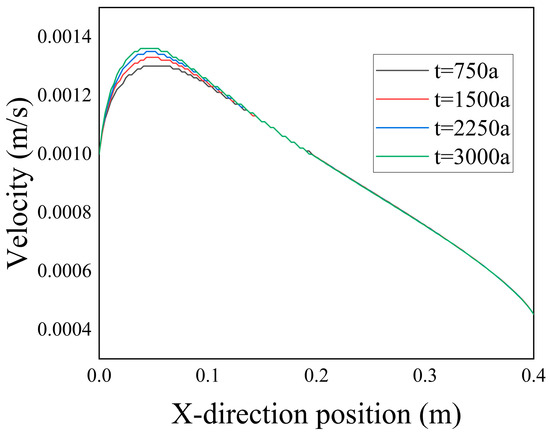
Figure 11.
Velocity distributions at different times along the central axis Y = 0.2 m.
- (3)
- Chemical Reaction Rate Analysis
From Figure 12, it can be observed that both the entire computational domain and the porous media region exhibited a pattern in which the chemical reaction rates initially increased rapidly, stabilized thereafter, and eventually decreased until they reached zero. In the fissure region, the chemical reaction rate rapidly dropped from 10−6 mol/(L·s) to zero within the time interval of 0–100 a. This behavior could be attributed to the initial presence of calcium ions within the fissure region, leading to a rapid chemical reaction rate. However, as the incoming flow displaced the hot fluid quickly, the fissure became filled with ions, leaving insufficient time for the reaction to occur before the ions flowed away. It can be inferred that the primary occurrence of chemical reactions within the computational domain took place in the porous media region.
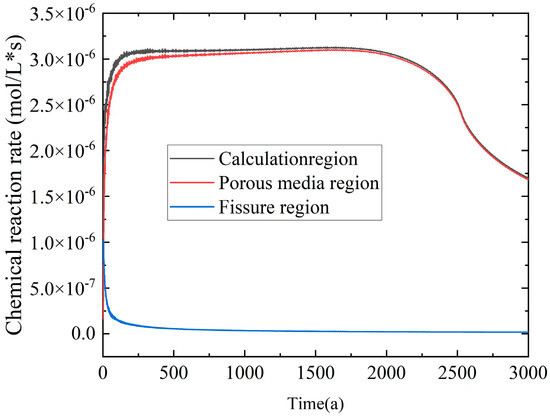
Figure 12.
Variation in the chemical reaction rates with time in different computational domains.
The chemical reaction rate primarily relies on ion concentrations. The variation in chemical reaction rates within the computational domain can be categorized into three phases: First, there was a rapid increase phase (0–200 a) characterized by the interaction of low-temperature seawater containing with the hot fluid containing This interaction led to an increase in reaction rate, as more was introduced. Subsequently, a stable phase (200–2250 a) followed, during which ion concentrations remain relatively constant, and the average temperature within the domain stabilized. This resulted in a gradual convergence of the reaction rate. Finally, a slow decrease phase (2250–3000 a) occurred as the ion concentrations and average temperatures decreased within the domain. Additionally, the accumulation of a significant quantity of at the ion interface inhibited further progress of the chemical reaction, leading to a decline in the chemical reaction rate.
3.2. Analysis of Influencing Factors
3.2.1. Influence of Porosity on Heat Transfer
- (1)
- Porosity Variation
The porosity of rock is a significant physical property that affects the heat transfer and chemical reactions of fluids within its internal structure. In this section, the simulation of convective heat transfer and chemical reactions between seawater and hydrothermal fluids within fractured porous media was conducted for initial porosity values of 0.3, 0.4, and 0.5. Considering that the fractures possessed a hollow structure and experience minimal influence from precipitation, which did not readily deposit within the fractures, such an influence could be neglected. Therefore, the subsequent three sections discuss only the variation in porosity within the porous media regions situated on both sides of the fractures. Figure 13 illustrates the porosity distribution of porous media with different initial porosity values, where different colors represent variations in porosity. The deposition of onto the porous media framework led to a reduction in porosity.
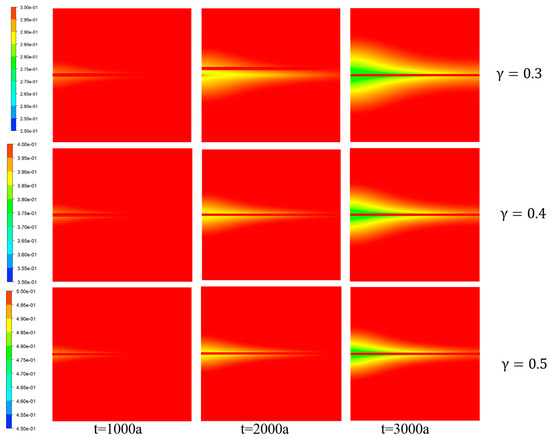
Figure 13.
Porosity variation for different initial porosity values.
The porosity gradually decreased along the X-direction on both sides of the fractures and decreased along the Y-direction at the inlet. This reduction can be primarily attributed to the deposition of at the interfaces between the fractures and the two types of ions. Figure 10 provides evidence that an increase in the initial rock porosity resulted in a smaller range of porosity variation within the porous media region. Combined with Figure 14, it can be inferred that the range of porosity variation was related to the distribution of concentration. Moreover, a higher porosity level led to a narrower range of ion diffusion. This was because ion diffusion is mainly influenced by temperature, with higher temperatures facilitating faster ion movement. Combined with Figure 15 and Figure 16, a higher porosity corresponded to a lower average temperature within the porous media region, thereby affecting the ion diffusion.
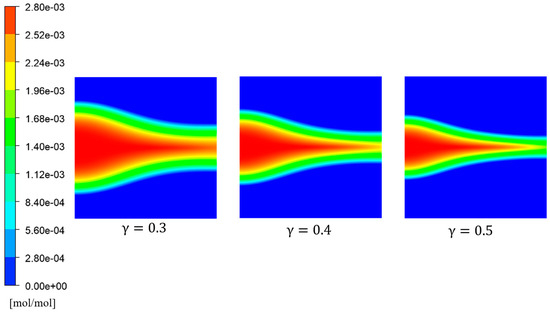
Figure 14.
Concentration distribution of sulfate ions for different initial porosity values.
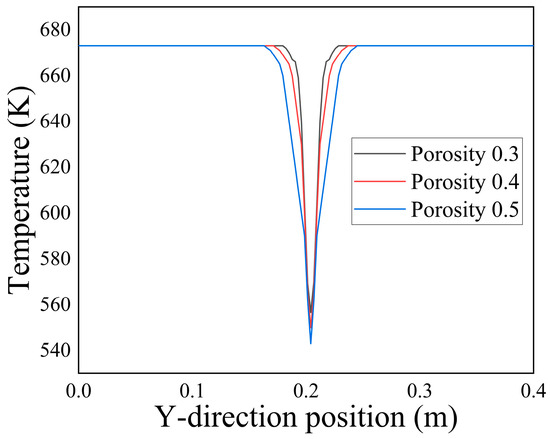
Figure 15.
Temperature distribution along the Y-axis at X = 0.1 m for different initial porosity values at t = 3000 a.
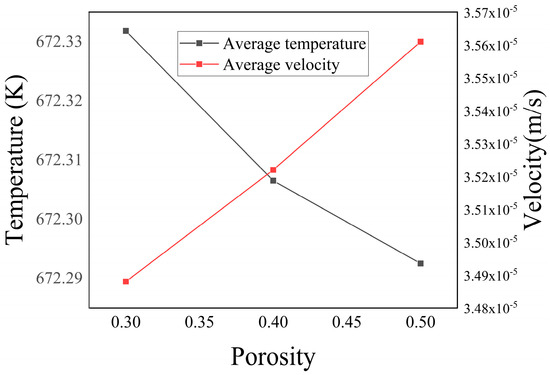
Figure 16.
Variation in average temperature and average velocity with porosity in the porous media region.
Figure 14 depicts the distribution of concentration for different initial porosity values. It can be observed that as the porosity increased, the extent of diffusion gradually decreased. This was mainly attributed to the fact that lower porosity levels resulted in higher diffusion intensity within the porous rock, accompanied by weaker flow effects and lower average velocity. In porous rocks with low porosity, the range of sulfate ions diffusion was larger. However, as the porosity rose, the inflow velocity rose, causing the transportation of ions before sufficient diffusion occurred.
- (2)
- Analysis of the Convective Heat Transfer
When low-temperature seawater was injected into the computational domain with different initial porosity values, heat exchange occurred between the injected seawater and the surrounding high-temperature hydrothermal fluids. This process led to a gradual increase in the inflow temperature, eventually approaching the overall temperature within the domain. Combined with Figure 15 at t = 3000 a, the temperature distribution along the Y-axis at X = 0.1 m for different initial porosity values can be observed. It is evident that as the porosity increased, the range of temperature extension along the central axis of Y = 0.2 m at X = 0.1 m continuously expanded. This expansion could be attributed to the growing influx of low-temperature seawater into the porous media region as the porosity increased. Consequently, the heat exchange between the fluids was enhanced.
Figure 16 illustrates the relationship between the average temperature and average velocity in the porous media region in relation to porosity. The graph reveals that as the initial porosity increased, the average temperature within the porous media region decreased, while the average velocity increased. This observation could be attributed to the amplified influx of low-temperature seawater into the porous media as the porosity increased. Consequently, the increased flow velocity contributed to a decline in the average temperature across the entire domain.
- (3)
- Chemical Reaction Rate Variation
Figure 17 illustrates the variation in chemical reaction rates within the porous media region over time for different initial porosity values. The graph reveals a notable trend: as the porosity increased, the chemical reaction rate within the porous rock decreased. This phenomenon could be attributed to two primary factors. First, as the porosity increased, the flow channel aperture within the porous rock enlarges, resulting in a decrease in the overall resistance coefficient. This change facilitated fluid flow through the porous rock, leading to an increased influx of cold fluid within the same time frame. Consequently, the average temperature decreased. Additionally, considering Equations (6) and (7), the increase in porosity caused a reduction in the average temperature, subsequently lowering the chemical reaction rate constant within the porous rock.
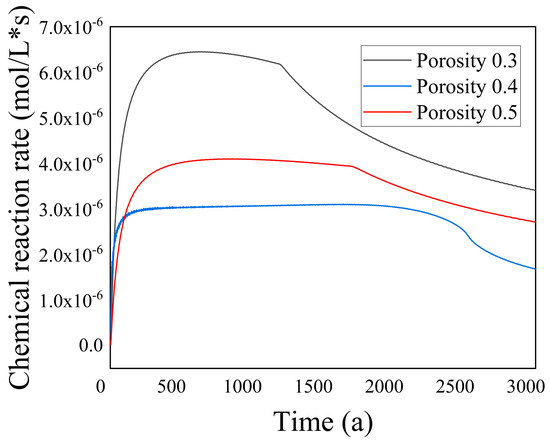
Figure 17.
Variation in chemical reaction rates with time for different initial porosity values.
Second, as the porosity increased, the internal pore size of the porous rock gradually expanded. This expansion allowed for a greater volume of cold fluid to pass through within the same time period, resulting in an increase in the average velocity. As a result, some ions did not have sufficient time to react with ions before being carried away by the flow.
3.2.2. Influence of the Ion Concentration on the Heat Transfer
- (1)
- Porosity Variation
The reactant concentration plays a crucial role in determining the chemical reaction rate, as an increase in reactant concentration typically leads to an acceleration of the reaction within a certain concentration range. According to Table 1, it can be observed that in the seawater and hydrothermal fluids, the concentration of was much greater than that of . Therefore, the rate of the chemical reaction primarily depended on the concentration of . Hence, in this section, we conducted simulations of the convective heat transfer and chemical reactions between seawater and hydrothermal fluids within fractured porous media, considering different concentrations of , specifically 0.0014 mol/mol, 0.0028 mol/mol, and 0.0056 mol/mol.
Figure 18 and Figure 19 illustrate the variation in porosity and the average porosity variation in the porous media region, respectively, for different concentrations of . The graphs demonstrate a clear trend, where within a specific range of ion concentrations, the porosity within the domain gradually decreased as the ion concentration increased. This finding was consistent with Equations (6) and (7), which indicate that the chemical reaction rate is directly proportional to the first power of the concentration. Therefore, an increase in concentration enhanced the chemical reaction rate, leading to the deposition of more within the porous media region over a given period. Consequently, this deposition reduced the porosity of the porous media and the average porosity decreased by 0.495%.

Figure 18.
Variation in porosity with different concentrations at t = 3000 a.
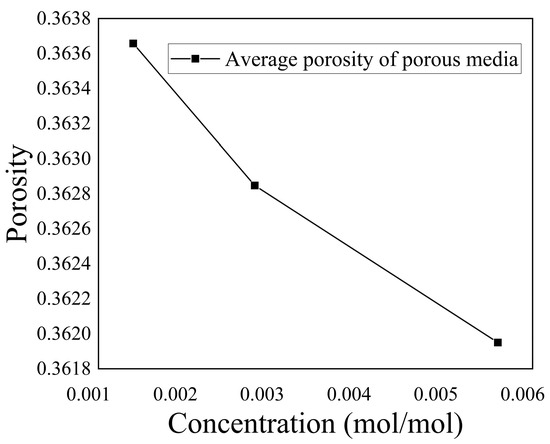
Figure 19.
Variation in the average porosity of the porous media region with respect to the concentration at t = 3000 a.
- (2)
- Heat Transfer Analysis
Figure 20 illustrates the temperature distribution along the Y-axis at X = 0.1 m for different concentrations at t = 3000 a. The graph reveals that with the injection of low-temperature seawater and an increase in concentration, the temperature gradient in the Y-direction near the inlet section intensified. This phenomenon could be attributed to the elevated ion concentration, which promoted the formation of precipitation, as shown in Figure 18. The deposition of reduced the porosity of the porous media, hindering the diffusion of low-temperature seawater toward the high-temperature hydrothermal fluid. Consequently, this alteration affected the convective heat transfer between the two fluids at the inlet section, resulting in an increased temperature gradient at that location.
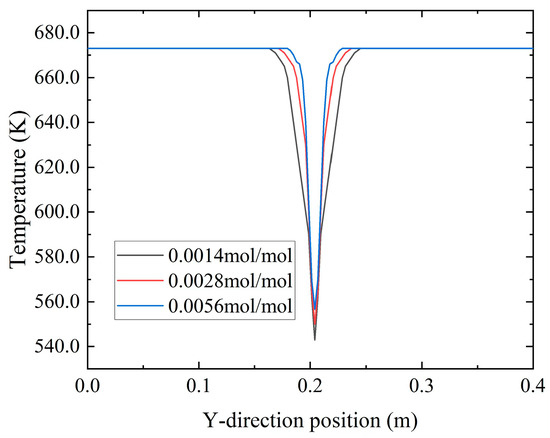
Figure 20.
Distribution of the velocity along the Y-axis at X = 0.1 m for different concentrations of at t = 3000 a.
Figure 21 illustrates the distribution of velocity along the Y-axis at the axis line Y = 0.2 m for varying concentrations of at t = 3000 a. Combined with Figure 19, it can be observed that an augmentation in sulfate ion concentration led to the deposition of , subsequently reducing the porosity. Consequently, the infiltration of low-temperature seawater into the porous media diminished. As a result, the maximum flow velocity of the low-temperature seawater entering the fractures increased.
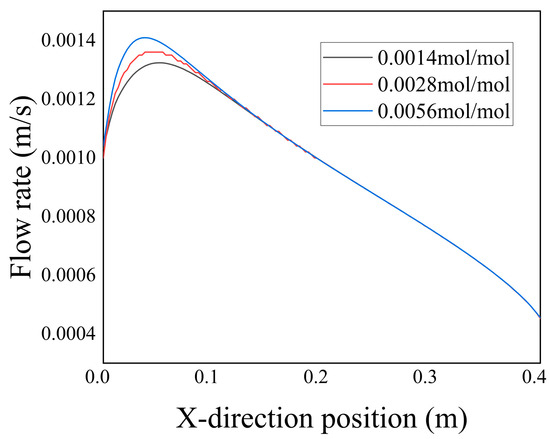
Figure 21.
Velocity distribution at Y = 0.2 m along the central axis for different concentrations of at t = 3000 a.
Figure 22 represents the variations in average temperature and average velocity within the porous media region with different concentrations of sulfate ions at t = 3000 a. The figure demonstrates that as the concentration of increased, the average temperature within the porous media region gradually rose, while the average velocity continuously decreased. Combined with Figure 22, it is evident that an increase in sulfate ion concentration led to a decrease in the porosity of the porous media region on both sides of the fractures. Consequently, this reduction in porosity impeded the mixing of the two ions, hindered chemical reactions, and limited heat exchange between the two fluids. Consequently, the average temperature within the porous media region decreased. Simultaneously, the reduction in porosity led to a gradual decline in the volume of fluid infiltrating into the porous media region, resulting in a decrease in the average flow velocity.
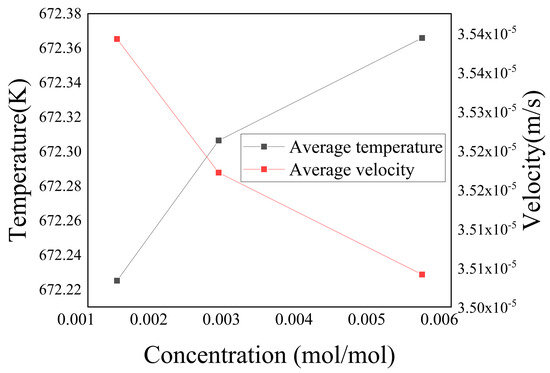
Figure 22.
Variation in the average temperature and average velocity in the porous medium region with concentration.
- (3)
- Chemical Reaction Rate Analysis
Figure 23 illustrates the spatiotemporal distribution of chemical reaction rates in the entire computational domain and the porous medium region for different concentrations of . The figure reveals that as the concentration of increased, the chemical reaction rate within the flow domain continuously rose. This was attributed to the direct proportionality between the chemical reaction rate and ion concentration, with present in significantly higher quantities than . Consequently, higher concentrations of led to greater chemical reaction rates. Additionally, referring to Figure 22, the overall increase in average temperature throughout the flow domain elevated the chemical reaction rate constant. These mutually reinforcing factors contributed to the overall increase in the chemical reaction rate.
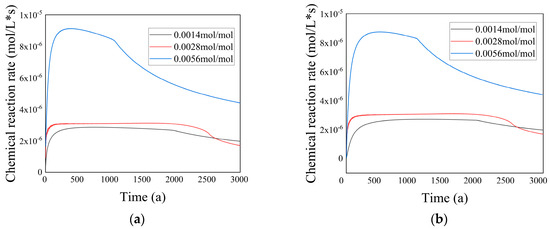
Figure 23.
(a) Variation in chemical reaction rate over the entire computational domain for different concentrations; (b) variation in chemical reaction rate in the porous medium region for different concentrations.
When t > 2250 a, the chemical reaction rate for the concentration of 0.0028 mol/mol of gradually became lower than that of the 0.0014 mol/mol group. This could be attributed to the later stages of the reaction, where the accumulation of due to the higher concentration of led to a rapid reduction in porosity. As a result, the hinderance to fluid infiltration from the fractures into the porous medium region intensified. At this point, the inhibitory effect of reduced porosity on ion diffusion outweighed the promoting effect of increased ion concentration on the chemical reaction.
3.2.3. Impact of Inflow Velocity on Flow and Heat Transfer
- (1)
- Variation in Porosity
The inflow velocity plays a crucial role in determining the degree of mixing between ions, thereby influencing the fluid flow, heat transfer, and chemical reactions between the ions. It is an important factor that affects heat exchange and mineral deposition/dissolution in the hydrothermal reaction zone on the seafloor. In this section, simulations were conducted for inflow velocities of 0.0005 m/s, 0.0010 m/s, and 0.0020 m/s to investigate the flow and heat transfer, as well as the chemical reaction and deposition of seawater and hydrothermal fluid in the fractured porous medium region.
Figure 24 and Figure 25 depict the variations in porosity for different inflow velocities and the distribution of concentration at t = 3000 a for different inflow velocities, respectively. Similar to the findings in the previous section, the porosity gradually decreased along the X-direction on both sides of the fracture, with a significant decrease near the inlet. With increasing inflow velocity, the overall porosity gradually decreased; this was primarily concentrated in the regions adjacent to the fracture. Figure 25 shows the variation in the average porosity in the porous medium region with inflow velocity. It can be observed that as the inflow velocity increased, the average porosity of the entire porous medium region decreased. This was attributed to the enhanced flow rate of low-temperature seawater, which resulted in an increased concentration of within the flow domain. Consequently, the chemical reaction rate increased, leading to an increased deposition of within the porous medium, gradually obstructing the pore space and reducing the porosity. According to Figure 26, the average porosity decreased by 0.468%.

Figure 24.
Variation in porosity for different inflow velocities.
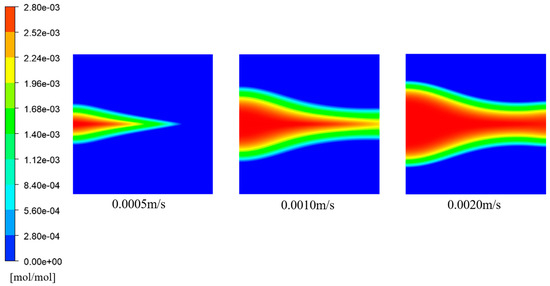
Figure 25.
Distribution of the concentration at t = 3000 a for different inflow velocities.
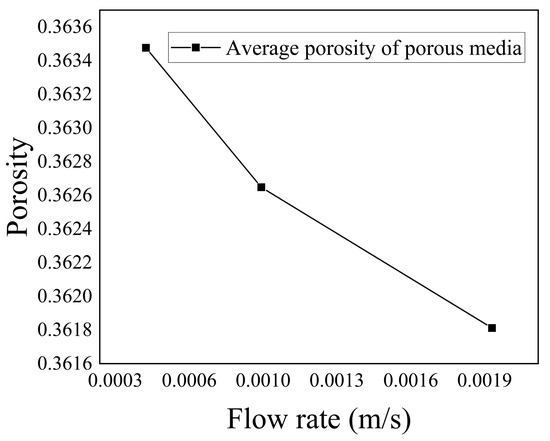
Figure 26.
Variation in the average porosity in the porous medium with the inflow rate.
- (2)
- Heat Transfer Analysis
Figure 27 and Figure 28 show the temperature distribution at t = 3000 a for various inflow velocities and the corresponding temperature distribution along the Y-axis at Y = 0.2 m, respectively. These figures illustrate that an increase in the inflow velocity led to a downstream extension of the low-temperature region along the X-axis. Specifically, when the inflow velocity was v = 0.0005 m/s, the length of the low-temperature region was x = 0.0931 m. As the inflow velocity increased to v = 0.0010 m/s, the length of the low-temperature region expanded to x = 0.162 m. Similarly, when the inflow velocity was v = 0.0020 m/s, the length of the low-temperature region further elongated to x = 0.269 m. This phenomenon occurred due to the augmented flow rate of the incoming fluid. As a result, the fluid predominantly traversed less obstructed areas within the fractures, resulting in an elongation of the low-temperature region within the fractures.
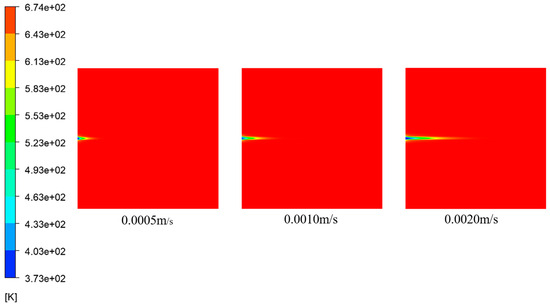
Figure 27.
Temperature distribution at t = 3000 a for different inflow velocities.
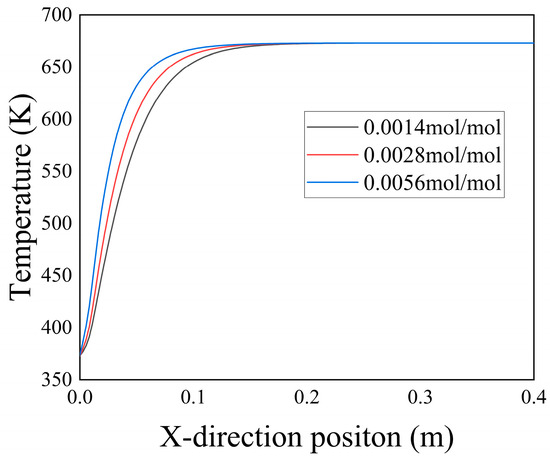
Figure 28.
Temperature distribution at t = 3000 a along the central axis (Y = 0.2 m) for different inflow velocities.
Figure 29 depicts the temperature distribution along the Y-axis at X = 0.1 m for various inflow velocities at t = 3000 a. The graph reveals that as the inflow velocity increased, the range of temperature diffusion toward the porous medium region diminished, particularly near the inlet. At higher velocities, the low-temperature fluid remained predominantly confined within the fractures. This phenomenon was attributed to excessively high inflow velocities, which created a channel along the central axis. Consequently, the central region exhibited higher porosity, while the porosity on both sides decreased. The deposition of predominantly occurred on the sides of the central axis, impeding ion mixing. Simultaneously, it hampered heat transfer between the fluids, preventing excessive diffusion of low-temperature seawater into the porous medium region.
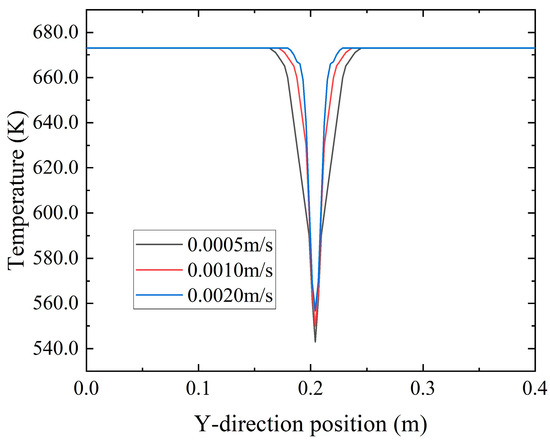
Figure 29.
Temperature distribution along the Y-axis at X = 0.1 m for different inflow velocities at t = 3000 a.
Figure 30 depicts the relationship between inflow velocities and the average temperature within the porous medium region. It demonstrates that as the inflow velocity increased, the flow rate of the low-temperature fluid also increased, resulting in a decrease in the average temperature within the porous medium.
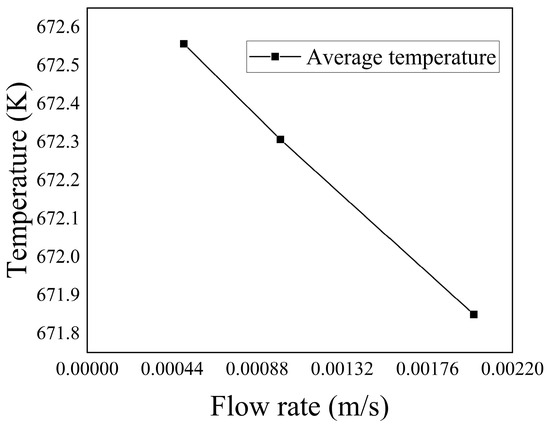
Figure 30.
Variation in the average temperature in the porous medium region with inflow velocity.
- (3)
- Chemical Reaction Rate
Figure 31 exhibits the temporal evolution of the chemical reaction rate in both the entire computational domain and the porous medium region at various inflow velocities. It can be observed that within a certain velocity range, the chemical reaction rate increased as the velocity rose. This was because of the elevated inflow velocity, which corresponded to a higher flow rate of low-temperature seawater. Consequently, the ion concentration experienced a rapid surge, resulting in an accelerated chemical reaction rate. The time required for the chemical reaction rate to reach a steady state diminished accordingly. At higher velocities, advection became the dominant transport mechanism in the flow domain, minimizing ion diffusion and causing ions to be carried away before sufficient diffusion could occur. As a result, the chemical reaction became unstable. However, at lower inflow velocities, the chemical reaction rate remained stable for a longer time. In cases of lower inflow velocity, both diffusion and advection significantly influenced the heat transfer and chemical reactions within the flow domain. The reduced inflow velocity limited the transport of ions, resulting in a slower formation rate of . This led to a more stable flow state and a correspondingly stable chemical reaction rate.
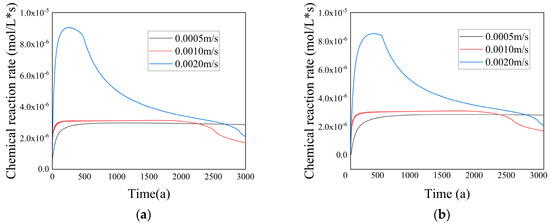
Figure 31.
(a) Variation in the chemical reaction rate over time in the entire computational domain for different inflow velocities; (b) variation in the chemical reaction rate over time in the porous medium region for different inflow velocities.
With increasing velocity, the chemical reaction rate approached zero at a faster rate. This was because excessively high inflow velocities gradually formed channels along the central axis, resulting in a higher porosity in the central region and a lower porosity on both sides. The precipitation of predominantly occurred on the sides of the central axis, hindering ion mixing.
Additionally, the graph reveals that for t > 2300 a and t > 2650 a, the chemical reaction rates for the inflow velocity groups of 0.0010 m/s and 0.0020 m/s were lower compared with the inflow velocity group of 0.0005 m/s. This was because the porosity in the porous medium region gradually decreased as the inflow velocity increased. The reduction in porosity hampered the effective mixing of the two ions, resulting in a decrease in the chemical reaction rate.
4. Conclusions
In this study, a comprehensive model that incorporated transport, fluid flow, heat transfer, and chemical reactions was developed to analyze the behavior of sulfate–calcium ion components in fractured porous media within complex submarine environments. Using numerical simulations, the mechanisms of heat and mass transfer, as well as chemical reaction precipitation, in fractured porous media were explored, taking into account various factors such as porosities, ion concentrations, inflow velocities, and fracture types on the material transport, fluid flow, and chemical reactions. The following conclusions could be drawn:
(1) The introduction of low-temperature seawater, which carries into high-temperature hydrothermal fluids containing , initiated chemical reactions between these ions and led to the formation of precipitates. The porosity of the fractured porous media gradually decreased in the X direction on both sides of the fracture and also decreased along the fracture on the inlet side. Interestingly, the precipitation of due to chemical reactions impeded the mixing of ions, resulting in a reduced flow of fluid permeating from the fracture into the porous medium region on both sides.
(2) In the entire computational domain, including the porous medium region, the chemical reaction rate initially exhibited a rapid increase, followed by a stable stage, and eventually decreased slowly until it reached zero. However, in the fracture region, the chemical reaction rate behaved oppositely. Initially, the chemical reaction rate was high because the fracture region allowed for the easy flow of both fluids due to the low resistance. However, after a certain period, when the fracture became filled with low-temperature seawater containing , the chemical reaction rate decreased to zero. The porosity of the porous medium region played a significant role in altering its resistance to fluid flow, thereby affecting the retention of fluids. Higher porosity enhanced the fluid flow, causing the to flow away before reacting with the .
(3) Modifying the inflow ion concentration and inflow velocity had a significant impact on the rate of chemical reaction. By increasing the concentration of reactants within the computational domain, the reaction rate was accelerated, leading to greater precipitation of onto the solid framework of the porous rock. As a consequence, the porosity of the porous medium was reduced.
Author Contributions
Conceptualization, D.Z. and Y.L. (Yan Li); methodology, D.Z.; software, Y.F. and Y.L. (Yina Luo); validation, Y.F. and Y.L. (Yina Luo); formal analysis, Y.L. (Yina Luo) and Y.F.; writing—original draft preparation, Y.L. (Yina Luo) and Y.F.; writing—review and editing, Y.L. (Yina Luo) and Y.F.; visualization, Y.L. (Yina Luo) and Y.F.; supervision, D.Z.; project administration, Y.L. (Yan Li). All authors have read and agreed to the published version of the manuscript.
Funding
This research was funded by the Nature Science Foundation of Shandong Province (no. ZR2020ME186).
Data Availability Statement
Not applicable.
Conflicts of Interest
The authors declare no conflict of interest. The funders had no role in the design of the study; in the collection, analyses, and or interpretation of data; in the writing of the manuscript; or in the decision to publish the results.
References
- Wang, X.; Zhai, S.; Meng, F.; Li, H.; Yu, Z.; Sun, G.; Xue, G. Influence of permeability on hydrothermal circulation in the sediment-buried oceanic crust. Sci. China 2006, 49, 773–784. [Google Scholar] [CrossRef]
- Swift, S.A.; Bower, A.S.; Schmitt, R.W. Vertical, horizontal, and temporal changes in temperature in the Atlantis II and Discovery hot brine pools, Red Sea. Deep-Sea Res. Part I 2012, 64, 118–128. [Google Scholar] [CrossRef]
- Hersey, J.B.; Bunce, E.T. Narrative of Chain Cruise No. 34, Woods Hole to Puerto Rico Tranch, North Wall, and Outer Ridge and Return, 21 October–13 December, 1962; Woods Hole Oceanographic Institution: Woods Hole, MA, USA, 1964. [Google Scholar]
- Saunders, A.D.; Tarney, J. The geochemistry of basalts from a back-arc spreading centre in the East Scotia Sea. Geochim. Cosmochim. Acta 1979, 43, 555–572. [Google Scholar] [CrossRef]
- Robertson, A. Metallogenesis along a fossil oceanic fracture zone: Arakapas fault belt, Troodos Massif, Cyprus. Earth Planet. Sci. Lett. 1978, 41, 317–329. [Google Scholar] [CrossRef]
- Hannington, M.; Herzig, P.; Stoffers, P.; Scholten, J.; Botz, R.; Garbe-Schönberg, D.; Jonasson, I.R.; Roest, W. First observations of high-temperature submarine hydrothermal vents and massive anhydrite deposits off the north coast of Iceland. Mar. Geol. 2001, 177, 199–220. [Google Scholar] [CrossRef]
- Wu, S. World Seafloor Hydrothermal Sulfide Resources; Ocean Press: Singapore, 2000. [Google Scholar]
- Bischoff, J.L.; Dickson, F.W. Seawater-basalt interaction at 200 °C and 500 bars: Implications for origin of sea-floor heavy-metal deposits and regulation of seawater chemistry. Earth Planet. Sci. Lett. 1975, 25, 385–397. [Google Scholar] [CrossRef]
- Becker, K.; Herzen, R. Pre-Drilling Observations of Conductive Heat Flow at the Tag Active Mound Using Alvin. Proc. Ocean. Drill. Program Initial. Rep. 2016, 158, 23–29. [Google Scholar]
- Guo, Z.; Chen, C.; Tao, C.; Hu, Z.; Xu, S. Numerical simulation of mineral precipitation process in seafloor hydrothermal circulation. Earth Sci. 2021, 46, 729–742. [Google Scholar]
- Zeng, Z. Submarine Hydrothermal Geology; Science Press: Beijing, China, 2011. [Google Scholar]
- Hannington, M.; Harðardóttir, V.; Garbe-Schönberg, D.; Brown, K.L. Gold enrichment in active geothermal systems by accumulating colloidal suspensions. Nat. Geosci. 2016, 9, 299–302. [Google Scholar] [CrossRef]
- Kawada, Y.; Yoshida, S. Formation of a hydrothermal reservoir due to anhydrite precipitation in an arc volcano hydrothermal system. J. Geophys. Res. Solid Earth 2010, 115, B11106. [Google Scholar] [CrossRef]
- Wang, R. Study on the Coupled Mathematical Model of Stable Temperature Field and Seepage Field in a Single-Fractured Rock Mass. Disaster Prev. Eng. 2006, 6. [Google Scholar]
- Stiller, W. Arrhenius Equation and Non-Equilibrium Kinetics: 100 Years Arrhenius Equation; BSB B.G. Teubner: Stuttgart, Germany, 1989. [Google Scholar]
- Lei, T.; Luo, K.H. Lattice Boltzmann Simulation of Multicomponent Porous Media Flows With Chemical Reaction. Front. Phys. 2021, 9, 715791. [Google Scholar] [CrossRef]
Disclaimer/Publisher’s Note: The statements, opinions and data contained in all publications are solely those of the individual author(s) and contributor(s) and not of MDPI and/or the editor(s). MDPI and/or the editor(s) disclaim responsibility for any injury to people or property resulting from any ideas, methods, instructions or products referred to in the content. |
© 2023 by the authors. Licensee MDPI, Basel, Switzerland. This article is an open access article distributed under the terms and conditions of the Creative Commons Attribution (CC BY) license (https://creativecommons.org/licenses/by/4.0/).