Article

A Zonal Approach for Wide-Area Temporary Voltage Quality Assessment in a Smart Grid

1
Department of Electroenergetics, Faculty of Electrical Engineering, University of East Sarajevo, 30 Vuk Karadžić Street, 71123 East Sarajevo, Bosnia and Herzegovina
2
Department of Computer Science, Faculty of Philosophy, University of East Sarajevo, 1 Aleksa Šantić Street, 71420 East Sarajevo, Bosnia and Herzegovina
*
Author to whom correspondence should be addressed.
Energies 2024, 17(11), 2475; https://doi.org/10.3390/en17112475
Submission received: 26 April 2024 / Revised: 10 May 2024 / Accepted: 13 May 2024 / Published: 22 May 2024
(This article belongs to the Section A1: Smart Grids and Microgrids)

Abstract

:
Wide-area voltage quality assessment represents one of the mandatory objectives for distribution system operators in the development of advanced distribution management systems supporting smart grid requirements. This paper introduces a zonal approach for wide-area temporary voltage quality evaluation in a distribution network. The concept of temporary voltage quality evaluation and assessment is recommended to incentivize active/online management of voltage quality issues. A decision support system based on simple deterministic rules is proposed for rating the voltage quality zones in a distribution network and making recommendations to the distribution system operator. Voltage RMS level, unbalance, and total harmonic distortion are considered voltage quality indices representing the inputs in the decision support system. Residential, commercial, and industrial load types are considered when setting the thresholds for voltage quality indices. The proposed zonal approach for the division of distribution networks in voltage quality zones is applied to the example of a typical European-type distribution network. The operation of a decision support system is tested using the developed distribution smart grid model. The following simulation case studies are conducted: loads with low power factors, manual voltage regulation at MV/LV transformers, unbalanced loads, integration of solar power plant, and nonlinear loads. The obtained simulation results reveal the benefits of the proposed voltage quality assessment approach. Cybersecurity challenges that may impact the proposed approach are addressed, including security vulnerabilities, data privacy, and resilience to cyber threats.

1. Introduction

Power quality (PQ) has recently become an important concept in all areas of energy management systems (EMSs). The distribution network (DN) is the main focus of PQ analysis due to the constantly increasing number of nonlinear loads and integrated distributed energy resources (DERs). The smart grid (SG) concept is envisioned to be supported by an advanced distribution management system (ADMS) that enables a high level of automatic monitoring, control, and recovery [1]. PQ online monitoring and a decision support system (DSS) are expected to be an integral part of ADMS.
PQ can be defined as the combination of voltage quality (VQ) and current quality (CQ). VQ is concerned with deviations of the voltage from the ideal [2]. The majority of distribution network operators (DSOs) in most countries have already established VQ monitoring systems [3]. The primary objective of VQ monitoring is to verify compliance with standards EN 50160 [4] and IEC 61000-3-6 [5] dealing with voltage disturbances. PQ monitoring devices, application techniques, and the interpretation of monitoring results are discussed in IEEE Std 1159-2019 [6].

1.1. Motivation and Incitement

The active PQ management function is envisioned to be the part of the ADMS that supports the SG concept. Online VQ monitoring is a precondition for the development of active PQ management in DNs. There are not many publications dealing with the spatiotemporal assessment of VQ in DNs. Spatial or wide-area analysis is important since voltage disturbances could be widespread in DNs. Temporal analysis is important since voltage disturbances could be of different durations. Advanced metering infrastructure (AMI) is expected to enable both spatial and temporal information on VQ to an ADMS. There is a clear need for research on how to assess spatiotemporal VQ data to provide decision support for DSOs in performing active VQ management functions. The main motivation for research in this paper is to define a suitable framework for wide-area VQ assessment in DNs and to propose a corresponding DSS for timelier active VQ management (10 min-based VQ ratings). The assumption is that suitable and enabling information and communication technologies (ICTs) are available to DSOs.

1.2. Literature Review

A systematic literature review of more than 150 articles on PQ analysis in photovoltaic (PV) systems is presented in [7]. The detection of certain events and seeing the state of the DN are identified as two main objectives of the PQ analysis. The PQ evaluation of PV grid-interfaced inverter systems is analyzed in [8]. A novel method for assessing PQ associated with wind energy integration was recently proposed in [9]. The proposal for an integrated PQ monitoring mechanism for microgrids is elaborated in [10]. The previous papers deal with PQ issues of specific systems (wind, PV, and microgrid) and not with the VQ assessment of DNs in general.
An overview of international industry practice on PQ monitoring is presented in [11]. Useful guidelines on PQ monitoring, considering measurement locations, processing, and presentation of data, are given in [12]. A number of relations between the transition to SG concept and PQ are summarized in [13]. The paper [14] provides an overview of PQ analysis, compensators, and control technologies under the new SG situation. The importance of AMI in SG architecture for online management and assessment of PQ issues was recently elaborated in [15]. The findings of the large-scale and long-lasting PQ monitoring project in Australia are reported in [16]. A proposal for an automatic system for the management of PQ monitoring data from Brazilian utilities is described in [17]. Voltage Quality Index (VQI) is suggested in [18] to integrally reflect frequency, total harmonic distortion, and dissymmetry. PQ evaluation in distributed generation systems based on the unified index combining six PQ metrics is presented in [19]. According to our best knowledge, no research papers have been published that analyze the wide-area assessment of VQ in DNs and introduce the corresponding DSS as a part of an ADMS. This paper represents an attempt to fill the previous research gap.

1.3. Contribution and Paper Organization

The main contributions of this research paper are as follows: the introduction of a zonal approach for wide-area VQ assessment in DN, the proposal of a temporary VQ concept, and the recommendation of DSS for VQ active management based on simple deterministic rules. The introduced zonal approach extends the idea of PQ gray zones (DN areas with violated PQ compliance) proposed in standard EN 50160 [4]. The temporary VQ concept is defined as an idea to actively assess the wide-area VQ state in regular 10 min time intervals, thus enabling timelier VQ management response actions by DSOs. Deterministic rules of DSS for active VQ management are defined separately for the selected VQ metrics of RMS level, unbalance, and total harmonic distortion (THD).
This paper is organized as follows: Section 2 describes wide-area VQ in DN, including VQ metrics and AMI considerations, and introduces a temporary VQ concept. A zonal approach for wide-area VQ assessment in DN is introduced in Section 3, elaborating on DN division in VQ zones and DSS for rating of VQ zones according to different VQ criteria (metrics). The distribution SG model used in numerical analysis is presented in Section 4. The division of the distribution SG model in VQ zones according to the proposed zonal approach is also explained in Section 4. Section 5 presents the main simulation case studies and the corresponding results. The most important cybersecurity challenges are addressed in Section 6. The relevant discussions and future research ideas are given in Section 7, and finally, the paper is concluded in Section 8.

2. Wide-Area Voltage Quality in Distribution Networks

In this paper, a wide-area VQ refers to the analysis of selected VQ metrics over a large area of the distribution network (DN). First, VQ metrics are analyzed at low-voltage loading points (LPs) and then at medium-voltage substation busbars across the DN. In this way, a VQ is assessed using a bottom-up approach related to the voltage levels.

2.1. Voltage Quality Metrics Suitable for Wide-Area Monitoring

Most of the voltage-related electromagnetic phenomena tend to propagate through the DN. Maintaining the nominal voltage RMS levels across the DN’s nodes is a crucial precondition for the normal operation of a DN. Wide-area monitoring of voltage RMS levels is identified as an indispensable function of distribution system operators (DSOs). The mean voltage RMS levels are affected by supply interruptions, voltage sags, and swells. Periodic data on voltage RMS levels provide a time-regular snapshot of the wide-area voltage RMS state in the DN.
In addition to voltage RMS levels, voltage unbalance (UunB) and total harmonic distortion (THDu) are identified as very suitable VQ metrics for wide-area monitoring. Wide-area monitoring of VunB and THDu could unveil their propagation functions and sources in DN. Previous functionality clearly advances the DSO’s assessment of wide-area VQ, which is compliant with the envisioned SG paradigm. According to [4], UunB and THDu are defined as:
U unB [ % ] = U 1 - ns U 1 - ps 100 ,
T H D u [ % ] = n = 2 U n 2 U 1 100 ,
where U1-ns and U1-ps are the RMS levels of negative and positive sequence symmetrical components of the first (fundamental) voltage harmonic, and Un is the RMS level of nth voltage harmonic.

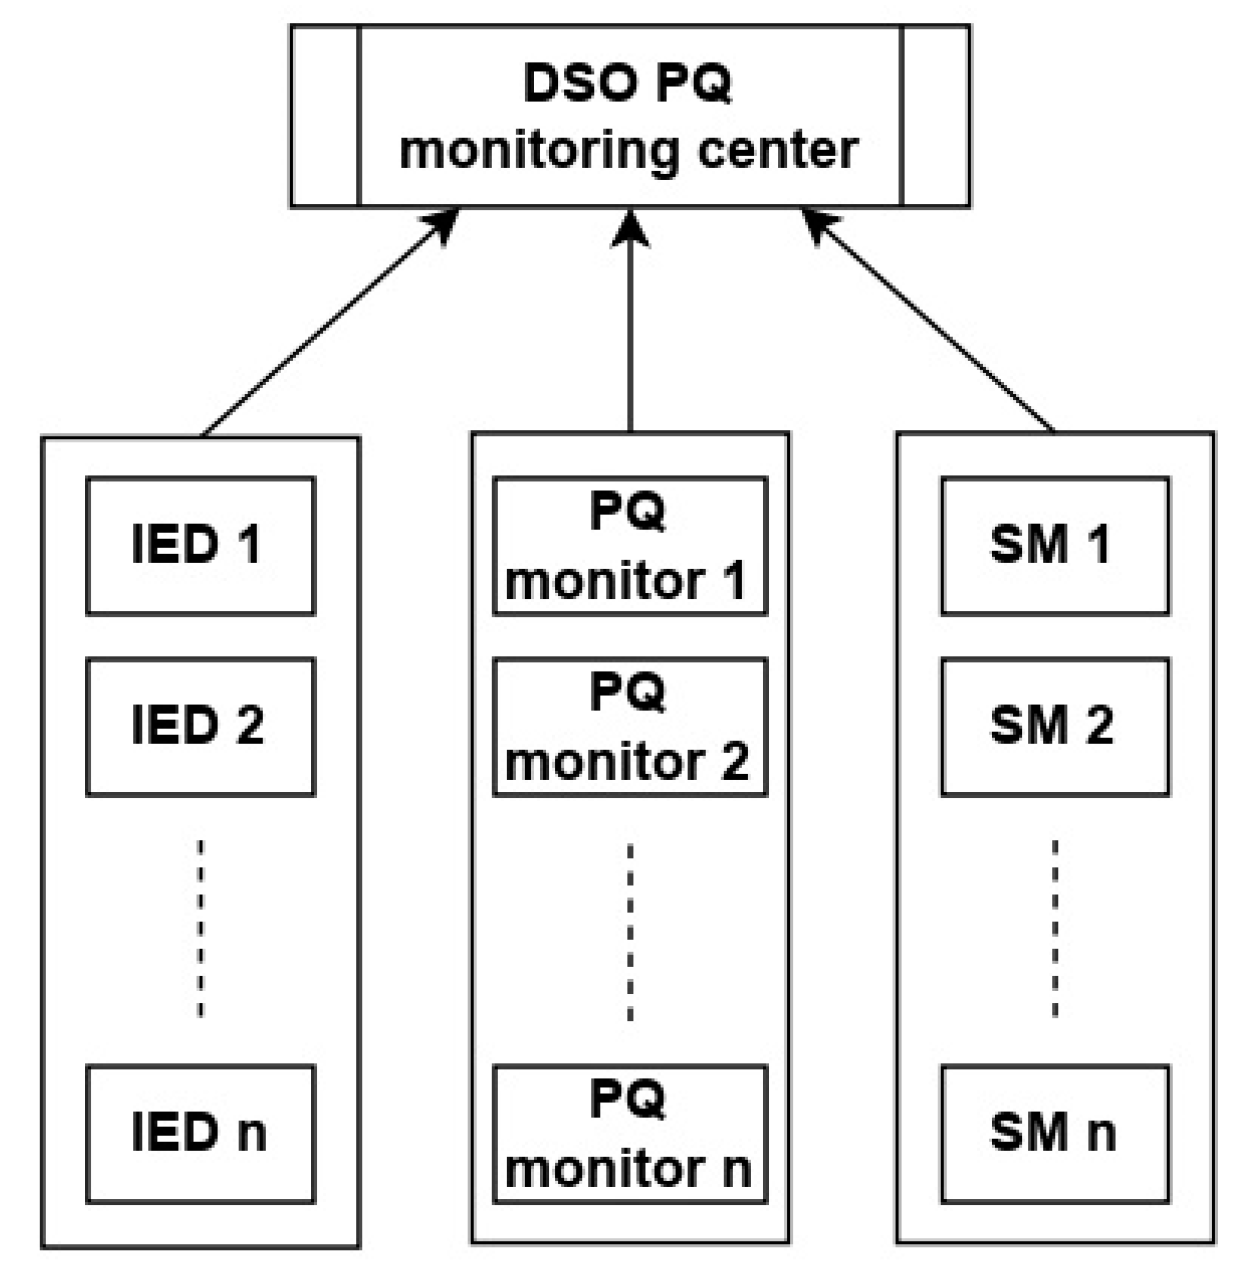
2.2. Advanced Metering Infrastructure Enabling Wide-Area Power Quality Measurements

AMI designed for SG is expected to support the PQ online monitoring function. The online monitoring of PQ indicators is assessed in the same way as the online monitoring of electricity consumption from smart meters (SMs). The conceptualized DSO PQ online monitoring center is presented in Figure 1.
The DSO PQ online monitoring center has the role of collecting and analyzing data from different devices capable of measuring PQ indicators. Intelligent electronic devices (IEDs) are typically located in HV/MV and MV1/MV2 substations across the DN. IEDs are mainly used for power consumption measurements, relay protection, and switching device control. Some of the basic PQ monitoring functions could be embedded into existing IEDs. However, more advanced PQ monitoring functions, such as harmonic measurements, counters of voltage sags and swells, etc., are typically available in electronic devices specifically designed for PQ applications (PQ monitors). IEDs and PQ monitors are typically not available in MV/LV substations; however, smart meters (SMs) with PQ measurement capabilities are being increasingly deployed at the LV network side.

2.3. Real-World Case Studies of Power Quality Monitoring Systems in Distribution Networks

There are many examples of case studies of PQ monitoring in DNs. The example of a project from Australia that contains a large amount of data obtained during long-term PQ measurements by many DSOs is summarized in [16]. The essence of the project is coordinated PQ monitoring, analysis, and network performance capabilities. The objectives of another project [20] are PQ issues in British DN, which are related to the integration of an increasing number of low-carbon technologies (LCTs) connected with power electronic inverters. The analysis is based on the observation of two real power networks differing in their share of LTE technology. During the period from 2011 to 2012 in the Public Electric Utility Elektroprivreda of Bosnia and Herzegovina, three pilot projects were implemented with the goal of testing the PQ monitoring systems of three different equipment manufacturers. All tested systems were based on fixed PQ monitors [21]. A system-wide PQ monitoring project based on 60 PQ monitors started in 2004 in Malaysia [22]. System-wide PQ monitoring at the consolidated Edison company of New York is summarized in [23]. The proposed approach integrates measurements from PQ monitors, digital protective relays, digital fault recorders, SCADA historians, phase angle sensors, battery monitoring systems, and SMs.
Some of the reviewed real-world case studies fall under the category of wide-area PQ monitoring systems. There is a distinct necessity for integrating measurements from various devices, not limited to dedicated PQ monitors. None of the reviewed projects have introduced the concept of temporary VQ evaluation. This paper aims to propose rapid VQ assessments accessible to DSOs at regular 10 min intervals and supported by advanced AMI technologies within the SG framework. Furthermore, a unique and clear zonal approach is suggested for evaluating wide-area PQ and serving as the foundation for a DSS to assist DSOs.

2.4. Temporary Voltage Quality Concept

Assuming the availability of a previously conceptualized PQ online monitoring center, it would be possible to analyze VQ metrics in regular 10 min time intervals over a wide area of DN. Unlike conventional VQ measuring systems, where 10 min mean VQ indicator values are used on a weekly basis to check compliance with relevant standards, this paper proposes a short-term or temporary VQ evaluation.
Temporary VQ ratings are estimated by the PQ monitoring center immediately after receiving 10 min mean VQ indicator values. The illustration of the proposed temporary VQ 10 min time snapshots and ratings is presented in Figure 2.
The proposed temporary VQ ratings are intended to complement the standard-based weekly evaluation of VQ indicators (RMS level, unbalance, and THD). According to relevant standards, VQ indicators are evaluated once a week using 1008 collected 10 min mean measurements. Temporary VQ ratings are recommended to assist DSOs in detecting and improving VQ issues in a timely manner. Using the temporary VQ ratings, the DSO will be able to make temporary decisions leading to an overall improvement in the VQ state before checking for compliance with standards by the end of the measuring week. In the previous sense, wide-area temporary VQ ratings could significantly contribute to the SG paradigm.

3. A Zonal Approach for Wide-Area Temporary Voltage Quality Assessment

To properly assess temporary VQ for a wide area of DN, it is necessary to identify meaningful areas/zones for the analysis of VQ indicators. The zonal approach proposed in this paper is based on considerations of DN topology and rated voltage levels.

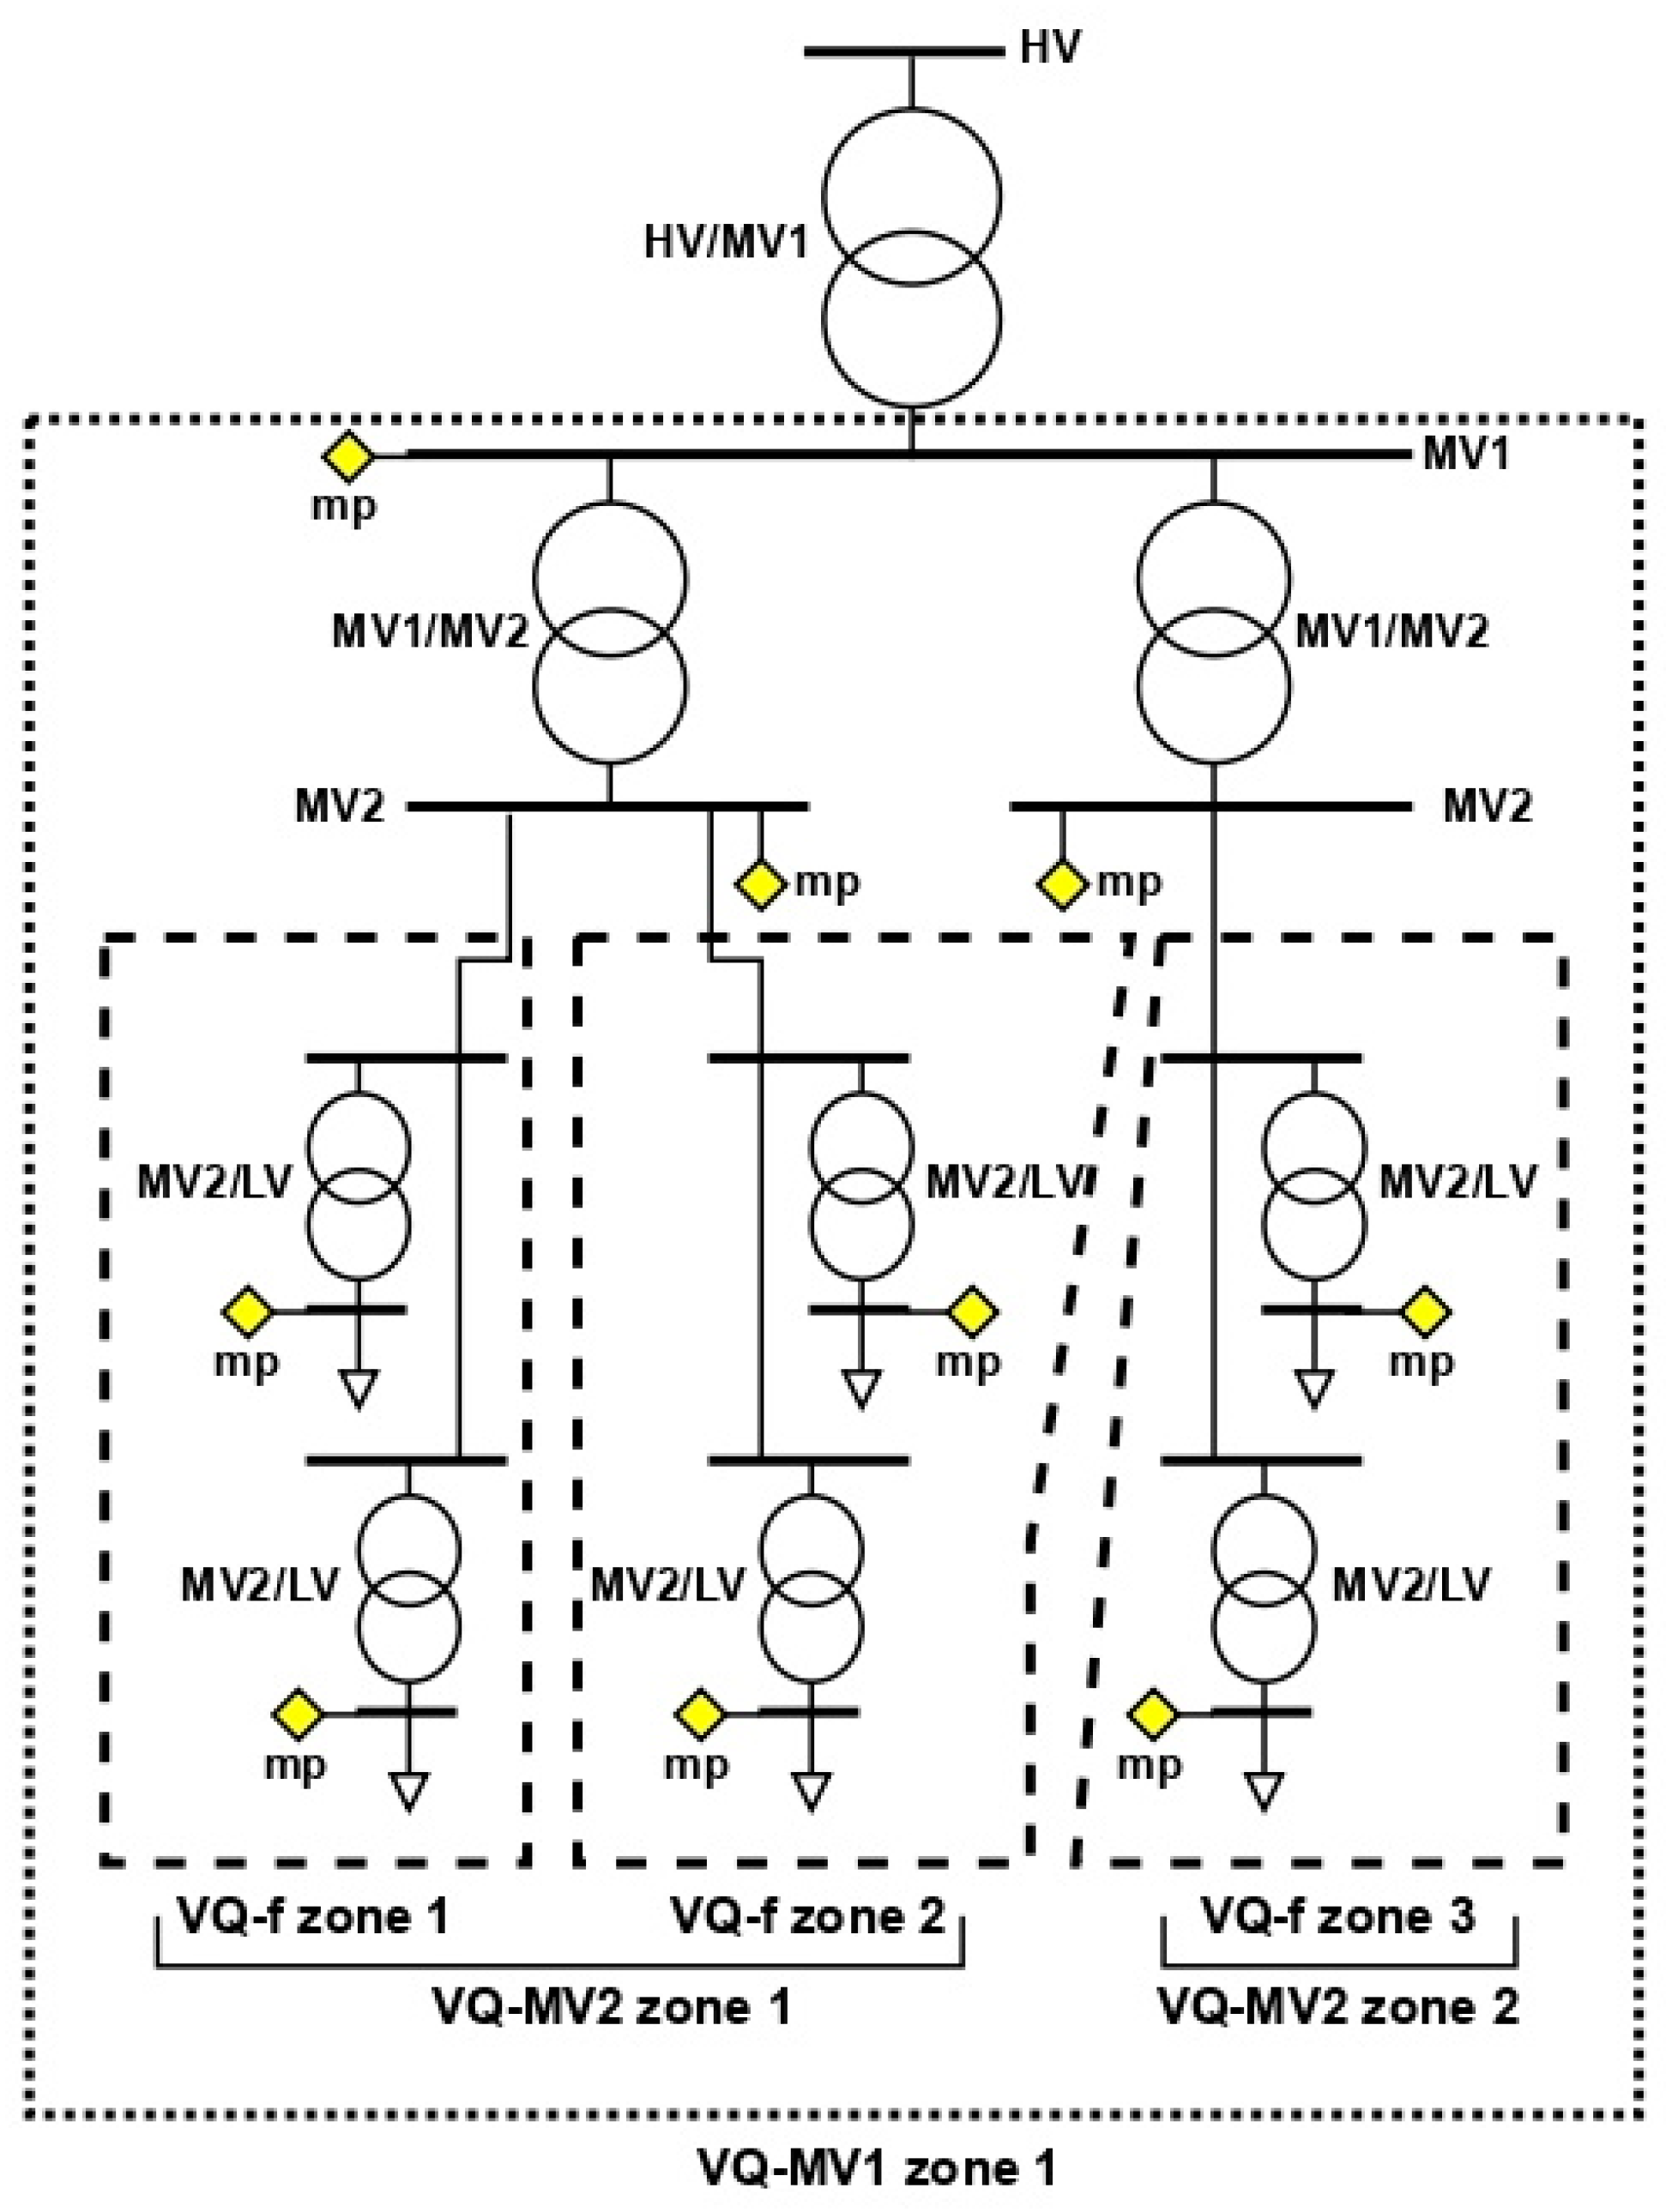
3.1. Distribution Network Division into Voltage Quality Zones

A DN is topologically divided into substations, feeders, and loads. A typical European-type DN includes one or two medium-rated voltage levels (MV1, MV2). In this paper, HV/MV substations are conceptualized as topological boundaries of a DN, as shown in Figure 3.
The primary and simultaneously the largest VQ zone (VQ-MV1 zone 1) is determined by the highest medium voltage level MV1. It starts from the MV1 busbars in the HV/MV1 substation and includes all MV1 feeders and MV1 busbars in the MV1/MV2 substations. The VQ indicators are analyzed at the MV1 level. It is possible to have multiple primary zones in the DN. The number of primary VQ zones in radial DNs is determined by the number of HV/MV1 power transformers. In special cases, the single primary VQ zone could be determined by two HV/MV1 power transformers, as in the case of a closed-ring configuration. Secondary VQ zones are determined by the first lower medium voltage level MV2 (VQ-MV2 zones). The number of secondary VQ zones in radial DNs is determined by the number of MV1/MV2 power transformers. Every secondary VQ zone is divided into feeder VQ zones (VQ-f zones). The number of VQ-f zones for a single zone VQ-MV2 is determined by the number of feeders starting from the corresponding MV2 busbars. VQ-f zones represent the smallest wide-area VQ zone units according to the proposed zonal approach. The VQ indicators for VQ-f zones are analyzed based on the VQ measurements in MV1/MV2 substations and the measurements of SMs at the LV level. The VQ assessment begins with the analysis of VQ indicators at loading or measurement points (mps), as shown in Figure 3. The VQ indicators for VQ-MV2 zones are determined by the VQ indicators for VQ-f zones. The VQ-f zones are encapsulated by VQ-MV2 zones, while VQ-MV2 zones are encapsulated by VQ-MV1 zones.

3.2. A Decision Support System for the Rating of Temporary Voltage Quality Zones

The rating system for temporary VQ zones is designed according to VQ indicators’ value ranges, compliant with EN 50160-2010 standard [4] and zonal/areal DN considerations. The recommended VQ indicators’ value ranges are modified and expanded to enable a greater selection of recommendations available to the proposed decision support system (DSS). The proposed DSS is designed to aid DSOs by recommending the possible type of action (alarm/control/protection). The recommendations are based on 10 min mean values of selected VQ indicators to ensure compatibility with existing PQ monitoring systems regulated by industry standards. DSS does not employ particular control strategies, and it is not equipped for the fast, automatic responses necessary to stabilize the DN during transient and dynamic conditions.
VQ zone ratings and recommendations are defined separately for selected VQ indicators of RMS level, unbalance, and THD, as shown in Table 1, Table 2 and Table 3, respectively.
Five different rating categories are defined for VQ zones based on voltage RMS levels: excellent, good, moderate, bad, and critical. First, the ratings are assigned to loading points (LPs) and then to the feeder, MV2, and MV1 zones. The ratings of higher-level VQ zones are dependent on ratings of lower-level VQ zones. Every VQ LP zone is rated excellent or good if the voltage RMS level is compliant with a standard-defined acceptable range of ±0.1 Un. A moderate rating is assigned to the VQ LP zone if the voltage RMS level is in the range of 0.85–0.9 Un, which is still compliant with the standard. When the voltage RMS level is out of the standard-defined range of 0.85–1.1 Un and the undervoltage and overvoltage protection thresholds are not exceeded, the VQ LP zone is rated bad. In the case when undervoltage or overvoltage protection thresholds are exceeded, the VQ LP zone is rated critical.
VQ LP zone ratings are used to give the corresponding recommendations to the DSO to take action for VQ improvement. There are two types of actions considered: control and protection actions. Control actions are assumed to be performed by PQ control/improvement equipment available in the DN. Protection actions are assumed to be performed by relay protection equipment in the DN. Control actions are divided into urgent and non-urgent. Urgent control actions are the ones expected to be executed before the next VQ 10 min snapshot becomes available. Non-urgent control actions are not required to be executed quickly by the DSO. Their time of execution is up to the specific DSO and DN operation rules.
The rating of excellent gives the recommendation to the DSO that no control action is required (temporary voltage RMS level is excellent at considered LP location). The rating of good gives the recommendation to the DSO that non-urgent control action should be considered. In the case of a moderate rating, the DSO is recommended to execute a non-urgent control action. Since the rating of bad indicates a violation of standard-allowed voltage RMS levels, the DSO is recommended to execute urgent control action. If the corresponding VQ issue is treatable, the DSO will be able to improve the rating before the next VQ 10 min snapshot consideration. Finally, protection actions are recommended in the case of a critical rating. Protection actions are expected to be executed automatically by protection equipment, and the DSO is expected to be notified shortly afterward.
The zone ratings and recommendations are similar in the case of VQ-f zones. Zone ratings depend on the RMS level of voltage at the corresponding busbars connecting the feeders (Ubusbar) and the zone ratings of LPs along the feeder. For example, the moderate rating is assigned to the VQ-f zone if the Ubusbar level is in the standard-allowed range of ±0.1 Un and if the minimum 100% of the corresponding VQ LP zones have a rating of moderate or better (good or excellent). The multiple conditions for the same rating are linked by a logical operator AND. If there is only one VQ LP zone with a rating of bad along the feeder or if the Ubusbar level is out of the range of ±0.1 Un, the VQ-f zone is rated bad or critical.
VQ MV2 zones are rated based on the number of associated VQ-f zones with particular ratings. Similarly, VQ MV1 zones are rated based on the number of associated VQ MV2 zones with particular ratings. The Ubusbar level condition is indirectly included in ratings since VQ-f zones are encapsulated by VQ MV2 zones, and VQ MV2 zones are encapsulated by VQ MV1 zones.
Ratings of VQ zones according to voltage unbalance criteria are shown in Table 2. Four different zone ratings are defined: excellent, good, bad, and critical. The moderate rating is omitted in this case since there is no expanded voltage unbalance range allowed by the standard [4] for LP (low voltage level). In the case of voltage RMS level criteria, the expanded range 0.85–0.9 Un is used for the definition of the moderate rating. The VQ unbalanced zone ratings are correlated with the corresponding recommendations for the DSO.
In the case of VQ LP zones, two voltage unbalance thresholds are defined: UunB-limit-1 and UunB-limit-2. The UunB-limit-1 threshold should be set below the standard-defined threshold of 1.3% to indicate an excellent zone rating. UunB-limit-2 should be set as a boundary between good and bad zone ratings. The VQ LP zone should be rated as bad when the standard-defined threshold is exceeded. However, in the case of voltage unbalance criteria, UunB-limit-1 and UunB-limit-2 are set to different values for different load types. As will be discussed later, some load types are more sensitive to voltage unbalance than others. Similar conclusions hold for the protection settings.
In the case of VQ-f zones, only the UunB-limit-2 threshold is used. There is a single threshold for voltage unbalance recommended by the standard [4] regardless of the DN nominal voltage level. VQ-f zone ratings depend on voltage unbalance at the corresponding busbars connecting the feeders (Ubus-unbalance) and the zone ratings of LPs along the feeder. Similar to voltage RMS criteria, VQ MV2 zones are rated based on the number of associated VQ-f zones with particular ratings, while VQ MV1 zones are rated based on the number of associated VQ MV2 zones with particular ratings.
Ratings of VQ zones according to voltage THD criteria are shown in Table 3. Standard [4] recommends the following voltage THD thresholds: 2.5%, 2%, and 1.5% for rated voltage levels 400 V, 11 kV, and 33 kV, respectively. The same zone ratings are defined as in the case of voltage unbalance criteria: excellent, good, bad, and critical. The VQ THD zone ratings are correlated with the corresponding recommendations for the DSO.
In the case of VQ LP zones, two voltage THD thresholds are defined: THDv-limit-1 and THDv-limit-2. The THDv-limit-1 threshold should be set below the standard-defined threshold of 2.5% to indicate an excellent zone rating. THDv-limit-2 should be set as a boundary between good and bad zone ratings. THDv-limit-1 and THDv-limit-2 are set to different values for different load types. Different load types have different sensitivities to different values of voltage THD. Similar conclusions hold for the protection settings.
When considering VQ-f zones, the threshold related to voltage THD is stricter than in the case of VQ LP zones. The THDv-bus-1-limit threshold should be set to 2% to differentiate between good and bad zone ratings. However, it is meaningful to account for load type sensitivity in settings of THDv-bus-1-limit. The feeders are commonly dominantly loaded by particular load types. Additionally, VQ-f zone ratings also depend on VQ LP zone ratings associated with the considered feeder.
VQ MV2 zones are rated based on the number of associated VQ-f zones with ratings and threshold THDv-bus-1-limit, which is equal to the corresponding one for VQ-f zones (feeders are connected to MV2 busbars). VQ MV1 zones are rated based on the number of associated VQ MV2 zones with ratings and threshold THDv-bus-2-limit. The THDv-bus-2-limit threshold should be set to 1.5% to differentiate between good and bad zone ratings (MV1 busbars). The THDv-bus-2-limit threshold is also dependent on the dominant load type in the VQ MV1 zone. Similar conclusions hold for the protection settings.

3.3. VQ Zone Rating Conditions and Different Load Types

LPs in DNs can be divided into different categories according to dominant load types. The most common load type categories in DNs are industrial, commercial, and residential. The sensitivities of different load types to VQ issues are different. The standard [4] does not recommend different allowed ranges of VQ indicators for different load types. A decision support system proposed in this paper includes recommendations for modifications of ranges of VQ indicators for different load types. A detailed analysis of VQ related to specific loads is out of the scope of this paper. However, VQ zone rating conditions could be easily modified to better describe the VQ issues for specific loads, such as induction motors, home electronic devices, etc.
The ratings of VQ zones according to voltage RMS level criteria accounted for different load types by recommending different undervoltage and overvoltage settings. In the case of residential and commercial loads, the following protection thresholds are recommended: Uundervoltage-prot = 0.8 Un; Uovervoltage-prot = 1.15 Un; Ubus-under-prot = 0.85 Un-busbar; and Ubus-over-prot = 1.15 Un-busbar. And in the case of industrial loads, the following protection thresholds are recommended: Uundervoltage-prot = 0.75 Un; Uovervoltage-prot = 1.15 Un; Ubus-under-prot = 0.8 Un-busbar; and Ubus-over-prot = 1.15 Un-busbar. Industrial loads are generally more robust to undervoltage issues than residential and commercial loads. The undervoltage protection threshold affects the bad and critical ratings of VQ zones (voltage RMS level criteria).
The ratings of VQ zones according to voltage unbalance criteria accounted for different load types by recommending different thresholds. The following voltage unbalance thresholds are recommended: UunB-limit-1 = 0.6%, UunB-limit-2 = 1.3% (industrial load type); UunB-limit-1 = 1%, UunB-limit-2 = 2% (commercial load type); and UunB-limit-1 = 1.5%, UunB-limit-2 = 3% (residential load type). The strictest thresholds are set for industrial load type since the high voltage unbalances commonly cause very high current unbalances. The protection threshold is set using the sensitivity factor k = 1.5: Uunbalance-prot =k·UunB-limit-2.
Different load type categories are also considered in the case of voltage THD criteria. Different thresholds are recommended for residential, commercial, and industrial load types. Residential loads are typically more sensitive to voltage THD than commercial and industrial loads. Many types of residential loads, such as appliances and electronics, are more susceptible to problems caused by harmonics, such as less efficient operation, interference with electronic devices, etc. It could be argued that commercial loads are typically more sensitive to voltage THD than industrial loads. Many types of commercial loads, such as office equipment and lighting systems, are more susceptible to problems caused by voltage THD. Generally, industrial loads are considered to be more robust and able to tolerate higher levels of voltage THD. Considering the previous analysis, voltage THD thresholds are set to be the lowest for residential loads and the highest for industrial loads. The recommended values for voltage THD thresholds are given in Table 4. Since voltage THD criteria are unconventionally used in relay protection, only indicative uniform values of all sensitivity factors are recommended: kr1 = kc1 = ki1 = 3; kr2 = kc2 = ki2 = 2.5; and kr3 = kc3 = ki3 = 2.

4. Distribution Smart Grid Model

Modeling DNs for performing PQ-related studies is not an easy task. Usually, harmonic power flow calculations are recommended in the case of wide-area steady-state analyses. If studying a specific element of a DN or its small part, time domain studies could be used. Wide-area steady-state DN analysis has been performed in this paper. Unconventionally, time domain calculations have been used due to the available computing resources and the designed DN model capabilities. Common modeling approximations related to harmonic power flow calculations have been avoided in this way. Modeling of SGs often includes joint DN and ICT system modeling. The idealized models of measurement and ICT devices have been used in this paper for simplification purposes. Previous models have been mandatory for modeling the proposed temporary VQ monitoring system. Detailed modeling of the ICT system is out of the scope of this paper.
A designed distribution SG (dSG) model unifies the models of basic power system elements (transformers, overhead and cable lines, loads, DERs, etc.), substation switching and measurement devices (circuit breakers, voltage, and current transformers, sectionalizing switches (SSs), etc.), and idealized ICT devices (IEDs, SMs, PQ monitors, DSO monitoring and control center, etc.). The capabilities of the dSG model include transient and steady-state power system studies, balanced and unbalanced three-phase power system operation analysis, power system harmonic analysis, power system short-circuit analysis, automatic voltage regulation (AVR) studies, power system protection studies, advanced metering infrastructure (AMI) studies, energy management system (EMS) studies, etc. The model is numerically implemented using the simulation platform Simulink, available as part of the software package MATLAB 2020b [24].

4.1. Distribution Network Elements, Topology, and Configuration

A typical European-style DN with three MV1/MV2 (33/11 kV/kV) substations in an open-ring configuration has been chosen for analysis. The base (default) configuration of the dSG model is shown in Figure 4. The model of AVR has been activated for HV/MV1 and MV1/MV2 transformers as a part of the base dSG model configuration. The solar power plant (SPP) model is disconnected, and SSs are normally open in the base configuration. The MV1/MV2 substations Sub1 and Sub2 are supplied from the HV/MV1 (132/33 kV/kV) substation mSub1 by the overhead lines OHL11 (12 km), OHL12 (12 km), and OHL2 (8 km), while the MV1/MV2 substation Sub3 is supplied from the same HV/MV substation mSub1 by the overhead line OHL4 (10 km). DN configuration could be switched to a closed ring by energizing the overhead line OHL3 (15 km), thus connecting the substations Sub2 and Sub3. Alternatively, the substation Sub3 could be supplied from another HV/MV substation mSub2 by energizing the overhead line OHL5 (10 km). The rated voltage levels and powers of the models of power system elements are also shown in Figure 4.
Substation Sub1 supplies the suburban residential load area (R-suburban zone Sub11—feeder 1) and two industrial load areas (I zone Sub12—feeder 3 and I zone Sub12—feeder 4). Substation Sub2 supplies the four suburban residential load areas (R-suburban zone Sub21—feeders 5, 6, 7, and R-suburban zone Sub22—feeder 9). SPP with a rated power of 2 MW could be connected to feeder 9. Substation Sub3 supplies the three urban residential load areas (R-urban zone Sub31—cable feeders 1, 2, and 3) and commercial load areas (C zone Sub32—cable feeder 4). The industrial load areas could be alternatively supplied from the substation Sub3 by feeder 8 (4 km). The urban residential load areas could be alternatively supplied from the substation Sub2 by Section 4 of feeder 9 (4 km).

4.2. Determination of VQ Zones

According to the proposed zonal approach, VQ zones have been determined for the case of the proposed DN topology. LPs are automatically determined by the adoption of certain DN topology. All LPs are enumerated using the form Xn1n2. X represents the load type, and n1 and n2 represent the ID numbers of the substation and load. For example, R12 LP represents residential load with ID number 1 supplied from substation 1 (Sub1).
As can be seen in Figure 4, the three VQ-MV1 zones could be determined: Sub1, Sub2, and Sub3. Previous substations determine VQ-MV1 zones since the corresponding 33 kV busbars exist. The main supplying substations mSub1 and mSub2 are not considered VQ-MV1 zones since there are no feeders supplying the loads from them directly.
VQ-MV1 zone Sub1 encapsulates the two VQ-MV2 zones Sub11 and Sub12, since there are two MV1/MV2 transformers in Sub1. VQ-MV2 zone Sub11 encapsulates only one residential VQ-feeder zone Sub11-feeder 1. Only feeders supplying loading areas are considered VQ-feeder zones. VQ-feeder zone Sub11-feeder 1 encapsulates six VQ LP zones. VQ-MV2 zone Sub12 encapsulates the following two industrial VQ-feeder zones: Sub12-feeder 3 and Sub12-feeder 4.
VQ-MV1 zone Sub2 encapsulates the following two VQ-MV2 zones: Sub21 and Sub22. VQ-MV2 zone Sub21 encapsulates the following residential VQ-feeder zones: Sub21-feeder 5, Sub21-feeder 6, and Sub21-feeder 7. Previous VQ-feeder zones encapsulate two, three, and five VQ LP zones, respectively. VQ-MV2 zone Sub22 encapsulates only one residential VQ-feeder zone, Sub22-feeder 9. The previous VQ-feeder zone encapsulates five VQ LP zones.
Finally, VQ-MV1 zone Sub3 encapsulates the following two VQ-MV2 zones: Sub31 and Sub32. VQ-MV2 zone Sub31 encapsulates the following urban residential VQ-feeder zones (cable feeders): Sub31-c-feeder 1, Sub31-c-feeder 2, and Sub31-c-feeder 3. Previous VQ-feeder zones encapsulate three, two, and two VQ LP zones, respectively. VQ-MV2 zone Sub32 encapsulates the one commercial VQ-feeder zone (cable feeder), Sub32-c-feeder 4. The previous VQ-feeder zone encapsulates four VQ LP zones.
The determined VQ-feeder zones in the DN base configuration are marked with different colors to highlight the different load types (Figure 4). Different reconfiguration actions in the DN could lead to different VQ zone encapsulations.

5. Simulation Case Studies and Results

The time domain power system analysis was performed to estimate the values of VQ indicators simulating 10 min average values of PQ indicators expected to be collected by the DSO PQ monitoring center, as conceptualized in Figure 1. Measuring sources (IEDs, PQ monitors, SMs) are indicated as measuring points in Figure 2. VQ indicator compliance with standard-defined constraints has been analyzed based on the results of the simulation case studies. The classification and rating of determined VQ zones have been performed according to the rules of the proposed temporary VQ decision support system. The following simulation case studies have been analyzed: DN operation—a base case, the impact of loads with low power factors, the impact of manual voltage regulation at MV/LV transformers, the impact of unbalanced loads, the impact of the integration of SPP, and the impact of nonlinear loads.

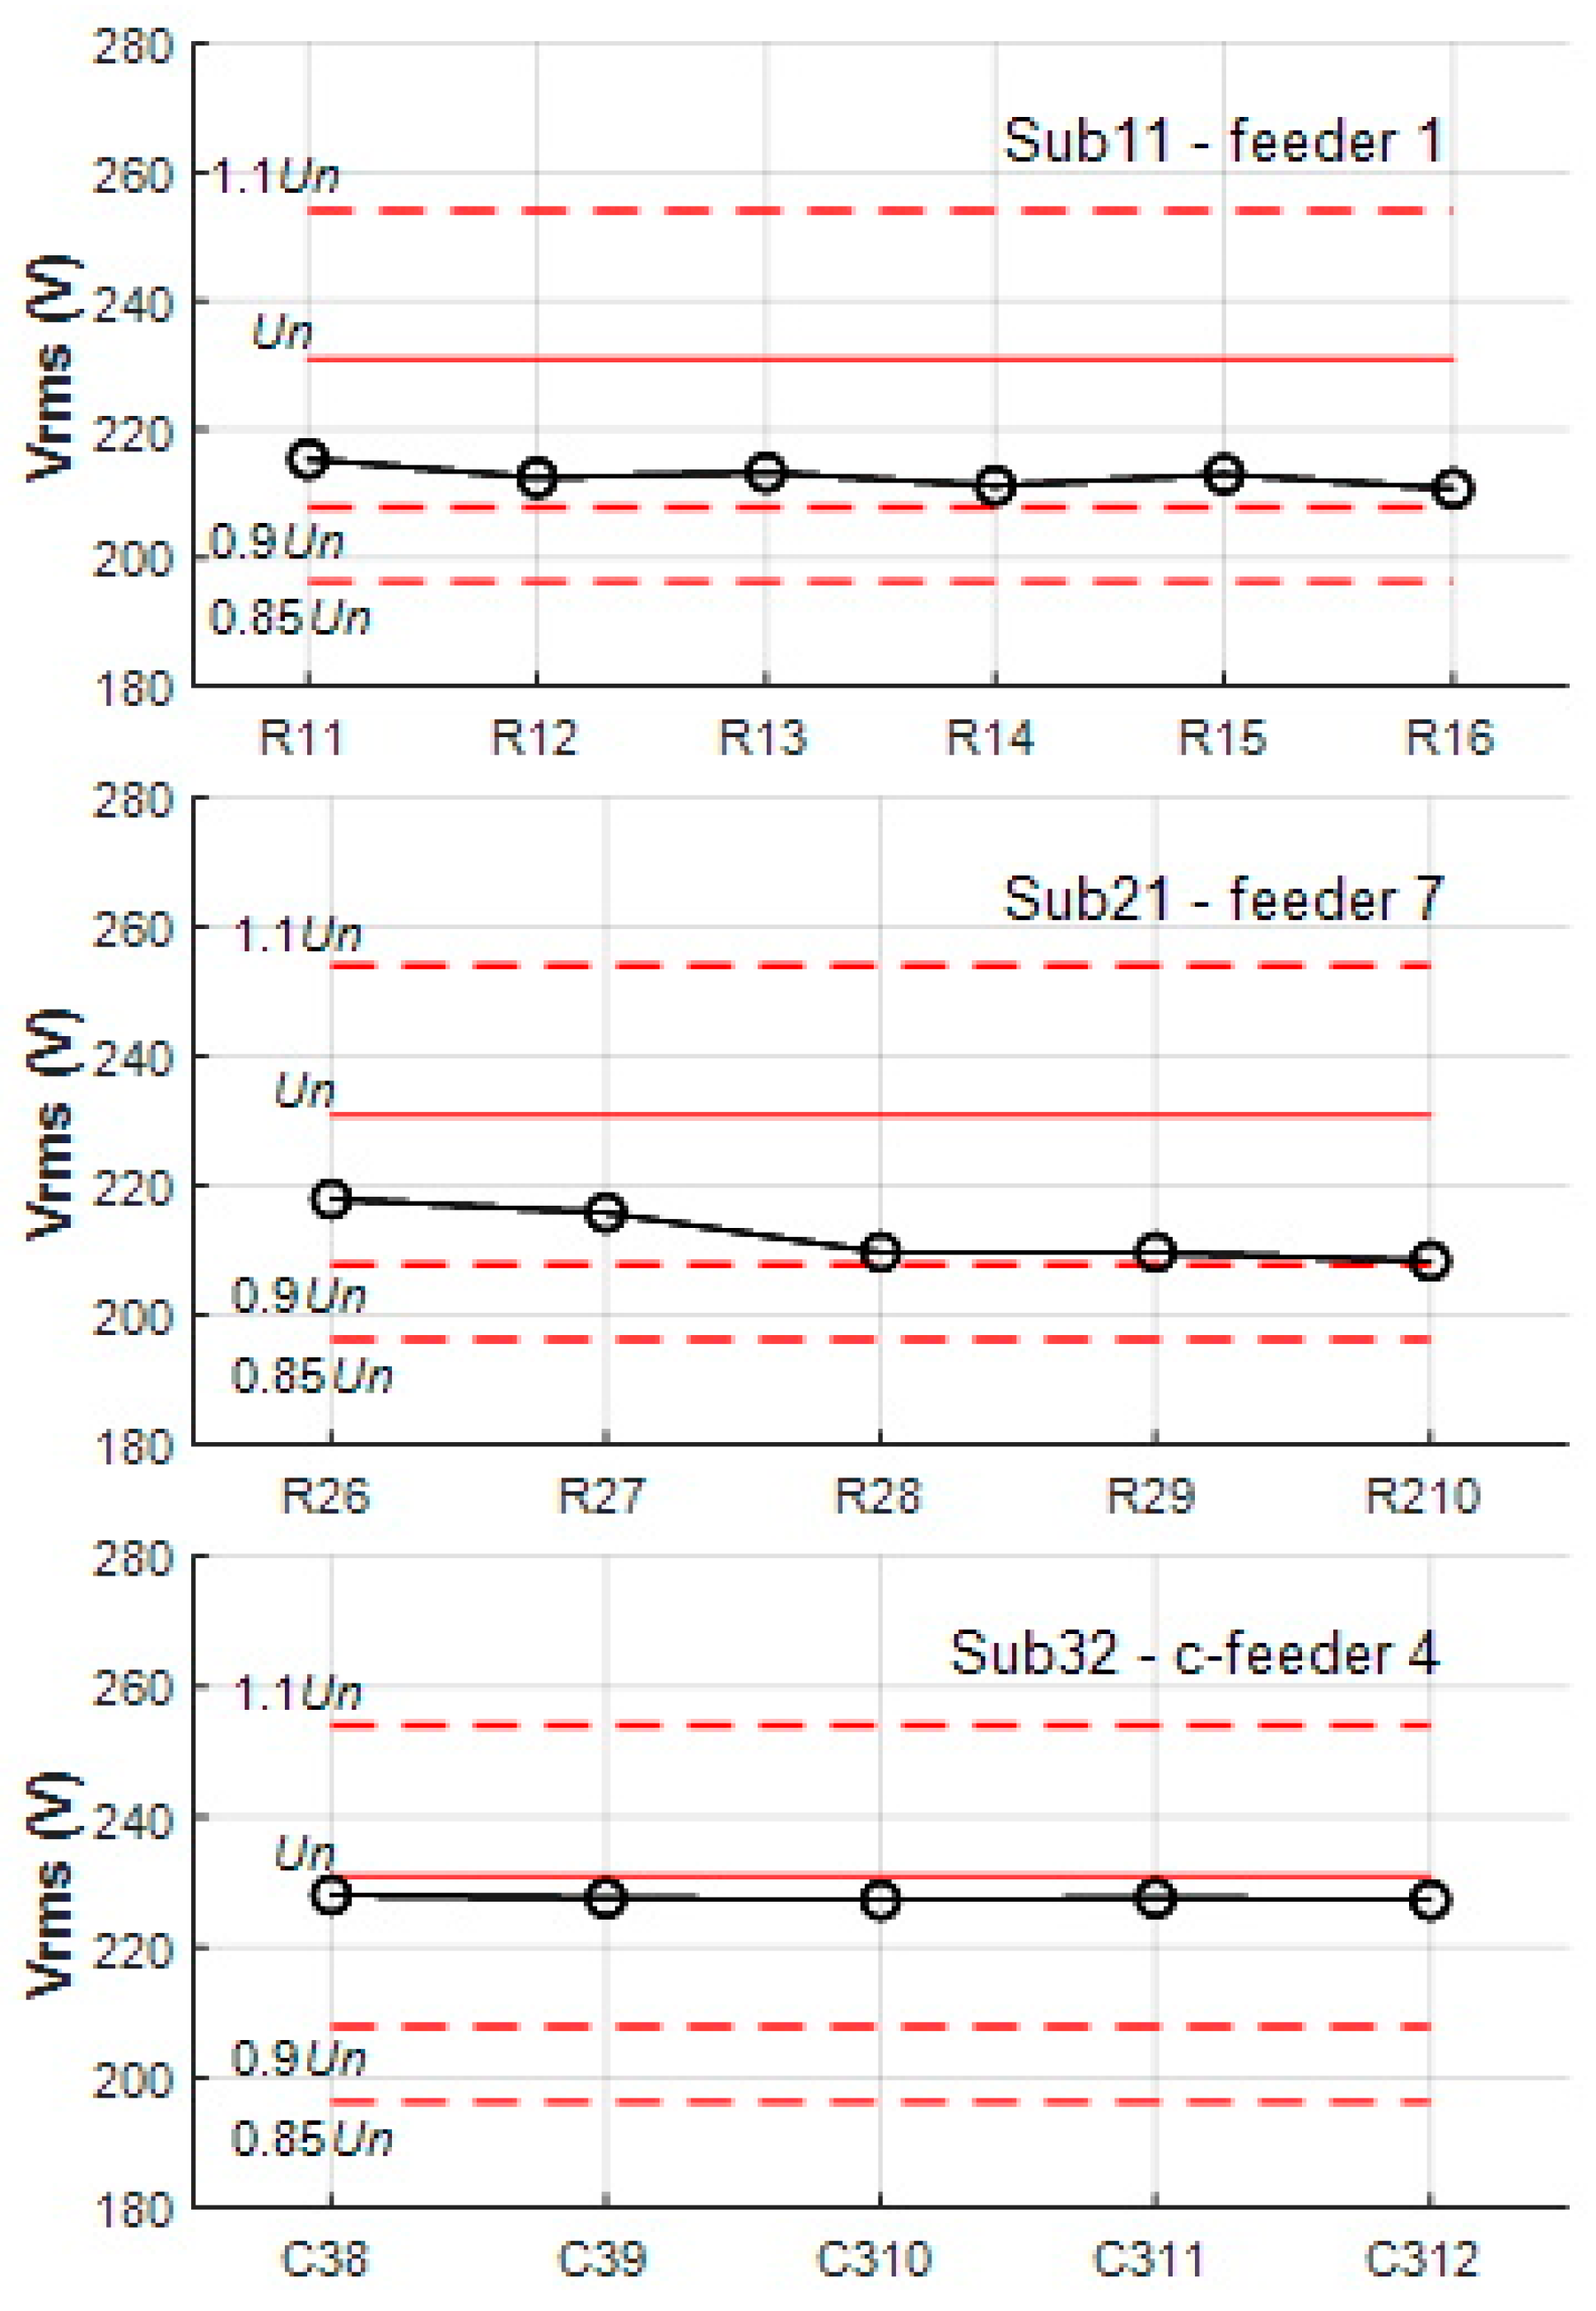
5.1. Distribution Network Operation—A Base Case

A base case of DN operation is determined by the base configuration of the DN model (Figure 4), nominal loading, and activated AVR at HV/MV1 and MV1/MV2 transformers. On-load tap-changer (OLTC) parameters are set as follows: voltage step = 1.25%, number of steps = ±16, deadband/2 = 0.75 × voltage step, and reference voltage = 1 pu.
The simulation stops when all OLTCs converge to final step positions. The final positions of OLTC steps determine the analyzed steady states of the DN. The previous steady states of the DN are used to represent temporary VQ states (simulated 10 min average values).
The voltage RMS level profiles of feeders Sub11—feeder 1, Sub21—feeder 7, and Sub32—c-feeder 4 are shown in Figure 5. The ratings of VQ-MV1 and VQ-MV2 zones are shown in Table 5, while the ratings of VQ LP and VQ-f zones are shown in Table 6.
Sub11—feeder 1 voltage RMS profile curve is in proximity to the 0.9Un limit under nominal loading conditions. The same conclusion holds for the Sub21—feeder 7 voltage RMS profile curve for remote loads R28, R29, and R210. Sub32—c-feeder 4 voltage RMS profile curve is in proximity to the Un under nominal loading conditions. Cable feeders are of short lengths, consequently leading to lower voltage drops.
According to the results in Table 5 and Table 6, the overall rating of temporary VQ based on voltage RMS level criteria is between good and excellent. VQ-f zones Sub11-feeder 1, Sub21-feeder 7, and Sub22-feeder 9 are rated good, with all corresponding VQ LP zones rated good. The DSO is recommended to consider non-urgent control actions to additionally improve VQ (Table 1). All VQ-f zones of VQ-MV1 zone Sub3 are rated excellent, and no control actions are required. AVR is able to achieve a good VQ quality.

5.2. Loads with Low Power Factors

In the previous base case of DN operation, all loads were assumed to have power factors of 0.95. The following power factors are assumed for different loads in this case study: 0.85—residential suburban, 0.9—residential urban, 0.85—commercial, 0.7—industrial I11, and 0.8—industrial I12 and I13. Nominal active power loading has also been assumed.
The voltage RMS level profiles of feeders Sub11—feeder 1, Sub21—feeder 7, and Sub12—feeder 3 and 4 are shown in Figure 6. The ratings of VQ-MV1 and VQ-MV2 zones are shown in Table 7, while the ratings of VQ LP and VQ-f zones are shown in Table 8. The ratings of VQ-f and VQ LP zones encapsulated by VQ-MV1 zone Sub3 are equal as in the DN base case (excellent). The VQ rating in Sub3 has not been changed when compared to the DN base case.
According to the results from Figure 6, voltage RMS profile curves have been reduced in the case of loads with low power factors (blue lines). Since more reactive power was demanded by loads, the voltage drops increased when compared with the DN base case (black lines). The worst-case voltage reduction occurred on industrial feeders Sub12-feeder 3 and Sub12-feeder 4.
The results related to the decision support system, shown in Table 7 and Table 8, clearly indicate the deterioration of VQ based on the voltage RMS level criteria. Sub1 and Sub2 VQ-MV1 zone ratings declined from good to moderate status. VQ ratings have declined in three VQ-MV2 zones and five VQ-f zones. Remote suburban residential loads and industrial loads have been affected the most by lower VQ ratings. The DSO is alerted to perform a non-urgent control action by the decision support system. Since standard-defined voltage RMS thresholds have not been violated, urgent control actions are not mandatory. Power factor correction procedures could be initiated to improve voltage RMS levels if available to the DSO direct control. Manual voltage regulation at MV2/LV transformers could be considered to support AVR, especially if VQ ratings remain at the corresponding values for a longer period. VQ-MV1 zone Sub3 (urban area) has not been affected by lower VQ ratings.

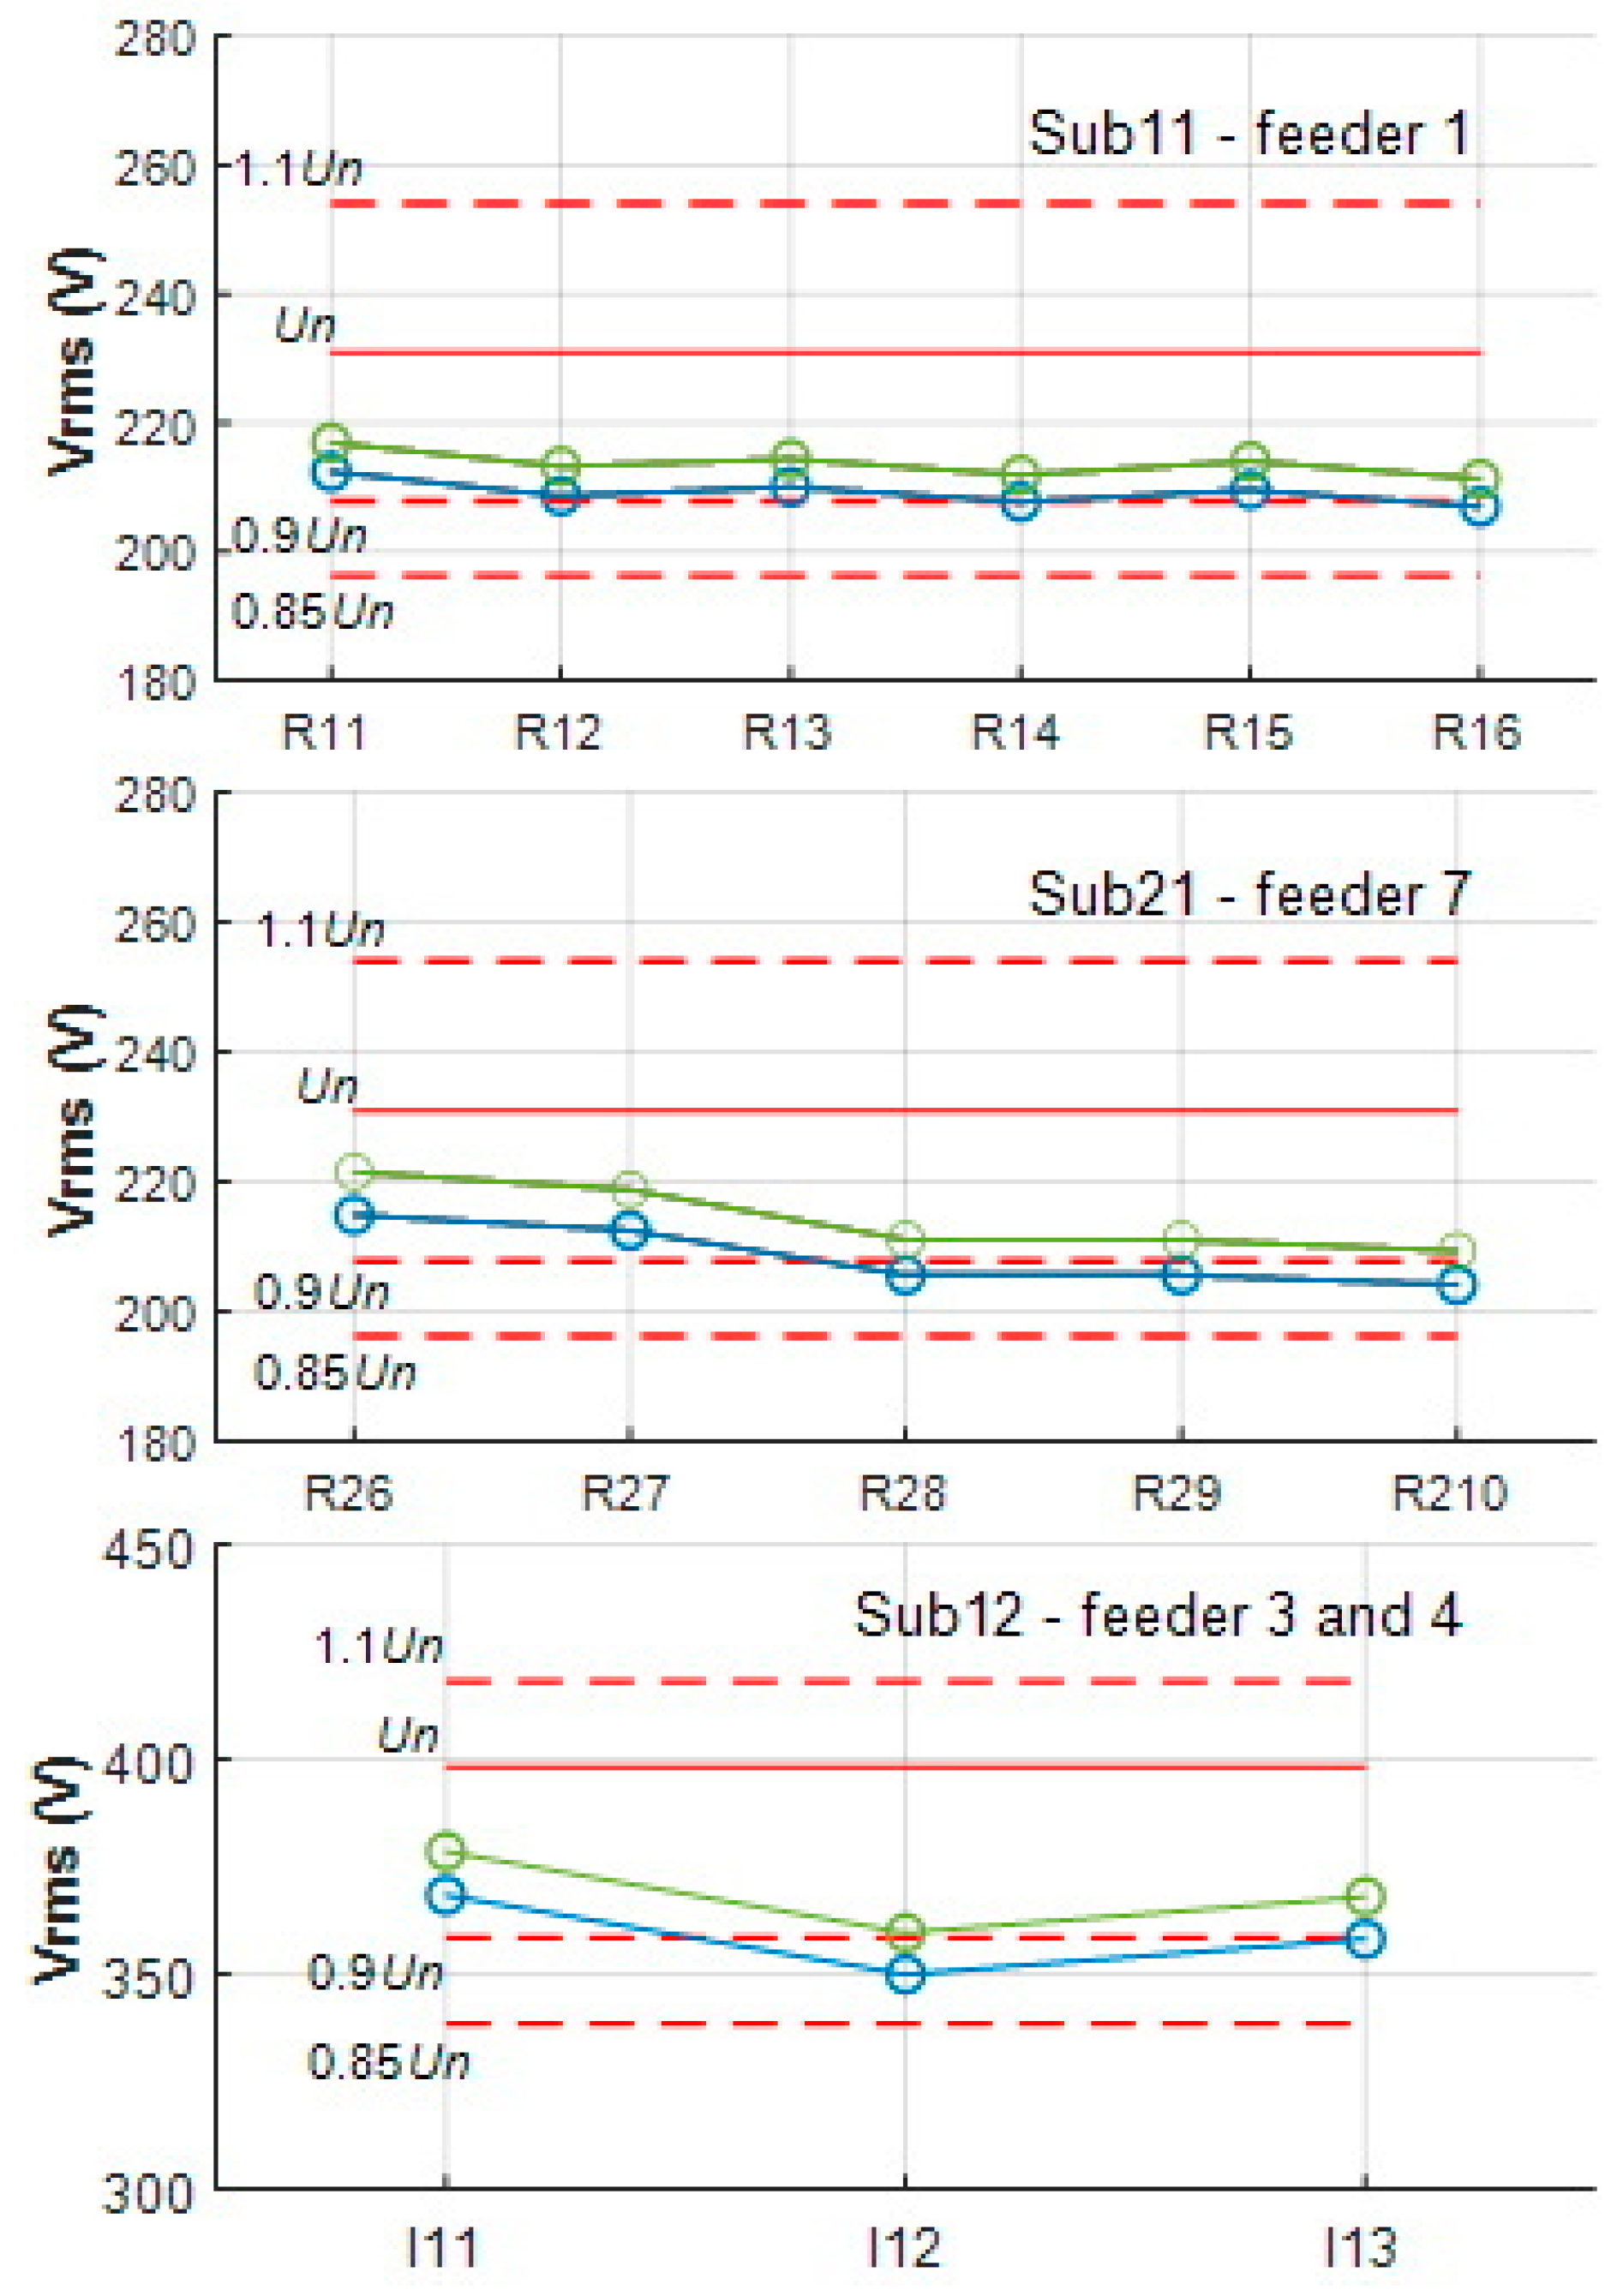
5.3. Manual Voltage Regulation at MV2/LV Transformers

In this simulation case study, the same power factors have been assumed for loads as in the previous case (loads with low power factors). Manual voltage regulation at MV2/LV transformers has been simulated in addition to the existing AVR at HV/MV1 and MV1/MV2 transformers. The parameters of the manual tap changer are voltage step = 2.5% and the number of steps = ±2. Manual tap changers at all MV2/LV transformers belonging to Sub1 and Sub2 have been set to increase the secondary voltage by 2.5% and 5%, respectively. Manual voltage regulation has not been applied to MV2/LV transformers belonging to Sub3 since VQ ratings were already excellent in the previous case.
Voltage RMS level profiles of feeders Sub11—feeder 1, Sub21—feeder 7, and Sub12—feeder 3 and 4 are shown in Figure 7. The ratings of VQ-MV1 and VQ-MV2 zones are shown in Table 9, while the ratings of VQ LP and VQ-f zones are shown in Table 10.
According to the results from Figure 8, the voltage RMS level profiles of all considered feeders improved after applying manual voltage regulation (green curves). Even the voltage RMS level of industrial load I12 is higher than the 0.9Un threshold. VQ-MV1 zones Sub1 and Sub2 are rated with a good grade because of the new, improved rating of VQ-MV2 zones Sub12, Sub21, and Sub22 (Table 9). The ratings of VQ-f zones are back to the levels from the DN base operation case. According to the results in Table 10, there are no moderate ratings in the case of any VQ LP zone. The four VQ LP zones, R24, R26, R211, and R212, improved ratings to better levels than in the DN base operation case. The value of manual voltage regulation in terms of improving voltage RMS levels is clearly demonstrated. The decision support system rated overall wide-area VQ in DN as good or excellent in the considered case. The DSO is advised to only consider additional non-urgent control actions to further improve voltage RMS levels. The DSO could initiate power factor correction procedures (if available) instead of manual voltage regulation to lower the voltage drop burden at MV2/LV transformers and save the tap changers’ operations.

5.4. Unbalanced Loads

Besides the voltage RMS level, the voltage unbalance represents an important VQ issue to deal with in DNs. The ratings of VQ zones based on voltage unbalance criteria are shown in Table 2 as part of the proposed VQ decision support system.
In this simulation case study, unbalanced loading has been assumed at the following suburban feeders: Sub11—feeder 1, Sub21—feeder 7, and Sub22—feeder 9. All loads connected to Sub11—feeder 1 have been assumed to be equally unbalanced. The following load active powers have been set per different phases: PA = Pn, PB = 0.9Pn, and PC = 0.8Pn. The underloading has been set in phases B and C. Uniform unbalance conditions have been assumed for all loads connected to Sub21—feeder 7. The following load active powers have been set per different phases: PA = Pn, PB = Pn, and PC = 0.6Pn. The previous is the case of the significant underloading (40%) in phase C. Finally, all loads connected to Sub22—feeder 9 are assumed to be equally unbalanced with the following active powers set per different phases: PA = Pn, PB = 0.2Pn, and PC = 0.5Pn. The previous is the case of the critical unbalance loading. All remaining loads in the DN have been assumed to be balanced.
Voltage unbalance profiles of feeders Sub11—feeder 1, Sub21—feeder 7, and Sub22—feeder 9 are shown in Figure 9. The ratings of VQ-MV1 and VQ-MV2 zones are shown in Table 11, while the ratings of VQ LP and VQ-f zones are shown in Table 12.
According to the results from Figure 8, the highest voltage unbalance is present at Sub22—feeder 9. Even the adopted unbalance protection threshold is reached. In the case of Sub21—feeder 7, the first unbalance threshold is reached for three remote loads. And finally, the voltage unbalance measured at all loading points is lower than the first unbalance threshold in the case of Sub11—feeder 1.
VQ-MV1 zone Sub1 is rated good because VQ-MV2 zone Sub12 (industrial area) is rated good (Table 11). VQ-f zone Sub11—feeder 1 is rated excellent, as shown in Table 12, which is anticipated since the corresponding voltage unbalance feeder profile curve is below the first unbalance threshold (Figure 8).
VQ-f zones Sub12—feeder 3 and 4 (industrial loads) are assigned a good rating because of unbalance loading of Sub11—feeder 1 (suburban residential loads). Voltage unbalance thresholds are set lower in the case of industrial loads by the decision support system. The DSO is recommended to initialize a non-urgent control action to mitigate voltage unbalance in the considered area.
VQ-f zones Sub21—feeder 5 and 6 (suburban residential loads) are rated excellent, besides the rating of VQ-MV1 zone Sub2, which is critical, as shown in Table 11. The rating critical for VQ-MV1 zone Sub2 is a consequence of the rating critical for VQ-MV2 zone Sub22. The worst rating of critical is assigned to VQ-f zone Sub22—feeder 9, which is expected if observing the voltage unbalance profile of the corresponding feeder (Figure 8). VQ LP zones R214 and R215 are rated critical. The DSO is alerted to initiate an urgent control/protection action to mitigate the voltage unbalance. VQ-f zone Sub22—feeder 7 is rated as good but does not significantly affect the adjacent VQ-f zones Sub21—feeder 5 and 6 (Table 12). VQ-MV1 zone Sub3 is not significantly affected by voltage unbalance, and it is rated as excellent (Table 11).
The considered simulation case study reveals the benefits of wide-area voltage unbalance assessment for the DSO. Using the proposed decision support system, the DSO can detect critical VQ zones and simultaneously analyze the effects on other VQ zones in the DN (wide-area propagation of voltage unbalance).

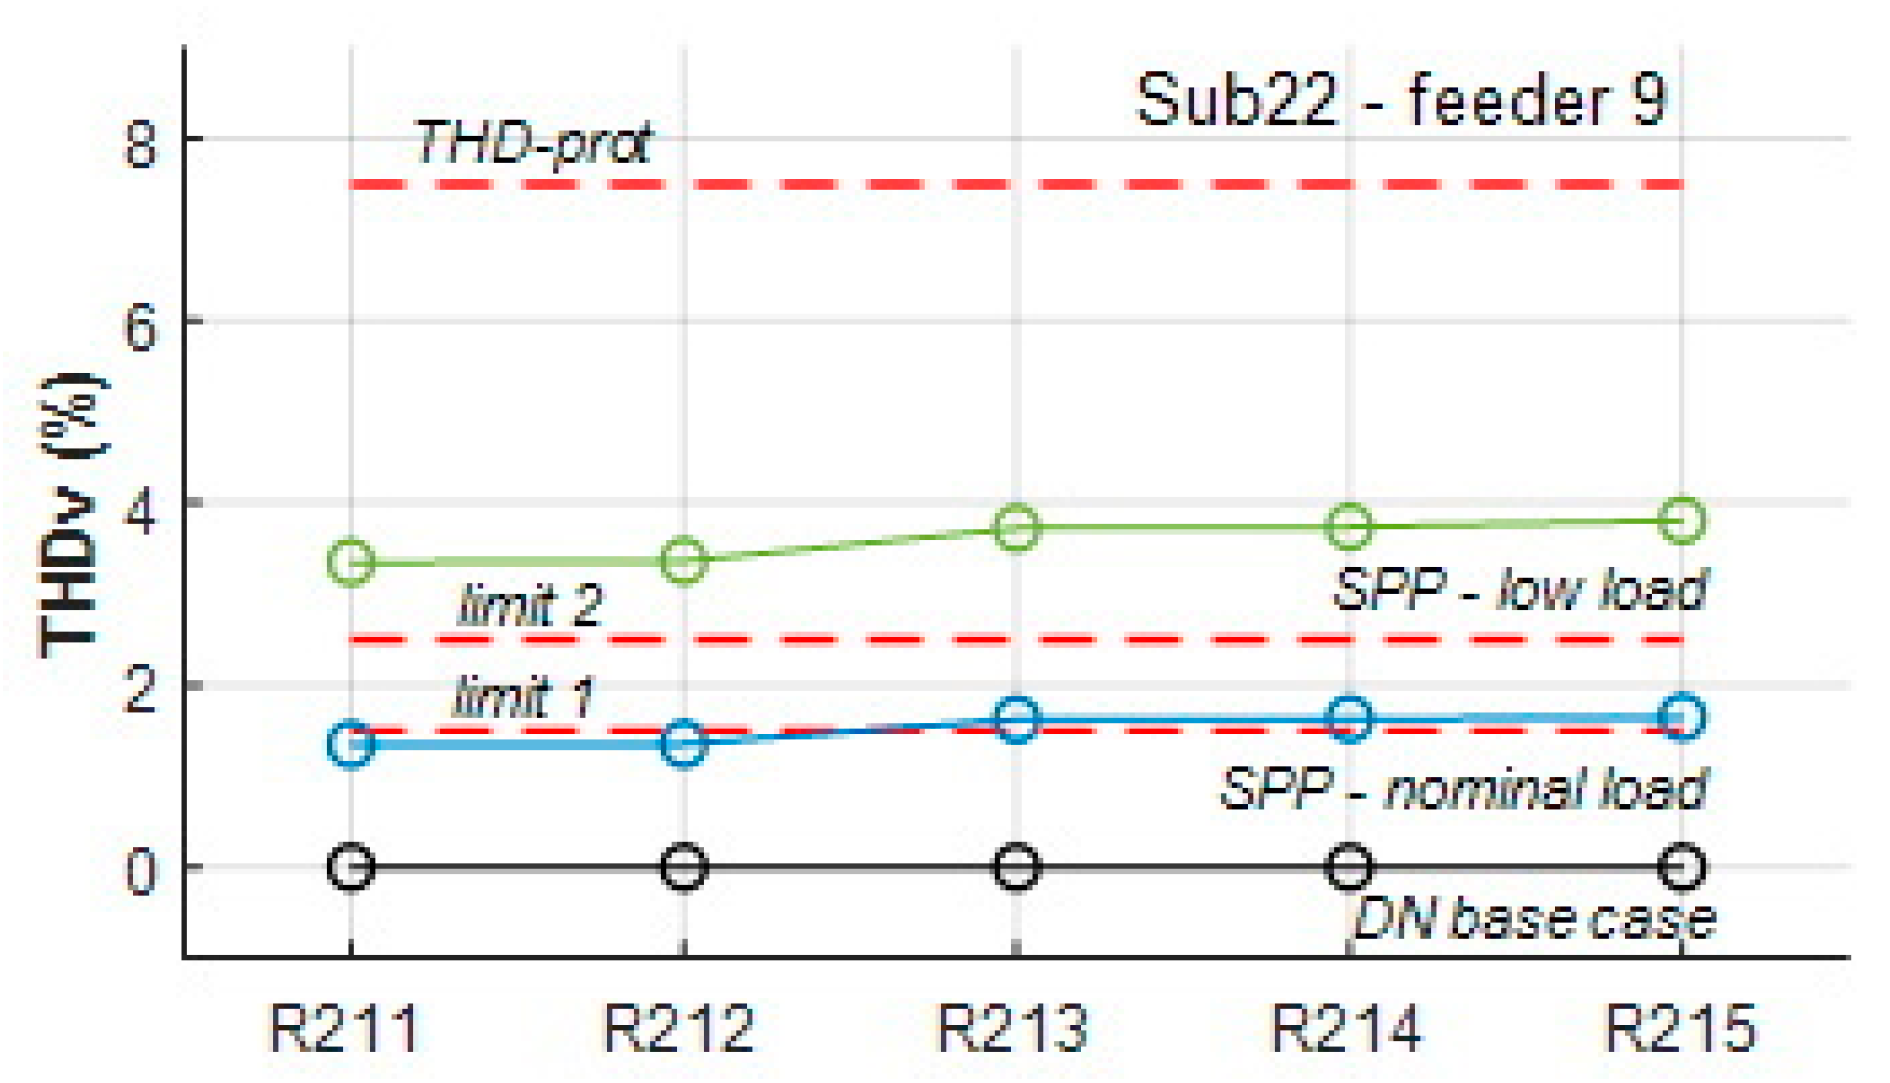
5.5. Integration of Solar Power Plant

This simulation case study analyzes the impact of 2 MW SPP integration at Sub22—feeder 9, 3 km from Sub2 (Figure 4), on voltage RMS levels and voltage THDs. The cases of nominal and low feeder loading have been considered. The low feeder loading has been assumed to be 10% of the nominal feeder loading.
A 2 MW SPP model embedded in the Simulink platform [24] has been used in this analysis. The embedded model has been developed according to recommendations available in papers [25,26]. The previous model has been slightly modified to support the analysis in this paper. The nominal frequency of 50 Hz has been set instead of the default frequency of 60 Hz. A reactive power regulator has been modified to enable SPP operation with an approximate unity power factor (>0.99). The discrete simulation step has been set to 0.05 ms to exactly match the discrete simulation step used for the dSG model. The SPP model is connected to Sub22—feeder 9 through a 0.5/11 kV/kV substation transformer with a rated power of 2.25 MVA, as shown in Figure 4.
SPP consists of two PV arrays with rated powers equal to 1.5 MW and 0.5 MW at standard conditions (1000 W/m2 irradiance and 25 °C cell temperature). Boost converters are individually controlled by the maximum power point tracking (MPPT) perturb and observe techniques. A three-level neutral point clamped (NPC) inverter has been used to convert the 1000 V DC voltage to 500 V AC voltage. DC voltage regulation has been applied to maintain the DC voltage to a constant value of 1000 V.
The voltage RMS level and THD profile of Sub22—feeder 9 are shown in Figure 9 and Figure 10, respectively, for the case studies of DN base case, integration of SPP with nominal feeder loading, and integration of SPP with low feeder loading.
According to the results shown in Figure 9, the integration of SPP improves the voltage RMS profile of the nominally loaded feeder when compared to the DN base case. In the case of low feeder loading, overvoltages occur after the integration of SPP. However, voltage RMS levels remain lower than the 1.1 Un threshold.
Since there are no nonlinear loads and power electronic converters, voltage THD values are negligible in the DN base case, as shown in Figure 10. The operation of power electronic converters causes an increase in voltage THD values after the integration of SPP. The first adopted THD limit is overreached for loads R213, R214, and R215 in the case of nominal feeder loading. The second adopted THD limit is overreached for every load in the case of low feeder loading.
The ratings of VQ LP zones encapsulated by VQ-f zone Sub22-feeder 9 based on the voltage RMS level for the cases of DN base operation and SPP integration with nominal and low feeder loading are shown in Table 13. The corresponding ratings based on voltage THD criteria are shown in Table 14. The results from Table 13 indicate the improvement of the VQ-f zone Sub22-feeder 9 rating based on the voltage RMS level criteria after the integration of SPP. The VQ-f zone is rated excellent in both cases of nominal and low feeder loading. Additionally, all VQ LP zones are rated excellent in both previous cases. VQ-MV2 zone Sub22 is rated excellent, and VQ-MV1 zone Sub2 is rated good, as in the DN base case. All remaining VQ zones in the DN are rated the same as in the DN base case. No control actions are recommended to the DSO; however, the overvoltage case should be monitored regularly. The significant effects of SPP integration are constrained only to VQ-f zone Sub22-feeder 9 (the ratings of other VQ zones are unchanged).
According to the results shown in Table 14, SPP integration caused a decrease in VQ-f zone Sub22-feeder 9 rating based on voltage THD criteria. In the case of nominal feeder loading, VQ-f zone Sub22-feeder 9 is rated good. VQ LP zones R213, R214, and R215 are rated good. VQ-MV2 zone Sub22 is rated good, and consequently, VQ-MV1 zone Sub2 is also rated good. Feeder loads are only partially supplied by SPP power in the case of nominal loading. The remaining power is supplied from the DN (Sub2). The DSO is recommended to initiate a non-urgent control action to mitigate voltage harmonics.
In the case of low feeder loading, VQ-f zone Sub22-feeder 9 is rated bad. All VQ LP zones are rated bad. VQ-MV2 zone Sub22 is rated bad, and consequently, VQ-MV1 zone Sub2 is also rated bad. Feeder loads are completely supplied by SPP power in the case of low loading. The power flow on feeder section f9s1 connecting SPP and Sub2 (Figure 4) is reversed in this case. The previous conditions cause higher voltage THD values at loading points, as shown in Figure 11. The DSO is recommended to initiate an urgent control action to mitigate voltage harmonics. Harmonic filtering procedures could be initiated if available to the DSO. In the case of a fast enough response (remote filtering control), the following VQ 10 min time snapshot could be improved. Since there is no significant voltage THD increase in all remaining VQ zones in the DN (the ratings remain unchanged when compared to the DN base case), the DSO is aware that the voltage THD issue is constrained only to VQ-f zone Sub22-feeder 9.

5.6. Nonlinear Loads

Several types of nonlinear loads have been considered in this simulation case study:
  • Six-pulse voltage-source adjustable speed drive (ASD)
  • Data center-personal computer (PC)
  • Residential air conditioner (RAC)
  • Fluorescent lighting-magnetic ballast (FL-MB)
  • Fluorescent lighting-electronic ballast (FL-EB)
A harmonic current injection method has been used to model the nonlinear loads at harmonic frequencies. The odd and even harmonic frequencies have been considered with the upper limit of 19 × base frequency (19 × 50 Hz). It has been assumed that all nonlinear loads are connected at the low voltage level sides of distribution transformers (400 V and 690 V). Harmonic current spectra corresponding to the considered nonlinear loads are obtained from the measurement data available in [27]. The characteristics and locations of nonlinear loads in the DN (Figure 4) are given in Table 15.
The ratings of VQ zones based on voltage THD criteria are shown in Table 3 as part of the proposed VQ decision support system. Voltage THD profiles of the feeders Sub12—feeder 3 and 4, Sub31—c-feeder 1, and Sub32—c-feeder 4 are shown in Figure 11. The ratings of VQ-MV1 and VQ-MV2 zones are shown in Table 16, while the ratings of VQ LP and VQ-f zones are shown in Table 17.
According to the results shown in Figure 11, the voltage THD profile curve of Sub12—feeder 3 (industrial loads I11 and I12) is above the second adopted limit, while the voltage THD profile curve of Sub12—feeder 4 (industrial load I13) is above the first adopted limit. The increase in voltage THD values is caused by nonlinear loads ASD1 and ASD2. The voltage THD profile curve of Sub31—c-feeder 1 (R-urban zone) is above the first adopted limit and below the second adopted limit for residential loads. Finally, the voltage THD profile curve of Sub32—c-feeder 4 (C-zone) is above the second adopted limit for loads C39 and C310 and above the first adopted limit for loads C38, C311, and C312.
VQ-MV1 zones Sub1 and Sub3 are rated bad, as shown in Table 16. The previous rating is a consequence of the bad rating of VQ-MV2 zones Sub12, Sub31, and Sub32. All nonlinear loads are located in previous VQ zones. VQ-MV1 zone Sub2 is rated excellent since there are no nonlinear loads connected in this part of the DN. According to the results shown in Table 17, all VQ-f zones in Sub1 and Sub3 are rated bad, except the VQ-f zone Sub11—feeder 1 (excellent rating). VQ-f zone Sub11—feeder 1 is electrically decoupled from the industrial area through two 33/11 kV/kV transformers, and there are no nonlinear loads in this zone. The DSO is alerted to initiate urgent control actions in industrial VQ-f zones.
All VQ-f zones encapsulated by VQ-MV1 zone Sub3 are rated bad, although the majority of the corresponding VQ LP zones are rated good. The reason for the previous case is the violation of THDv-bus-1-limit at 11 kV busbars in Sub3 (2% for residential feeder loading and 3% for commercial feeder loading). The six remaining nonlinear loads are located in VQ-MV1 zone Sub3 (Table 15). The DSO is alerted to initiate urgent control actions to mitigate voltage THD values. Remote filtering control could be initiated if available.

6. Cybersecurity Challenges

The vulnerability of the proposed zonal approach to cyber threats mirrors that of the underlying AMI. Addressing cybersecurity challenges necessitates an understanding of AMI vulnerabilities.

6.1. Security Vulnerabilities

AMI deployments are susceptible to various security vulnerabilities, such as unauthorized access, data tampering, and denial-of-service attacks. These vulnerabilities can compromise the integrity and confidentiality of data, leading to privacy breaches and disruptions in grid operations. Tampering with data could lead the proposed DSS to suggest erroneous control and protection actions, potentially resulting in unwarranted service alterations or even disruptions.
The Integrated Authentication and Confidentiality (IAC) protocol introduced in paper [28] addresses security vulnerabilities in AMI deployments. By providing mechanisms for user privacy, message authentication, and data integrity, the protocol aims to mitigate security risks associated with unauthorized access, data tampering, and denial-of-service attacks. Building upon the IAC protocol, paper [29] proposes a comprehensive security protocol that further mitigates security vulnerabilities identified in paper [28]. This protocol covers aspects such as initial authentication, secure data transmission, and privacy protection, thereby strengthening the security posture of AMI systems against various threats.

6.2. Data Privacy

The collection of granular data from smart meters raises privacy concerns, as it can potentially reveal sensitive information about customers’ behavior, including PQ-related patterns. Unauthorized access to this data could violate privacy rights and undermine customer trust in the smart grid ecosystem. Data privacy should be jointly regulated by both DSOs and measurement points at customers’ premises.
The IAC protocol in paper [28] includes provisions for user privacy, aiming to address concerns related to the collection and use of granular data from smart meters. By ensuring confidentiality and privacy protection, the protocol helps safeguard sensitive information about customers’ behavior. Paper [29] extends the privacy protections provided by the IAC protocol by proposing a comprehensive security protocol that includes measures for privacy preservation throughout the communication process.

6.3. Resilience to Cyber Threats

AMI systems need to be resilient against evolving cyber threats, including malware, phishing attacks, and insider threats. Ensuring the resilience of these systems requires robust security measures and proactive risk management strategies.
Paper [30] conducts a detailed security analysis of AMI infrastructures to identify vulnerabilities and potential cyber threats. By understanding the security landscape, the paper provides insights into critical targets and potential impacts of attacks, which can inform the development of proactive risk management strategies to enhance resilience against cyber threats.
Paper [31] proposes a Key Management Scheme (KMS) tailored to address the key management challenges in AMI systems. By providing efficient key management procedures for different communication modes, the KMS ensures secure communication among DSOs and measuring devices while addressing resource constraints and scalability issues, thereby enhancing cybersecurity measures and resilience against cyber threats.

7. Discussions and Future Research

Zonal VQ indices are very beneficial, even if all LP VQ indices are available (fully observable DN). If observing PQ indices only at the node level, it is possible to identify critical nodes, but it could be very challenging to identify the propagation of VQ issues through the DN. Zonal indices could reveal DN vulnerabilities related to VQ issues. For example, the same VQ issue in some critical nodes could have a higher or lower impact on the VQ of the remaining nodes, depending on their location in the DN. If the DSO only has information on VQ at the node level, it would be difficult to make correct and timely control or protection actions, even in the case of a fully observable DN. Usually, it is the case that control or protection actions are limited to substations supplying a large number of nodes.
Zonal indices should be defined in such a way as to avoid masking, where a zone can be declared as satisfactory when one or more nodes have severe non-compliances. For example, VQ-feeder zones—F (medium voltage (11 kV)) are rated as moderate only in the case where all the corresponding VQ-loading points—LP (low voltage (400 V)) are rated as moderate (100%). Severe non-compliances usually impact the whole zone, and their corresponding rating should be reflective of the severe non-compliance. LP (node) severe non-compliances are also visible to the DSO, in any case, if the DN is fully observable. Thresholds for the zone indices (60% or 80% of LP per zone) should be reconsidered and adapted depending on the specific real DN case studies.
More complicated VQ indices, such as VQ index (VQI), unifying frequency, THD, and dissymmetry variations, are not considered in this paper since they are not yet officially included in the relevant PQ standards. Future research will be focused on expanding the presented VQ to PQ evaluation (including more indices). Incorporating additional variables into the PQ monitoring system, such as currents, active and reactive powers, frequency, etc., would necessitate an expansion of the proposed DSS. However, for this expanded DSS to be viable, it would require additional wide-area measurements facilitated by more advanced AMI. Moreover, setting corresponding thresholds for these additional PQ indicators would pose challenges for DSOs, as they are not yet regulated by relevant PQ standards.
As part of future research, enhancements to the proposed DSS could involve tracking the number and types of faults occurring within 10 min intervals. This upgrade would offer valuable insights into events affecting VQ over very short durations.

Future Research Focusing on Field Trials

Several real-world case studies have examined operational PQ monitoring systems integrated into DNs, but the authors note that relevant PQ data are not, to their knowledge, publicly available. A key strength of the zonal approach presented in this paper is its applicability to any DN equipped with an operational PQ monitoring system. The primary guidelines for real-world DSOs considering the implementation of this approach are outlined as follows:
  • Assess the level of DN observability, i.e., the number of nodes within the DN equipped with devices capable of monitoring PQ.
  • Evaluate the suitability of existing AMI for supporting online VQ monitoring and temporary VQ assessment (using 10 min-based VQ ratings).
  • Based on the DN observability level and AMI capabilities, segment the observable part of the DN into corresponding VQ zones.
  • Customize the proposed DSS for temporary VQ assessment by adjusting the rules and thresholds for standardized VQ indices, if necessary.
  • Validate the customized DSS and refine the rules and thresholds if any issues are identified following the implementation of control or protection actions.
In previous research, the authors created an experimental power distribution system simulator to analyze PQ parameters [32]. The primary objective was to test the effectiveness of the commercial low-voltage regulating transformer system “VROT-18” designed for improving VQ [33]. However, future research plans include testing the proposed zonal approach for temporary VQ assessment across wider areas using the developed experimental power distribution system simulator. Should DSOs express interest in analyzing, testing, and validating the proposed approach, the authors are eager to aid.

8. Conclusions

The wide-area assessment of VQ in DNs is analyzed in this paper. The proposed zonal approach provides a suitable methodology for the inclusion of an active VQ management function in ADMS. The temporary VQ concept recommends the evaluation of VQ metrics in regular 10 min time intervals, thus assuming the existence of AMI and enabling ICT. The temporary VQ concept is suitable for SG objectives related to DN self-awareness supported by a more timely response from the DSO. The proposed zonal wide-area temporary VQ approach could incentivize the DSO to plan suitable and faster control actions considering the spatiotemporal VQ state in the DN. DSS, based on the simple deterministic rules for temporary VQ evaluation, is designed to be a suitable addition to ADMS when dealing with PQ issues in DNs. DSS is able to evaluate the temporary VQ state in different zones according to three different VQ indices (metrics): RMS level, unbalance, and THD. DSS is designed to be adaptable in dealing with different load types (residential, commercial, and industrial). The effectiveness of the proposed zonal approach with DSS is evaluated on various examples of VQ issues using the developed dSG model. The temporary VQ state is determined for the following simulation case studies: loads with low power factors, manual voltage regulation at MV/LV transformers, unbalanced loads, the integration of SPP, and nonlinear loads. Suitable recommendations for DSOs are obtained in all considered case studies.
The zonal approach offers several benefits to DSOs. Firstly, it improves visibility by providing a more comprehensive view of VQ issues across different zones in DNs. This enables DSOs to better identify critical areas requiring attention. Secondly, it enhances understanding by categorizing VQ based on zones and load types. Consequently, DSOs can make more informed decisions. Thirdly, zonal indices facilitate targeted actions by pinpointing specific areas or zones needing immediate attention or corrective measures. This allows DSOs to allocate resources efficiently. Finally, zonal assessments enable DSOs to implement targeted control or protection measures in specific zones, thereby enhancing their ability to mitigate VQ issues effectively.
Implementing a zonal approach for VQ assessment introduces certain complexities to the monitoring and management of the DN. These complexities arise from the need for additional resources and expertise to effectively implement and maintain the zonal system. Secondly, determining appropriate thresholds for different zones and load types requires extensive analysis and calibration. Additionally, scaling the zonal approach to larger DNs or integrating it with other SG functionalities presents scalability challenges that must be carefully addressed to ensure the system’s effectiveness and reliability.
The research results presented in this paper could initiate new research ideas dealing with wide-area PQ assessment in SG. More advanced DSS could be developed to include feeders with mixed load types, CQ metrics, DER-specific rules, etc.

9. Publication Statement

Preprints have previously been published [34].

Author Contributions

Conceptualization, M.F.; Methodology, M.F., A.S. and S.J.; Software, M.F. and J.F.; Validation, M.F. and S.J.; Formal analysis, M.F. and A.S.; Investigation, J.F.; Resources, S.J.; Data curation, J.F.; Writing—original draft, M.F.; Writing—review & editing, A.S. and S.J.; Visualization, J.F.; Supervision, A.S. All authors have read and agreed to the published version of the manuscript.

Funding

This research received no external funding.

Data Availability Statement

The data presented in this study are available on request from the corresponding author due to ongoing research.

Conflicts of Interest

The authors declare no conflict of interest.

References

  1. Jabr, R.A.; Dzafic, I. Distribution Management Systems for Smart Grid: Architecture, Work Flows, and Interoperability. J. Mod. Power Syst. Clean Energy 2022, 10, 300–308. [Google Scholar] [CrossRef]
  2. Bollen, M. What is power quality? Electr. Power Syst. Res. 2003, 66, 5–14. [Google Scholar] [CrossRef]
  3. Bollen, M.; Castel, R.; Friedl, W.; Villa, F.; Baumann, P.; Esteves, J.; Larzeni, S.; Ström, L.; Beyer, Y.; Faias, S.; et al. Guidelines for good practice on voltage quality monitoring. In Proceedings of the 22nd International Conference and Exhibition on Electricity Distribution (CIRED 2013), Stockholm, Switzerland, 10–13 June 2013; pp. 1–4. [Google Scholar]
  4. European Norm EN 50160; Voltage Characteristics of Electricity Supplied by Public Distribution Systems. CENELEC: Brussels, Belgium, 2010.
  5. IEC 61000-3-6:2008; Electromagnetic Compatibility (EMC)–Part 3-6: Limits—Assessment of Emission Limits for the Connection of Distorting Installations to MV, HV and EHV Power Systems. IEC: Geneva, Stockholm, 2008.
  6. IEEE Std 1159-2019 (Revision of IEEE Std 1159-2009); IEEE Recommended Practice for Monitoring Electric Power Quality. IEEE: Piscataway, NJ, USA, 2019; pp. 1–98.
  7. Remigio-Carmona, P.; Rosa, J.J.G.-D.-L.; Florencias-Oliveros, O.; Sierra-Fernández, J.M.; Fernández-Morales, J.; Espinosa-Gavira, M.J.; Agüera-é, A.; Palomares-Salas, J.-C. Current Status and Future Trends of Power Quality Analysis. Energies 2022, 15, 2328. [Google Scholar] [CrossRef]
  8. Gupta, A. Power quality evaluation of photovoltaic grid interfaced cascaded h-bridge nine-level multilevel inverter systems using d-statcom and upqc. Energy 2022, 238, 121707. [Google Scholar] [CrossRef]
  9. Mahela, O.P.; Khan, B.; Alhelou, H.H.; Siano, P. Power Quality Assessment and Event Detection in Distribution Network with Wind Energy Penetration Using Stockwell Transform and Fuzzy Clustering. IEEE Trans. Ind. Inform. 2020, 16, 6922–6932. [Google Scholar] [CrossRef]
  10. Chen, C.I.; Chen, Y.C.; Chin, Y.C.; Chen, C.H. Integrated power-quality monitoring mechanism for microgrid. IEEE Trans. Smart Grid 2018, 9, 6877–6885. [Google Scholar] [CrossRef]
  11. Milanovié, J.V.; Meyer, J.; Ball, R.F.; Howe, W.; Preece, R.; Bollen, M.H.J.; Elphick, S.; Čukalevski, N. International industry practice on power-quality monitoring. IEEE Trans. Power Deliv. 2014, 29, 934–941. [Google Scholar] [CrossRef]
  12. Bollen, M.; Milanovié, J.V.; Čukalevski, N. CIGRE/CIRED JWG C4.112—Power Quality Monitoring. In Proceedings of the International Conference on Renewable Energies and Power Quality (ICREPQ’14), Cordoba, Spain, 7–10 April 2014. [Google Scholar]
  13. Bollen, M.; Bahramirad, S.; Khodaei, A. Is there a place for power quality in the smart grid? In Proceedings of the 2014 16th International Conference on Harmonics and Quality of Power (ICHQP), Bucharest, Romania, 25–28 May 2014; pp. 713–717. [Google Scholar]
  14. Luo, A.; Xu, Q.; Ma, F.; Chen, Y. Overview of power quality analysis and control technology for the smart grid. J. Mod. Power Syst. Clean Energy 2016, 4, 1–9. [Google Scholar] [CrossRef]
  15. Jain, A.; Bhullar, S. Online management and assessment of power quality issues through smart metering in smart grid architecture. Energy Rep. 2022, 8, 613–631. [Google Scholar] [CrossRef]
  16. Elphick, S.; Ciufo, P.; Drury, G.; Smith, V.; Perera, S.; Gosbell, V. Large scale proactive power-quality monitoring: An example from Australia. IEEE Trans. Power Deliv. 2017, 32, 881–889. [Google Scholar] [CrossRef]
  17. Carvalho, E.L.N.; Passos, F.O.; Cyrillo, I.O.; Miranda, J.; Filho, J.M.C.; Carneiro, J.R.; Motta, L.J.; de Costa, M.V.; Pereira, N.B.; Silveira, P.M.; et al. A proposal for power quality management system. In Proceedings of the 2020 19th International Conference on Harmonics and Quality of Power (ICHQP), Naples, Italy, 29 May–1 June 2022; pp. 1–6. [Google Scholar]
  18. Montano, J.C.; Bravo, J.C.; Borras, D.; Castilla, M.; Lopez, A.; Gutierrez, J. Voltage quality index. In Proceedings of the International Symposium on Power Electronics, Electrical Drives, Automation and Motion, 2006. (SPEEDAM 2006), Taormina, Italy, 23–26 May 2006; pp. 814–817. [Google Scholar]
  19. Elbasuony, G.S.; Aleem, S.H.A.; Ibrahim, A.M.; Sharaf, A.M. A unified index for power quality evaluation in distributed generation systems. Energy 2018, 149, 607–622. [Google Scholar] [CrossRef]
  20. Western Power Distribution. Primary Networks Power Quality Analysis. Six Monthly Project Progress Reports, 2018–2021. Available online: https://www.nationalgrid.co.uk/projects/primary-networks-power-quality-analysis-pnpqa (accessed on 7 May 2024).
  21. Music, M.; Bosovic, A.; Hasanspahic, N.; Avdakovic, S.; Becirovic, E. Integrated Power Quality Monitoring Systems in smart distribution grids. In Proceedings of the 2012 IEEE International Energy Conference and Exhibition (ENERGYCON), Florence, Italy, 9–12 September 2012; pp. 501–506. [Google Scholar]
  22. Rahman, F.A. System-wide power quality monitoring in Malaysia. In Proceedings of the CIRED 2005—18th International Conference and Exhibition on Electricity Distribution, Turin, Italy, 6–9 June 2005; pp. 1–5. [Google Scholar]
  23. Sabin, D.D.; Dimitriu, C.; Doherty, F.; Santiago, D. System-wide power quality monitoring at the consolidated Edison company of New York. In Proceedings of the 2012 IEEE 15th International Conference on Harmonics and Quality of Power, Hong Kong, China, 17–20 June 2012; pp. 870–875. [Google Scholar]
  24. MATLAB; (R2020b); The MathWorks Inc.: Natick, MA, USA, 2020.
  25. Horowitz, K.; Peterson, Z.; Coddington, M.; Ding, F.; Sigrin, B.; Saleem, D.; Baldwin, S.E.; Lydic, B.; Stanfield, S.C.; Enbar, N.; et al. An Overview of Distributed Energy Resource (DER) Interconnection: Current Practices and Emerging Solutions; Technical Report NREL/TP-6A20-72102; National Renewable Energy Laboratory: Golden, CO, USA, 2019.
  26. Islam, H.; Mekhilef, S.; Shah, N.B.M.; Soon, T.K.; Seyedmahmousian, M.; Horan, B.; Stojcevski, A. Performance evaluation of maximum power point tracking approaches and photovoltaic systems. Energies 2018, 11, 365. [Google Scholar] [CrossRef]
  27. Grady, M. Understanding Power System Harmonics. 2012. Available online: https://web.ecs.baylor.edu/faculty/grady/understanding_power_system_harmonics_grady_april_2012.pdf (accessed on 6 June 2019).
  28. Yan, Y.; Hu, R.Q.; Das, S.K.; Sharif, H.; Qian, Y. An efficient security protocol for advanced metering infrastructure in smart grid. IEEE Netw. 2013, 27, 64–71. [Google Scholar] [CrossRef]
  29. Ye, F.; Qian, Y.; Hu, R.Q. A security protocol for advanced metering infrastructure in smart grid. In Proceedings of the 2014 IEEE Global Communications Conference, Austin, TX, USA, 8–12 December 2014; pp. 649–654. [Google Scholar]
  30. Hansen, A.; Staggs, J.; Shenoi, S. Security analysis of an advanced metering infrastructure. Int. J. Crit. Infrastruct. Prot. 2017, 18, 3–19. [Google Scholar] [CrossRef]
  31. Abdullah, A.A.; El-den, B.M.; Abo-Al-Ez, K.M.; Hassan, T.M. Security Management for an Advanced Metering Infrastructure (AMI) System of Smart Electrical Grids. Appl. Sci. 2023, 13, 8990. [Google Scholar] [CrossRef]
  32. Simović, A.; Jokić, S.; Lemez, A.; Stojković, Z. An improved experimental power distribution system simulator for the analysis of power quality parameters. In Proceedings of the 2023 22nd International Symposium INFOTEH-JAHORINA (INFOTEH), East Sarajevo, Bosnia and Herzegovina, 15–17 March 2023; pp. 1–5. [Google Scholar]
  33. Simović, A.; Lemez, A.; Stojković, Z.; Bošković, M.; Jokić, S. An Analysis of the Application of the “VROT-18 System” for Increasing the Power Quality and Energy Efficiency of the Low-voltage Distribution Network. In Proceedings of the 2023 17th International Conference on Engineering of Modern Electric Systems (EMES), Oradea, Romania, 9–10 June 2023; pp. 1–4. [Google Scholar]
  34. Forcan, M.; Simović, A.; Jokić, S.; Forcan, J. A Zonal Approach for Wide Area Temporary Voltage Quality Assessment in Smart Grid. Available online: https://ssrn.com/abstract=4427987 (accessed on 7 May 2024).
Figure 1. Conceptualized DSO PQ online monitoring center collecting and analyzing data from IEDs, PQ monitors, and SMs.
Energies 17 02475 g001
Figure 2. Temporary VQ 10 min time snapshots and ratings.
Energies 17 02475 g002
Figure 3. DN division into VQ zones according to the proposed zonal approach.
Energies 17 02475 g003
Figure 4. DN model—base configuration with marked VQ-feeder zones.
Energies 17 02475 g004
Figure 5. Voltage RMS level profiles of different feeders—DN base case.
Energies 17 02475 g005
Figure 6. Voltage RMS level profiles of different feeders—loads with low power factor case.
Energies 17 02475 g006
Figure 7. Voltage RMS level profiles of different feeders—manual voltage regulation case.
Energies 17 02475 g007
Figure 8. Voltage unbalance profiles of different feeders—unbalanced loads case.
Energies 17 02475 g008
Figure 9. Voltage RMS level profile of Sub22—feeder 9—DN base case and SPP integration cases.
Energies 17 02475 g009
Figure 10. Voltage THD profile of Sub22—feeder 9—DN base case and SPP integration cases.
Energies 17 02475 g010
Figure 11. Voltage THD profiles of different feeders—nonlinear loads case.
Energies 17 02475 g011
Table 1. The ratings of VQ zones—voltage RMS level criteria.
VQ-Loading Points—LP (Low Voltage (400 V))
Voltage RMS rangeZone ratingRecommendation
0.95 Un < U < 1.05 UnVQ-RMS LP excellentno control action required
0.9 Un < U < 0.95 UnVQ-RMS LP goodnon-urgent control action considered
1.05 Un < U < 1.1 UnVQ-RMS LP goodnon-urgent control action considered
0.85 Un < U < 0.9 UnVQ-RMS LP moderatenon-urgent control action required
Uundervoltage-prot < U < 0.85 UnVQ-RMS LP badurgent control action required
1.1 Un < U < Uovervoltage-protVQ-RMS LP badurgent control action required
U < Uundervoltage-protVQ-RMS LP criticalprotection action required
U > Uovervoltage-protVQ-RMS LP criticalprotection action required
VQ-feeder zones—F (medium voltage (11 kV))
Voltage RMS range and VQ loading point (LP) zone ratingsZone ratingRecommendation
0.95 Un < Ubusbar < 1.05 Un
80% of LP—VQ-RMS LP excellent
100% of LP—VQ-RMS LP good
VQ-RMS F excellentno control action required
0.95 Un < Ubusbar < 1.05 Un
60% of LP—VQ-RMS LP good
100% of LP—VQ-RMS LP moderate
VQ-RMS F goodnon-urgent control action considered
0.9 Un < Ubusbar < 1.1 Un
100% of LP—VQ-RMS LP moderate
VQ-RMS F moderatenon-urgent control action required
Ubus-under-prot < Ubusbar < Ubus-over-prot
100% of LP—VQ-RMS LP bad
VQ-RMS F badurgent control action required
all remaining casesVQ-RMS F criticalurgent control/protection action required
VQ-MV2 zones—MV2 (medium voltage (11 kV))
VQ-feeder (F) zone ratingsZone ratingRecommendation
80% of F—VQ-RMS F excellent
100% of F—VQ-RMS F good
VQ-RMS MV2 excellentno control action required
100% of F—VQ-RMS F goodVQ-RMS MV2 goodnon-urgent control action considered
100% of F—VQ-RMS F moderateVQ-RMS MV2 moderatenon-urgent control action required
100% of F—VQ-RMS F badVQ-RMS MV2 badurgent control action required
all remaining cases VQ-RMS MV2 criticalurgent control/protection action required
VQ-MV1 zones—MV1 (medium voltage (33 kV))
VQ-MV2 (MV2) zone ratingsZone ratingRecommendation
80% of MV2—VQ-RMS MV2 excellent
100% of MV2—VQ-RMS MV2 good
VQ-RMS MV1 excellentno control action required
100% of MV2—VQ-RMS MV2 goodVQ-RMS MV1 goodnon-urgent control action considered
100% of MV2—VQ-RMS MV2 moderateVQ-RMS MV1 moderatenon-urgent control action required
100% of MV2—VQ-RMS MV2 badVQ-RMS MV1 badurgent control action required
all remaining casesVQ-RMS MV1 criticalurgent control/protection action required
Table 2. Ratings of VQ zones—voltage unbalance criteria.
VQ-Loading Points—LP (Low Voltage (400 V))
Voltage unbalance rangeZone ratingRecommendation
0% < Uunbalance < UunB-limit-1VQ-unB LP excellentno control action required
UunB-limit-1 < Uunbalance < UunB-limit-2VQ-unB LP goodnon-urgent control action required
UunB-limit-2 < Uunbalance < Uunbalance-protVQ-unB LP badurgent control action required
Uunbalance > Uunbalance-protVQ-unB LP criticalprotection action required
VQ-feeder zones—F (medium voltage (11 kV))
Voltage unbalance range and VQ loading point (LP) zone ratingsZone ratingRecommendation
0% < Ubus-unbalance < UunB-limit-2
80% of LP—VQ-unB LP excellent
100% of LP—VQ-unB LP good
VQ-unB F excellentno control action required
0% < Ubus-unbalance < UunB-limit-2
100% of LP—VQ-unB LP good
VQ-unB F goodnon-urgent control action required
0% < Ubus-unbalance < Uunbalance-prot
100% of LP—VQ-unB LP bad
VQ-unB F badurgent control action required
all remaining casesVQ-unB F criticalurgent control/protection action required
VQ-MV2 zones—MV2 (medium voltage (11 kV))
VQ-feeder (F) zone ratingsZone ratingRecommendation
80% of F—VQ-unB F excellent
100% of F—VQ-unB F good
VQ-unB MV2 excellentno control action required
100% of F—VQ-unB F goodVQ-unB MV2 goodnon-urgent control action required
100% of F—VQ-unB F badVQ-unB MV2 badurgent control action required
all remaining casesVQ-unB MV2 criticalurgent control/protection action required
VQ-MV1 zones—MV1 (medium voltage (33 kV))
VQ-MV2 (MV2) zone ratingsZone ratingRecommendation
60% of MV2—VQ-unB MV2 excellent
100% of MV2—VQ-unB MV2 good
VQ-unB MV1 excellentno control action required
100% of MV2—VQ-unB MV2 goodVQ-unB MV1 goodnon-urgent control action required
100% of MV2—VQ-unB MV2 badVQ-unB MV1 badurgent control action required
all remaining casesVQ-unB MV1 criticalurgent control/protection action required
Table 3. Ratings of VQ zones—voltage THD criteria.
VQ-Loading Points—LP (Low Voltage (400 V))
Voltage THD rangeZone ratingRecommendation
0% < THDv < THDv-limit-1VQ-THD LP excellentno control action required
THDv-limit-1 < THDv < THDv-limit-2VQ-THD LP goodnon-urgent control action required
THDv-limit-2 < THDv < THDv-protVQ-THD LP badurgent control action required
THDv > THDv-protVQ-THD LP criticalprotection action required
VQ-feeder zones—F (medium voltage (11 kV))
Voltage THD range and VQ loading point (LP) zone ratingsZone ratingRecommendation
0% < THDv-bus-1 < THDv-bus-1-limit
80% of LP—VQ-THD LP excellent
100% of LP—VQ-THD LP good
VQ-THD F excellentno control action required
0% < THDv-bus-1 < THDv-bus-1-limit
100% of LP—VQ-THD LP good
VQ-THD F goodnon-urgent control action required
0% < THDv-bus-1 < THDv-bus-1-prot
100% of LP—VQ-THD LP bad
VQ-THD F badurgent control action required
all remaining casesVQ-THD F criticalurgent control/protection action required
VQ-MV2 zones—MV2 (medium voltage (11 kV))
Voltage THD range and VQ-feeder (F) zone ratingsZone ratingRecommendation
80% of F—VQ-THD F excellent
100% of F—VQ-THD F good
VQ-THD MV2 excellentno control action required
100% of F—VQ-THD F goodVQ-THD MV2 goodnon-urgent control action required
100% of F—VQ-THD F badVQ-THD MV2 badurgent control action required
all remaining casesVQ-THD MV2 criticalurgent control/protection action required
VQ-MV1 zones—MV1 (medium voltage (33 kV))
Voltage THD range and VQ-MV2 (MV2) zone ratingsZone ratingRecommendation
0% < THDv-bus-2 < THDv-bus-2-limit
60% of MV2—VQ-THD MV2 excellent
100% of MV2—VQ-THD MV2 good
VQ-THD MV1 excellentno control action required
0% < THDv-bus-2 < THDv-bus-2-limit
100% of MV2—VQ-THD MV2 good
VQ-THD MV1 goodnon-urgent control action required
0% < THDv-bus-2 < THDv-bus-2-prot
100% of MV2—VQ-THD MV2 bad
VQ-THD MV1 badurgent control action required
all remaining casesVQ-THD MV1 criticalurgent control/protection action required
Table 4. Voltage THD thresholds for zone ratings.
Voltage THD ThresholdsLoad Types
ResidentialCommercialIndustrial
THDv-limit-11.5%2%3%
THDv-limit-22.5%4%5%
THDv-protkr1·2.5%kc1·4%ki1·5%
THDv-bus-1-limit2%3%4%
THDv-bus-1-protkr2·2%kc2·3%ki2·4%
THDv-bus-2-limit1.5%2%3%
THDv-bus-2-protkr3·1.5%kc3·2%ki3·3%
Table 5. The ratings of VQ-MV1 and VQ-MV2 zones based on the voltage RMS level criteria—DN base case.
VQ-MV1 ZonesVQ-MV2 ZonesZone Rating
Sub1
good
Sub11good
Sub12good
Sub2
good
Sub21good
Sub22good
Sub3
excellent
Sub31excellent
Sub32excellent
Table 6. The ratings of VQ LP and VQ-f zones based on the voltage RMS level criteria—DN base case.
VQ-f ZonesVQ LP Zones
Sub11-feeder 1R11R12R13R14R15R16
goodgoodgoodgoodgoodgoodgood
Sub12-feeder 3I11I12////
goodexcellentgood////
Sub12-feeder 4I13/////
goodgood/////
Sub21-feeder 5R21R22////
excellentexcellentexcellent////
Sub21-feeder 6R23R24R25///
goodexcellentgoodgood///
Sub21-feeder 7R26R27R28R29R210/
goodgoodgoodgoodgoodgood/
Sub22-feeder 9R211R212R213R214R215/
goodgoodgoodgoodgoodgood/
Sub31-c-feeder 1R31R32R33///
excellentexcellentexcellentexcellent///
Sub31-c-feeder 2R34R35////
excellentexcellentexcellent////
Sub31-c-feeder 3R36R37////
excellentexcellentexcellent////
Sub32-c-feeder 4C38C39C310C311C312/
excellentexcellentexcellentexcellentexcellentexcellent/
Table 7. The ratings of VQ-MV1 and VQ-MV2 zones based on the voltage RMS level criteria—loads with low power factors case.
VQ-MV1 ZonesVQ-MV2 ZonesZone Rating
Sub1
↓ moderate
Sub11good
Sub12↓ moderate
Sub2
↓ moderate
Sub21↓ moderate
Sub22↓ moderate
Sub3
excellent
Sub31excellent
Sub32excellent
Table 8. The ratings of VQ LP and VQ-f zones based on the voltage RMS level criteria—loads with low power factors case.
VQ-f ZonesVQ LP Zones
Sub11-feeder 1R11R12R13R14R15R16
goodgoodgoodgood↓ moderate good↓ moderate
Sub12-feeder 3I11I12////
↓ moderate↓ good↓ moderate////
Sub12-feeder 4I13/////
↓ moderate↓ moderate/////
Sub21-feeder 5R21R22////
↓ goodexcellent↓ good////
Sub21-feeder 6R23R24R25///
goodexcellentgoodgood///
Sub21-feeder 7R26R27R28R29R210/
↓ moderategoodgood↓ moderate↓ moderate↓ moderate/
Sub22-feeder 9R211R212R213R214R215/
↓ moderategoodgood↓ moderate↓ moderate↓ moderate/
Table 9. The ratings of VQ-MV1 and VQ-MV2 zones based on the voltage RMS level criteria—manual voltage regulation case.
VQ-MV1 ZonesVQ-MV2 ZonesZone Rating
Sub1
↑ good
Sub11good
Sub12↑ good
Sub2
↑ good
Sub21↑ good
Sub22↑ good
Sub3
excellent
Sub31excellent
Sub32excellent
Table 10. The ratings of VQ LP and VQ-f zones based on the voltage RMS level criteria—manual voltage regulation case.
VQ-f ZonesVQ LP Zones
Sub11-feeder 1R11R12R13R14R15R16
goodgoodgoodgood↑ goodgood↑ good
Sub12-feeder 3I11I12////
↑ good↑ excellent↑ good////
Sub12-feeder 4I13/////
↑ good↑ good/////
Sub21-feeder 5R21R22////
↑ excellentexcellent↑ excellent////
Sub21-feeder 6R23R24R25///
goodexcellent↑ excellentgood///
Sub21-feeder 7R26R27R28R29R210/
↑ good↑ excellentgood↑ good↑ good↑ good/
Sub22-feeder 9R211R212R213R214R215/
↑ good↑ excellent↑ excellent↑ good↑ good↑ good/
Table 11. The ratings of VQ-MV1 and VQ-MV2 zones based on the voltage unbalance criteria—unbalanced loads case.
VQ-MV1 ZonesVQ-MV2 ZonesZone Rating
Sub1
good
Sub11excellent
Sub12good
Sub2
! critical
Sub21good
Sub22! critical
Sub3
excellent
Sub31excellent
Sub32excellent
Table 12. The ratings of VQ LP and VQ-f zones based on the voltage unbalance criteria—unbalanced loads case.
VQ-f ZonesVQ LP Zones
Sub11-feeder 1R11R12R13R14R15R16
excellentexcellentexcellentexcellentexcellentexcellentexcellent
Sub12-feeder 3I11I12////
goodgoodgood////
Sub12-feeder 4I13/////
goodgood/////
Sub21-feeder 5R21R22////
excellentexcellentexcellent////
Sub21-feeder 6R23R24R25///
excellentexcellentexcellentexcellent///
Sub21-feeder 7R26R27R28R29R210/
goodexcellentexcellentgoodgoodgood/
Sub22-feeder 9R211R212R213R214R215/
! criticalbadbadbad! critical! critical/
Table 13. The ratings of VQ LP zones encapsulated by VQ-f zone Sub22-feeder 9 based on the voltage RMS level criteria for the cases of DN base operation and SPP integration with nominal and low feeder loading.
Simulation
Case Study
VQ-f ZoneVQ LP Zones
R211R212R213R214R215
DN base operation casegoodgoodgoodgoodgoodgood
SPP integration nominal feeder loadingexcellentexcellentexcellentexcellentexcellentexcellent
SPP integration
low feeder loading
excellentexcellentexcellentexcellentexcellentexcellent
Table 14. The ratings of VQ LP zones encapsulated by VQ-f zone Sub22-feeder 9 based on the voltage THD criteria for the cases of DN base operation and SPP integration with nominal and low feeder loading.
Simulation
Case Study
VQ-f ZoneVQ LP Zones
R211R212R213R214R215
DN base operation caseexcellentexcellentexcellentexcellentexcellentexcellent
SPP integration nominal feeder loadinggoodexcellentexcellentgoodgoodgood
SPP integration
low feeder loading
badbadbadbadbadbad
Table 15. The characteristics and locations of nonlinear loads in DN.
Nonlinear LoadNominal QuantitiesLocation in DN
ASD1Pn = 200 kW, V1n = 690 VI11 (I zone—Sub12—feeder 3)
ASD2Pn = 300 kW, V1n = 690 VI13 (I zone—Sub12—feeder 4)
PC1Pn = 50 kW, V1n = 400 VC39 (C zone—Sub32—c-feeder 4)
PC2Pn = 60 kW, V1n = 400 VC310 (C zone—Sub32—c-feeder 4)
RAC1Pn = 100 kW, V1n = 400 VR31 (R-urban zone—Sub31—c-feeder 1)
RAC2Pn = 100 kW, V1n = 400 VR35 (R-urban zone—Sub31—c-feeder 2)
FL-MB1Pn = 100 kW, V1n = 400 VR37 (R-urban zone—Sub31—c-feeder 3)
FL-EB1Pn = 100 kW, V1n = 400 VC311 (C zone—Sub32—c-feeder 4)
Table 16. The ratings of VQ-MV1 and VQ-MV2 zones based on the voltage THD criteria—nonlinear loads case.
VQ-MV1 ZonesVQ-MV2 ZonesZone Rating
Sub1
bad
Sub11excellent
Sub12bad
Sub2
excellent
Sub21excellent
Sub22excellent
Sub3
bad
Sub31bad
Sub32bad
Table 17. The ratings of VQ LP and VQ-f zones based on the voltage THD criteria—nonlinear loads case.
VQ-f ZonesVQ LP Zones
Sub11-feeder 1R11R12R13R14R15R16
excellentexcellentexcellentexcellentexcellentexcellentexcellent
Sub12-feeder 3I11I12////
badbadbad////
Sub12-feeder 4I13/////
badgood/////
Sub31-c-feeder 1R31R32R33///
badgoodgoodgood///
Sub31-c-feeder 2R34R35////
badgoodgood////
Sub31-c-feeder 3R36R37////
badgoodgood////
Sub32-c-feeder 4C38C39C310C311C312/
badgoodbadbadgoodgood/
Disclaimer/Publisher’s Note: The statements, opinions and data contained in all publications are solely those of the individual author(s) and contributor(s) and not of MDPI and/or the editor(s). MDPI and/or the editor(s) disclaim responsibility for any injury to people or property resulting from any ideas, methods, instructions or products referred to in the content.

