Article

A Big Data-Driven Approach for Early Warning of Enterprise Emissions Alignment with Carbon Neutrality Targets: A Case Study of Guangxi Province

1
Guangxi Power Grid Co., Ltd., Nanning 530023, China
2
School of Applied Economics, Renmin University of China, Beijing 100872, China
*
Author to whom correspondence should be addressed.
Energies 2024, 17(11), 2508; https://doi.org/10.3390/en17112508
Submission received: 14 April 2024 / Revised: 14 May 2024 / Accepted: 17 May 2024 / Published: 23 May 2024

Abstract

:
Achieving the target of carbon neutrality has been an important approach for China to mitigate global climate change. Enterprises are major carbon emitters, and a well-designed early warning system is needed to ensure that their emissions align with carbon neutrality goals. Therefore, this study utilized electricity big data to construct an early warning model for enterprise carbon emissions based on carbon quota allocation. Taking key carbon-emitting enterprises in Guangxi as a case study, we aim to provide insights to support China’s dual carbon goals. Firstly, we established the Carbon Quota Allocation System, enabling carbon quota allocation at the enterprise levels. Secondly, we developed the Enterprise Carbon Neutrality Index, facilitating dynamic warnings for carbon emissions among enterprises. The main conclusions are as follows: (1) In 2020, Guangdong received the highest carbon quota of 606 million tons, representing 5.72% of the national total, while Guangxi only received 2.63 billion tons. (2) Only 39.34% of enterprises in Guangxi are able to meet the carbon neutrality target, indicating significant emission reduction pressure faced by enterprises in the region. (3) Over 90% of enterprises in Guangxi receive Commendation and Encouragement warning levels, suggesting that enterprises in Guangxi are demonstrating a promising trend in emission reduction efforts.

1. Introduction

Achieving carbon peak and carbon neutrality has become an essential strategic pathway for the international community to address climate change and transform the economic development mode. As the largest energy consumer and carbon emitter, China’s reduction efforts are vital for domestic environmental protection and ecological civilization, along with a profound impact on global climate action [1,2]. However, China’s dual-carbon objectives constitute a long-term policy goal, involving the participation of multiple stakeholders responsible for carbon emissions reduction, which poses certain challenges to the realization of carbon neutrality targets. Therefore, the scientific decomposition of these objectives among various responsible entities, along with the guidance, calibration, and standardization of their short-term emission behaviors through long-term goals, is particularly critical [3]. Enterprises, as key participants in achieving China’s dual carbon goals, bear significant carbon reduction responsibilities [4]. Consequently, it is urgent to understand enterprise-level carbon emissions, track trends in real time, and dynamically adjust enterprise emissions under the national dual carbon pathway. By establishing an enterprise carbon emissions early warning model, governments can access data on enterprise-level carbon emissions performance, aiding in the formulation of more scientifically effective emission reduction policies. Moreover, the results of early warning can incentivize enterprises to more actively engage in carbon reduction efforts, thereby significantly supporting China’s dual carbon objectives.
However, constructing an enterprise-level carbon emission early warning model is not an easy task. On the one hand, the realization of early warnings for enterprise carbon emissions relies on the timeliness and accuracy of enterprise-level carbon emission data. Yet, due to limitations in China’s statistical systems and technology, micro-level enterprise data on carbon emissions are relatively scarce [5,6]. Additionally, carbon emission data accounting, based on annual energy consumption statistics, is also highly lagged [7]. On the other hand, predicting whether enterprises deviate from the carbon neutrality pathway requires knowledge of the maximum emission limits for each enterprise under the carbon neutrality pathway. However, current research on carbon emission pathways under carbon neutrality goals mostly focuses on levels of nations or provinces, with limited results at the enterprise level [8,9]. To address these challenges, this study leveraged the significant advantages of electricity big data in terms of timeliness and reliability, establishing a four-tier Carbon Quota Allocation System and an enterprise carbon emission early warning model. In addition, using key enterprises in the Guangxi region as an example, we conducted early warning analyses of their carbon emission performance.
Our work is related to the literature on the exploration of various early warning methods. Early warning refers to the issuing of alerts and warnings about the current and future status of a situation, reminding people of the potential abnormalities and their severity within the system to facilitate timely preventive measures [10,11]. Originating within the military field, the design of early warning systems has been applied in many areas, such as architecture, energy, transportation, and natural disasters [12,13,14,15,16]. As the focus shifts towards reducing carbon emissions, new methods for warning about deviations in enterprise carbon emissions have emerged. Some of the literature has established a carbon emission monitoring and early warning indicator system, which generates composite indicators capable of describing the carbon emission levels of entities [17]. Governments can then utilize the relative magnitude of this index to identify which entities require warnings of carbon emissions. Scholars have developed a system of carbon emissions warning and monitoring indicators for the foreign trade industry, based on factors like export trade growth rates, the carbon emission growth rates from export trade, the energy consumption elasticity coefficients, the export trade dependence, and the export consumption indices [18]. Others have constructed a renewable carbon emission early warning indicator system by utilizing free classification methods, ontology modeling techniques, and low-carbon evaluation indicators found online [19]. Additionally, some have developed early warning evaluation indicator systems for carbon emissions based on energy consumption, industrial structure, and technological progress, showing that, while China’s overall carbon emission risk is decreasing, there are regional disparities [20].
In addition, machine learning algorithms have been introduced for the early warning assessment of carbon emissions. Artificial neural networks, for example, are effective for solving nonlinear problems and handling uncertainties in carbon emission early warning evaluations [21]. Some studies have used PSR theory to create carbon emission early warning evaluation systems for thermal power plants, successfully addressing emission problems through neural network structures [22]. Others have used Support Vector Machine (SVM) models for the early warning of carbon risks in heavily polluting industrial enterprises, showing their advantages over traditional methods in terms of prediction accuracy, ease of operation, and broad applicability [23]. Furthermore, genetic algorithms have been used to construct early warning models, with analyses determining early warning indicator systems for net carbon emissions from agricultural product export trade, and neural network models used for empirical analysis of net carbon emissions from China’s agricultural product export trade [24]. In addition to mainstream literature, some scholars have explored alternative models for carbon emission early warning. For example, integrating consortium blockchain technology in carbon emission monitoring and early warning systems can help verify valid carbon emission data. Blockchain’s decentralized networks and smart contract technology can enhance monitoring efficiency by automating alert mechanisms [25]. The study of the WebGIS-based carbon emission early warning decision-making system, by inputting various environmental data, can analyze the carbon emission intensity of emitting entities. Furthermore, by applying clustering fuzzy Q-learning algorithms into the system, the optimal early warning strategies for emission reduction can be obtained [26]. In contrast to the existing literature, this paper innovates in two main aspects. Firstly, it addresses the lack of scientifically grounded frameworks for setting carbon emission quotas by devising a four-tier allocation method encompassing national, provincial, industrial, and enterprise levels. Secondly, this study innovatively constructed a dynamic enterprise carbon emission deviation early warning method, providing four different levels of warning for enterprise carbon emissions by integrating the current and cumulative carbon emission performances of enterprises, enriching the perspectives of existing technologies on carbon emission early warning. The main tasks accomplished during this process are as follows:
  • By integrating enterprise electricity consumption big data, we constructed a four-tier carbon quota allocation model at the levels of national–provincial–industrial–enterprise.
  • Integrating carbon intensity factors, we utilized electricity big data to estimate enterprise carbon emissions. Subsequently, we developed a Carbon Neutrality Index to depict the disparity between actual enterprise carbon emissions and the carbon neutrality pathway.
  • We designed an enterprise carbon emission early warning method, determined the warning thresholds, and divided the warning levels to achieve the objectives of dynamically regulating key enterprises.

2. Methodology

2.1. National–Provincial–Industrial–Enterprise Carbon Quota Allocation System

2.1.1. National–Provincial Carbon Quota Allocation

The study distributed carbon quotas among provinces based on carbon emission efficiency. Specifically, provinces with higher carbon emission efficiency demonstrate better carbon emission management and energy consumption patterns. Therefore, they should get more decision-making authority and quotas in the carbon quota allocation mechanism. Conversely, provinces with lower carbon emission efficiency, due to their potential for reductions, should be allocated fewer carbon quotas. This allocation logic aims to reward regions with more efficient energy use and superior carbon emission control, and motivate provinces with lower carbon emission efficiency to adopt more proactive measures in carbon emission reduction. The specific carbon quota allocation formula is as follows:
C i t = C t × E i i = 1 I E i
where C i t represents the total carbon emissions at the national level in the year t , Ei denotes the carbon emission efficiency of province i, and I is the number of provinces. Moreover, E i i = 1 I E i represents the proportion of carbon quotas allocated to each province, which is independent of the year t , as we assume that the proportions of carbon quotas allocated to provinces remain consistent throughout the years.
Efficiency typically refers to how effectively inputs translate into outputs. When the actual output falls short of the ideal production state, known as the production frontier, it signals inefficiencies in technology. In this study, carbon emission efficiency is simply the ratio of actual output per unit of carbon dioxide emissions to the best possible output. The range of carbon emission efficiency values is from 0 to 1, where a value closer to 1 indicates higher efficiency, implying that existing resources are fully and effectively utilized in production activities. An efficiency value of 1 means that production activities are at the frontier, achieving optimal resource utilization [27].
This paper adopts the Stochastic Frontier Analysis (SFA) model to estimate the carbon emission efficiency of provinces. The Stochastic Frontier Analysis model is a method for evaluating production efficiency that can quantify random errors in the production process and measure technical inefficiencies [28,29]. The model structure is as follows:
ln Y i t = β 0 + β 1 ln c o 2 i t + β 2 ln K i t + β 3 ln L i t + β 4 ln c o 2 i t 2 + β 5 ln K i t 2 + β 6 ln L i t 2 + β 7 ln c o 2 i t × ln K i t + β 8 ln c o 2 i t × ln L i t + β 9 ln L i t × ln K i t + v i t u i t
where C O 2 i t represents the carbon dioxide emissions of province i in year t , K i t denotes the capital stock of province i in year t , L i t indicates the labor level of province i in year t , v i t is a symmetrical random error term associated with statistical noise, and u i t is a non-negative random variable related to technical inefficiency.
Subtracting ln C O 2 i t from both sides of the equation yields the following:
ln Y i t c o 2 i t = β 0 + β 1 1 ln c o 2 i t + β 2 ln K i t + β 3 ln L i t + β 4 ln c o 2 i t 2 + β 5 ln K i t 2 + β 6 ln L i t 2 + β 7 ln c o 2 i × ln K i t + β 8 ln c o 2 i × ln L i t + β 9 ln L i t × ln K i t + v i t u i t
Defining y i t = Y i t C O 2 i t , the carbon emission efficiency T E i t is the ratio of the expected actual output per unit of carbon dioxide to the expected output at the production frontier:
T E i t = E y i t E y i t u i t = 0 = exp u i t

2.1.2. Provincial–Industrial Carbon Quota Allocation

Given the relatively limited scope of carbon emission adjustments at the industry level, especially since emission reduction actions in certain industries may directly impact industry scale and output value, this study allocates carbon quotas to various industries based on the principle of ‘grandfathering approach’. Because the grandfathering allocation principle is simple and easy to implement, it is one of the primary allocation methods used in China’s carbon emission pilot markets [30,31,32]. Following this principle, industries with larger historical emissions will receive more carbon quotas [33]. We first determine the carbon quota allocation weights at the industry level based on emissions per unit of output value for each industry. Then, by combining estimated provincial-level carbon quotas and industry weights, we ultimately determine the carbon quotas for each industry level. The specific calculation formula is as follows:
I i j t = C i t × T i j j = 1 J T i j
where C i t represents the carbon emission quota obtained by province i in the year t , T i j denotes the historical carbon dioxide emissions of industry j in province i , and J is the number of industries. Similarly, the proportion of carbon quotas allocated to each industry, T i j j = 1 J T i j , is independent of the year t , as we assume that the proportions of carbon quotas allocated to industries remain consistent throughout the years.

2.1.3. Industrial–Enterprise Carbon Quota Allocation

Given that the current carbon emission accounting system of enterprises is still being developed and improved, this study proposes a carbon quota allocation method based on the big data of power consumption. Electricity is a key resource for enterprise production, which can indirectly reflect the production scale and carbon emission level of enterprises and have an important impact on economic development [34,35,36]. Based on this, the study allocates quotas by using the electricity consumption of enterprises as a proxy indicator for carbon emissions. The allocation method follows the principle that enterprises with higher carbon emissions should be granted more carbon emission rights, promoting enterprises to actively participate in carbon reduction, while ensuring economic development. By calculating the proportion of an enterprise’s electricity consumption to the total electricity consumption of its industry, we devise a reasonable allocation scheme for each enterprise:
C i j t y = C i j t × E i j y y = 1 Y E i j y
where C i j t y represents the carbon quota obtained by enterprise y belonging to industry j in region i in the year t ; C i j t denotes the carbon quota for industry j in region i in the year t ; E i j y indicates the electricity consumption of enterprise y , and y = 1 Y E i j y signifies the total electricity consumption of all enterprises belonging to industry j in region i . Similarly, we assume that the proportions of carbon quotas allocated to each company, represented by E i j y y = 1 Y E i j y , remain consistent throughout the years.

2.2. Enterprise Carbon Emission Early Warning Model

2.2.1. Enterprise Carbon Neutrality Index

This study utilized big data on electricity at the enterprise level and combined it with carbon emission factors to calculate the actual carbon emissions of enterprises [37]. Incorporating the carbon quota data required for enterprises to achieve carbon neutrality, we constructed an Enterprise Carbon Neutrality Index model to assess the performance of different enterprises in achieving carbon neutrality. The formula for the model is as follows:
C I y T = C E y T Q y T
where C E y T represents the actual carbon emissions of enterprise y in year T, and QyT is the carbon quota for enterprise y under its carbon neutrality goal in year T, derived from the national–provincial–industrial–enterprise Carbon Quota Allocation System. An index value greater than 1 signifies that the enterprise’s actual carbon emissions surpass its quotas, posing challenges in achieving carbon neutrality and requiring heightened reduction efforts. An index value equal to 1 indicates that the enterprise successfully meets its carbon neutrality goal. And an index value less than 1 indicates that the enterprise’s reduction efforts surpass expectations, allowing it to achieve carbon neutrality ahead of schedule.

2.2.2. Enterprise Carbon Emission Early Warning Method

The Enterprise Carbon Neutrality Index describes an enterprise’s carbon emission performance for the year. However, as a long-term process, carbon reduction requires that enterprises reduce a certain amount of carbon emissions over a specified period for achieving dual carbon goals. To monitor the long-term carbon reduction performance of enterprises, the study introduces a Cumulative Carbon Neutrality Index, reflecting the overall carbon reduction effect of an enterprise from the beginning of the carbon neutrality path to the current year. The calculation of the Cumulative Carbon Neutrality Index is as follows:
D C I y T = t = 2020 T C E y t t = 2020 T Q y t , T 2020
where D C I y T is the Cumulative Carbon Neutrality Index of enterprise y in year T; t = 2020 T C E y t is the total carbon emissions of enterprise y from the start year of the carbon neutrality path (2020) to year T; and t = 2020 T Q y t is the total carbon quotas obtained by enterprise y from 2020 to year T.
By integrating the Annual Carbon Neutrality Index, C I y T , and the Cumulative Carbon Neutrality Index, D C I y T , this study established a framework for regulating and warning about carbon emission deviations. Based on the different combinations of two indexes, the carbon emission performance of enterprises can be divided into four scenarios. First, if both the Annual and Cumulative Carbon Neutrality Indexes of an enterprise exceed 1, it indicates that both current and past carbon emissions have not met the standards, necessitating a Warning to the enterprise. Second, if the annual index exceeds 1 while the cumulative index is below 1, it suggests that the enterprise has had significant reduction achievements in the past, yet current emissions have exceeded the standard. And in this scenario, we assign a Reminder level. The third scenario, where the annual index is below 1 and the cumulative index is above 1, reflects a good current emission reduction performance despite historical cumulative emissions exceeding the standard, demonstrating enhanced reduction efforts, which should be given Encouragement. Finally, when both the annual and cumulative indices of an enterprise are below 1, it means that the enterprise has consistently shown excellent reduction achievements in the current period, and we give a Recommendation level in this scenario.

3. Data

Based on the model constructed in this paper, theoretically, we can calculate the carbon quotas for various industries and enterprises in each provincial-level region of China and issue carbon emission warnings for enterprises nationwide. Additionally, our early warning scope can encompass the entire carbon neutrality pathway. However, considering data availability issues, this paper focuses on key carbon-emitting enterprises in the Guangxi region and conducts an analysis of carbon emission warnings for these enterprises for the years 2020 and 2021.The data used in this study and their sources mainly include the following aspects:
The national-level carbon quotas we utilize are derived from estimates of carbon emission pathways necessary for China to achieve its carbon neutrality goals, collected from various institutions. We have gathered computational data from reputable sources, such as the Boston Consulting Group, Beijing Institute of Technology, Tsinghua University, Ministry of Ecology and Environment, and Renmin University of China. Specifically, data on carbon neutrality pathways calculated by the Renmin University of China are utilized in the calculation stage.
The data required to calculate the carbon emission efficiency of each province are utilized. This paper employs panel data from 2003 to 2018 to estimate the total carbon emission efficiency for each province in China, requiring data on capital input, labor input, total carbon emissions, and total output as model inputs. The calculation of capital input adopts the perpetual inventory method, with relevant capital stock data sourced from publications like the China Statistical Yearbook and China Statistical Compendium of 60 Years. To eliminate the influence of price changes on the analysis, this study adjusted the provincial fixed asset investment price index to the year 2000. Data on labor input are from the annual number of employees recorded in the China Statistical Yearbook and provincial statistical yearbooks. Provincial carbon emission data are derived from the China Emissions Accounts and Datasets (CEADs) [38,39,40,41,42]. GDP data are sourced from the China Statistical Yearbook, and the nominal GDP of each province is adjusted to the real GDP value in 2000.
We also acquired data on carbon quota allocation to industries and enterprises in the Guangxi region. The carbon emission data of industries in Guangxi are also obtained from CEADs. To achieve the allocation of enterprise carbon quotas, this study compiles detailed electricity consumption data and industry information for 969 representative electricity-consuming enterprises in Guangxi, provided by the China Southern Power Grid.

4. Results and Discussion

4.1. Pathways to Carbon Neutrality in China

The dual carbon goals proposed by China have sparked extensive discussion within the academic community, with numerous research institutes conducting in-depth calculations on the pathways to achieve these targets. A comprehensive analysis of various carbon neutrality studies reveals diverse approaches. Some studies focus on outlining a roadmap to achieve carbon neutrality by 2060, while others concentrate on reaching near-zero emissions by 2050 to meet a 1.5 °C temperature control target. To facilitate comparison, we adjust the results of each study to a common baseline, using the 10.6 billion tons of carbon emissions in 2020 as the average initial value (Figure 1).
Researchers have indicated significant differences in the pathways to carbon neutrality due to varying assumptions, logical frameworks, and methodologies. Generally, these pathways fall into two categories: one demonstrates a significant decrease in carbon emissions from 2020 without a specific peak carbon emission point, indicating the need for immediate and stringent emission reduction measures, as proposed by the pathways from Boston Consulting Group [43] and the research team from Beijing Institute of Technology [44]. The other category shows a peak carbon emission period between 2024 and 2028, followed by a rapid decline, displaying a slow and then rapid trend, as demonstrated by studies from Tsinghua University [45], the Ministry of Ecology and Environment [46], and Renmin University of China. Regardless of the pathway, the road to carbon neutrality in China is filled with challenges, urgently requiring forward-looking policy deployment, early planning, and broad participation and proactive actions from all sectors of society.

4.2. Provincial Carbon Quota Allocation Results

The carbon emission efficiency of China’s provincial-level administrative regions is shown in Figure 2. Generally, there is a correlation between the carbon emission efficiency and the level of economic development across provinces, revealing the impact of economic development level, industrial structure, energy composition, and living standards on carbon emission efficiency. More economically developed provinces tend to have higher carbon emission efficiency, whereas less developed regions have lower efficiency. From the perspective of spatial distribution, carbon emission efficiency decreases from coastal to inland areas, showing obvious geographic characteristics. The average carbon emission efficiency is 0.56, with a variance of 0.033, suggesting that, despite differences among provinces, the overall disparity is not extreme. Coastal and economically developed areas like Guangdong (0.970) and Shanghai (0.961) rank at the top in terms of carbon emission efficiency, reflecting the capability to effectively control carbon emissions, while maintaining a high level of economic development. In contrast, the Guangxi region, with a carbon emission efficiency of 0.42, ranks 25th out of 30 provincial administrative regions, indicating that, in spite of some economic achievements, there is substantial room for improvement in carbon emission control and efficiency enhancement.
Based on the carbon neutrality pathways calculated by Renmin University of China, this study calculated the carbon quotas for each province in 2020 (Figure 3). With a total carbon emission quota of 10.6 billion tons for China in 2020, the average would reach 353 million tons if the quotas are evenly distributed among provinces. However, the actual allocation reveals significant inter-provincial differences, with a variance of 1.28, highlighting the imbalance in carbon emission efficiency and economic development levels among provinces. Particularly, Guangdong Province, with a quota of 606 million tons, approximately 1.7 times the average quota, ranks first nationwide. In contrast, due to the relatively lower carbon emission efficiency, the quota for Guangxi is only 263 million tons, 26% below the average.

4.3. Carbon Quota Allocation across Industries in Guangxi

We calculated the carbon quotas for 45 industries in Guangxi for the year 2020. Figure 4 shows the top nine industries receiving the highest carbon quotas, with the remaining industries categorized as ‘others’. The detailed carbon quota data for all industries are provided in Appendix A. Specifically, electric power, nonmetal steam, and hot water production and supply; nonmetal mineral products; and smelting and pressing of ferrous metals rank as the top three, receiving carbon quotas of 90.36 million tons, 52.12 million tons, and 40.17 million tons, respectively. Additionally, due to negligible carbon emissions from the petroleum and natural gas extraction and logging and transport of wood and bamboo, no carbon quotas are allocated to these sectors (Appendix A Table A1). In 2020, the actual carbon emissions from the electric power, nonmetal steam and hot water production and supply in Guangxi were 107.51 million tons, slightly exceeding its allocated carbon quotas, indicating a significant emission reduction challenge for the sector in the region. Among the 45 industries surveyed, only 9 have a quota share exceeding 1% of the total industry quota, with the majority of industries receiving carbon quota shares ranging from 0% to 0.8%, highlighting significant disparities in quota allocation among industries.

4.4. Guangxi Enterprise Carbon Neutrality Index

By integrating big data on the electricity consumption of enterprises, we calculated the Carbon Neutrality Index for 969 sample enterprises in Guangxi for the year 2020 (Figure 5). Overall, approximately 39.34% of enterprises are able to meet carbon neutrality targets, leaving about 60.66% of enterprises with a carbon budget usage rate exceeding 1, indicating the substantial emission reduction pressure. Specifically, around 24.25% of enterprises have actual carbon emissions significantly lower than their theoretical carbon emissions, with a Carbon Neutrality Index below 0.50, demonstrating that these enterprises could relatively easily achieve carbon neutrality targets. About 6.31% of enterprises have a Carbon Neutrality Index between 0.50 and 0.75, indicating that these enterprises are under relatively optimistic pressure to reduce emissions. Moreover, approximately 8.79% of enterprises have a carbon budget usage rate between 0.75 and 1.00, meaning that these enterprises have almost achieved the carbon neutrality targets. However, with potential increases in actual electricity consumption, there is a risk that this proportion could exceed 1, thus facing the possibility of actual carbon emissions above their carbon quotas. Ultimately, about 60.66% of enterprises have a carbon budget usage rate over 100%, i.e., a Carbon Neutrality Index greater than 1, indicating these enterprises’ actual carbon emissions exceeded their theoretical emissions, thus failing to meet the standards for carbon neutrality.

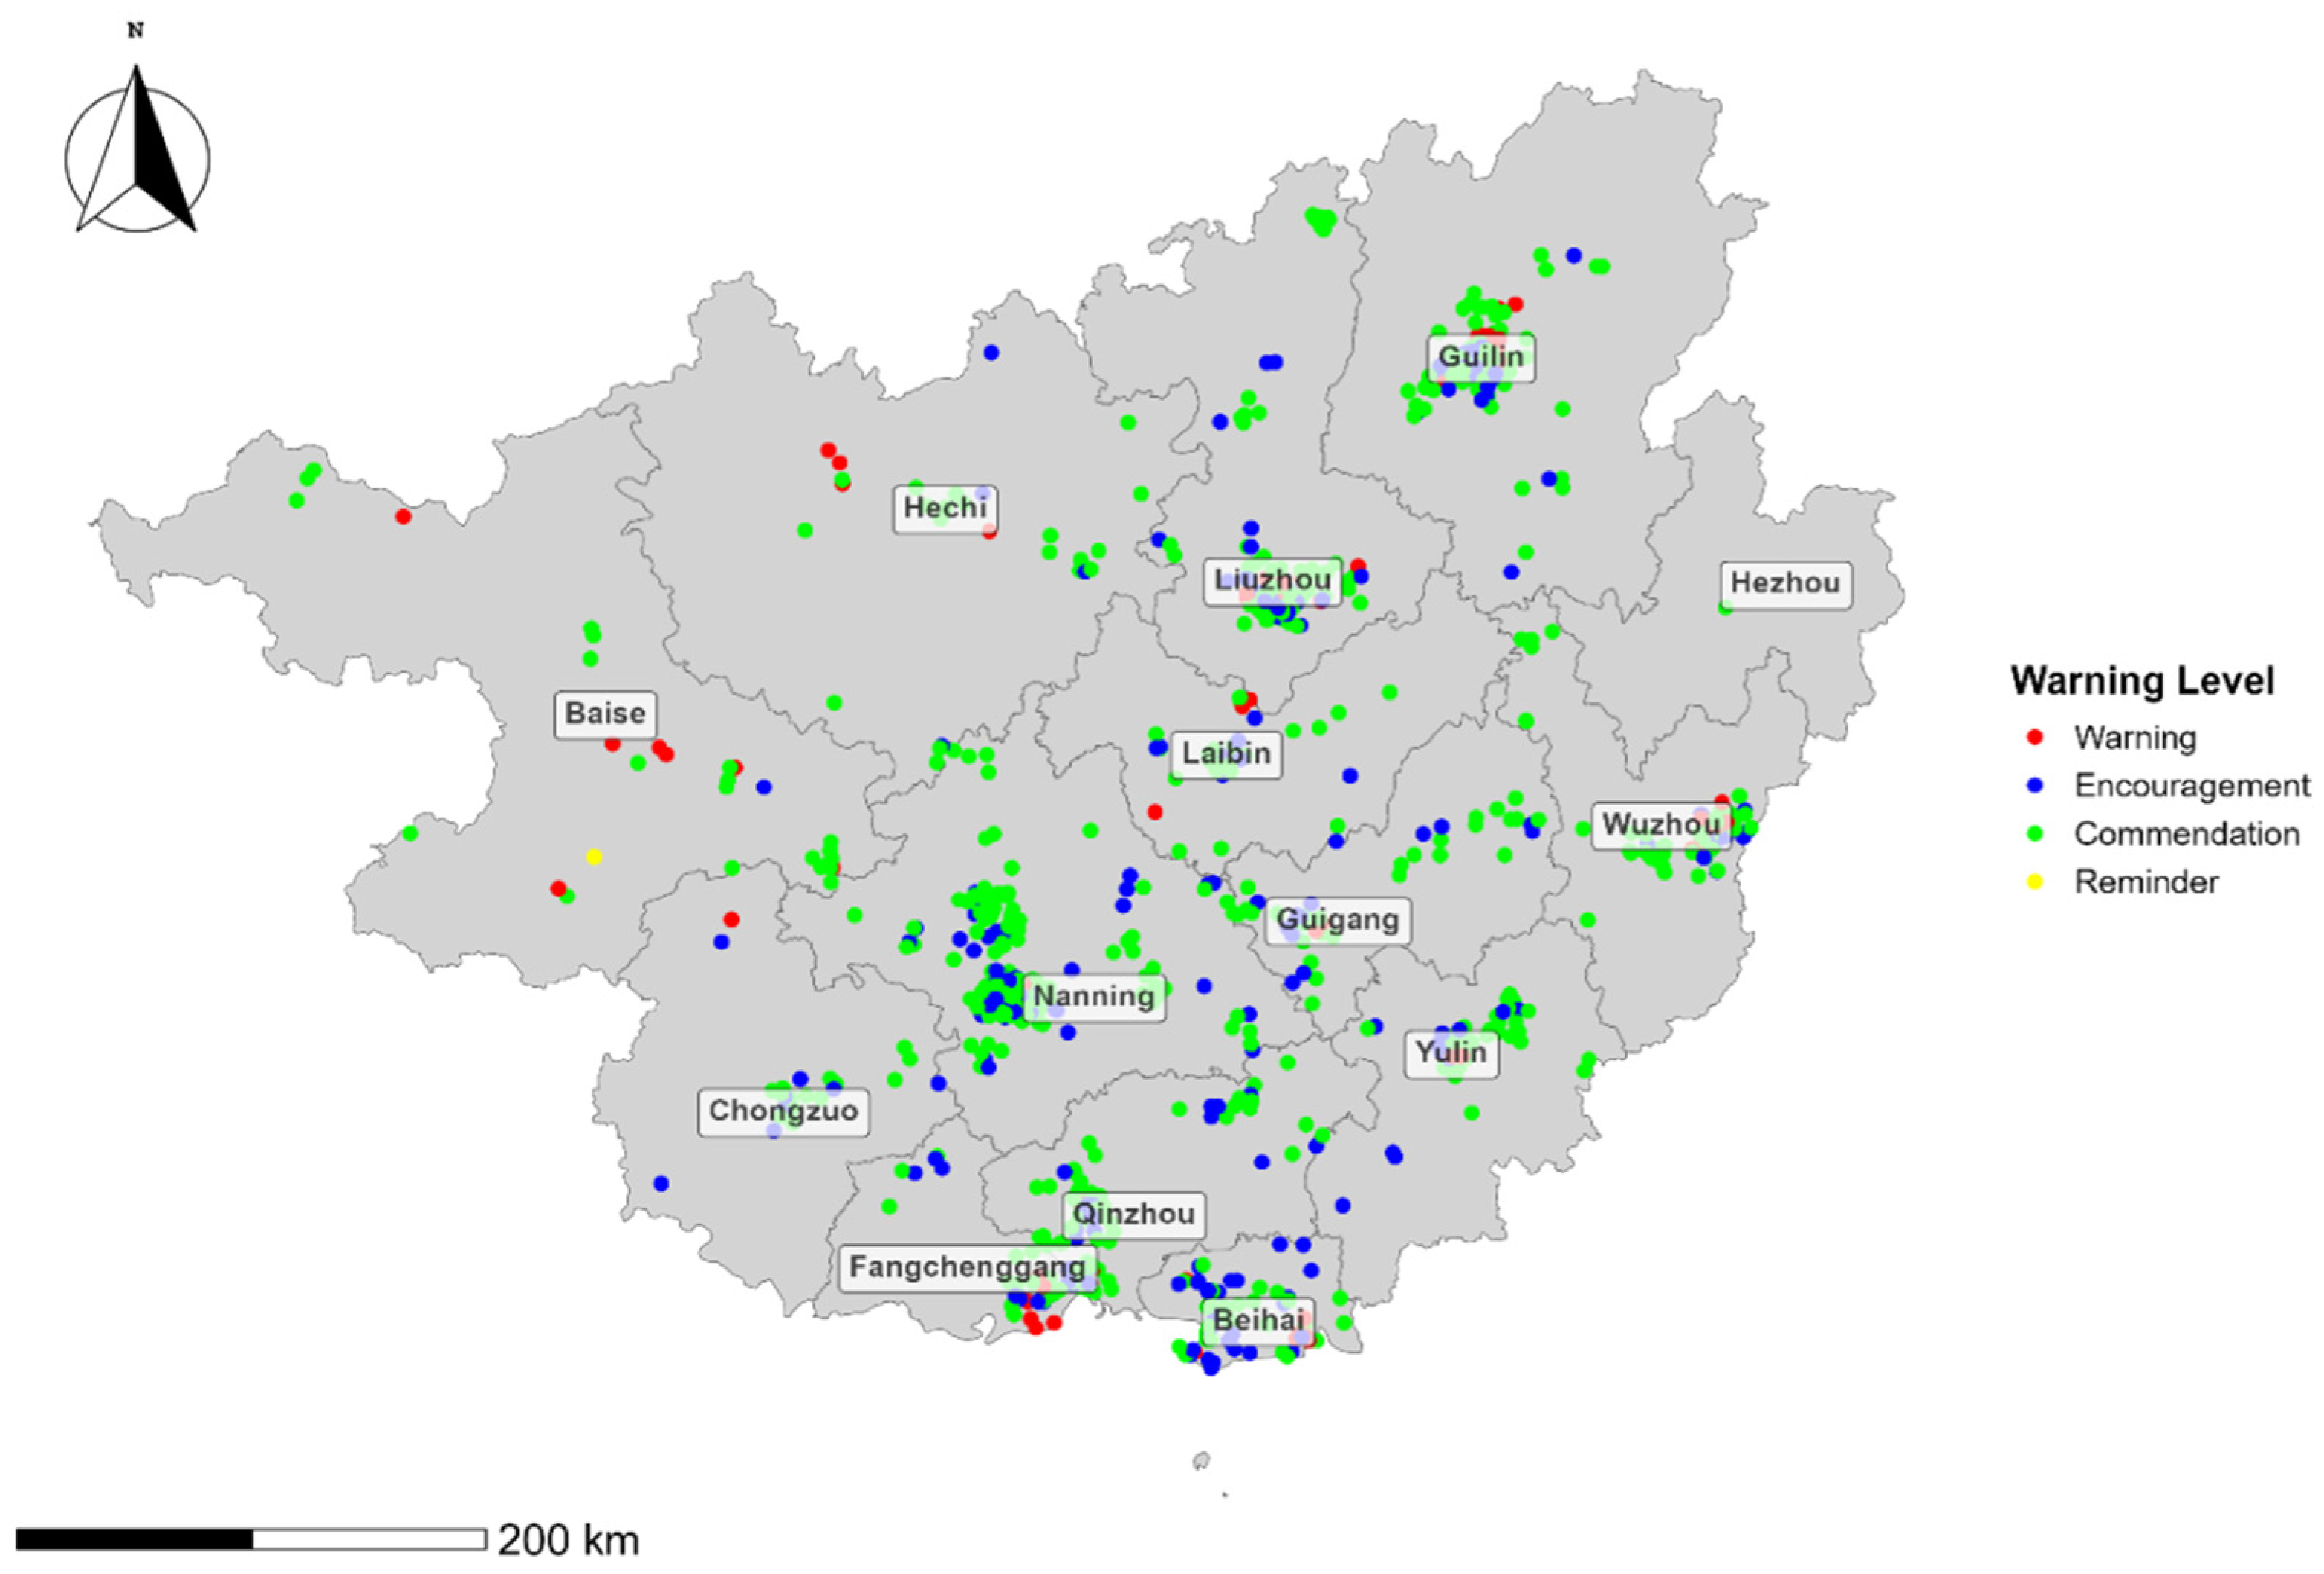
4.5. Guangxi Enterprise Carbon Emission Early Warning Levels

In 2021, the location and corresponding early warning levels of the 969 sample enterprises in Guangxi are depicted in Figure 6. Among these, 9.17% of enterprises are categorized under the Warning level, indicating that these enterprises’ carbon emissions in 2021 exceeded their allocated quotas, with total emissions over 2020 and 2021 also above total quotas for two years. This situation suggests the need for the enhanced management of these enterprises. Additionally, 0.21% of enterprises are marked under the Reminder level, meaning their cumulative emissions for 2020 and 2021 did not exceed their quotas, but their single-year emissions in 2021 are significant. About 36.77% of enterprises receive the Encouragement level, indicating that their total emissions for 2020 and 2021 are not ideal. However, their single-year carbon emissions in 2021 are below their quotas, showing the potential for future emission reductions. Finally, 53.86% of enterprises are assigned the Commendation level, demonstrating that over half of the sample enterprises in Guangxi are performing well, both throughout the overall emission reduction period and in 2021.
As a whole, enterprises in Guangxi have shown a diverse range of performances in carbon emissions, with more than half successfully controlling their emissions to meet or even exceed reduction targets. However, a small proportion of enterprises exceed their quotas, facing significant difficulties in achieving carbon neutrality. Despite the challenges ahead in emission reduction efforts, the 90% of enterprises at Commendation and Encouragement levels indicate a general shift towards a more sustainable direction in the region. This trend not only highlights regional enterprises’ recognition and responsibility towards emission reduction; it also reflects the positive progress Guangxi has made in advancing carbon reduction and achieving carbon neutrality goals. This conclusion is also largely consistent with the conclusions regarding the reduction of carbon emission risks at the provincial level in China [20]. While some enterprises still need to strive to meet emission standards, the overall positive performance of enterprises in Guangxi provides a solid foundation for achieving long-term environmental sustainability.

5. Conclusions and Implications

5.1. Conclusions

The successful achievement of China’s dual carbon goals requires the collective efforts of all participating entities. As one of the most important carbon emitters, the carbon emission behavior of enterprises will significantly impact the realization of China’s dual carbon goals. To understand and manage enterprise carbon emissions, it is necessary to implement early warning and monitoring systems for their carbon emission behavior. Therefore, by integrating big data on electricity, this paper proposes a dynamic early warning method for enterprise carbon emission deviations based on carbon quota allocation. Firstly, we used a carbon quota allocation model to calculate the carbon emission budget space for different provinces, industries, and enterprises. Secondly, by combining the carbon budget of each enterprise with its carbon emissions estimated by electricity big data, the carbon neutrality development index of enterprises was calculated. Lastly, based on the Annual and Cumulative Carbon Neutrality Indexes of enterprises, we classified the carbon emission performance of enterprises. The main conclusions of the paper are as follows:
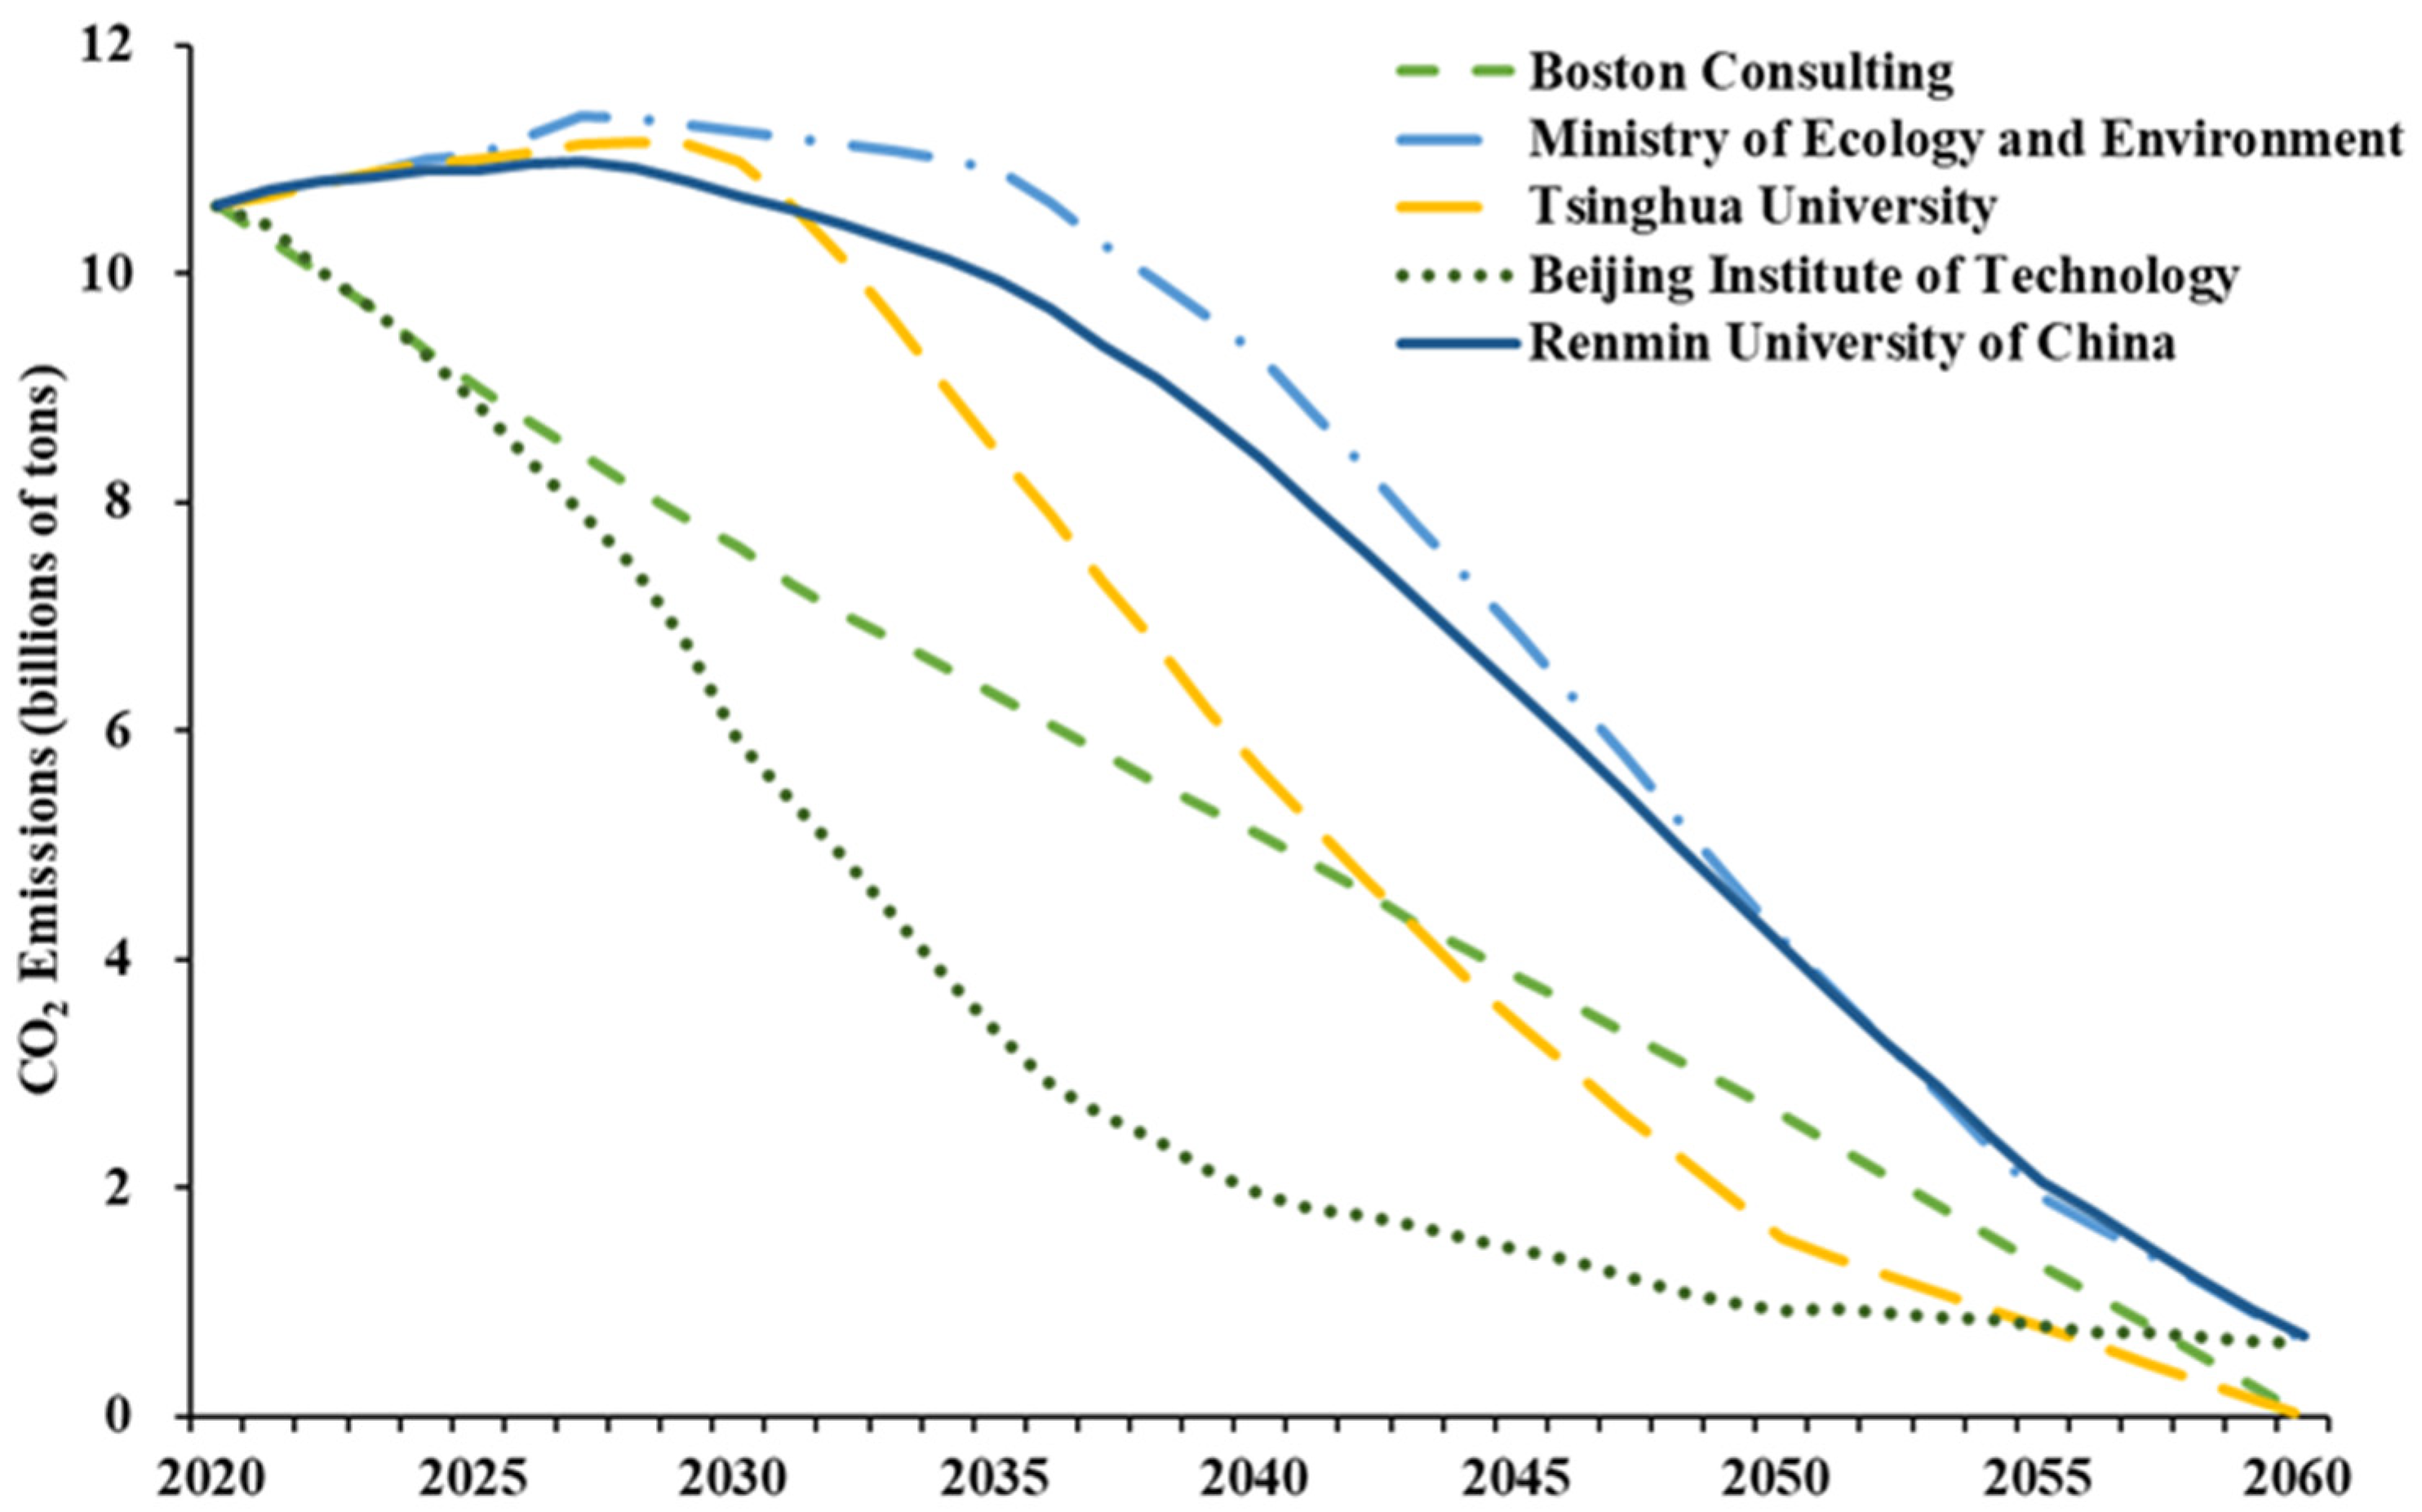
  • The carbon-neutral pathways studied by various institutions can be categorized into two types. One type involves a gradual reduction in carbon emissions, starting from 2020, without a specific peak emission point, while the other type sees a peak in carbon emissions from 2024 to 2028, followed by a rapid decline. However, regardless of the carbon-neutral pathway adopted, both indicate that China’s journey towards carbon neutrality is challenging and requires early planning, as well as proactive actions from all participating entities.
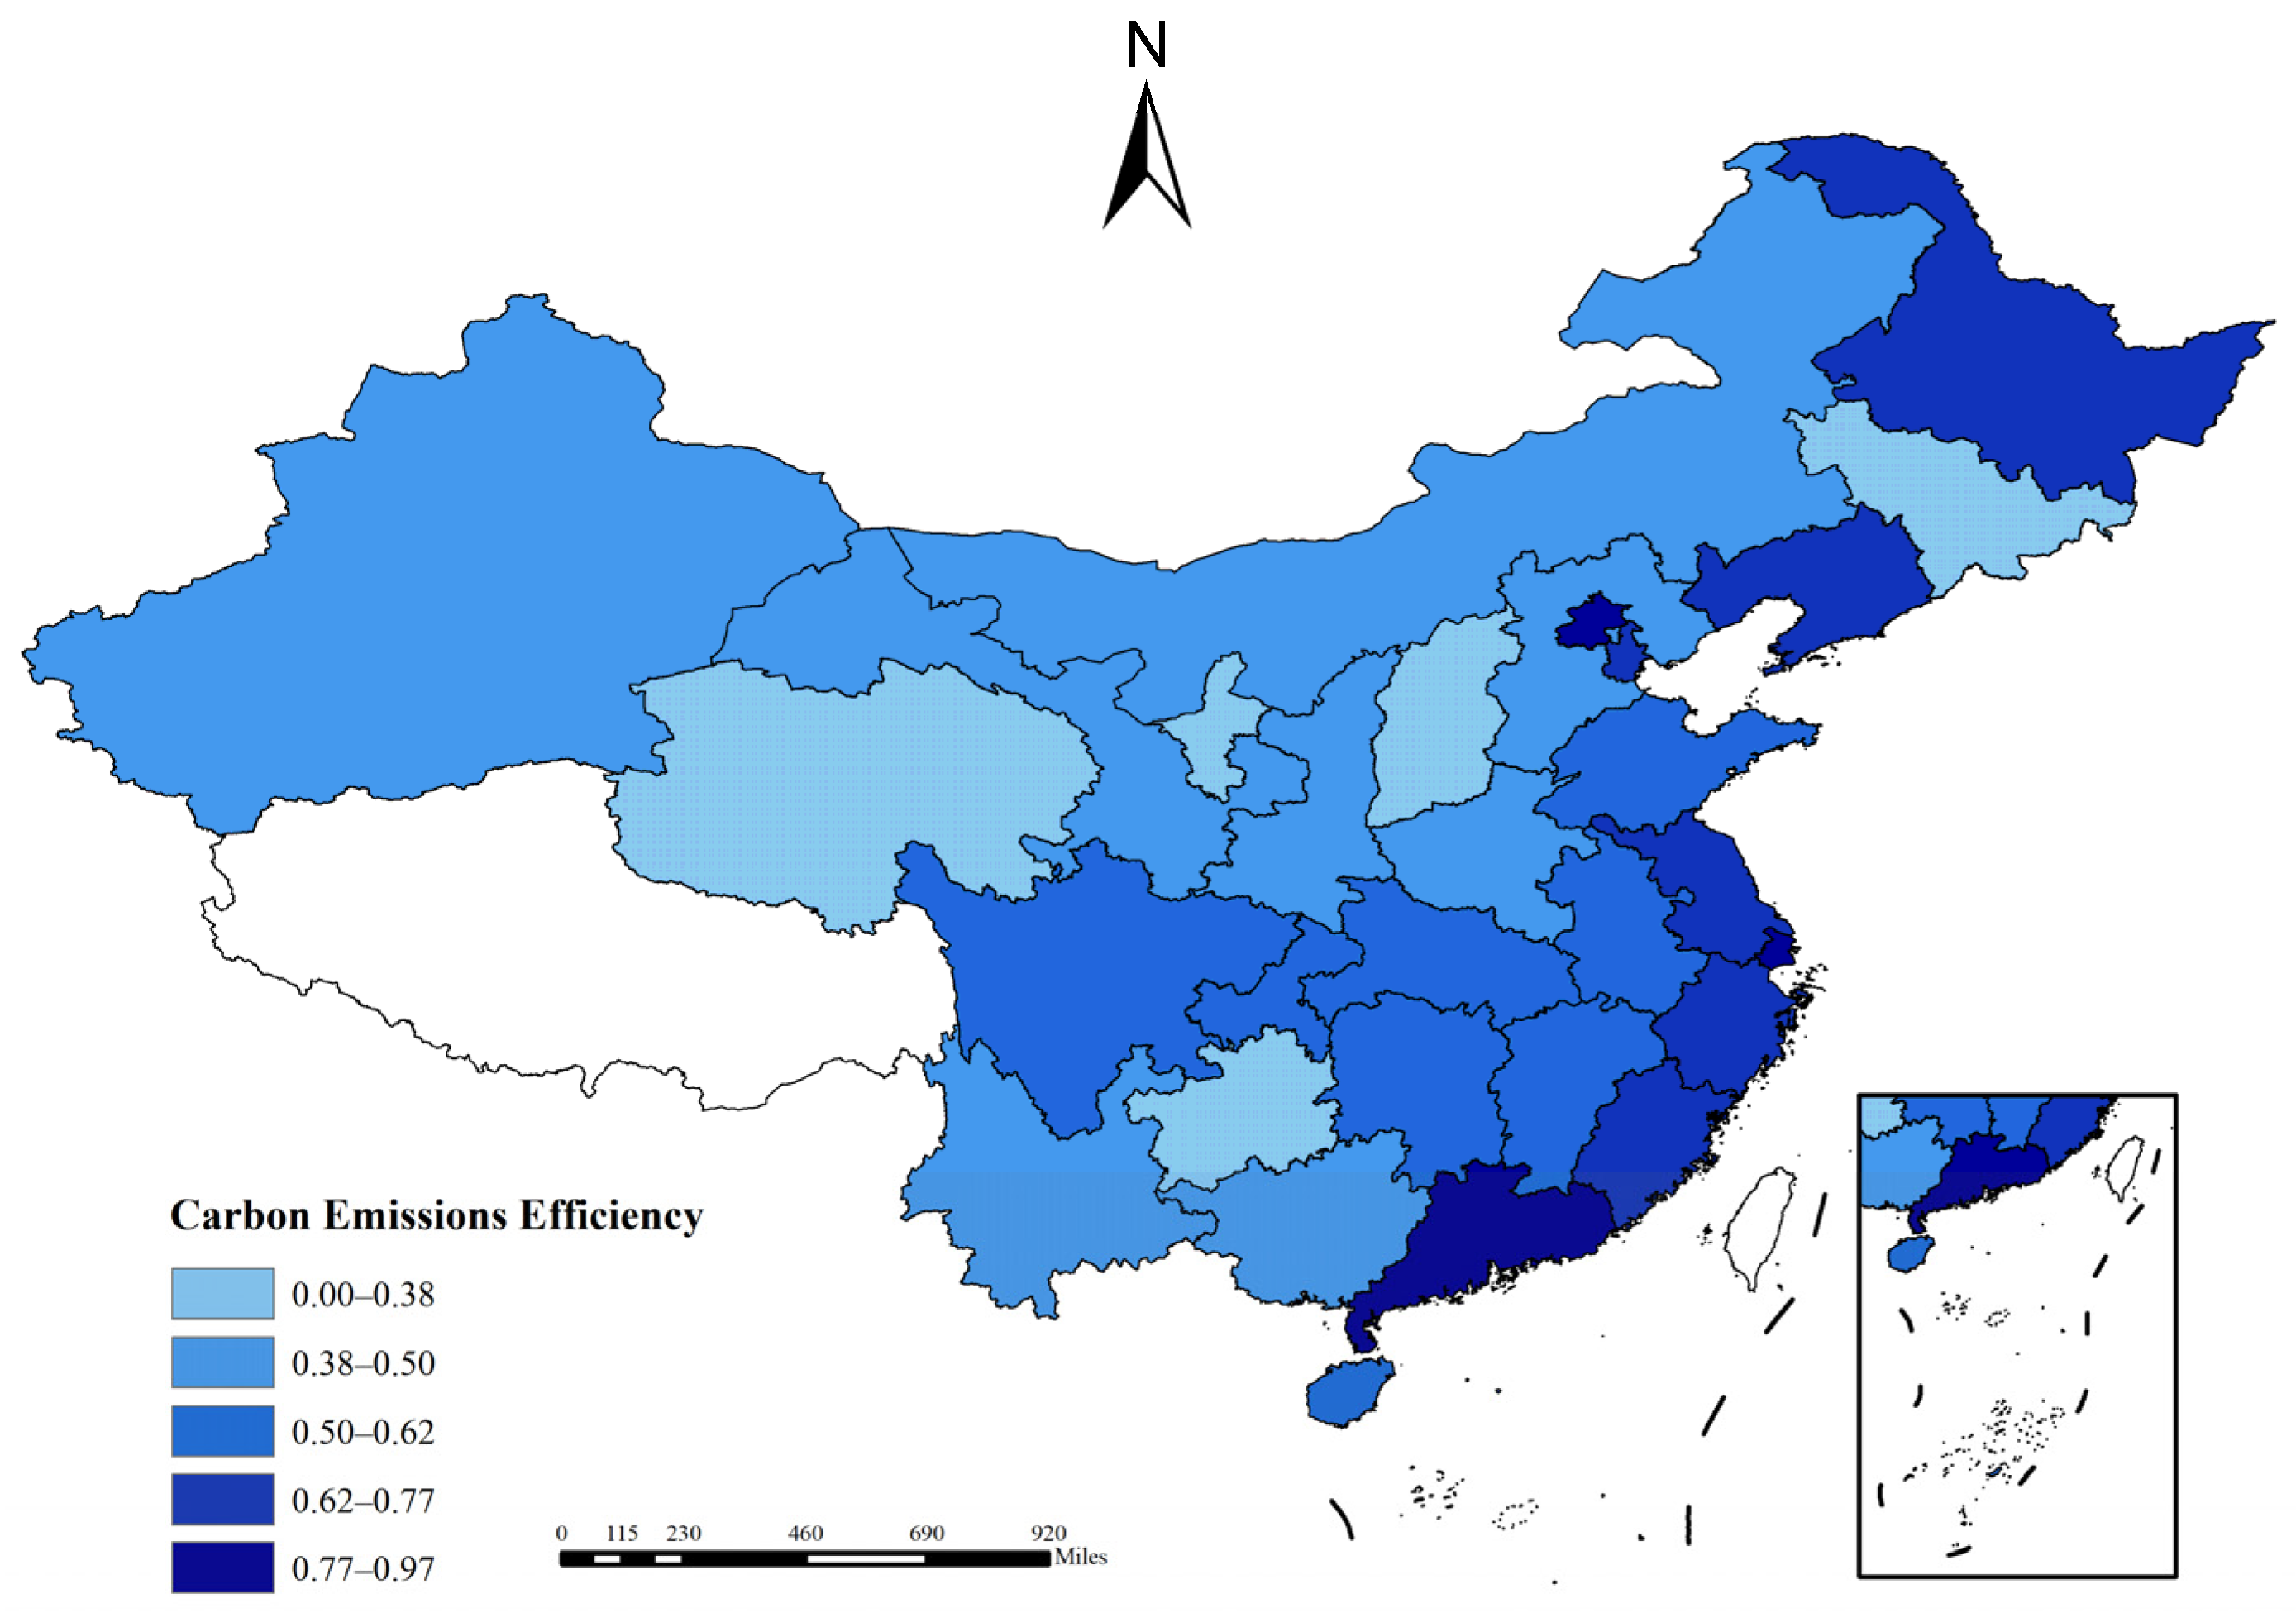
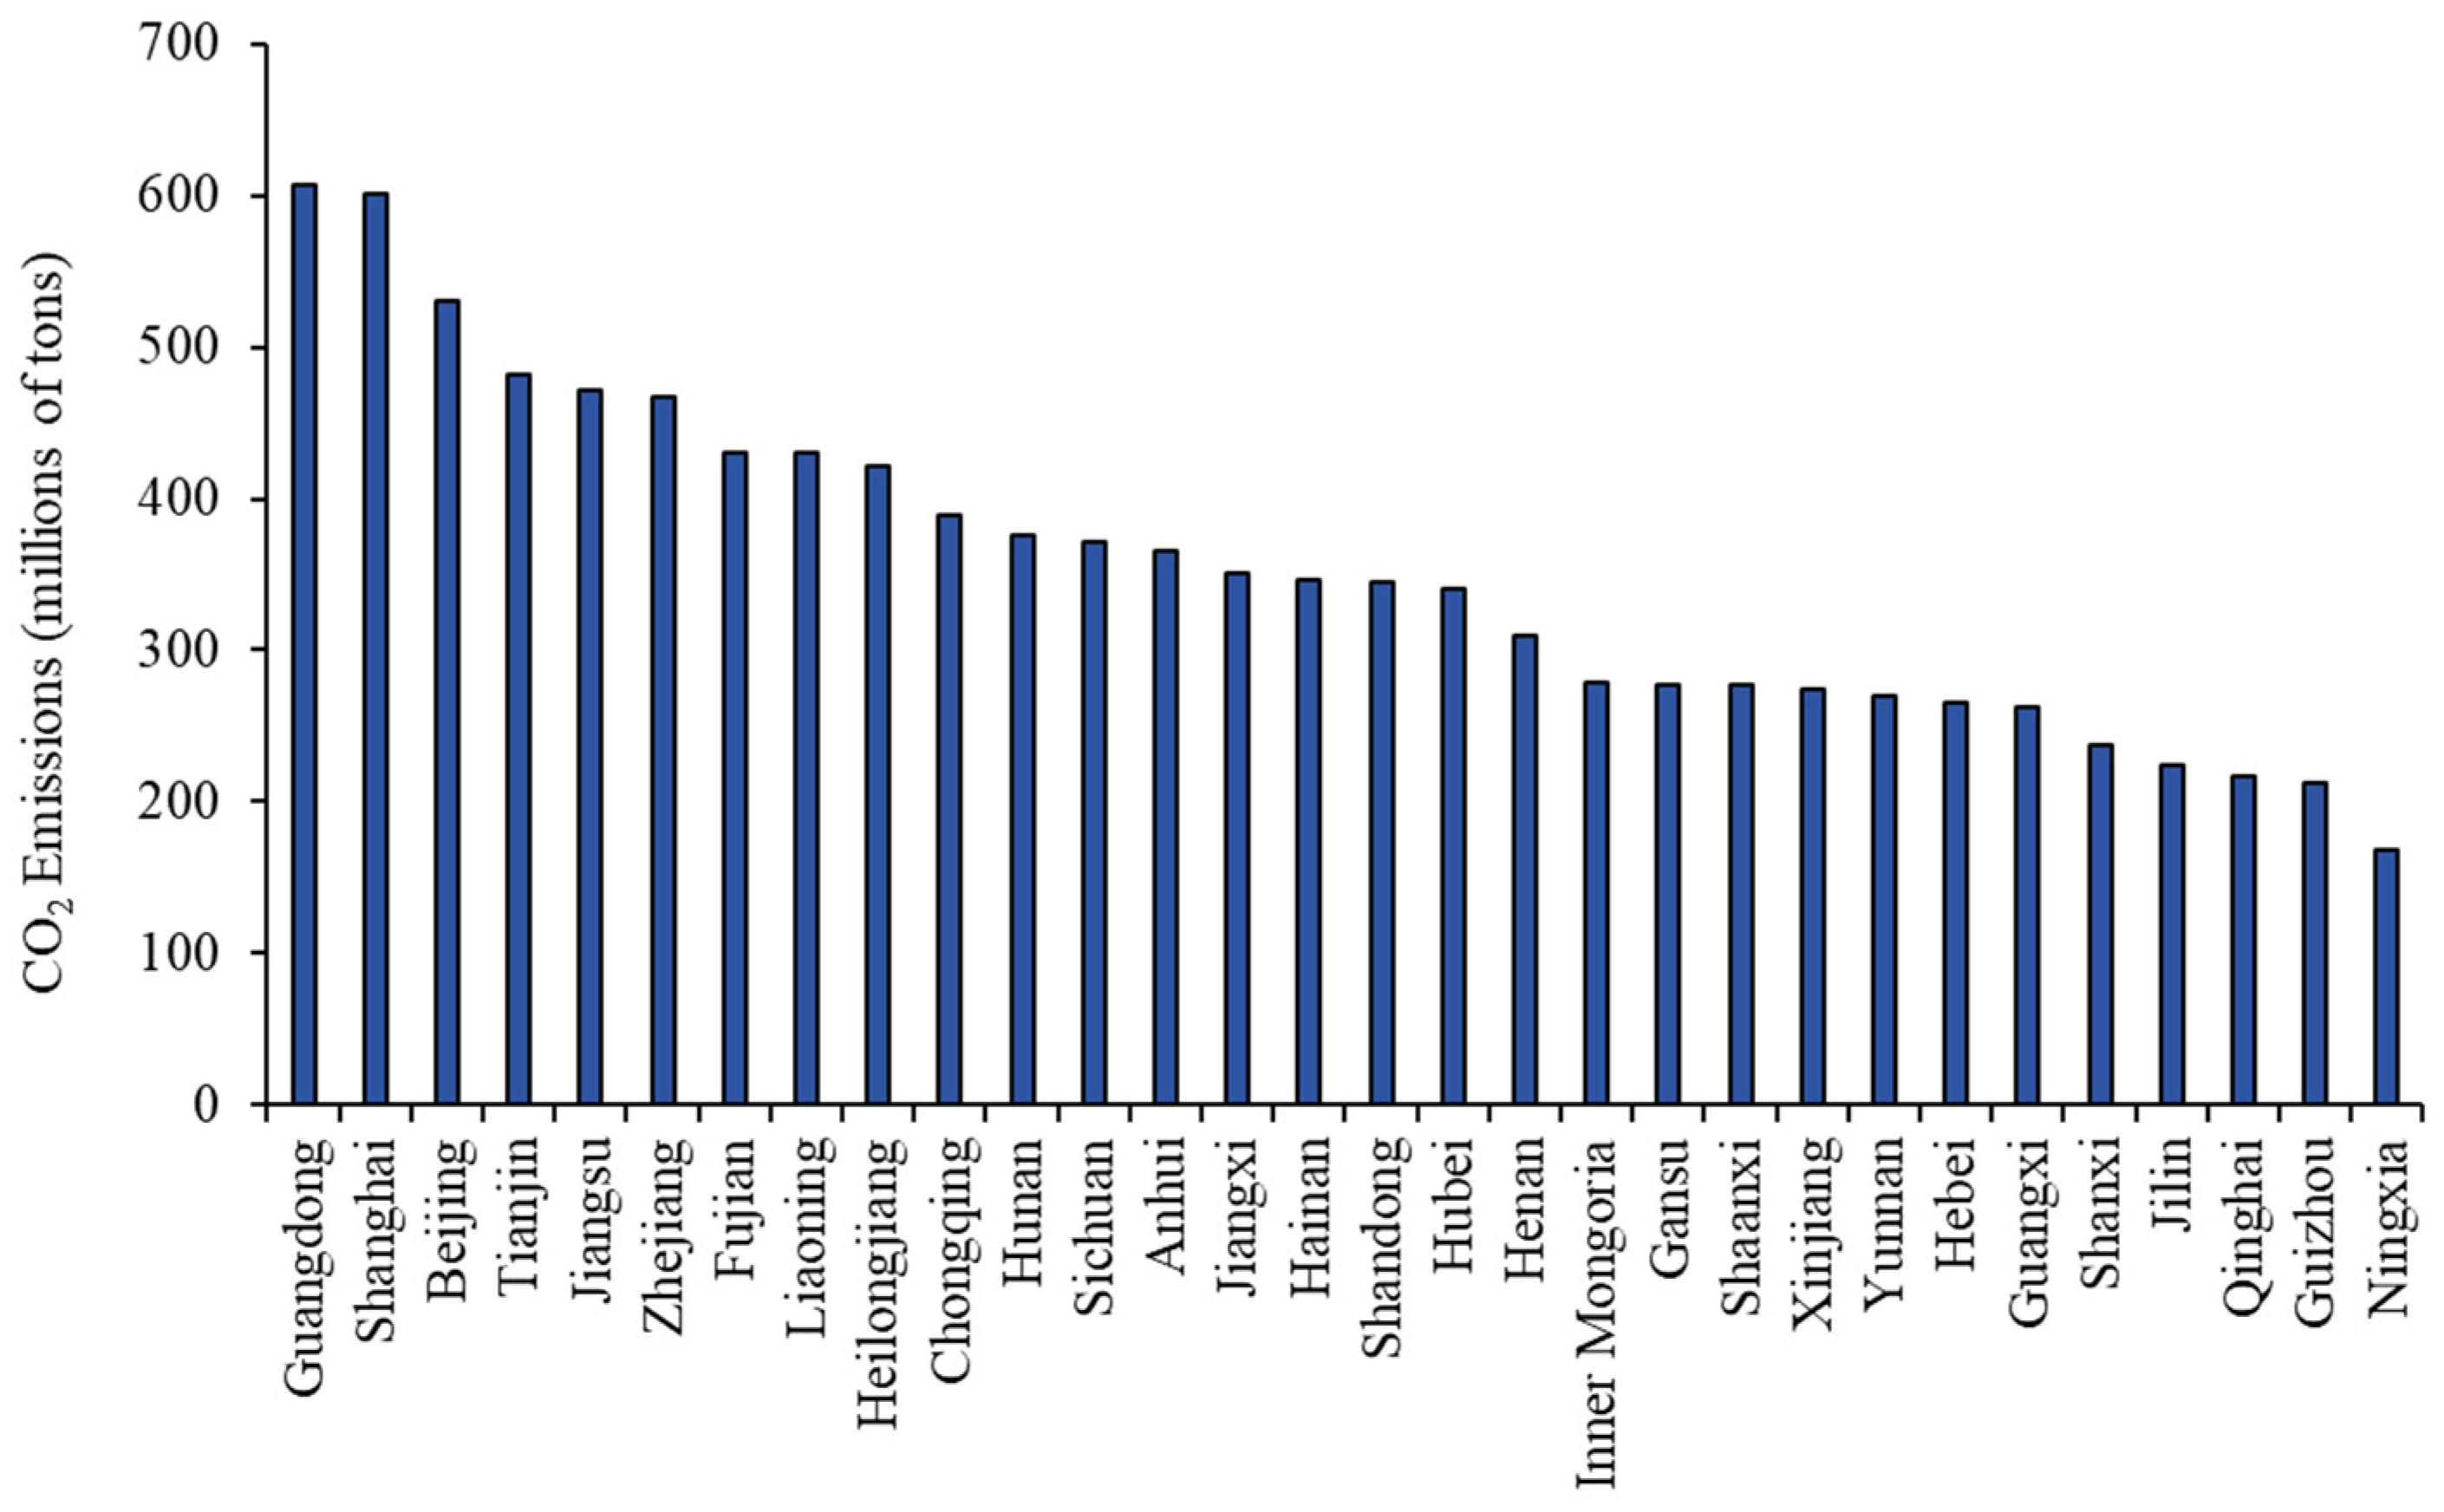
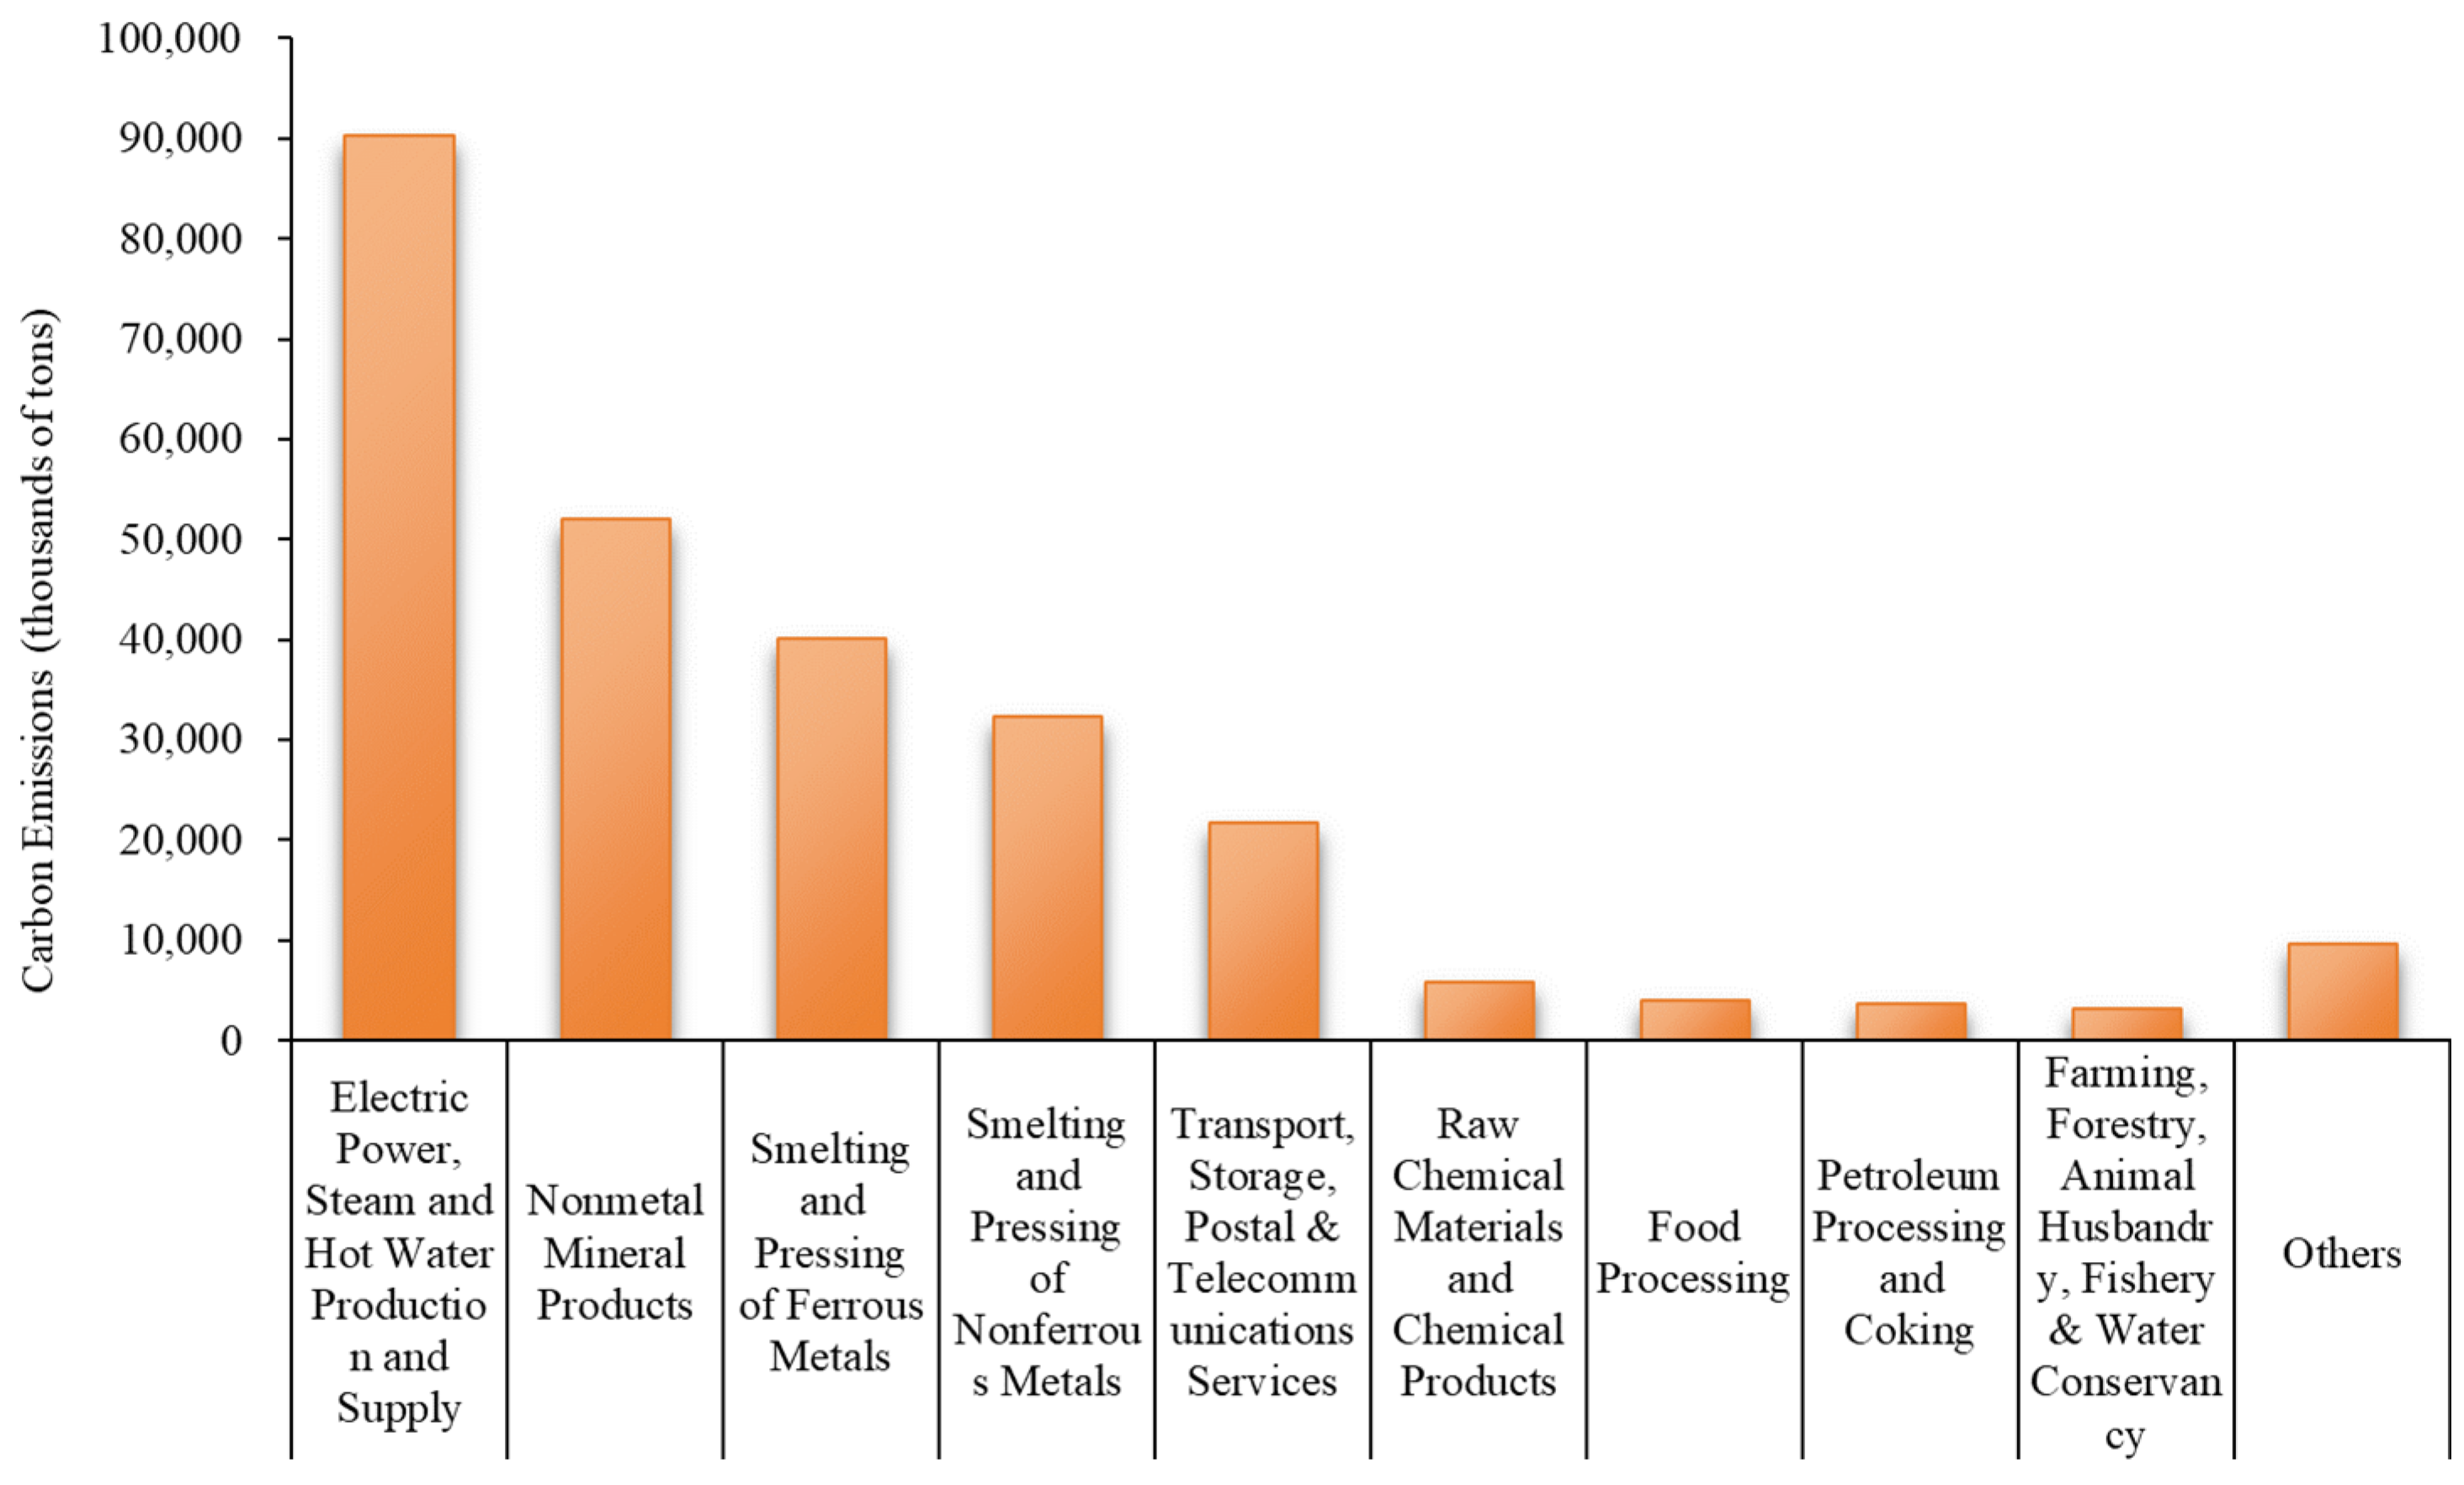
  • From the results of carbon quota allocation by province, there is a notable difference in the allocation for 2020, with regions like Guangdong receiving the highest quota of 606 million tons, constituting 5.72% of the national carbon quota. In contrast, Guangxi is allocated only 263 million tons, 26% below the average quota. Concerning industrial carbon quota allocation, owing to its historically highest carbon emissions across all industries, Guangxi’s electric power, steam, and hot water production and supply sector secures 90.36 million tons of carbon quota, accounting for 34% of the total regional carbon allocation in Guangxi.
  • The Carbon Neutrality Index of key enterprises in Guangxi in 2020 indicates that there is still significant room for improvement in reducing carbon emissions among enterprises in the region. Approximately 60.66% of enterprises have a Carbon Neutrality Index greater than 1, failing to meet the carbon neutrality standard. Around 39.34% of enterprises are able to achieve carbon neutrality goals. In addition, 8.79% of enterprises have a Carbon Neutrality Index ranging from 0.75 to 1.00. While these enterprises just meet the carbon neutrality standard, the rising electricity demand due to economic growth may lead to their carbon emissions surpassing allocated quotas.
  • Based on the carbon emission warning levels of key enterprises in Guangxi in 2021, there is a clear trend of emission reduction among Guangxi enterprises. Over 90% of enterprises are actively implementing emission reduction measures, with more than half of them being recognized as being at the Commendation level, and 36.77% of enterprises being awarded the Encouragement level. Only 9.17% of enterprises are rated as Warning, and 0.21% are rated as Reminder. Overall, while Guangxi enterprises still face emission reduction challenges, it is progressing towards sustainable development.

5.2. Implications

Based on the research conclusions, this paper proposes the following policy recommendations to help China better achieve its dual carbon targets:
  • Estimates on the pathways to carbon neutrality from all institutes indicate that China faces severe challenges in achieving carbon neutrality. The government needs to deploy policies and plan in advance to ensure the smooth achievement of China’s carbon neutrality goal. Initially, it is suggested that the government increase investment in carbon emission control, as early successful reductions would be a crucial step towards achieving the target. In the medium term, the government should accelerate the exploitation and use of clean energy and encourage industries to improve energy efficiency levels to ensure cleaner, more efficient, and economical energy supply and consumption. In the later stage, the government is recommended to support the research, development, and application of carbon sink and carbon sequestration technologies to make substantial progress in deep decarbonization.
  • To alleviate the emission reduction pressure on high-carbon industries and enterprises, carbon emission control policies should be formulated based on the characteristics of each emission entity. At the industry level, it is recommended that carbon emission control targets be established according to the historical carbon emissions of each industry. Industries with significant carbon reduction pressure should be given special attention, supporting them in achieving technological upgrades and transitioning to clean energy sources. At the enterprise level, implement stricter monitoring and emission reduction requirements for enterprises with a Carbon Neutrality Index greater than 1, and take corresponding measures to encourage their proactive emission reduction efforts.
  • In conjunction with the dynamic control and early warning levels of enterprise carbon emissions, a series of targeted policies could be formulated to better achieve carbon neutrality targets for enterprises in Guangxi. On one hand, for enterprises with the Commendation and Encouragement early warning level, strengthen the reward system and set up special funds to incentivize more enterprises to participate actively in emission reduction. On the other hand, provide technical support and training for enterprises at the Reminder and Warning level to help them improve emission reduction techniques and ensure better compliance with carbon quotas in the future.
While our model enables carbon emission-level early warnings at the enterprise level, there are still research gaps and potential avenues for future expansion. On one hand, our alert results are somewhat reliant on the selection of China’s carbon neutrality pathway and allocation indicators, which is evident in the substantial discrepancies between our provincial-level carbon quota allocation results and those of other allocation methods [31]. Therefore, flexible adjustments are required based on actual circumstances during practical implementation. On the other hand, future research could innovate in regard to the construction of allocation weights for carbon quotas at various levels, enriching research methods for carbon quota allocation and thus better facilitating the realization of China’s carbon neutrality goals.

Author Contributions

Conceptualization, C.Z.; methodology, C.Z. and W.Z.; software, W.Z.; investigation, H.T.; resources, C.Z. and H.T.; data curation, H.T.; writing—original draft preparation, W.Z. and J.Q.; writing—review and editing, J.Q. and Q.L.; visualization, W.Z.; supervision, W.Z.; project administration, C.Z. and H.T. All authors have read and agreed to the published version of the manuscript.

Funding

This research was funded by China Southern Power Grid, grant number 0400002023030301GZ00029.

Data Availability Statement

The data presented in this study are available upon request from the corresponding author.

Conflicts of Interest

Authors Chunli Zhou, Huizhen Tang and Qideng Luo are employed by the company Guangxi Power Grid Co., Ltd. The remaining authors declare that the research is conducted in the absence of any commercial or financial relationships that could be construed as a potential conflict of interest.

Appendix A. The Calculation of Industry Carbon Quota Allocation

Table A1. Industry carbon quota allocation in Guangxi (2020).
IndustryCarbon Emissions (Thousands of Tons)
Electric power, steam, and hot water production and supply90,363.66
Nonmetal mineral products52,126.65
Smelting and pressing of ferrous metals40,172.04
Smelting and pressing of nonferrous metals32,377.78
Transport, storage, postal, and telecommunications services21,715.46
Raw chemical materials and chemical products5896.58
Food processing4012.46
Petroleum processing and coking3716.94
Farming, forestry, animal husbandry, fishery, and water conservancy3159.03
Wholesale, retail trade, and catering service2086.43
Papermaking and paper products1880.62
Beverage production909.83
Other868.49
Transportation equipment505.38
Construction384.55
Medical and pharmaceutical products312.61
Food Production274.36
Ferrous metals mining and dressing256.38
Plastic products245.49
Gas production and supply234.15
Metal products229.11
Textile industry220.89
Ordinary machinery174.84
Nonferrous metals mining and dressing173.64
Timber processing; bamboo, cane, palm, and straw products168.01
Rubber products166.95
Nonmetal minerals mining and dressing122.44
Coal mining and dressing89.04
Equipment for special purpose86.32
Electric equipment and machinery46.03
Tobacco processing42.60
Leather, furs, down, and related products42.48
Other manufacturing industry41.56
Scrap and waste11.04
Electronic and telecommunications equipment8.12
Tap water production and supply6.11
Printing and record medium reproduction5.18
Furniture manufacturing4.53
Garments and other fiber products2.40
Chemical fiber1.46
Instruments, meters cultural, and office machinery1.04
Cultural, educational, and sports articles0.41
Other minerals mining and dressing0.06
Petroleum and natural gas extraction0.00
Logging and transport of wood and bamboo0.00

References

  1. Shi, H.; Chai, J.; Lu, Q.; Zheng, J.; Wang, S. The impact of China’s low-carbon transition on economy, society and energy in 2030 based on CO2 emissions drivers. Energy 2022, 239, 122336. [Google Scholar] [CrossRef]
  2. Xu, S. China’s climate governance for carbon neutrality: Regulatory gaps and the ways forward. Hum. Soc. Sci. Commun. 2023, 10, 853. [Google Scholar] [CrossRef]
  3. He, W.; Zhang, B.; Li, Y.; Chen, H. A performance analysis framework for carbon emission quota allocation schemes in China: Perspectives from economics and energy conservation. J. Environ. Manag. 2021, 296, 113165. [Google Scholar] [CrossRef] [PubMed]
  4. Hong, Y.; Jiang, X.; Xu, H.; Yu, C. The impacts of China’s dual carbon policy on green innovation: Evidence from Chinese heavy-polluting enterprises. J. Environ. Manag. 2024, 350, 119620. [Google Scholar] [CrossRef] [PubMed]
  5. Liu, Z.; Guan, D.; Wei, W. Carbon emission accounting in China. Sci. China Earth 2018, 48, 878–887. (In Chinese) [Google Scholar]
  6. Qian, H.; Xu, S.; Cao, J.; Ren, F.; Wei, W.; Meng, J.; Wu, L. Air pollution reduction and climate co-benefits in China’s industries. Nat. Sustain. 2021, 4, 417–425. [Google Scholar] [CrossRef]
  7. Pan, J. Construction, challenges and marcket expansion of emissions trading system. Chin. J. Popul. Resour. Environ. 2016, 26, 1–5. (In Chinese) [Google Scholar]
  8. Xie, M.; Liu, X.; Yan, W.; Li, Y.; Liu, X.; Zhang, G.; Sun, J. Carbon emission reduction pathways under carbon neutrality targets in Gansu province of China. Front. Environ. Sci. 2022, 10, 1042344. [Google Scholar] [CrossRef]
  9. Zhang, D.; Huang, X.D.; Zhong, J.T.; Guo, L.-F.; Guo, S.-Y.; Wang, D.-Y.; Miao, C.-H.; Zhang, X.L.; Zhang, X.Y. A representative CO2 emissions pathway for China toward carbon neutrality under the Paris Agreement’s 2 °C target. Adv. Clim. Chang. Res. 2023, 14, 941–951. [Google Scholar] [CrossRef]
  10. Fan, X. Enightenments of the intemational ealy waming system to domestic environmental eany waning research. Acta Ecol. Sin. 2021, 41, 7454–7463. [Google Scholar]
  11. Neußner, O. Early warning alerts for extreme natural hazard events: A review of worldwide practices. Int. J. Disaster Risk Reduct. 2021, 60, 102295. [Google Scholar] [CrossRef]
  12. Xu, Y.; Guo, J. Construction safety early warning simulation based on risk conduction BN model. Comput. Simul. 2024, 41, 527–531. (In Chinese) [Google Scholar]
  13. Li, J.; Wang, L.; Wang, J. Based on dynamic critical rainfall of the mountain torrent disaster early warning technology research. J. Nat. Disasters 2023, 32, 235–242. (In Chinese) [Google Scholar]
  14. Sun, P.; Wu, K. Based on data fusion of large passenger flow in urban rail transit early warning research. Electron. Des. Eng. 2024, 32, 135–139. (In Chinese) [Google Scholar]
  15. Huang, Z.; Wu, C.; Chen, Z. Research on safety early warning of petrochemical Enterprises based on AHP-BP neural network method. Ind. Saf. Environ. Prot. 2021, 47, 1–6. (In Chinese) [Google Scholar]
  16. Sättele, M.; Bründl, M.; Straub, D. Quantifying the effectiveness of early warning systems for natural hazards. Nat. Hazards Earth Syst. Sci. 2016, 16, 149–166. [Google Scholar] [CrossRef]
  17. Liang, Y.; Niu, D.; Wang, H.; Chen, H. Assessment Analysis and Forecasting for Security Early Warning of Energy Consumption Carbon Emissions in Hebei Province, China. Energies 2017, 10, 391. [Google Scholar] [CrossRef]
  18. Zhao, G. Research on measurement and early warning of carbon emissions from China’s export trade. Ecol. Econ. 2018, 34, 19–24. (In Chinese) [Google Scholar]
  19. Cui, J.; Xu, B.; Han, J. Construction of carbon emission early warning index system based on Folksonomy and ontology modeling. Inf. Sci. 2013, 31, 126–129. (In Chinese) [Google Scholar]
  20. Han, S.; Zhu, M.; Liu, H. Research on carbon emission monitoring and early warning system: Based on the analysis of provincial data in China. Ecol. Econ. 2012, 38, 21–27. (In Chinese) [Google Scholar]
  21. Kawamoto, K.; Shimoda, Y.; Mizuno, M. Energy saving potential of office equipment power management. Energy Build. 2004, 36, 915–923. [Google Scholar] [CrossRef]
  22. Cong, R.; Han, J. Research on carbon emission early warning evaluation of China’s thermal power plants based on artificial neural network—A case study of a thermal power plant in Jilin Province. Ecol. Econ. 2019, 35, 37–41. (In Chinese) [Google Scholar]
  23. Zhou, Z.; Xiao, T. Based on support vector machine (SVM) carbon polluting industries risk early warning research. Environ. Pollut. Control 2016, 38, 82–89. (In Chinese) [Google Scholar]
  24. Xin, D. Research on Measurement and Early Warning of Carbon Emission of China’s Agricultural Export Products. Master’s Thesis, North China Electric Power University, Beijing, China, 2019. (In Chinese). [Google Scholar]
  25. Jin, H.; Chen, Y.; Zhang, L. Research on carbon emission monitoring and early warning system based on blockchain. Econ. Res. Guide 2023, 36–38. (In Chinese) [Google Scholar]
  26. Peng, Y. Research and Design of Distributed WebGIS Carbon Emission Early Warning and Decision System. Master’s Thesis, Central South University, Hunan, China, 2012. (In Chinese). [Google Scholar]
  27. Zhang, Y.-J.; Hao, J.-F.; Song, J. The CO2 emission efficiency, reduction potential and spatial clustering in China’s industry: Evidence from the regional level. Appl. Energy 2016, 174, 213–223. [Google Scholar] [CrossRef]
  28. Du, K.; Zou, C. Regional differences, influencing factors and convergence analysis of carbon emission efficiency in China: An empirical study based on stochastic frontier model and panel unit root. Zhejiang Soc. Sci. 2011, 32–43. (In Chinese) [Google Scholar]
  29. Battese, G.E.; Coelli, T.J. A Model for Technical Inefficiency Effects in a Stochastic Frontier Production Function for Panel Data. Empir. Econ. 1995, 20, 325–332. [Google Scholar] [CrossRef]
  30. Cong, R.; Lo, A.Y. Emission trading and carbon market performance in Shenzhen, China. Appl. Energy 2017, 193, 414–425. [Google Scholar] [CrossRef]
  31. Li, F.; Wu, F.P.; Chen, L.X. Harmonious allocation of carbon emission permits based on dynamic multiattribute decision-making method. J. Clean. Prod. 2020, 248, 119184. [Google Scholar] [CrossRef]
  32. Liu, L.; Chen, C.; Zhao, Y.; Zhao, E. China׳s carbon-emissions trading: Overview, challenges and future. Renew. Sustain. Energy Rev. 2015, 49, 254–266. [Google Scholar] [CrossRef]
  33. Ye, F.; Fang, X.; Li, L.; Li, Y.; Chang, C.-T. Allocation of carbon dioxide emission quotas based on the energy-economy-environment perspective: Evidence from Guangdong Province. Sci. Total Environ. 2019, 669, 657–667. [Google Scholar] [CrossRef] [PubMed]
  34. Chen, H.; Wang, R.; Liu, X.; Du, Y.; Yang, Y. Monitoring the enterprise carbon emissions using electricity big data: A case study of Beijing. J. Clean. Prod. 2023, 396, 136427. [Google Scholar] [CrossRef]
  35. Chen, H.; Gong, K.; Chang, Y.; He, W.; Geng, H.; Zhang, B.; Zhang, W. Modeling the power system resilience in China under different natural disasters. J. Environ. Manag. 2023, 347, 119151. [Google Scholar] [CrossRef]
  36. Chen, H.; Jin, L.; Wang, M.; Guo, L.; Wu, J. How will power outages affect the national economic growth: Evidence from 152 countries. Energy Econ. 2023, 126, 107055. [Google Scholar] [CrossRef]
  37. Zhou, C.; Lin, X.; Wang, R.; Song, B. Real-Time Carbon Emissions Monitoring of High-Energy-Consumption Enterprises in Guangxi Based on Electricity Big Data. Energies 2023, 16, 5124. [Google Scholar] [CrossRef]
  38. Shan, Y.; Guan, D.; Zheng, H.; Ou, J.; Li, Y.; Meng, J.; Mi, Z.; Liu, Z.; Zhang, Q. China CO2 emission accounts 1997–2015. Sci. Data 2018, 5, 170201. [Google Scholar] [CrossRef] [PubMed]
  39. Shan, Y.; Huang, Q.; Guan, D.; Hubacek, K. China CO2 emission accounts 2016–2017. Sci. Data 2020, 7, 54. [Google Scholar] [CrossRef] [PubMed]
  40. Guan, Y.; Shan, Y.; Huang, Q.; Chen, H.; Wang, D.; Hubacek, K. Assessment to China’s Recent Emission Pattern Shifts. Earth’s Future 2021, 9, e2021EF002241. [Google Scholar] [CrossRef]
  41. Shan, Y.; Liu, J.; Liu, Z.; Xu, X.; Shao, S.; Wang, P.; Guan, D. New provincial CO2 emission inventories in China based on apparent energy consumption data and updated emission factors. Appl. Energy 2016, 184, 742–750. [Google Scholar] [CrossRef]
  42. Xu, J.; Guan, Y.; Oldfield, J.; Guan, D.; Shan, Y. China carbon emission accounts 2020–2021. Appl. Energy 2024, 360, 122837. [Google Scholar] [CrossRef]
  43. Energy Foundation China. Synthesis Report 2020 on China’s Carbon Naturality. 2020. Available online: https://www.efchina.org/Attachments/Report/report-lceg-20201210 (accessed on 10 December 2020).
  44. Yu, B.; Zhao, G.; An, R.; Chen, J.; Tan, J.; Li, X. Carbon neutral targets under China’s carbon emissions way research. J. Beijing Inst. Technol. (Engl. Ed.) 2021, 23, 17–24. (In Chinese) [Google Scholar]
  45. Project Comprehensive Report Compilation Group; Tsinghua University. Comprehensive report on China’s Long-term low-carbon Development Strategy and Transition Path. China Popul. Resour. Environ. 2020, 30, 1–25. (In Chinese) [Google Scholar]
  46. Cai, B.; Cao, L.; Lei, Y.; Wang, C.; Zhang, L.; Zhu, J.; Li, M.; Du, M.; Lv, C.; Jiang, H.; et al. Carbon dioxide emission path under China’s carbon neutrality goal. China Popul. Resour. Environ. 2019, 31, 7–14. (In Chinese) [Google Scholar]
Figure 1. Pathways to carbon neutrality in China. Note: The pathway names represent the affiliated institutions of the researchers.
Energies 17 02508 g001
Figure 2. Carbon emission efficiency by province. Note: regions without color indicate missing data. Based on the standard map of GS (2022)1873, the boundaries of the base map were not modified.
Energies 17 02508 g002
Figure 3. Carbon quota allocation among provinces in 2020.
Energies 17 02508 g003
Figure 4. Carbon quota allocation by industry in Guangxi, 2020.
Energies 17 02508 g004
Figure 5. Carbon Neutrality Index of sample enterprises in Guangxi, 2020.
Energies 17 02508 g005
Figure 6. Carbon Emission Early Warning Levels for Sample Enterprises in Guangxi, 2021.
Energies 17 02508 g006
Disclaimer/Publisher’s Note: The statements, opinions and data contained in all publications are solely those of the individual author(s) and contributor(s) and not of MDPI and/or the editor(s). MDPI and/or the editor(s) disclaim responsibility for any injury to people or property resulting from any ideas, methods, instructions or products referred to in the content.

