
Experimental and DFT Studies of Influence of Flue Gas Components on the Interaction between CaO and As during Sludge Combustion

Abstract
:
1. Introduction
2. Materials
3. Experimental Setup
3.1. Combustion Experiments
3.2. Methods
4. Theoretical Calculations
4.1. Calculation Parameters
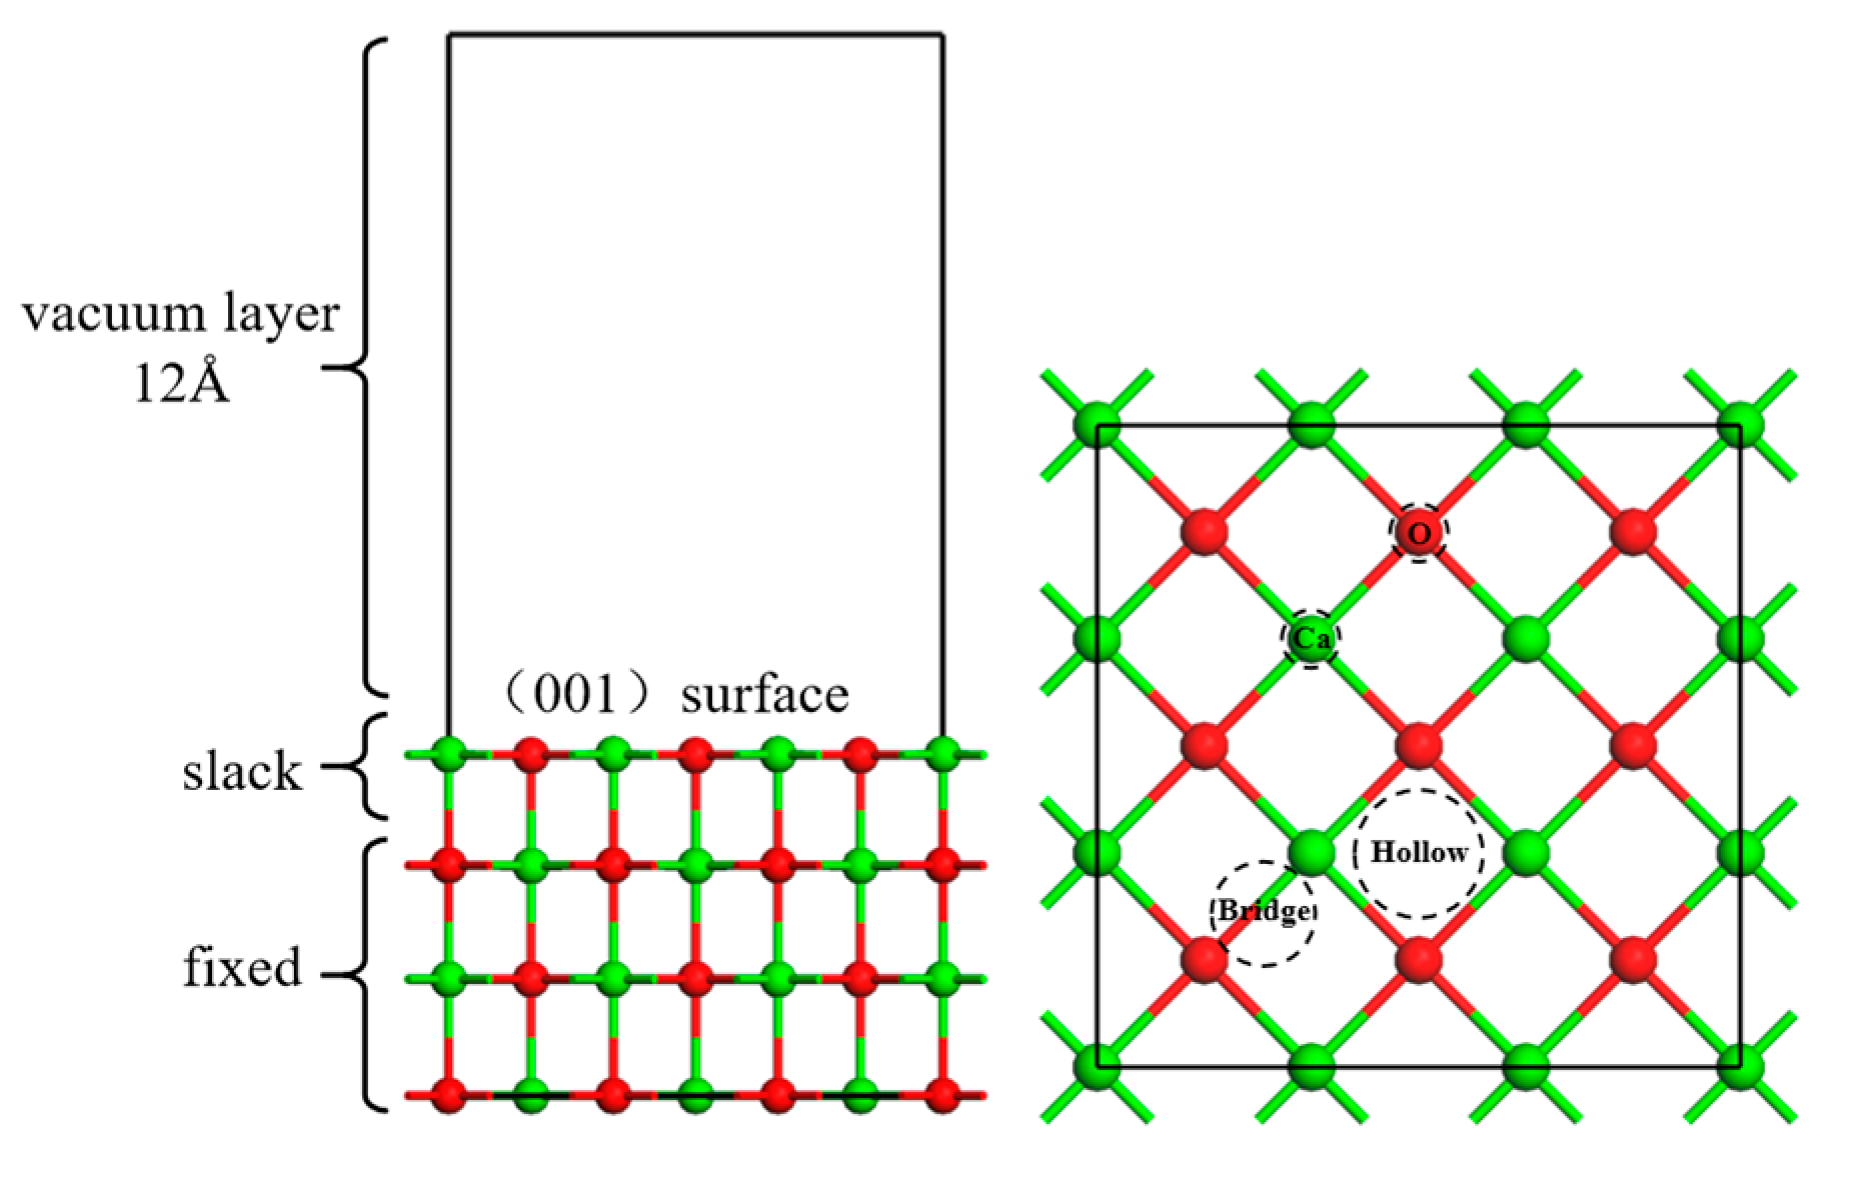
4.2. Model Parameters
4.3. Calculation of Adsorption Energy
5. Results and Discussion
5.1. Migration Behaviour of As from Sludge Combustion Process
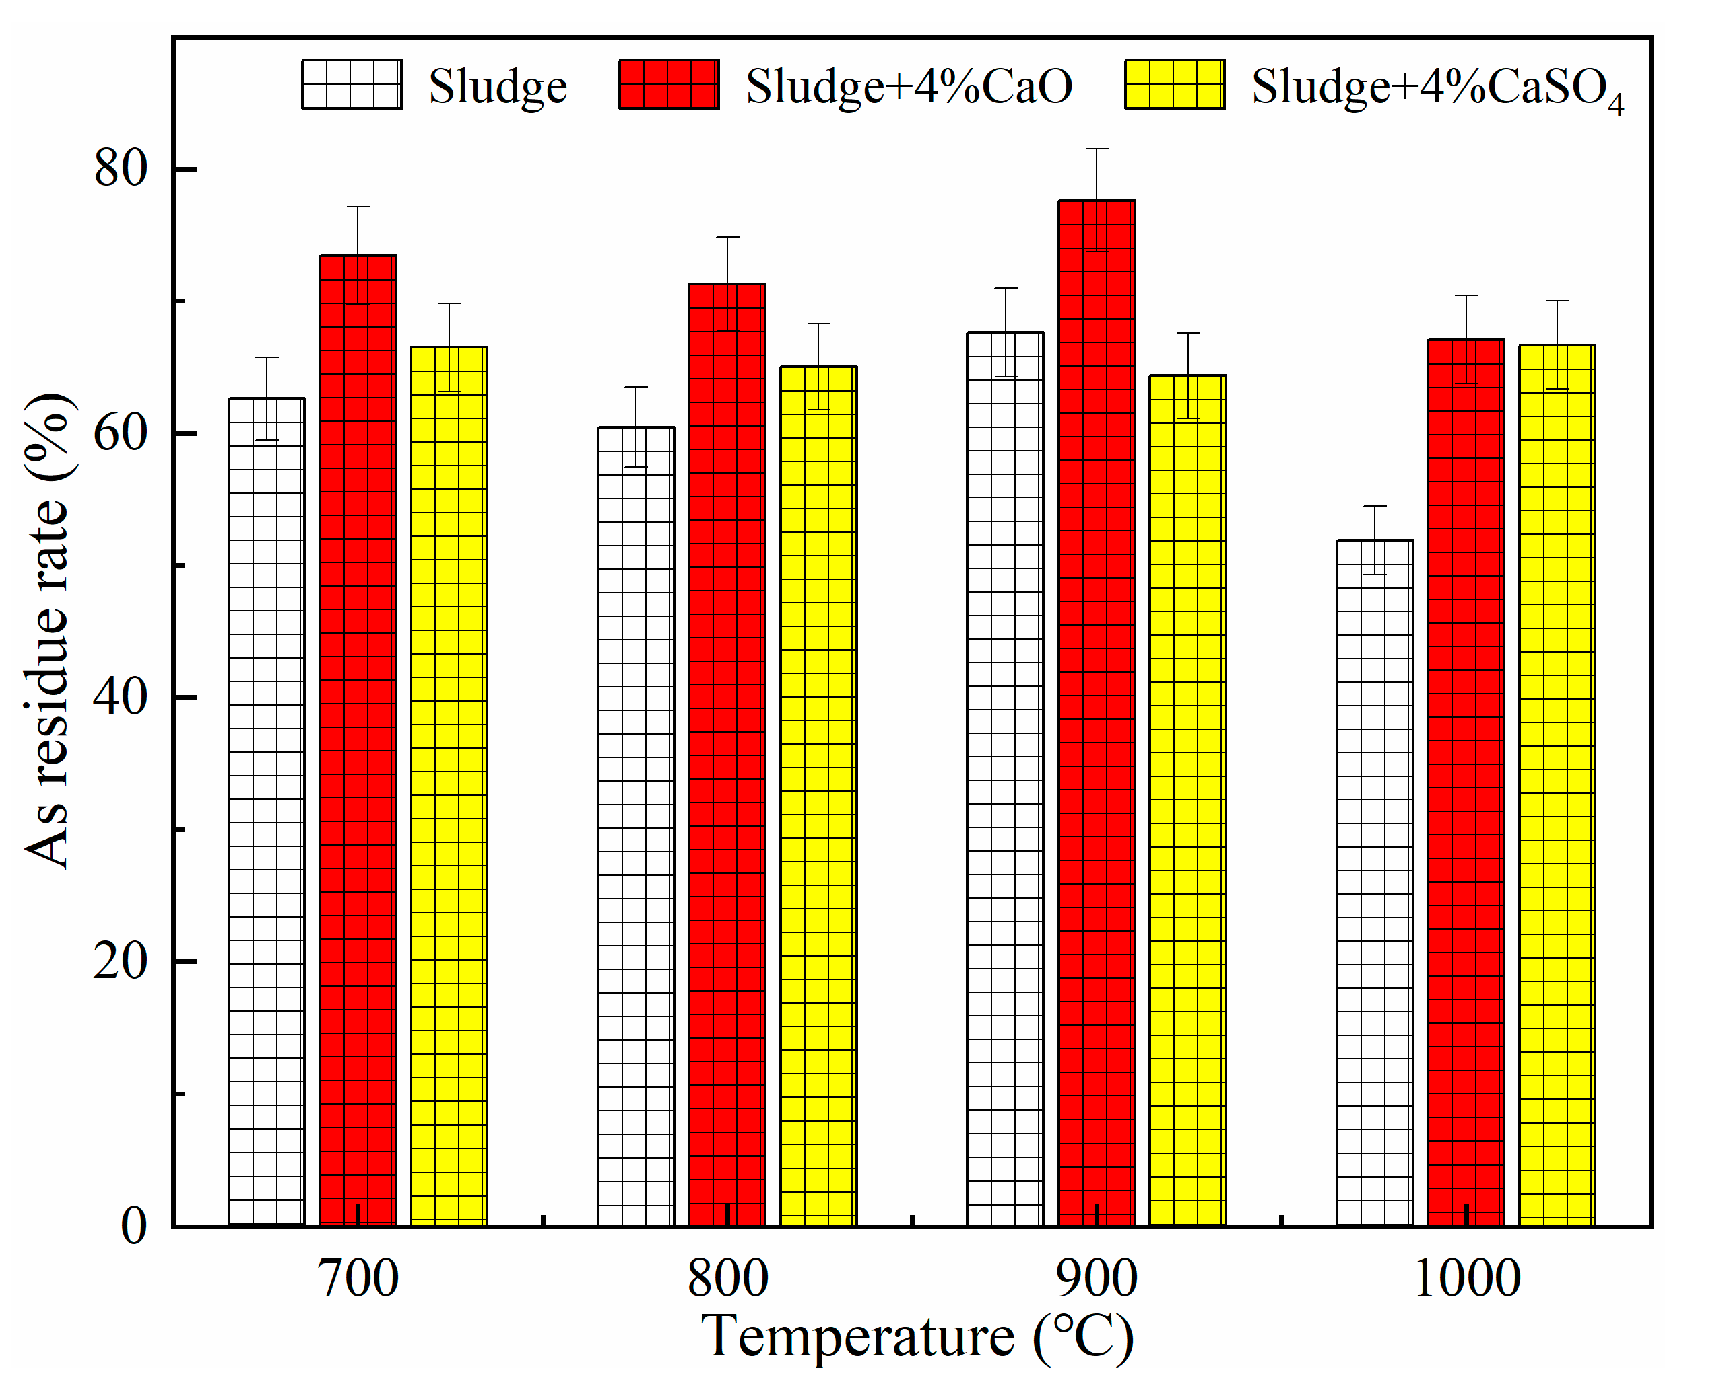
5.1.1. Impact of CaO on As Migration Pattern
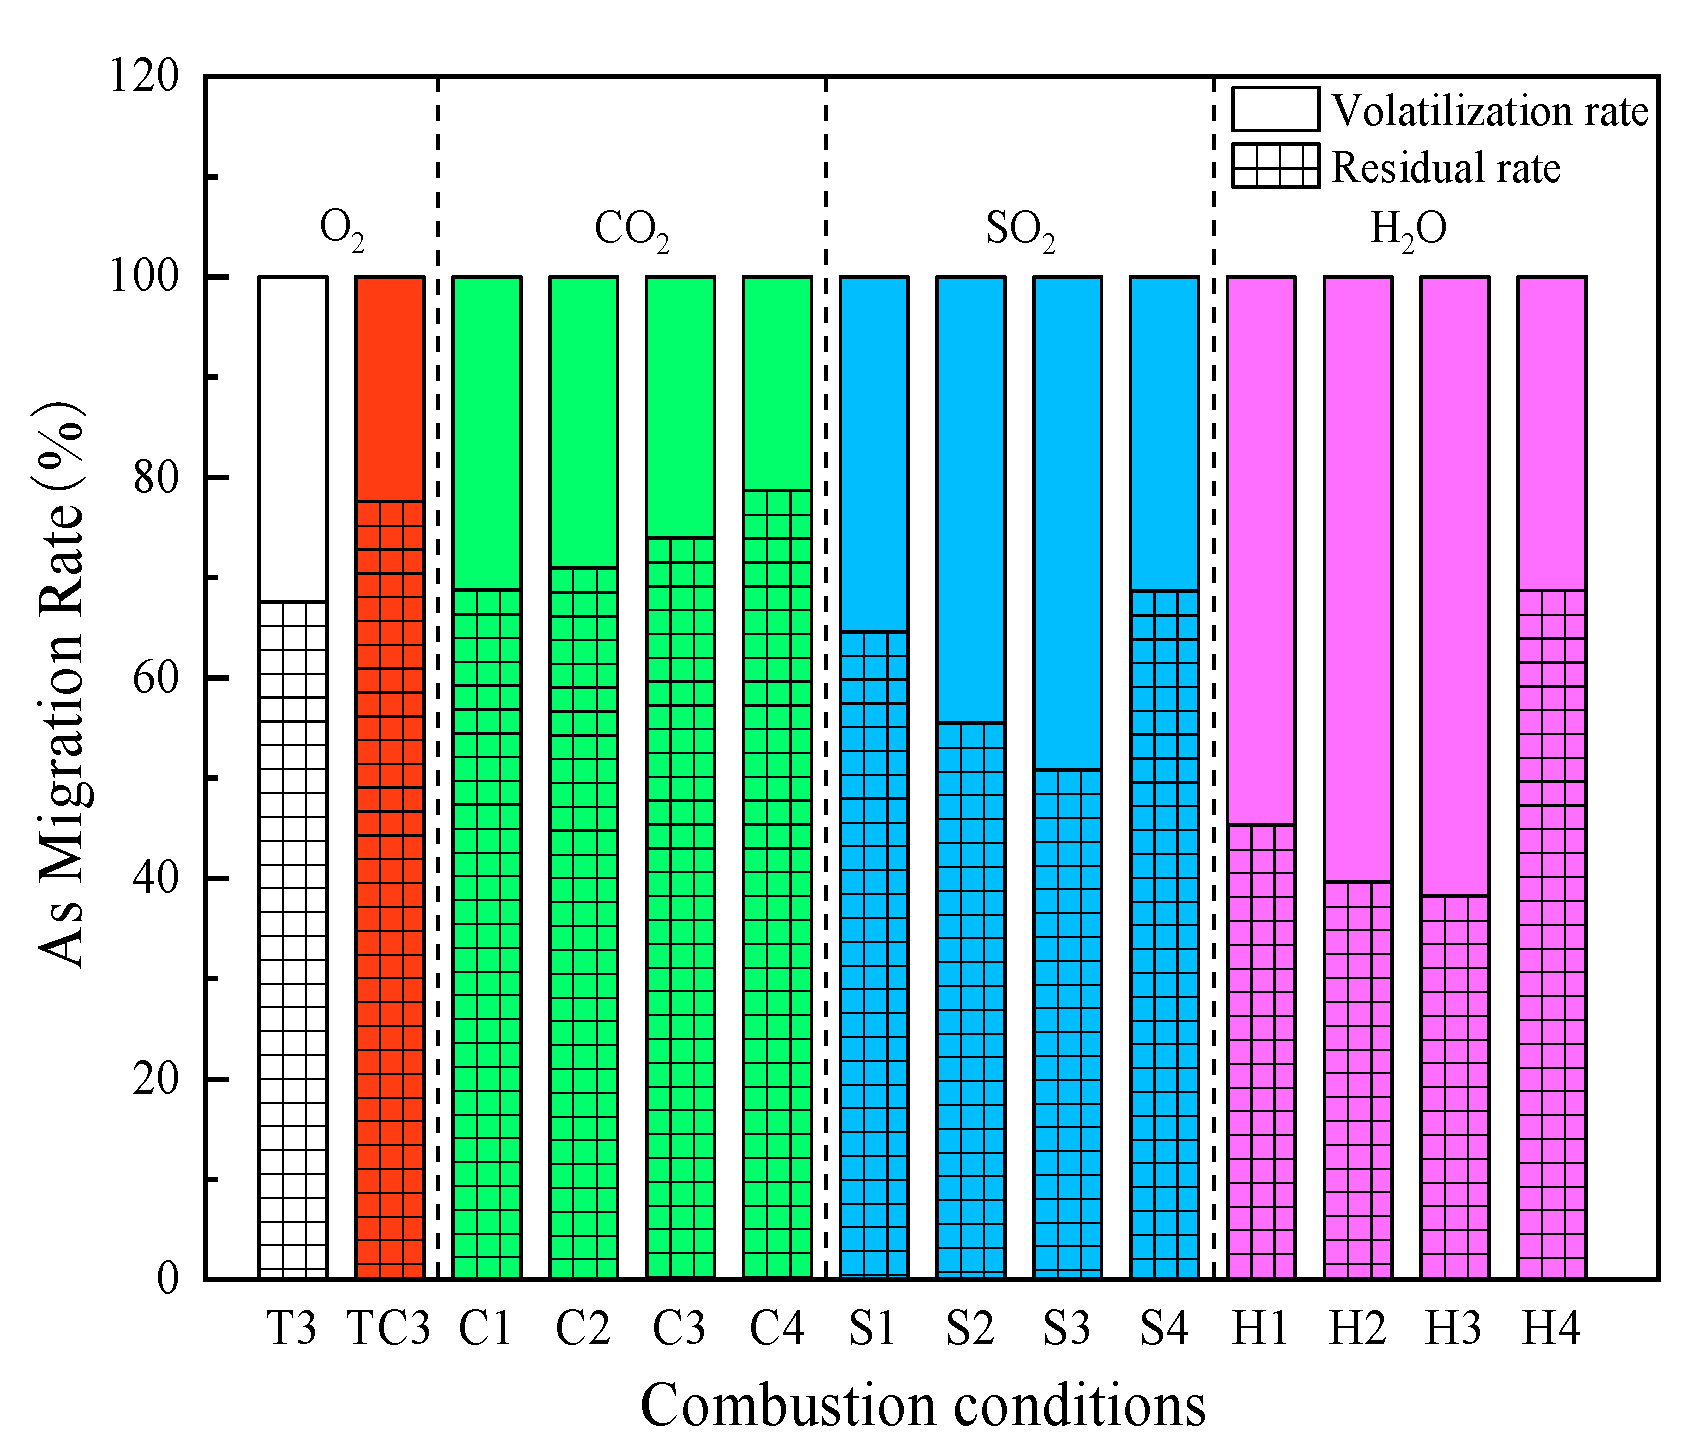
5.1.2. Impact of CO2/SO2/H2O on the Interaction of CaO and As
5.2. Characterization Analysis
5.2.1. Porosity Structure Analysis
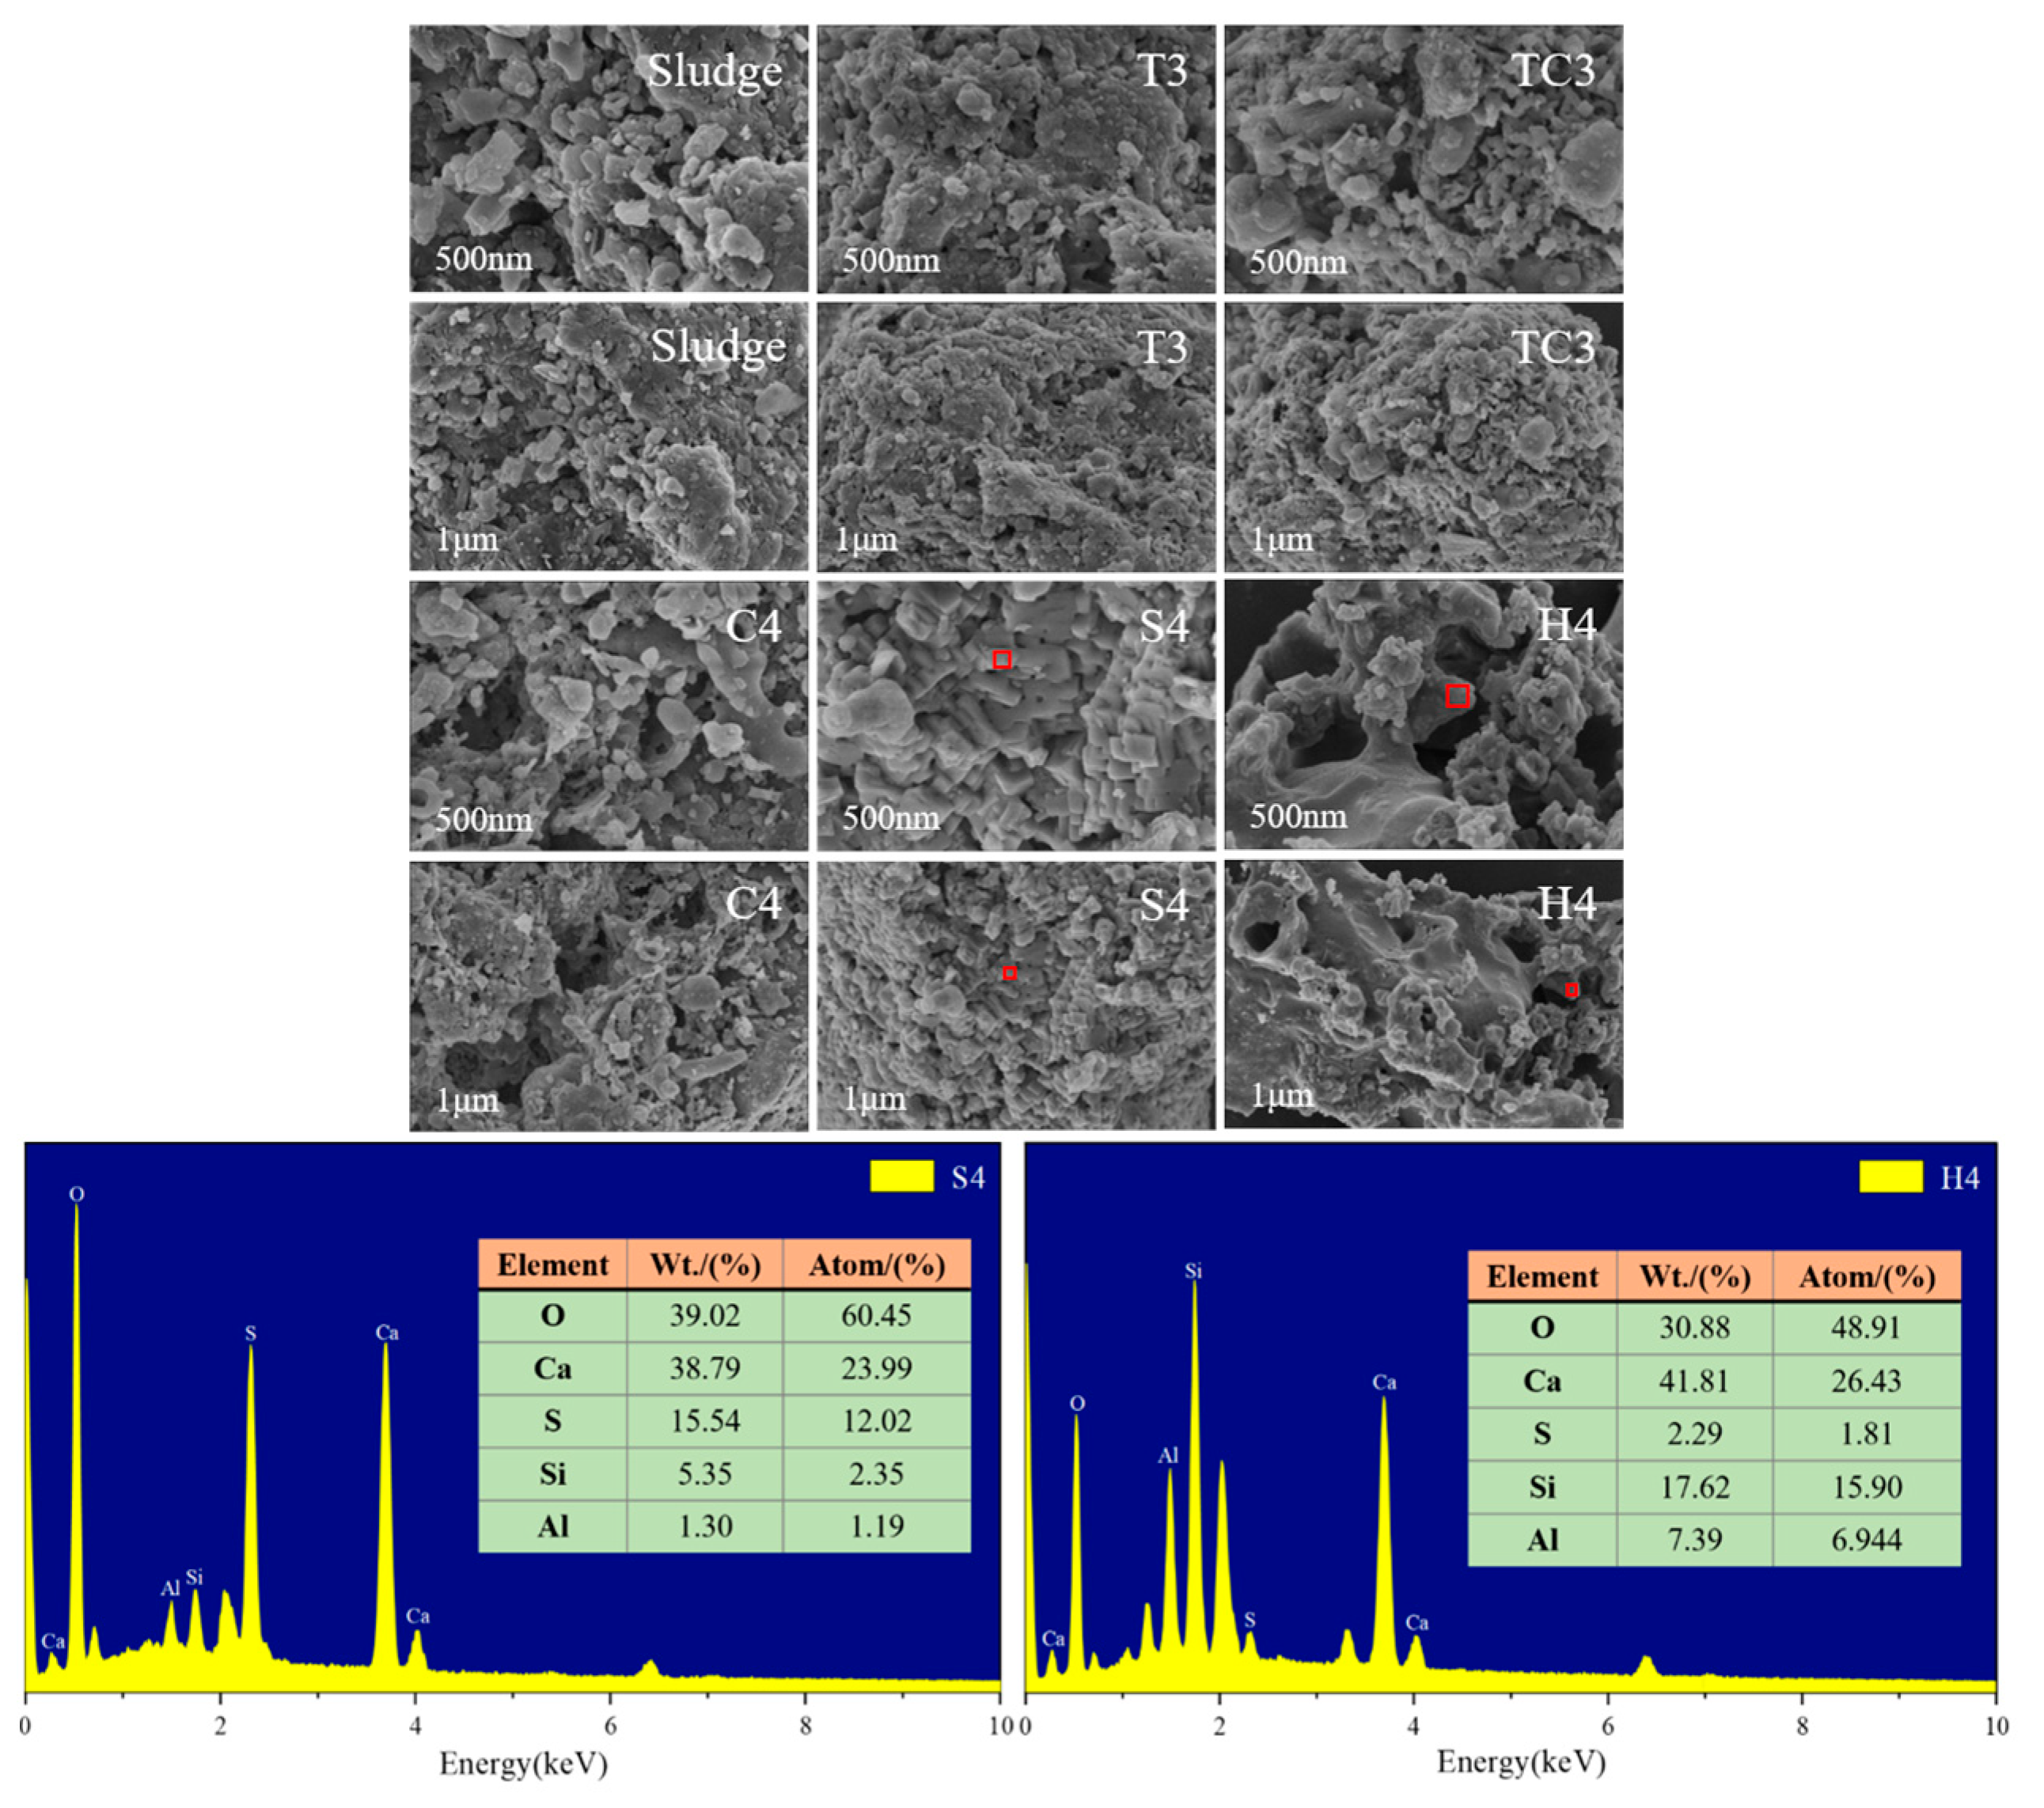
5.2.2. Microscopic Morphological Analysis
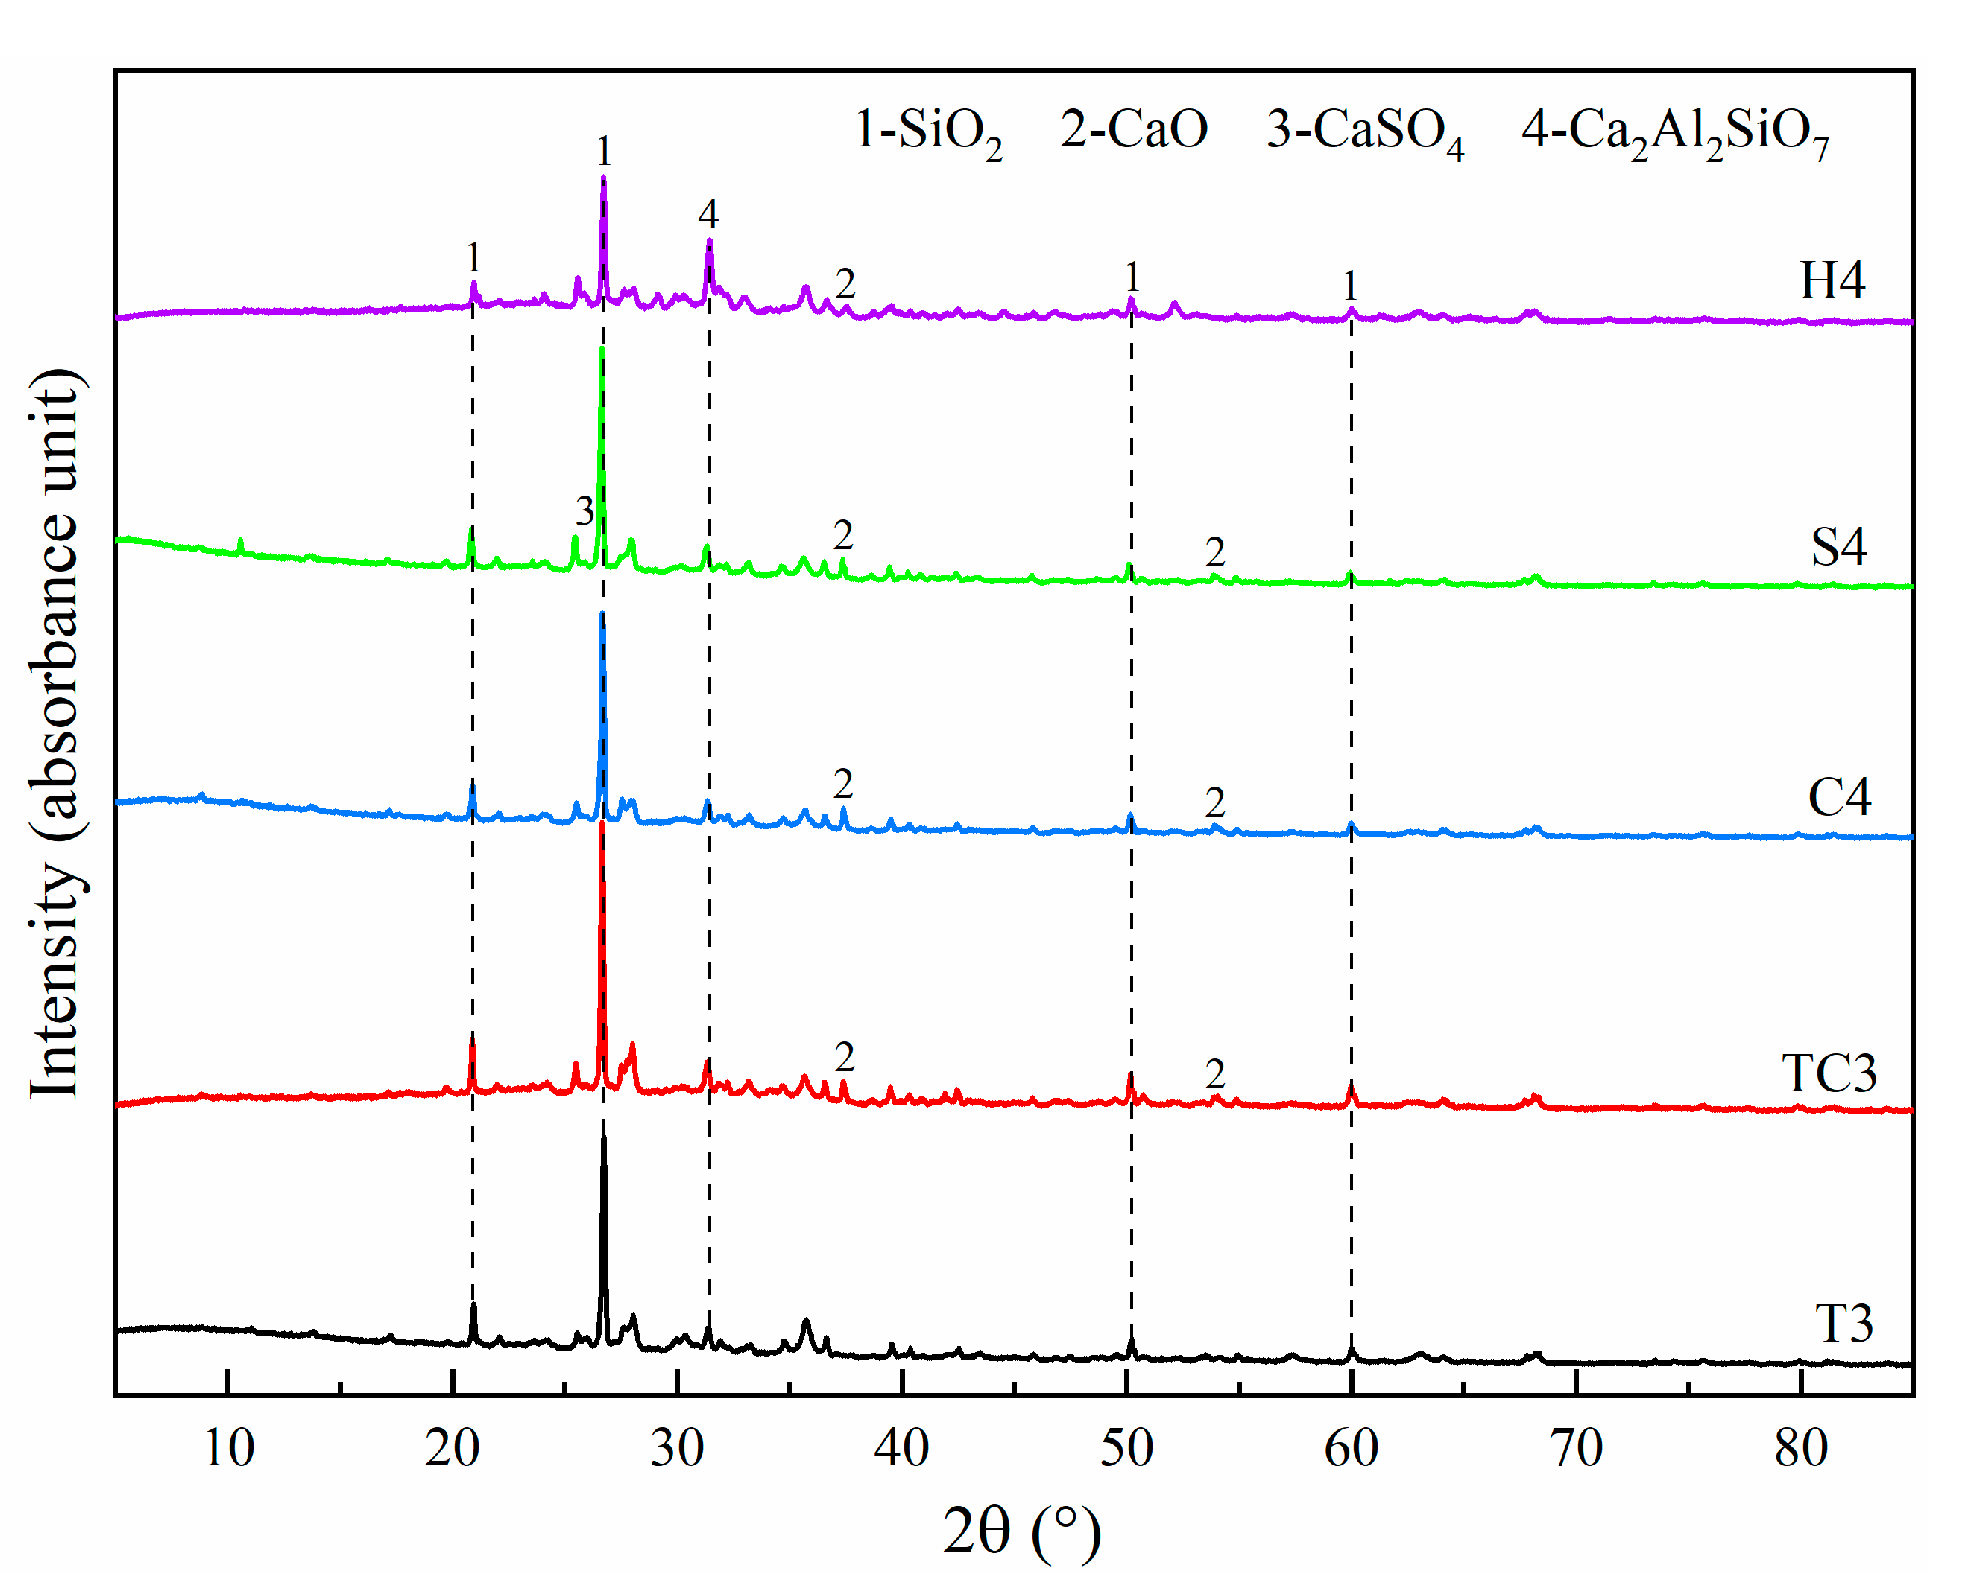
5.2.3. Phase Composition Analysis
5.3. Calculation Results and Discussion
6. Discussion
- (1)
- CaO chemically reacted with gaseous arsenic-containing compounds to produce more stable calcium-arsenic compounds, and CaO immobilized As better than CaSO4. CO2 contributed significantly to the immobilization of As. When CO2 concentration increased from 0% to 30%, the residual rates of As increased by 6.33%. SO2 was detrimental to the immobilization of As. As SO2 concentration increased from 0% to 0.2%, the residual rate of As showed a decreasing trend, decreasing by 16.76%. H2O had a significant inhibitory effect on the immobilization of As. The moisture content in sludge increased from 0% to 30%, and the residual rate of As was decreased by 29.38%.
- (2)
- The residual rate of As after combustion of sludge loaded with 4% CaO in 20CO2/20O2/60N2 atmosphere increased by 1.09%, and CO2 favored the capture of As by CaO. The residual rate of As was reduced by 8.96% after combustion of sludge loaded with 4% CaO in 0.15SO2/20O2/79.85N2 atmosphere, and SO2 inhibited CaO to fix As. The residual rate of As was reduced by 8.89% at 20% water content in sludge loaded with 4% CaO, and the presence of water was unfavorable for the capture of As by CaO.
- (3)
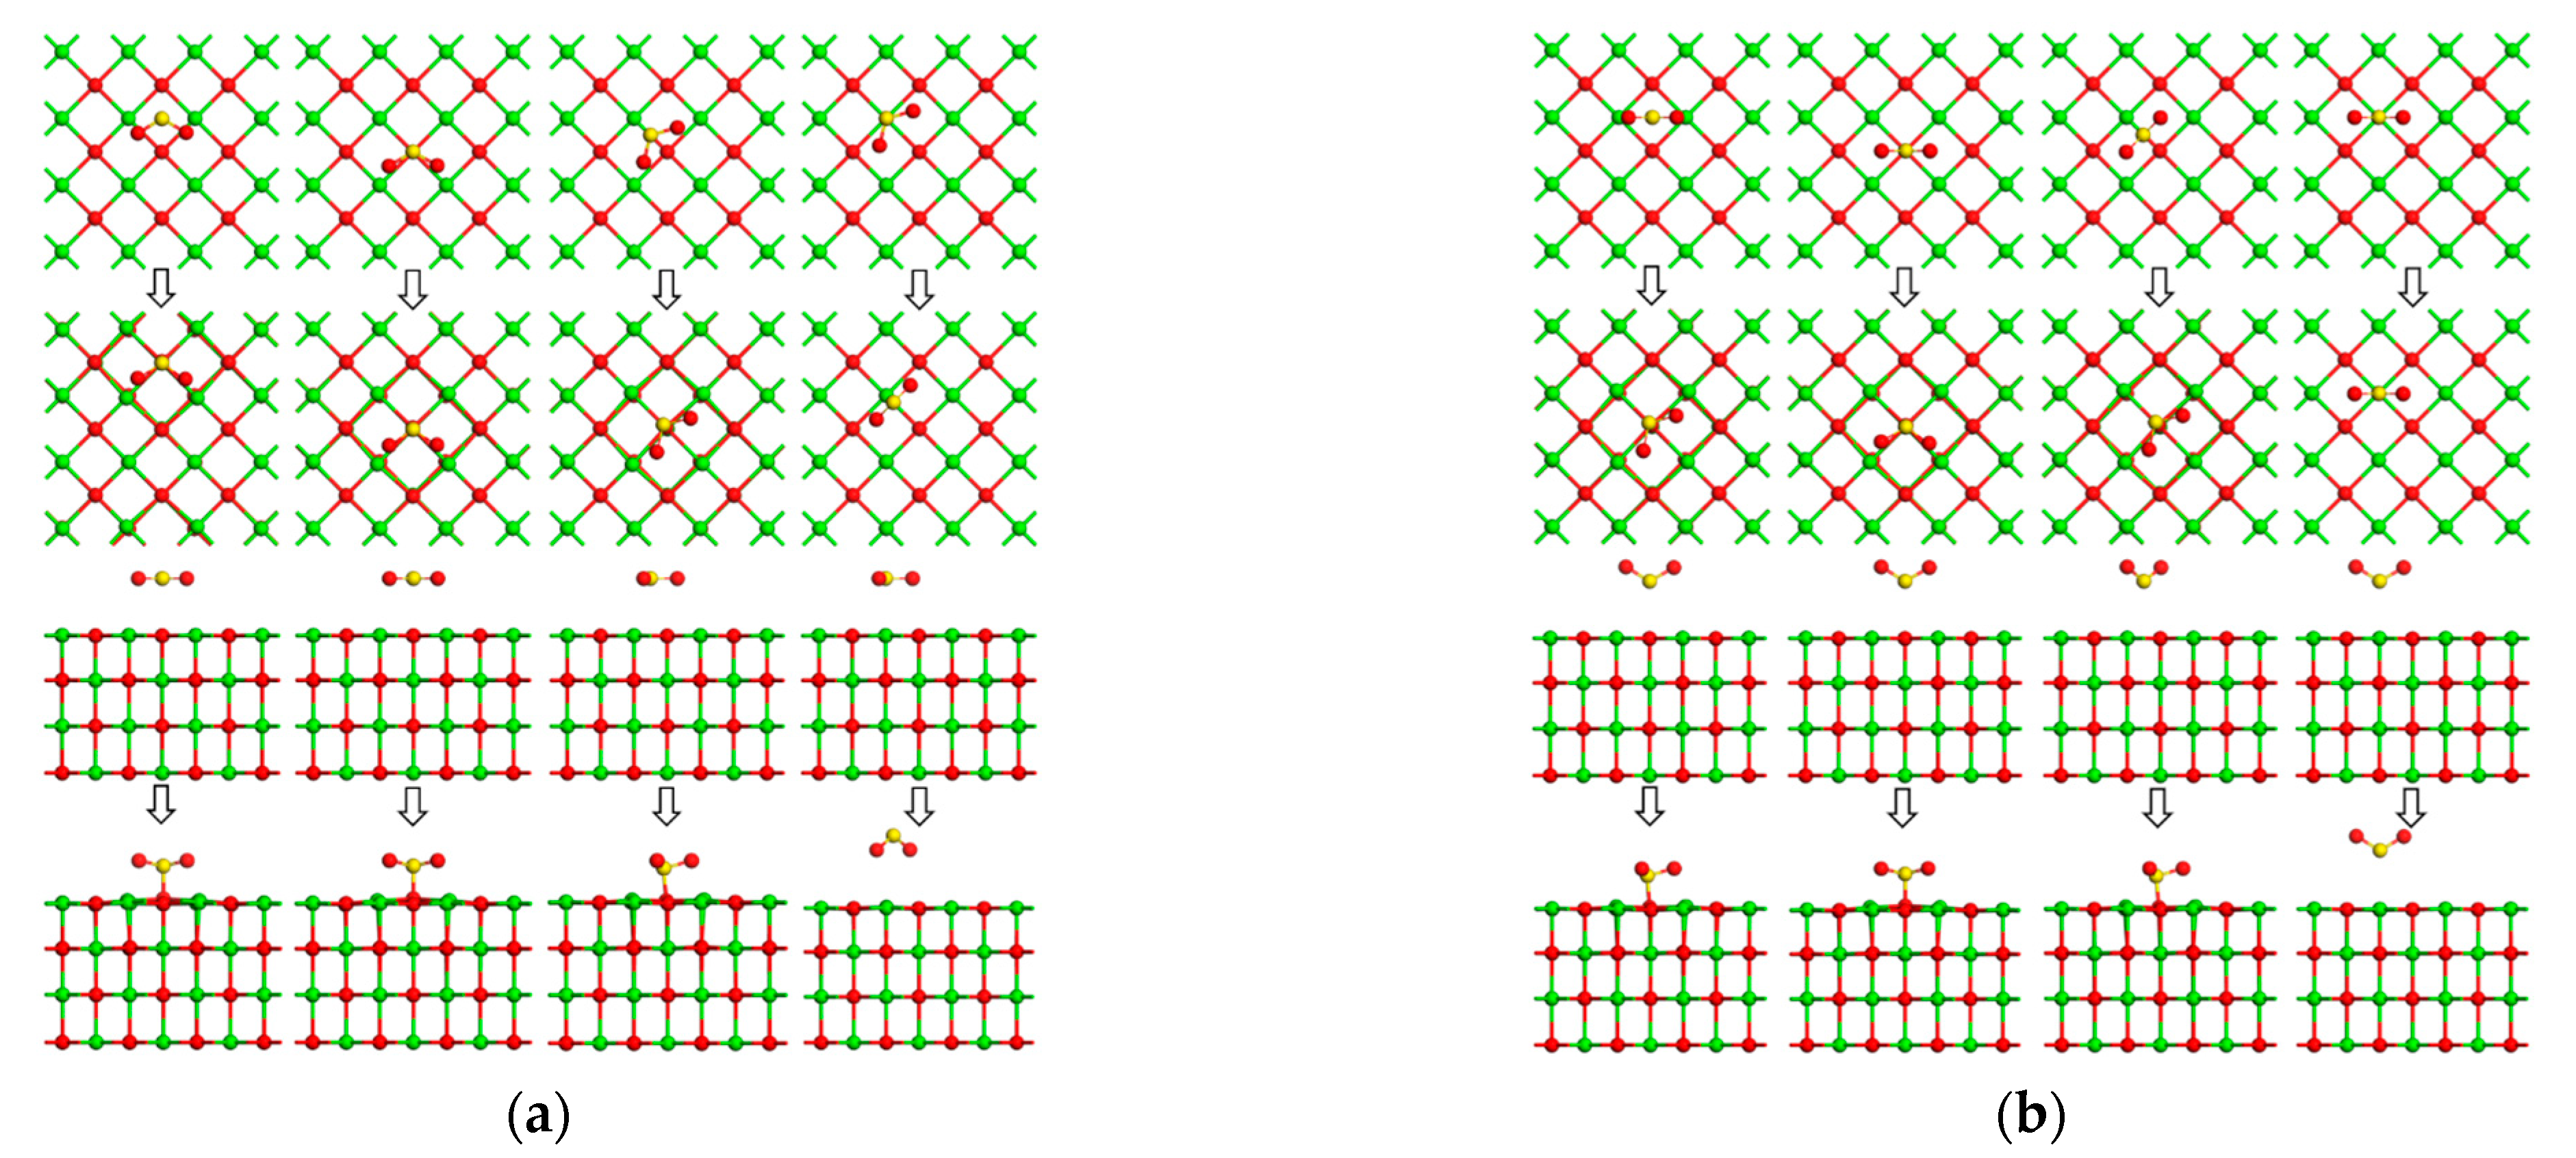
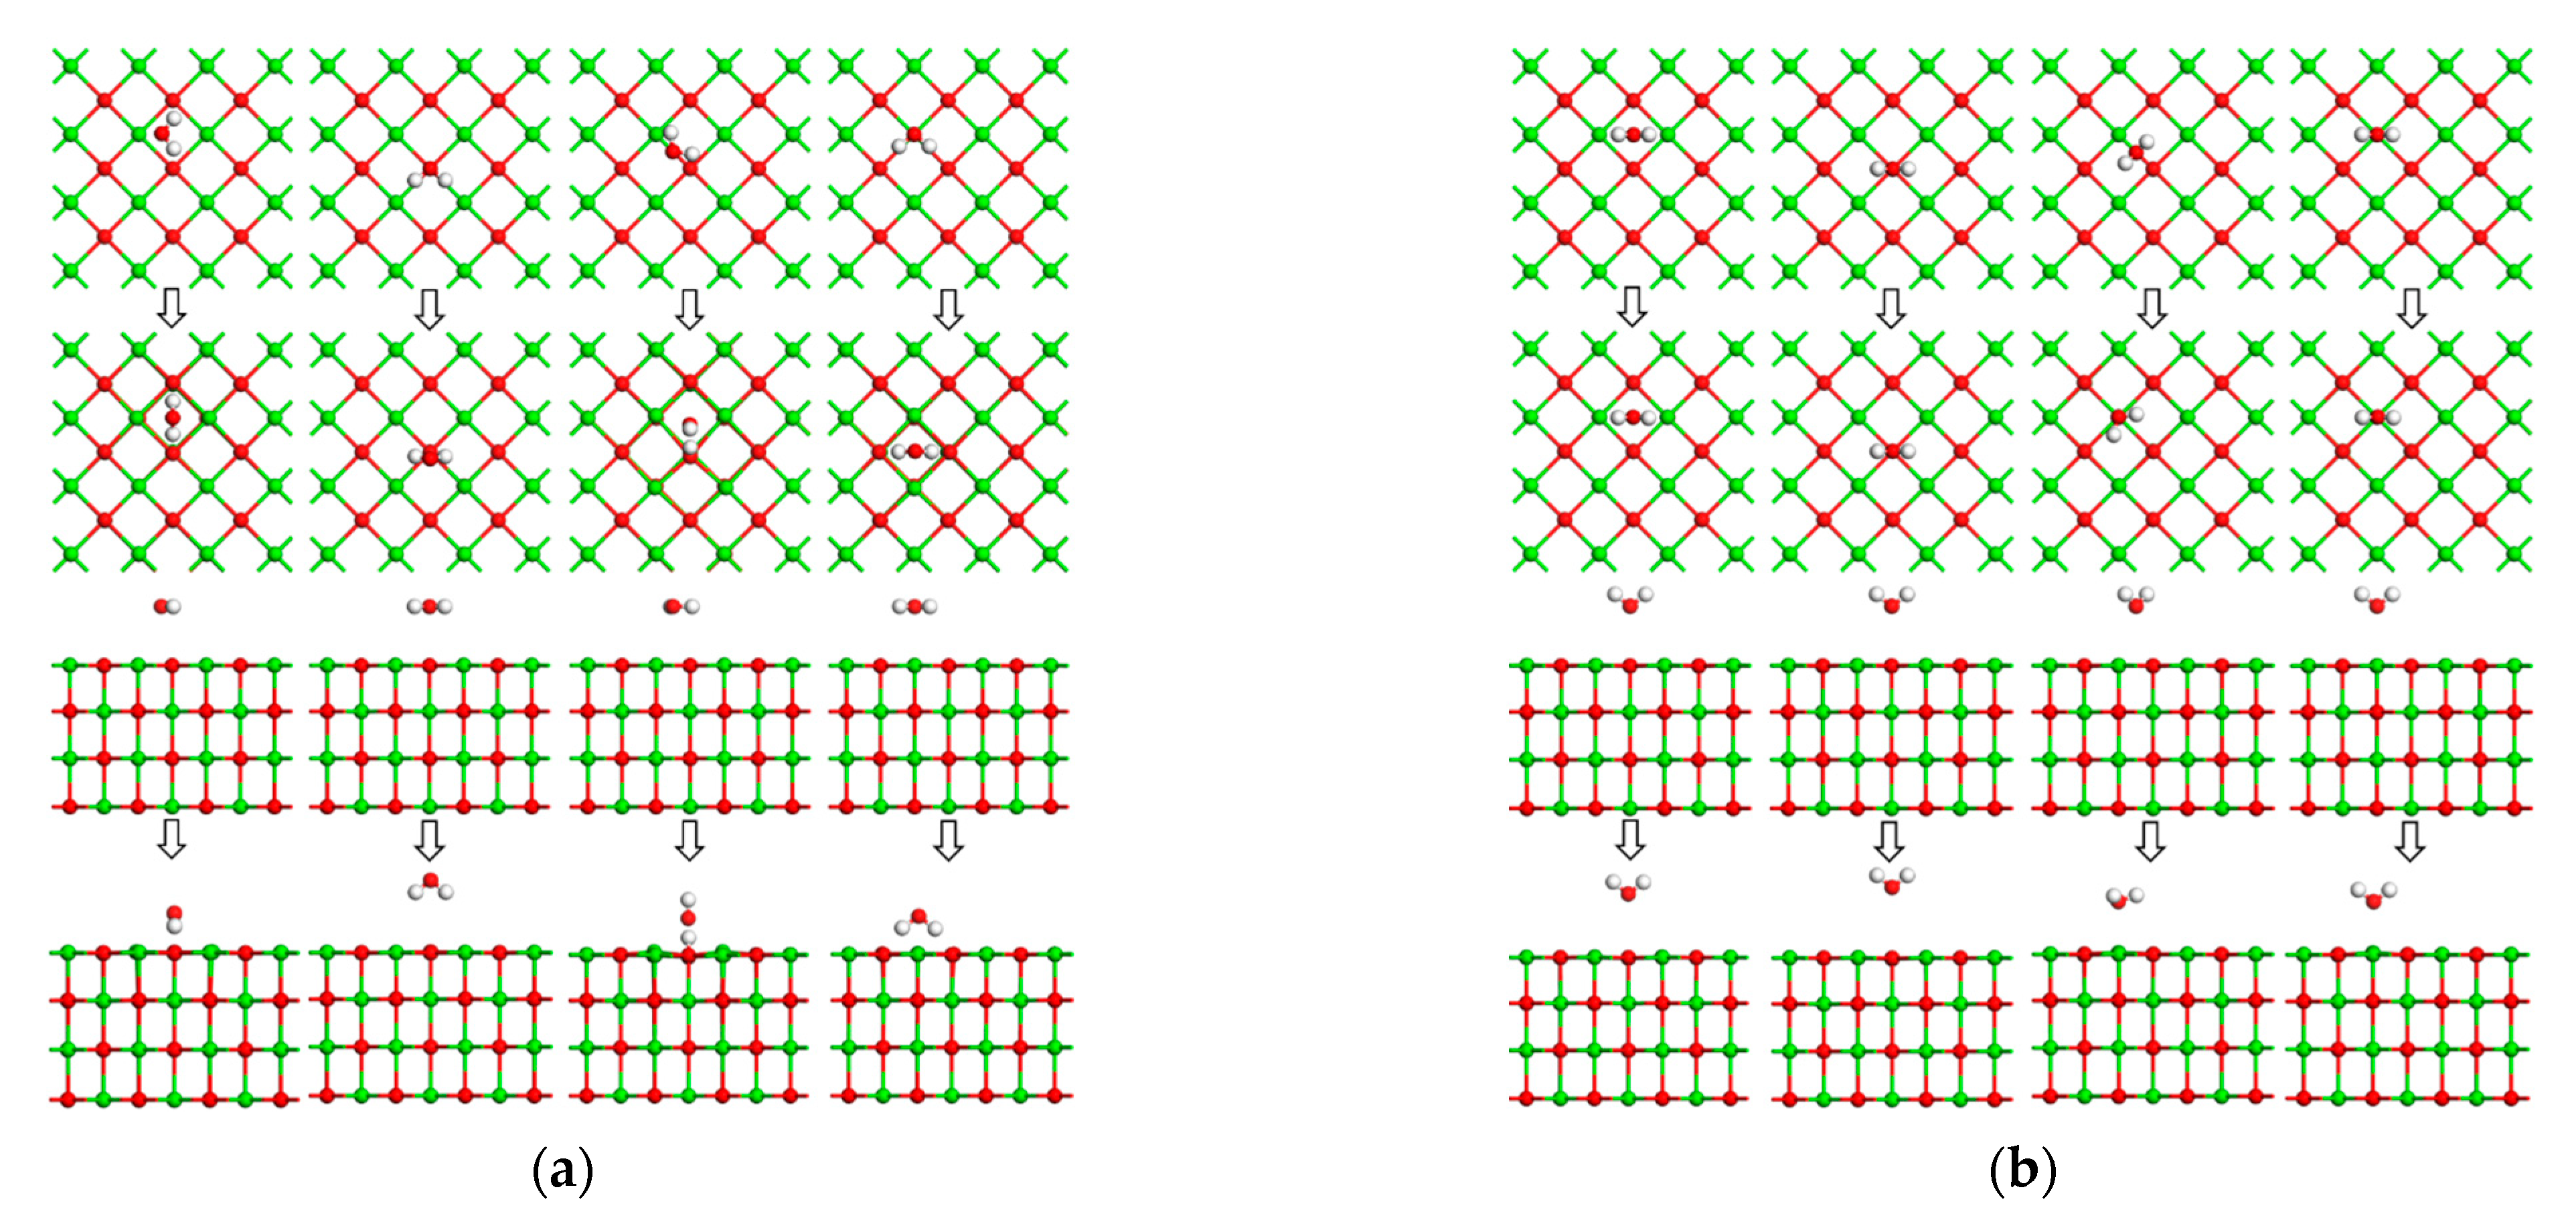
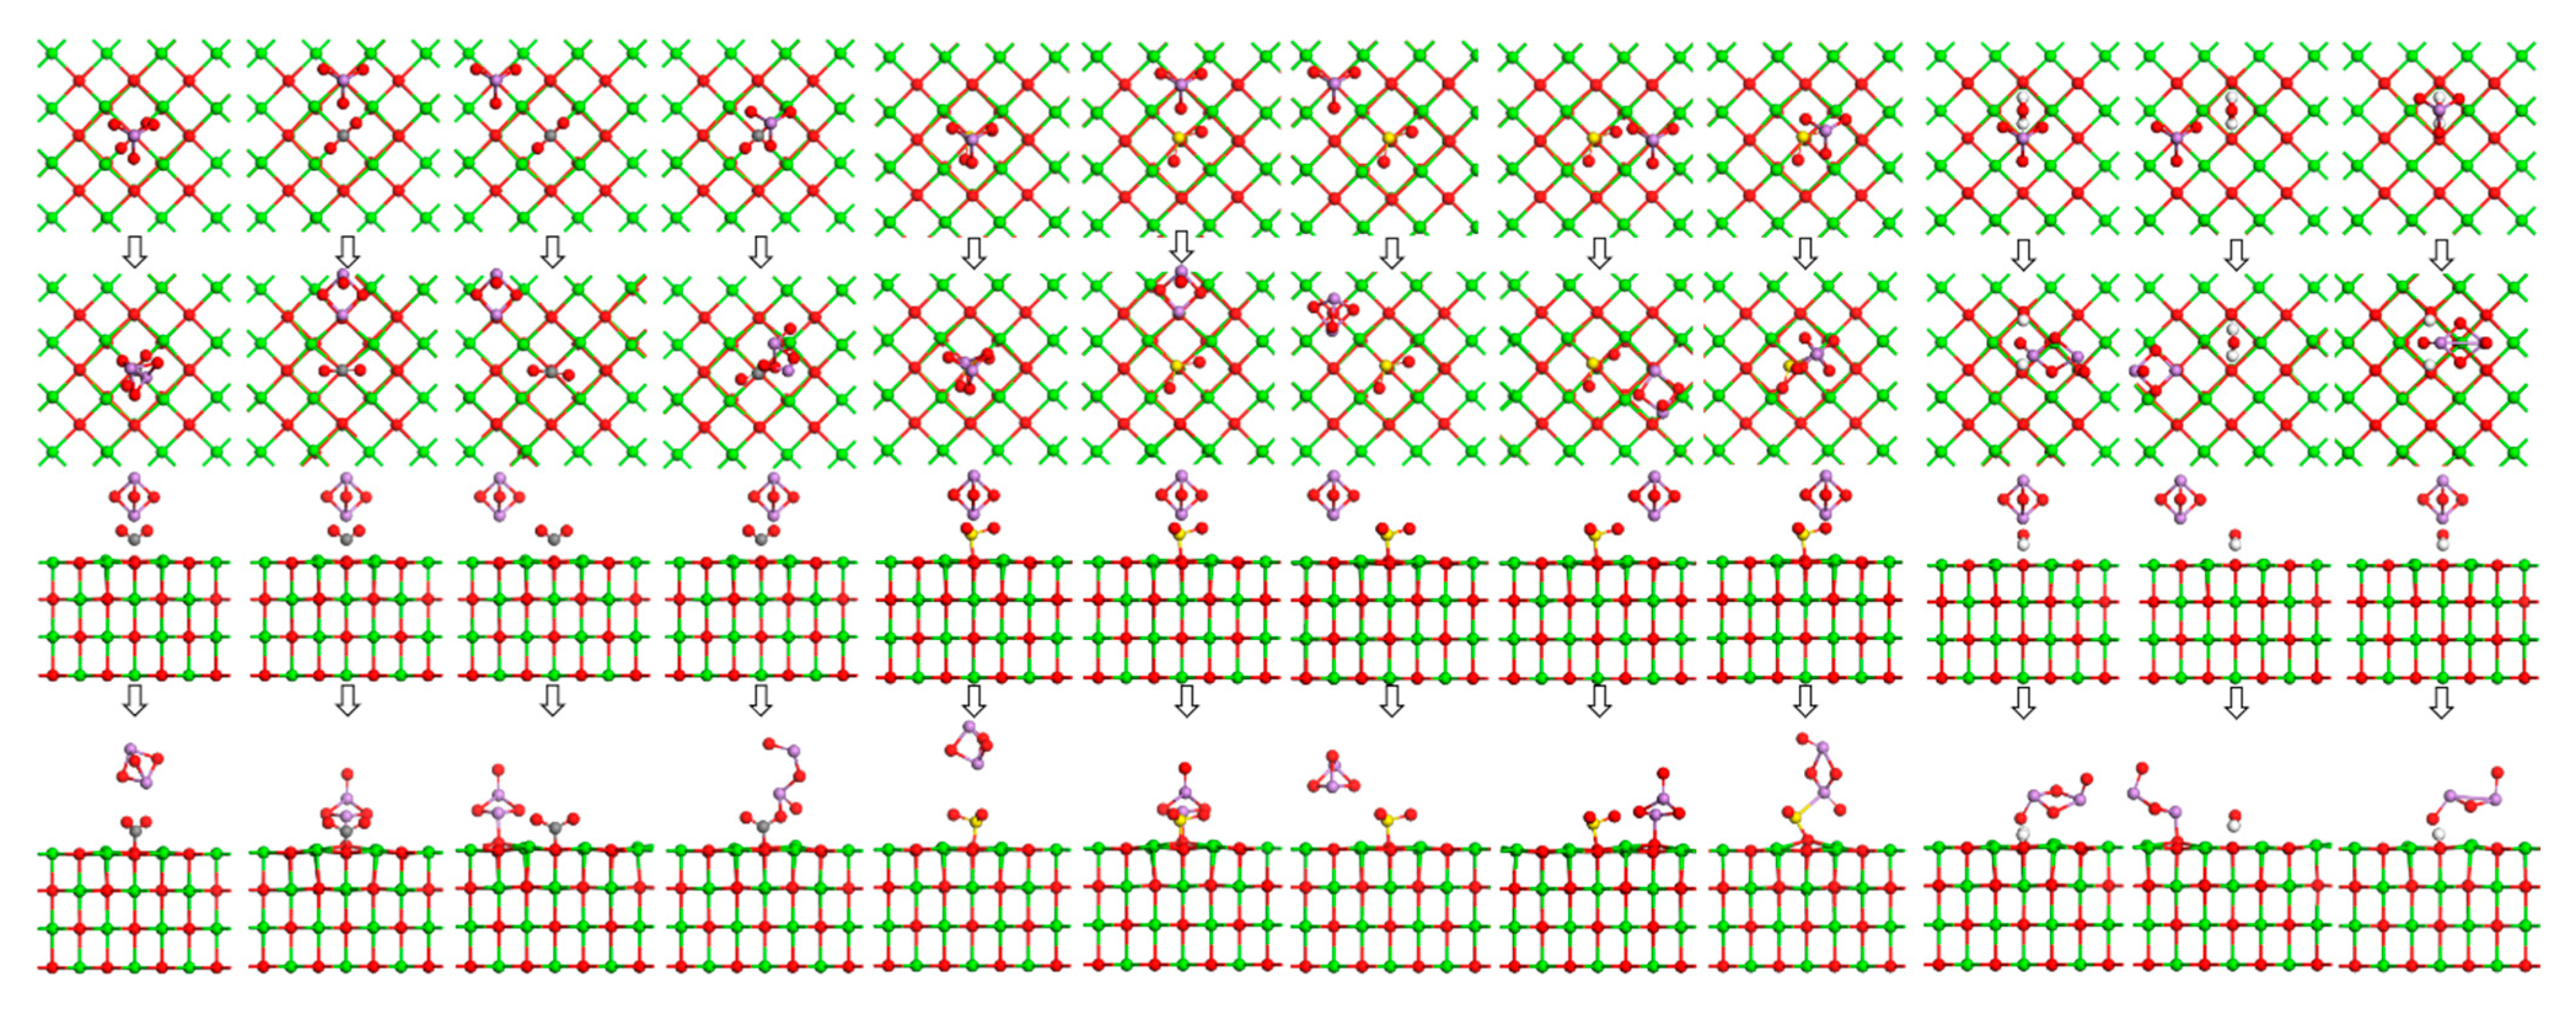
- DFT calculations showed that the CaO(001) surface O top site was the active site for the adsorption of As2O3, CO2, SO2, and H2O molecules. The adsorption energy of As2O3 molecules at the OC1 top site (−209.972 kJ/mol) was higher than at the Osurf top site (−202.774 kJ/mol). CO2 favored the stable adsorption of As2O3 molecules at the OC1 top site to the detriment of their adsorption at the top sites of OC0, OC2, and OC3. The adsorption energies of As2O3 molecules at potential active sites on SO2+CaO(001) surface were all lower than those on clean CaO(001) surface, and SO2 was unfavorable for the adsorption of As2O3 molecules at the top sites of OS0~OS4. For the OH0 and OH2 top sites, the H-OH bonds in the H2O molecule were broken, and the resulting OH atoms underwent more intense orbital hybridization with the As atoms in the As2O3 molecule. The adsorption energies (−241.446 kJ/mol and −236.457 kJ/mol) of the stabilized structure after adsorption were higher than those of the Osurf top site, which greatly facilitated the stabilized adsorption of the As2O3 molecule, whereas the OH1 top site was not conducive to the stabilized adsorption of the As2O3 molecule. In addition, in the theoretical calculation section only considered As2O3 (g), a major form of As present in combustion flue gas. In the actual combustion process, there were also singlet, chlorinated states, etc., which needed to be further investigated in the follow-up work.
- (4)
- Migration was a complex physicochemical reaction during the actual combustion of sludge. When exploring the migration law, not only shall we analyze the influence of physical properties such as pore structure and changes in chemical forms such as compounds on the migration of As from a macroscopic point of view by means of experimental characterization, but we shall also explain the changes in the electronic structure of atoms and molecules as well as the changes in the adsorption energy from a microchemical point of view by means of theoretical calculations. Probing the migration pattern of As was instructive for the efficient removal of heavy metals from sludge and the realization of stable and clean combustion of sludge.
Author Contributions
Funding
Data Availability Statement
Conflicts of Interest
Appendix A


| Adsorption Structures | Eads (kJ/mol) | As-Osurf Key Length (Å) | As-Osurf Population | q(As2O3) (e) | |
|---|---|---|---|---|---|
| As-terminus | 1-a | −202.533 | 1.836 | 0.32 | −0.39 |
| 2-a | −202.774 | 1.836 | 0.32 | −0.38 | |
| 3-a | 6.946 | - | - | −0.10 | |
| 4-a | 11.992 | - | - | −0.07 | |
| O-terminus | 1-b | −202.273 | 1.836 | 0.32 | −0.38 |
| 2-b | 21.120 | - | - | 0.01 | |
| 3-b | −202.755 | 1.836 | 0.32 | −0.32 | |
| 4-b | −6.909 | - | - | −0.01 | |
| As-O bond | 1-c | −31.735 | - | - | −0.17 |
| 2-c | −202.234 | 1.835 | 0.32 | −0.38 | |
| 3-c | −202.427 | 1.837 | 0.32 | −0.38 | |
| 4-c | −202.389 | 1.835 | 0.32 | −0.38 | |
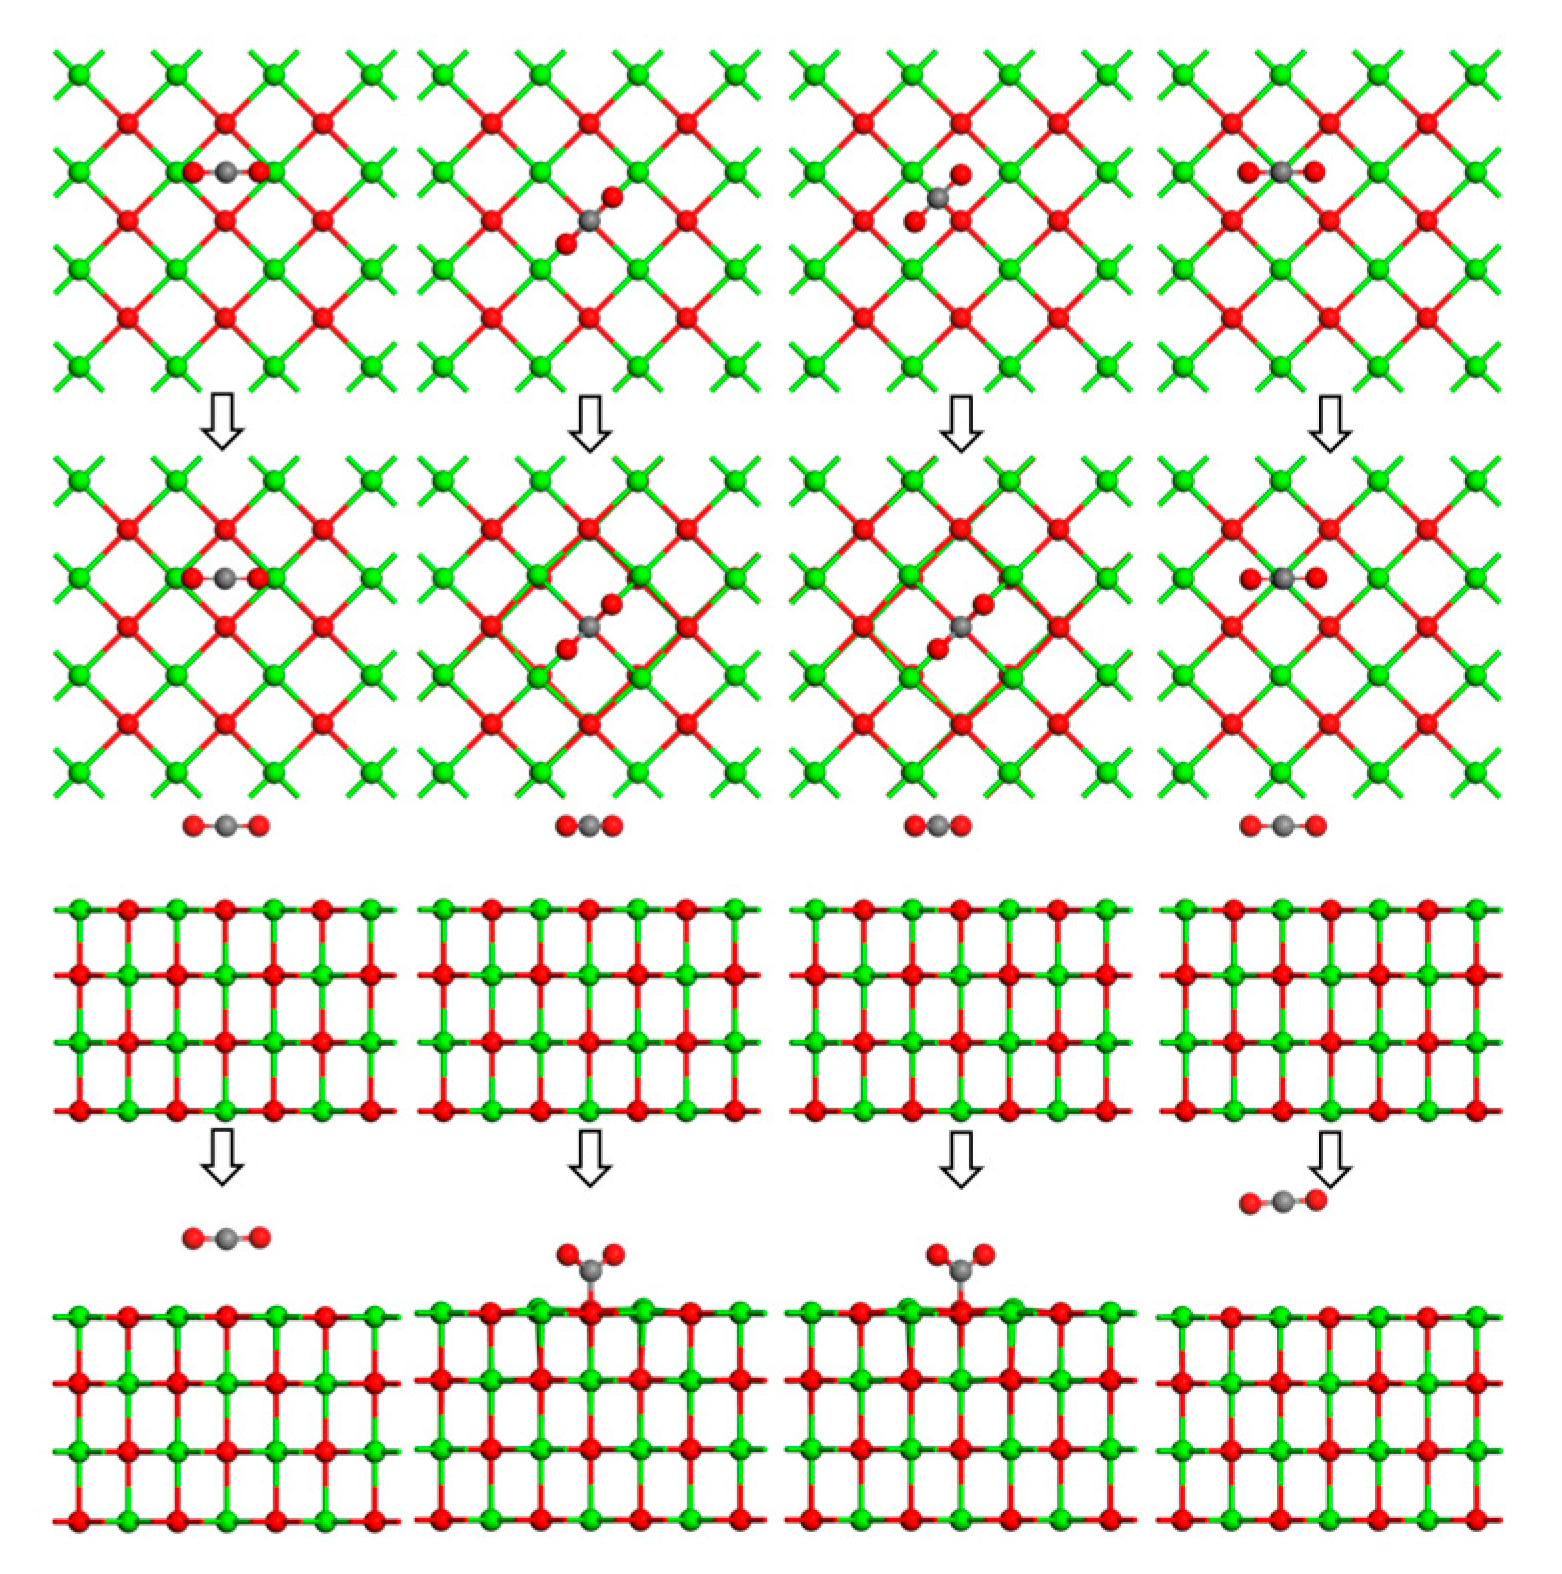
| Adsorption Structure | Eads (kJ/mol) | C-Osurf Bond Length (Å) | C-Osurf Population | q(CO2) (e) | |
|---|---|---|---|---|---|
| C-terminus parallel | 1-a | −0.341 | - | - | −0.05 |
| 2-a | −123.321 | 1.393 | 0.63 | −0.64 | |
| 3-a | −123.379 | 1.392 | 0.63 | −0.64 | |
| 4-a | 16.863 | - | - | −0.01 | |
| Adsorption Structure | Eads (kJ/mol) | S-Osurf Bond Length (Å) | S-Osurf Population | q(SO2) (e) | |
|---|---|---|---|---|---|
| S-terminus parallel | 1-a | −169.444 | 1.699 | 0.21 | −0.31 |
| 2-a | −169.415 | 1.700 | 0.21 | −0.31 | |
| 3-a | −177.037 | 1.672 | 0.22 | −0.30 | |
| 4-a | 8.205 | - | - | −0.15 | |
| S-terminus vertical | 1-b | −177.056 | 1.671 | 0.22 | −0.30 |
| 2-b | −169.502 | 1.698 | 0.21 | −0.31 | |
| 3-b | −176.661 | 1.672 | 0.23 | −0.3 | |
| 4-b | 8.195 | - | - | −0.1 | |
| Adsorption Structure | Eads (kJ/mol) | H-Osurf Bond Length (Å) | H-Osurf Population | q(H2O) (e) | |
|---|---|---|---|---|---|
| O-terminus parallel | 1-a | −58.875 | - | - | −0.25 |
| 2-a | 11.772 | - | - | −0.03 | |
| 3-a | −77.699 | 1.036 | 0.48 | −0.26 | |
| 4-a | −58.537 | - | - | −0.25 | |
| O-terminus vertical | 1-b | 18.005 | - | - | 0.01 |
| 2-b | 19.182 | - | - | 0 | |
| 3-b | −8.606 | - | - | 0.03 | |
| 4-b | −4.766 | - | - | 0.03 | |
References
- Stasta, P.; Boran, J.; Bebar, L.; Stehlik, P.; Oral, J. Thermal processing of sewage sludge. Appl. Therm. Eng. 2006, 26, 1420–1426. [Google Scholar] [CrossRef]
- Jang, H.N.; Kim, J.H.; Back, S.K.; Sung, J.H.; Yoo, H.M.; Choi, H.S.; Seo, Y.C. Combustion characteristics of waste sludge at air and oxy-fuel combustion conditions in a circulating fluidized bed reactor. Fuel 2016, 170, 92–99. [Google Scholar] [CrossRef]
- Xie, R.K.; Seip, H.M.; Wibetoe, G.; Nori, S.; McLeod, C.W. Heavy coal combustion as the dominant source of particulate pollution in Taiyuan, China, corroborated by high concentrations of arsenic and selenium in PM10. Sci. Total Environ. 2006, 370, 409–415. [Google Scholar] [CrossRef] [PubMed]
- Zhou, C.C.; Liu, G.J.; Yan, Z.C.; Fang, T.; Wang, R.W. Transformation behavior of mineral composition and trace elements during coal gangue combustion. Fuel 2012, 97, 644–650. [Google Scholar] [CrossRef]
- Tang, Q.; Liu, G.J.; Yan, Z.C.; Sun, R.Y. Distribution and fate of environmentally sensitive elements (arsenic, mercury, stibium and selenium) in coal-fired power plants at Huainan, Anhui, China. Fuel 2012, 95, 334–339. [Google Scholar] [CrossRef]
- Nriagu, J.O.; Pacyna, J.M. Quantitative assessment of worldwide contamination of air, water and soils by trace metals. Nature 1988, 333, 134–139. [Google Scholar] [CrossRef] [PubMed]
- Winter, R.M.; Mallepalli, R.R.; Hellem, K.P.; Szydlo, S.W. Determination of As, Cd, Cr, and Pb species formed in a combustion environment. Combust. Sci. Technol. 1994, 101, 45–58. [Google Scholar] [CrossRef]
- Contreras, M.L.; Arostegui, J.M.; Armesto, L. Arsenic interactions during co-combustion processes based on thermodynamic equilibrium calculations. Fuel 2009, 88, 539–546. [Google Scholar] [CrossRef]
- Liu, X.S.; Gao, Z.Y.; Wang, C.; Zhao, M.L.; Ding, X.L.; Yang, W.J.; Ding, Z. Hg0 oxidation and SO3, Pb0, PbO, PbCl2 and As2O3 adsorption by graphene-based bimetallic catalyst ((Fe,Co)@N-GN): A DFT study. Appl. Surf. Sci. 2019, 496, 143686. [Google Scholar] [CrossRef]
- Hong, J.D.; Zhao, Y.F.; Wu, J.; Xie, X.L.; Zhao, P.C.; Li, S.; Yao, H.; Luo, G.Q.; Liu, Z.H.; Yang, X. Fabrication of Al2O3/CaO with anti-sintering for efficient removal of As2O3 in simulated flue gas: Experimental and DFT study. Fuel 2022, 307, 121812. [Google Scholar] [CrossRef]
- Yao, H.; Naruse, I. Using sorbents to control heavy metals and particulate matter emission during solid fuel combustion. Particuology 2009, 7, 477–482. [Google Scholar] [CrossRef]
- Jadhav, R.A.; Fan, L.S. Capture of gas-phase arsenic oxide by lime: Kinetic and mechanistic studies. Environ. Sci. Technol. 2001, 35, 794–799. [Google Scholar] [CrossRef]
- Yu, S.H.; Zhang, C.; Ma, L.; Fang, Q.Y.; Chen, G. Insight into As2O3 adsorption characteristics by mineral oxide sorbents: Experimental and DFT study. Chem. Eng. J. 2021, 420, 127593. [Google Scholar] [CrossRef]
- Wang, J.W.; Zhang, Y.S.; Liu, Z.; Norris, P.; Romero, C.E.; Xu, H.; Pan, W.P. Effect of coordinated air pollution control devices in coal-fired power plants on arsenic emissions. Energy Fuels 2017, 31, 7309–7316. [Google Scholar] [CrossRef]
- Yang, Y.H.; Hu, H.Y.; Xie, K.; Huang, Y.D.; Liu, H.; Li, X.; Yao, H.; Naruse, I. Insight of arsenic transformation behavior during high-arsenic coal combustion. Proc. Combust. Inst. 2019, 37, 4443–4450. [Google Scholar] [CrossRef]
- Zhang, Y.; Wang, C.B.; Li, W.H.; Liu, H.; Zhang, Y.; Hack, P.; Pan, W.P. Removal of gas-phase As2O3 by metal oxide adsorbents: Effects of experimental conditions and evaluation of adsorption mechanism. Energy Fuels 2015, 29, 6578–6585. [Google Scholar] [CrossRef]
- Mahuli, S.; Agnihotri, R.; Chauk, S.; Ghosh-Dastidar, A.; Fan, L.S. Mechanism of arsenic sorption by hydrated lime. Environ. Sci. Technol. 1997, 31, 3226–3231. [Google Scholar] [CrossRef]
- Batroňová, L. Effect of CaO, Al2O3 and Fe2O3 in coal ash on the retention of acid- forming elements during coal combustion. WSEAS Trans. Power Syst. 2014, 9, 486–494. [Google Scholar]
- Chen, D.K.; Hu, H.Y.; Xu, Z.; Liu, H.; Cao, J.X.; Shen, J.H.; Yao, H. Findings of proper temperatures for arsenic capture by CaO in the simulated flue gas with and without SO2. Chem. Eng. J. 2015, 267, 201–206. [Google Scholar] [CrossRef]
- Han, H.D.; Hu, S.; Lu, C.F.; Wang, Y.; Jiang, L.; Xiang, J.; Su, S. Inhibitory effects of CaO/Fe2O3 on arsenic emission during sewage sludge pyrolysis. Bioresour. Technol. 2016, 218, 134–139. [Google Scholar] [CrossRef]
- Li, X.Y.; Chen, J.; Zhao, R.H.; Xiong, Z.P.; Lu, C.M. Determination on the activity of formed CaSO4 for arsenic adsorption during arsenic capture by CaO with the presence of SO2: Experimental and density functional theory study. Chem. Eng. J. 2022, 427, 132015. [Google Scholar] [CrossRef]
- Jiao, F.C.; Cheng, Y.; Zhang, L.; Yamada, N.; Sato, A.; Ninomiya, Y. Effects of HCl, SO2 and H2O in flue gas on the condensation behavior of Pb and Cd vapors in the cooling section of municipal solid waste incineration. Proc. Combust. Inst. 2011, 33, 2787–2793. [Google Scholar] [CrossRef]
- Miller, B.; Dugwell, D.R.; Kandiyoti, R. The influence of injected HCl and SO2 on the behavior of trace elements during wood-bark combustion. Energy Fuels 2003, 17, 1382–1391. [Google Scholar] [CrossRef]
- Zou, C.; Wang, C.B.; Chen, J.; Zhang, Y.; Xing, J.Y.; Anthony, E.J. The effect of H2O on formation mechanism of arsenic oxide during arsenopyrite oxidation: Experimental and theoretical analysis. Chem. Eng. J. 2020, 392, 123648. [Google Scholar] [CrossRef]
- Zhao, S.L.; Xie, X.Y.; Liao, Y.R.; Wang, Y.C.; Sun, Z.Q. Removal of As2O3 in coal-fired flue gas by metal oxides: Effects of adsorption temperature and flue gas components. J. Clean. Prod. 2022, 376, 134239. [Google Scholar] [CrossRef]
- Yu, S.H.; Zhang, C.; Ma, L.; Tan, P.; Fang, Q.; Chen, G. Deep insight into the effect of NaCl/HCl/SO2/CO2 in simulated flue gas on gas-phase arsenic adsorption over mineral oxide sorbents. J. Hazard. Mater. 2021, 403, 123617. [Google Scholar] [CrossRef] [PubMed]
- Zhou, S.Q.; Zhao, Q.L.; Yu, T.; Yao, X.Z. Co-pyrolysis of Sewage Sludge with Paint Sludge: Kinetics and Thermodynamic Analysis via Iso-conversional Methods. J. Wuhan Univ. Technol. Mater. 2024, 39, 716–727. [Google Scholar]
- Dai, X.H. Atoms, molecules, solids, and surfaces: Current Situation and Thoughts on Treatment and Disposal of Sludge in China’s Cities and Towns. Water Wastewater Eng. 2012, 38, 1–5. [Google Scholar] [CrossRef]
- Segall, M.D.; Lindan, P.J.D.; Probert, M.J.; Pickard, C.J.; Hasnip, P.J.; Clark, S.J.; Payne, M.C. First-principles simulation: Ideas, illustrations and the CASTEP code. J. Phys. Condens. Matter 2002, 14, 2717–2744. [Google Scholar] [CrossRef]
- Perdew, J.P.; Burke, K.; Ernzerhof, M. Generalized Gradient Approximation Made Simple. Phys. Rev. Lett. 1996, 77, 3865–3868. [Google Scholar] [CrossRef]
- Perdew, J.P.; Chevary, J.A.; Vosko, S.H.; Jackson, K.A.; Pederson, M.R.; Singh, D.J.; Fiolhais, C. Atoms, molecules, solids, and surfaces: Applications of the generalized gradient approximation for exchange and correlation. Phys. Rev. B 1992, 46, 6671–6687. [Google Scholar] [CrossRef] [PubMed]
- Kim, S.; Thiessen, P.A.; Bolton, E.E.; Chen, J.; Fu, G.; Gindulyte, A.; Han, L.Y.; He, J.; He, S.; Shoemaker, B.A.; et al. PubChem Substance and Compound databases. Nucleic Acids Res. 2016, 44, D1202–D1213. [Google Scholar] [CrossRef] [PubMed]
- Fan, Y.M.; Zhuo, Y.Q.; Lou, Y.; Zhu, Z.W.; Li, L.L. SeO2 adsorption on CaO surface: DFT study on the adsorption of a single SeO2 molecule. Appl. Surf. Sci. 2017, 413, 366–371. [Google Scholar] [CrossRef]
- Fan, Y.M.; Zhuo, Y.Q.; Li, L.L. SeO2 adsorption on CaO surface: DFT and experimental study on the adsorption of multiple SeO2 molecules. Appl. Surf. Sci. 2017, 420, 465–471. [Google Scholar] [CrossRef]
- Wang, K.S.; Chiang, K.Y.; Lin, S.M.; Tsai, C.C.; Sun, C.J. Effects of chlorides on emissions of toxic compounds in waste incineration: Study on partitioning characteristics of heavy metal. Chemosphere 1999, 38, 1833–1849. [Google Scholar] [CrossRef] [PubMed]
- Liu, J.Y.; Xie, C.; Xie, W.M.; Zhang, X.C.; Chang, K.L.; Sun, J.; Kuo, J.H.; Xie, W.H.; Liu, C.; Sun, S.Y.; et al. Arsenic partitioning behavior during sludge co-combustion: Thermodynamic equilibrium simulation. Waste Biomass Valorization 2019, 10, 2297–2307. [Google Scholar] [CrossRef]
- Lei, K.; Zhang, R.; Ye, B.Q.; Cao, J.; Liu, D. Study of sewage sludge/coal co-combustion by thermogravimetric analysis and single particle co-combustion method. Energy Fuels 2018, 32, 6300–6308. [Google Scholar] [CrossRef]
- Quann, R.J.; Sarofim, A.F. Vaporization of refractory oxides during pulverized coal combustion. Symp. Int. Combust. 1982, 19, 1429–1440. [Google Scholar] [CrossRef]
- Lei, K.; Ye, B.Q.; Cao, J.; Zhang, R.; Liu, D. Combustion characteristics of single particles from bituminous coal and pine sawdust in O2/N2, O2/CO2, and O2/H2O atmospheres. Energies 2017, 10, 1695. [Google Scholar] [CrossRef]
- Solano, A.L.; Gullon, I.M.; Martínez de Lecea, C.S.; Talavera, B.S. Activated carbons from bituminous coal: Effect of mineral matter content. Fuel 2000, 79, 635–643. [Google Scholar] [CrossRef]
- Tseng, R.L. Physical and chemical properties and adsorption type of activated carbon prepared from plum kernels by NaOH activation. J. Hazard. Mater. 2007, 147, 1020–1027. [Google Scholar] [CrossRef]
- Yue, W.F.; Song, W.L.; Fan, C.G.; Li, S.G. Kinetics of CaCO3 decomposition at low CO2 partial pressure in a vacuum fixed bed. Chem. Eng. Sci. 2023, 273, 118646. [Google Scholar] [CrossRef]
- Maes, I.I.; Gryglewicz, G.; Yperman, J.; Franco, D.V.; Mullens, J.; Van Poucke, L.C. Effect of calcium and calcium minerals in coal on its thermal analysis. Fuel 1997, 76, 143–147. [Google Scholar] [CrossRef]
- Zhang, W.Q.; He, Y.H.; Xing, X.X.; Wang, Y.F.; Li, Q.Y.; Wang, L.; Zhu, Y.Z. In-depth insight into the effects of intrinsic calcium compounds on the pyrolysis of hazardous petrochemical sludge. J. Hazard. Mater. 2023, 455, 131593. [Google Scholar] [CrossRef] [PubMed]
- Liu, J.Y.; Zeng, J.J.; Sun, S.Y.; Huang, S.S.; Kuo, J.H.; Chen, N.W. Combined effects of FeCl3 and CaO conditioning on SO2, HCl and heavy metals emissions during the DDSS incineration. Chem. Eng. J. 2016, 299, 449–458. [Google Scholar] [CrossRef]
- Wang, C.B.; Zhang, Y.; Jia, L.F.; Tan, Y.W. Effect of water vapor on the pore structure and sulfation of CaO. Fuel 2014, 130, 60–65. [Google Scholar] [CrossRef]
- Cao, Y.; Song, B.; Song, M.; Meng, F.Y.; Wei, Y.X.; Cao, Q. Capture of arsenic in coal combustion flue gas at high temperature in the presence of CaSiO3 with good anti-sintering. Fuel Process. Technol. 2020, 205, 106428. [Google Scholar] [CrossRef]
- Morgenstern, L.; Talebi, E.; Kerscher, F.; Spliethoff, H. Experimental investigation of CaO/Ca(OH)2 for thermochemical energy storage–commissioning of a 0.5 kWh experimental setup. Fuel 2023, 345, 128220. [Google Scholar] [CrossRef]
- Wang, Y.L.; Zhu, S.H.; Gao, M.Q.; Yang, Z.R.; Yan, L.J.; Bai, Y.H.; Li, F. A study of char gasification in H2O and CO2 mixtures: Role of inherent minerals in the coal. Fuel Process. Technol. 2016, 141, 9–15. [Google Scholar] [CrossRef]
- Korus, A.; Gutierrez, J.P.; Szlęk, A.; Jagiello, J.; Hornung, A. Pore development during CO2 and H2O activation associated with the catalytic role of inherent inorganics in sewage sludge char and its performance during the reforming of volatiles. Chem. Eng. J. 2022, 446, 137298. [Google Scholar] [CrossRef]


| Proximate Analysis (%) | Ultimate Analysis (%) | |||||||
|---|---|---|---|---|---|---|---|---|
| Mad | Aad | Vad | FCad | Cd | Hd | Od | Nd | Sd |
| 2.53 | 49.67 | 43.03 | 4.77 | 23.45 | 3.51 | 17.14 | 4.35 | 0.58 |
| Heavy Metals (mg/kg) | Minerals (%) | ||||
|---|---|---|---|---|---|
| As | SiO2 | CaO | Al2O3 | P2O5 | MgO |
| 15.025 | 32.732 | 16.992 | 17.14 | 7.680 | 7.639 |
| Combustion Conditions | Temperature (°C) | Combustion Atmosphere (vol.%) | Samples (2 g) |
|---|---|---|---|
| T1 | 700 °C | 20O2/80N2 | 100% Sludge |
| T2 | 800 °C | ||
| T3 | 900 °C | ||
| T4 | 1000 °C | ||
| TC1 | 700 °C | 96% Sludge + 4% CaO | |
| TC2 | 800 °C | ||
| TC3 | 900 °C | ||
| TC4 | 1000 °C | ||
| TCS1 | 700 °C | 96% Sludge + 4% CaSO4 | |
| TCS2 | 800 °C | ||
| TCS3 | 900 °C | ||
| TCS4 | 1000 °C | ||
| C1 | 900 °C | 10CO2/20O2/70N2 | 100% Sludge |
| C2 | 20CO2/20O2/60N2 | ||
| C3 | 30CO2/20O2/50N2 | ||
| C4 | 20CO2/20O2/60N2 | 96% Sludge + 4% CaO | |
| S1 | 0.1SO2/20O2/79.9N2 | 100% Sludge | |
| S2 | 0.15SO2/20O2/79.85N2 | ||
| S3 | 0.2SO2/20O2/79.8N2 | ||
| S4 | 0.15SO2/20O2/79.85N2 | 96% Sludge + 4% CaO | |
| H1 | 20O2/80N2 | 10% H2O + 90% Sludge | |
| H2 | 20% H2O + 80% Sludge | ||
| H3 | 30% H2O + 70% Sludge | ||
| H4 | 20% H2O + 76% Sludge + 4% CaO |
| Device | Make | Type | Measuring | Accuracy |
|---|---|---|---|---|
| ICP-MS | Agilent (Beijing, China) | Agilent 7800 | ppb~ppm | 1–5% |
| BET | Micromeritics (Beijing, China) | ASAP-2460 | 0.01 m2/g~1000 m2/g | 1–5% |
| XRD | Malvern Panalytical (Beijing, China) | Panalytical Empyrean | 5°~85° | 1–5% |
| SEM-EDS | ZEISS (Beijing, China) | ZEISS Sigma 300 | μm~nm | 1–5% |
| Model | Key Length/Key Angle | Optimize Value (Å/°) | Reference Value (Å/°) | Relative Error (%) |
|---|---|---|---|---|
| CaO | a = b = c | 4.91 | 4.81 | 2.16 |
| α = β = γ | 90.00 | 90.00 | 0.00 | |
| CO2 | C-O | 1.17 | 1.16 | 0.86 |
| O-C-O | 179.99 | 180.00 | 0.01 | |
| SO2 | S-O | 1.46 | 1.43 | 1.89 |
| O-S-O | 119.48 | 119.50 | 0.02 | |
| H2O | H-O | 0.98 | 0.96 | 1.88 |
| H-O-H | 103.74 | 104.50 | 0.73 | |
| As2O3 | As-O | 1.87 | 1.86 | 0.43 |
| As-O-As | 75.41 | 73.50 | 2.60 |
| Samples | Specific Surface Area (m2/g) | Pore Volume (×10−2 cm3/g) |
|---|---|---|
| Sludge | 8.03 | 2.05 |
| CaO | 7.13 | 1.33 |
| T3 | 4.82 | 0.84 |
| TC3 | 6.32 | 1.11 |
| C4 | 5.86 | 1.02 |
| S4 | 2.26 | 0.42 |
| H4 | 3.52 | 0.51 |
| Adsorption Structure | EadS (kJ·mol−1) | As-OX Bond Length (Å) | As-OX Population | q(As2O3) (e) | X-Osurf Key Length (Å) | X-Osurf Population | q(X) (e) |
|---|---|---|---|---|---|---|---|
| OC0 | −26.737 | - | - | −0.1 | 1.366 | 0.68 | −0.64 |
| OC1 | −209.972 | 1.857 | 0.31 | −0.33 | 1.370 | 0.67 | −0.65 |
| OC2 | −190.502 | 1.860 | 0.30 | −0.34 | 1.384 | 0.65 | −0.65 |
| OC3 | −51.997 | 2.074 | - | −0.18 | 1.333 | 0.75 | −0.58 |
| OS0 | −7.430 | - | - | −0.04 | 1.659 | 0.23 | −0.31 |
| OS1 | −192.094 | 1.873 | 0.3 | −0.37 | 1.672 | 0.22 | −0.27 |
| OS2 | −2.239 | - | - | −0.01 | 1.671 | 0.23 | −0.30 |
| OS3 | −177.109 | 1.877 | 0.3 | −0.36 | 1.675 | 0.22 | −0.24 |
| OS4 | 80.323 | - | - | 0.23 | 1.608 | 0.24 | −0.73 |
| OH0 | −241.446 | 1.788 | 0.34 | −0.40 | 1.005 | 0.37 | −0.26 |
| OH1 | −199.484 | 1.854 | 0.31 | −0.34 | - | - | −0.20 |
| OH2 | −236.457 | 1.768 | 0.35 | −0.39 | 1.003 | 0.54 | −0.24 |
Disclaimer/Publisher’s Note: The statements, opinions and data contained in all publications are solely those of the individual author(s) and contributor(s) and not of MDPI and/or the editor(s). MDPI and/or the editor(s) disclaim responsibility for any injury to people or property resulting from any ideas, methods, instructions or products referred to in the content. |
© 2024 by the authors. Licensee MDPI, Basel, Switzerland. This article is an open access article distributed under the terms and conditions of the Creative Commons Attribution (CC BY) license (https://creativecommons.org/licenses/by/4.0/).
Share and Cite
Shi, Y.; Zhang, H.; Yu, J.; Feng, Y.; Jin, Y. Experimental and DFT Studies of Influence of Flue Gas Components on the Interaction between CaO and As during Sludge Combustion. Energies 2024, 17, 2522. https://doi.org/10.3390/en17112522
Shi Y, Zhang H, Yu J, Feng Y, Jin Y. Experimental and DFT Studies of Influence of Flue Gas Components on the Interaction between CaO and As during Sludge Combustion. Energies. 2024; 17(11):2522. https://doi.org/10.3390/en17112522
Chicago/Turabian StyleShi, Yilin, Huan Zhang, Jingxiang Yu, Youxiang Feng, and Yan Jin. 2024. "Experimental and DFT Studies of Influence of Flue Gas Components on the Interaction between CaO and As during Sludge Combustion" Energies 17, no. 11: 2522. https://doi.org/10.3390/en17112522