Article

Frequency Regulation Adaptive Control Strategy of Wind Energy Storage System for Wind Speed Uncertainty

1
Key Laboratory of Smart City Energy Sensing and Edge Computing of Hunan Province, Hunan City University, Yiyang 413000, China
2
School of Mechanical Engineering, Hunan University of Science and Technology, Xiangtan 411201, China
*
Author to whom correspondence should be addressed.
Energies 2024, 17(11), 2523; https://doi.org/10.3390/en17112523
Submission received: 9 April 2024 / Revised: 18 May 2024 / Accepted: 20 May 2024 / Published: 23 May 2024

Abstract

:
In order to reduce the negative influence of wind speed randomness and prediction error on frequency modulation, the reliability of the wind storage system was assessed effectively. In the wind storage frequency modulation system, a state of charge (SOC) adaptive adjustment method for wind speed randomness is proposed. Firstly, through the correlation analysis between the standby capacity of frequency modulation and the output power of wind turbine, the uncertainty of its frequency modulation capacity is revealed. Secondly, in view of the uncertainty of wind turbine frequency modulation, the output power of energy storage frequency modulation is optimized with the goal of minimizing the frequency modulation power deviation of the wind storage front under the framework of model predictive control, and the improved whale optimization algorithm (WOA) is used to solve the problem. Finally, the simulation results show that, under the given 5 min continuous disturbance, the root mean square of frequency regulation of the proposed restoration method is reduced by 56.65% compared to the SOC recovery base point set to 0.5. Under continuous large perturbations, the maximum frequency deviation is reduced by 0.0455 Hz. This effectively shows that this method can not only improve the frequency modulation reliability of wind power system but also improve the continuous frequency modulation capability of energy storage system.

1. Introduction

In the end of 2019, the Global Wind Energy Association announced that the cumulative installed capacity of wind power reached 410,000 MW, accounting for 21% [1]. However, the large-scale grid connection of wind farms and other new energy sources with random and unpredictable output and no independent frequency modulation capability [2] brings great challenges to the stability of power grid frequency [3,4,5].
In recent years, in order to ensure the frequency stability of power grids including wind power systems, wind power is considered to have frequency modulation functions such as frequency modulation reserve capacity and inertial response. Many relevant guidelines or norms have been developed in European and North American countries for wind power to participate in frequency modulation of power systems [6,7]. China has also promulgated or revised a series of technical specifications or standards, which clearly specify the technical requirements for connecting wind farms and photovoltaic power stations to the grid. For example, the Technical Standards for Grid-connected Wind Power [8] and the Technical Regulations and Test Guidelines for Primary Frequency Modulation of Grid-connected Power Supply [9] (GB/T40595-2021), which were scheduled to be implemented on 1 May 2022, clearly require wind farms to have primary frequency modulation capability. In this context, the study of frequency modulation technology involving wind farms in power grids has developed rapidly, but refs. [10,11] point out that, even on the time scale of primary frequency modulation, the change in wind speed may cause frequency deterioration. Authors of [12,13] further show that wind speed randomness and prediction errors significantly affect the ability of wind turbines to reliably participate in frequency modulation. Therefore, it is urgent for high-quality frequency modulation resources such as energy storage to provide auxiliary frequency modulation means to meet the frequency modulation requirements of the system [14]. However, state of charge (SOC), as one of the key factors for the efficient utilization of energy storage [15,16], must consider its management in the frequency modulation process. Authors of [17] propose that, in the isolated island state, the frequency modulation reliability of air storage and SOC recovery base point are optimized by taking the minimum deviation of the frequency modulation power of air storage as the goal. The results show that the proposed method can effectively improve the frequency modulation reliability and the continuous frequency modulation capability of energy storage. In [18], a microgrid energy optimization scheduling strategy based on the SOC state of energy storage to improve the utilization rate of renewable energy is proposed.
To sum up, most of the existing studies on SOC self-recovery take 0.5 as the base point, and there is a lack of a method to determine the base point of SOC recovery that can meet the reliability requirements of wind power frequency modulation and adapt to changes in wind speed. In view of this, a frequency regulation adaptive control strategy of wind energy storage system for wind speed uncertainty is proposed in this paper. Its main contribution is that the energy storage adaptively follows the wind power output curve to optimize the frequency modulation power of wind storage in real time, which can improve the continuous frequency modulation capability of energy storage and reduce the number of charge and discharge times of energy storage while ensuring the reliability of frequency modulation.
The rest of the paper is structured as follows: Section 2 presents the wind power frequency modulation uncertainty model; Section 3 presents the adaptive adjustment strategy of energy storage SOC; Section 4 contains the model’s solving process. Section 5 comprises the simulation analysis, and Section 6 consists of the conclusion.

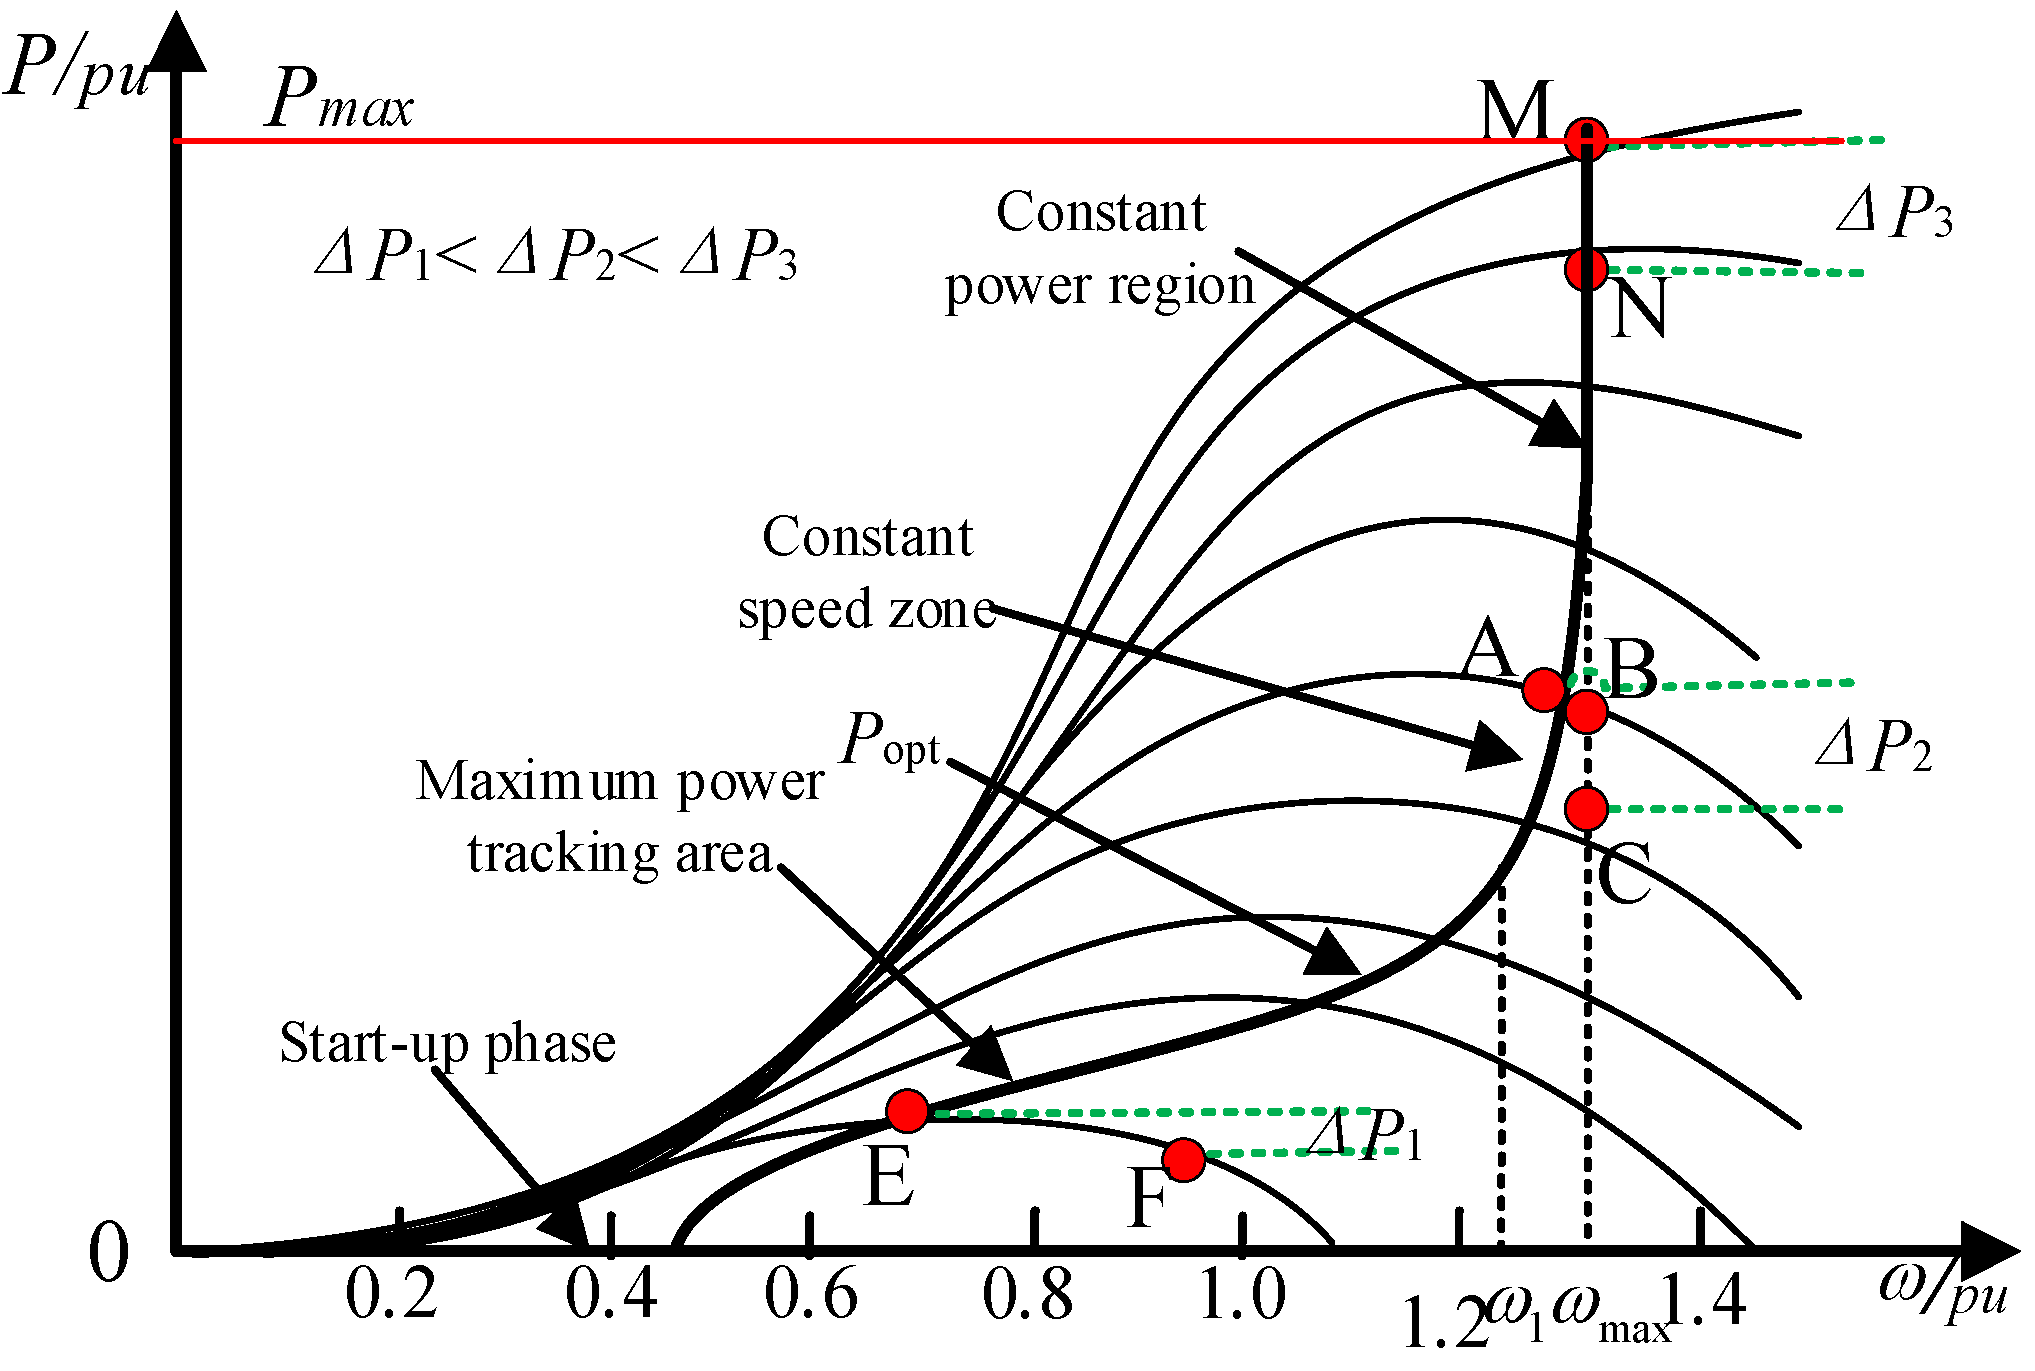
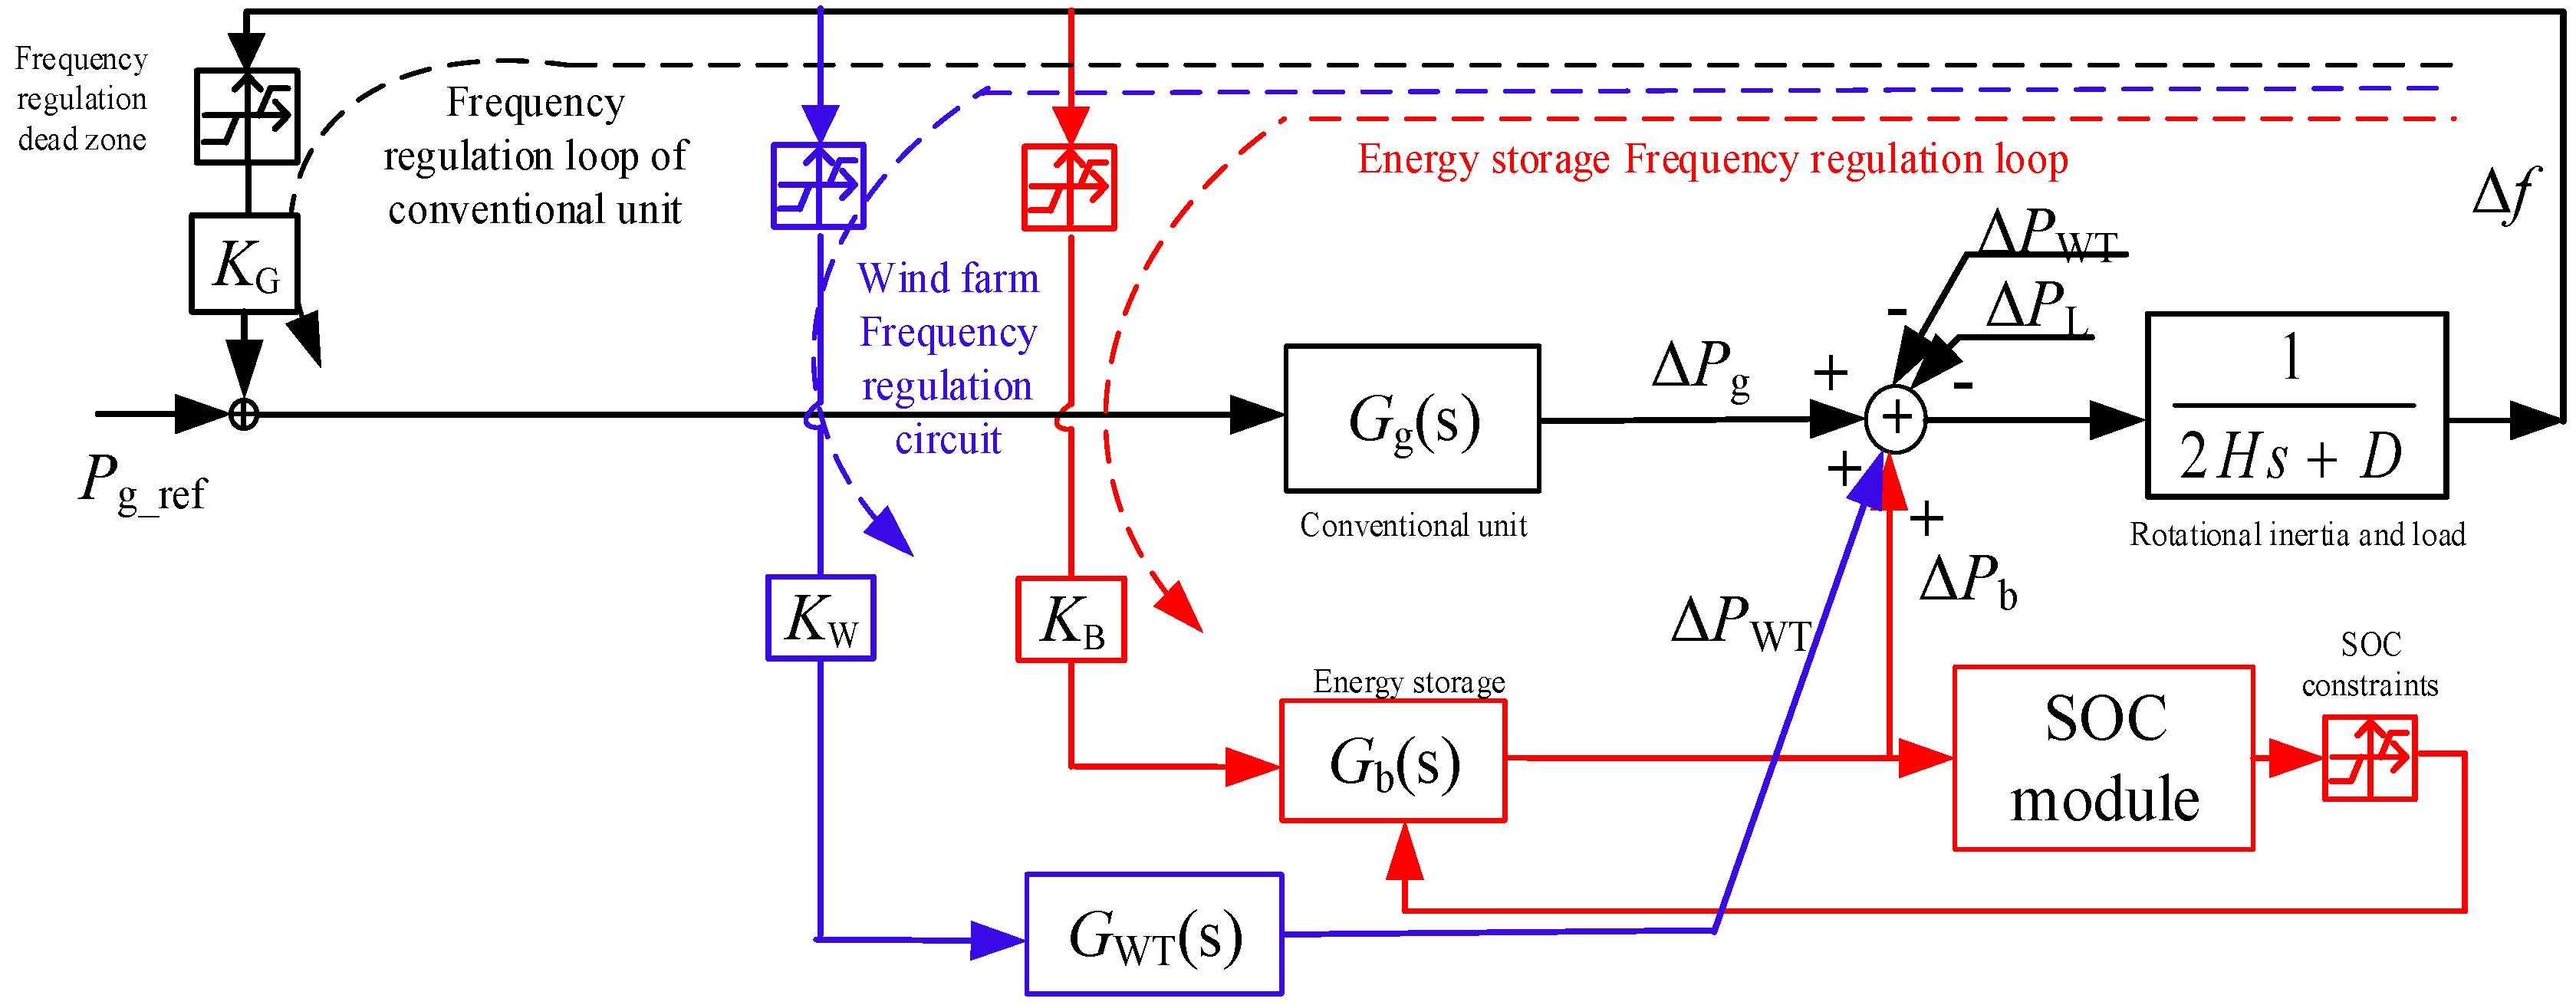
2. Study on Frequency Modulation Uncertainty Mechanism of Wind Turbine

The fan frequency modulation control principle is shown in Figure 1, where d% is the reserve power factor for frequency modulation, and ∆P is the reserve power.
The mechanical power (Pm) generated by wind generators is related to the air density ρ, the wind speed v, the pitch angle β, the sweep radius r of wind turbine blades, and the wind energy utilization coefficient Cp. Based on aerodynamic principles, the expression is given as follows [19]:
P m = 1 2 ρ v 3 π r 2 C p ( λ , β ) C p ( λ , β ) = 0.22 116 λ i 0.4 β 5 e 12.5 λ i λ = r ω v
At the present stage, the load reduction mode is mainly adopted to enable wind turbines to have bi-directional frequency modulation capability [19]. If the wind turbines operate with the load reduction coefficient d%, the standby power of frequency modulation is shown in (2), and the power–speed characteristic curve is shown in Figure 2.
Δ P wind = P m d = 1 2 ρ v 3 π r 2 C p ( λ ) d %
Δ P wind = K i Δ f
where Ki is the frequency modulation constant of the system.
In Figure 2, when the wind speed is less than 6.7 m/s (start-up stage), the wind turbine is generally in the shutdown state without any frequency modulation ability. When the wind speed is between 6.7 and 11.7 m/s, the maximum power tracking area adopts the overspeed load reduction frequency modulation control mode, as shown in the middle point E in the figure. After overspeed load reduction, it runs at point F, and the adjustment capacity is ∆P1 = d% ∗ PoptE. When the wind speed is 11.7~13 m/s, that is, the constant speed zone, because the speed is close to the rated speed, the adjustable range is small. If the frequency modulation ability does not meet the demand at this time, combined with the pitch load reduction control, the overspeed load reduction from point A to point B, and then the variable paddle load reduction to point C, the adjustable power is ∆P2 = d% ∗ PoptA. When the wind speed is greater than 13 m/s, that is, the constant power zone, and the maximum rated power is the output, only the pitch load reduction control can be carried out. In the figure, the load reduction from M point to N point can be carried out through the pitch. Thanks to PoptM > PoptA > PoptE, therefore, ∆P3 > ∆P2 > ∆P1, it is not difficult to find that the frequency modulation ability of wind farms, which varies with wind speed and is unstable.
When the predicted power error of wind power is ΔP, then, the frequency-modulated standby power error is ΔP × d%. By substituting the frequency-modulated standby power error into Equation (3), the frequency deviation caused by wind power prediction error can be written as follows:
Δ f 1 = Δ P × d % K i
It can be seen from Equation (4) that the standby capacity of wind turbine frequency modulation is one of the important factors affecting the reliability of frequency modulation.

3. SOC Adaptive Adjustment Strategy for Wind Speed Randomness

There are two operational requirements for energy storage-assisted wind farms to participate in frequency regulation: (1) maintain reasonable SOC and (2) improve the frequency modulation reliability of the air storage system. It is worth noting that, in most previous studies, SOCref recovery base point (SOCref) was set as the fixed point 0.5 [16]. However, in wind power systems, due to the randomness of wind speed, SOCref is set as the reference point, which may cause the energy storage to need frequent charging and discharging to recover its SOC, which will not only shorten the service time of the energy storage but also bring instability to the power grid. Therefore, an SOCref adaptive adjustment method based on the randomness of wind speed is proposed in order to maintain the SOCref within the planned range, so as to improve the reliability of its output during frequency modulation and avoid the influence of frequent charge and discharge on the service life of energy storage.
To damp the power deficit/redundancy of wind power frequency modulation caused by wind speed fluctuations, the SOCref needs to be increased to make up for this part of the power deficit when wind speed decreases, and SOCref needs to be lowered when wind speed increases to store this part of redundant power. In summary, the basic point adjustment method is shown in Figure 3.
According to Figure 3, the method of adaptive adjustment of SOCref according to the randomness of wind speed proposed in this paper is as follows:
(1)
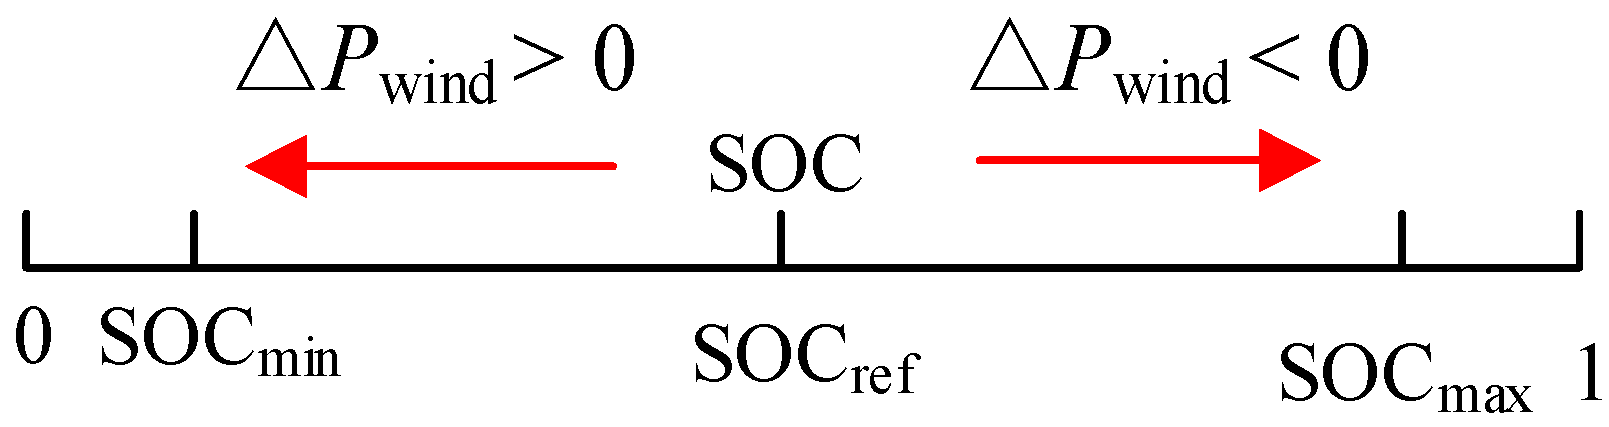
If the perturbation ∆PL(t + 1) = 0 is predicted at the next time, the SOCref remains unchanged;
(2)
If the perturbation quantity ∆PL(t + 1) > 0 is predicted at the next time; at this time, more space should be reserved to store the redundant power generated by the increase in wind speed at the next time, and SOCref should be lowered;
(3)
If the perturbation quantity ∆PL(t + 1) < 0 is predicted at the next time; at this time, more power should be stored to make up for the power loss caused by the decrease in wind speed at the next moment, and SOCref should be increased.
According to the above ideas, if the current moment is known and the wind speed is predicted at the next moment, the fluctuation of wind power frequency modulation (∆Pwind(t)) in the next sampling interval can be predicted, namely, the frequency modulation output power (∆PES(t)) in the period of energy storage. Therefore, the current energy storage SOC base point value (SOCref(t)) can be known.
Δ P wind ( t ) = [ P m ( t + Δ t ) P m ( t ) ] × d %
Δ P wind ( t ) = Δ P ES ( t ) = Δ SOC ( t ) × E N
SOC ref ( t ) = SOC max Δ SOC ( t ) , C h a r g i n g SOC min + Δ SOC ( t ) , D i s c h a r g e
where ∆t is the sampling interval, and EN is the rated energy storage power.

4. Optimization Model Based on Model Predictive Control

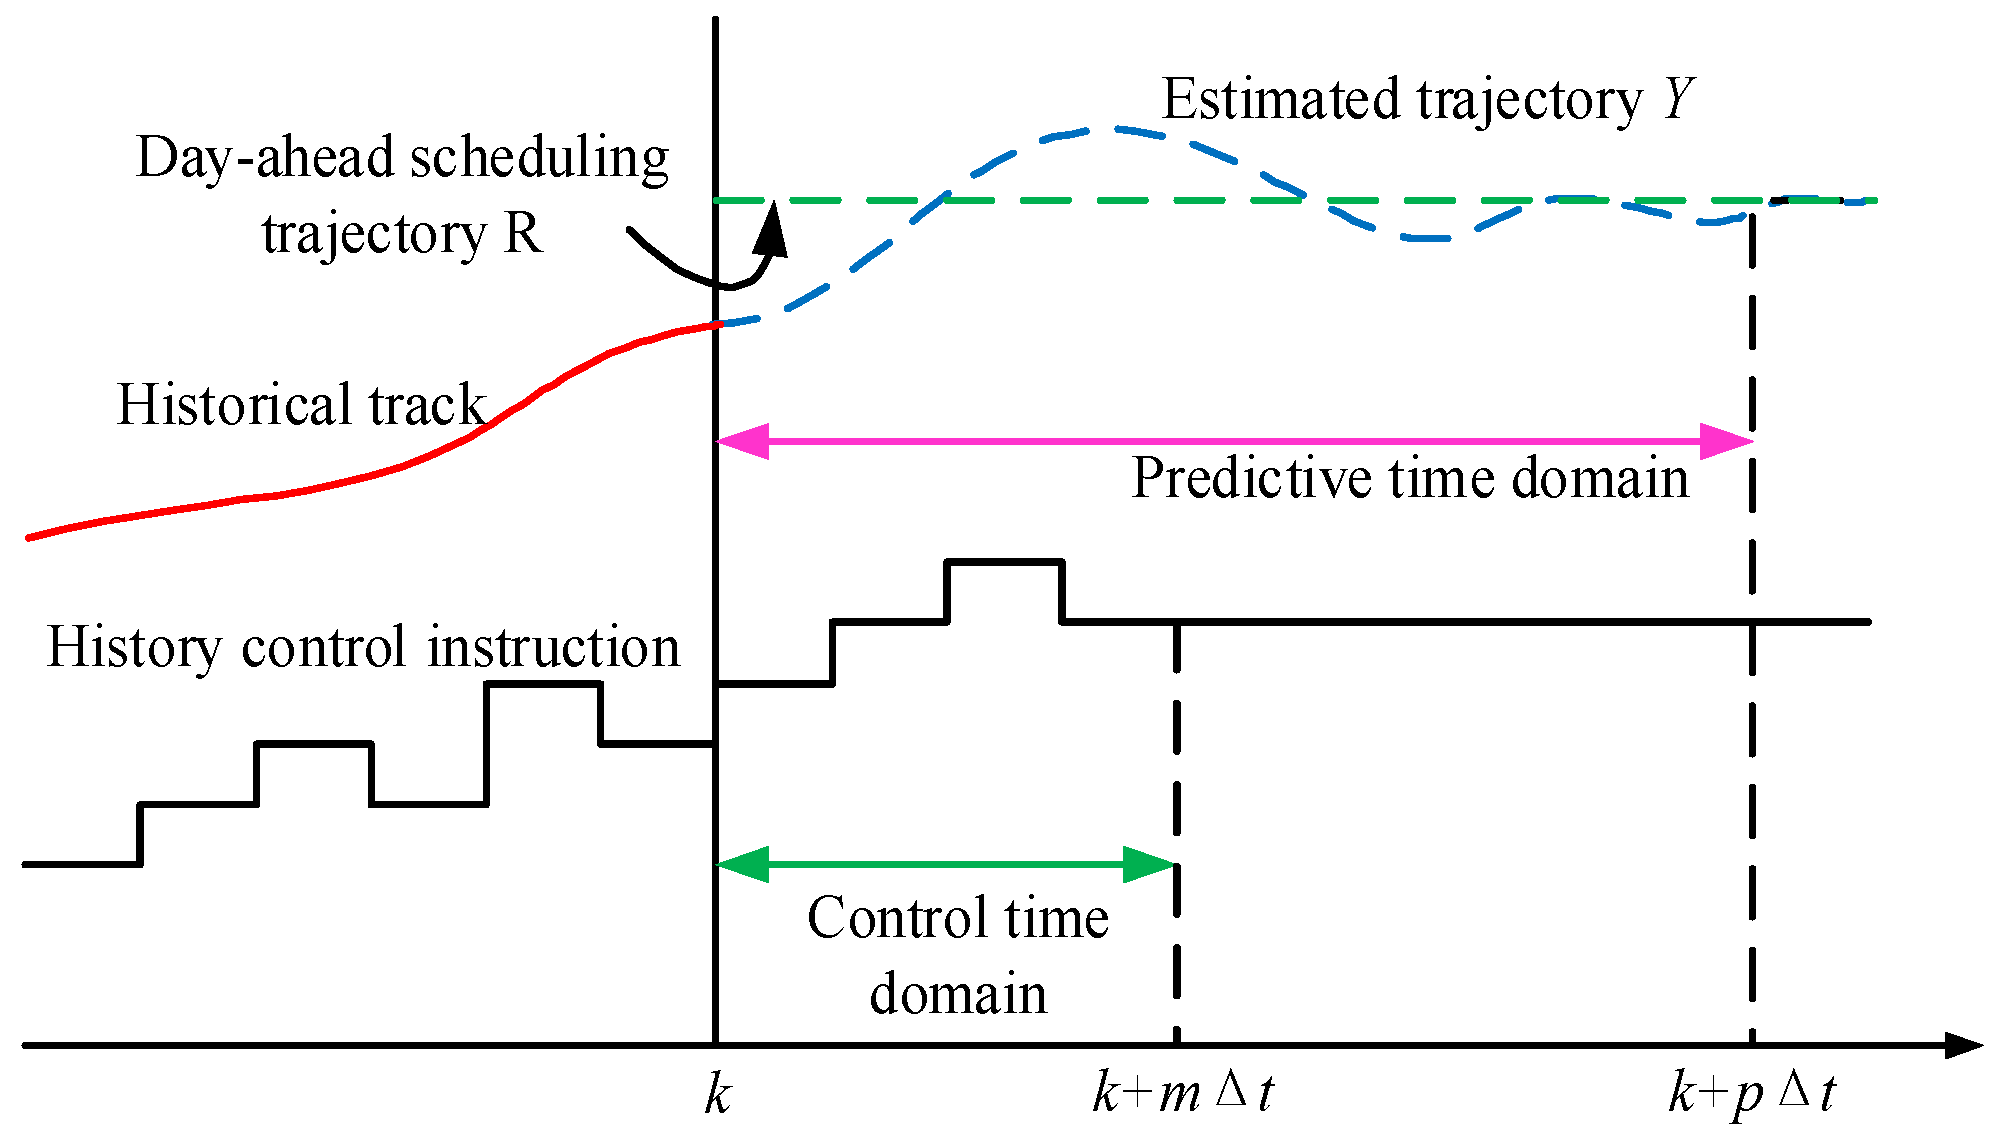
4.1. Introduction to Model Predictive Control

The basic principle and rolling optimization process of MPC are shown in Figure 4 and Figure 5. Its core steps are as follows:
(1)
Based on the current moment k and the current state x(k), the state of the system in the future (k~k + pt) is predicted, and then, we obtain the future control instruction sequence at time k + mt, i.e., k + ∆t, k + 2∆t....
(2)
Only the first control instruction in the optimal control sequence is applied to the system;
(3)
At the time of k + ∆t, the system state is updated to x(k + ∆t) with the actual control effect as the feedback information. A revised forecast model is obtained based on new forecast information. Then, the preceding steps are repeated.

4.2. Evaluation Equation

Based on rolling optimization and advanced control ideas, the model prediction control (MPC) can effectively solve the frequency modulation uncertainty caused by the randomness of wind speed. According to the relationship between variables, the MPC state space model is established, as shown in Equations (8) and (9). According to the ultra-short-term forecast data of the output and load of wind turbine, the above state space model is iterated repeatedly, and the vector Yf composed of the estimated output value of the energy storage SOC in the control time domain mt can be obtained. As shown in the upper part of Equation (10), in the period mt ahead of the current moment, the vector Rref formed by the planned value of energy storage SOCref (determined according to the day-ahead SOC scheduling plan) is the tracking control target, as shown in the following part of Equation (10). With the goal of minimizing the error between the estimated output value and the planned value of the energy storage SOCref, the rolling optimization control is transformed into the quadratic programming problem as shown in Equation (11).
x ( k + Δ t ) = P WT ( k + Δ t ) P ES ( k + Δ t ) S O C ES ( k + Δ t ) P grid ( k + Δ t ) = 1 0 0 0 0 1 0 0 0 Δ t W ESN 1 0 0 0 0 1 P WT ( k ) P ES ( k ) S O C ES ( k ) P grid ( k ) + 1 0 0 1 0 Δ t W ESN 1 1 Δ P WT ( k ) Δ P ES ( k ) + 0 0 0 0 0 0 0 0 0 1 1 1 Δ P L ( k ) Δ P WTY ( k ) Δ P ESD ( k )
y ( k ) = S ES ( k ) = 0   0   1   0 P WT ( k ) P ES ( k ) S ES ( k ) P grid ( k ) T
Y f = S O C ES f ( k + Δ t ) S O C ES f ( k + m Δ t ) T R r e f = S O C ES r e f ( k + Δ t ) S O C E S r e f ( k + m Δ t ) T
min J = ( R r e f Y f ) T H ( R r e f Y f ) + U T G U s . t .     P WT min P WT P WT max Δ P WT min Δ P WT Δ P WT max P ES min P ES P ES max S O C min S O C ES S O C max

4.3. Whale Algorithm Optimization Evaluation Equation

Compared to the classical particle swarm optimization (PSO) and differential evolution algorithm (DE) with 11 well-known benchmark functions, the results of the experiments showed that the WOA was effective in solving optimization problems [20,21]. Therefore, WOA was chosen to solve the problem in this paper.
Whale algorithm (WA) is mainly divided into three stages: marking stage, hunting stage, and searching stage. After spotting prey, the whale will perform a spiral narrowing of the circle, and its position will be updated as follows:
X ( t + 1 ) = X ( t ) A D ,     p < 0.5 D e b l cos ( 2 π l ) + X ( t ) ,     p 0.5
D = C X ( t ) X ( t ) D = X ( t ) X ( t )
where p [0, 1] is a random number, and when p < 0.5, it can be considered that the whale population will perform a narrowing circle behavior and move closer to the position of prey. When p ≥ 0.5, the whale population will perform a spiral hunt to prey more accurately. t is the number of current iterations; X ( t ) is the current prey position; X ( t ) is the current whale position; b and l are spiral path parameters, where b is a constant, and l is the random number between [−1, 1]; D and D are the distances between prey and whales; A and C are coefficient vectors, which are defined as follows:
A = 2 s r 1 s ,     C = 2 r 2
s = 2 2 t T max
where s is the convergence factor, whose value belongs to [0–2], resulting in the late iteration of the algorithm that is always less than 1. When |s| < 1, the algorithm does not have global search capability. r1 and r2 are [0, 1] random numbers. Tmax is the maximum number of iterations.
In order to improve the global search capability of whale algorithm, whales need to search for new prey in the solution space in addition to encircling hunting behavior. The position update formula is as follows:
X ( t + 1 ) = X r a n d ( t ) A D
D = C X r a n d ( t ) X ( t )
where Xrand(t) is the whale individual random position, and when |A| > 1, by A type (16), the whales will randomly update their location away from the prey, and when |A| ≤ 1, hunting whales surrounded the implemented prey.
It is not difficult to find from the above analysis that the traditional WA is difficult to jump out of the local optimal solution in the late iteration period and lacks the global search ability. Moreover, it also has certain limitations in the search for the local optimal solution in the optimization process. Therefore, a nonlinear convergence factor s is proposed to improve the global search capability of the algorithm. In order to improve the global search ability in the early stage and local fine search ability in the late stage, adaptive weight η was added into the whale population position updating formula. The nonlinear convergence factor s and the adaptive weight η are shown as follows:
s = s i ( s i s n ) ( t T max ) 2
η = η min + ( η max η min ) × 1 1 + e ( k t / T max μ )
where si and sn are initial and final values, respectively. In the early stage of whale algorithm optimization, the value of s is large, and the decline rate is slow, while in the late stage of whale algorithm optimization, the decline rate of s is accelerated, which is conducive to algorithm convergence. ηmin and ηmax are the maximum inertial weights. k and μ are curvature-adjusted quantities, and the values of k and μ directly affect the decline rate of η. The updated formula of the improved adaptive whale algorithm is as follows:
X ( t + 1 ) = η X ( t ) A D ,     p < 0.5 D e b l cos ( 2 π l ) + η X ( t ) ,     p 0.5
X ( t + 1 ) = X r a n d ( t ) η A D

4.4. Model Solving Steps
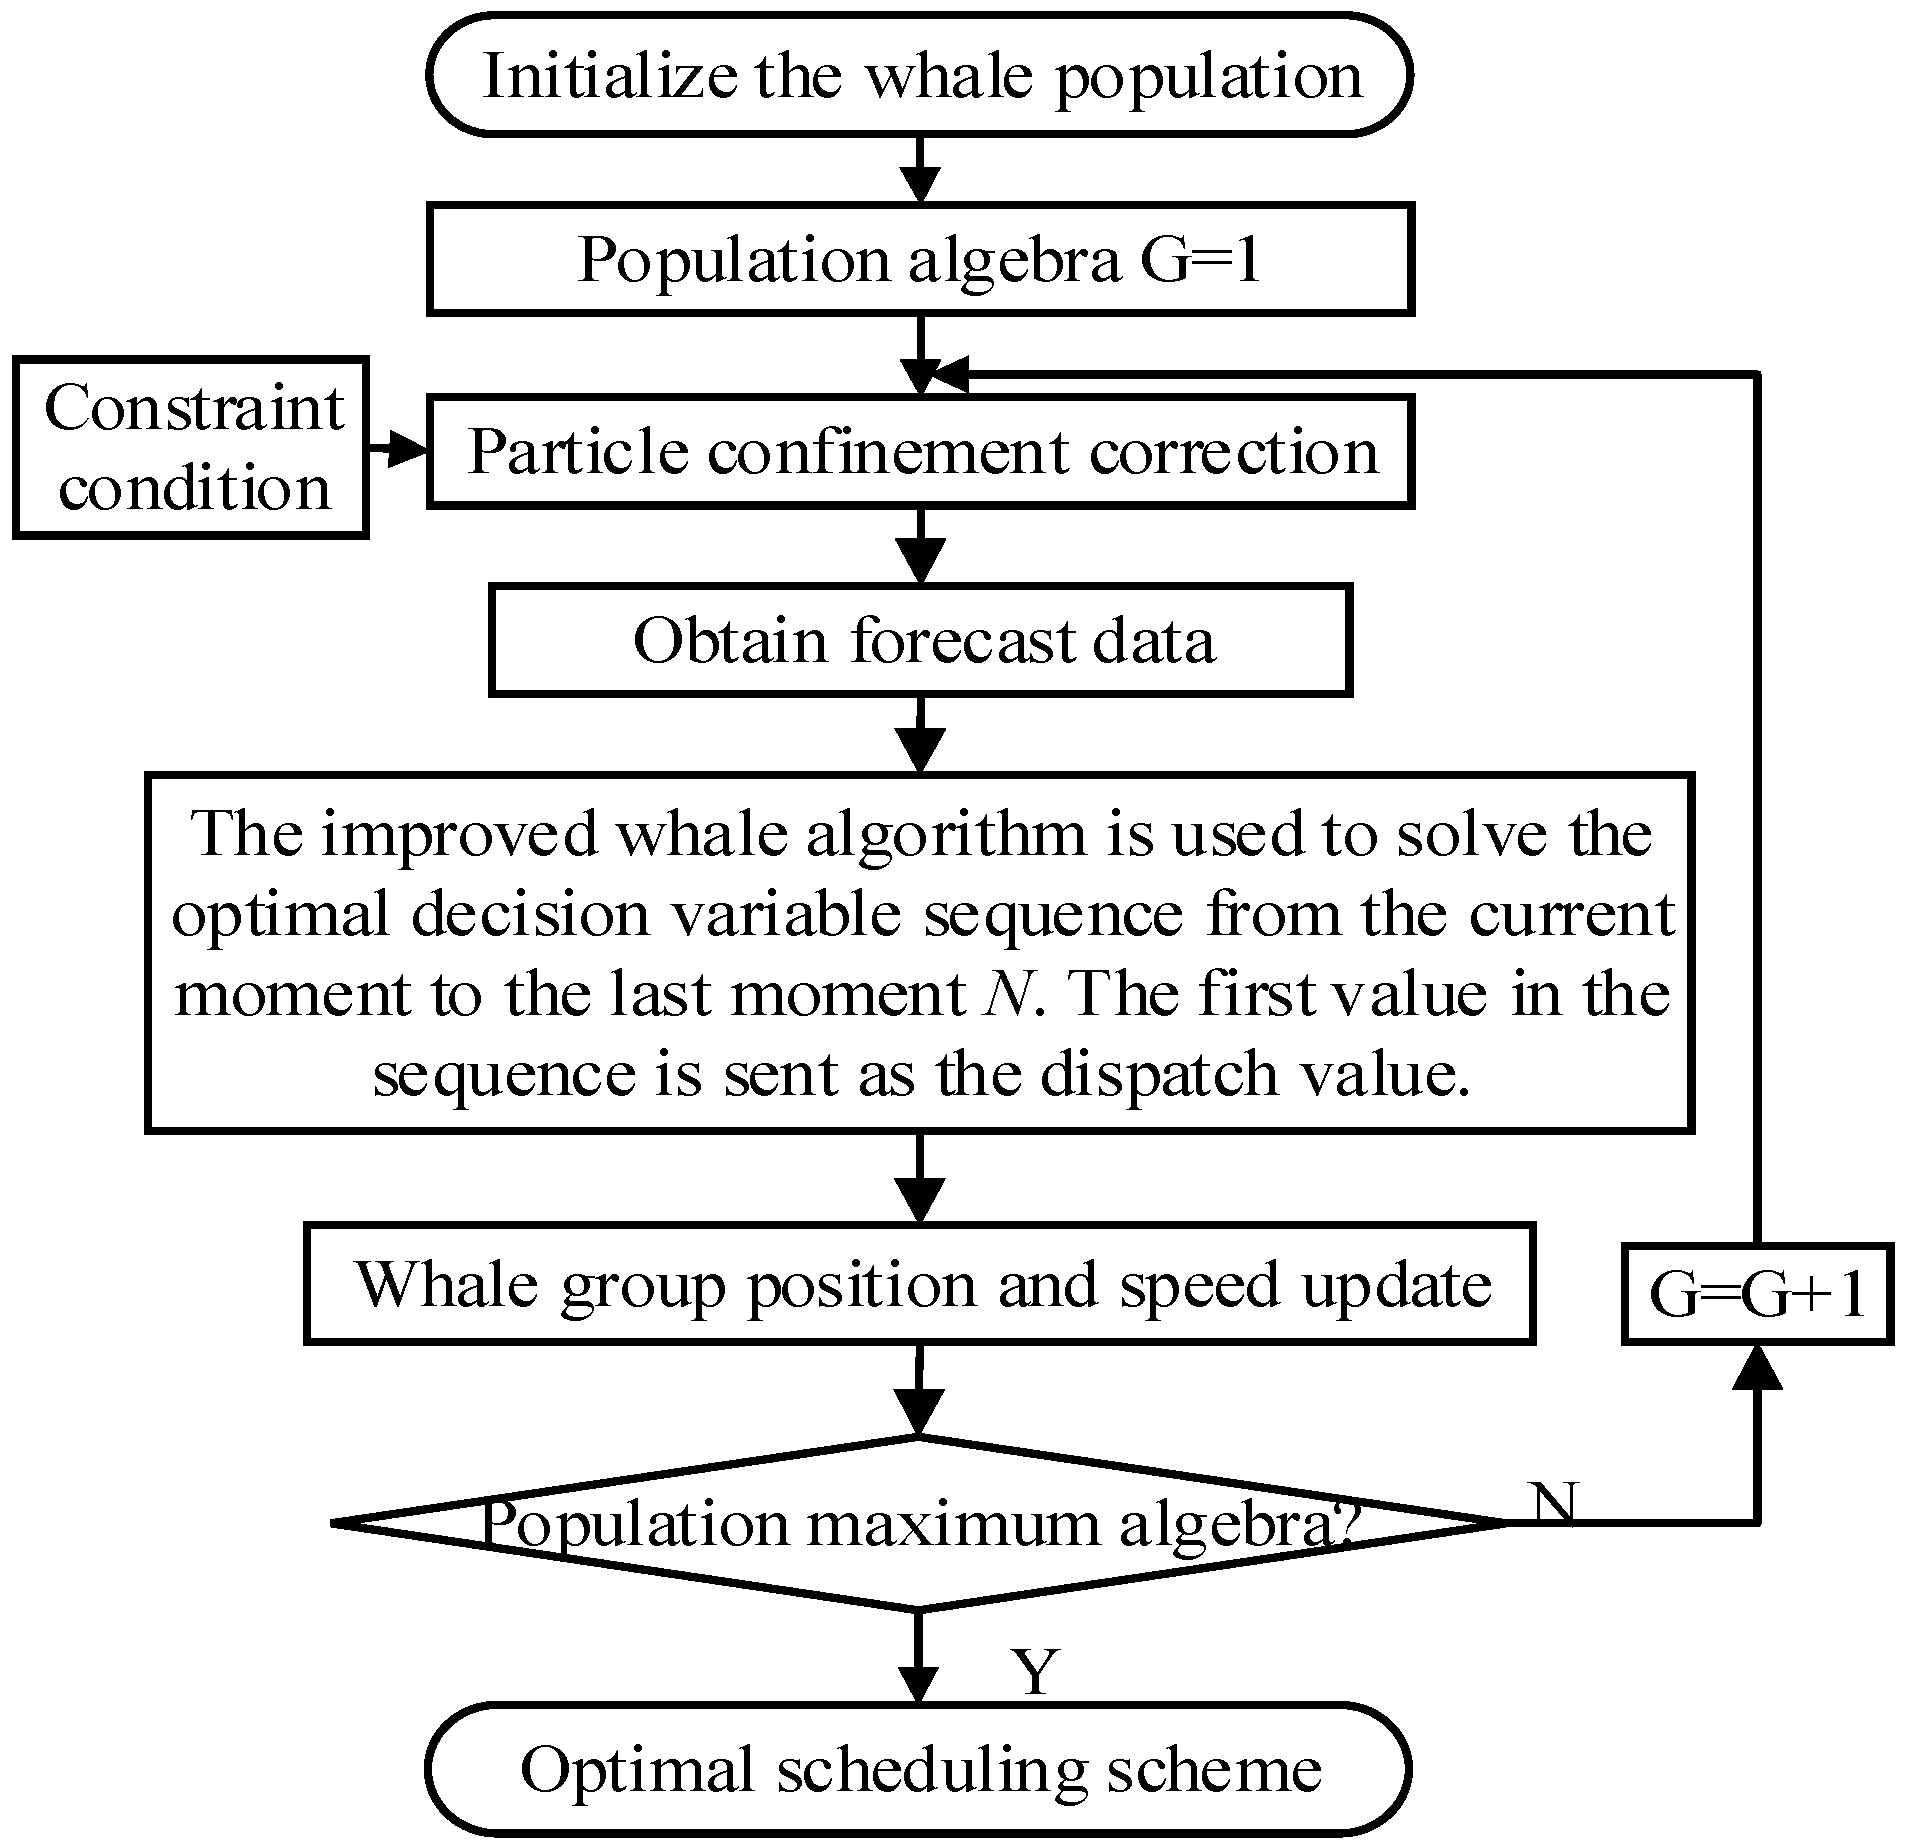
The proposed algorithm flow is shown in Figure 6. The implementation steps are as follows:
(1)
Parameter initialization: Let the current optimal scheduling time be t = 1 and the optimization interval be 15 min. Obtain the load demand and output value of wind turbine and photovoltaic turbine every 15 min in the next 24 h.
(2)
Initialization of whale algorithm: different whale positions and velocities represent different micro-source scheduling plans and adjustment sizes.
(3)
Calculate the objective function: The optimization objective is to minimize the frequency deviation from the current moment to the last moment, and the optimal decision variable sequence is shown in Equation (9). And the first value of the sequence in Equation (9) is sent as a scheduling reference value.
(4)
Update the SOC value of energy storage, whale position, and speed: The SOC value is updated with the measured load, wind power, and photoelectric output value, and the actual charge/discharge power of the energy storage is fine-tuned. The measured information is used to achieve a closed-loop optimization process and improve the optimization effect.
(5)
Iterative update: let t = t + 1, and then, repeat steps (2)–(5) until t = N, to gradually solve the optimal P(t) adjustment value at each moment.

5. Simulation Analysis

5.1. Basis of Simulation

The dynamic model of primary frequency modulation in a region containing the wind storage system is shown in Figure 7. The unit capacity of the power grid is 200 MW, the maximum load is 160 MW, and the proportion of new energy is 40%. The parameters are standardized based on the unit capacity of 1000 MW. Parameters of the simulation model are shown in Table 1 [18], and load reduction coefficient of wind turbine d% = 10%.
Under the two working conditions of short-time continuous step disturbance and 5 min continuous disturbance, the frequency modulation effects of three different control strategies, no energy storage (SOC = 0), SOC restoration base point constant value of 0.5 (SOC = 0.5), and dynamic SOC (DSOC) restoration base point method, proposed in this paper are simulated and analyzed. In the example, the disturbance refers to the algebraic sum of the load disturbance and the new energy disturbance. At the same time, a frequency modulation evaluation index was defined for the quality of frequency modulation effect of quantitative analysis. For step disturbance, the index was the maximum frequency deviation (Δfmax).
Δ f max = f max f 0
where f0 represents the reference frequency of 50 Hz.
For continuous disturbance, the root mean square of frequency deviation (Rf) and root mean square of SOC (Rsoc) are used as frequency modulation evaluation indexes.
R f = 1 n i = 1 n ( f i f 0 ) 2
R s o c = 1 n i = 1 n ( SOC i SOC 0 ) 2
where fi and SOCi are the frequency and SOC of moment i; SOC0 is the recovery base point value; and smaller Rf and Rsoc values indicate better frequency modulation effect and SOC maintenance effect.

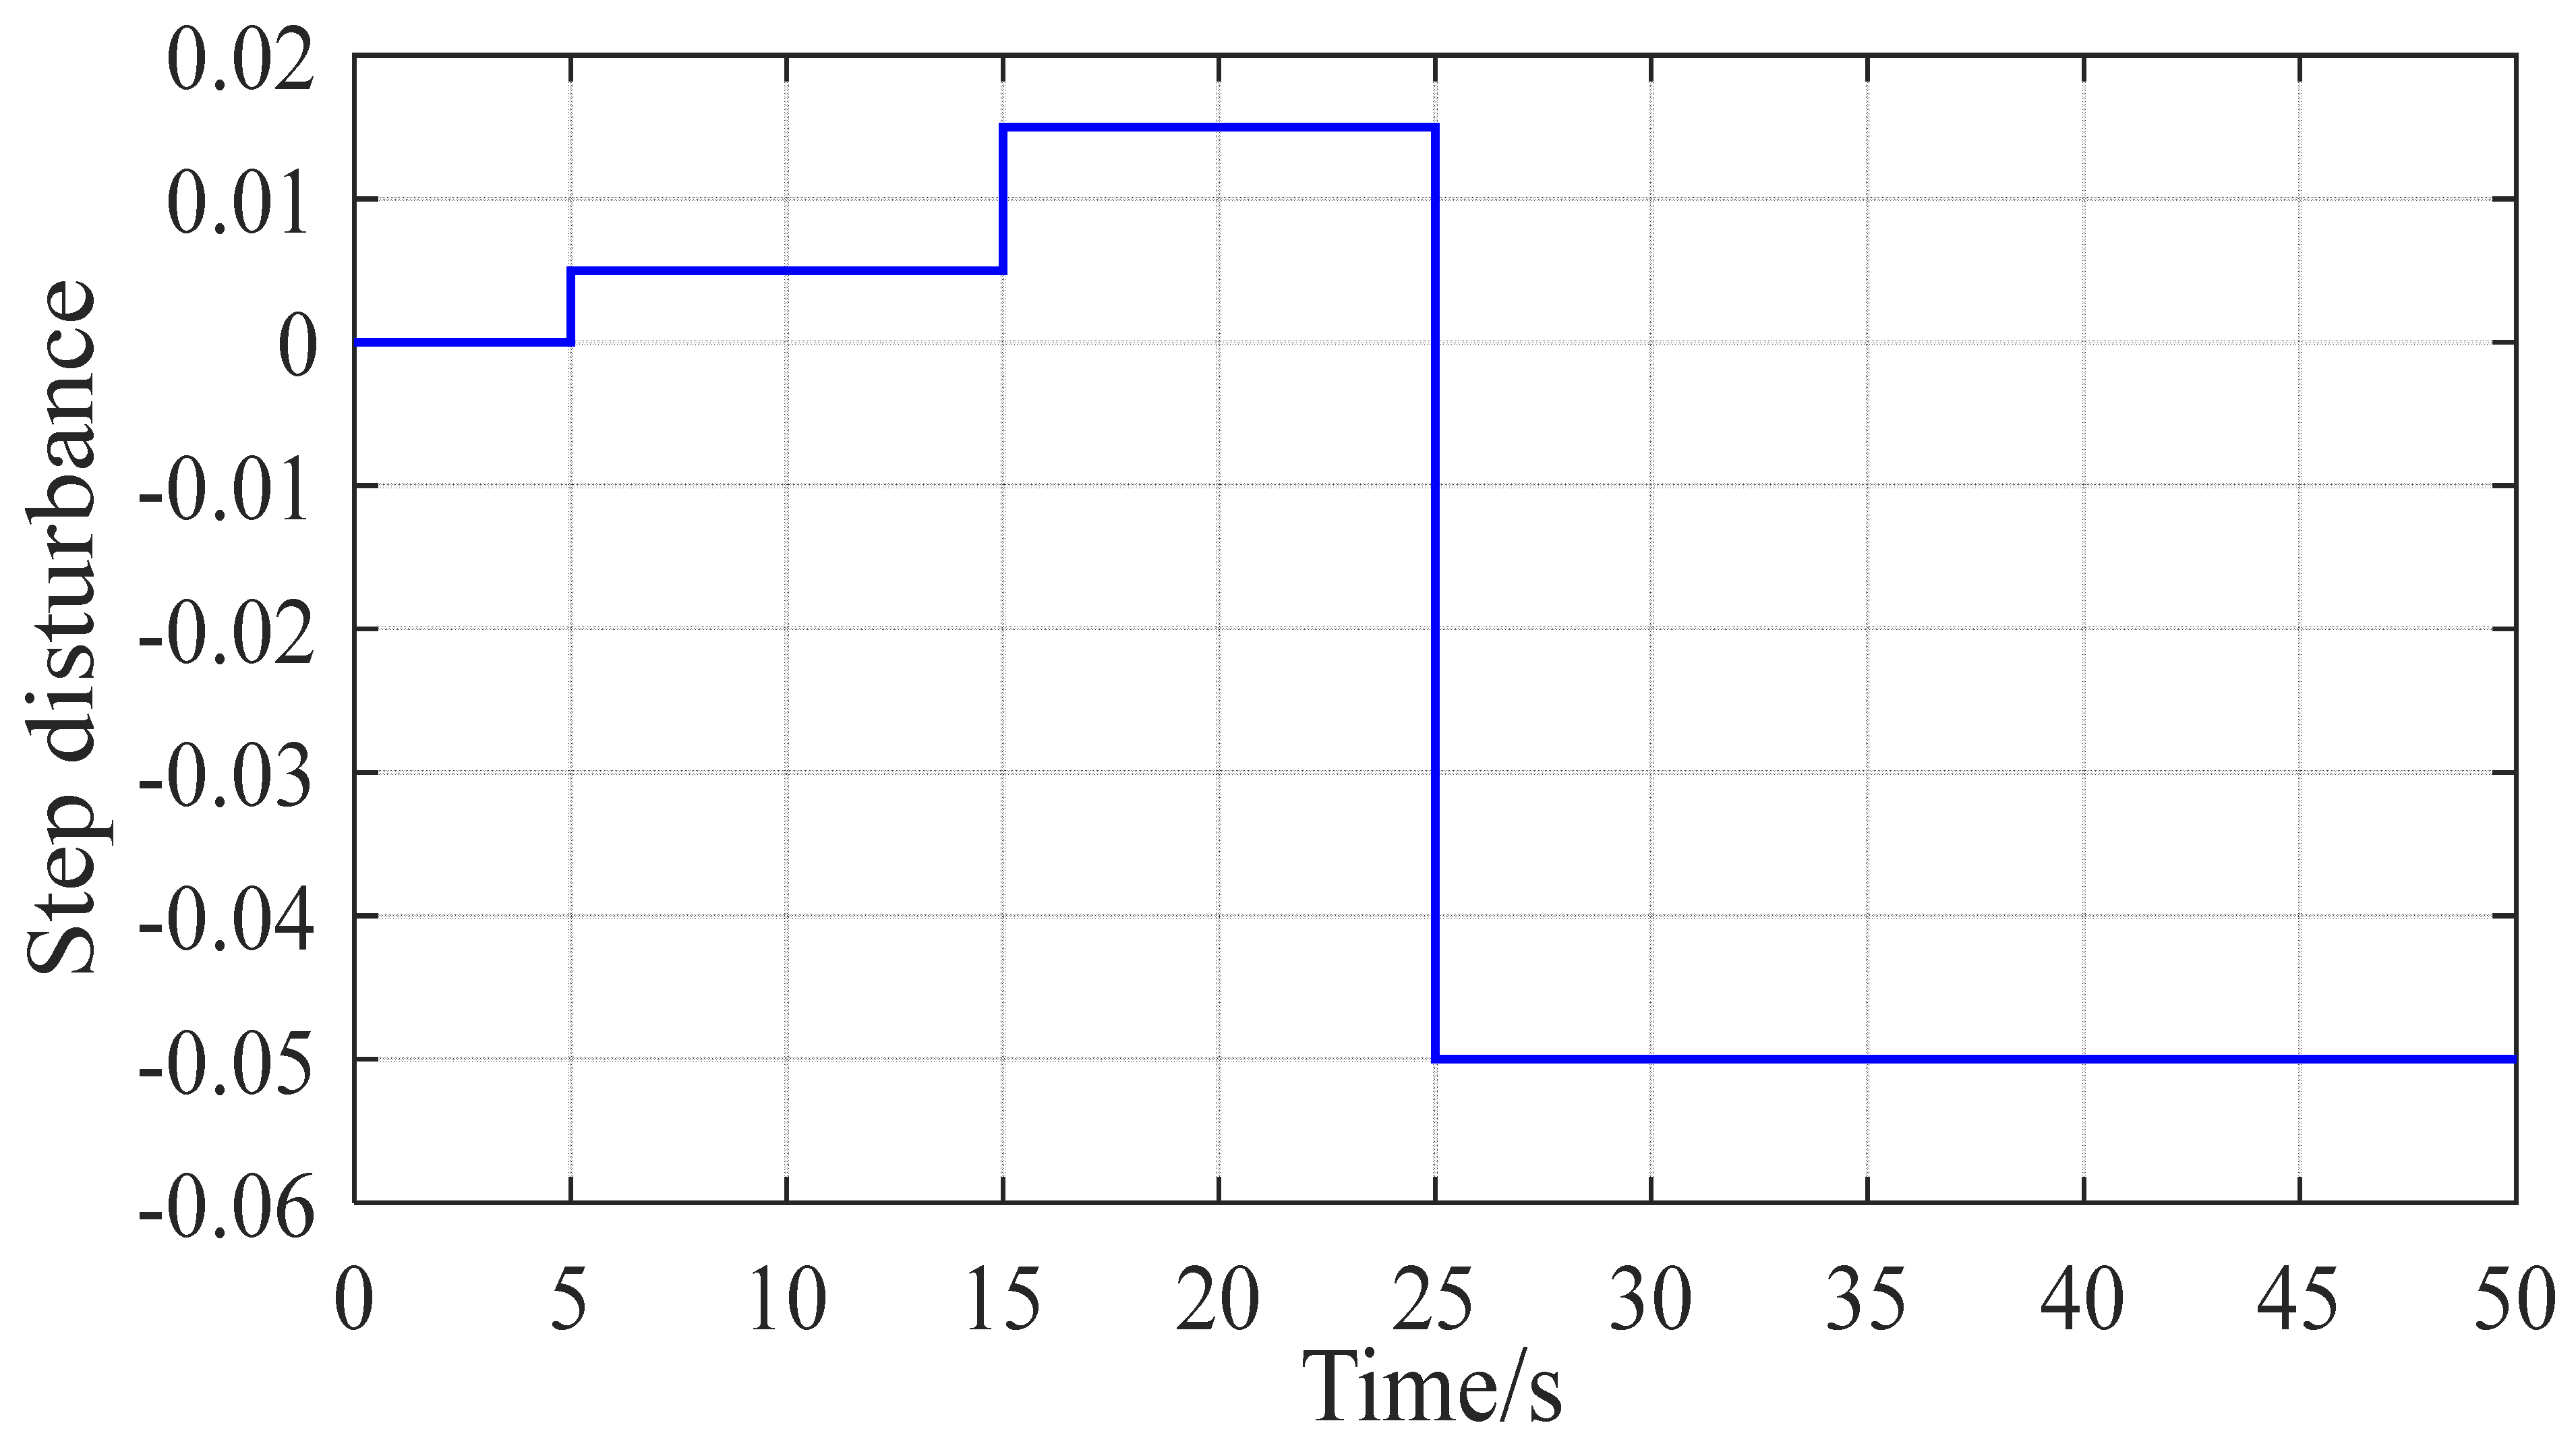
5.2. Short-Time Continuous Step Disturbance Condition Analysis

The 0.005 p.u. step disturbance is given at 5 s and 0.015 p.u. at 15 s. Step disturbance of −0.065 p.u. is given at 25 s. The disturbance curve is shown in Figure 8, and the simulation duration is 50 s. Frequency response curves under different control methods are shown in Figure 9, energy storage output and SOC curves are shown in Figure 10 and Figure 11, respectively, frequency modulation power increment in conventional units is shown in Figure 12, and the relevant frequency modulation indexes are shown in Table 2.
As seen in Figure 6, in the disturbance period, Δfmax is significantly greater than that of the frequency modulation mode in which energy storage participates, indicating that energy storage can effectively improve the frequency deviation. In Figure 8, with the method of fixing SOC, at 10 s, when the frequency enters the new steady state, SOC begins to recover to around 0.5. At this time, due to the large change in recovered power, the frequency is obviously affected, as shown in Figure 9, and frequency disturbance occurs at 10 s. At 25 s, when a large step disturbance occurs, the SOC value in the fixed SOC method is around 0.45, and the energy storage space is limited at this time. As a result, the frequency modulation reaches the SOC saturation state in the later stage and exits, thus leading to a large steady-state frequency deviation. However, the DSOC method adopts the recovery of SOC base point based on disturbance uncertainty, and its SOC base point adaptively adjusts with wind speed prediction. When the disturbance is predicted for 10 s to 15 s, the disturbance increases, but the SOC can meet the demand of frequency modulation at this time, so the recovery is not carried out. When the disturbance is predicted for the next time at 25 s, in order to provide more storage space, the SOC remains at a low state and does not need to be restored, which effectively reduces the number of energy storage recovery and charge and discharge times of energy storage. In addition, according to the data in Table 2, the Δfmax of the proposed DSOC method is lower than that of other energy storage frequency modulation methods under any step disturbance, which effectively demonstrates the superiority of this method.

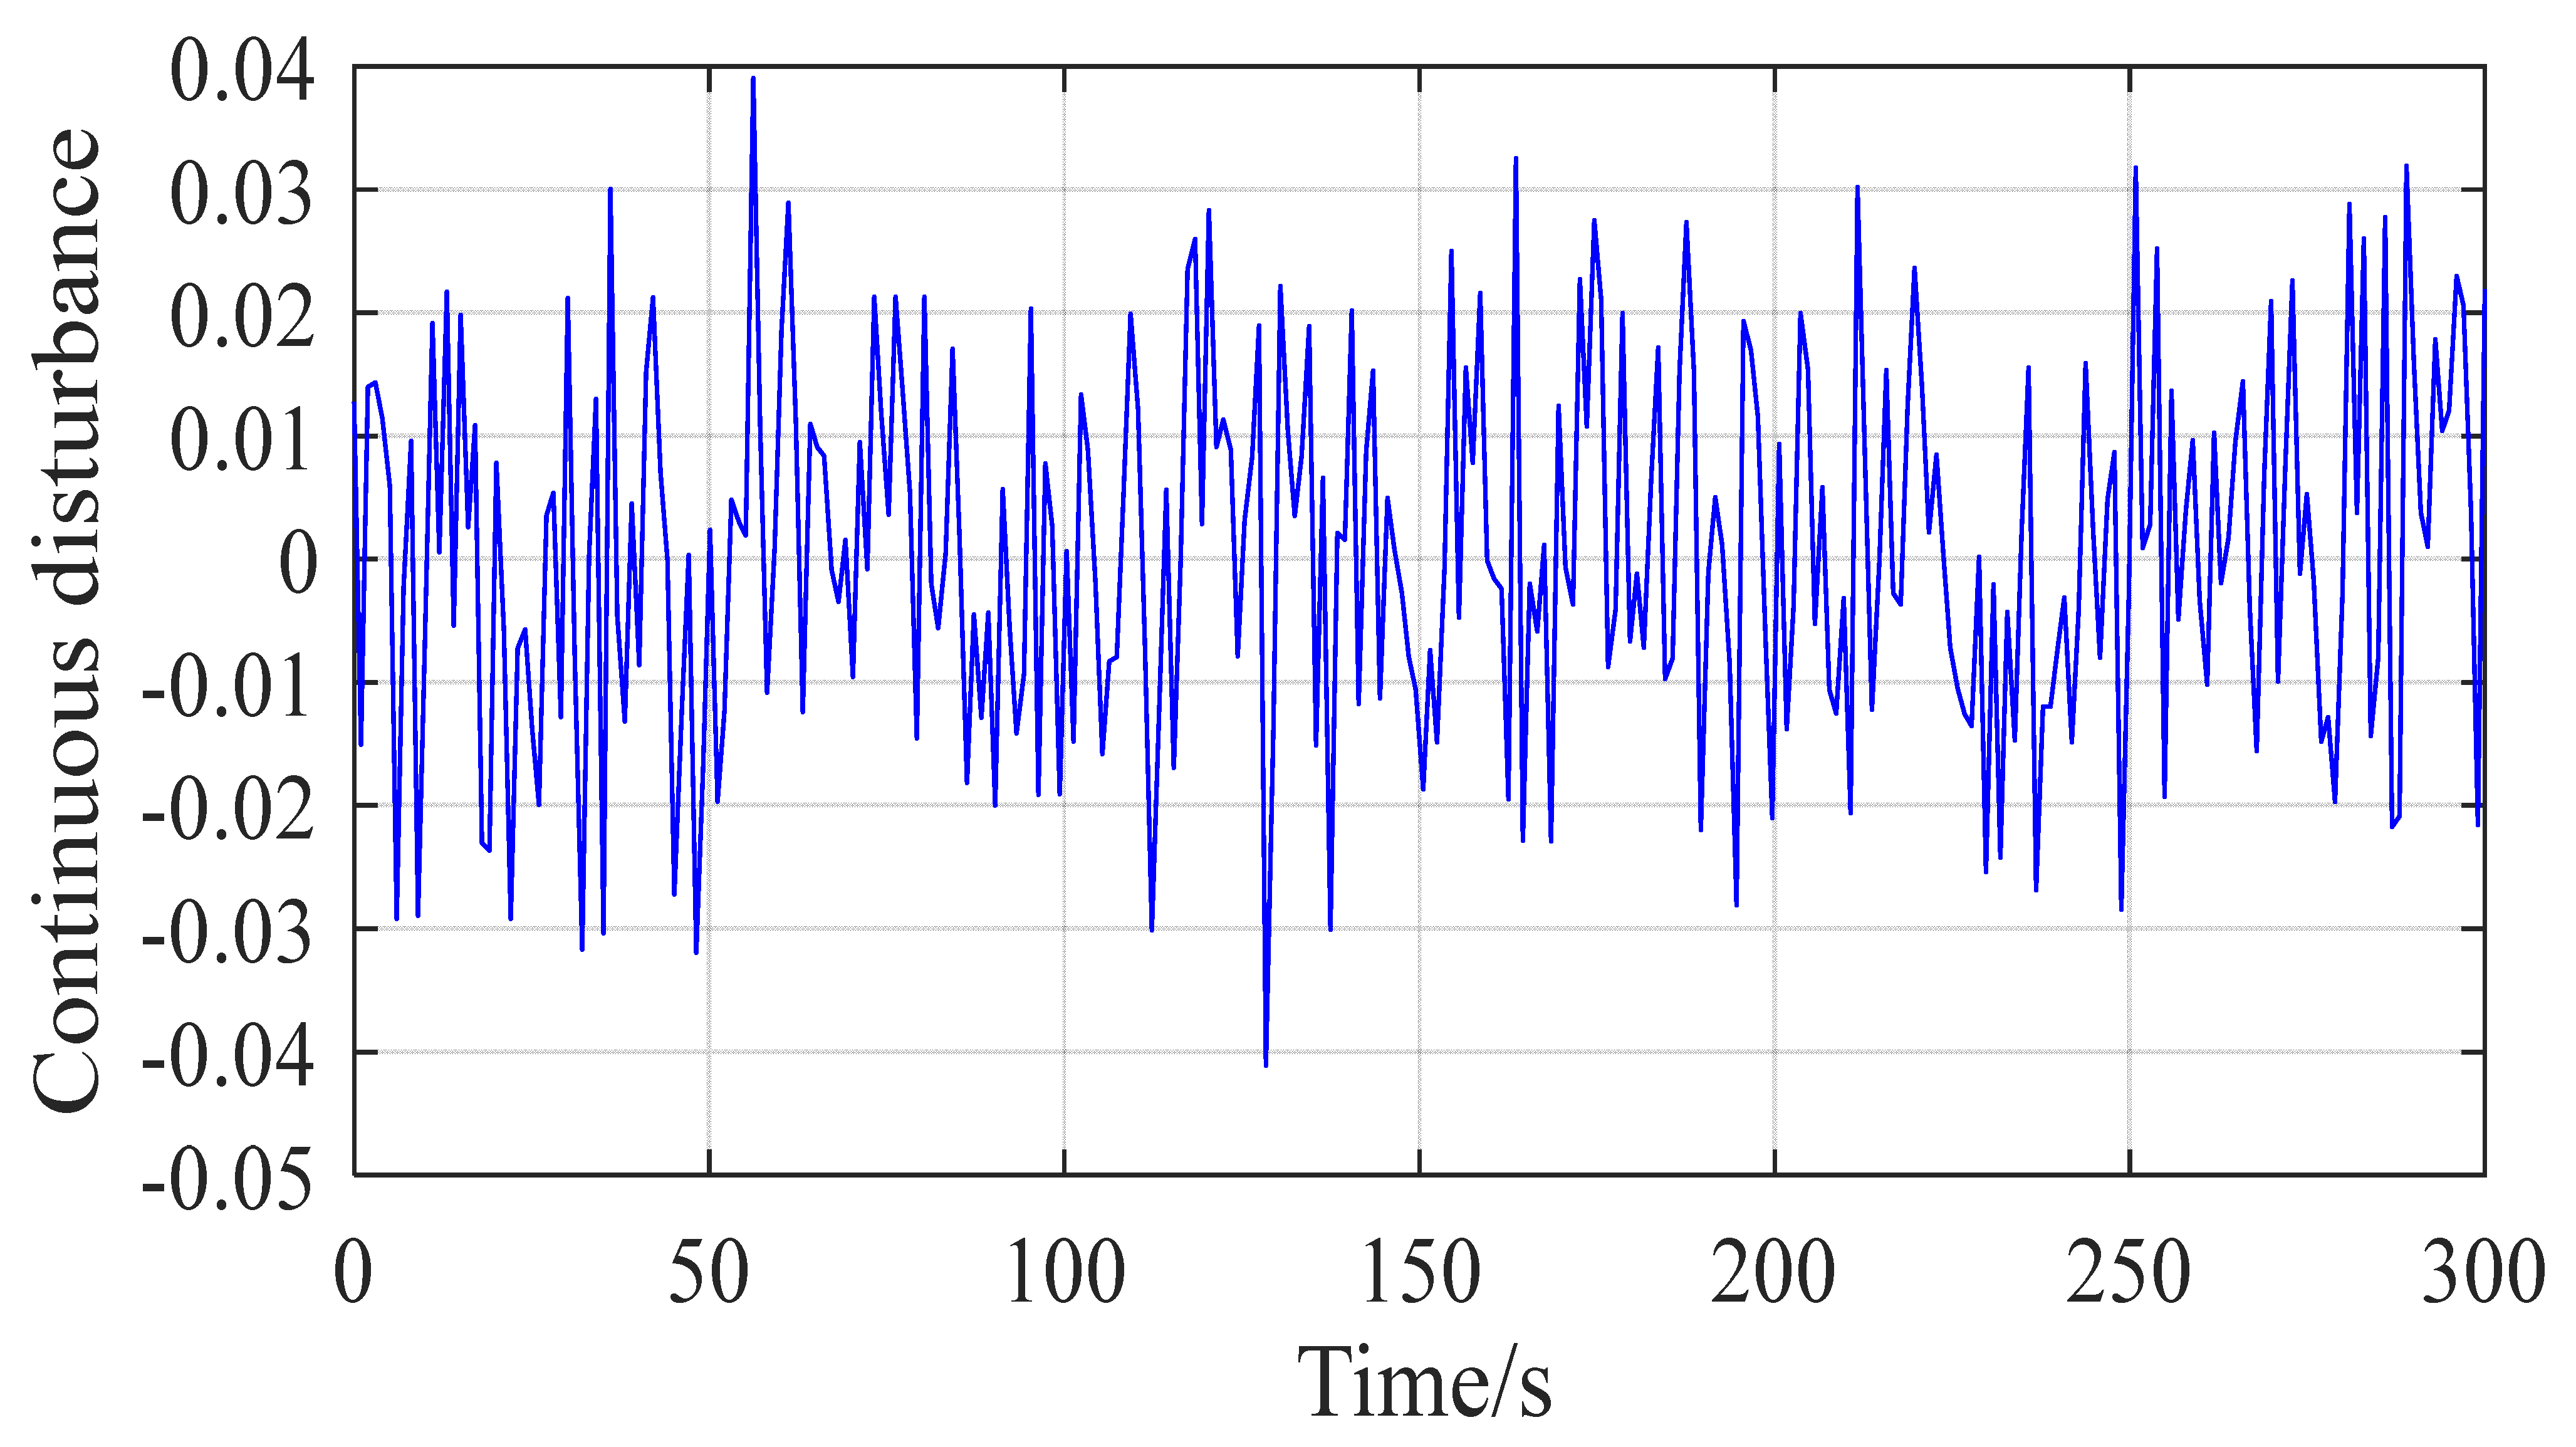
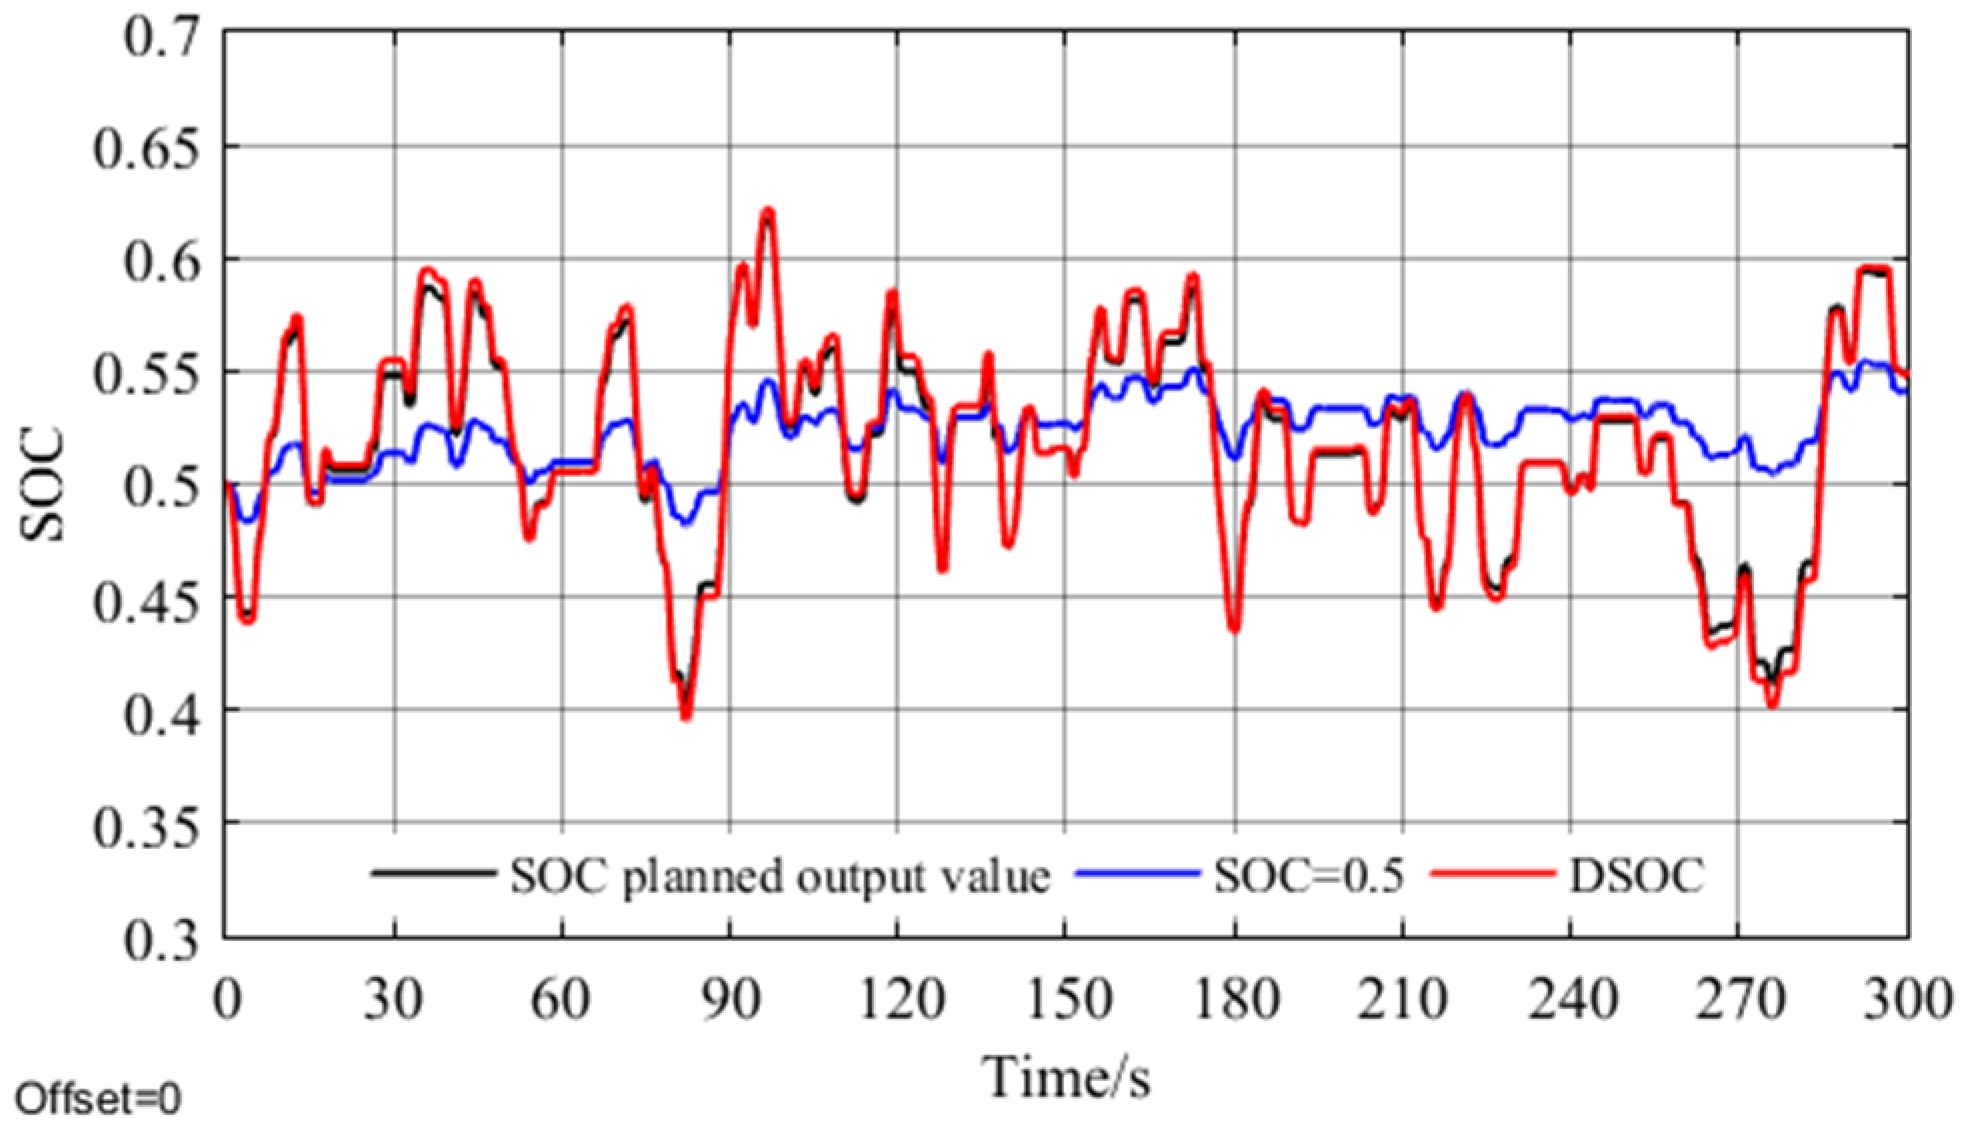
5.3. Continuous Disturbance Condition Analysis

This section verifies the universality of the proposed method under the continuous load curve shown in Figure 12. Figure 13 is the frequency response curve, Figure 14 and Figure 15 are the energy storage power curve and the SOC curve, respectively, and the frequency modulation index results are shown in Table 3.
As seen in Figure 10, in the continuous disturbance condition, the frequency deviation value of the mode without energy storage is still greater than that of the mode with energy storage, indicating that energy storage can effectively improve the frequency modulation effect. In the DSOC frequency modulation mode, the recovery base point of energy storage SOC changes with the trend of disturbance. When the disturbance develops from positive to negative, the energy storage changes from discharge to charge in this process, and the corresponding SOC recovery base point changes from small to large. At this time, discharge can be used to deal with the frequency fluctuation caused by the system power deficiency. In the long run, the effect of frequency adjustment and SOC maintenance will be weaker than that of DSOC. This is because when SOC is near 0.5, the probability of energy storage saturation or depletion under large disturbance is much greater than that of SOC adaptive recovery base point method, as shown in Figure 8. In addition, in the process of continuous recovery, it can increase the frequent start-up times and frequency disturbance times of conventional units, thus increasing the mechanical wear cost and reducing the frequency modulation effect, which effectively indicates that the SOC recovery base point method proposed in this paper can adapt to the disturbance trend, is more conducive to the long-term stability of frequency and the maintenance of SOC, and improve the operation economy of energy storage.
According to the data in Table 3 and Figure 12, the SOC offset of the DSOC method is 56.65% smaller than that of the fixed SOC method based on the planned SOC value, and the SOC maintenance effect is the best. This is mainly because the SOC = 0.5 method cannot automatically adjust the SOC base point according to the disturbance trend, but restores it to around 0.5, thus increasing the deviation.

6. Conclusions

In order to improve the frequency modulation reliability of the wind storage system, a frequency modulation control method based on the SOC recovery base point oriented to wind speed uncertainty is proposed. Through simulation under different working conditions, the following conclusions can be drawn:
(1)
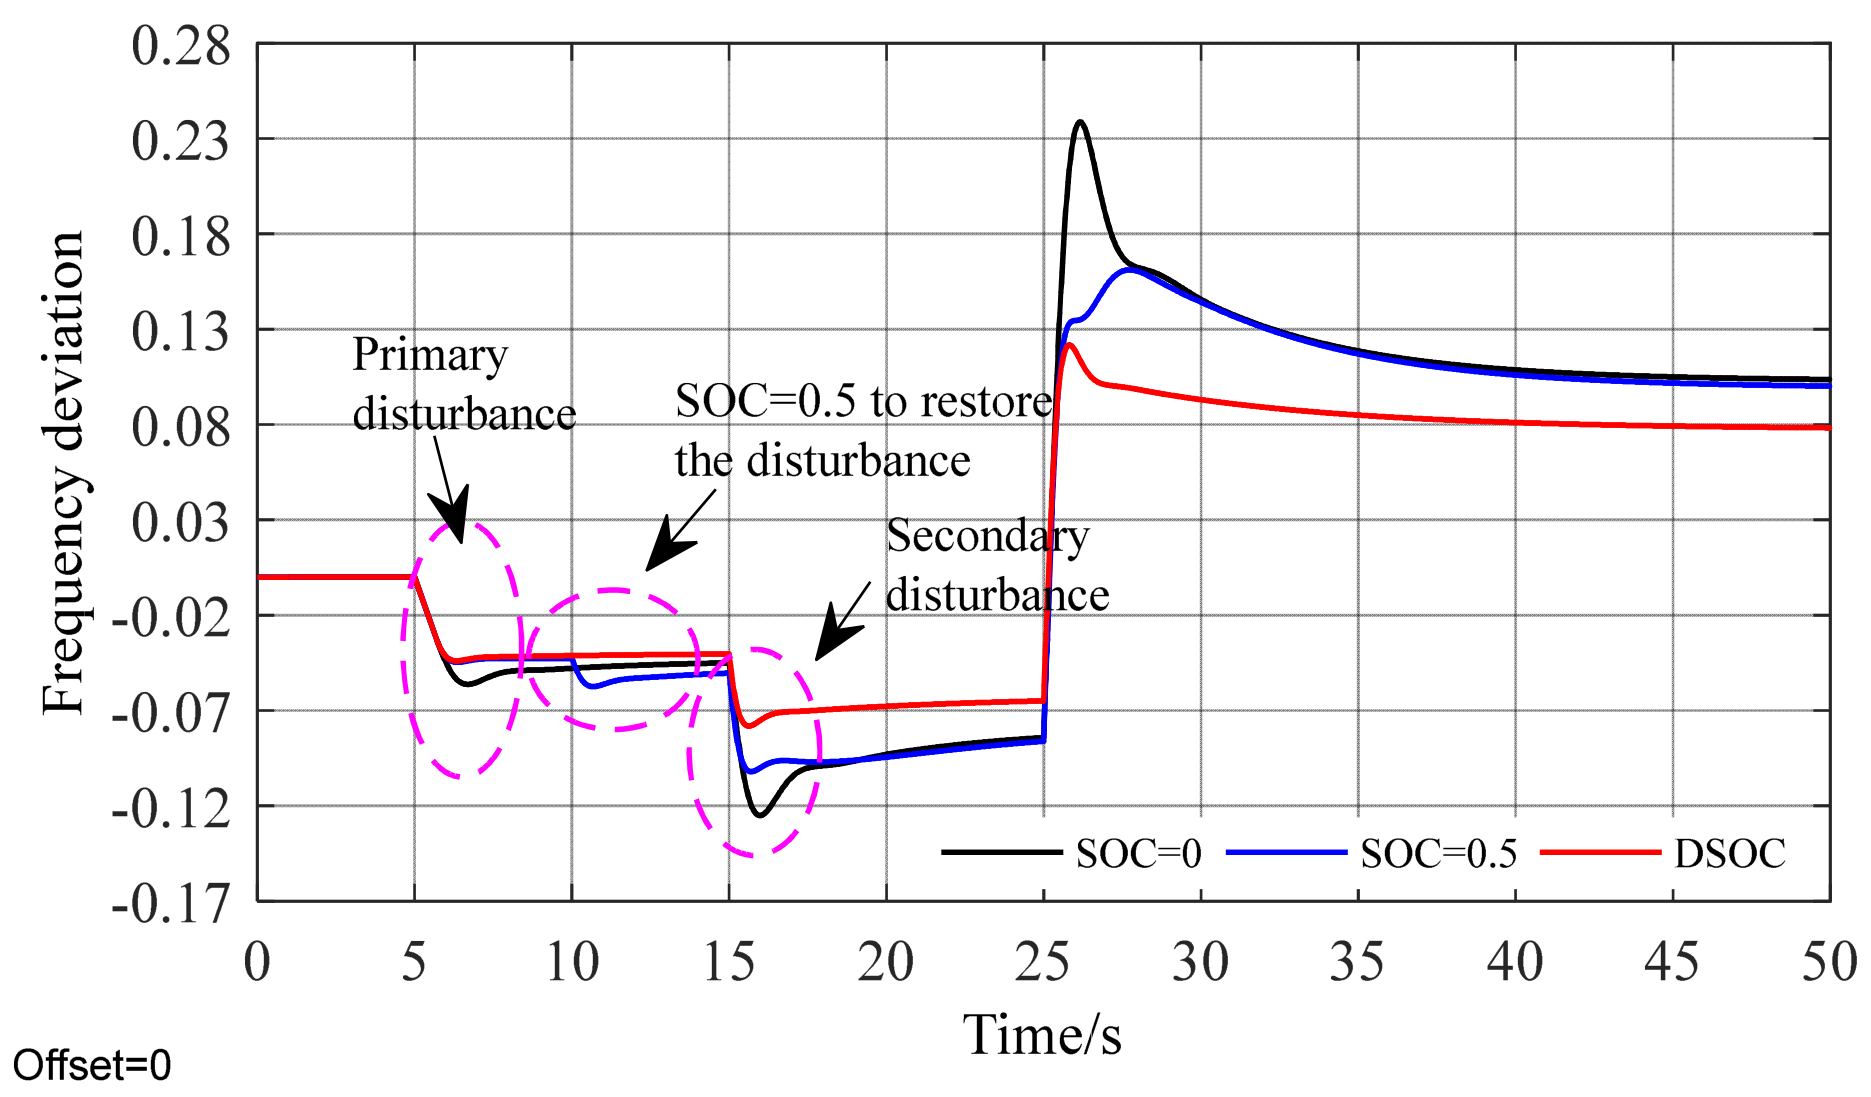
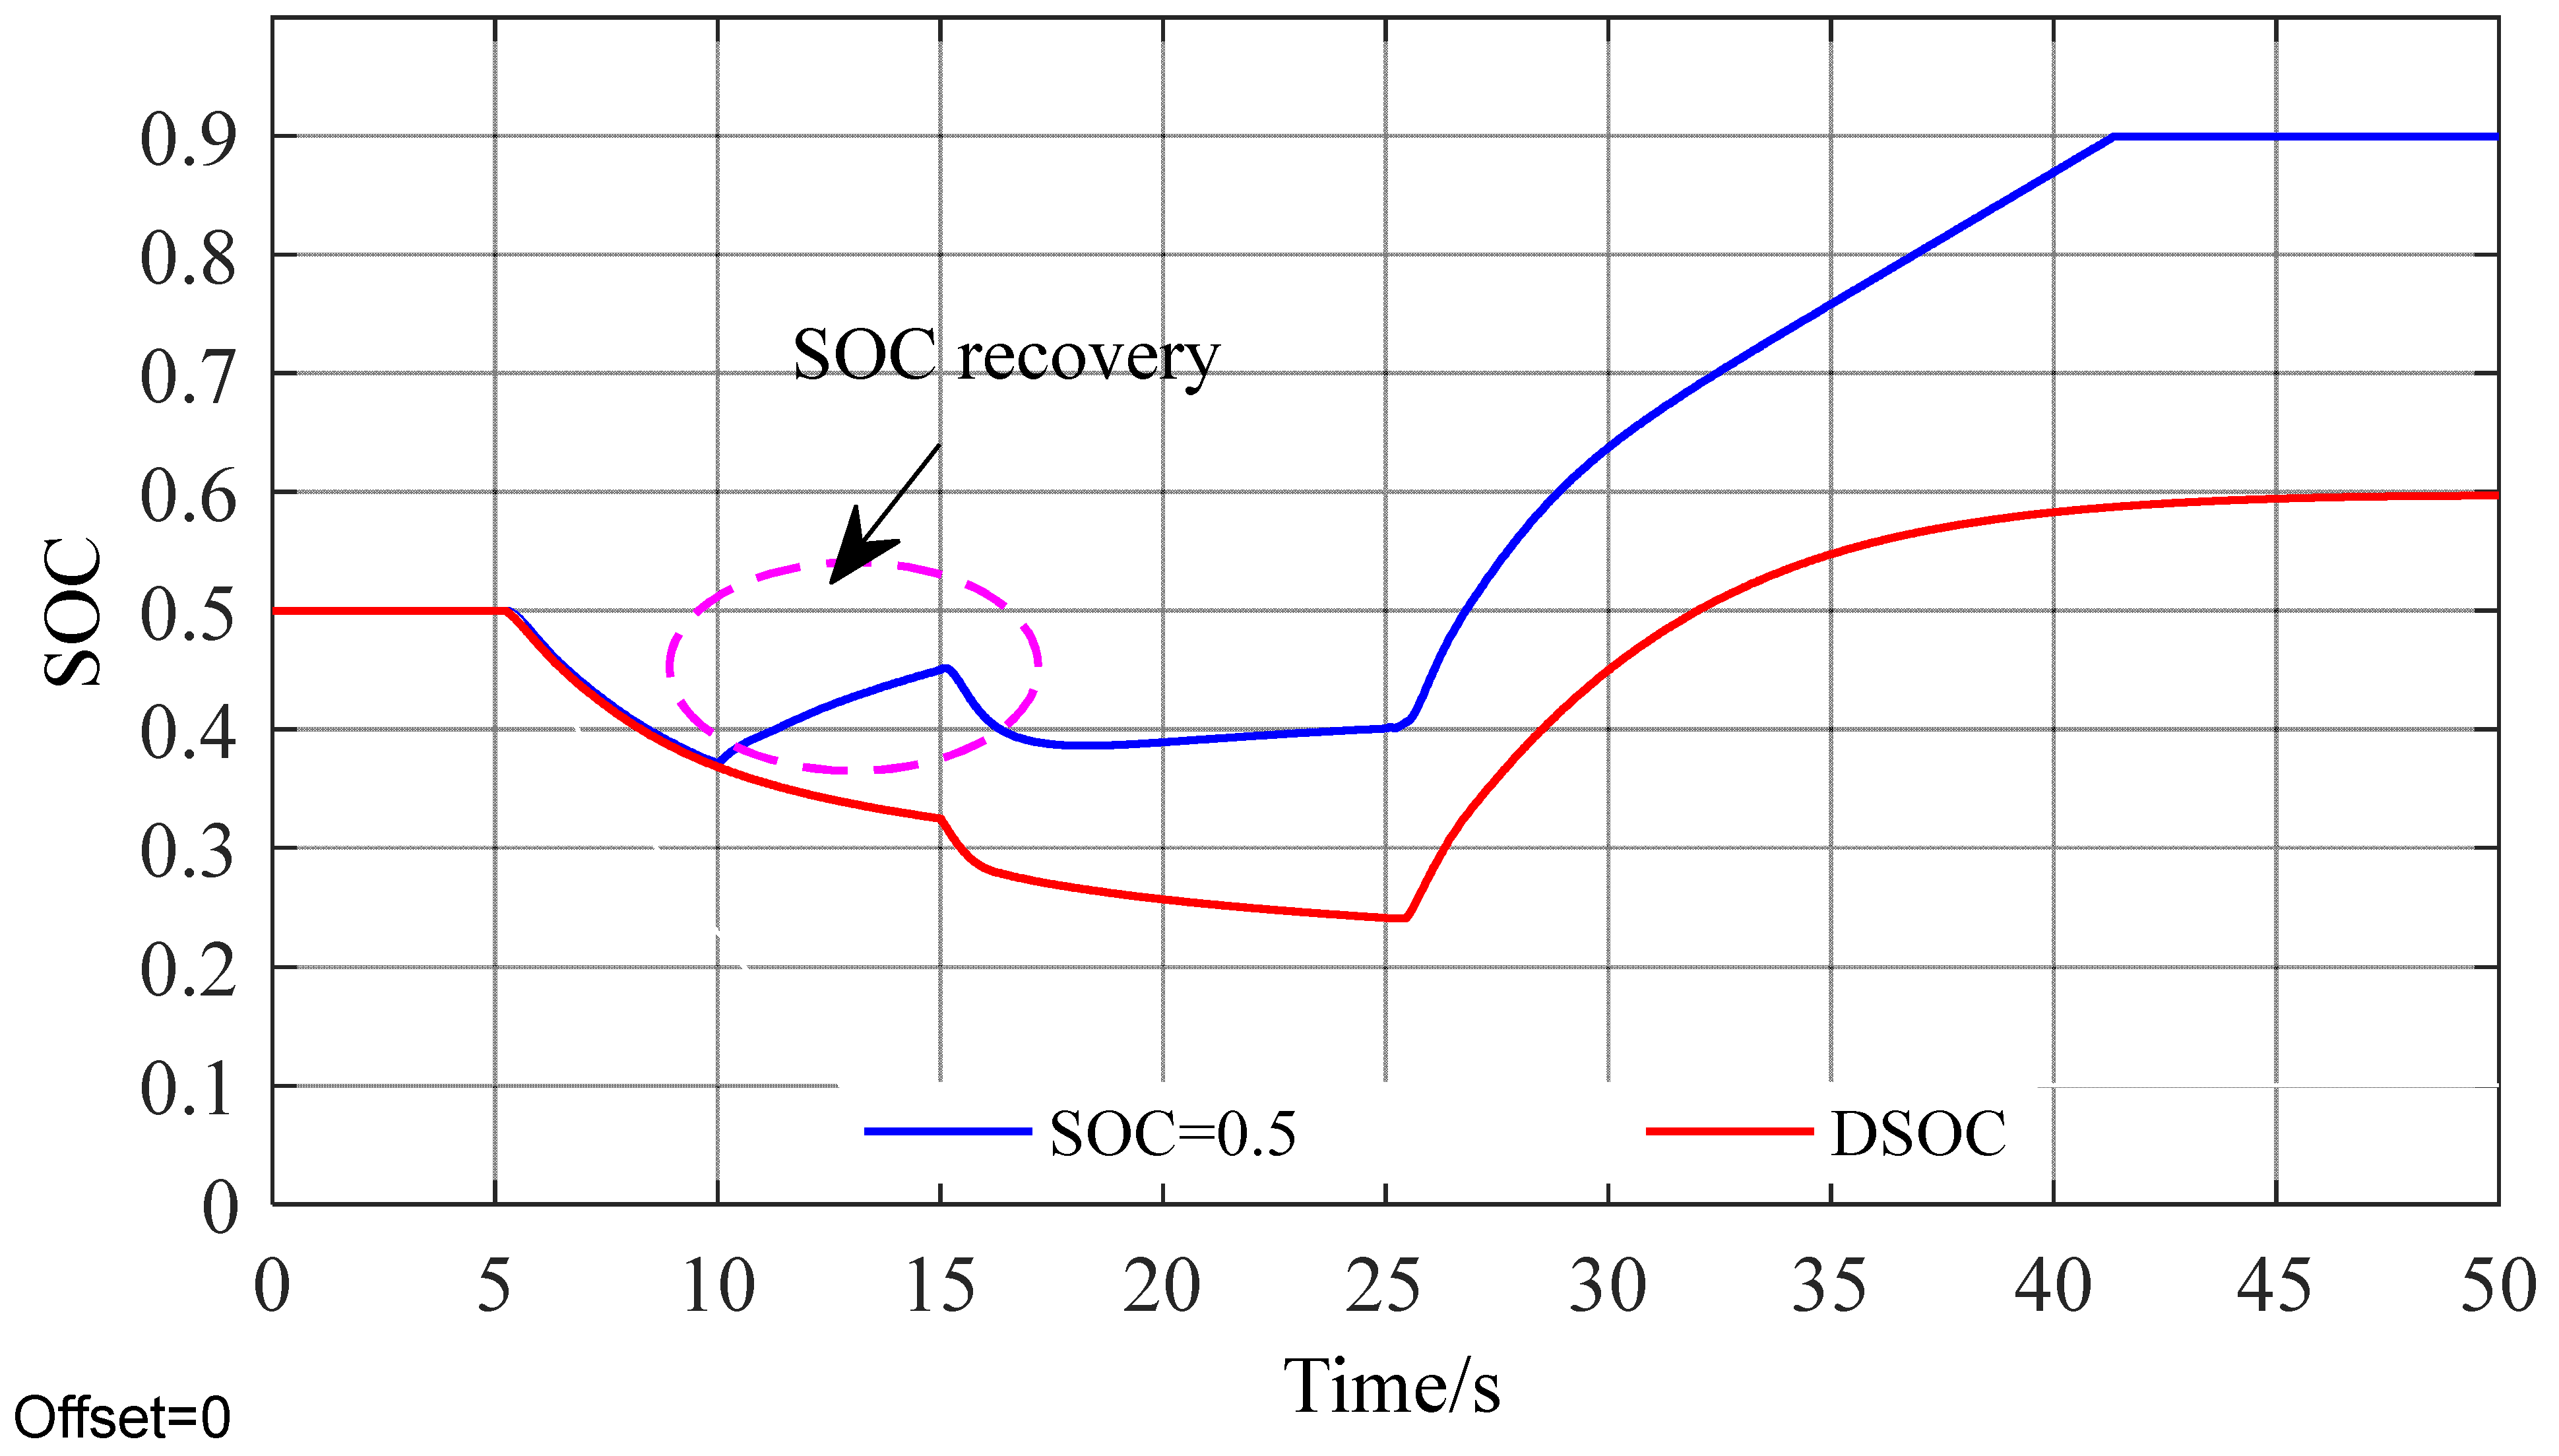
At 25 s, when a large step disturbance occurs, the SOC value in the constant SOC method is around 0.45, and the energy storage space is limited at this time, resulting in the late SOC saturation state and the withdrawal of frequency modulation, Δfmax =0.1658 Hz, while the DSOC method adopts the SOC base point recovery based on disturbance uncertainty. The SOC base point adaptively adjusts with the wind speed prediction, and the disturbance will increase when 10 s is predicted to be 15 s, but SOC can meet the frequency modulation demand at this time, so no recovery is carried out. However, when a large disturbance is predicted at 25 s for the next time, SOC remains at a low state in order to provide more storage space, and no recovery is required. And Δfmax =0.1203 Hz, increased by 0.0455 Hz, which not only effectively reduces the maximum frequency deviation but also effectively reduces the number of energy storage recovery and the number of energy storage charge and discharge.
(2)
Based on the planned SOC value, the SOC offset of the DSOC method is 56.65% smaller than that of the fixed SOC method, and the SOC maintenance effect is the best.
To sum up, the SOC adaptive recovery base point control strategy proposed in this paper comprehensively considers the current SOC state and the disturbance trend and adaptively adjusts the recovery base point of energy storage SOC, which not only improves the reliability of energy storage FM but also takes into account the maintenance effect of energy storage SOC.

Author Contributions

Conceptualization, C.C.; Validation, C.C.; Formal analysis, C.C.; Investigation, C.C. and L.L.; Data curation, L.L.; Writing—original draft, C.C.; Writing—review & editing, C.C. All authors have read and agreed to the published version of the manuscript.

Funding

This work was supported by the Hunan Provincial Natural Science Regional Joint Fund (2023JJ50341) and Hunan Provincial Department of Education Outstanding Youth Project (23B0742, 23B0744).

Data Availability Statement

Data are from our laboratory, which other authors can refer to.

Conflicts of Interest

The authors declare no conflicts of interest.

References

  1. National Energy Administration. Grid Connected Operation of Wind Power in 2019 [EB/OL]. Available online: http://www.nea.gov.cn/2020-02/28/c_138827910.htm (accessed on 2 February 2020).
  2. Dai, J.; Tang, Y.; Wang, Q.; Jiang, P. Aggregation frequency response modeling for wind power plants with primary frequency regulation service. IEEE Access 2019, 7, 108561–108570. [Google Scholar] [CrossRef]
  3. Liu, X.; Li, X.; Meng, Y.; Chen, C.; Yang, Y. Optimized wavelet packet analysis for photovoltaic wave power suppression. Int. J. Low-Carbon Technol. 2021, 17, 90–96. [Google Scholar] [CrossRef]
  4. Varma, R.K.; Akbari, M. Simultaneous fast frequency control and power oscillation damping by utilizing PV solar system as PV-STATCOM. IEEE Trans. Sustain. Energy 2020, 1, 415–425. [Google Scholar] [CrossRef]
  5. Li, C.; Yuan, S. Research on frequency modulation control of photovoltaic power generation system based on VSG. Int. J. Low-Carbon Technol. 2021, 16, 287–293. [Google Scholar] [CrossRef]
  6. Mejía-Giraldo, D.; Velásquez-Gomez, G.; Muñoz-Galeano, N.; Cano-Quintero, J.B.; Lemos-Cano, S. A BESS sizing strategy for primary frequency regulation support of solar photovoltaic plants. Energies 2019, 12, 317. [Google Scholar] [CrossRef]
  7. Ramírez, M.; Castellanos, R.; Calderón, G.; Malik, O. Placement and sizing of battery energy storage for primary frequency control in an isolated section of the Mexican power system. Electr. Power Syst. Res. 2018, 160, 142–150. [Google Scholar] [CrossRef]
  8. Safety Conditions and Evaluation Specification for Grid Connection of Wind Farms. (Office Safety [2011] No. 79).pdf (nea.gov.cn). Available online: https://www.doc88.com/p-58273787494017.html (accessed on 19 May 2024).
  9. Baidu.com. Technical Regulations and Test Guidelines for Primary Frequency Modulation of Grid-Connected Power Supply(GB/T40595-2021) EB/OL]. Available online: https://power.in-en.com/html/power-2400846.shtml (accessed on 1 May 2022).
  10. Parsons, B.; Milligan, M.; Zavadil, B. Grid impacts of wind power: A summary of recent studies in the United States. Wind Energy 2014, 7, 87–108. [Google Scholar] [CrossRef]
  11. Liu, Y.; Du, W.; Xiao, L.; Wang, H.; Bu, S. Sizing Energy Storage Based on a Life-Cycle Saving Dispatch Strategy to Support Frequency Stability of an Isolated System with Wind Farms. IEEE Access 2019, 7, 166329–166336. [Google Scholar] [CrossRef]
  12. Akram, U.; Mithulananthan, N.; Raza, M.Q.; Shah, R.; Milano, F. RoCoF Restrictive Planning Framework and Wind Speed Forecast Informed Operation Strategy of Energy Storage System. IEEE Trans. Power Syst. 2021, 36, 224–234. [Google Scholar] [CrossRef]
  13. Chen, C.; Li, X.; Liu, X.; Yang, Y. Reliability improvement of wind power frequency modulation based on look-ahead control strategy and stage of charge optimization of energy storage. Int. J. Energy Res. 2022, 46, 4739–4753. [Google Scholar]
  14. Tan, J.; Zhang, Y. Coordinated control strategy of a battery energy storage system to support a wind power plant providing multi-timescale frequency ancillary services. IEEE Trans. Sustain. Energy 2017, 8, 1140–1153. [Google Scholar] [CrossRef]
  15. Xu, Q.; Xiao, J.; Hu, X.; Wang, P.; Lee, M.Y. A decentralized power management strategy for hybrid energy storage system with autonomous bus voltage restoration and state of charge recovery. IEEE Trans. Ind. Electron. 2017, 64, 7098–7108. [Google Scholar] [CrossRef]
  16. Zhang, D.; Li, J.; Liu, X.; Guo, J.; Xu, S. A stochastic optimization method for energy storage sizing based on an expected value model. Energies 2019, 12, 702. [Google Scholar] [CrossRef]
  17. Chen, C.; Wang, Y.; Zhou, K.; Huang, Z. Frequency regulation optimization for wind storage based on frequency regulation reliability and state of charge in isolated island off-grid. Energy Sci. Eng. 2023, 11, 192–205. [Google Scholar] [CrossRef]
  18. Dang, J.; Seuss, J.; Suneja, L.; Harley, R.G. SOC feedback control for wind and ESS hybrid power system frequency regulation. IEEE J. Emerg. Sel. Top. Power Electron. 2014, 2, 79–86. [Google Scholar] [CrossRef]
  19. Wu, Z.; Gao, D.W.; Zhang, H.; Yan, S.; Wang, X. Coordinated control strategy of battery energy storage system and PMSG-WTG to enhance system frequency regulation capability. IEEE Trans. Sustain. Energy 2017, 8, 1330–1343. [Google Scholar] [CrossRef]
  20. Hang, Y.; Guo, J. Research on scientific data mining algorithms based on WOA-BP neural networks. In Proceedings of the 2023 3rd International Conference on Consumer Electronics and Computer Engineering (ICCECE), Guangzhou, China, 6–8 June 2023; pp. 667–672. [Google Scholar]
  21. Jitkongchuen, D.; Sirikayon, C.; Thummano, A. An Adaptive Whale Optimization Algorithm with Mahalanobis Distance for Optimization Problems. In Proceedings of the 2022 Joint International Conference on Digital Arts, Media and Technology with ECTI Northern Section Conference on Electrical, Electronics, Computer and Telecommunications Engineering (ECTI DAMT & NCON), Chiang Rai, Thailand, 26–28 January 2022; pp. 285–289. [Google Scholar]
Figure 1. Frequency modulation control principle curve.
Energies 17 02523 g001
Figure 2. Power–speed characteristic curve.
Energies 17 02523 g002
Figure 3. SOCref adjustment method.
Energies 17 02523 g003
Figure 4. Basic schematic diagram of MPC.
Energies 17 02523 g004
Figure 5. Schematic diagram of MPC rolling optimization process.
Energies 17 02523 g005
Figure 6. Proposed algorithmic flow.
Energies 17 02523 g006
Figure 7. Frequency modulation dynamic model of air storage system.
Energies 17 02523 g007
Figure 8. Step disturbance curve.
Energies 17 02523 g008
Figure 9. Frequency response curve.
Energies 17 02523 g009
Figure 10. Energy storage output curve.
Energies 17 02523 g010
Figure 11. SOC change curve.
Energies 17 02523 g011
Figure 12. Five-minute continuous load disturbance.
Energies 17 02523 g012
Figure 13. Frequency deviation.
Energies 17 02523 g013
Figure 14. Energy storage output curve.
Energies 17 02523 g014
Figure 15. SOC curve.
Energies 17 02523 g015
Table 1. Simulation model parameters.
Parameter NameValueParameter NameValue
WESN (MWh)0.5D (p.u.)1
EN (MW)1H (s)5
KG (p.u.)20FHP (p.u.)0.5
TG (s)0.08Kmax (p.u.)24
TCH (s)0.3TES (s)0.01
TRH (s)10TWT (s)0.01
SOCmax0.9SOCmin0.1
Table 2. Regulation index statistics.
Index
(Hz)
Time of DisturbanceFrequency Modulation Method
SOC = 0SOC = 0.5DSOC
Δfmax5 s−0.0561−0.0451−0.0446
15 s−0.1252−0.1022−0.0775
25 s0.23380.16580.1203
Table 3. Frequency modulation index statistics.
IndexFrequency Modulation Method
SOC = 0SOC = 0.5DSOC
Rf0.1150.5910.365
Rsoc-0.2030.088
Disclaimer/Publisher’s Note: The statements, opinions and data contained in all publications are solely those of the individual author(s) and contributor(s) and not of MDPI and/or the editor(s). MDPI and/or the editor(s) disclaim responsibility for any injury to people or property resulting from any ideas, methods, instructions or products referred to in the content.

