Abstract
In this paper, a comprehensive analysis of the parameters that affect polymer electrolyte membrane fuel-cell performance is presented. Experiments were conducted on a single fuel cell membrane with an active area of 5 cm2. To study the fuel cell operation, parametric studies of temperature, pressure and relative humidity values were conducted under cyclic voltammetry for impedance analysis. The impact of the behavior of all three parameters on the fuel-cell performance were recorded and analyzed. As the temperature increased from 50 °C to 74 °C, the Pt catalyst surface areas demonstrated lower activation losses as the membrane conductivity increased. It is confirmed that an increase in temperature accompanied higher humidity levels to provide sufficient cell hydration that resulted in a higher performance output. The impedance measurements indicate that low humidity levels resulted in higher cell resistance and mass transport losses. As the back pressure increased, the membrane resistance decreased, which also reduced mass transport losses. The results indicate that the important factors affecting the fuel cell performance are mass transport limitation and membrane resistance. Based on the results of this study, the optimum performance can be achieved by operating at higher pressures and temperatures with humidified reactant gases.
1. Introduction
In the past few decades, there has been an increasing focus on alternative and sustainable sources of clean energy. The global trend of decarbonization has catalyzed a profound shift towards the extensive use of renewable energy sources, with fuel cells emerging as a pivotal technology in this transition. As nations strive to reduce greenhouse gas emissions and combat climate change, renewable energy has gained widespread recognition for its potential to provide clean, sustainable power without the detrimental environmental impacts associated with fossil fuels [1,2]. Fuel cells, particularly proton exchange membrane fuel cells (PEMFCs), play a crucial role by offering efficient, low-emission energy conversion solutions. By harnessing hydrogen produced from renewable sources or through electrolysis powered by renewable electricity, fuel cells enable the storage and utilization of green energy on demand, helping to address the intermittency challenges inherent in renewables [3,4,5,6]. As the demand for clean energy continues to escalate, fuel cells hold promise for applications ranging from transportation to stationary power generation, offering versatile solutions for decarbonizing diverse sectors of the economy. Therefore, commercialization of PEM fuel cell technology relies on improving the efficiency of membrane-electrode assemblies (MEAs) and bipolar plates as well as optimizing operating conditions to accelerate the transition towards sustainable energy solutions [7,8].
Fuel cell operating conditions directly affect the efficiency and degradation of MEA. Temperature and humidity are crucial factors that can positively affect the performance and lifetime of PEMFCs if the membrane is properly hydrated [9,10]. Several studies examined the impact of humidity on fuel cell performance [11,12,13]. Water management and humidity control systems need to be optimized for efficient proton conductivity through the membrane and catalyst surface to prevent drying or flooding [14,15]. Excess water and high relative humidity levels can cause overload water retention in the membrane [16,17]. This water accumulation can hinder electrochemical reactions within the fuel cell, leading to reduced power output and efficiency [18,19,20]. The water produced in the cathode during oxygen reduction reaction (ORR) needs to be removed at the same generation rate to prevent obstruction of pores in the porous cathode catalyst layer (CCL) and gas diffusion layer (GDL), as well as covering active sites within the catalyst layer and blocking gas transport channels in the flow field. Additionally, water flooding within the catalyst layer, GDL, or gas flow channels can cause uneven distribution of reactants across the active catalyst area, which can result in a poor fuel cell performance [21,22]. To mitigate these effects and to achieve optimized performance, meticulous control and management of humidity and temperature are essential. Strategies such as humidification and temperature regulation systems help prevent flooding and ensure consistent performance under varying operating conditions. Therefore, advancements in fuel cell research are continuously being pursued to develop membranes with improved water management capabilities, enhancing the resilience of PEMFCs to fluctuating environmental conditions.
Partial pressure of reactant gases is another characteristic parameter of performance for fuel cell operation. Specifically, in PEM fuel cells, which operate at relatively low temperatures, the partial pressure of hydrogen and oxygen gases directly influences the kinetics of the electrochemical reactions occurring at the anode and cathode, respectively. The partial pressure of hydrogen gas at the anode affects the rate of hydrogen oxidation reaction, which is crucial for the cell’s power output. Higher partial pressures of hydrogen generally lead to enhanced reaction kinetics and improved cell performance due to the increased availability of reactants at the electrode surface. Similarly, the partial pressure of oxygen gas at the cathode significantly impacts the kinetics of the oxygen reduction reaction. Adequate oxygen partial pressure is necessary to ensure a sufficient supply of oxygen to the cathode catalyst layer, promoting efficient oxygen reduction and overall cell operation [23,24,25]. According to the Butler–Volmer equation, changes in pressure directly affect the proton conductivity, which in turns affects the activation overpotential [26]. Previous studies indicate that increasing the partial pressure of reactant gases improved the performance of a fuel cell [27,28,29]. This study evaluates the effect of partial pressure on the fuel cell performance with varying relative humidity and temperature.
Electrochemical impedance spectroscopy (EIS) and polarization curves have been widely used to study the behavior of PEM fuel cells. They are pivotal for understanding and optimizing fuel cell’s performance. Electrochemical impedance spectroscopy can be used to measure the effect of operation parameters, membrane resistance, interfacial kinetics of ORR and mass transport resistances on the fuel cell performance [30,31,32,33]. It delves into the microscopic electrochemical processes within the fuel cell by analyzing impedance across different frequencies, providing insights into resistance, capacitance, and electrochemical kinetics [34,35]. Lee et al. [36] used EIS to measure the contribution of membrane resistance by analyzing high-frequency impedance behavior. Additionally, Hakenjos et al. [37] used EIS to analyze the diffusion losses and mass transport resistance by evaluating the low- and high-frequency resistances on cell voltage. Conversely, a polarization curve offers a macroscopic view of the fuel cell’s behavior by illustrating the relationship between voltage and current density under varying operating conditions. These two techniques are synergistically needed to analyze and obtain a full understanding of the operating parameters and design features, ultimately leading to enhancements in the efficiency, durability, and performance of PEMFCs.
Equivalent circuit models of the fuel cell are commonly utilized to further describe the cell behavior and analyze the ohmic resistance in the membrane [38,39,40]. Seo et al. [41] studied the resistance among the membrane and catalyst layer using EIS and an equivalent circuit model. Kurz et al. [42] and Kadyk et al. [43] utilized the equivalent circuit models to study membrane dehydration and reverse effects. Equivalent circuit models provide insight into the dynamic response and performance characteristics of fuel cell systems under different operating conditions. In essence, they represent the complex electrochemical processes occurring within the fuel cell as a set of interconnected electrical components, allowing for analysis and prediction of system behavior. One commonly used equivalent circuit model for fuel cells is based on the combination of resistive, capacitive, and inductive elements, each representing different aspects of the cell’s behavior [44,45]. The simplest form of such a model includes serial resistance representing ohmic losses within the cell components; charge-transfer resistance, accounting for electrochemical reactions at the electrodes; and a double-layer capacitance capturing charge storage effects at the electrode–electrolyte interface. By simulating the behavior of equivalent circuit models under various operating conditions, valuable insights can be gained by underlying electrochemical processes, identifying performance-limiting factors, and optimizing system design and control strategies.
Previous studies aimed at optimizing PEMFC performance investigated various factors independently, including catalyst activity, stability, membrane degradation, mass transport phenomena, temperature, pressure, and humidity settings. There is no emphasis on evaluating all these conditions together at once. Hence, this paper offers a comprehensive study of the effect of temperature, humidity, and pressure synchronously by combining the analysis of polarization curves, EIS measurements and equivalent circuit models to provide a significant insight into optimizing the performance of PEMFCs.
2. Materials and Methods
A perfluorosulfonated acid (PFSA) membrane, Nafion® 212, with a thickness of 0.002 in (2 mil) from Sigma Aldrich (St. Louis, MO, USA) was utilized in MEA for this experiment. A single cell with an active area of 5 cm2 was used in this experiment. A catalyst layer composed of Pt nanoparticles on carbon support, with 0.3 mg/cm2 loading, was prepared on both anode and cathode sides of the MEA. The single-channel horizontal serpentine flow design made of graphite was configured in a fuel-cell fixture. This experiment used hydrogen (H2) gas as a fuel and for the oxygen source, compressed air was used, acting as an oxidant in the experiments. Nitrogen (N2) gas was employed to purge the fuel cell system before and after the experiments to ensure the removal of any residue. Deionized (DI) water was used to provide humidification in both the anode and cathode.
The Scribner Associates 850 Fuel Cell test system was used to analyze the fuel cell performance. The unit allows variations in the operating temperature and flow of reactant gases. The stoichiometric flow rates employed for both the fuel and oxidant gases were 0.05 L/min for hydrogen and 0.125 L/min for compressed air [46]. After the system was purged with N2 gas, cyclic voltammetry was applied to measure the properties of the electroactive catalyst area. Linear sweep voltammetry was used to collect voltage and current measurements of the cell. Polarization curves were obtained by the current scan rates of 10 mA/cm2 per 30 s from open circuit potential to 0.1 V. A back-pressure regulator was used on both the hydrogen and oxygen sides to adjust the values for the given pressure conditions of the experiments. High, medium, and low levels of temperature, pressure, and humidity operating parameters were selected (Table 1) to evaluate the performance of the fuel cell under various environmental scenarios.

Table 1.
Operating conditions and parameters for PEM fuel cell performance measurement experiments.
In this study, the cell temperature varied within the range of 50–74 °C across all operational scenarios. However, EIS analysis was extended to 80 °C to further understand the cell behavior and explore variations in ohmic resistance at elevated temperatures. This value, specifically assessed under varying thermal conditions, ensured the repeatability and relevance of the remaining test parameters, thus enhancing the overall validity of the study’s findings.
2.1. Electrochemical Impedance Measurements
The Scribner Associates 850 Fuel Cell test unit is equipped with a frequency response analyzer which allowed us to apply an electronic load within the cell. Once steady-state conditions were achieved, impedance measurements were initiated using the frequency response analyzer, enabling the assessment of the fuel cell’s electrochemical characteristics across a range of frequencies. Galvanostatic mode with a frequency range of 5% DC current to AC current was applied to perform impedance measurements. Operating conditions followed low, medium, and high values of temperature, pressure, and humidity levels to collect information on the cell behavior under various settings. The current value (j) of 0.5 A/cm2 was applied corresponding to 0.25A with 5% AC current in impedance measurements. The impedance measurement frequency range was set from 10 kHz down to 1 Hz, with ten impedance points recorded per decade of frequency. Under these conditions, a steady state was attained faster, and the impedance data were recorded at 5 min intervals to prevent any substantial change in the cell voltage.
2.2. Equivalent Circuit Modeling
Equivalent circuit modeling, as seen in Figure 1, was utilized to evaluate the fuel cell’s behavior and the ohmic losses, which are illustrated by the resistors described in the model [47,48]. Ohmic losses indicate the internal resistance of the cell, such as the resistance of electrodes, conductive plates, and the ion transport through the membrane. The resistance measurements through the circuit provide information on water management, which is a significant factor in fuel cell operation performance [49,50].
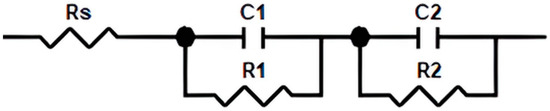
Figure 1.
Equivalent circuit model for PEMFC’s ohmic losses and resistance values characterization.
The circuit elements in Figure 1 indicate specific resistances and capacitors represented by the impedance measurements, Rs denotes the high-frequency resistance (HFR), encapsulating the total ohmic resistance of the fuel cell. R1 represents the charge-transfer resistance due to ORR; C1 demonstrates catalyst layer capacitance properties linked with R1; R2 indicates the resistance related to the mass transport; and, similar to C1, C2 denotes the capacitance properties linked with R2 [51,52]. Parallel connection between resistors and capacitors corresponds to the activation losses present in the model.
The overall fuel cell ohmic resistance was determined by measuring the real part of the impedance at a frequency of 10 kHz [53]. The total value of the ohmic resistance (Rs) represents the contributions from various sources, such as wire/contact resistance (Rwc), the ohmic resistances of each cell component (Ro), and contact resistances among the cell components (Rc). The ohmic resistance of cell components specifically includes the resistance of the membrane (Rm), bipolar plate (Rbp), current collector plate (Rcp), and contact resistances between different members such as the electrode/membrane, electrode/bipolar plate, and the bipolar plate/current collector plate Rc. The relationship between all resistance values is expressed below [54,55].
3. Results and Discussion
The impedance scans, polarization curves, and voltage output data are presented below.
3.1. Electrochemical Impedance Spectrometry
The EIS technique was applied to determine the effect of resistances to cell performance and to analyze the individual contributions of each operating parameter that caused performance loss. The EIS data characterize the components of the total impedance with respect to high- and low-frequency values to further determine the internal resistances associated with the fuel cell. These resistances can be characterized by higher- and lower-frequency loops represented by the Nyquist plot, which is the method most widely used to analyze impedance data representing the negative of imaginary and real parts of the fuel cell [56,57]. Under various testing and operational conditions, the Nyquist plots may comprise low-, medium-, and high-frequency loops [58,59]. There are usually two loops representing different frequencies: the high frequency loop characterizes the charge-transfer processes related to ORR represented by Rct and the low-frequency loop indicates diffusion/mass transport limitations due to flooding denoted as Rtm [60]. The total cell resistance can be described in three types of resistances: mass transport resistance (Rtm), charge-transfer resistance (Rct) and ohmic resistance (Rohm). Ohmic resistance of the cell is associated with the high frequency region of Nyquist plot. Figure 2 illustrates the Nyquist graph under the fuel cell operating conditions for 80 °C, 75% RH, and back pressure of 5 psig conditions.
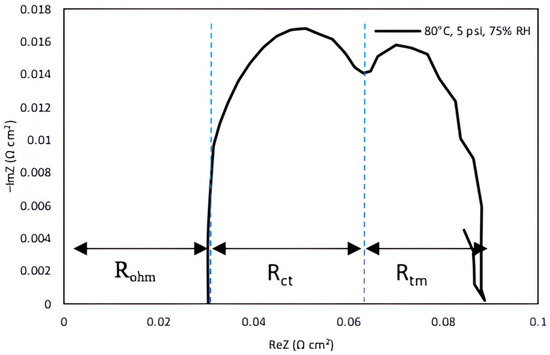
Figure 2.
Interpretation of internal resistances as a Nyquist plot.
3.2. Equivalent Circuit Modeling Analysis
As described in the experimental methods section, utilizing equivalent circuit modeling provides a detailed analysis of the resistances associated within membrane structure. The total cell resistance (Rs) is responsible for the ohmic losses and comprises two values: R1 is the resistance associated with the charge transport (Rct) and R2 is the resistance value representing the mass transport losses (Rtm). The resistance and capacitance values from equivalent circuit analysis are presented in Table 2 for various operating conditions. The lowest resistance values were observed in the sufficiently wetted conditions of 80 °C, 75% RH. As the temperature increased, there was a decrease in ohmic resistance, except in the insufficiently wetted conditions (80 °C, 25% RH) where the cell suffers from a lack of humidity.
Table 2.
Equivalent circuit element values for impedance analysis.
3.3. Effect of Cell Temperature
The effect of different temperatures under varying conditions of humidified and dry inlet gases were examined. Figure 3 displays the polarization curves and power curvesmeasured at cell temperatures of 50 °C, 62 °C, and 74 °C with humidified reactant gases supplied to both the anode and cathode of the cell at low, medium, and high fixed operating conditions of relative humidity and back pressure of the reactant gases given in Table 1. An increase in power density at the same current density was observed for high fixed humidity and pressure operating parameters. Increasing temperature resulted in a decrease in cell concentration losses. For high and medium fixed parameters, the performance increase was observed as the temperature increased. The proton transfer and reaction kinetics for ORR improved as the temperature increased and the ion transport in electrodes increased and resulted in lower mass transport losses [61,62]. This result is supported by the impedance measurements as shown in Figure 4, as the higher temperature conditions showed lower mass transport peaks. However, power curves in Figure 3a,b indicate that power density decreased as the temperature increased from 62 °C to 74 °C. This finding can be explained by the low relative humidity operation levels (25% RH), which led to insufficient membrane hydration. Consequently, there was a reduction in membrane conductivity, resulting in larger ohmic losses caused by higher ionic resistance (Figure 4). Overall, the optimal performance was observed at the temperature of 74 °C, back pressure of 25 psig and humidity of 75% RH which gives the highest value of power density output was 0.66 mW/cm2.
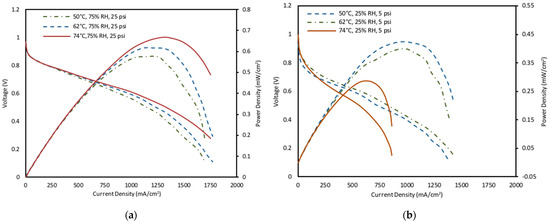
Figure 3.
Effect of cell temperature on power density and polarization curve characteristics (a) High fixed operating parameters of 25 psig and 75% RH, (b) low fixed operating parameters of 5 psig and 25% RH.
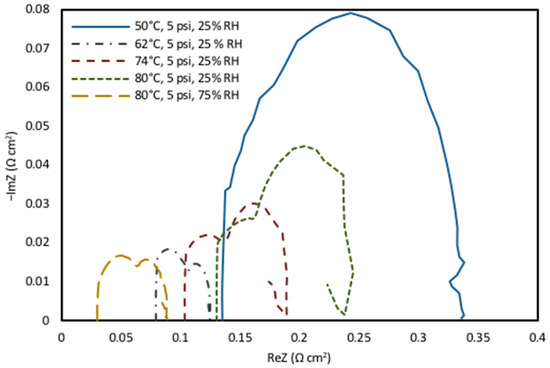
Figure 4.
Nyquist plot of EIS data and change in fuel cell impedance magnitude for normal operation and drying conditions.
As the temperature and humidity operating conditions increase, the membrane will experience increased hydration, leading to reduced ohmic resistance. Therefore, the drying effect is seen at high-temperature and low-humidity conditions (80 °C and 25% RH), as indicated in Figure 4, where the high-frequency resistance peak of impedance was increased by the low humidity levels [63,64]. As the temperature changed from 50 °C to 80 °C, the water content in the membrane evaporated, leading to membrane dehydration. This resulted in decreased membrane conductivity and increased membrane resistance.
As discussed above, the EIS analysis was conducted to further support the polarization curve results and performance analysis. The ohmic resistance of the fuel cell can be identified by the point at which the high-frequency portion of Nyquist plot intersects the horizontal axis, which can be seen in Figure 4. The values of Rohm for each temperature and humidity conditions can be seen in Table 3, and the result supports the data from previous studies with Nafion® 212 [65]. The changes observed in the diameter of the higher-frequency loop were due to a compound effect of both conductivity and mass-transport limitations that occurred in the catalyst layer. Since the membrane resistance is the main cause for ohmic resistance in the cell [66], the impedance data suggest that the loss of performance under dry conditions is due to increased cell resistance. This was demonstrated by the increase in membrane resistance when the temperature decreases at the same humidity level (Figure 4). The ohmic resistance at 80 °C was measured at approximately 0.14956 Ω cm2 for 25% RH, whereas it was 0.033104 Ω cm2 for 75% RH. The ohmic resistance was observed to considerably increase as the humidity decreased, resulting in high mass transfer losses.
Table 3.
Values of membrane resistance for fuel cell impedance as a function of temperature.
Figure 5 represents the AC impedance spectra of the Bode plot for variation in the impedance magnitude and phase angle between voltage and current for a given frequency range. Given that the Nyquist plot does not visibly display frequency, the Bode plot is used to examine the frequency change with the impedance data. Impedance data peaks are characterized by examining the highest values of imaginary impedance within the Nyquist plot. The correlation between the temperature, impedance, and frequency data shown in Figure 5 indicates that as the temperature decreases, there is an increase in the internal resistances associated with the cell due to the low RH % value (25%). The data confirm the results of the Nyquist graph, as the highest magnitude of impedance is shown for 50 °C, 25% RH, while the lowest value is at 80 °C, 75% RH.
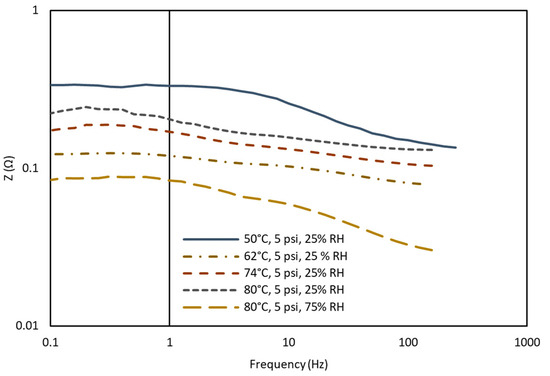
Figure 5.
A plot of AC impedance vs. frequency changes for normal operation and drying conditions.
3.4. Effect of Relative Humidity of Reactant Gases
As previously mentioned in this paper, PEMFCs require a delicate balance between water vapor and humidification, as the conductivity of a fuel cell correlates with its water level. Pre-humidification of reactant gases is a significant step to provide sufficient moisture to the cell. It is well known from previous studies that the fuel cell performance changes based on the absence or excess of water which can lead to dehydration (drying conditions) or flooding [67,68,69]. The lower humidity values caused an increase in membrane resistance in catalyst layers due to poor oxygen electrocatalysis, which led to an overall decrease in the PEMFC power output [70].
Power curves in Figure 6 shows that at fixed temperatures, there was a notable enhancement in the fuel cell performance as relative humidity increased, particularly in regions of high current density. Higher humidity levels at elevated current densities facilitated an increase in the membrane hydration, thereby enhancing conductivity and enabling higher levels of proton transport through the membrane. Consequently, the reaction rate was accelerated, leading to a significant increase in the cell performance at the cost of higher amounts of water produced. Overall, the experimental data for the relative humidity effect at high temperatures agree with previous literature studies [71] and the impedance analysis represented in Figure 4. As the temperature and/or the humidity levels decreased, higher values of the ohmic and the membrane resistance were observed in the analysis. The concentration loss became important when there was a limiting current, which was the case for the low-temperature and low-humidity cases for this study (50 °C, 25% RH). Additionally, the flooding effect was significant at higher current densities, primarily due to higher mass transport limitations [72,73]. At higher current densities, the rate of water removal is slower that of water generation, and flooding can occur, which covers the active sites within the catalyst layer, blocking gas transport channels in the flow field and leading to performance loss within the cell.
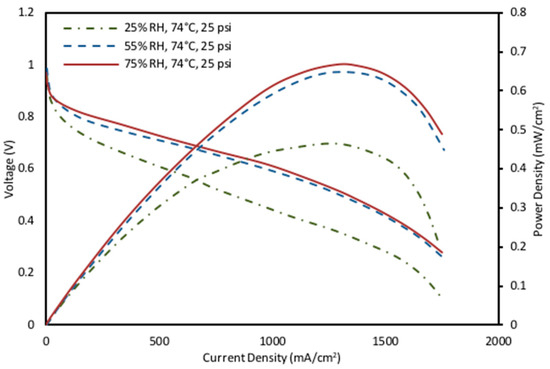
Figure 6.
Effect of relative humidity on power density and polarization curves characteristics of high fixed operating parameters of 74 °C and 25 psig.
Under the medium-range operating parameters of 62 °C and 15 psig and the low operating parameters of 50 °C and 5 psig, the data followed the same pattern as that observed at the high fixed operating parameters (Figure 6). Among these experiments, the most optimal value was determined to be 75% RH, 25 psig and 74 °C, which resulted in the greatest power density of 0.66 mW/cm2.
In the literature, relative humidity is known to hydrate the membrane, which promotes membrane conductivity and transport of protons, leading to improvement in cell performance. Ohmic resistance is clearly seen to decrease when the humidity was 75%. The values for charge and mass transport resistance also increased when the humidity decreased. The Nyquist graph was constructed at 2.5 V, as shown in Figure 4, corresponding to the impedance diagrams of different operating conditions to further demonstrate the effects of drying and hydration conditions and the cause of performance loss. The dehydration effect can be observed as the membrane resistance increases, as there is a lateral shift to the right. The AC impedance measurements indicated that low humidity levels resulted in mass transport losses, as supported by the higher low-frequency-loop results of impedance curve in Figure 4. The impedance analysis is in clear agreement with the temperature and humidity effects on MEA represented by the polarization curves above. It is expected that if MEA is not sufficiently hydrated, it will result in a poorer cell performance caused by mass transport limitations.
3.5. Effect of Back Pressure of Reactant Gases
The effect of pressure across various humidity and temperature conditions was also studied for fuel cell operation. The activation overpotential is affected by the proton conductivity because of a change in the back pressure applied to the cell. A rise in membrane resistance is caused by decreasing the partial pressures and membrane dehydration [74]. Furthermore, increasing back pressure was observed to increase the fuel cell performance (Figure 7). The highest power density value was recorded as 0.647 mW/cm2 at 25 psig, 74 °C, and 75% RH. The medium operating parameters of 62 °C and 55% RH and low operating parameters of 50 °C and 25% RH followed the same pattern as the high fixed operating parameters shown in Figure 7.
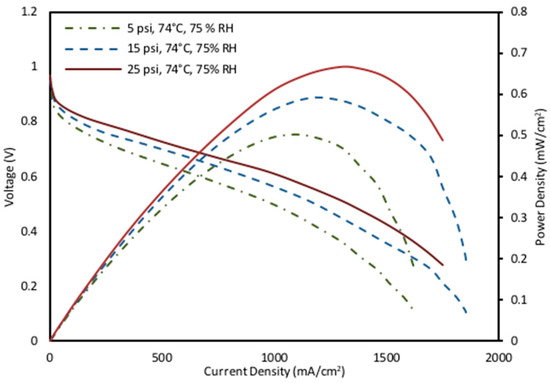
Figure 7.
Effect of back pressure on power density and polarization curve characteristics at high fixed operating parameters (74 °C and 75% RH).
The fuel cell performance is observed to increase with higher pressure due to faster electrode kinetics of lower charge-transfer resistance. The impedance measurements were conducted at three different pressure values (5, 15, 25 psig) at a fixed temperature of 74 °C. The impedance measurements confirmed that when the back pressure was increased, the ohmic resistance of the cell decreased and the mass transport losses reduced (Figure 8). This was due to higher mass transport through the membrane at higher pressures. Figure 8a demonstrates the variation in the magnitude of the cell resistance for the frequency range, along with the phase angle. The data at the lowest pressure clearly show the highest impedance magnitude and phase angle. This discovery suggests that the combination of high pressure, elevated relative humidity, and increased temperature resulted in the highest performance and power density values, while maintaining ohmic resistances within an optimal range during the optimization experiments.
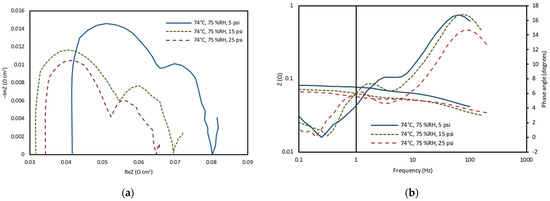
Figure 8.
(a) Electrochemical impedance spectroscopy scans and corresponding changes in the fuel cell impedance magnitude. (b) Changes in fuel cell impedance with frequency for pressure values of 5 psig, 15 psig and 25 psig, at a fixed temperature.
4. Conclusions
The performance of PEMFCs is significantly dependent on the operation parameters, such as the cell temperature, relative humidity, and partial pressures of reactant gases. Higher temperature and lower humidity levels resulted in mass transport limitations, which is indicated by the higher ohmic and membrane resistance of the cell. This study demonstrated that EIS measurement is a useful tool to characterize fuel cell behaviors. It provides an insight into how power curves behave. In this study, individual contributions of each reaction parameter were investigated and resulted in a higher power density of 0.647 mW/cm2 at 25 psig, 74 °C, and 75% RH. This result demonstrates that combining high pressure with adequate relative humidity and an elevated operating temperature can yield optimized power output and cell performance. Ensuring proper hydration is essential when raising cell temperature to achieve optimal performance at higher temperatures. This necessitates increasing humidification concurrently with the temperature rise. Impedance spectroscopy analysis indicated a decline in membrane resistance as the back pressure increased, suggesting that elevated back pressures correlated with diminished mass transport.
While our study has presented a comprehensive method to analyze fuel cell performance and suggested the optimum operating conditions, it is important to note that the findings were specifically validated for small-scale single-cell operations. Implementing these settings for a larger fuel cell stack presents challenges due to the sensitivity of the operating conditions within the stack. Appropriate stack and system designs are essential to maintain uniform temperature and humidity within each cell and throughout the stack. This involves proper design of flow fields and materials for the bipolar plates to prevent temperature build-up and flooding. Additionally, a real-time control system is needed to regulate the conditions of the reactant gases. By doing so, we can effectively integrate PEM fuel cells into broader energy systems, thereby unlocking their full potential as dependable and scalable power sources.
Author Contributions
Formal analysis, G.U.; Supervision, Y.H. and D.M. All authors have read and agreed to the published version of the manuscript.
Funding
This research was funded by the Institute of Gas Innovation and Technology (I-GIT) at Stony Brook University.
Data Availability Statement
The original contributions presented in the study are included in the article, further inquiries can be directed to the corresponding author.
Acknowledgments
The authors acknowledge the facilities at the Advanced Energy Research and Technology Center at Stony Brook University.
Conflicts of Interest
The authors declare no conflicts of interest.
References
- Jacobson, M.Z.; Delucchi, M.A.; Bauer, Z.A.F.; Goodman, S.C.; Chapman, W.E.; Cameron, M.A.; Bozonnat, C.; Chobadi, L.; Clonts, H.A.; Enevoldsen, P.; et al. 100% Clean and Renewable Wind, Water, and Sunlight All-Sector Energy Roadmaps for 139 Countries of the World. Joule 2017, 1, 108–121. [Google Scholar] [CrossRef]
- Armaroli, N.; Balzani, V. The Future of Energy Supply: Challenges and Opportunities. Angew. Chem. Int. Ed. 2006, 46, 52–66. [Google Scholar] [CrossRef] [PubMed]
- Gaurav, N.; Sivasankari, S.; Kiran, G.; Ninawe, A.; Selvin, J. Utilization of bioresources for sustainable biofuels: A Review. Renew. Sustain. Energy Rev. 2017, 73, 205–214. [Google Scholar] [CrossRef]
- Abbas, Q.; Mirzaeian, M.; Hunt, M.; Hall, P.; Raza, R. Current State and Future Prospects for Electrochemical Energy Storage and Conversion Systems. Energies 2020, 13, 5847. [Google Scholar] [CrossRef]
- Cheng, X.; Shi, Z.; Glass, N.; Zhang, L.; Zhang, J.; Song, D.; Liu, Z.-S.; Wang, H.; Shen, J. A review of PEM hydrogen fuel cell contamination: Impacts, mechanisms, and mitigation. J. Power Sources 2007, 165, 739–756. [Google Scholar] [CrossRef]
- Mo, S.; Du, L.; Huang, Z.; Chen, J.; Zhou, Y.; Wu, P.; Meng, L.; Wang, N.; Xing, L.; Zhao, M.; et al. Recent Advances on PEM Fuel Cells: From Key Materials to Membrane Electrode Assembly. Electrochem. Energy Rev. 2023, 6, 28. [Google Scholar] [CrossRef]
- Endoh, E.; Terazono, S.; Widjaja, H.; Takimoto, Y. Degradation study of MEA for PEMFCs under low humidity conditions. Electrochem. Solid-State Lett. 2004, 7, A209. [Google Scholar] [CrossRef]
- Wang, Y.; Chen, K.; Mishler, J.; Cho, S.; Adroher, X. A review of polymer electrolyte membrane fuel cells: Technology, applications, and needs on fundamental research. Appl. Energy 2011, 88, 981–1007. [Google Scholar] [CrossRef]
- St-Pierre, J.; Wilkinson, D.P.; Knights, S.; Bos, M. Relationships between water management, contamination and lifetime degradation in PEFC. J. New Mater. Electrochem. Syst. 2000, 3, 99–106. [Google Scholar]
- Berg, P.; Promislow, K.; Pierre, J.; Stumper, J.; Wetton, B. Water management in PEM fuel cells. J. Electrochem. Soc. 2004, 151, 341–353. [Google Scholar] [CrossRef]
- Freire, T.J.P.; Gonzalez, E.R. Effect of membrane characteristics and humidification conditions on the impedance response of polymer electrolyte fuel cells. J. Electroanal. Chem. 2001, 503, 57–68. [Google Scholar] [CrossRef]
- Picot, D.; MMetkemeljer, R.R.; Bezian, J.; Rouveyr, L. Impact of the water symmetry factor on humidification and cooling strategies for PEM fuel cell stacks. J. Power Sources 1998, 75, 251–260. [Google Scholar] [CrossRef]
- Bao, C.; Ouyang, M.; Yi, B. Analysis of water management in proton exchange membrane fuel cells. Tsinghua Sci. Technol. 2006, 11, 54–64. [Google Scholar] [CrossRef]
- Sridhar, P.; Perumal, R.; Rajalakshmi, N.; Raja, M. Dhathathreyan. Humidification studies on polymer electrolyte membrane fuel cell. J. Power Sources 2001, 101, 72–78. [Google Scholar] [CrossRef]
- Choi, K.H.; Park, D.; Rho, Y.; Kho, Y.T.; Lee, T.H. A study of the internal humidification of an integrated PEMFC stack. J. Power Sources 1998, 74, 146–150. [Google Scholar] [CrossRef]
- Staschewski, D. Internal humidifying of PEM fuel cells. Int. J. Hydrogen Energy 1996, 21, 381–385. [Google Scholar] [CrossRef]
- Majsztrik, P.; Bocarsly, A.; Benziger, J. Water permeation through nafion membranes: The role of water activity. J. Phys. Chem. B 2008, 112, 16280–16289. [Google Scholar] [CrossRef]
- Yan, S.; Yang, M.; Sun, C.; Xu, S. Liquid Water Characteristics in the Compressed Gradient Porosity Gas Diffusion Layer of Proton Exchange Membrane Fuel Cells Using the Lattice Boltzmann Method. Energies 2023, 16, 6010. [Google Scholar] [CrossRef]
- Pourrahmani, H.; Van Herle, J. Water management of the proton exchange membrane fuel cells: Optimizing the effect of microstructural properties on the gas diffusion layer liquid removal. Energy 2022, 256, 124712. [Google Scholar] [CrossRef]
- Ijaodola, O.; El, Z.; Ogungbemi, E.; Khatib, F.; Wilberforce, T.; Thompson, J.; Olabi, A. Energy efficiency improvements by investigating the water flooding management on proton exchange membrane fuel cell (PEMFC). Energy 2019, 179, 246–267. [Google Scholar] [CrossRef]
- Yi, J.; Yang, J.D.; King, C. Water management along the flow channels of PEM fuel cells. AIChE J. 2004, 50, 2594–2603. [Google Scholar] [CrossRef]
- Wilkinson, D.; Voss, H.; Prater, K. Water management and stack design for solid polymer fuel cells. J. Power Sources 1994, 19, 117. [Google Scholar] [CrossRef]
- Carmo, M.; Fritz, D.L.; Mergel, J.; Stolten, D. A comprehensive review on PEM water electrolysis. Int. J. Hydrogen Energy 2013, 38, 4901–4934. [Google Scholar] [CrossRef]
- Steele, B.C.; Heinzel, A. Materials for fuel-cell technologies. Nature 2001, 414, 345–352. [Google Scholar] [CrossRef] [PubMed]
- Le, A.D.; Zhou, B. A general model of proton exchange membrane fuel cell. J. Power Sources 2008, 182, 197–222. [Google Scholar] [CrossRef]
- Mann, R.; Amphlett, J.; Peppley, B.; Thurgood, C. Application of Butler–Volmer equations in the modelling of activation polarization for PEM fuel cells. J. Power Sources 2006, 161, 775–781. [Google Scholar] [CrossRef]
- Cong, Z.; Li, X. A new one dimensional steady state model for PEM fuel cell. World Electr. Veh. J. 2010, 4, 437–444. [Google Scholar] [CrossRef]
- Lee, J.; Joo, J.; Lee, J. Effect of hydrogen partial pressure on a polymer electrolyte fuel cell performance. Korean J. Chem. Eng. 2010, 27, 843–847. [Google Scholar] [CrossRef]
- Bi, W.; Deng, Y.; Sun, Q.; Fuller, T.F. The effect of humidity and oxygen partial pressure on degradation of Pt/C catalyst in PEM fuel cell. Electrochim. Acta 2009, 54, 1826–1833. [Google Scholar] [CrossRef]
- Wu, J.; Yuan, X.; Wang, H.; Blanco, M.; Martin, J.; Zhang, J. Diagnostic tools in PEM fuel cell research: Part I electrochemical techniques. Int. J. Hydrogen Energy 2008, 33, 1735–1746. [Google Scholar] [CrossRef]
- Brunetto, C.; Tina, G.; Squadrito, G.; Moschetto, G. PEMFC diagnostics and modeling by electrochemical impedance spectroscopy. In Proceedings of the 12th IEEE Mediterranean Electrochemical Conference, Dubrovnik, Croatia, 12–15 May 2004; Volume 3, pp. 1045–1050. [Google Scholar]
- Springer, T.; Zawodzinski, T.; Wilson, M.; Gottesfeld, S. Characterization of polymer electrolyte fuel cells using AC impedance spectroscopy. J. Electrochem. Soc. 1996, 143, 587–599. [Google Scholar] [CrossRef]
- Andreaus, B.; McEvoy, A.; Scherer, G. Analysis of performance losses in polymer electrolyte fuel cells at high current densities by impedance spectroscopy. Electrochim. Acta 2002, 47, 2223–2229. [Google Scholar] [CrossRef]
- Tang, X.; Zhang, Y.; Xu, S. Temperature sensitivity characteristics of PEM fuel cell and output performance improvement based on optimal active temperature control. Int. J. Heat Mass Transf. 2023, 206, 123966. [Google Scholar] [CrossRef]
- Choi, J.; Sim, J.; Oh, H.; Min, K. Resistance Separation of Polymer Electrolyte Membrane Fuel Cell by Polarization Curve and Electrochemical Impedance Spectroscopy. Energies 2021, 14, 1491. [Google Scholar] [CrossRef]
- Lee, S.; Mukerjee, S.; McBreen, J.; Rho, Y.; Kho, Y.; Lee, T. Effects of Nafion impregnation on performances of PEMFC electrodes. Electrochim. Acta 1998, 43, 3693. [Google Scholar] [CrossRef]
- Hakenjos, A.; Zobel, M.; Clausnitzer, J.; Hebling, C. Simultaneous electrochemical impedance spectroscopy of single cells in a PEM fuel cell stack. J. Power Sources 2006, 154, 360. [Google Scholar] [CrossRef]
- Giner-Sanz, J.; Pérez-Herranz, V.; Ortega, E.M. Mechanistic equivalent circuit modelling of a commercial polymer electrolyte membrane fuel cell. J. Power Sources 2018, 379, 328–337. [Google Scholar] [CrossRef]
- del Real, A.; Arce, A.; Carlos, B. Development and experimental validation of a PEM fuel cell dynamic model. J. Power Sources 2007, 173, 310–324. [Google Scholar] [CrossRef]
- Zhao, L.; Dai, H.; Pei, F.; Ming, P.; Wei, X.; Zhao, J. A Comparative Study of Equivalent Circuit Models for Electro-Chemical Impedance Spectroscopy Analysis of Proton Exchange Membrane Fuel Cells. Energies 2022, 15, 386. [Google Scholar] [CrossRef]
- Seo, S.-J.; Woo, J.-J.; Yun, S.-H.; Lee, H.-J.; Park, J.-S.; Xu, T.; Yang, T.-H.; Lee, J.; Moon, S.-H. Analyses of interfacial resistances in a membrane-electrode assembly for a proton exchange membrane fuel cell using symmetrical impedance spectroscopy. Phys. Chem. Chem. Phys. 2010, 12, 15291–15300. [Google Scholar] [CrossRef]
- Kurz, T.; Hakenjos, A.; Kramer, J.; Zedda, M.; Agert, C. An impedance-based predictive control strategy for the state-of-health of PEM fuel cell stacks. J. Power Sources 2008, 180, 742–747. [Google Scholar] [CrossRef]
- Kadyk, T.; Hanke-Rauschenbach, R.; Sundmacher, K. Nonlinear frequency response analysis of PEM fuel cells for diagnosis of dehydration, flooding and CO-poisoning. J. Electroanal. Chem. 2009, 630, 19–27. [Google Scholar] [CrossRef]
- Wang, M.; Zeng, Z.; Ma, Z.; Dong, C. A comprehensive review of equivalent circuit models for proton exchange membrane fuel cells. Int. J. Hydrogen Energy 2020, 45, 20368–20383. [Google Scholar]
- Jiang, C.; Shi, L.; Wang, X.; Sun, T. Electrochemical Impedance Spectroscopy Analysis of a Proton Exchange Membrane Fuel Cell Using a Modified Equivalent Circuit Model. J. Power Sources 2016, 308, 163–1692016. [Google Scholar]
- Askaripour, H. Effect of operating conditions on the performance of a PEM fuel cell. Int. J. Heat Mass Transf. 2019, 144, 118705. [Google Scholar] [CrossRef]
- Chavan, S.; Talange, D. Electrical Equivalent Circuit Modeling and Parameter Estimation for PEM Fuel Cell. In Proceedings of the International Conference on Innovations in Power and Advanced Computing Technologies, Vellore, India, 21–22 April 2017. [Google Scholar]
- Dhirde, A.; Dale, N.; Salehfar, H.; Mann, M.; Han, T. Equivalent Electric Circuit Modeling and Performance Analysis of a PEM Fuel Cell Stack Using Impedance Spectroscopy. IEEE Trans. Energy Convers. 2010, 25, 778–786. [Google Scholar] [CrossRef]
- Martín, I.; Ursúa, A.; Sanchis, P. Modelling of PEM Fuel Cell Performance: Steady-State and Dynamic Experimental Validation. Energies 2014, 7, 670–700. [Google Scholar] [CrossRef]
- Jin, Z. A Novel Method for Parameter Identification of Fuel Cell Equivalent Circuit Model. J. Phys. Conf. Ser. 2021, 1754, 012004. [Google Scholar] [CrossRef]
- Li, H.; Zhang, J.; Fatih, K.; Wang, Z.; Tang, Y.; Shi, Z. Polymer electrolyte membrane fuel cell contamination: Testing and diagnosis of toluene-induced cathode degradation. J. Power Sources 2008, 185, 272–279. [Google Scholar] [CrossRef]
- Brunetto, C.; Moschetto, A.; Tina, G. PEM fuel cell testing by electrochemical impedance spectroscopy. Electr. Power Syst. Res. 2009, 79, 17–26. [Google Scholar] [CrossRef]
- Reshetenko, T.; Kulikovsky, A. On the Origin of High Frequency Impedance Feature in a PEM Fuel Cell. J. Electrochem. Soc. 2019, 166, F1253–F1257. [Google Scholar] [CrossRef]
- Easton, E.; Astill, T.; Holdcroft, S. Properties of gas diffusion electrodes containing sulfonated poly. J. Electrochem. Soc. 2005, 152, 752. [Google Scholar] [CrossRef]
- Ciureanu, M.; Roberge, R. Electrochemical impedance study of PEM fuel cells. Experimental diagnostics and modeling of air cathodes. J. Phys. Chem. B 2001, 105, 3531–3539. [Google Scholar] [CrossRef]
- Siracusano, S.; Trocino, S.; Briguglio, N.; Baglio, V.; Aricò, A.S. Electrochemical Impedance Spectroscopy as a Diagnostic Tool in Polymer Electrolyte Membrane Electrolysis. Materials 2018, 11, 1368. [Google Scholar] [CrossRef]
- Elsøe, K.; Grahl-Madsen, L.; Scherer, G.; Hjelm, J.; Mogensen, M. Electrochemical Characterization of a PEMEC Using Impedance Spectroscopy. J. Electrochem. Soc. 2017, 164, 1419–1426. [Google Scholar] [CrossRef]
- Romero-Castanon, T.; Arriaga, L.; Cano-Castillo, U. Impedance spectroscopy as a tool in the evaluation of MEAs. J. Power Sources 2003, 118, 179–182. [Google Scholar] [CrossRef]
- Fischer, A.; Jindra, J.; Wendt, H. Porosity and catalyst utilization of thin layer cathodes in air operated PEM-fuel cells. J. Appl. Electrochem. 1998, 28, 277–282. [Google Scholar] [CrossRef]
- Wagner, N. Characterization of membrane electrode assemblies in poly-mer electrolyte fuel cells using ac impedance spectroscopy. J. Appl. Electrochem. 2002, 32, 859–863. [Google Scholar] [CrossRef]
- Parthasarathy, A. An Electrochemical Impedance Spectroscopic Analysis of Oxygen Reduction Kinetics and Nafion Characteristics. J. Electrochem. Soc. 1992, 139, 1634. [Google Scholar] [CrossRef]
- Kurzweil, P.; Fischle, H. A new monitoring method for electrochemical aggregates by impedance spectroscopy. J. Power Sources 2004, 127, 331–340. [Google Scholar] [CrossRef]
- Santarelli, M.G.; Torchio, M.F. Experimental analysis of the effects of the operating variables on the performance of a single PEMFC. Energy Convers. Manag. 2007, 48, 40–51. [Google Scholar] [CrossRef]
- Andreaus, B.; Scherer, G. Effects of Nafion dehydration in PEM fuel cells. Solid State Ion. 2004, 168, 311–320. [Google Scholar] [CrossRef]
- Santana, J.; Espinoza-Andaluz, M.; Li, T.; Andersson, M. A Detailed Analysis of Internal Resistance of a PEFC Comparing High and Low Humidification of the Reactant Gases. Front. Energy Res. 2020, 8, 217. [Google Scholar] [CrossRef]
- Tavakoli, R. The effect of fuel cell operational conditions on the water content distribution in the polymer electrolyte membrane. Renew. Energy 2011, 30, 13. [Google Scholar] [CrossRef]
- Zhang, J.; Tang, Y.; Song, C.; Xia, Z.; Li, H.; Wang, H.; Zhang, J. PEM fuel cell relative humidity (RH) and its effect on performance at high temperatures. Electrochim. Acta 2008, 53, 5315–5321. [Google Scholar] [CrossRef]
- Debenjak, A.; Gašperin, M.; Pregelj, B.; Atanasijević-Kunc, M.; Petrovčič, J.; Jovan, V. Detection of Flooding and Drying inside a PEM Fuel Cell Stack. Stroj. Vestn. J. Mech. Eng. 2013, 59, 56–64. [Google Scholar] [CrossRef]
- Li, H.; Tang, Y.; Wang, Z.; Shi, Z.; Wu, S.; Song, D.; Zhang, J.; Fatih, K.; Zhang, J.; Wang, H.; et al. A review of water flooding issues in the proton exchange membrane fuel cell. J. Power Sources 2008, 178, 103–117. [Google Scholar] [CrossRef]
- Mulyazmi, M.; Daud, W.R.W.; Octavia, S.; Ulfah, M. The Relative Humidity Effect Of The Reactants Flows Into The Cell To Increase PEM Fuel Cell Performance. ATEC Web Conf. 2018, 156, 03033. [Google Scholar] [CrossRef]
- Ciureanu, M.; Mikhailenko, S.; Kaliaguine, S. PEM fuel cells as membrane reactors: Kinetic analysis by impedance spectroscopy. Catal. Today 2003, 82, 195–206. [Google Scholar] [CrossRef]
- Yanzhou, Q.; Qing, D.; Mingzhe, F.; Chang, Y.; Yin, Y. Study on the operating pressure effect on the performance of a proton exchange membrane fuel cell power system. Energy Convers. Manag. 2017, 142, 357–365. [Google Scholar]
- Baschuk, J.; Li, X. Modelling of polymer electrolyte membrane fuel cells with variable degree of water flooding. J. Power Sources 2000, 86, 181–196. [Google Scholar] [CrossRef]
- Misran, E.; Hassan, N.S.M.; Daud, W.R.W.; Majlan, E.H.; Rosli, M.I. Water transport characteristics of a PEM fuel cell at various operating pressures and temperatures. Int. J. Hydrogen Energy 2013, 38, 9401–9408. [Google Scholar] [CrossRef]
Disclaimer/Publisher’s Note: The statements, opinions and data contained in all publications are solely those of the individual author(s) and contributor(s) and not of MDPI and/or the editor(s). MDPI and/or the editor(s) disclaim responsibility for any injury to people or property resulting from any ideas, methods, instructions or products referred to in the content. |
© 2024 by the authors. Licensee MDPI, Basel, Switzerland. This article is an open access article distributed under the terms and conditions of the Creative Commons Attribution (CC BY) license (https://creativecommons.org/licenses/by/4.0/).