Article

Experimental Investigation of the Impact of CO2 Injection Strategies on Rock Wettability Alteration for CCS Applications

by
Stella I. Eyitayo
1,*,
Gamadi Talal
1,
Oladoyin Kolawole
2,
Chinedu J. Okere
1,
Ion Ispas
1,
Nachiket Arbad
1,
Hossein Emadibaladehi
1 and
Marshall C. Watson
1
1
Bob L. Herd Department of Petroleum Engineering, Texas Tech University, 807 Boston Avenue, Lubbock, TX 79409, USA
2
John A. Reif, Jr. Department of Civil and Environmental Engineering, New Jersey Institute of Technology, Newark, NJ 07102, USA
*
Author to whom correspondence should be addressed.
Energies 2024, 17(11), 2600; https://doi.org/10.3390/en17112600
Submission received: 13 May 2024 / Revised: 24 May 2024 / Accepted: 25 May 2024 / Published: 28 May 2024
(This article belongs to the Special Issue Subsurface Energy and Environmental Protection)

Abstract

:
Carbon capture and storage (CCS) has been recognized as a pivotal technology for mitigating climate change by reducing CO2 emissions. Storing CO2 in deep saline aquifers requires preserving the water-wet nature of the formation throughout the storage period, which is crucial for maintaining rock integrity and storage efficiency. However, the wettability of formations can change upon exposure to supercritical CO2 (scCO2), potentially compromising storage efficiency. Despite extensive studies on various factors influencing wettability alteration, a significant research gap remains in understanding the effects of different CO2 injection strategies on wettability in deep saline formations (DSFs). This study addresses this gap by investigating how three distinct CO2 injection strategies—continuous scCO2 injection (CCI), water alternating with scCO2 injection (WAG), and simultaneous water and scCO2 injection (SAI)—affect the wettability of gray Berea sandstone and Indiana limestone, both selected for their homogeneous properties relevant to CCS. Using a standardized sessile drop contact angle method before and after CO2 injection, along with core flooding to model the injection process at an injection pressure of 1500 psi and temperature of 100 °F with a confining pressure of 2500 psi, the results indicate a shift in wettability towards more CO2-wet conditions for both rock types under all strategies with changes in CA of 61.6–83.4° and 77.6–87.9° and 81.5–124.2° and 94.6–128.0° for sandstone and limestone, respectively. However, the degree of change varies depending on the injection strategy: sandstone exhibits a pronounced response to the CCI strategy, with up to a 77% increase in contact angle (CA), particularly after extended exposure. At the same time, WAG shows the least change, suggesting that water introduction slows surface modification. For limestone, the changes in CA ranged from 9% to 49% across strategies, with WAG and SAI being more effective in altering its wettability. This study underscores the importance of selecting suitable CO2 injection strategies based on rock type and wettability characteristics to maximize carbon storage efficiency. The findings offer valuable insights into the complex interactions of fluid–rock systems and a guide for enhancing the design and implementation of CCS technologies in various geological settings.

1. Introduction

Wettability is the capacity of a rock to adhere to one fluid in the presence of another preferentially [1]. This essential property controls the interactions between fluid phases and rock surfaces in porous media, influencing hydrodynamic behavior in subsurface environments. In geological formations such as sandstone and limestone, wettability influences the distribution and movement of fluids like water, oil, and gas, affecting multiphase fluid saturations, relative permeability, and residual saturations [2,3,4]. A formation’s affinity for water categorizes it as water-wet. Similarly, an affinity for oil or CO2/gas classifies it as oil-wet or CO2/gas-wet, respectively. The preferred liquid is termed the wetting phase, with the other the non-wetting phase, affecting the quantity and manner of fluid displacement.
A wetting fluid occupies the thinnest pores due to the attractive forces it exhibits with the formation. It also lines the surface of larger pores—typically quantified as connate water saturation when water is in the wetting phase—and ensures the continuity and flow advantage of the wetting fluid. Conversely, when the fluid is CO2, it can be residually trapped in smaller pores; however, it flows more easily, increasing its plume migration and area. CO2’s behavior varies depending on the rock surface it interacts with: it acts as a non-wetting phase in strongly hydrophilic, water-wet systems at pressures below 10 MPa and temperatures around 296–298 K, but becomes a wetting phase under supercritical conditions in less or intermediate hydrophilic systems, with the effect intensifying at lower temperatures [5,6]. Supporting this, Plug et al. (2007) observed CO2 as the wetting phase on clean quartz surfaces at 8.5 MPa and 313 K [7].
Obtaining the contact angle (CA) between the liquid–solid surface, an indication or measure of wettability, can more easily convey the fluid’s tendency to spread [8]. Wettability is typically assessed using the Amott–Harvey wettability index (AHM) and sessile drop CA measurement. The AHM involves spontaneous and forced imbibition in initially saturated cores. At the same time, the sessile drop method evaluates the CA directly, proving particularly sensitive to changes in sandstone wettability when exposed to supercritical CO2 (scCO2) [9]. Wettability, classified via CA measurements into three categories—water-wet, neutrally/intermediate water-wet, and non-water-wet [10] provides crucial insights into fluid behaviors in porous media. CAs are delineated as follows: water-wet (0–75°), neutrally wet (75–120°), and non-water-wet (120–180°). Other authors have classified these as 0–90, 90–120, and 120–180°. Recent developments show a new classification of CA based on water and CO2. As illustrated by Figure 1, when the CA is less than 70°, the system is water-wet; above 110°, it is CO2-wet when only water and CO2 are within the formation. For example, quartz and muscovite mica display strong water-wet properties, with CAs of 0–26° and 0–58°, respectively [11,12,13]. The formation is termed an intermediate wet system with a CA between 70° and 110°. Another method used in quantifying wettability change is molecular dynamic analytical calculation, which was demonstrated by researchers to give a similar result [14,15]. These types of measurement are referred to as static measurement.

1.1. Wettability Alteration

Research has shown that various factors, including the physical properties of the rock, the chemistry of the fluid phases, and the injection conditions, such as pressure and temperature, influence the behavior of CO2 in subsurface formations. Experimental studies confirm that wettability in geological formations is also influenced by salinity, surface roughness, mineral content, CO2 density, concentration, and exposure time [16]. Lv et al. (2017) additionally identify interactions between surface contaminants, fluid, pore topology, and capillarity as key factors [17]. In carbonate and some shale formations, wettability alteration is significantly affected by pH, oil composition, fractures, and fissures [9]. The impact of temperature on CA and wettability alteration (WA) shows no consistent trend: CA may increase or decrease with temperature changes, reflecting a transition in water wettability from strongly to less water-wet or vice versa [15,16,18,19,20]. Notably, the wettability effect of CO2 is more pronounced in the subcritical region, indicating a stronger influence at lower temperatures [5]. High-temperature injections can shift wettability from oil-wet to water-wet due to desorption phenomena [21]. An increase in pressure can increase CA, indicating shifts from strongly water-wet to less water-wet or a CO2-wet system, and this is sustained above 6.7–20 MPa pressure thresholds if other factors remain constant [19,20,22,23,24]. Jaeger et al. (2010) explained that increasing pressure in CO2–brine systems might decrease CA, suggesting that CO2 can become the wetting or non-wetting phase under certain conditions [25]. The impact of ionic strength is better understood than pressure and temperature effects. Higher ionic strength increases WA and significantly changes CA values. Experimental results consistently show that increasing salinity in a CO2–brine–rock system, primarily composed of quartz or silica, enhances wettability alteration regardless of the measurement method or the type of salt used, whether divalent or monovalent [22,26,27]. However, in the presence of oil, the influence of salinity on CAs is limited. It may either remain unchanged or decrease [28]. Changes in pH can drastically alter wettability; for instance, increasing pH can switch the wettability of mica from water-wet to oil-wet, a dynamic further influenced by CO2 addition [29,30]. Studies suggest that increasing surface roughness can either increase or decrease CA, with significant implications for mineral dissolution or precipitation-altering surface properties [4,31,32,33]; hence, it is essential to polish the surface of the formation to be used in the experiment. The type of formation—such as shale, sandstone, limestone, and dolomite—plays a crucial role in how wettability is affected by CO2 exposure [11,34]. Each mineral responds differently, influencing the optimal selection of caprock properties for CO2 storage [16,35]. Changes in CO2 density can modify CA, with denser CO2 phases generally promoting a shift toward less water-wet conditions [17]. Extended exposure to CO2 can lead to dynamic changes in CA, demonstrating the importance of time in assessing wettability outcomes [36,37]. Kim et al. (2012) and Al-yaseri et al. (2015) noted that changes within the reservoir could enhance or reduce trapping capacities [18,38]. Wettability alteration mechanisms, such as interfacial tension reduction, mineral dissolution, adsorption, and type of CO2, play critical roles in these processes. For example, Hirasaki et al. (2011) demonstrated that these mechanisms led to wettability alteration in Berea sandstone when exposed to scCO2 [39]. Dynamic changes in wettability are also driven by prolonged CO2 exposure [13] These factors, with time, lead to WA, which significantly impacts CO2 storage strategies. This can lead to accelerated CO2 migration, affecting mobility and altering solubility and residual trapping capacities. Thus, understanding these variations is crucial for optimizing CO2 geo-storage efficiency and enhancing containment security. Since storage capacity and efficiencies are affected by several factors, the others must be kept constant to study the effect of one over another. For more details, see Supplementary Materials for Tables S1–S4.

1.2. Impact of Wettability Alteration (WA) on CO2 Storage

Wettability is crucial in carbon capture and storage (CCS) within deep saline formations (DSFs) or aquifers, where controlling fluid flow significantly impacts the efficiency and success of these processes. WA affects capillary pressure, which affects microscopic sweep efficiency. WA can be either beneficial or detrimental to storage capacity and efficiency. For example, changes within the reservoir can enhance residual trapping [38]. Shifting from strongly to weakly water-wet wettability in quartz in storage conditions can reduce structural and residual trapping capacities [18,40]. Conversely, alterations within the caprock reduce its sealing capacity [41,42].
Various mechanisms responsible for wettability alteration have been identified, including interfacial tension reduction, mineral dissolution, and adsorption. For instance, a study by Hirasaki et al. (2011) found that reduced interfacial tension between CO2 and water led to rock wettability alteration [39]. Additionally, the study found that mineral dissolution played a role in wettability alteration. In carbonates, Sagbana et al. (2022) stated that the mechanisms responsible for WA are multicomponent ion exchange, electric double-layer expansion, and dissolution [9]. Investigations such as those by Juanes et al. (2006) have delved into the multiphase flow dynamics of CO2 in porous media, emphasizing the importance of understanding capillary and viscous forces to predict CO2 plume behavior and trapping mechanisms effectively [43]. Exposure of rock formations to supercritical CO2 (scCO2) can change their native wettability, impacting the fluid dynamics and trapping mechanisms crucial for effective CO2 storage. This alteration can either enhance or reduce the capillary forces, thus altering the saturation functions and affecting storage efficiency and security over time. For instance, a study by Wang et al. (2019) found that exposing sandstone to scCO2 shifted its wettability from water-wet to intermediate-wet, with mineral dissolution playing a significant role in this change [44]. Moreover, Li et al. (2005, 2006) and Chiquet et al. (2005, 2007) demonstrated that CO2 can diminish the capillary-sealing efficiency of shale and evaporite caprocks by reducing CO2 breakthrough pressures, thereby limiting storage volumes [30,35,45,46]. While various factors influencing these changes have been studied, the impact of injection strategies and exposure time on wettability alteration reduction has yet to be fully explored and studied.

1.3. Injection Strategy as a Means of Reducing WA

Usually, the traditional approach of CO2 storage involves continuous CO2 injection (CCI) into the formation using different phases such as gas or liquid. Recently, scCO2 has been found to be more efficient due to its higher density (0.45–0.7 g/cm3) compared to the gaseous state (0.002 g/cm3) or liquid state (0.771 g/cm3) and better stability than in the liquid state [47,48]. In most cases, the scCO2 is injected continuously into the formation until abandonment. The injection of CO2 or scCO2 into porous media has been extensively studied over recent decades, primarily focusing on improving oil recovery in enhanced oil recovery (EOR), with less attention paid to improving CO2 storage [49,50,51,52,53,54]. One such challenge is the excessive production of CO2 injected alongside the oil. Azzolina et al. (2015) reported that 23.1–61.8% of CO2 is retained/stored, with an incremental recovery of 5.3–21.5% [55]. Farajzadeh et al. (2020) indicated that 6–56% of the CO2 is stored, meaning that 0.43–0.94 kg of CO2/kg of CO2 stored will be re-emitted, leading to a CO2 cycle breakthrough that complicates optimization and makes storing large amounts of CO2 difficult and potentially unsustainable [56]. Regarding life cycle assessment, more energy is consumed to store up to 56% of CO2 than is generated from the extra oil produced. Water-alternating gas (WAG) has also been exploited for the same purpose in EOR [57,58,59,60,61]; however, this injection strategy has not yet been applied or studied extensively in geological CO2 storage in DSFs.
While the injection of CO2 and its interactions with reservoir rocks are well documented, the specific effects of different injection strategies on wettability—a key factor in determining the sweep efficiency of CO2 storage in deep saline formations (DSFs)—remain less understood. Wettability significantly influences the distribution and movement of fluids within the rock matrix, thereby affecting the ultimate storage capacity of a reservoir. Comprehensive, systematic studies that isolate the effects of varied CO2 and brine injection strategies on wettability changes are lacking, especially detailed comparative analyses across different rock types under the same experimental conditions to outline each injection method’s effects.
The objectives of this research are twofold: to quantitatively assess wettability changes for different injection strategies—continuous scCO2 injection, brine alternating with scCO2 injection, and simultaneous brine and CO2 injection—and to evaluate how these strategies affect the wettability of two common subsurface rock types, sandstone, and limestone. This assessment will help determine which scCO2 injection strategy least modifies wettability in a way that could enhance the storage and trapping of scCO2, thereby improving overall subsurface carbon storage efficiency. This study aims to contribute valuable insights into the wettability behavior of rock samples when exposed to scCO2 using different injection strategies, offering data-driven recommendations to enhance carbon storage strategies in DSFs.

2. Materials and Methods

The materials utilized in this experiment include core samples (sandstone and limestone), scCO2, and water, which are discussed in detail below.

2.1. Description of Sample and Preparation

The rock samples chosen for this study were Berea sandstone and Indiana limestone, both widely recognized in geoscientific research for their homogeneity and predictable physical properties. Berea sandstone is noted for its high porosity and permeability, consisting predominantly of quartz grains cemented by silica, making it ideal for fluid injection studies. Indiana limestone, characterized by its calcite composition, provides insights into chemical interactions between CO2 and carbonate minerals.
Each rock type was prepared into cylindrical core samples approximately 1.5 inches in diameter and 3 inches in length. Before testing, all samples were oven-dried and vacuum-saturated with brine to ensure uniform starting conditions. The wettability measurement method—conventional techniques versus micro-CT—can significantly influence observed effects due to differences in surface interaction and cleaning procedures. Therefore, surfaces were cleaned to minimize their impact on the CA measurement.
Sandstone and limestone, prevalent in CCS and EOR projects, offer distinct physical and chemical characteristics crucial for studying CO2 injection impacts on wettability. Sandstone, primarily siliciclastic, displays varying porosity and permeability, affecting fluid flow and trapping mechanisms. Limestone, mainly composed of calcite, undergoes chemical reactions with CO2, potentially altering pore structures and surface properties. Understanding how CO2 and brine injection strategies modify the wettability of these rocks is key to optimizing CCS techniques across different geological settings.
For the study, the observed average effective porosity for nine gray Berea sandstone core samples ranged from 19.3% to 20.2% and for nine Indiana limestone samples from 19.0% to 21.5%. The observed average absolute permeability was between 28.3 and 138.5 mD for Berea sandstone and 20.8 to 188.5 mD for Indiana limestone. The cores were dried in an oven at 100 °F for 24 h and continuously weighed until a consistent dry weight was achieved, and their porosity and permeability were measured. Before experimentation, the cores were saturated in a vacuum saturator to remove air from the pore spaces, simulating reservoir conditions. This process was maintained for 24 h. Cleaned, polished, and saturated core disks were then subjected to scCO2 saturation using core flooding equipment at a confining pressure of 2500 psi and an injection pressure of 1500 psi at 100 °F. Pretest measurements were taken following this preparation.
Wettability changes were quantified using the CA measurement technique. CAs were determined before and after the injection experiments using a high-resolution camera and image analysis software. The CA at which a liquid–vapor interface meets a solid surface indicates the rock’s wettability. A decrease in CA suggests a shift toward more water-wet conditions, while an increase indicates a shift toward oil-wet conditions. This detailed methodology ensures a comprehensive assessment of how different CO2 injection strategies affect the wettability of sandstone and limestone, providing a robust basis for understanding the implications of these methods on subsurface carbon storage. These experiments comprised three phases: (1) pretest CA measurement using the drop shape analyzer, (2) sample exposure through a core flooding experimental setup, and (3) post-test CA measurement for the two samples of gray Berea sandstone and Indiana limestone at various exposure times.

2.2. Pretest and Post-Test Experimental Setup

The initial CA, formed between the solid surface and the tangent at the droplet contact point, was quantified before exposure to any treatment to determine the surfaces’ baseline wetting properties.
In this experiment, the sessile drop technique was employed to measure CAs, utilizing a Drop Shape Analyzer DSA25, as depicted in Figure 2. This technique carefully places a liquid droplet on a solid surface and measures the angle formed at the liquid–solid–gas interface. The droplet’s contour is mathematically modeled using a general conic section equation. Calculating the derivative at the point where the droplet contour intersects with the baseline enables the determination of the slope at the three-phase contact point, thus accurately establishing the CA.
Unlike some types of CA measurements based on visual observation, these are automatically measured after the diameter of the needle and the surface alignment are properly calibrated. The rock sample is positioned on the adjustable platform, and the drop of liquid is released on the sample. As shown in Figure 2, the DSA25 instrument is crucial for these measurements. It has a high-resolution digital camera and video recording capabilities that capture detailed dynamic changes in droplet behavior and digital processing software. These features allow for continuous monitoring and recording of the drop’s shape, providing a robust dataset for analysis. The precise control and advanced imaging capabilities of the DSA25 achieve a measurement resolution of 0.1 degrees, significantly enhancing the accuracy and reliability of the CA measurements.
In this study, the static CA was determined using the ellipse method, which assumes an elliptical shape of the droplet. This method was coupled with large drop weight dynamic dosing to accommodate slightly asymmetrical droplet contours under ambient conditions of 72 °F and 14.7 psi. The substrate was cleaned, placed on an adjustable sample stage, and calibrated to ensure that measurements were taken on a level horizontal plane or the contact baseline. Distilled water was utilized for dosing and introduced slowly onto the substrate surface to facilitate detailed shape analysis and corresponding CA measurement. A lower CA indicates a stronger tendency of the aqueous phase to wet the substrate. The measurements were checked for repeatability at least three times in each experiment.
Sample preparation was standardized across all experiments—samples were cleaned and dried. The pretests and post-tests were conducted before and after subjecting rock samples to various injection strategies. Initial angle measurements were taken using air–water–rock and scCO2–water–rock systems, with post-exposure measurements to inject fluids like scCO2 and water. The final angle measurements were conducted similarly but were limited to the scCO2–water–rock system. The sessile drop method, involving water droplets on an scCO2-immersed substrate, was employed for these measurements.

2.3. Core Flooding Experimental Setup and Conditions

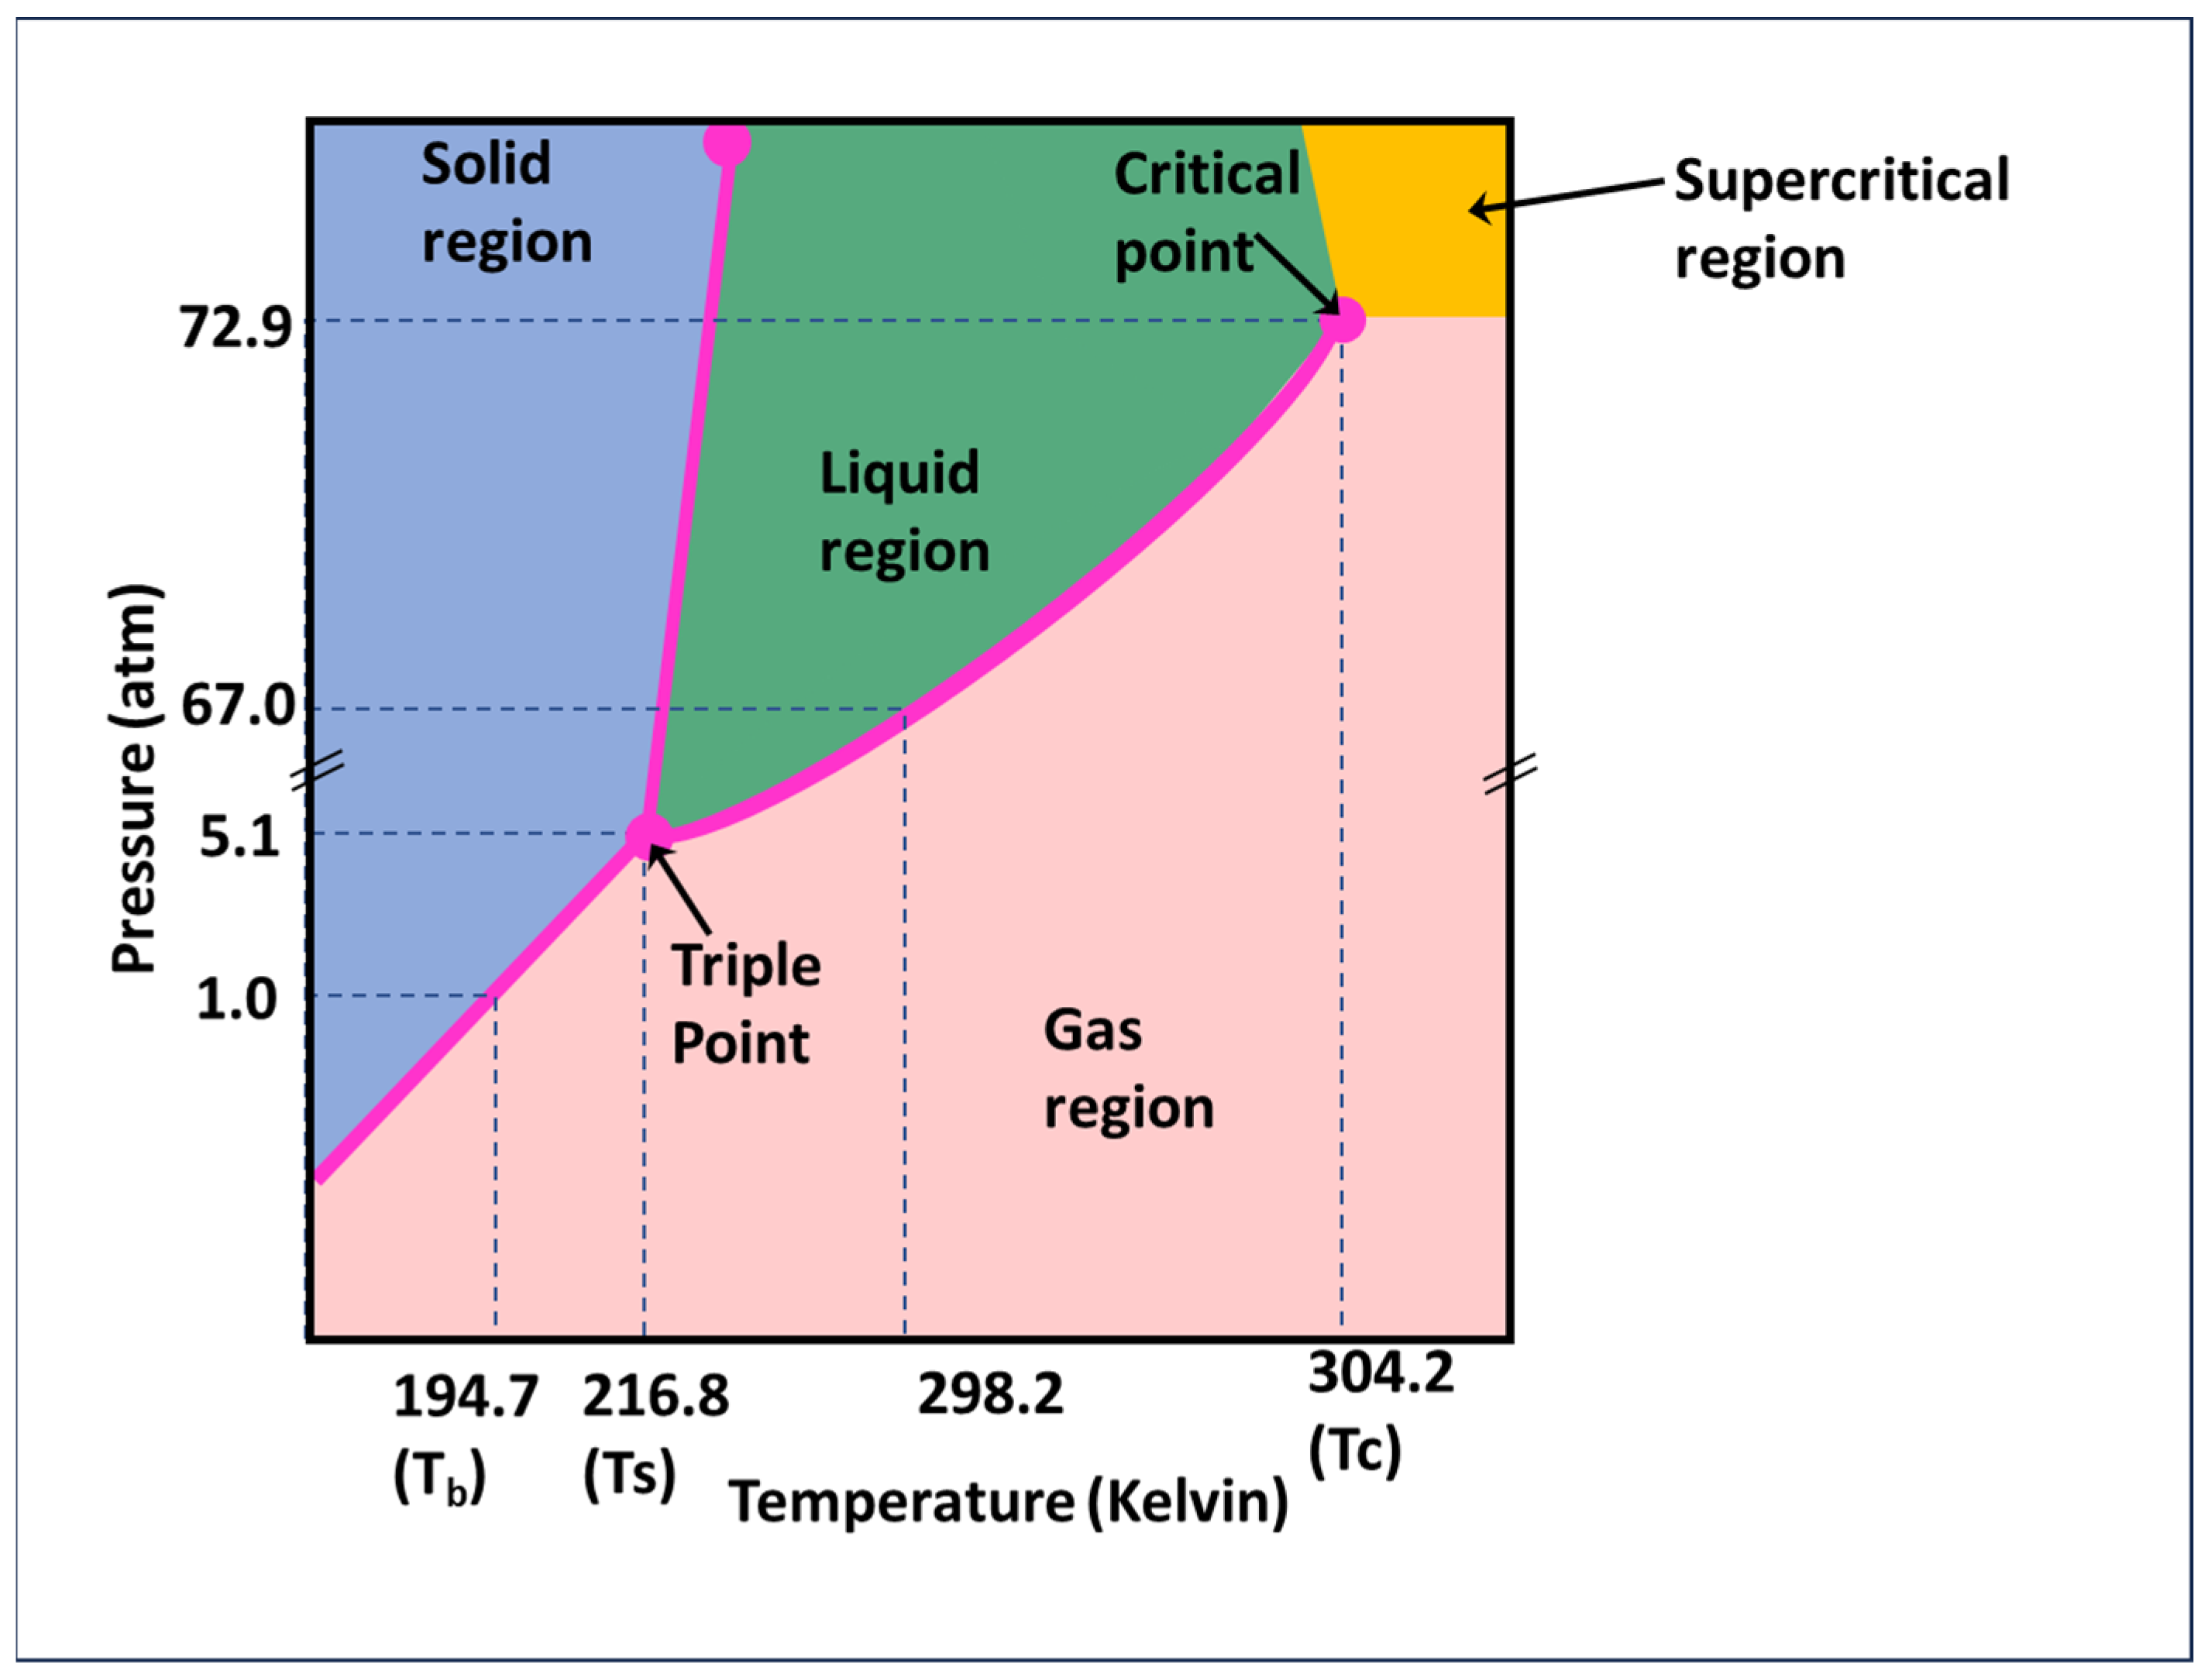
The temperature and pressure conditions selected for these experiments were based on representative subsurface conditions at which scCO2 begins to exist. CO2 becomes supercritical at a temperature of 304.2 K (89 °F) and a pressure of 73 atm (1072.8 psi), as shown in Figure 3. Its volume has decreased by 0.3% compared to the volume at standard pressure and temperature conditions [48,62,63]. In this phase, CO2 exists as a single, uniform phase where the density of CO2 vapor is the same as that of the liquid, thereby eliminating any interface between the two phases. The experimental temperature and pressure must be higher than these values to maintain these phases. The thermodynamic conditions of 1500 psi injection pressure and 100 °F temperature were chosen to simulate scCO2 conditions commonly desired for CO2 storage in saline formations. These conditions are critical to replicate in order to understand the behavior of CO2 in realistic storage scenarios.
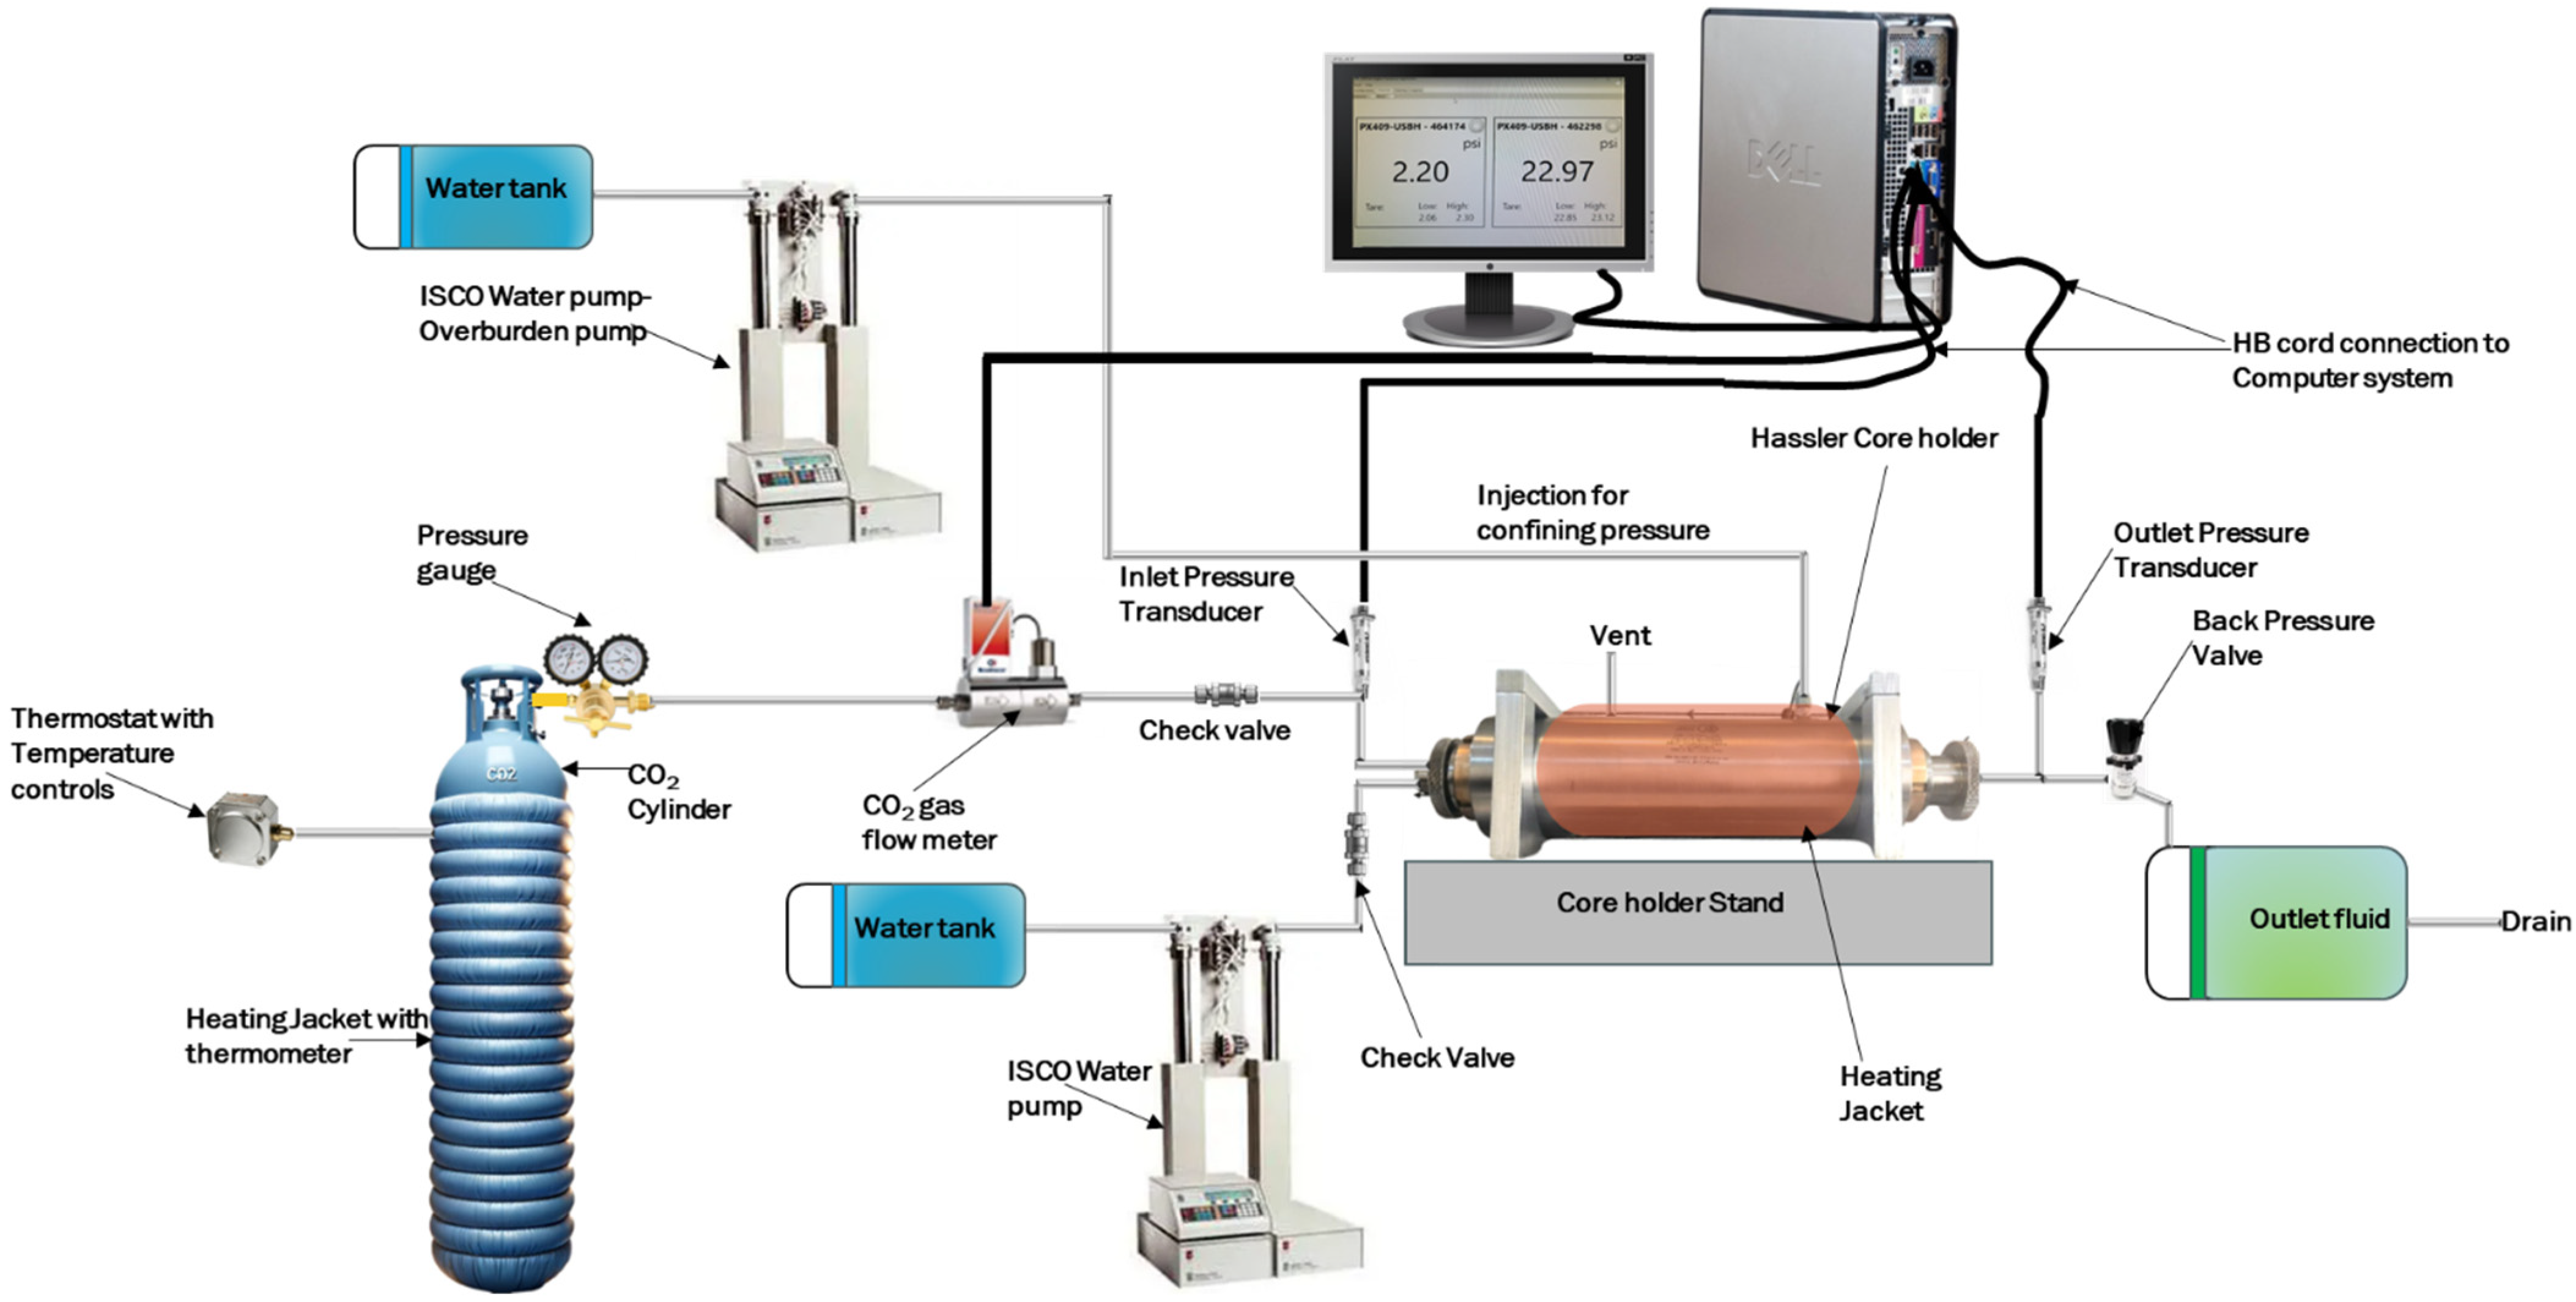
The experimental setup was designed to investigate various injection strategies involving scCO2 and brine by replicating subsurface geological formation storage conditions. This setup is illustrated in Figure 4.
The setup includes a thermostat capable of regulating temperature from 0–335 °F to ensure desired temperature control (i.e., 100 °F) in the cylinder containing scCO2 throughout the experiments. The gas cylinder is wrapped with a heating jacket to increase the temperature, thus raising the pressure of the gaseous CO2 to achieve scCO2 formation conditions. It is connected to a corrosion-resistant pressure gauge to monitor system pressures accurately. Additionally, this pressure is used to control the injection pressure to the desired value (1500 psi). Once a pressure of 1500 psi is achieved in the cylinder, scCO2 flows through a CODA Alicat flow meter at a predetermined rate. This flow meter accurately measures injection rates and volumes, enabling precise control over experimental parameters. Pressure transducers, with a maximum pressure rating of 4500 psi, are strategically positioned to measure both inlet and outlet pressures, ensuring that the system operates within the desired pressure ranges (1100–1500 psi). Check valves are also installed in the inlet scCO2 and water flow lines to ensure the unidirectional flow of fluid, which is crucial for maintaining experimental integrity and preventing any backflow.
The core holder, a critical setup component, is a Hassler Core holder wrapped with a Briskheat composite heating jacket. This configuration serves two primary purposes: preventing heat loss and maintaining the supercritical condition. It also facilitates the flow of fluids through the rock samples under investigation.
A Tescom Back pressure regulator, with an inlet pressure capacity of up to 12,000 psi, is employed to maintain a constant flow pressure of 1500 psi within the system and only vents once the pressure is above 1500 psi. This regulator ensures stability and consistency in experimental conditions, essential for accurate data collection and analysis. Additionally, outlets are provided for the venting or draining of scCO2 or brine, which feeds into a collection system for effluent. This system enables the efficient capture and disposal of experimental byproducts, contributing to the overall safety and integrity of the experiments. Two ISCO water pumps are installed: one allows alternating or simultaneous water injection into the core holder during the WAG and simultaneous scCO2–water aquifer injection (SAI) methods, while the second exerts a confining pressure of about 2500 psi in the system, as required by the experimental procedures. Overall, the experimental setup is comprehensively designed to provide a controlled and precise environment for investigating the behavior of scCO2 and brine within geological formations for different injection strategies.

2.4. Experimental Procedure

Sandstone samples were exposed to carbon dioxide using three exposure scenarios (24 h, 72 h, and 168 h) in core flooding equipment, as shown in Figure 4. This range was selected to observe both the immediate and long-term effects of the exposure on the CAs, providing insights into the kinetics of surface interactions. Different exposure times are synonymous with the aging process in EOR; however, in this case, the fluids were in a dynamic condition for these durations for the different injection strategies considered. The samples were exposed to scCO2 in a Hassler core holder at a 1 mL/min flow rate at a temperature of 100 °F and a confining pressure of 2500 psi. When water was introduced, the rate of 1 mL/min was maintained. Three distinct injection strategies were employed during the experiments: CCI, WAG, and SAI. These methods were chosen to evaluate their respective efficacy in modifying surface properties under controlled conditions. The CCI strategy involves constant exposure to scCO2. The WAG strategy alternates between scCO2 and brine. In contrast, the SAI strategy is the combined injection of scCO2 and water at the same time, potentially mimicking more dynamic environmental conditions to compare the extent of wettability alteration.

2.4.1. Continuous scCO2 Injection

The cylinder was heated to a temperature of 100 °F using a heating jacket, with the temperature monitored by a thermometer to ensure the CO2 reached supercritical condition. Each core was first fully saturated with brine using a vacuum saturator to ensure complete saturation. The brine-saturated core sample 1S was then loaded into the core holder. A confining pressure of 2500 psi was applied, and scCO2 was injected at a controlled rate of 1 mL/min, at a pressure of 1500 psi, and at a temperature of 100 °F until a steady state was reached. The pressure was maintained throughout the experiment to ensure the CO2 remained in the supercritical phase, maximizing its interaction with the rock’s surface. The core holder was also heated to 100 °F to prevent any phase change of CO2 from scCO2 to gas during the injection. scCO2 flowed through with the back pressure valve set to 1500 psi. Once the volume of scCO2 injected reached 75 times the pore volume (PV), which took about 24 h, the injection was stopped, the system was depressurized to remove the core sample immediately, and the post-injection measurement was taken. This is repeated for samples 4S and 7S, except that the injection duration lasted 72 h (225 PV) and 168 h (525 PV), respectively. The same procedure was used for 1L, 4L, and 7L limestone samples.

2.4.2. Alternate scCO2–Water Injection (WAG)

This experiment was like that above: for every 10-pore volume scCO2, 10 PV water is injected without changing experimental conditions. This ensures considerable contact time and that the hydrodynamic drag force will not displace sediments in the cores. This cycle was repeated three times to examine alternating fluids’ impact on the rock surfaces’ wettability. For comparative analysis of the different injection strategies, the volume of injected scCO2 was limited to 75 PV, 225 PV, and 525 PV for the 24 h, 72 h, and 168 h injections while excluding the time required to inject an equal amount of water. This was repeated for the second and third 24 h of scCO2 injection to 15 PV scCO2 injections.

2.4.3. Simultaneous scCO2–Water Aquifer Injection (SAI)

Similar samples in terms of permeability and porosity were used for the experiment, ensuring a consistent basis for comparing the CCI, WAG, and SAI methods. Initial conditions were carefully established to mirror those in previous tests. Injection rates and pressure were maintained at 0.5 mL/min and 1500 psi, respectively, with water and scCO2 injected at equal volumetric rates. This approach was adopted based on research suggesting that optimized displacement efficiencies are achieved with a balanced injection [64,65,66,67,68]. This could enhance the interface dynamics between the fluids and the rock, potentially improving oil displacement efficiency. The total fluid injection rate was set at 1 mL/min, maintaining the same overall flow rate as in other methods, but allowing for immediate interaction between the brine, scCO2, and rock. The injection duration was aligned with the volumetric benchmarks set in the CCI and WAG experiments, targeting 75 PV, 225 PV, and 525 PV of scCO2 injected at respective experimental durations of 24, 72, and 168 h. The procedure was applied to sandstone samples (3S, 6S, 9S) and limestone samples (3L, 6L, and 9L). Key parameters such as pressure changes, fluid saturations, and recovery rates were monitored throughout the injection process. Pressure sensors and data acquisition systems were deployed to capture a comprehensive dataset, facilitating real-time monitoring and necessary adjustments. After the injections were completed, the CA post-test was conducted.

3. Results

Berea sandstone and Indiana limestone exhibit varying CA influenced by surface treatments, different injection strategies, testing fluids, and exposure durations. Measurements across the Berea sandstone samples’ pretest varied from a minimum of 61.3° to a maximum of 83.4°, with a mean initial CA of approximately 72.69°. This variation provided a comprehensive baseline for assessing the impact of subsequent exposure treatments. The initial CA across the samples exhibited relatively low variability, evidenced by a standard deviation of ±5.43, as shown in Table 1. This consistency in initial CAs shows the uniformity in the surface conditions before the injection of scCO2 or water. Such a narrow range in initial measurements is crucial for ensuring that observed differences in post-treatment outcomes are attributable to the core flooding experimental conditions rather than inherent disparities in the sample surfaces. Based on the CA’s range of value measurement, Berea sandstone wettability suggests a weak water-wet and intermediate-wet system (Figure 1). Many studies have reported on the CAs of Berea sandstone and Indiana limestone, highlighting variations under different conditions. Donaldson et al. (1969) reported Berea sandstone CAs from 0 to 75° in oil–water–rock systems [69]. Teklu et al. (2015) found Berea sandstone CAs at 20.4° in synthetic salt water and between 21 and 33.3° in carbonates [70]. Zhang et al. (2020) documented high water-wetness for Berea sandstone with angles between 10° and 21°, noting a reduction in equilibrium CA with increased pressure or temperature [41]. Haeri et al. (2022) demonstrated that Berea sandstone CAs range from 15 to 38° when exposed to various CO2 phases [71]. Mutailipu et al. (2019) observed Berea sandstone CAs between 18.8° and 66.4° under different CO2 states, investigating wettability alterations under elevated conditions and using the sitting-drop method [24]. These measurements align with the measured value of CAs in this work, except for one sample used.
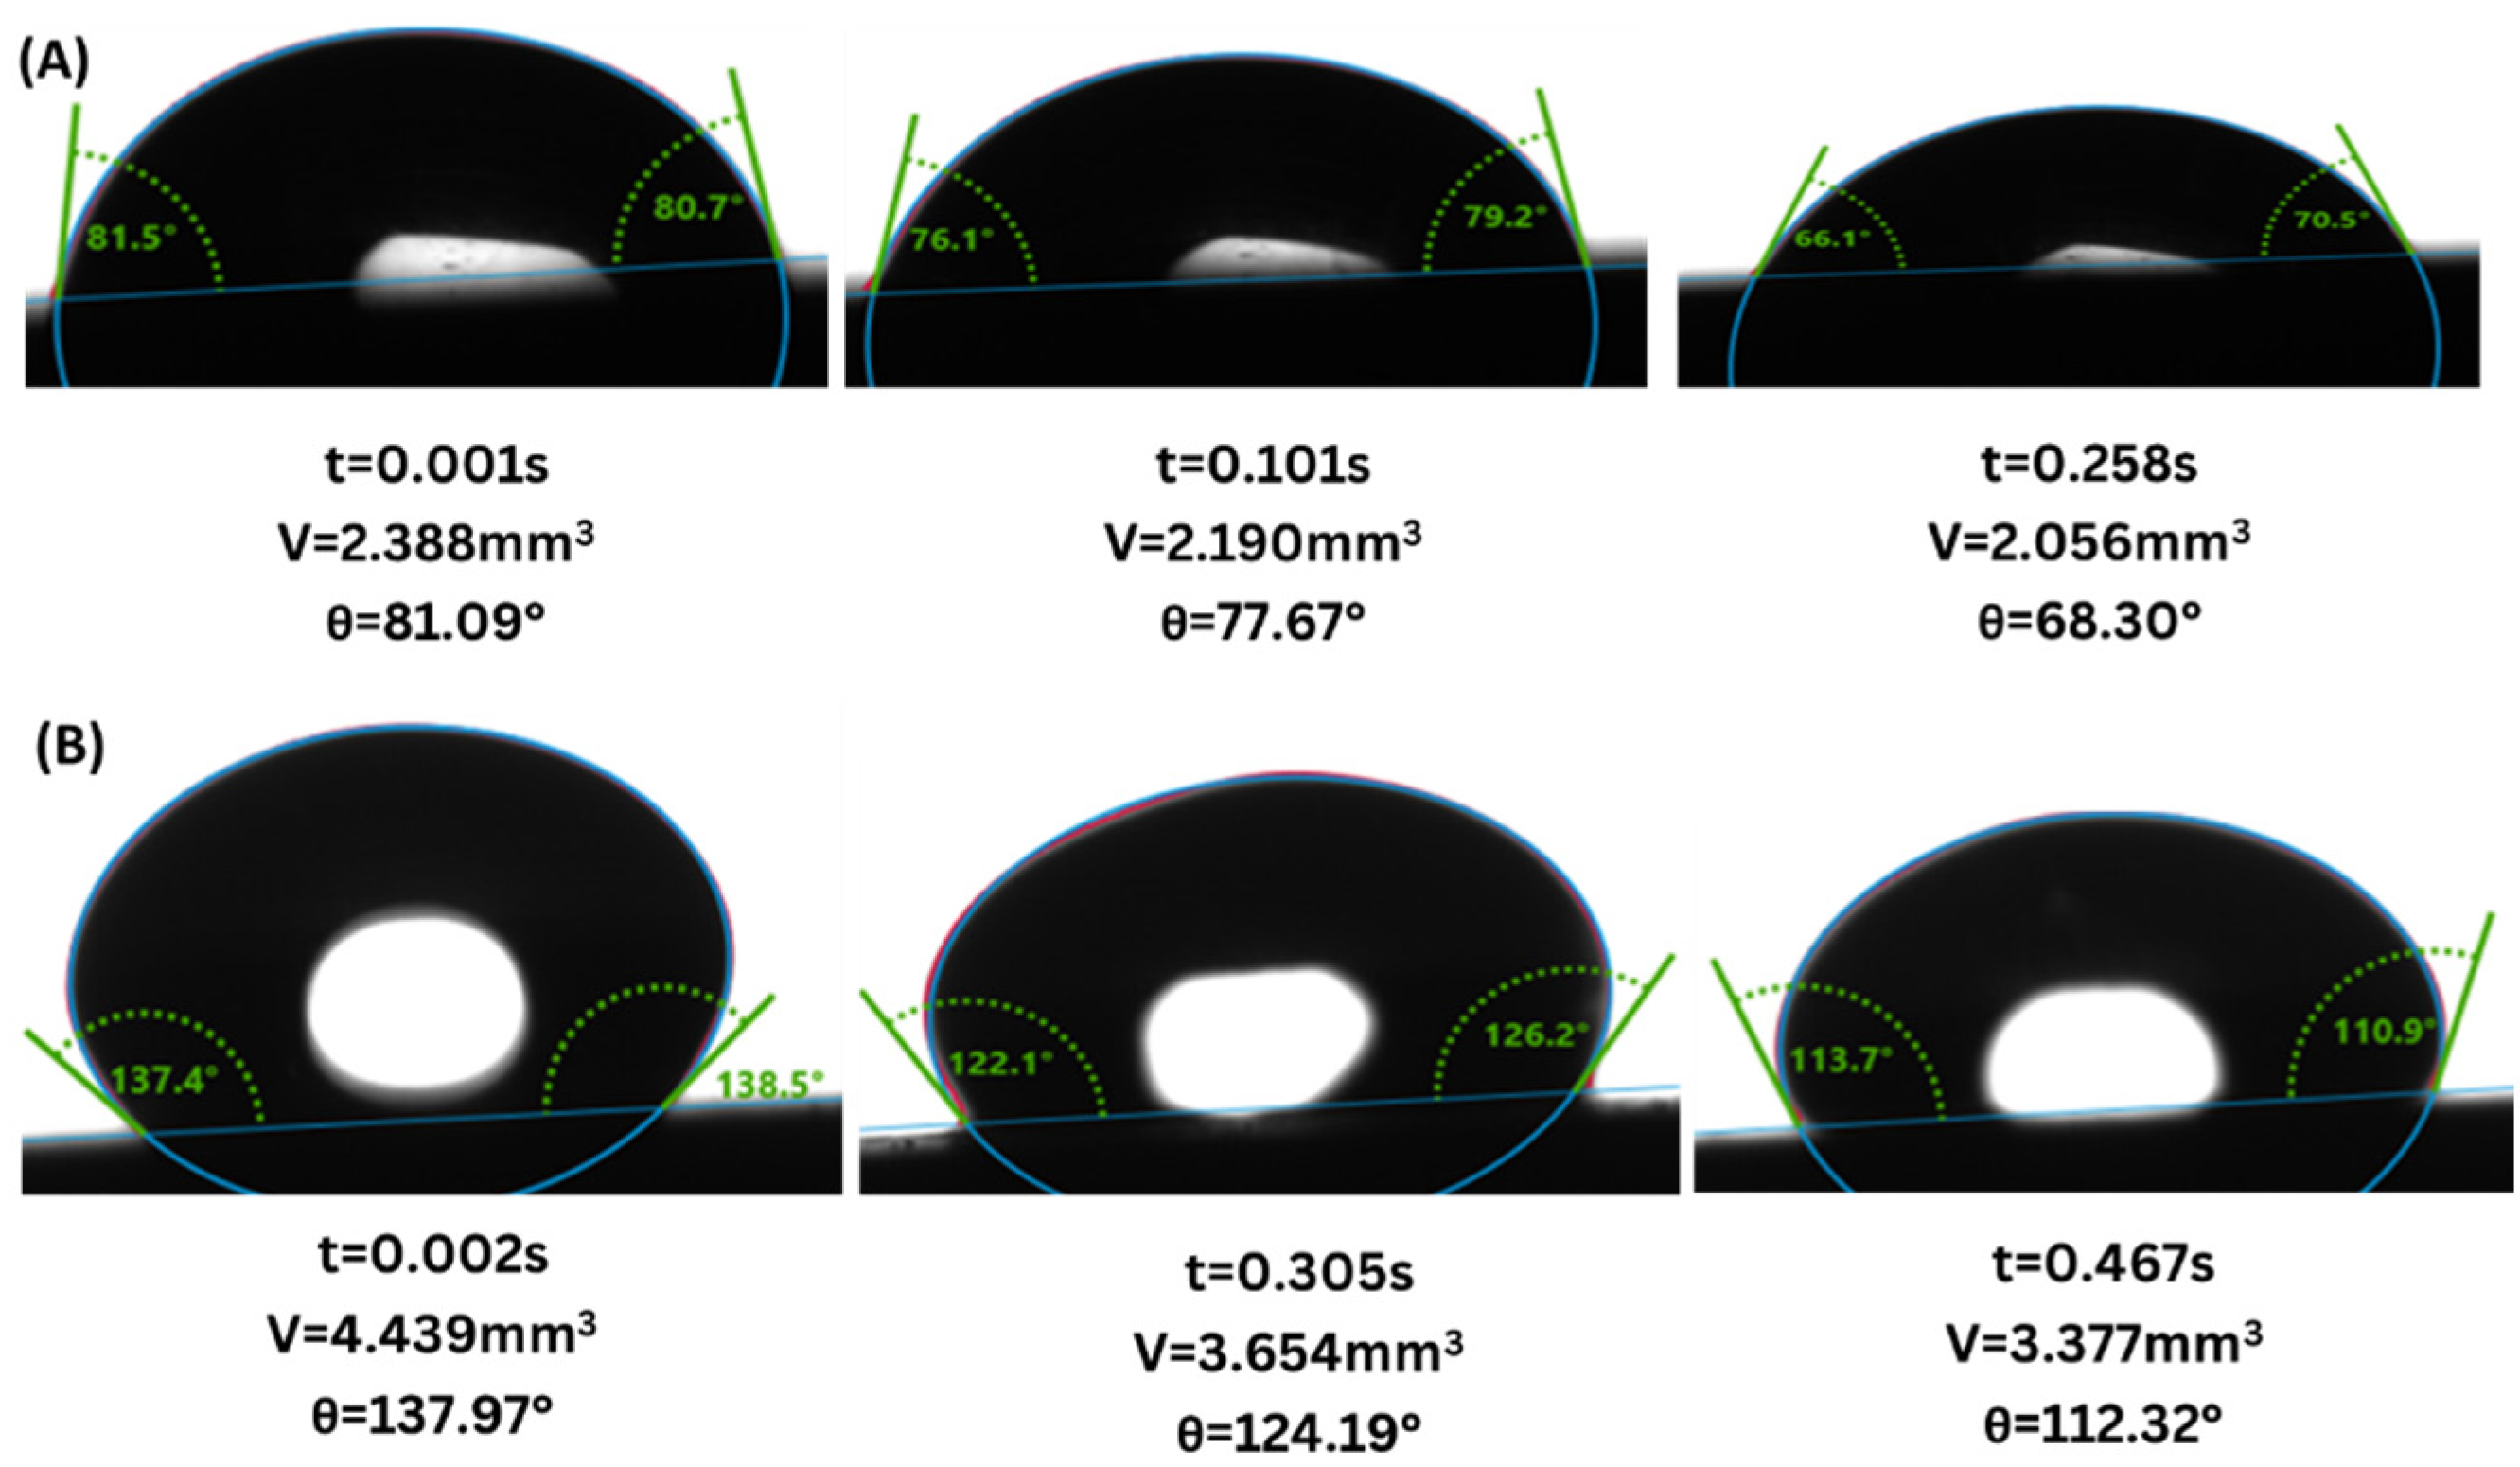
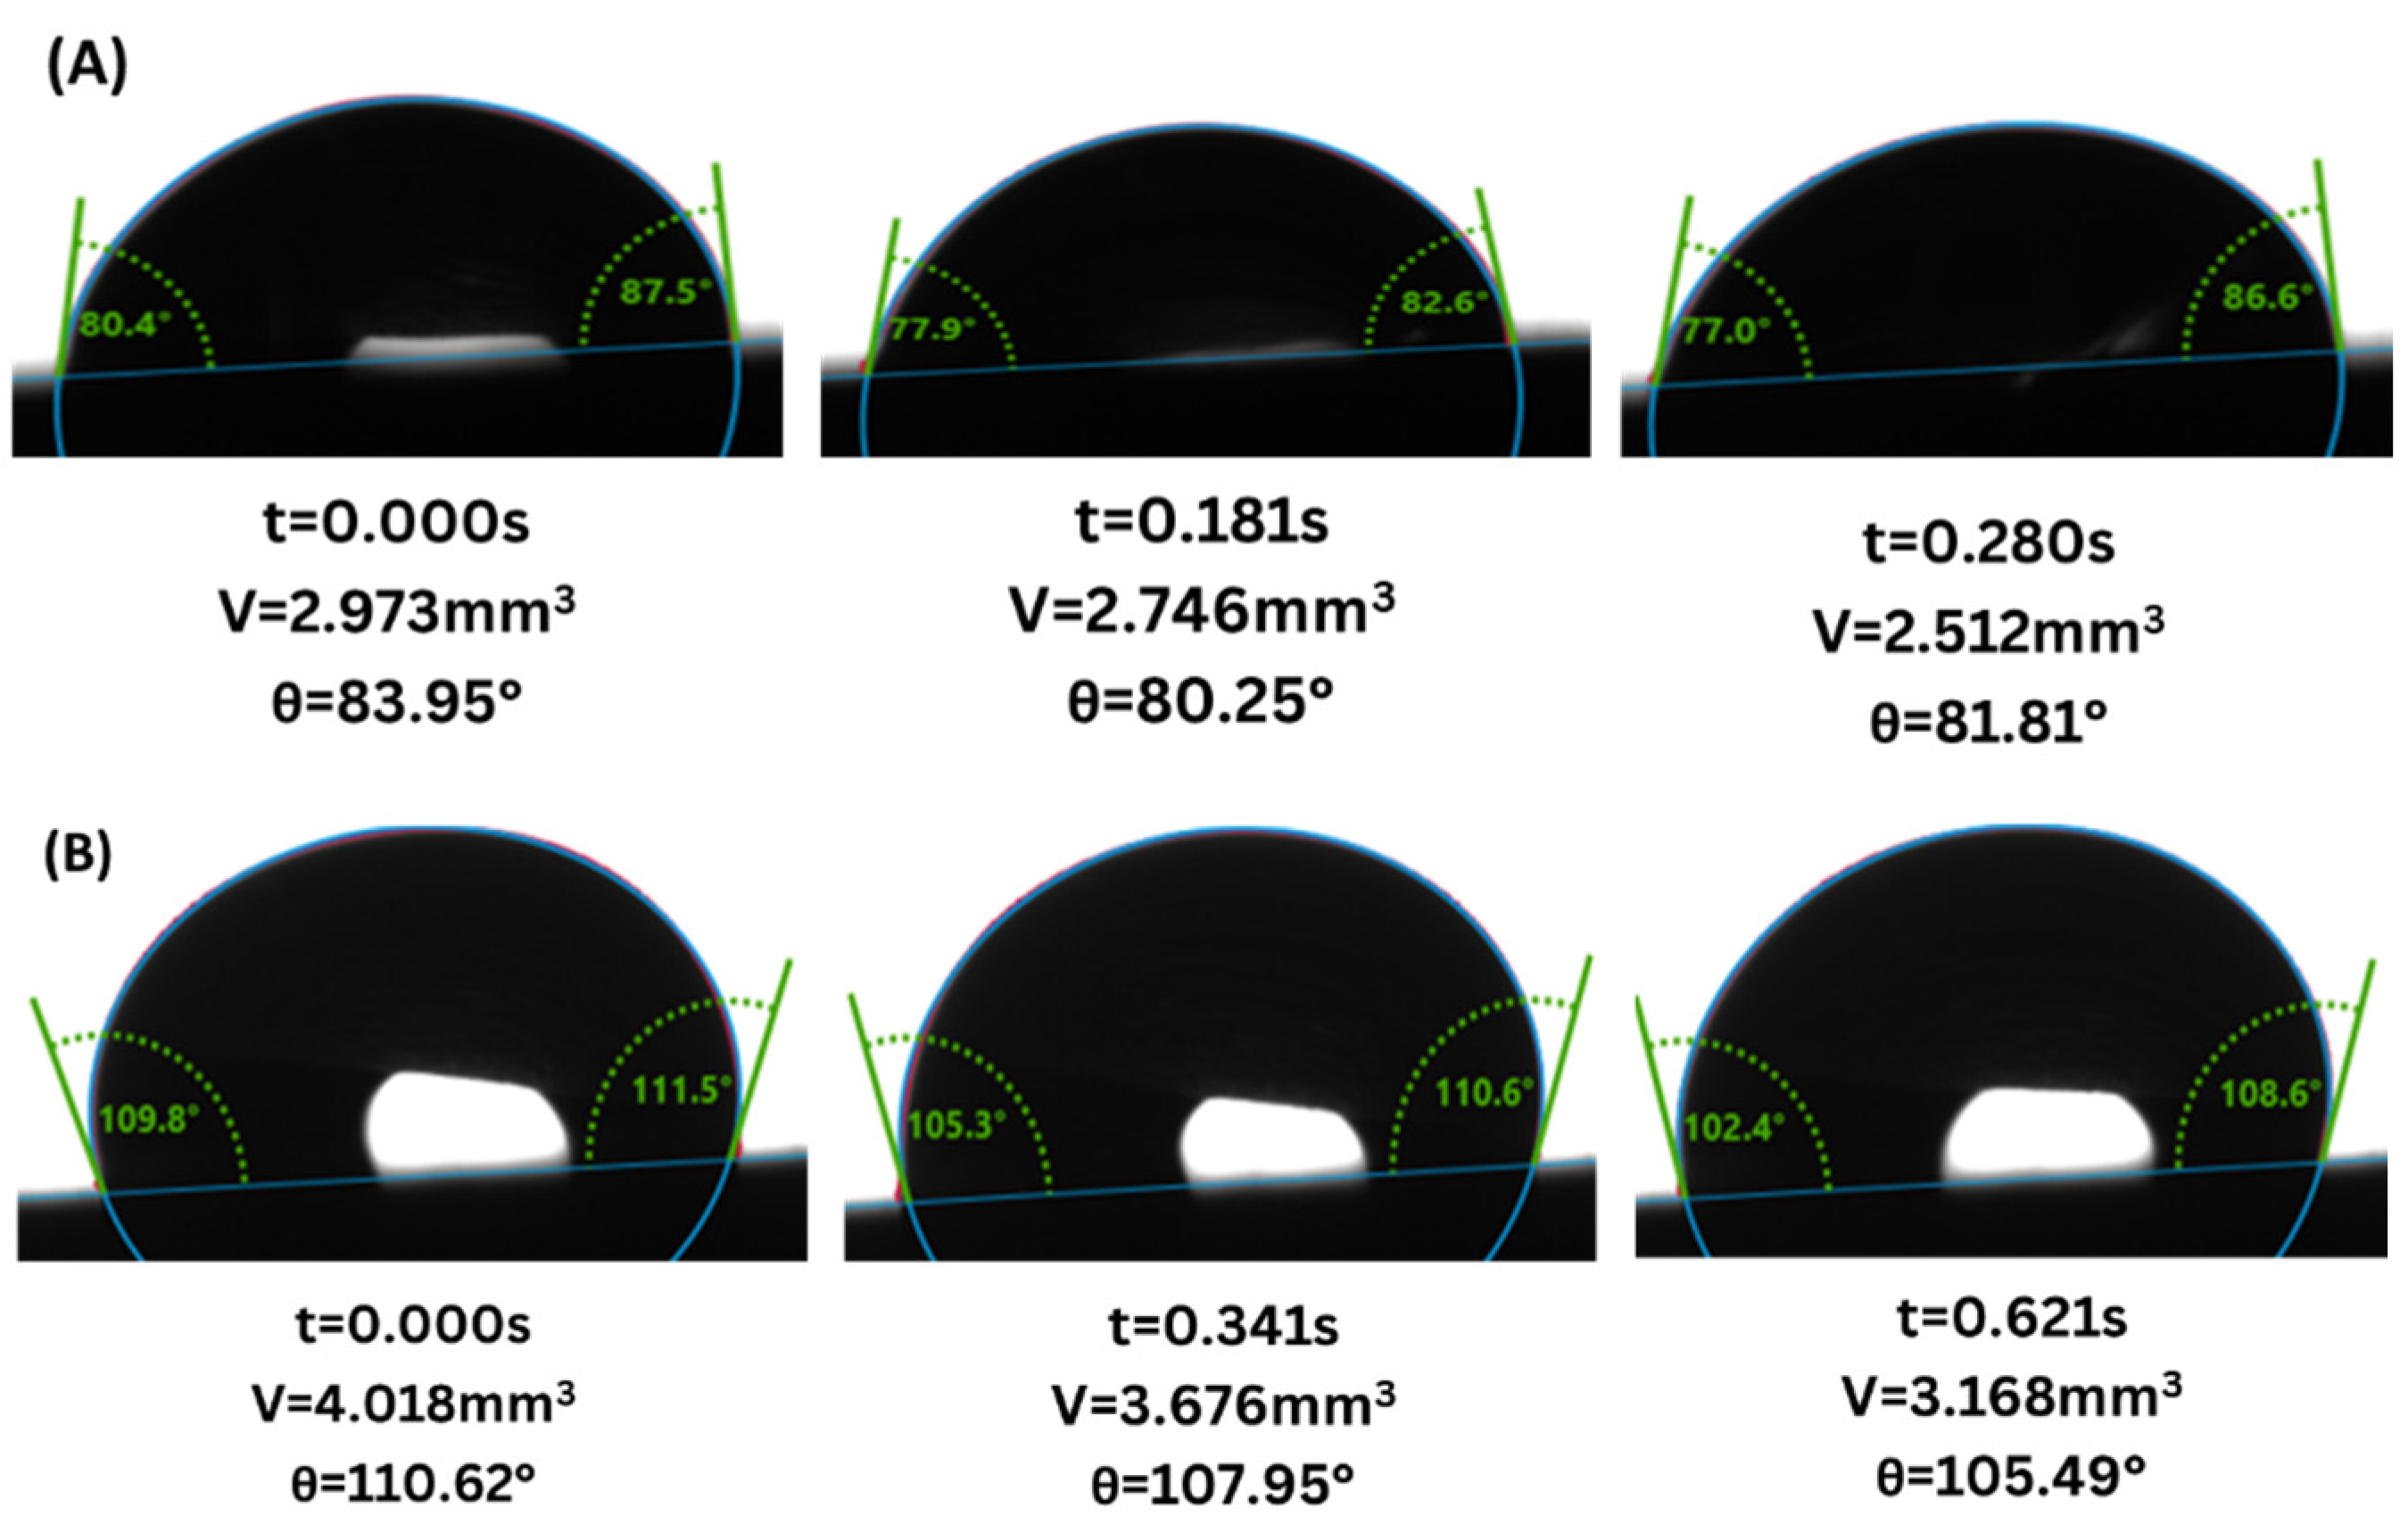
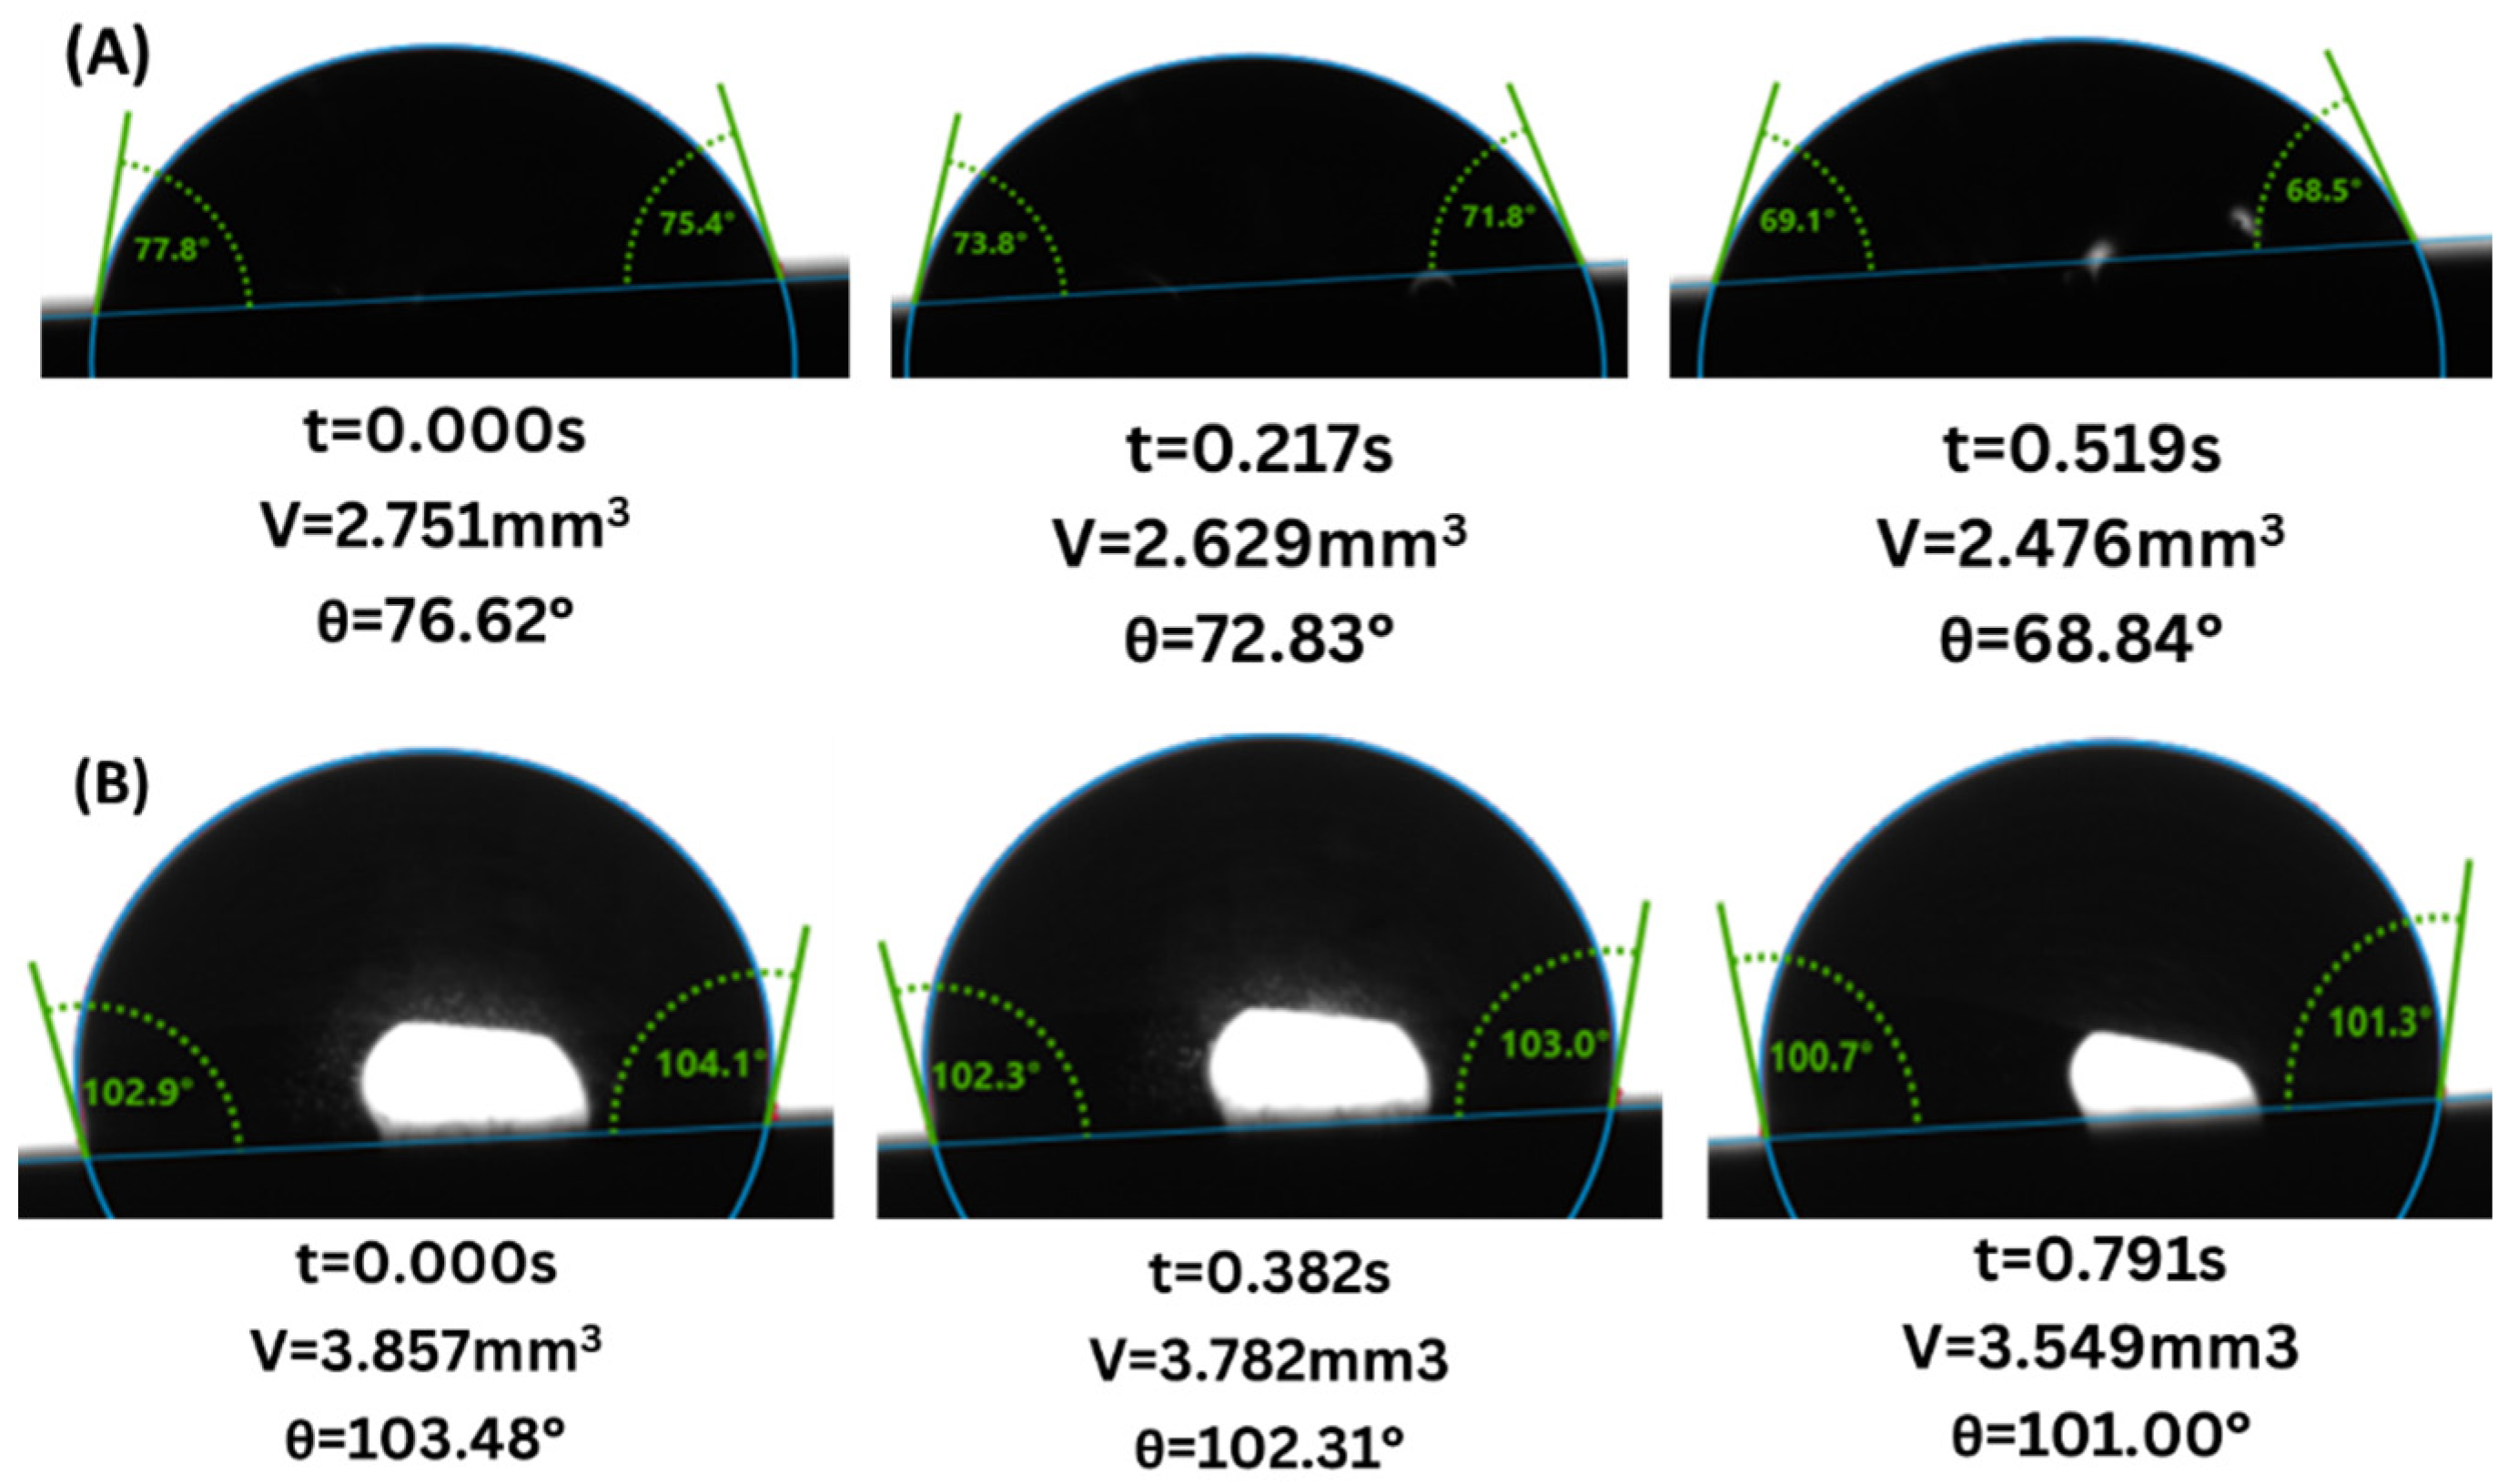
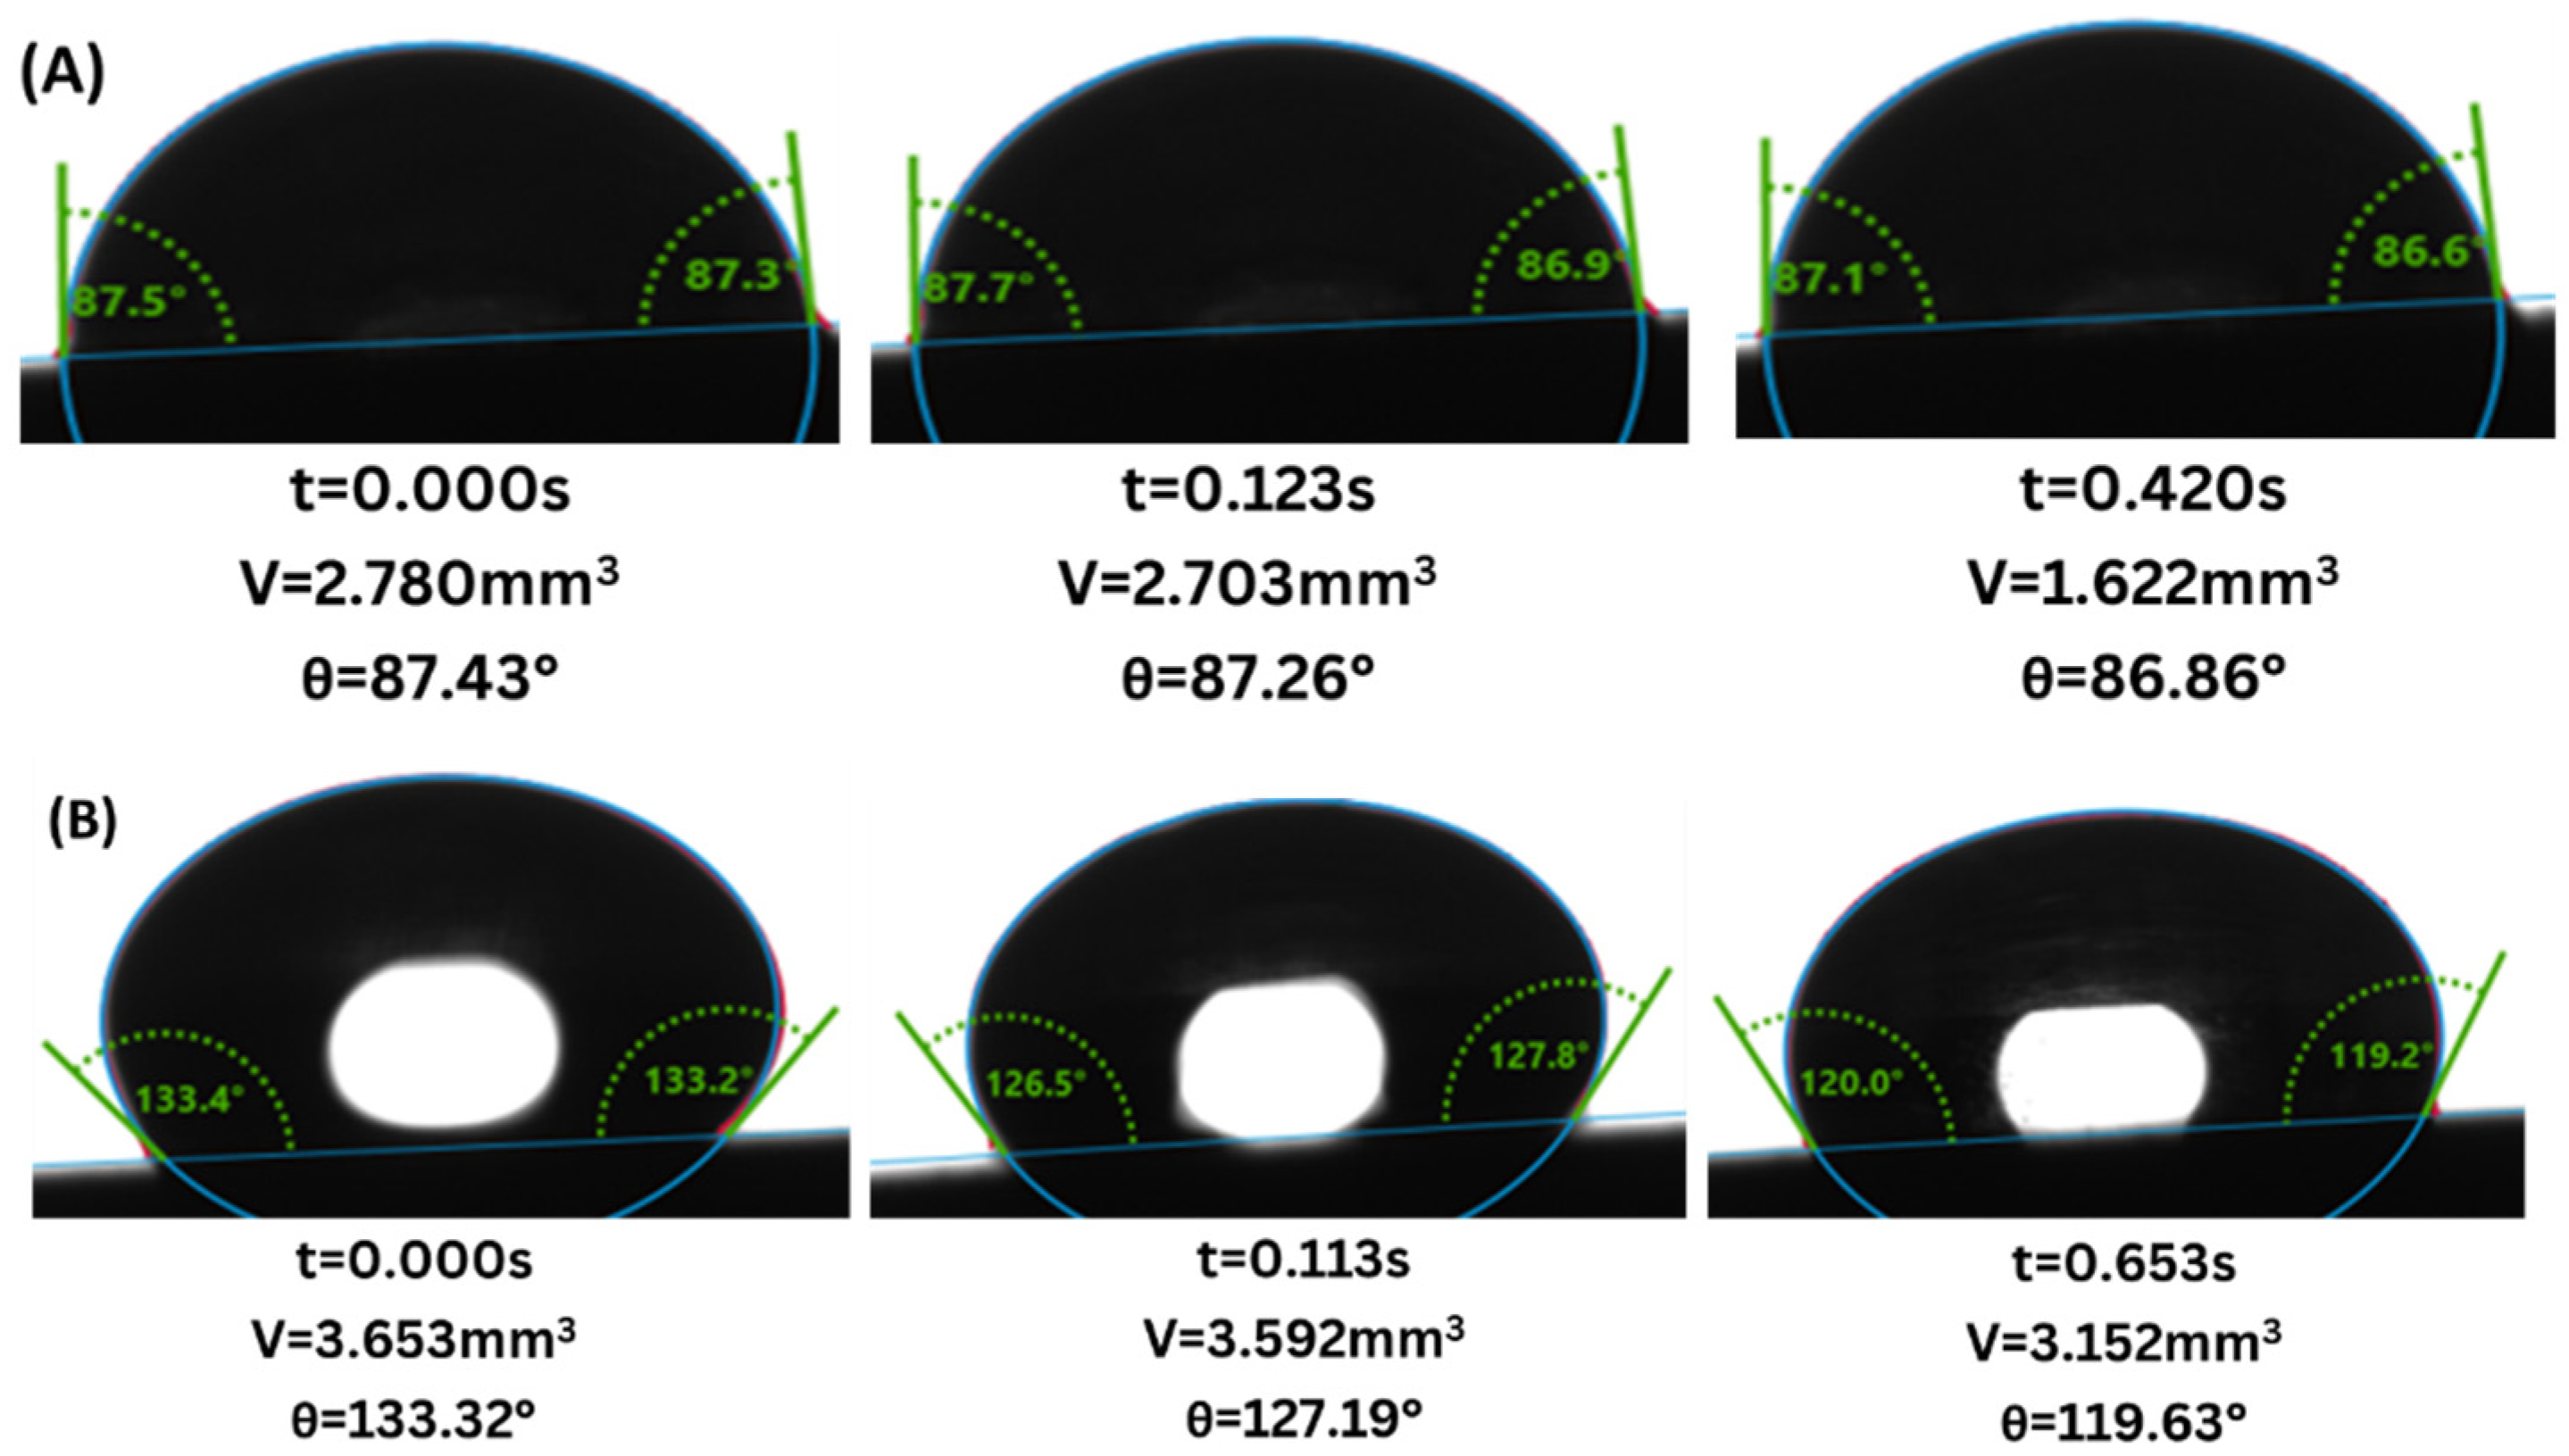
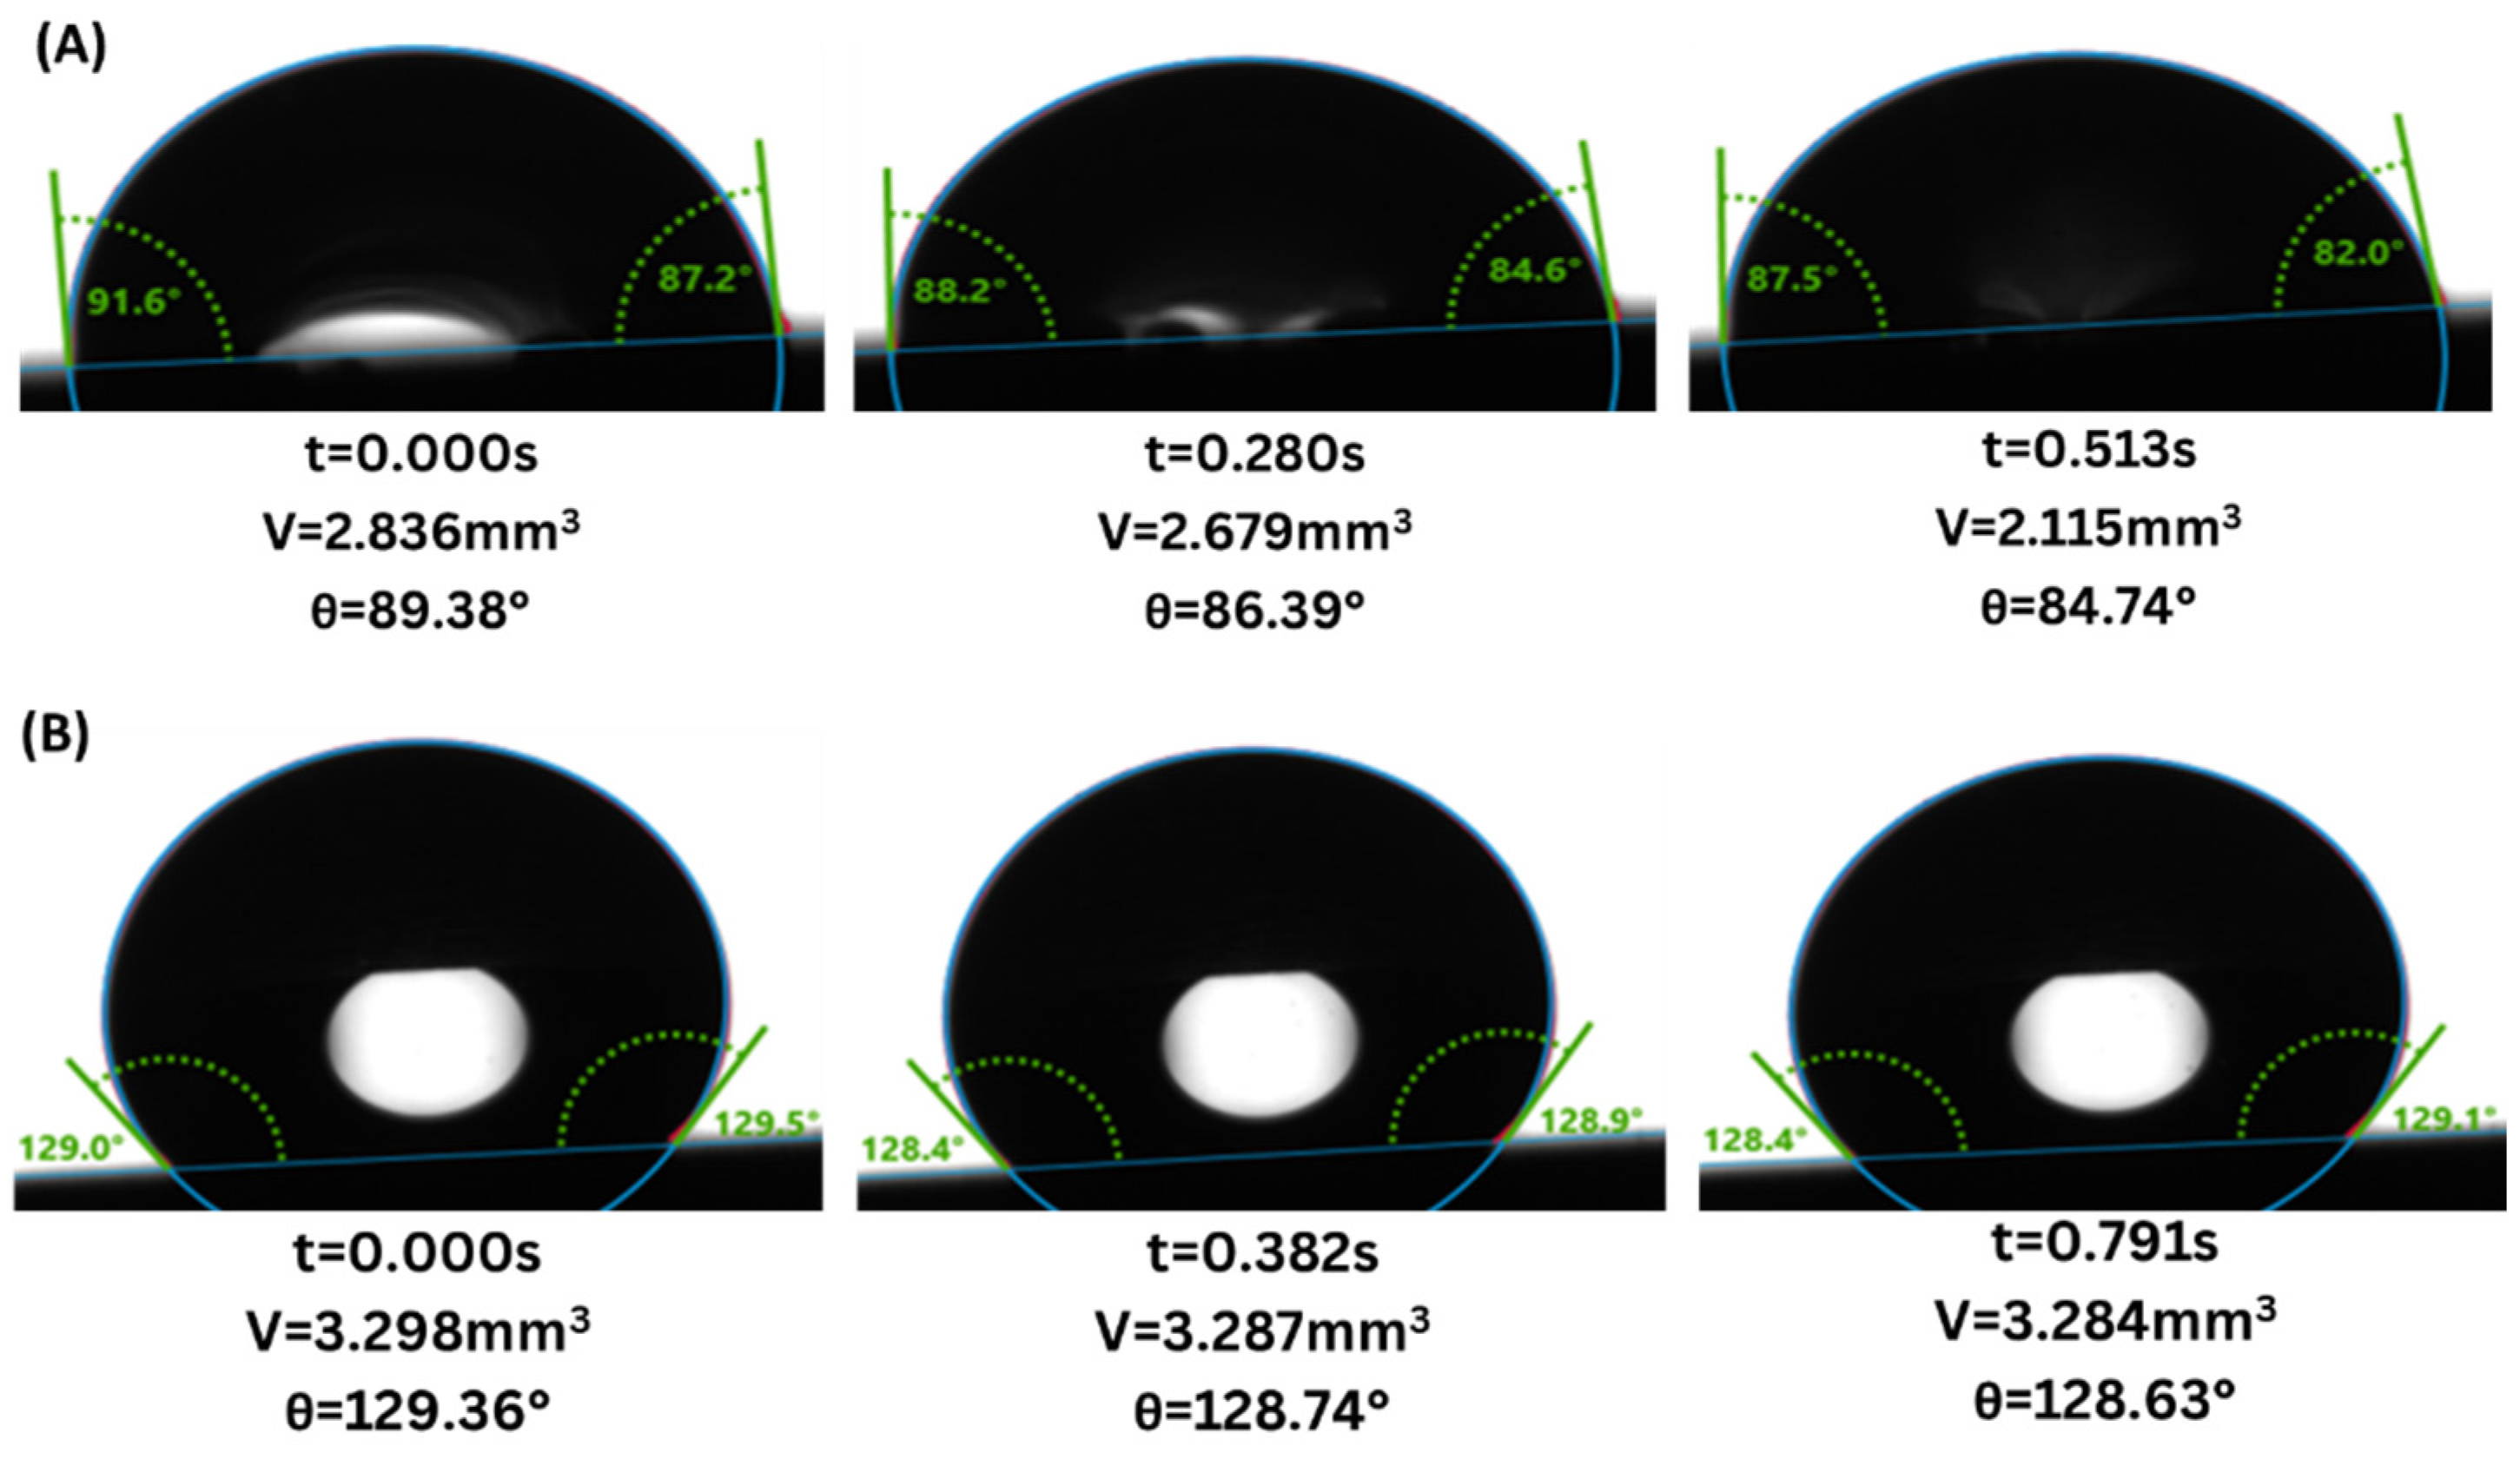
Figure 5, Figure 6 and Figure 7 show digital images of the pretest and post-test CA measurements for 168 h of exposure time for the three injection strategies as evidence of how the droplet shape evolved due to its modification by scCO2. The final wettability, assessed after implementing CCI, WAG, and SAI injection strategies, is also shown in Table 1. Post-exposure, the final CA was recorded to assess the changes induced by the interaction with the exposure environment. These angles showed a considerable shift, ranging from 81.5° to 124.2°, suggesting significant surface property changes due to the injection of scCO2 through the samples. The average final CA observed was approximately 98.42°, indicating a general trend towards increased hydrophobicity or alteration of other surface characteristics.
In contrast to the initial CAs, the final CAs demonstrated greater variability, with a standard deviation of about 13.09. This increased spread indicates a diverse range of surface responses to the treatments applied. This can be attributed to the differential impact of the exposure types and the injection strategies employed. The variation in final CAs highlights the influence of experimental conditions on surface properties, providing a rich dataset for analyzing each treatment strategy’s effectiveness and potential applications. The CA range suggests that the Berea sandstone changed from a weak water-wet system to a weak CO2-wet system. This result is corroborated by Mutailipu et al. (2019), where the influence of scCO2 and water at elevated temperatures and pressures led to Berea sandstone samples becoming less water-wet as the CO2 phase state changed from subcritical to supercritical [24]. The observed changes in CAs suggest modifications in surface properties, potentially pointing to alterations in surface hydrophobicity or other physical characteristics. For more of these for 24 h and 72 h changes, see the supplementary information (i.e., Figures S1–S6 in Supplementary Materials).
Similarly, Indiana limestone CA ranged from 77.6 to 87.9° with an average of 83.6° with a narrow variability, as indicated by a standard deviation of 2.80°, which is slightly higher than the Berea sandstone, but still indicates a water-wet to intermediate-wet system, as shown in Table 2. Christensen et al. (2017) measured Indiana limestone CAs from 55.1 to 150.0°, which agrees with our results [72].
Post-exposure, the CAs shift significantly from 94.6 to 128.0°, representing a CO2-wet system with lower variability than sandstone samples showing increased variability (standard deviation of 3.5°). The increases in CAs show considerable variability, ranging from modest increases around 10° to significant shifts exceeding 40°. This variability underscores the nuanced response of CAs to the injection processes. Dos Santos Lucas et al. (2020) and Felix Feldmann et al. (2021) measured original and varying CAs in Indiana limestone using distilled and various saline waters, respectively [73,74], highlighting substantial variations dependent on the fluid medium. These studies corroborate the sensitivity of rock surface wettability to environmental conditions and fluid composition. Figure 8, Figure 9 and Figure 10 display digital images capturing the evolution of droplet shapes before and after 168 h of exposure, demonstrating the impact of scCO2 on the CA measurements for the three injection strategies. These images visually illustrate how the droplet shape has been altered due to the interaction with scCO2. For more of these for 24 h and 72 h changes, see the supplementary information (i.e., Figures S7–S12 in Supplementary Materials).
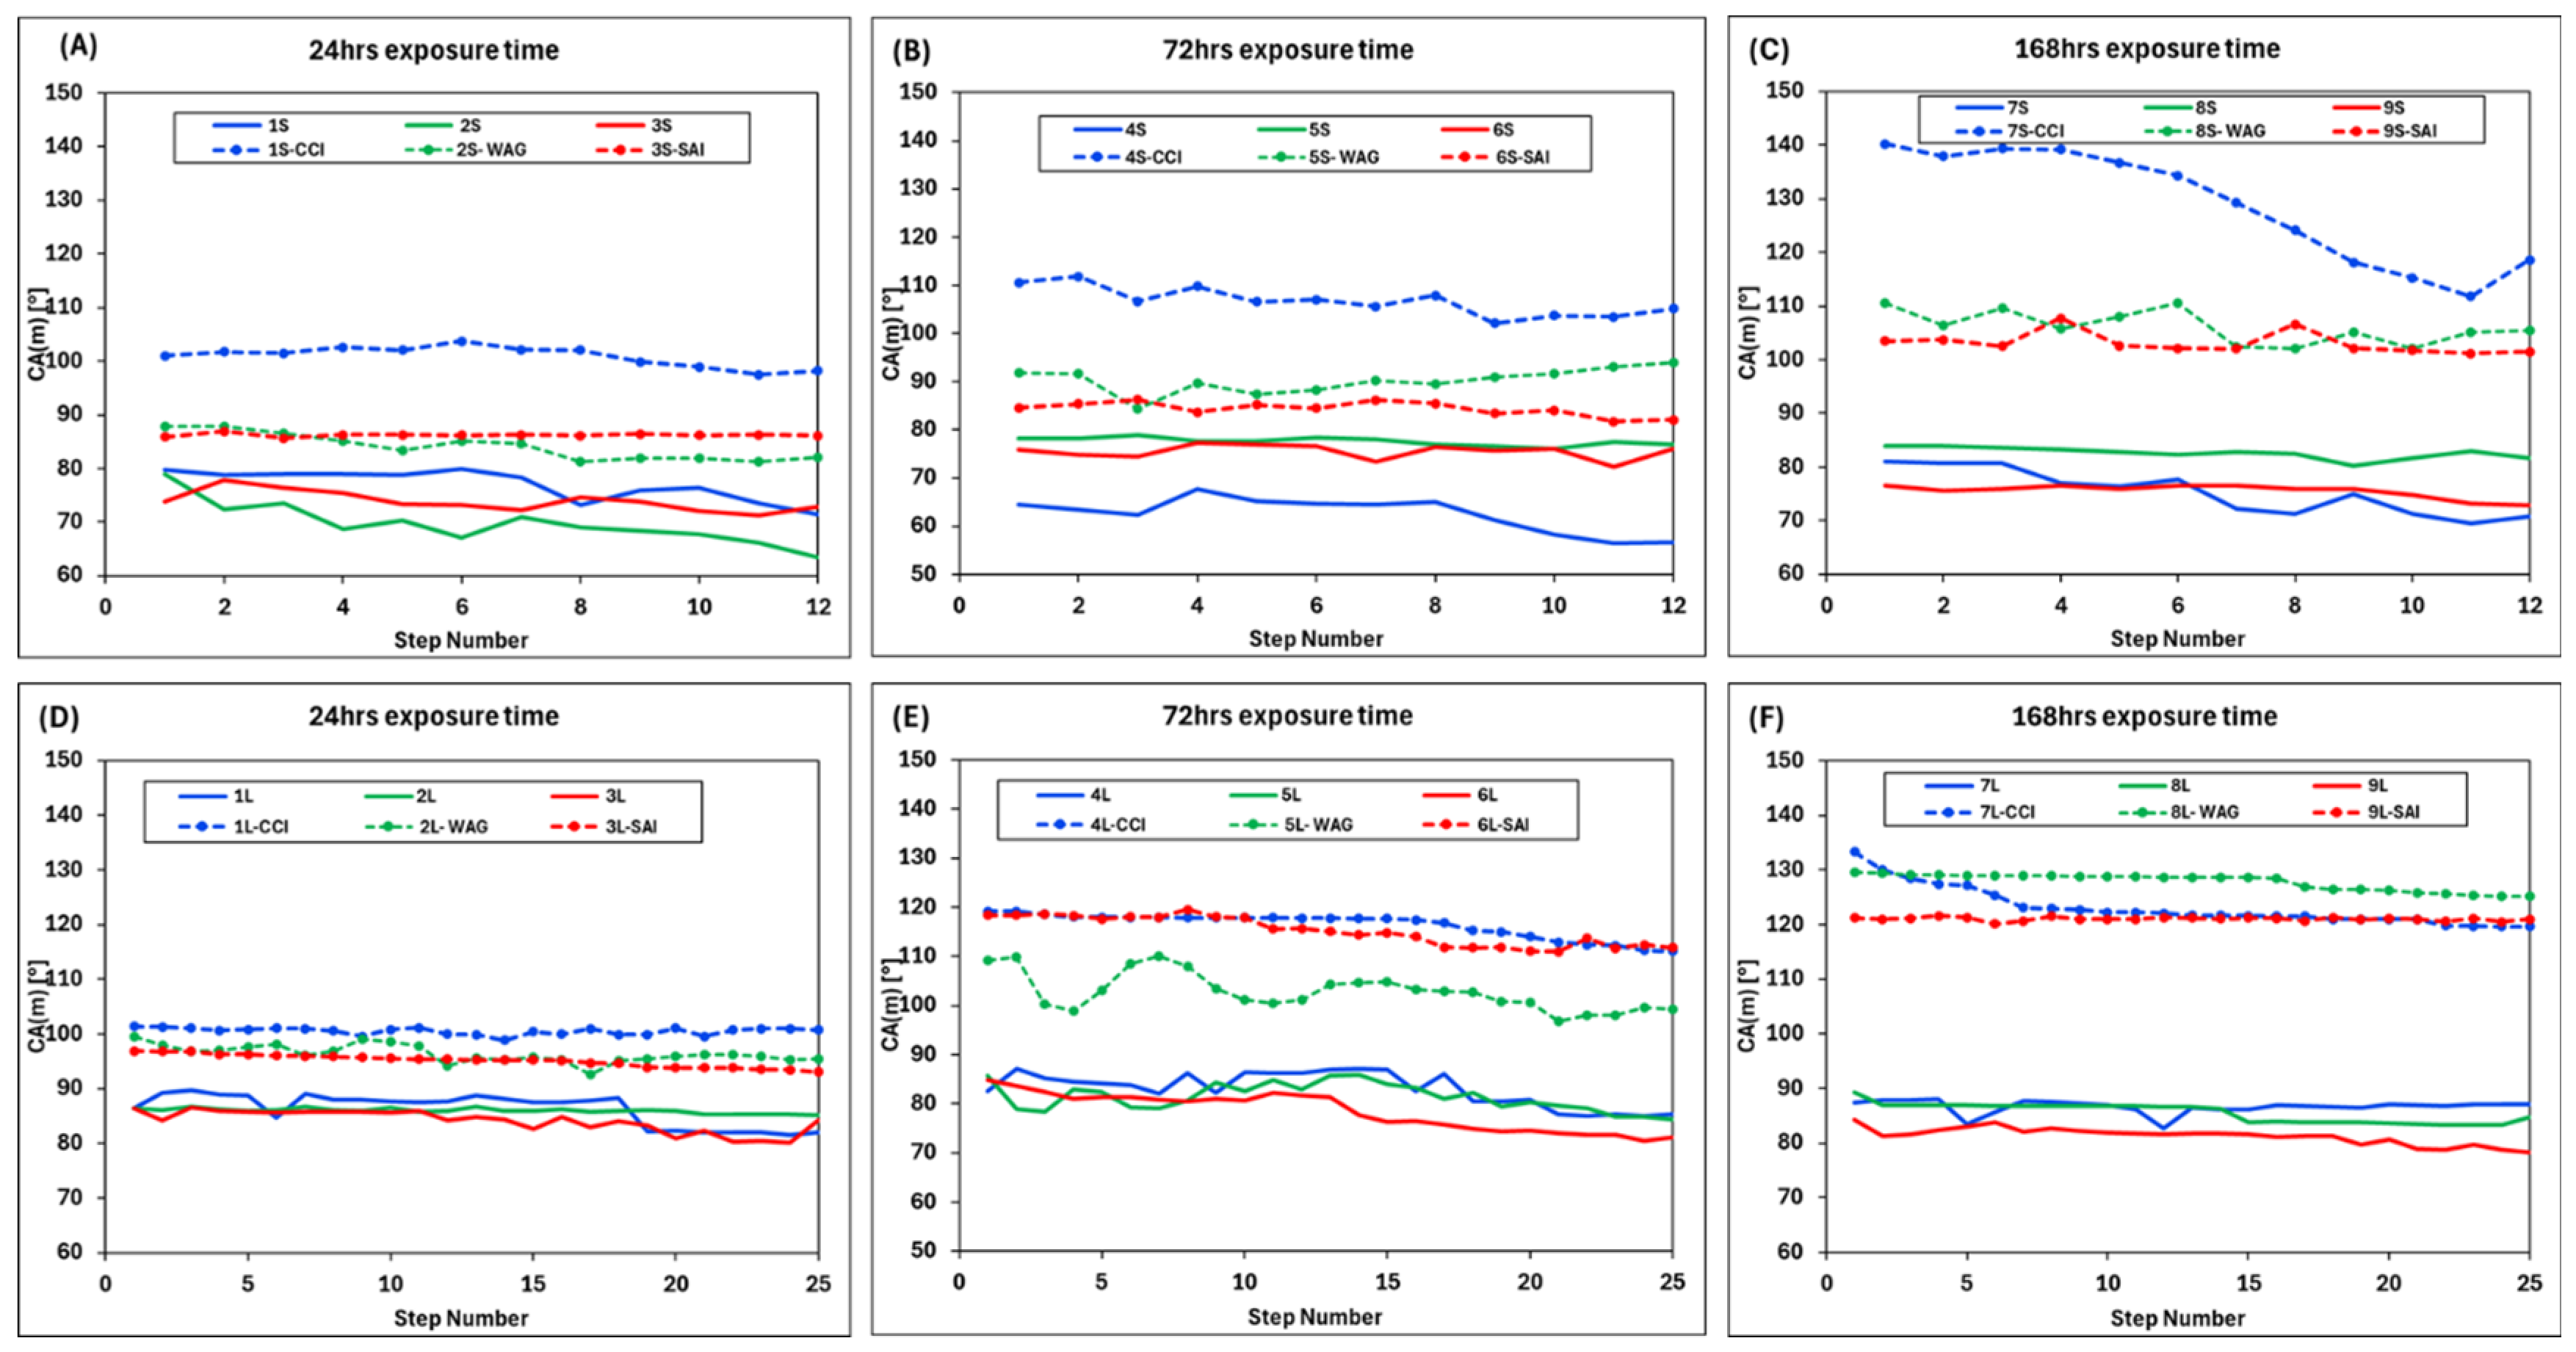
For repeatability measurement, at least ten 10 steps and 25 steps of data count were measured for each injection scenario for sandstone and limestone, respectively, as shown in Figure 11, to ensure that the measurement was consistent for some time. In addition, for each sample, the pretest and post-test measurements were taken twice to ensure consistency in the results.

4. Discussion

Wettability alterations have direct implications for carbon storage efficiency. More water-wet conditions generally enhance the capillary trapping of CO2, thereby increasing the security and capacity of CO2 storage. This effect is crucial in preventing CO2 from migrating upwards and potentially leaking from the reservoir; hence, there is a need to conserve the original wettability of the formation. This is not the case, especially when the formation is exposed to scCO2, because the WA occurs, making the formation CO2-wet. To reduce this effect, water is introduced in the injection strategy to slow the effect or prevent early and fast surface modification. The results of the wettability experiments indicated different effects for each injection strategy in sandstone and limestone. Variation in exposure times was crucial for assessing the kinetics of surface interactions over both short and extended periods, aiding in understanding the temporal dynamics of surface modifications, critical for applications in CCS. Figure 12 illustrates that CA increased for sandstone, with longer exposure times correlating with more substantial changes.

4.1. Gray Berea Sandstone

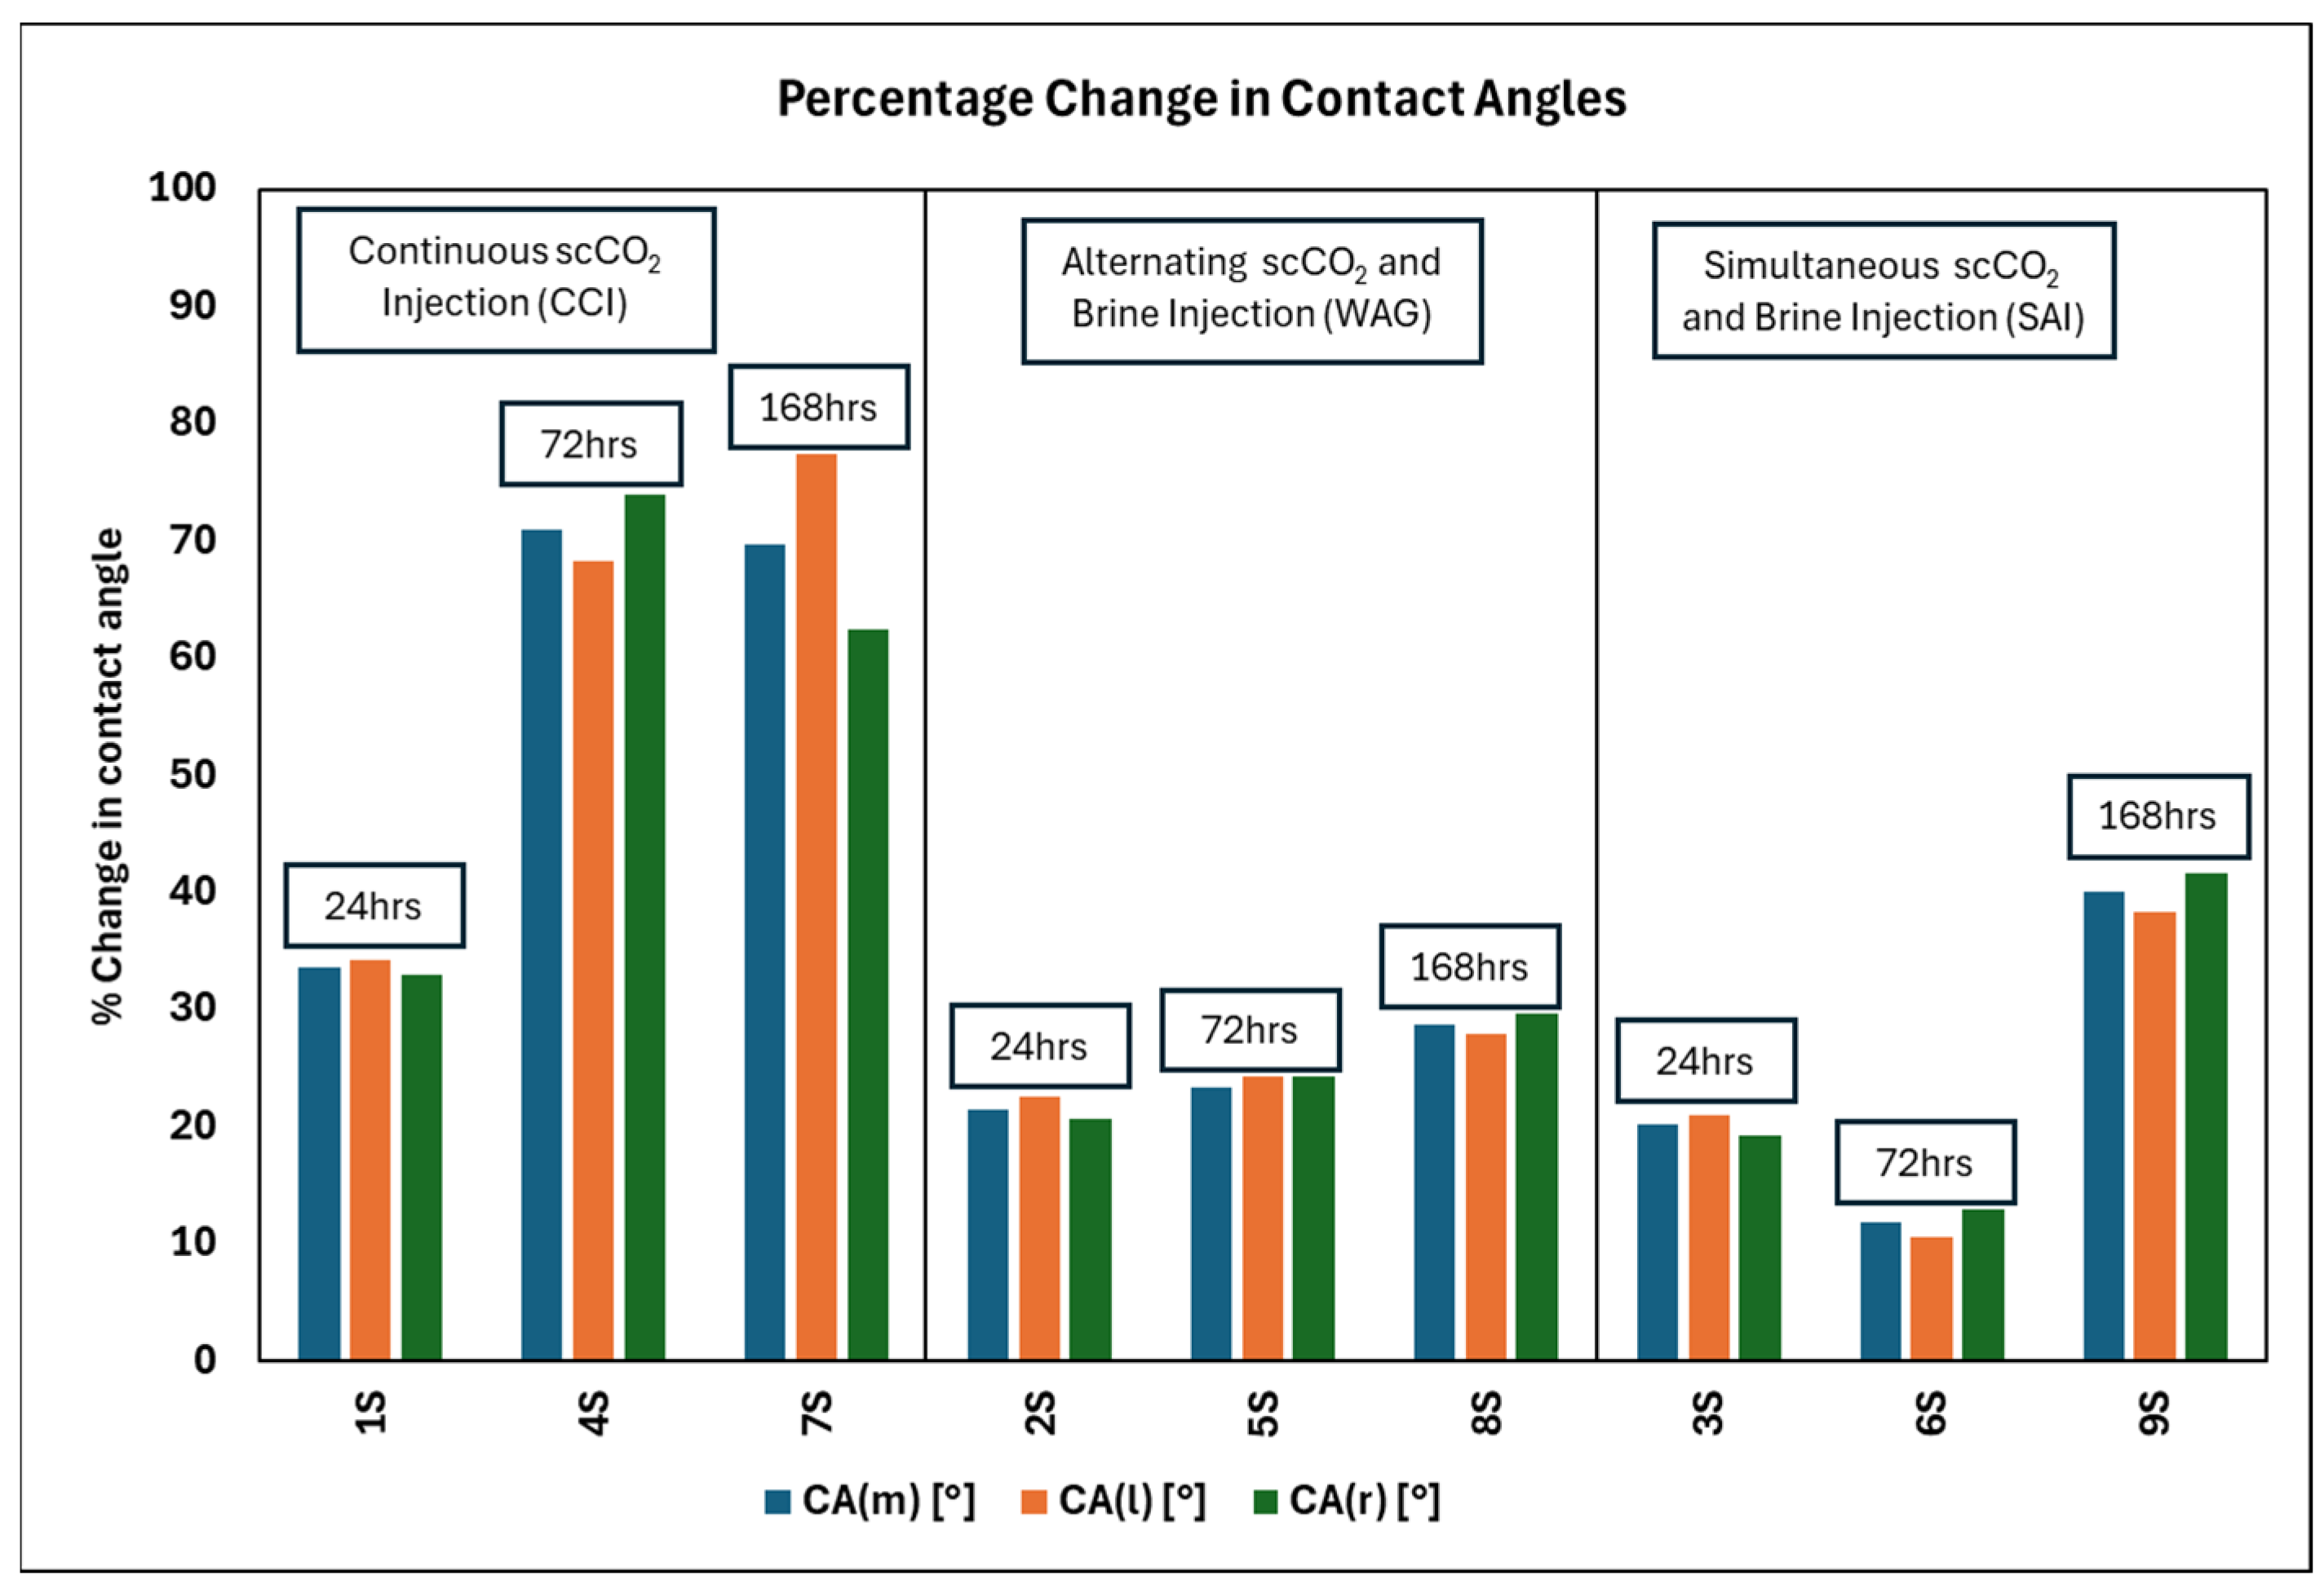
For the CCI strategy, the initial average CA in sandstone post-injection increased by 32–77% depending on the exposure duration, indicating a significant shift toward more CO2-wet conditions. Specifically, Berea sandstone’s largest variation occurred with a 168 h exposure (525 PV scCO2 injection). This trend suggests that the surface–treatment interaction intensifies over time due to increased absorption, diffusion, or chemical reactions at the surface. At the same time, a steady increase in post-injection increased by 20–29%. This shows that WAG resulted in the least changes, suggesting that the water introduction slows surface modification due to dilution and limited chemical reaction or formation of weak acid. This is not the case in the SAI strategy, because the CA increases slightly (i.e., lower than the WAG increase) in the 24 and 72 h injection time, but was followed by a larger increase in the longer injection period. This may be due to sample 9S having higher permeability than 3S and 6S coupled with a longer injection period. This is because permeability plays a significant role in the fluid–rock interactions that determine the CA, such as uniform fluid distribution and easier flow of fluids. In rocks with higher permeability, scCO2 can more readily penetrate the pore structure, potentially altering the surface properties more extensively than in rocks with lower permeability. Permeability affects capillary pressure, which influences the wetting phase behavior in porous media. Lower permeability typically results in higher capillary pressures, which can enhance the capillary trapping of scCO2 and influence the CA by modifying the wetting characteristics of the rock.
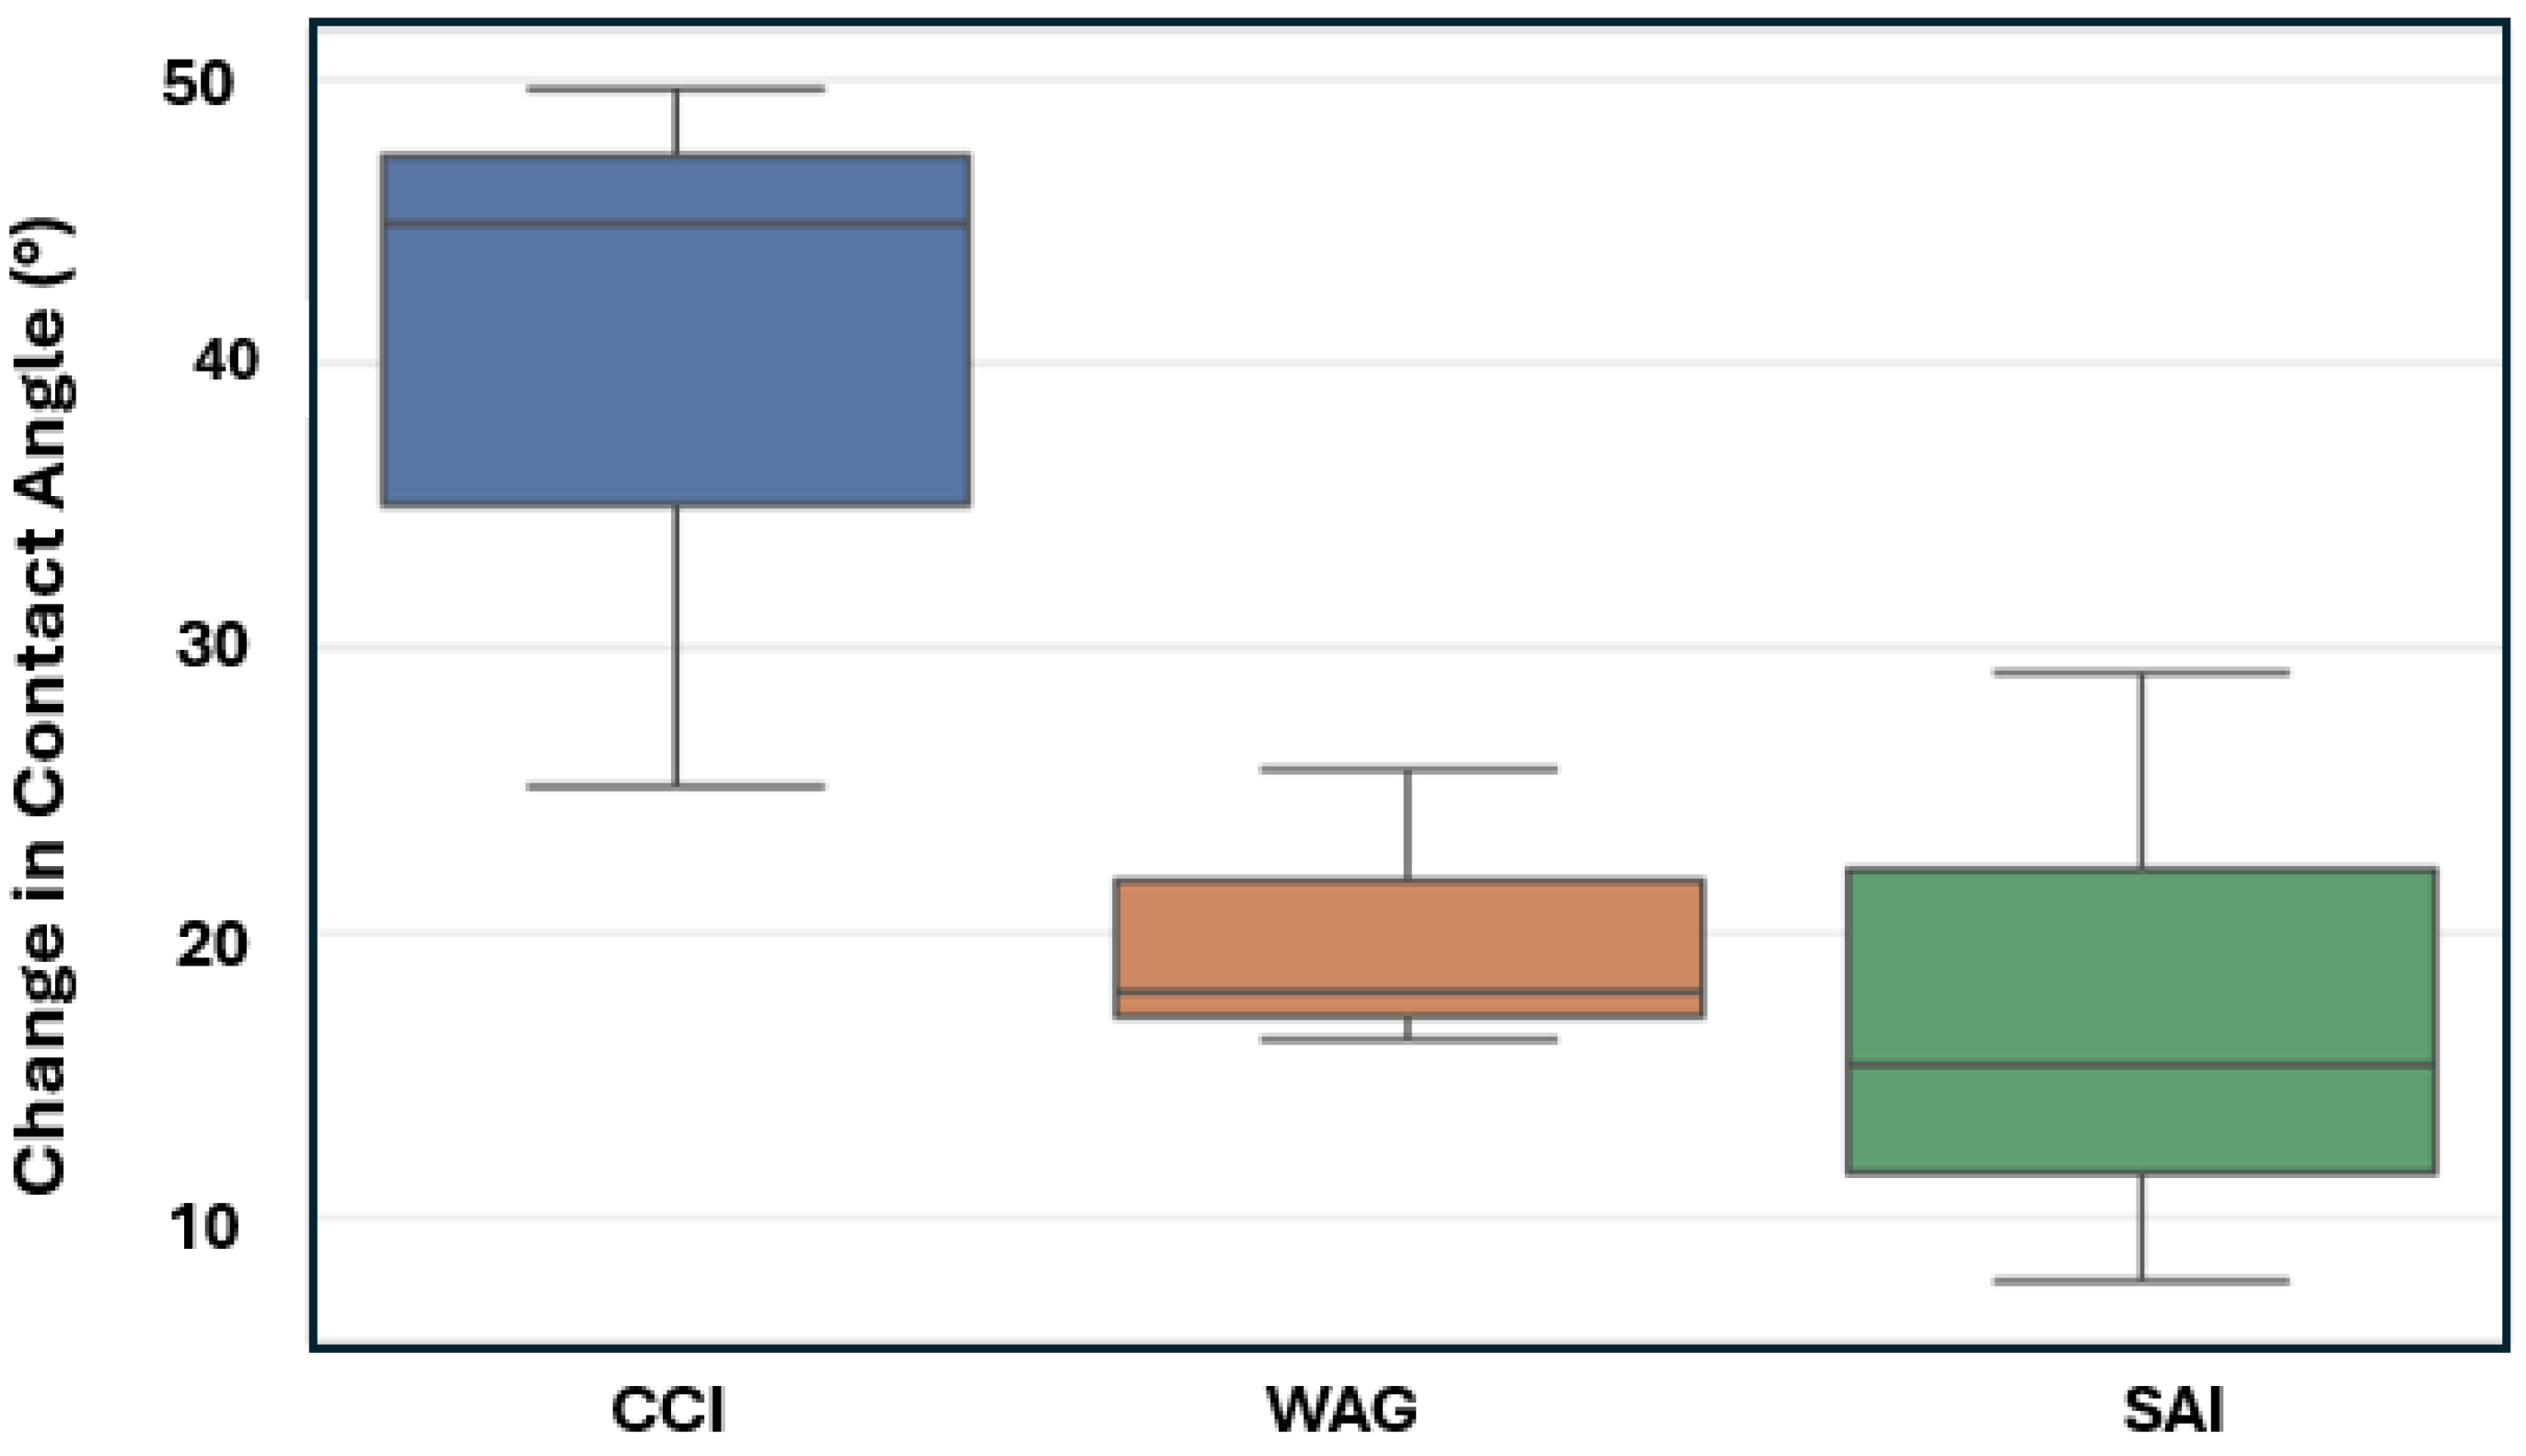
For the Berea sandstone, the data indicate significant variability and differing impacts of scCO2 injection strategies on the CAs of samples, with the only significant difference observed between CCI and SAI. CCI shows a broad range of angle changes, indicating high variability in its impact on the samples, as shown in Figure 12. WAG, in contrast, presents a smaller and more consistent change, suggesting a less aggressive impact. Similarly, SAI demonstrates variability, but less so than CCI. Statistically, to further quantify these observations, the mean changes in CAs for CCI, WAG, and SAI are 39.9° (with a variability of 13.02°), 19.93° (with a variability of 5.07°), and 17.37° (with a variability of 10.85°), respectively, as shown in Figure 13.

4.2. Indiana Limestone

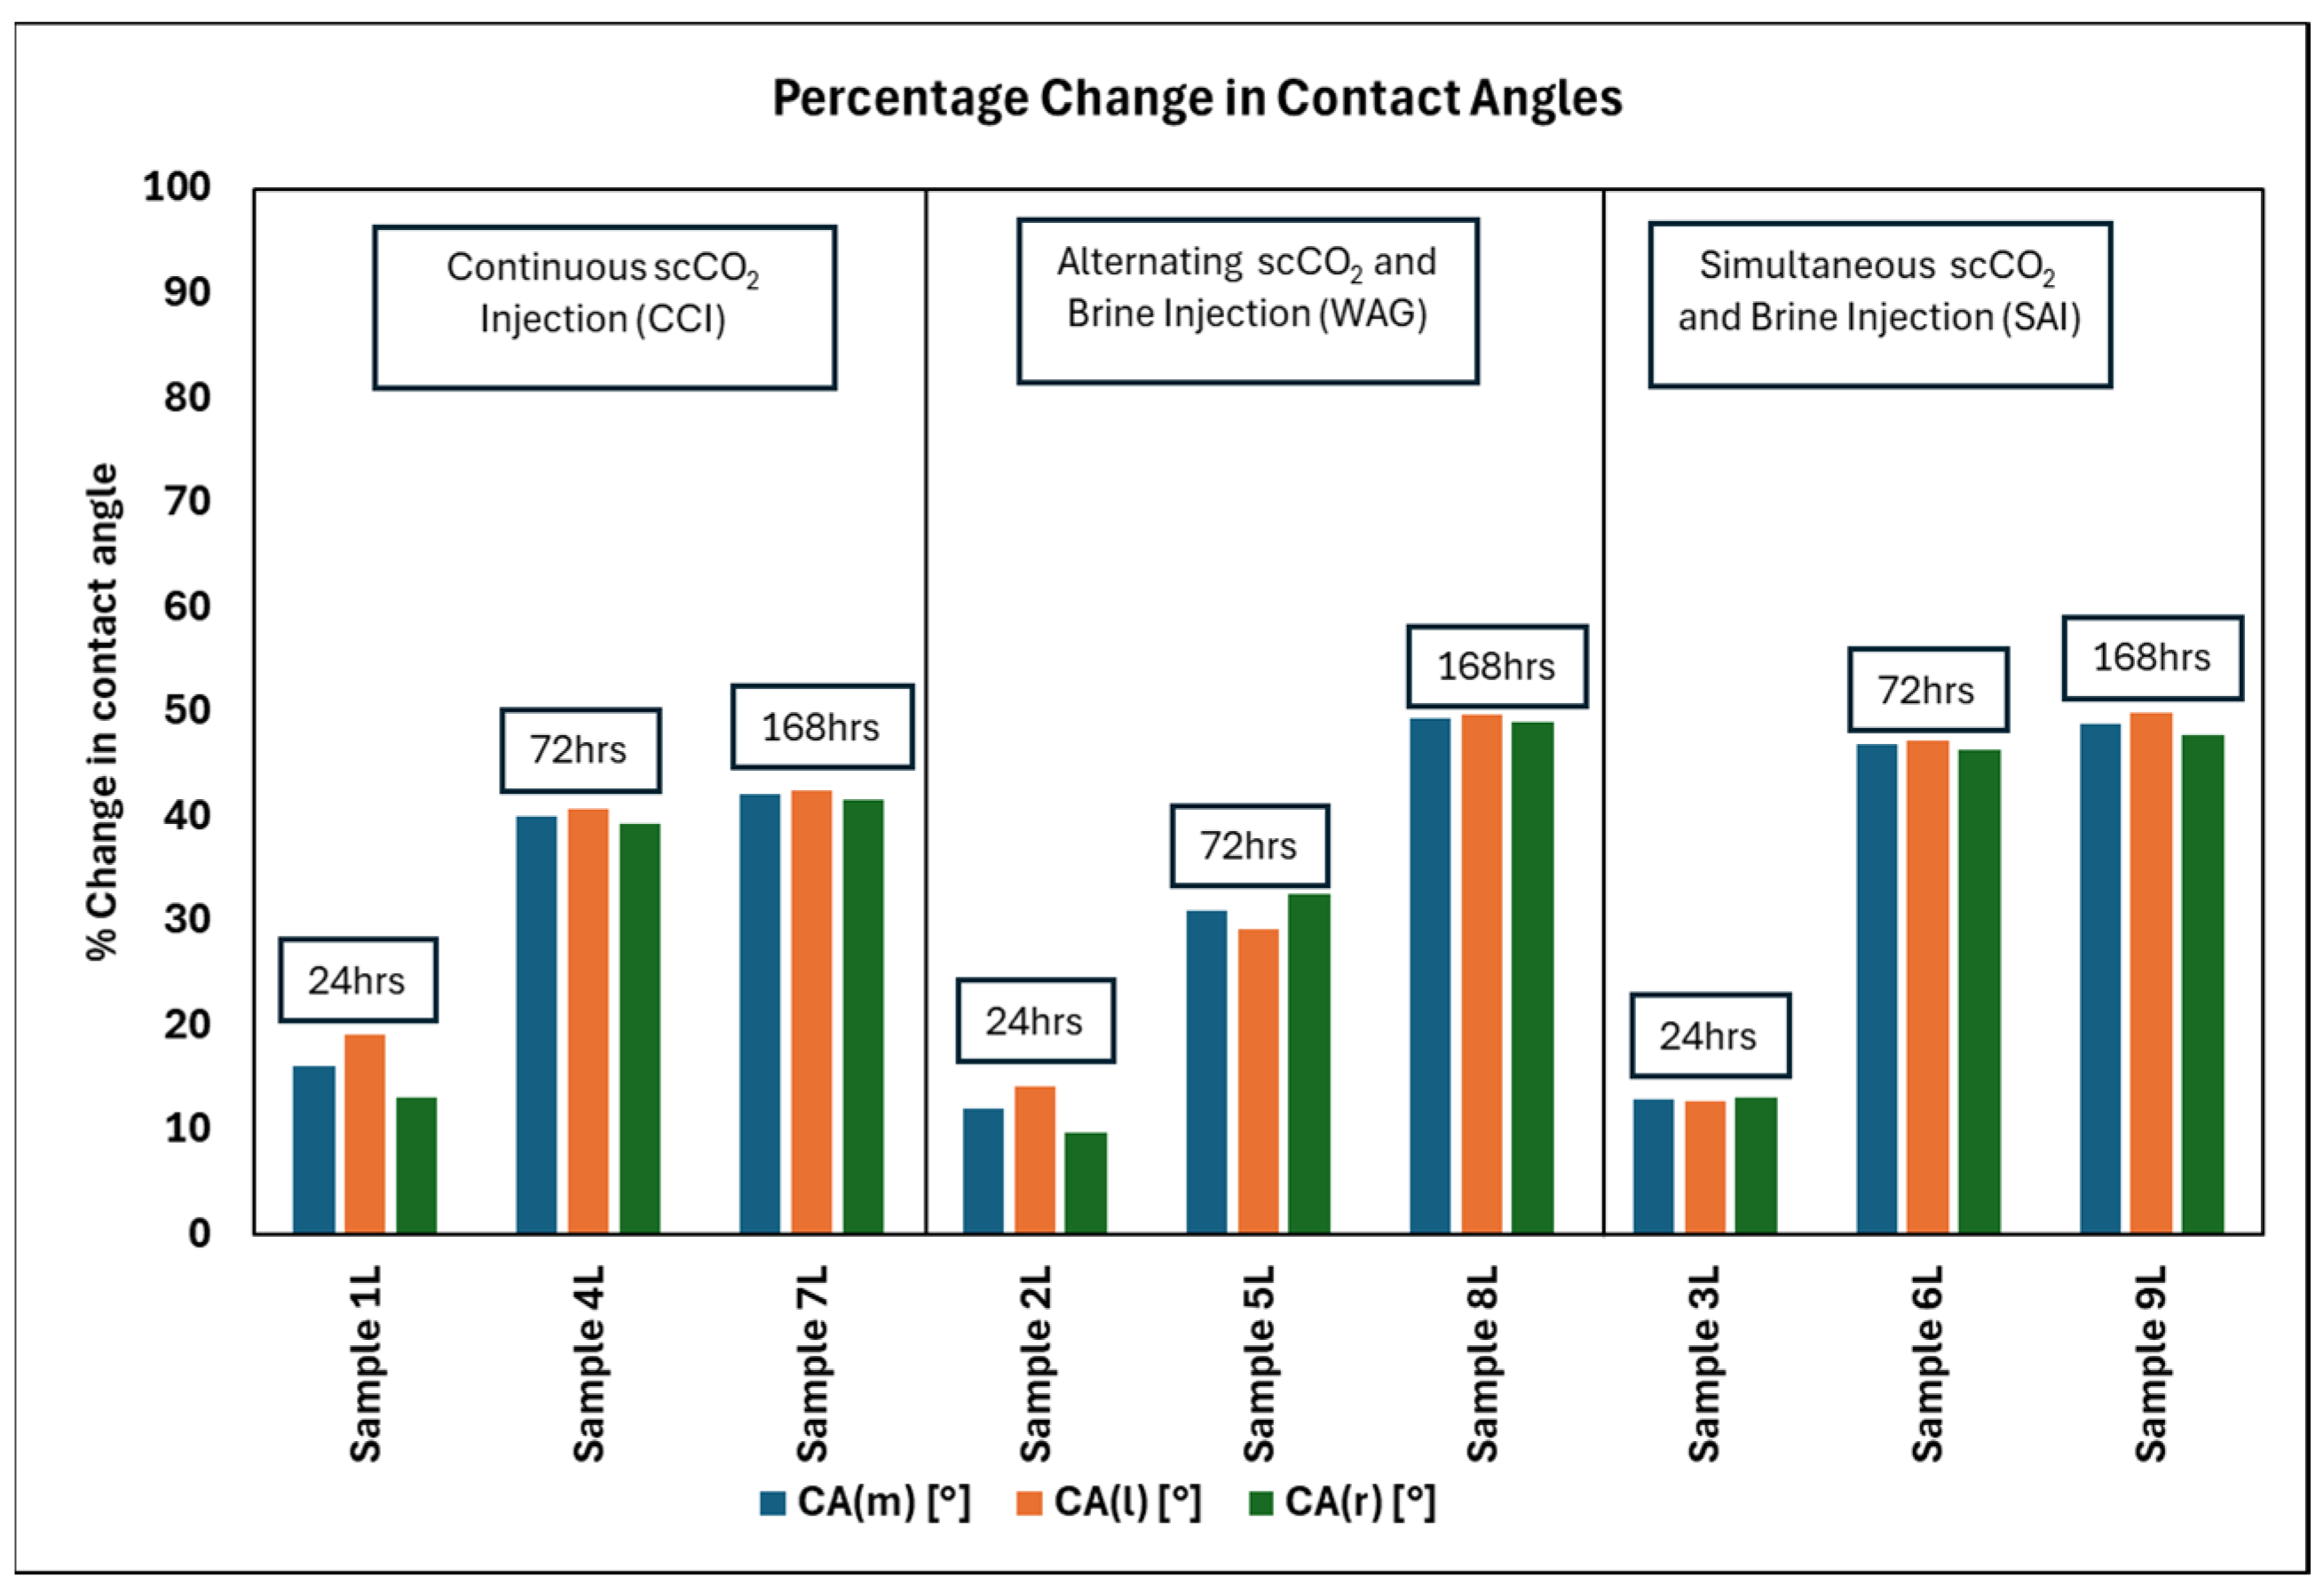
For the Indiana limestone, the change in CA varies across the board depending on the exposure time and the injection strategy, as in the case of sandstone. These ranges are similar across all the injection strategies; for instance, the initial average CA post-injection is 13–42%, 9–49%, and 12–49% for CCI, WAG, and SAI strategies, respectively, indicating that CCI is a preferred injection strategy for CO2 storage in limestone, as shown in Figure 14. For the WAG and SAI strategy, limestone is more responsive to surface modifications when water is introduced. Notably, the most substantial alteration and changes in limestone CA were observed, with CAs increasing from 85.9° to 128.0° under SAI conditions. This suggests that the dynamics and interactions between the injected fluids and rock surfaces vary significantly across different injection methods, leading to marked differences in surface-wetting properties. These findings have significant implications for optimizing fluid injection strategies in geological formations. The average changes in CA due to different injection strategies reveal distinct patterns: WAG results in an average change of 30.50°, CCI has the least change with an average of 11.74°, and SAI leads to the most pronounced change at 39.51° for the limestone samples, as shown in Figure 15.

4.3. Significance of Wettability Alteration in CCS

CCS is a key strategy in the global effort to mitigate greenhouse gas emissions and combat climate change. This method involves capturing CO2 from industrial and energy-related sources, transporting it to a storage site, and injecting it into underground geological formations to isolate it from the atmosphere. One significant aspect of CCS is the impact of CO2 on the wettability of the rock formations. Typically, saline aquifers, where water is the native fluid, are inherently water-wet. However, introducing scCO2 can alter this native wettability, significantly changing the fluid dynamics within these formations.
The experimental results demonstrate significant wettability alterations in both sandstone and limestone due to the different CO2 injection methods. The observed shift towards more CO2-wet conditions suggests that scCO2 interactions with the rock matrices are conducive to altering the surface energy, thereby influencing fluid retention and migration patterns. This effect is slowed when water is introduced to the system, except for limestone samples, where changes were more dramatic due to its chemical reactivity. The introduction of water with scCO2 can cause mineral dissolution and subsequent reprecipitation. The interactions between scCO2, brine, and rock surfaces significantly affect storage efficiency in geological CO2 storage. These interactions are primarily governed by the chemical properties of the substances and their interplay under subsurface conditions. scCO2 dissolves or precipitates minerals, notably affecting carbonate rocks like limestone, potentially altering their porosity, permeability, and wettability [75]. This process fundamentally alters the surface characteristics of the rock. These effects are also influenced by the CO2’s partial pressure, temperature, and water presence. When brine is used, it can lead to ion exchange, pH shifts, and changes in rock surface charge, which together can modify fluid–rock interactions and affect scCO2 mobility. In addition, when scCO2 dissolves in brine, it forms carbonic acid, which can react further with rock minerals, altering formation mineralogy and potentially increasing porosity and changing flow paths for CO2. These chemical interactions can transform rock wettability from water-wet to CO2-wet, impacting the capillary trapping mechanism essential for CO2’s secure storage. The rate of these interactions is influenced by thermodynamic and kinetic factors, including temperature, pressure, and rock surface area, with higher temperatures generally accelerating the chemical reactions and enhancing their effects. X-ray diffraction (XRD) and scanning electron microscopy with energy-dispersive X-ray spectroscopy (SEM-EDS) are required to ascertain whether the element is dissolved or precipitated, coupled with pH measurement and analyses of ionic concentration. These are beyond the scope of this study and hence are recommended as further analyses in explaining the element or compound responsible for reduced WA when using different injection strategies.
This alteration affects the residual and solubility trapping mechanisms crucial for effective CO2 storage, influencing critical capillary forces in trapping CO2 within pore spaces. Wang et al. (2013) showed that a 38% change in CA would lead to a 5−10% difference in capillary trapping or pressure [76]. Such changes can either enhance or diminish the storage capacity and stability of subsurface CO2 reservoirs. Furthermore, the interaction between CO2 and reservoir rocks may trigger geochemical reactions, potentially affecting the rock’s structural integrity and influencing the feasibility and safety of CCS technologies. Based on these experimental studies, the effect can be slowed when WAG or SAI is used, especially when sandstone is involved.
Understanding how CO2 gets trapped in porous media is essential for determining target formations’ storage capacity and predicting potential CO2 trapping in aquifers. Changes in wettability due to CO2 exposure can lead to shifts from water-wet to CO2-wet conditions, affecting the long-term security of CO2 storage. The implications of observed wettability changes for the long-term stability of CO2 storage include potential impacts on capillary trapping and the integrity of the storage site. This is why tailored injection strategies such as WAG or SAI can mitigate these effects, especially in sandstone formations. These strategies help manage the wettability and enhance the effectiveness of carbon storage.
Moreover, the CO2 wettability of caprock is crucial for ensuring a reservoir’s structural trapping and containment security. Under reservoir conditions, caprock wettability changes can significantly reduce sealing efficiency, highlighting the need to adjust reservoir simulation models to reflect these conditions and ensure reliable predictions and operational security. Reducing WA is vital to optimizing CO2 geo-storage efficiency and security of containment [77]. Overall, these findings provide a deeper understanding of how different injection strategies can be tailored to maximize the efficiency of CO2 sequestration based on specific rock types. Further research is recommended to explore the long-term stability of the altered wettability conditions and their real-world applicability in large-scale carbon storage projects.

5. Conclusions

This study systematically investigated the impact of three CO2 injection strategies on the wettability of sandstone and limestone, providing significant insights into the dynamics of fluid–rock interactions under varying strategies. The research emphasized the importance of maintaining more water-wet conditions, as they enhance the capillary trapping of CO2, thereby increasing the security and capacity of CO2 storage. This research demonstrates the necessity for further exploration and development of tailored CO2 injection strategies, which are essential for harnessing their full potential in CCS and alleviating climate change. The main findings include the following.
  • Wettability Change: Both sandstone and limestone changed towards more CO2-wet conditions across all injection strategies due to changes in CA from the range of 61.6–83.4° to 77.6–87.9° and from 81.5–124.2° to 94.6–128.0° for sandstone and limestone respectively. The decreased water-wetness suggests that capillary trapping of CO2 is limited and crucial for the long-term security and efficacy of geological carbon storage.
  • Injection Strategy Efficiency: The results show variability in surface response depending on the injection strategy employed. Sandstone displayed more substantial changes in wettability for CCI, with a 77.4% change in CA. In comparison, WAG was more effective in reducing the WA with the least change of 29.6%, followed by the SAI strategy with a change of 41.7% maximum. Changes in CA and wettability were similar across strategies in limestone, with changes of 42.5%, 49.7%, and 49.9% in CCI, WAG, and SAI methods, highlighting its chemical reactivity with scCO2 and water. This suggests that WAG and SAI may enhance the interaction between CO2, brine, and rock surfaces, potentially leading to better CO2 trapping mechanisms in sandstone formations.
  • Exposure duration: Across all samples, CA gradually increased as the exposure time increased, except for the SAI process when sample 6S was exposed for 72 h. This is related to the permeability variability of these samples.
  • Rock Type Specificity: The results underscored the importance of considering rock type when selecting CO2 injection strategies, as a rock’s chemical composition and physical properties significantly influence the outcome of wettability changes. The differential response between sandstone and limestone to the same injection strategies indicates that tailoring the injection approach based on specific geological settings of a storage site could optimize sequestration results. In this case, the WAG method with a sandstone formation gave the most favorable result for CO2 storage. This prolongs WA and hence maintains the water-wet nature of formation for longer than CCI.

Future Research

While this study provides foundational insights, further investigation to bridge existing knowledge gaps is required, as follows.
  • Study surface morphology of the rock samples before and after injection, providing visual evidence of physical changes at the microstructural level using the SEM. In addition, X-ray diffraction patterns will also show mineralogical changes post-injection, particularly in limestone, supporting the observed wettability results.
  • Future studies should focus on the long-term stability of wettability changes and their implications over the lifespan of a CO2 storage project (for instance, 6 months to 1 year). Understanding how these changes persist under varying geological and operational conditions is crucial.
  • Exploring the role of different brine compositions and additives that might enhance wettability changes or react chemically with CO2 and rock could further optimize injection strategies.
  • Developing comprehensive models that integrate fluid dynamics, rock chemistry, and wettability changes would help predict outcomes more accurately and design better injection protocols.

Supplementary Materials

The following supporting information can be downloaded at https://www.mdpi.com/article/10.3390/en17112600/s1. Supplementary S1. Other figures of Contact angle change. Supplementary S2: Contact angle and wettability. References [78,79,80,81,82,83,84,85,86,87,88,89,90,91,92,93,94,95,96,97,98,99] are cited in the Supplementary Materials.

Author Contributions

Conceptualization, S.I.E. and M.C.W.; Methodology, S.I.E.; Validation, G.T., O.K., I.I. and H.E.; Formal analysis, S.I.E., O.K. and N.A.; Investigation, S.I.E. and C.J.O.; Resources, M.C.W.; Writing—original draft, S.I.E.; Writing—review & editing, G.T., O.K., I.I., N.A., H.E. and M.C.W.; Supervision, G.T. and M.C.W.; Funding acquisition, M.C.W. All authors have read and agreed to the published version of the manuscript.

Funding

This research received no external funding.

Data Availability Statement

The original contributions presented in the study are included in the article/Supplementary Materials, further inquiries can be directed to the corresponding author.

Conflicts of Interest

The authors declare no conflict of interest.

References

  1. Ahmed, T. Reservoir Engineering Handbook, 4th ed.; Gulf Professional Publishing: Amsterdam, The Netherlands, 2010. [Google Scholar] [CrossRef]
  2. Iglauer, S.; Al-yaseri, A.Z.; Rezaee, R.; Lebedev, M. CO2 wettability of caprocks: Implications for structural storage capacity and containment security. Geophys. Res. Lett. 2015, 42, 9279–9284. [Google Scholar] [CrossRef]
  3. Iglauer, S.; Wülling, W.; Pentland, C.H.; Al-Mansoori, S.K.; Blunt, M.J. Capillary-trapping capacity of sandstones and sandpacks. SPE J. 2011, 16, 778–783. [Google Scholar] [CrossRef]
  4. Tudek, J.; Crandall, D.; Fuchs, S.; Werth, C.J.; Valocchi, A.J.; Chen, Y.; Goodman, A. In situ contact angle measurements of liquid CO2, brine, and Mount Simon sandstone core using micro X-ray CT imaging, sessile drop, and Lattice Boltzmann modeling. J. Pet. Sci. Eng. 2017, 155, 3–10. [Google Scholar] [CrossRef]
  5. Chalbaud, C.; Robin, M.; Lombard, J.M.; Martin, F.; Egermann, P.; Bertin, H. Interfacial tension measurements and wettability evaluation for geological CO2 storage. Adv. Water Resour. 2009, 32, 98–109. [Google Scholar] [CrossRef]
  6. Chalbaud, C.; Robin, M.; Bekri, S.; Egermann, P. Wettability Impact on CO2 Storage in Aquifers: Visualisation and Quantification Using Micromodel Tests, Pore Network Model and Reservoir Simulations. In Proceedings of the International Symposium of the Society of Core Analysts, Calgary, AB, Canada, 10–12 September 2007; pp. 1–12. [Google Scholar]
  7. Plug, W.J.; Bruining, J. Capillary pressure for the sand-CO2-water system under various pressure conditions. Application to CO2 sequestration. Adv. Water Resour. 2007, 30, 2339–2353. [Google Scholar] [CrossRef]
  8. Lauren, S. Enhanced oil Recovery: How to Measure the Wettability of Carbonate Reservoir Core? Biolin Sci. Surf. Sci. Blog 2019, 1–11. Available online: https://www.biolinscientific.com/blog/enhanced-oil-recovery-how-to-measure-the-wettability-of-carbonate-reservoir-core#:~:text=The-USBM-test-compares-the,spins-with-stepwise-increasing-speed (accessed on 3 March 2023).
  9. Sagbana, P.I.; Sarkodie, K.; Nkrumah, W.A. A critical review of carbonate reservoir wettability modification during low salinity waterflooding. Petroleum 2022, 9, 317–330. [Google Scholar] [CrossRef]
  10. Anderson, W.G. Wettability Literature Survey—Part 2: Wettability Measurement. JPT J Pet. Technol. 1986, 38, 1246–1262. [Google Scholar] [CrossRef]
  11. Chaudhary, K.; Guiltinan, E.J.; Cardenas, M.B.; Maisano, J.A.; Ketcham, R.A.; Bennett, P.C. Wettability measurement under high P-T conditions using X-ray imaging with ap- plication to the brine-supercritical CO2 system. Geochem. Geophys. Geosystems 2015, 16, 2858–2864. [Google Scholar] [CrossRef]
  12. Kassa, A.M.; Gasda, S.E.; Landa-Marbán, D.; Sandve, T.H.; Kumar, K. Field-scale impacts of long-term wettability alteration in geological CO2 storage. Int. J. Greenh. Gas Control 2022, 114, 103556. [Google Scholar] [CrossRef]
  13. Kassa, A.M.; Gasda, S.E.; Kumar, K.; Radu, F.A. Impact of time-dependent wettability alteration on the dynamics of capillary pressure. Adv. Water Resour. 2020, 142, 103631. [Google Scholar] [CrossRef]
  14. Zhu, L.; Liao, X.; Chen, Z.; Mu, L.; Wang, T. An analytical approach for evaluating the capillary trapping during CO2 storage in aquifers. In Society of Petroleum Engineers—SPE/IATMI Asia Pacific Oil and Gas Conference and Exhibition; SPE: Lumpur, Malaysia, 2017; pp. 1–14. [Google Scholar]
  15. Javanbakht, G.; Sedghi, M.; Welch, W.; Goual, L. Molecular dynamics simulations of CO2/water/quartz interfacial properties: Impact of CO2 dissolution in water. Langmuir 2015, 31, 5812–5819. [Google Scholar] [CrossRef] [PubMed]
  16. Arif, M.; Abu-Khamsin, S.A.; Iglauer, S. Wettability of rock/CO2/brine and rock/oil/CO2-enriched-brine systems:Critical parametric analysis and future outlook. Adv. Colloid Interface Sci. 2019, 268, 91–113. [Google Scholar] [CrossRef] [PubMed]
  17. Lv, P.; Liu, Y.; Wang, Z.; Liu, S.; Jiang, L.; Chen, J.; Song, Y. In Situ Local Contact Angle Measurement in a CO2-Brine-Sand System Using Microfocused X-ray CT. Langmuir 2017, 33, 3358–3366. [Google Scholar] [CrossRef] [PubMed]
  18. Al-yaseri, A.Z.; Lebedev, M.; Barifcani, A.; Iglauer, S. Receding and advancing (CO2 + brine + quartz) contact angles as a function of pressure, temperature, surface roughness, salt type and salinity. J. Chem. Thermodyn. 2015, 93, 416–423. [Google Scholar] [CrossRef]
  19. Sarmadivaleh, M.; Al-Yaseri, A.Z.; Iglauer, S. Influence of temperature and pressure on quartz-water-CO2 contact angle and CO2-water interfacial tension. J. Colloid Interface Sci. 2015, 441, 59–64. [Google Scholar] [CrossRef] [PubMed]
  20. Alnili, F.; Al-Yaseri, A.; Roshan, H.; Rahman, T.; Verall, M.; Lebedev, M.; Sarmadivaleh, M.; Iglauer, S.; Barifcani, A. Carbon dioxide/brine wettability of porous sandstone versus solid quartz: An experimental and theoretical investigation. J. Colloid Interface Sci. 2018, 524, 188–194. [Google Scholar] [CrossRef]
  21. Al-hadhrami, H.S.; Blunt, M.J. Thermally Induced Wettability Alteration to Improve Oil Recovery in Fractured Reservoirs. In Proceedings of the SPE/DOE Improved Oil Recovery Symposium, Tulsa, OK, USA, 22–26 April 2000; pp. 1–9. [Google Scholar]
  22. Arif, M.; Al-Yaseri, A.Z.; Barifcani, A.; Lebedev, M.; Iglauer, S. Impact of pressure and temperature on CO2-brine-mica contact angles and CO2-brine interfacial tension: Implications for carbon geo-sequestration. Colloid Interface Sci. 2015, 462, 208–215. [Google Scholar] [CrossRef] [PubMed]
  23. Botto, J.; Fuchs, S.J.; Fouke, B.W.; Clarens, A.F.; Freiburg, J.T.; Berger, P.M.; Werth, C.J. Effects of Mineral Surface Properties on Supercritical CO2 Wettability in a Siliciclastic Reservoir. Energy Fuels 2017, 31, 5275–5285. [Google Scholar] [CrossRef]
  24. Mutailipu, M.; Liu, Y.; Jiang, L.; Zhang, Y. Measurement and estimation of CO2–brine interfacial tension and rock wettability under CO2 sub- and super-critical conditions. J. Colloid Interface Sci. 2019, 534, 605–617. [Google Scholar] [CrossRef]
  25. Jaeger, P.T.; Alotaibi, M.B.; Nasr-El-Din, H.A. Influence of compressed carbon dioxide on the capillarity of the gas-crude oil-reservoir water system. J. Chem. Eng. Data 2010, 55, 5246–5251. [Google Scholar] [CrossRef]
  26. Saraji, S.; Piri, M.; Goual, L. The effects of SO2 contamination, brine salinity, pressure, and temperature on dynamic contact angles and interfacial tension of supercritical CO2/brine/quartz systems. Int. J. Greenh. Gas Control 2014, 28, 147–155. [Google Scholar] [CrossRef]
  27. Liu, Y.; Mutailipu, M.; Jiang, L.; Zhao, J.; Song, Y.; Chen, L. Interfacial Tension and Contact Angle Measurements for the Evaluation of CO2-Brine Two-Phase Flow Characteristics in Porous Media. Environ. Prog. Sustain. Energy 2015, 34, 1756–1762. [Google Scholar] [CrossRef]
  28. Ameri, A.; Shojai Kaveh, N.; Rudolph, E.S.J.; Wolf, K.H.; Farajzadeh, R.; Bruining, J. Investigation on interfacial interactions among crude oil-brine-sandstone rock-CO2 by contact angle measurements. Energy Fuels 2013, 27, 1015–1025. [Google Scholar] [CrossRef]
  29. Drummond, C.; Israelachvili, J. Fundamental studies of crude oil-surface water interactions and its relationship to reservoir wettability. J. Pet. Sci. Eng. 2004, 45, 61–81. [Google Scholar] [CrossRef]
  30. Chiquet, P.; Broseta, D.; Thibeau, S. Capillary Alteration of Shaly Caprocks by Carbon Dioxide. In Proceedings of the SPE Europec/EAGE Annual Conference, Madrid, Spain, 13–16 June 2005; pp. 1–10. [Google Scholar] [CrossRef]
  31. Kaveh, N.S.; Rudolph, E.S.J.; Van Hemert, P.; Rossen, W.R.; Wolf, K.H. Wettability evaluation of a CO2/water/bentheimer sandstone system: Contact angle, dissolution, and bubble size. Energy Fuels 2014, 28, 4002–4020. [Google Scholar] [CrossRef]
  32. Wang, S.; Tao, Z.; Persily, S.M.; Clarens, A.F. CO2 adhesion on hydrated mineral surfaces. Environ. Sci. Technol. 2013, 47, 11858–11865. [Google Scholar] [CrossRef]
  33. Iglauer, S.; Pentland, C.H.; Busch, A. CO2 wettability of seal and reservoir rocks and the implications for carbon geo-sequestration. Water Resour. Res. 2014, 51, 729–774. [Google Scholar] [CrossRef]
  34. Daryasafar, A.; Keykhosravi, A.; Shahbazi, K. Modeling CO2 wettability behavior at the interface of brine/CO2/mineral: Application to CO2 geo-sequestration. J. Clean. Prod. 2019, 239, 118101. [Google Scholar] [CrossRef]
  35. Chiquet, P.; Broseta, D.; Thibeau, S. Wettability alteration of caprock minerals by carbon dioxide. Geofluids 2007, 7, 112–122. [Google Scholar] [CrossRef]
  36. Bikkina, P.K. Contact angle measurements of CO2-water-quartz/calcite systems in the perspective of carbon sequestration. Int. J. Greenh. Gas Control 2011, 5, 1259–1271. [Google Scholar] [CrossRef]
  37. Mills, J.; Riazi, M.; Sohrabi, M. Wettability of common rock-forming minerals in a CO2-brine system at reservoir conditions. In Proceedings of the International Symposium of the Society of Core Analysts, Austin, TX, USA, 21 August–1 September 2011; pp. 1–12. [Google Scholar]
  38. Kim, Y.; Wan, J.; Kneafsey, T.J.; Tokunaga, T.K. Dewetting of Silica Surfaces upon Reactions with Supercritical CO2 and Brine: Pore-Scale Studies in Micromodels. Environ. Sci. Technol. 2012, 46, 4228–4235. [Google Scholar] [CrossRef]
  39. Hirasaki, G.J.; Miller, C.A.; Puerto, M. Recent Advances in Surfactant EOR. SPE J. 2011, 16, 889–907. [Google Scholar] [CrossRef]
  40. Underschultz, J.; Boreham, C.; Dance, T.; Stalker, L.; Freifeld, B.; Kirste, D.; Ennis-King, J. CO2 storage in a depleted gas field: An overview of the CO2CRC Otway Project and initial results. Int. J. Greenh. Gas Control 2011, 5, 922–932. [Google Scholar] [CrossRef]
  41. Zhang, X.; Ge, J.; Kamali, F.; Othman, F.; Wang, Y.; Le-Hussain, F. Wettability of sandstone rocks and their mineral components during CO2 injection in aquifers: Implications for fines migration. J. Nat. Gas Sci. Eng. 2020, 73, 103050. [Google Scholar] [CrossRef]
  42. Dai, Z.; Xu, L.; Xiao, T.; McPherson, B.; Zhang, X.; Zheng, L.; Dong, S.; Yang, Z.; Soltanian, M.R.; Yang, C.; et al. Reactive chemical transport simulations of geologic carbon sequestration: Methods and applications. Earth-Sci. Rev. 2020, 208, 103265. [Google Scholar] [CrossRef]
  43. Juanes, R.; Spiteri, E.J.; Orr, F.M.; Blunt, M.J. Impact of relative permeability hysteresis on geological CO2 storage. Water Resour. Res. 2006, 42, 1–13. [Google Scholar] [CrossRef]
  44. Wang, S.; Liu, K.; Han, J.; Ling, K.; Wang, H.; Jia, B. Investigation of properties alternation during super-critical CO2 injection in shale. Appl. Sci. 2019, 9, 1686. [Google Scholar] [CrossRef]
  45. Li, Z.; Dong, M.; Li, S.; Huang, S. CO2 sequestration in depleted oil and gas reservoirs-caprock characterization and storage capacity. Energy Convers. Manag. 2006, 47, 1372–1382. [Google Scholar] [CrossRef]
  46. Li, S.; Dong, M.; Li, Z.; Huang, S.; Qing, H.; Nickel, E. Gas breakthrough pressure for hydrocarbon reservoir seal rocks: Implications for the security of long-term CO2 storage in the Weyburn field. Geofluids 2005, 5, 326–334. [Google Scholar] [CrossRef]
  47. Bachu, S. Sequestration of CO2 in geological media: Criteria and approach for site selection in response to climate change. Energy Convers. Manag. 2000, 41, 953–970. [Google Scholar] [CrossRef]
  48. Atkins, P.; de Paula, J. Atkins’ Physical Chemistry, 8th ed.; Oxford University Press: Oxford, UK, 2006. [Google Scholar] [CrossRef]
  49. Brendan, J. Lowering Ethanol Carbon Intensity with CO2 Capture and Enhanced Oil Recovery; Great Plains Institute: Minneapolis, MN, USA, 2017. [Google Scholar]
  50. Sampaio, M.A.; de Mello, S.F.; Schiozer, D.J. Impact of physical phenomena and cyclical reinjection in miscible CO2-WAG recovery in carbonate reservoirs. J. Pet. Explor. Prod. Technol. 2020, 10, 3865–3881. [Google Scholar] [CrossRef]
  51. Ampomah, W.; Balch, R.; Will, R.; Cather, M.; Gunda, D.; Dai, Z. Co-optimization of CO2-EOR and Storage Processes under Geological Uncertainty. Energy Procedia 2017, 114, 6928–6941. [Google Scholar] [CrossRef]
  52. Kashkooli, S.B.; Gandomkar, A.; Riazi, M.; Tavallali, M.S. Coupled optimization of carbon dioxide sequestration and CO2 enhanced oil recovery. J. Pet. Sci. Eng. 2022, 208, 109257. [Google Scholar] [CrossRef]
  53. Wang, X.; Jiang, L.; Gai, Z.; Tao, F.; Tang, H.; Xu, P. The plasticity of indigenous microbial community in a full-scale heavy oil-produced water treatment plant. J. Hazard. Mater. 2018, 358, 155–164. [Google Scholar] [CrossRef] [PubMed]
  54. Chen, B.; Pawar, R.J. Capacity assessment and co-optimization of CO2 storage and enhanced oil recovery in residual oil zones. J. Pet. Sci. Eng. 2019, 182, 106342. [Google Scholar] [CrossRef]
  55. Azzolina, N.A.; Nakles, D.V.; Gorecki, C.D.; Peck, W.D.; Ayash, S.C.; Melzer, L.S.; Chatterjee, S. CO2 storage associated with CO2 enhanced oil recovery: A statistical analysis of historical operations. Int. J. Greenh. Gas Control 2015, 37, 384–397. [Google Scholar] [CrossRef]
  56. Farajzadeh, R.; Eftekhari, A.A.; Dafnomilis, G.; Lake, L.W.; Bruining, J. On the sustainability of CO2 storage through CO2Enhanced oil recovery. Appl. Energy 2020, 261, 114467. [Google Scholar] [CrossRef]
  57. AlRassas, A.M.; Vo Thanh, H.; Ren, S.; Sun, R.; Al-Areeq, N.M.; Kolawole, O.; Hakimi, M.H. CO2 Sequestration and Enhanced Oil Recovery via the Water Alternating Gas Scheme in a Mixed Transgressive Sandstone-Carbonate Reservoir: Case Study of a Large Middle East Oilfield. Energy Fuels 2022, 36, 10299–10314. [Google Scholar] [CrossRef]
  58. Jia, K.; Zeng, J.; Wang, X.; Li, B.; Gao, X.; Wang, K. Wettability of Tight Sandstone Reservoir and Its Impacts on the Oil Migration and Accumulation: A Case Study of Shahejie Formation in Dongying Depression, Bohai Bay Basin. Energies 2022, 15, 4267. [Google Scholar] [CrossRef]
  59. Khoshsima, A.; Sedighi, M.; Mohammadi, M. Enhanced oil recovery by water alternating gas injection. In Gas Injection Methods: A Volume in Enhanced Oil Recovery Series; Gulf Professional Publishing: Amsterdam, The Netherlands, 2023; pp. 295–316. [Google Scholar] [CrossRef]
  60. Arzhilovsky, A.V.; Afonin, D.G.; Ruchkin, A.A.; Kobyashev, A.V.; Morozovskiy, N.A.; Toropov, K.V. Express assessment of the increase in the oil recovery as a result of water-alternating-gas technology application. Neft. Khozyaystvo-Oil Ind. 2022, 2022, 63–67. [Google Scholar] [CrossRef]
  61. Lima, R.O.; de L. Cunha, A.; Santos, J.A.O.; Garcia, A.J.V.; dos Santos, J.P.L. Assessment of continuous and alternating CO2 injection under Brazilian-pre-salt-like conditions. J. Pet. Explor. Prod. Technol. 2020, 10, 2947–2956. [Google Scholar] [CrossRef]
  62. Nordic CCS Competence Centre Report. The Nordic CO2 Storage Atlas; Nordic CCS Competence Centre Report: Copenhagen, Denmark, 2009. [Google Scholar]
  63. Okamoto, I.; Li, X.; Ohsumi, T. Effect of supercritical CO2 as the organic solvent on cap rock sealing performance for underground storage. Energy 2005, 30, 2344–2351. [Google Scholar] [CrossRef]
  64. Sohrabi, M.; Fatemi, S.M.; Farzaneh, S.A.; Jami, M.; Ireland, S.; Ahmed, K. Performance of Swag Injection Versus Alternating and Continuous Injection of Water and Gas in Low Gas-Oil Ift and Mixed-Wet Systems. In Proceedings of the 26th International Symposium of the Society of Core Analysts, Aberdeen, UK, 27–30 August 2012; pp. 1–12. [Google Scholar]
  65. Drozdov, A.; Gorbyleva, Y.; Drozdov, N.; Gorelkina, E. Perspectives of application of simultaneous water and gas injection for utilizing associated petroleum gas and enhancing oil recovery in the Arctic fields. IOP Conf. Ser. Earth Environ. Sci. 2021, 678, 012039. [Google Scholar] [CrossRef]
  66. Heidari, P.; Kharrat, R.; Alizadeh, N.; Ghazanfari, M.H. A comparison of WAG and SWAG processes: Laboratory and simulation studies. Energy Sources Part A Recover. Util. Environ. Eff. 2013, 35, 2225–2232. [Google Scholar] [CrossRef]
  67. Chen, P.; Sowaidi, A.K.A.; Patel, H.; Brantferger, K.; Bin Buang, K.A.; Syed, F.I.; Shehhi, R. Al Assessment of simultaneous water and gas injection swag pilot in a giant offshore carbonate reservoir. In Proceedings of the Abu Dhabi International Petroleum Exhibition & Conference, Abu Dhabi, United Arab Emirates, 7–10 November 2016; pp. 1–10. [Google Scholar] [CrossRef]
  68. Shetty, S. Evaluation of Simultaneous Water and Gas Injection Using CO2; Louisiana State University and Agricultural & Mechanical College: Baton Rouge, LA, USA, 2011. [Google Scholar]
  69. Donaldson, E.C.; Chilingarin, G.V.; Yen, T.F. (Eds.) Enhanced Oil Recovery, II process and operations; Elsevier: Amsterdam, The Netherlands,, 1989; Volume 17B, pp. 1–607. [Google Scholar]
  70. Teklu, T.W. Experimental and Numerical Study of Carbon Dioxide Injection Enhanced Oil Recovery in Low-Permeability Reservoirs; Colorado School of Mines: Golden, CO, USA, 2015; Volume 1. [Google Scholar]
  71. Haeri, F.; Myshakin, E.M.; Sanguinito, S.; Moore, J.; Crandall, D.; Gorecki, C.D.; Goodman, A.L. Simulated CO2 storage efficiency factors for saline formations of various lithologies and depositional environments using new experimental relative permeability data. Int. J. Greenh. Gas Control 2022, 119, 103720. [Google Scholar] [CrossRef]
  72. Christensen, M.; Tanino, Y. Waterflood oil recovery from mixed-wet limestone: Dependence on contact anle. Energy Fuels 2015, 31, 1529–1535. [Google Scholar] [CrossRef]
  73. dos Santos Lucas, C.R.; Aum, Y.K.P.G.; de Andrade Araújo, E.; de Castro Dantas, T.N.; Araújo, E.A.; Sousa, T.N.; Aum, P.T.P. Investigating the fluid-solid interaction of acid nonionic nanoemulsion with carbonate porous media. Molecules 2020, 25, 1475. [Google Scholar] [CrossRef]
  74. Feldmann, F.; Al-Shalabi, E.W.; AlAmeri, W. Carbonate mineral effect on surface charge change during low-salinity imbibition. In SPE Annual Technical Conference and Exhibition; SPE: Lumpur, Malaysia, 2021; pp. 1–14. [Google Scholar] [CrossRef]
  75. Zhou, L.; Liu, Y.; Anfinsen, B.; Hashemian, Y.; Yuan, Z. Evaluating Subsea Capping Stack Usage for CO2 Blowouts Lei. In Offshore Technology Conference; OTC: Springfield, MO, USA, 2024; pp. 1–18. [Google Scholar] [CrossRef]
  76. Wang, S.; Edwards, I.M.; Clarens, A.F. Wettability Phenomena at the CO2BrineMineral Interface: Implications for Geologic Carbon Sequestration. Environ. Sci. Technol. 2013, 47, 234–241. [Google Scholar] [CrossRef]
  77. Eyitayo, S.I.; Arbad, N.; Kolawole, O.; Watson, M.C.; Eyitayo, S.I.; Arbad, N.; Kolawole, O.; Marshall, C. Optimizing CO2 storage in deep saline formations: A comprehensive review of enhancing pore space utilization through simultaneous or alternate aquifer injection through simultaneous or alternate aquifer injection ABSTRACT. Energy Sources Part A Recover. Util. Environ. Eff. 2024, 46, 6513–6536. [Google Scholar] [CrossRef]
  78. Dickson, J.L.; Gupta, G.; Horozov, T.S.; Binks, B.P.; Johnston, K.P. Wetting Phenomena at the CO2/Water/Glass Interface. Langmuir 2006, 22, 2161–2170. [Google Scholar] [CrossRef]
  79. Yang, D.; Gu, Y.; Tontiwachwuthikul, P. Wettability Determination of the Reservoir Brine−Reservoir Rock System with Dissolution of CO2 at High Pressures and Elevated Temperatures. Energy Fuels 2007, 22, 504–509. [Google Scholar] [CrossRef]
  80. Tonnet, N.; Broseta, D.F.; Mouronval, G. Evaluation of the Petrophysical Properties of a Carbonate-rich Caprock for CO2 Geological Storage Purposes. In Proceedings of the 72nd European Association of Geoscientists and Engineers Conference and Exhibition 2010 A New Spring for Geoscience, Barcelona, Spain, 14–17 June 2010; Volume 2, pp. 802–814. [Google Scholar]
  81. Espinoza, D.N.; Santamarina, J.C. Water-CO2-mineral systems: Interfacial tension, contact angle, and diffusion—Implications to CO2 geological storage. Water Resour. Res. 2010, 46. [Google Scholar] [CrossRef]
  82. Broseta, D.; Tonnet, N.; Shah, V. Are rocks still water-wet in the presence of dense CO2 or H2S? Geofluids 2012, 12, 280–294. [Google Scholar] [CrossRef]
  83. Jung, J.-W.; Wan, J. Supercritical CO2 and Ionic Strength Effects on Wettability of Silica Surfaces: Equilibrium Contact Angle Measurements. Energy Fuels 2012, 26, 6053–6059. [Google Scholar] [CrossRef]
  84. Farokhpoor, R.; Bjørkvik, B.J.; Lindeberg, E.; Torsæter, O. CO2 Wettability Behavior During CO2 Sequestration in Saline Aquifer -An Experimental Study on Minerals Representing Sandstone and Carbonate. Energy Procedia 2013, 37, 5339–5351. [Google Scholar] [CrossRef]
  85. Seyyedi, M.; Sohrabi, M.; Farzaneh, A. Investigation of Rock Wettability Alteration by Carbonated Water through Contact Angle Measurements. Energy Fuels 2015, 29, 5544–5553. [Google Scholar] [CrossRef]
  86. Iglauer, S.; Mathew, M.; Bresme, F. Molecular dynamics computations of brine–CO2 interfacial tensions and brine–CO2–quartz contact angles and their effects on structural and residual trapping mechanisms in carbon geo-sequestration. J. Colloid Interface Sci. 2012, 386, 405–414. [Google Scholar] [CrossRef] [PubMed]
  87. Tsuji, S.; Liang, Y.; Kunieda, M.; Takahashi, S.; Matsuoka, T. Molecular Dynamics Simulations of the CO2-Water-silica Interfacial Systems. Energy Procedia 2013, 37, 5435–5442. [Google Scholar] [CrossRef]
  88. Chen, C.; Dong, B.; Zhang, N.; Li, W.; Song, Y. Pressure and Temperature Dependence of Contact Angles for CO2/Water/Silica Systems Predicted by Molecular Dynamics Simulations. Energy Fuels 2016, 30, 5027–5034. [Google Scholar] [CrossRef]
  89. Yang, Y.; Nair, A.K.N.; Ruslan, M.F.A.C.; Sun, S. Interfacial properties of the alkane+water system in the presence of carbon dioxide and hydrophobic silica. Fuel 2021, 310, 122332. [Google Scholar] [CrossRef]
  90. Zhu, Z.; Li, M.; Lin, M.; Peng, B.; Sun, L.; Chen, L. Investigation on Variations in Wettability of Reservoir Rock Induced by CO2-Brine-rock Interactions. In Proceedings of the SPE EUROPEC/EAGE Annual Conference and Exhibition, Vienna, Austria, 23–26 May 2011; Volume 5, pp. 4027–4038. [Google Scholar]
  91. Yang, D.; Gu, Y. Interfacial Interactions of Crude Oil-Brine-CO2 Systems under Reservoir Conditions. SPE Annual Technical Conference and Exhibition. In Proceedings of the SPE Annual Technical Conference and Exhibition, Houston, TX, USA, 26–29 September 2004. [Google Scholar]
  92. McCaughan, J.; Iglauer, S.; Bresme, F. Molecular Dynamics Simulation of Water/CO2-quartz Interfacial Properties: Application to Subsurface Gas Injection. Energy Procedia 2013, 37, 5387–5402. [Google Scholar] [CrossRef]
  93. Chen, C.; Chai, Z.; Shen, W.; Li, W.; Song, Y. Wettability of Supercritical CO2–Brine–Mineral: The Effects of Ion Type and Salinity. Energy Fuels 2017, 31, 7317–7324. [Google Scholar] [CrossRef]
  94. Al-Mutairi, S.M.; Abu-Khamsin, S.A.; Okasha, T.M.; Aramco, S.; Hossain, M.E. An experimental investigation of wettability alteration during CO2 immiscible flooding. J. Pet. Sci. Eng. 2014, 120, 73–77. [Google Scholar] [CrossRef]
  95. Ali, M.; Arif, M.; Sahito, M.F.; Al-Anssari, S.; Keshavarz, A.; Barifcani, A.; Stalker, L.; Sarmadivaleh, M.; Iglauer, S. CO2-wettability of sandstones exposed to traces of organic acids: Implications for CO2 geo-storage. Int. J. Greenh. Gas Control 2019, 83, 61–68. [Google Scholar] [CrossRef]
  96. da Costa, A.A.; Costa, G.; Embiruçu, M.; Soares, J.B.; Trivedi, J.J.; Rocha, P.S.; Souza, A.; Jaeger, P. The Influence of Rock Composition and pH on Reservoir Wettability for Low-Salinity Water-CO2 Enhanced Oil Recovery Applications in Brazilian Reservoirs. SPE Reserv. Evaluation Eng. 2020, 24, 45–65. [Google Scholar] [CrossRef]
  97. Ali, M.; Awan, F.U.R.; Ali, M.; Al-Yaseri, A.; Arif, M.; Sánchez-Román, M.; Keshavarz, A.; Iglauer, S. Effect of humic acid on CO2-wettability in sandstone formation. J. Colloid Interface Sci. 2020, 588, 315–325. [Google Scholar] [CrossRef]
  98. Ali, M.; Al-Yaseri, A.; Awan, F.U.R.; Arif, M.; Keshavarz, A.; Iglauer, S. Effect of water-soluble organic acids on wettability of sandstone formations using streaming zeta potential and NMR techniques: Implications for CO2 geo-sequestration. Fuel 2022, 329. [Google Scholar] [CrossRef]
  99. Liu, S.; Yang, X.; Qin, Y. Molecular dynamics simulation of wetting behavior at CO2/water/solid interfaces. Chin. Sci. Bull. 2010, 55, 2252–2257. [Google Scholar] [CrossRef]
Figure 1. Static contact angle illustration in a CO2–water–rock system.
Energies 17 02600 g001
Figure 2. Drop Shape Analyzer (DSA25) for CA measurement showing the needle’s and substrate’s position.
Energies 17 02600 g002
Figure 3. Phase diagram for CO2 (modified after Atkin and de Paula (2006)).
Energies 17 02600 g003
Figure 4. Core flooding experimental setup to simulate different injection strategies for specified exposure time.
Energies 17 02600 g004
Figure 5. Sequential digital images of the sessile water drop on the scCO2-saturated sandstone substrate sample 7S: (A) pretest CA and (B) post-test CA after 168 h of CCI of scCO2.
Energies 17 02600 g005
Figure 6. Sequential digital images of the sessile water drop on the scCO2-saturated sandstone substrate sample 8S: (A) pretest CA and (B) post-test CA after 168 h of WAG of scCO2 and water.
Energies 17 02600 g006
Figure 7. Sequential digital images of the sessile water drop on the scCO2-saturated sandstone substrate sample 9S: (A) pretest CA and (B) post-test CA after 168 h of SAI of scCO2 and water.
Energies 17 02600 g007
Figure 8. Sequential digital images of the sessile water drop on the scCO2-saturated limestone substrate sample 7L: (A) pretest CA and (B) post-test CA after 168 h of CCI of scCO2.
Energies 17 02600 g008
Figure 9. Sequential digital images of the sessile water drop on the scCO2-saturated limestone substrate sample 8L: (A) pretest CA and (B) post-test CA after 168 h of WAG of scCO2 and water.
Energies 17 02600 g009
Figure 10. Sequential digital images of the sessile water drop on the scCO2-saturated limestone substrate sample 8L: (A) pretest CA and (B) post-test CA after 168 h of SAI of scCO2 and water.
Energies 17 02600 g010aEnergies 17 02600 g010b
Figure 11. Pretest and post-test CA with the range of steps measurement for (A) sandstone exposure for 24 h, (B) sandstone exposure for 72 h, (C) sandstone exposure for 168 h, (D) limestone exposure for 24 h, (E) limestone exposure for 72 h, and (F) limestone exposure for 168 h.
Energies 17 02600 g011
Figure 12. Changes in static CA measurement for each injection strategy at different exposure times in a sandstone formation.
Energies 17 02600 g012
Figure 13. Boxplot showing the variability of change in CA for Berea sandstone.
Energies 17 02600 g013
Figure 14. Changes in static CA measurement for each injection strategy at different exposure times in a limestone formation.
Energies 17 02600 g014
Figure 15. Boxplot showing the variability of change in CA for Indiana limestone.
Energies 17 02600 g015
Table 1. Sandstone CA measurement pretest and post-test.
SandstonePretest CA Mean ± STD (°)Post-Test CA Mean ± STD (°)
1S74.5 ± 4.774.1 ± 5.574.9 ± 3.999.6 ± 2.299.5 ± 2.399.6 ± 2.5
2S68.2 ± 4.066.5 ± 4.169.9 ± 4.382.9 ± 3.181.5 ± 4.484.4 ± 3.1
3S71.6 ± 3.170.4 ± 3.272.9 ± 3.086.1 ± 0.585.2 ± 0.886.9 ± 0.4
4S62.3 ± 3.163.0 ± 2.961.6 ± 4.4106.5 ± 2.8105.9 ± 3.0107.2 ± 3.9
5S73.7 ± 2.973.7 ± 2.773.7 ± 3.190.9 ± 2.391.6 ± 2.991.6 ± 2.9
6S75.4 ± 1.477.2 ± 1.673.6 ± 1.384.3 ± 1.585.4 ± 2.583.1 ± 1.8
7S72.65 ± 5.270.0 ± 6.375.3 ± 5.5123.3 ± 12.4124.2 ± 14.4122.3 ± 11.1
8S82.4 ± 1.281.4 ± 1.983.4 ± 1.9106.1 ± 3.1104.1 ± 4.8108.1 ± 2.3
9S73.5 ± 2.474.7 ± 2.572.4 ± 2.4103.0 ± 2.1103.3 ± 3.9102.6 ± 0.9
Table 2. Limestone CA measurement pretest and post-test.
LimestonePretest CA Mean ± STD (°)Post-Test CA Mean ± STD (°)
1L86.3 ± 2.984.7 ± 2.987.9 ± 3.5100.3 ± 0.9100.9 ± 0.899.6 ± 1.1
2L85.9 ± 0.583.9 ± 0.487.9 ± 0.696.3 ± 1.695.9 ± 1.796.6 ± 1.5
3L84.1 ± 2.083.8 ± 1.684.5 ± 3.295.1 ± 1.294.6 ± 1.395.5 ± 1.1
4L83.1 ± 3.482.4 ± 3.483.7 ± 3.4116.4 ± 2.6116.1 ± 2.1116.7 ± 3
5L78.5 ± 3.679.5 ± 3.377.6 ± 4.0102.8 ± 3.9102.8 ± 3.9102.8 ± 3.8
6L78.4 ± 3.878.2 ± 3.478.7 ± 4.5115.2 ± 2.9115.2 ± 2.7115.2 ± 3.4
7L86.6 ± 1.386.2 ± 1.387.0 ± 1.4123.1 ± 3.5122.9 ± 3.9123.3 ± 3.2
8L85.5 ± 1.785.2 ± 3.485.9 ± 2.4127.8 ± 1.5127.6 ± 1.5128.0 ± 1.6
9L81.3 ± 1.580.4 ± 1.682.1 ± 2.2121.0 ± 0.3120.6 ± 0.3121.5 ± 0.3
Disclaimer/Publisher’s Note: The statements, opinions and data contained in all publications are solely those of the individual author(s) and contributor(s) and not of MDPI and/or the editor(s). MDPI and/or the editor(s) disclaim responsibility for any injury to people or property resulting from any ideas, methods, instructions or products referred to in the content.