Article

Assessing the Potential for Electrification of the Food Industry and Its Implications for Environmental Sustainability

1
INSA Lyon, CNRS, CETHIL, UMR5008, 69621 Villeurbanne, France
2
Section for Quantitative Sustainability Assessment, Department of Technology, Management and Economics, Technical University of Denmark (DTU), 2800 Kgs. Lyngby, Denmark
*
Author to whom correspondence should be addressed.
Energies 2024, 17(11), 2602; https://doi.org/10.3390/en17112602
Submission received: 29 April 2024 / Revised: 22 May 2024 / Accepted: 24 May 2024 / Published: 28 May 2024

Abstract

:
Most studies on industrial heat decarbonization by electrification focus on energy and greenhouse gas emissions. However, there are additional potential environmental impacts to be considered to make a fair comparison. The aim of the proposed work is therefore to highlight the benefits and drawbacks of switching to electricity, using life cycle assessment (LCA) methodology to explore more environmental issues. In addition, in order to evaluate the environmental sustainability of this transformation, the LCA results are compared with sustainability thresholds defined with two different methods, on a global scale using the “sustainable levels” concept. The first method is based on the current environmental impacts of industrial processes, while the second considers the economic added value. Industrial heat production levels for the Danish and French food industries are used as case studies. The results show a large number of environmental trade-offs associated with electrification, some of which are leading to unsustainable levels. Sustainability thresholds based on economic added value ensure a fairer distribution between sectors, in particular by preventing the most virtuous sectors and processes from being penalized.

1. Introduction

The reduction in industrial greenhouse gas (GHG) emissions is one of the pillars of the European strategy to achieve its global reduction objectives [1]. In this context, electrification of heat production is to play a major role for two main reasons: (i) electricity represents the major part of the energy used in the scenarios aimed at limiting climate change within the framework of the set goals [2,3]; and (ii) electrification has a high technology readiness level [1]. Hence, this transition is highly supported in EU roadmaps for industrial heat decarbonization [4] and some major projects are already underway [5].

1.1. Assessment of the Environmental Impact of the Electrification of Industrial Heat

The environmental impact of industrial heat production electrification is mainly addressed through the evaluation of the potential GHG emission abatement. For example, Zuberi et al. [6] estimated potential CO2 savings of 31 MtCO2 per year by the deployment of industrial heat pumps in U.S. food manufacturing. They also reached conclusions about the major modifications to the U.S. electricity infrastructure needed to achieve this wide-scale electrification. The importance of the carbon footprint of the electricity network was also highlighted in [7]. Schoeneberger et al. [8] stressed the necessity to take into account the environmental content of the grid mix to appropriately quantify the savings. However, their assessment also remained limited to GHG evaluation. The same approach is found in [2], in which the impact of several scenarios (business as usual, energy policy, and net-zero) on the decarbonization of the Swiss pulp and paper industry were assessed using techno-economic and GHG indicators. These authors stressed the role to be played by heat pumps and biomass boilers, with the latter enabling a rapid decline in CO2 emissions, but without considering the other environmental aspects.
Some other studies have used a broader environmental scope such as resource consumption or pollutant emissions. For example, in studies on the decarbonization of the glass industry [9] and the ceramics industry [10], the challenges related to material use (e.g., sand, gravel) were noted, but without discussing the details of the methodology used to adequately take them into account or specifically addressing the contribution of the energy consumption to these environmental impacts.
Hence, while GHG emission abatement has been systematically evaluated, the quantification of the other environmental impacts remains limited. Consequently, this may lead to an incomplete assessment, with a potential risk of environmental burden shifting [11,12]. This was also highlighted by Jovet et al. [13], who highlighted that the information given by approaches based on energy efficiency is insufficient to capture their consequences for the various environmental impacts.
Some recent studies have integrated LCA (life cycle assessment) to optimize energy systems, with, for example, Terlouw et al. [14] stressing the need to go beyond climate change impacts, as well as various processes: drying [15], the agri-food industry [16,17], or jet fuel production [18]. With such an approach, Volkart et al. [19] highlighted the environmental impacts resulting from a transformation of the Swiss energy system. However, their sustainability assessment remains limited to the LCA approach without any comparison to more macro criteria, like “planetary boundaries” as defined by Rockström et al. [20], which consider the Earth’s carrying capacity. The same limitation is found in the pioneering articles on the subject (e.g., [21]).

1.2. Sustainability Definition and Inclusion for Industrial Sectors’ Decarbonization

To appropriately assess the sustainability of a transformation, a large number of research studies have developed dedicated analytical frameworks. One of the most known methods was developed by the Stockholm Resilience Centre and is called “planetary boundaries”. It defines sustainable limits for nine criteria broken down into twelve sub-criteria, beyond which equilibrium is threatened [20]. There are also other methods based on different life cycle assessment methods such as those developed by Vargas-Gonzalez et al. [22] and Sala et al. [23], which both proposed to introduce reduction factors defined as the ratio of the “current global impact” to the “carrying capacity” for each LCA impact category.
One of the main limitations of these methods for application at the industrial level is the difficulty of converting the global threshold into roadmaps at the process level. In order to plan the transformation of energy systems, it is desirable for industries to have long-term visibility and, therefore, ideally, to have targets to aim for. One problem in enabling this is distributing the environmental impact defined at the global level between the various sectors of activity. The choice of the share of the authorized environmental impact, also named the “right to impact” by Ryberg et al. [24], is therefore needed to set objectives for industries.
To address this challenge, several studies [24,25,26] evaluated different downscaling principles, which are methods used to distribute overall impacts across sectors and individuals. There is a great variety of downscaling approaches, some based on physical flows (e.g., ability to reduce, heat energy content, physical production output) and others based on economic flows (equal per capita, historical debt, economic value added). As stated by Bjørn et al. [25], it is often necessary to combine several of them to be able to evaluate a specific process. However, each approach used to ensure that human activities do indeed respect sustainable limits has different implications and limitations, and each is not necessarily compatible with the others. Hence, these authors have classified them into three categories: (i) egalitarian or inegalitarian (each person has the same right or not), (ii) utilitarian (distribution based on the interests of society), and (iii) prioritarian (enabling positive discrimination for disadvantaged parties).

1.3. Present Work Objective and Novelties

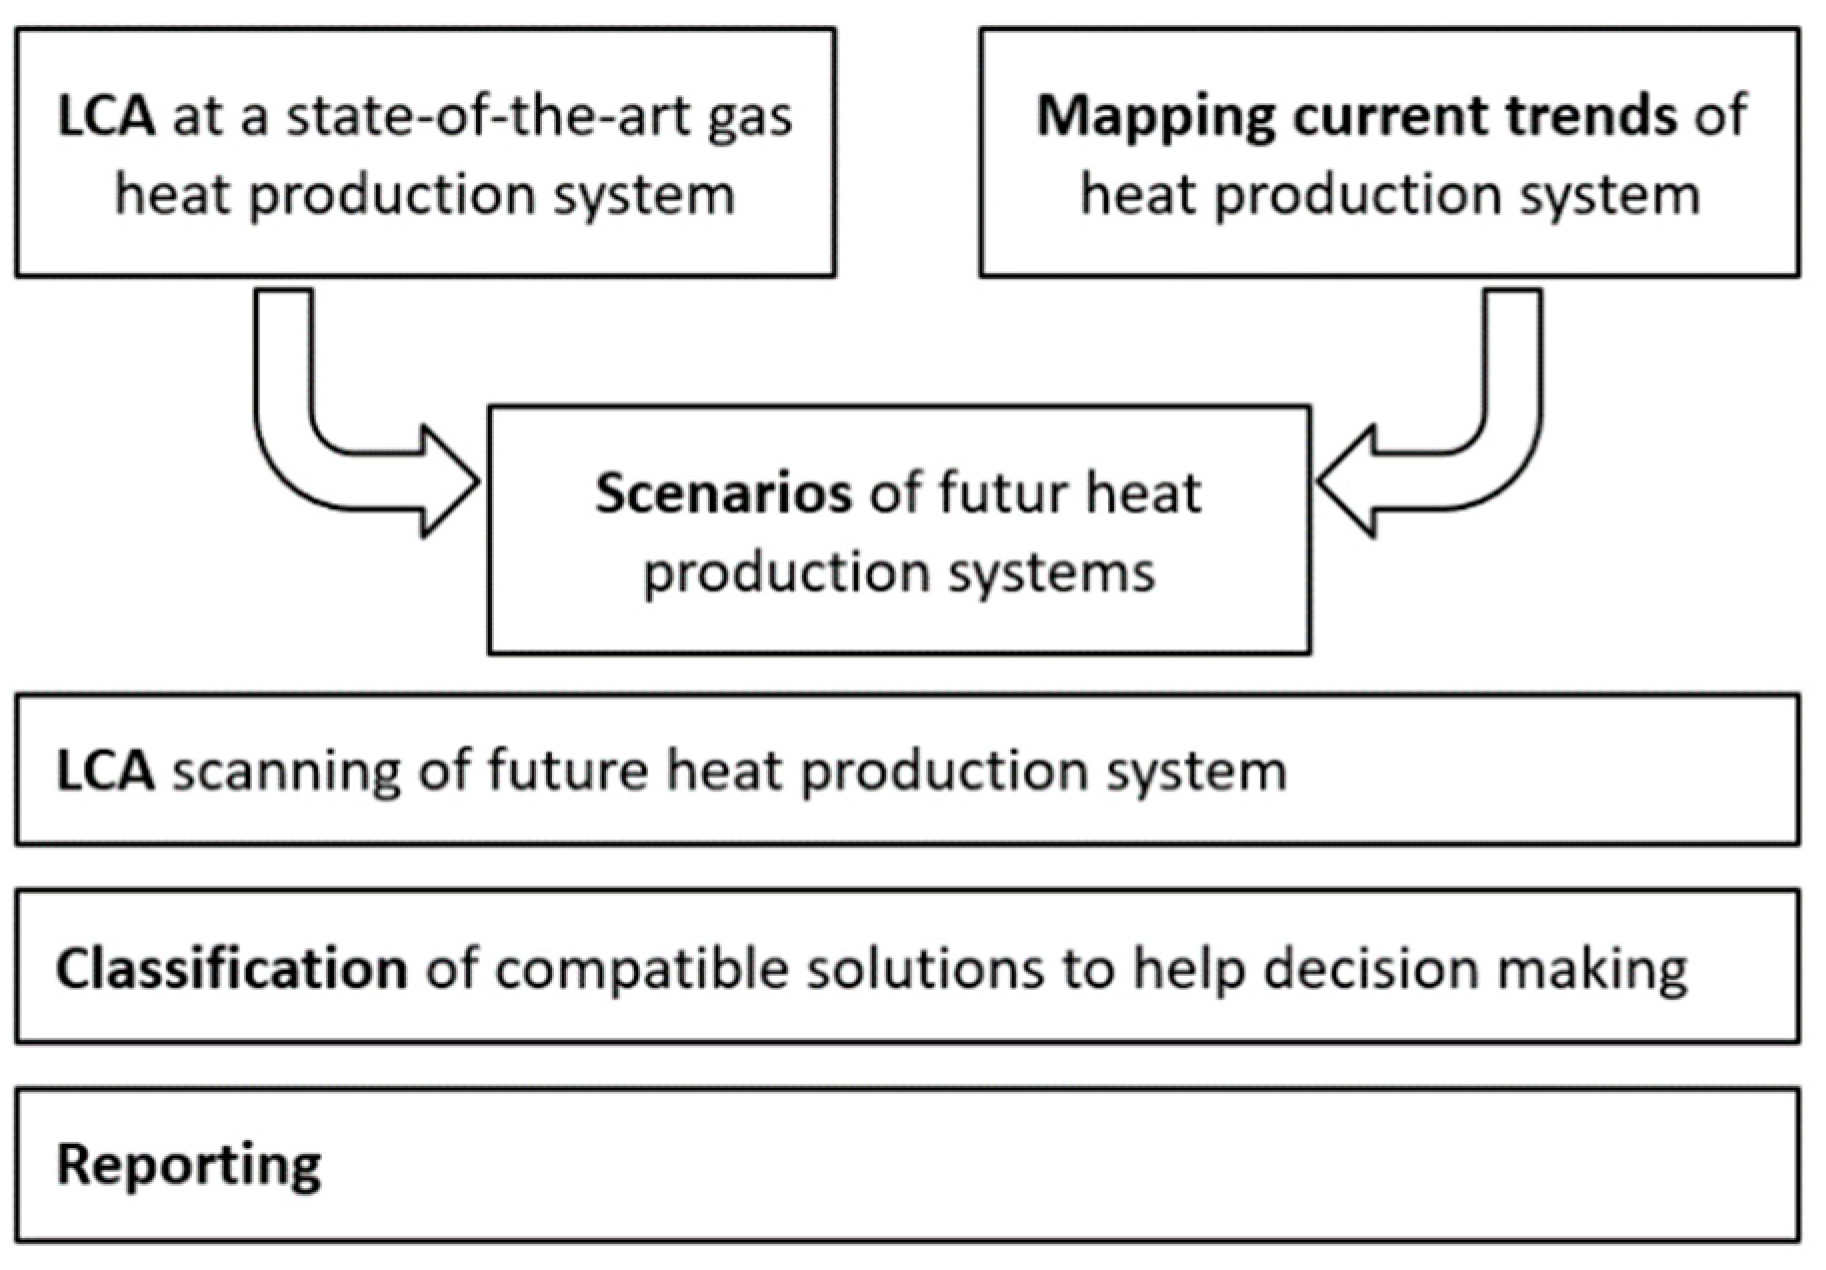
The present work aims to appropriately include considerations on sustainability to evaluate the decarbonization of industrial heat by electrification. To achieve this objective several novelties are proposed:
(a)
The sustainability of the electrification is evaluated against “sustainable levels based on planet boundaries, resource consumption or human health; this is a clear step forward if compared to other available works, which mainly conduct evaluations using energy efficiency and/or LCA.
(b)
The combination of utilitarian and prioritarian methods is used to perform the downscaling at the industrial sector scale. Two utilitarian criterions are proposed, one based on the current GHG emissions level, and the other on economic value added. It is then proposed to couple the economic criterion with a “contribution” indicator developed in this work, which corrects the downscaling using a prioritarian principle (penalization of highly contributing sectors).
(c)
To illustrate the relevance of this original approach, the impacts of the electrification of the heat generation for the Danish and French food industry sectors are evaluated, so that two electrical mixes with different decarbonized production sources are considered.
The proposed methodology is discussed in Section 2, with definitions of the French and Danish electricity mixes, the energy and LCA models, and the proposed novel indicators for sustainability assessment. The results are presented and discussed in Section 3. The first sub-section in Section 3 is dedicated to discussing the environmental impacts and the comparison of the sustainability limits defined with the two utilitarian approaches. The second sub-section evaluates the relevance of integrating the prioritarian criterion.

2. Materials and Methods

2.1. Energy in an Environmental Assessment Framework

Two electric mixes are considered in the present study: those of Denmark and France. To define the industrial heat demand and the available technologies to electrify its generation, the approach developed by Elmegaard et al. [27] and Bühler [28] was chosen. Within this framework, three scenarios based on the study of the electrification of the Danish food industry are considered: a reference scenario called “Business As Usual” (BAU), which is complemented by two electrification scenarios: the Low scenario (Lo) includes a massive electrification of the processes with the use of mechanical heat pumps (MHPs) for temperatures up to 150 °C, while the High scenario (Hi) supposes heat pumps are able to deliver heat at 300 °C. Each industrial sector is identified by its process type and the operating temperature needed to define the appropriate process electrification technology. Hence, MHPs (or mechanical vapor recompression, MVR) cover the heat demand until their maximum operating temperature. For higher temperatures, heat is produced with electric boilers and, if not possible, with gas boilers as a last option. Hence, the portfolio of technological solutions to produce heat is identical to that found in [27,28], and the performance data are retrieved from these references.
Beyond these three scenarios, only the marginal process is considered for the evaluation of both energy and environment indicators. Hauschild et al. [29] defined the concept of the marginal process as “the changes to the economy caused by the introduction of the studied product system, i.e., the product system’s consequence”. In our case, the heat production for the food industry represents a significant share of the energy market, so that its electrification will also lead to a significant change in electricity production to satisfy this new demand. Consequently, the environmental impact of these new sources of electricity production is considered thanks to the so-called “consequential” approach, as embedded in the Ecoinvent database [30].

2.2. Energy an Environmental Assessment Framework

2.2.1. Energy Efficiency

The data used in the model are based on the current energy consumption of the industry. The total final energy consumption (EcT) of the heat production process is given by Equation (1):
E c T = E p x , T η x , T . ( 1 ε )
Epx,T represents the heating requirement at temperature T (at process or industry scales), and ηx,T is the efficiency of the system for driving energy source x and an operating temperature T assumed equal to that of the process. The share of heat losses is quantified by ε , presented in Table 1, with typical values taken from Bühler [28].
For mechanical heat pumps (MHPs—assumed to be transcritical CO2 heat pumps as in [28]) and mechanical vapor recompression (MVR), η x , T is equal to the coefficient of performance (COP). For mechanical vapour recompression (MVR), the COP is supposed to be equal to 5 according to [27]. For MHPs, the COP is defined as [28]:
C O P M H P = η L o r e n z × T ¯ l m , s i n k T ¯ l m , s i n k T ¯ l m , s o u r c e
where η L o r e n z is the Lorenz efficiency with an assumed value of 0.45 [28]. T ¯ l m , s i n k and T ¯ l m , s o u r c e are defined by:
T ¯ l m , s i n k = T s i n k , o u t T s i n k , i n l n ( T s i n k , o u t ) l n ( T s i n k , i n )
T ¯ l m , s o u r c e = T s o u r c e , i n T s o u r c e , o u t l n ( T s o u r c e , i n ) l n ( T s o u r c e , o u t )
where T s i n k , i n and T s i n k , o u t are, respectively, the input and output temperatures of the sink, and T s o u r c e , i n and T s o u r c e , o u t are, respectively, the input and output temperatures of the source.
For boilers, an efficiency of 1 (i.e., η x , T = 1 ), regardless of the temperature level and the fuel (electric, gas, oil, or coal boilers, with the latter still being used in the BAU scenario).

2.2.2. Danish and French Consumption Scenarios

The energy consumption per energy source of the Danish food industry (Figure 1a) is evaluated using industrial consumption data ( E px , T ) from the Danish Energy Agency, Energistyrelsen [31]. It appears that gas, followed by oil and coal, are the main energy sources for heat generation in the current food industry. For both Lo and Hi scenarios, all the demand can be covered through electrification—except slaughterhouses because of the higher temperature required. However, the share of MHPs depends on the scenario and, therefore, on the availability of MHPs for very high temperature applications (up to 300 °C). The “other food industry” category includes all the industries not covered by the other four categories. It was chosen for the present study as its energy distribution is close to the average of the Danish food industry as a whole (gas share of 70% vs. 68%, oil share 24% vs. 22%, and coal share of 6% vs. 9% for “other food industry” and the Danish food sector, respectively).
The details of final energy demand by energy source of the French food industry are presented in Figure 1b. The data are taken from the National Institute of Statistics and Economic Studies of France [32]. Due to a lack of detailed data, the distribution of processes and temperature requirements is assumed to be equivalent to that of the Danish industry. Unlike the Danish case, the French sector relies almost exclusively on gas, which accounts for almost 98% of the energy used in all the sectors studied. It is also possible to see a different breakdown between sectors, with a lower share for the four major sectors and, therefore, a higher share for “other food industry”.

2.2.3. Electricity Mix

The marginal electricity mix for Denmark comes from the consistent Ecoinvent 3.7.1 database [30], as presented in Table 2, and is allocated as follows: less than 0.1% from hydro river production, 61.0% from wind power, and 39.0% from biomass. For the marginal electricity mix for France reported in Table 2, we chose to consider the scenario N1 from the French Transmission System Operator [33,34] instead of the Ecoinvent scenario; this is because the former differs from the latter, with biomass not being seen as a major contributor, in official scenarios, to the evolution of the French electricity mix. These marginal electricity mixes are defined at a medium-high-voltage grid scale, which explains the absence of solar PV, which is mostly connected to the low-voltage grid and is therefore used to a negligible extent by industry.
This study examines the potential environmental impact of decarbonized electricity mixes. The grid regulation for intermittent energies is based on French TSO studies [33,34]; it is managed using batteries, trade across European countries, and change in flexibility, but not by carbon energies, as is currently the case. The battery requirement for both countries is estimated using French TSO (RTE) studies. Indeed, according to these TSO scenarios, as only marginal processes are considered here, electricity storage at the grid scale is mainly achieved thanks to batteries, in the absence of the potential to significantly increase the pumping station storage.
The environmental impact of the battery requirement (BR) to balance the grid (kgbat/GWhgrid) is calculated using Equation (5); the results for each electricity mix are presented in Table 3a.
B R = b · E t P E d
where b is the battery power-to-grid consumption ratio described in Table 3b, in GWbat/GWhgrid, and is derived from the RTE study [33]; EtP is the battery energy-to-power ratio (GWh/GW), supposed to be designed for 5 h [35], which corresponds to the duration for which the module can operate at its rated output; and Ed is the battery energy density, set at 0.2 kWh/kg [36]. For LCA assessment, the battery life time is set at 10 years [37].

2.3. Environmental Model Description

The aim of this LCA is to model the environmental impacts of different heat production technologies in order to determine the solutions with the lowest impact and to benchmark these with the carrying capacity of Earth. The functional unit used is the heat production needed to meet the current demand of the industrial food processes over 1 year in France and Denmark in 2015.
The analysis was performed using the Ecoinvent 3.7.1 LCI database for modeling background processes [30], based on the marginal process defined in the assessment framework. The following methodology is based on ISO 14040/14044 standards [38,39]. More assumptions and information that are required to follow the ISO standards of the LCA are detailed in Appendix A.
The life cycle impact assessment methodology used to assess the environmental impact is the EF 3.0 methodology [40]. The assessment boundaries include all impacts from the cradle to the grave, including transport and conversion losses for the life cycle of energy and the equipment life cycle. There is no coproduct in this assessment, i.e., the heat is intended entirely for the industrial process. This study focuses on heat production and, therefore, does not consider other impacts of the agri-food process (non-energy inputs, for example). The integration of the new heat production system on the site is also neglected because this accounts for only a small part of the system’s impact and it varies greatly from one plant to another. Lastly, the impact of the current energy system, which will be replaced, is not negatively accounted for in the balance, with the objective here being to compare different systems with respect to a sustainable level that is independent of the type of energy initially used by the system.
For the refrigerant, a charge by power unit ratio of 2.0 kg/kW [41], an annual leakage rate of 5% [41], and an end-of-life leakage rate of 15% [42] are considered.

2.4. Environmental Sustainability Assessment

The life cycle assessment is expanded to include environmental sustainability. Note that for the sake of simplicity, the environmentally sustainable limit is henceforth referred to as the sustainable limit’. Sustainable limits are based on the carrying capacities of the whole Earth system in the face of various anthropogenic pressures, based on planetary boundaries and extended with human health [29]. Global sustainable levels for all human activities are defined using Equation (6) on the basis of the current impact, which is corrected with reduction factors. The latter were derived from Vargas-Gonzales et al. [22], except for marine eutrophication, which is based on [43], and climate change, which is based on the AIM/CGE 2.2 scenario published by [44]. This scenario is used in IPCC AR6 as one of the reference scenarios to limit warming to 2 °C without overshooting [45]. It sets out the targeted reduction in emissions between 2015 and 2100 to respect the 2 °C target. In this work, it is used to define targets for the climate change indicator over different time periods, as presented in Table 4. These periods are not used for the other impact categories or for a possible improvement in the technologies (such as MHP or MVR) in the future. The reduction factors are divided into three periods of 25 years (average lifetime of heat production technologies): 2015–2040, 2040–2065, and 2065–2090, as presented in Table 4.
S L t o t , y = I t o t , y R f y
where SLtot,y is the global environmental sustainability threshold for environmental impact “y”. Itot,y is the total impact of the human activities over a year for environmental impact y using the base year 2010, which is the closest year to the studies on sustainable levels provided by the EF 3.0 method. I tot , y units depend on each impact category. Rfy is the reduction factor used to reach a sustainable level for environmental impact “y” presented in Table 4. A value of Rfy below 1 indicates that the current level is below the sustainable level, while a value greater than 1 indicates that the sustainable level is exceeded.
At the level of a particular human activity or an industrial sector, the sustainable level from sector ( S L s , y ) is derived from S L t o t , y following Equation (7):
S L s , y = S L t o t , y · τ s , y
where τ s , y represents the share of environmental impact y authorised for the considered sector “s”, which depends on the importance of this sector in relation to all human activities. The sum of τ s , y for all human activities must be lower than or equal to 1 in order not to exceed the sustainable limit for impact category “y”. Allocating τ s , y to each sector of human activity is definitely open to discussion [24,25,26]; it may be based on economic or environmental considerations, prioritizing basic human needs or their ability to pay for it, etc. Two approaches are compared and discussed to present the advantages and disadvantages of each choice:
  • The simplest approach is to use the share of the current sector impact in relation to the total environmental impact, as presented in Equation (8):
τ s , y = I s , y I t o t , y
where I s , y represents the contribution of the heat production over one year for impact category “y”.
  • The second approach is based on the economic importance of the sector considered in relation to all human activities. It is calculated using the economic value added (EVA) of the process compared to the global value added (EVAtot):
τ s = E V A s E V A t o t
The downscaling based on current emissions is probably the easiest for industry to assess because it depends solely on its own emissions. It is therefore possible for each industry to assess its level of impact and to put in place the measures required to make the necessary gains. On the other hand, this approach implies that the reduction is based on a current level of emissions, and it will be less difficult for industries that have not improved their processes yet to achieve the desired level, compared to those that have already begun their transformation. The second method was designed to avoid this bias, by dividing the global impact according to the added value of the process. This method therefore makes it possible to set a limit on the impact per added value generated, assuming that value added reflects the sectors in which human activity is willing to place value. As added value data are also easily accessible, this method is also relatively simple to implement.
The environmental sustainability ratio (SRs,y) defines the ratio between the resulting impact of a process and the corresponding space allowed for the sector:
S R s , y = I s , y S L s , y
Sustainability is achieved for the proposed solution for a value below 1; conversely unsustainability is identified by a ratio above 1. The lower the value of S R s , y , the further from the boundaries the solution.

2.5. Contribution Level

To refine the information given by the sustainability ratio, it is necessary to estimate the extent of the impact for a given impact category. To reach this objective, a “Contribution Level” (CL) is defined. It compares the generated impact “y” per added value of human activity for the given sector “s”, Is,y/EVAs, to the overall value (i.e., global contribution of impact “y” for the global value added), Itot,y/EVAtot:
C L s , y = I s , y E V A s I tot , y E V A tot
A value of C L s , y means the share of emissions is aligned with the share of EVA created. On the contrary, a low (or high value) implies an environmental contribution that is not aligned with the value created, which leads to an insignificant (or predominant) environmental contribution of the process on the impact category, regardless of whether or not this contribution is sustainable. It should be noted that the contribution level and the τ s , y indicator both use the economic value EVA but reflect different aspects. Indeed, τ s , y represents the “right to impact” of a process, i.e., the proportion of emissions that a sector can afford, which is complex and depends on many factors, so there is currently no commonly accepted definition. The contribution level indicator compares the environmental impact per EUR of EVA generated by the process with the world average. In other words, this indicator can be used to assess whether the process is more or less virtuous in a particular impact category than the rest of human activity, and therefore to determine whether it makes a significant contribution to the impact in relation to its size.
The various indicators were calculated for 2019. Corresponding data were taken from [46] for Denmark, ref. [32] for France, and [47] for the world. As the Danish EVA value includes “Production of compound feed”, “Production of Sugar”, and “Other food industry”, the distribution of EVA was made in proportion to the energy consumption between these three sectors.

3. Results

The environmental assessments of French and Danish scenarios are presented in Section 3.1 and compared to the sustainable limits using the sharing principal defined in Equations (8) and (9). In Section 3.2, the sustainability ratio is compared to the contribution level, which provides another perspective for the analysis of the sustainability of the different scenarios.

3.1. Environmental Assessment of the Scenarios Compared to the Sustainable Level

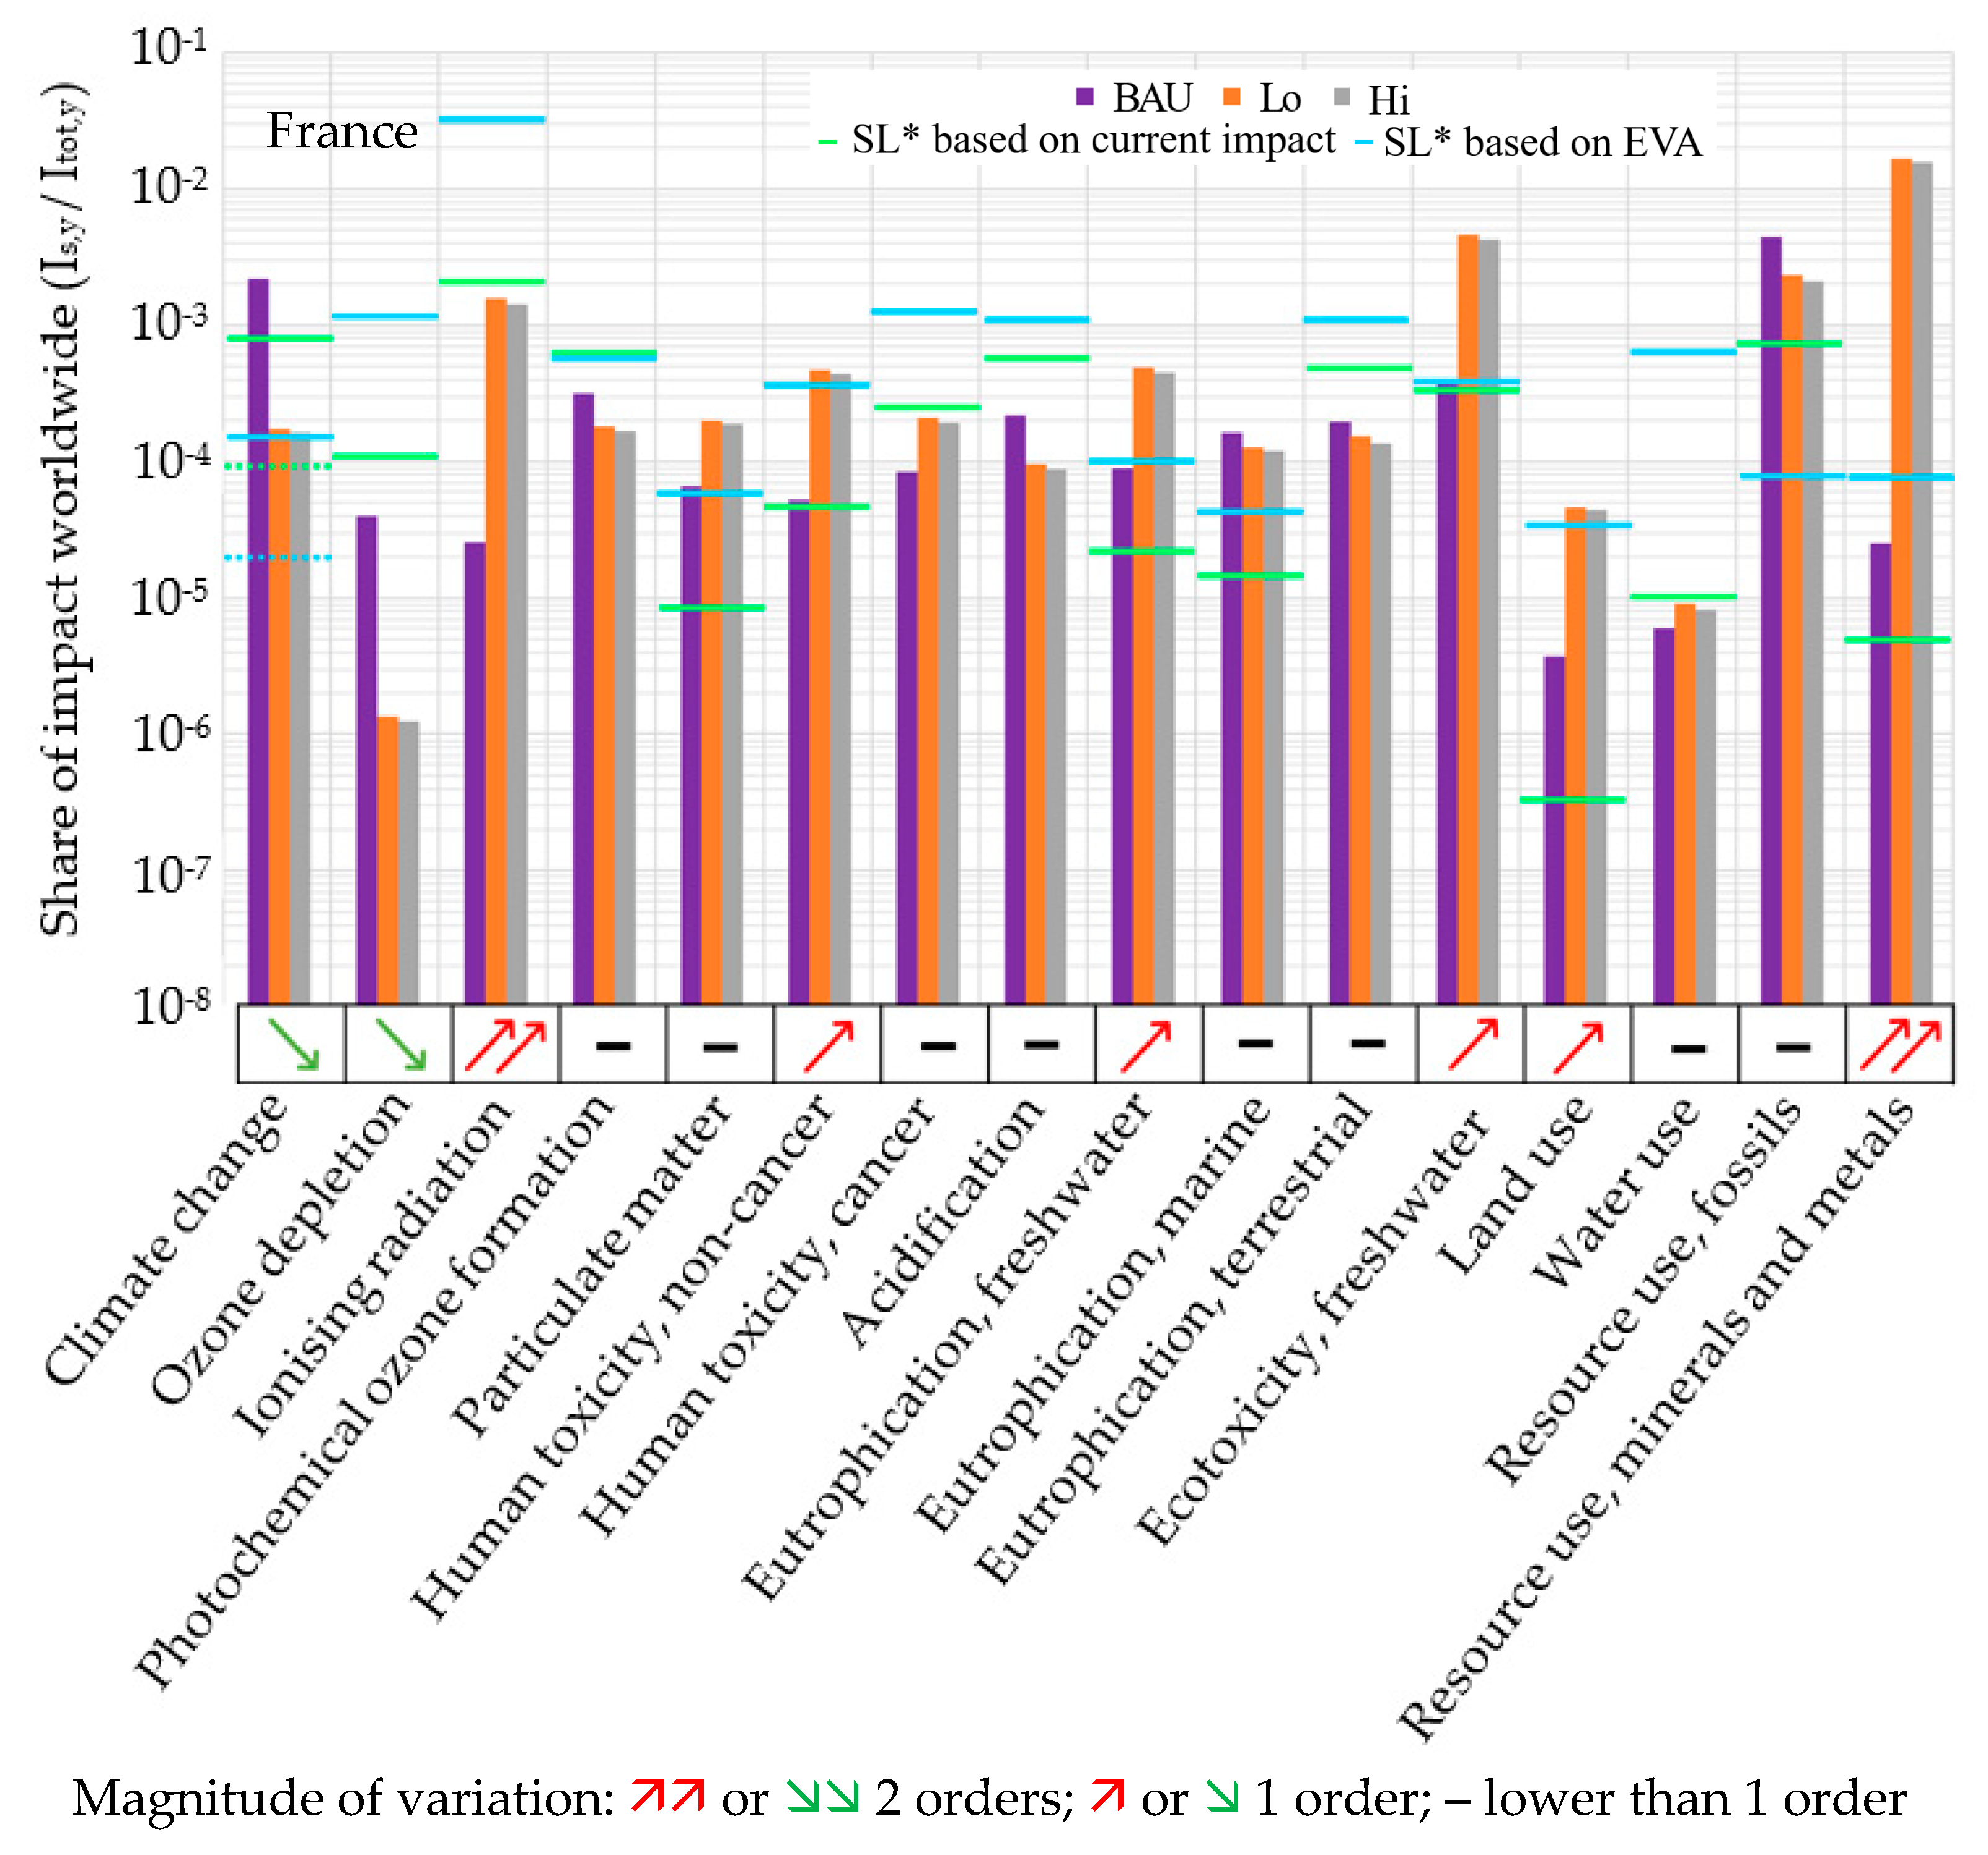
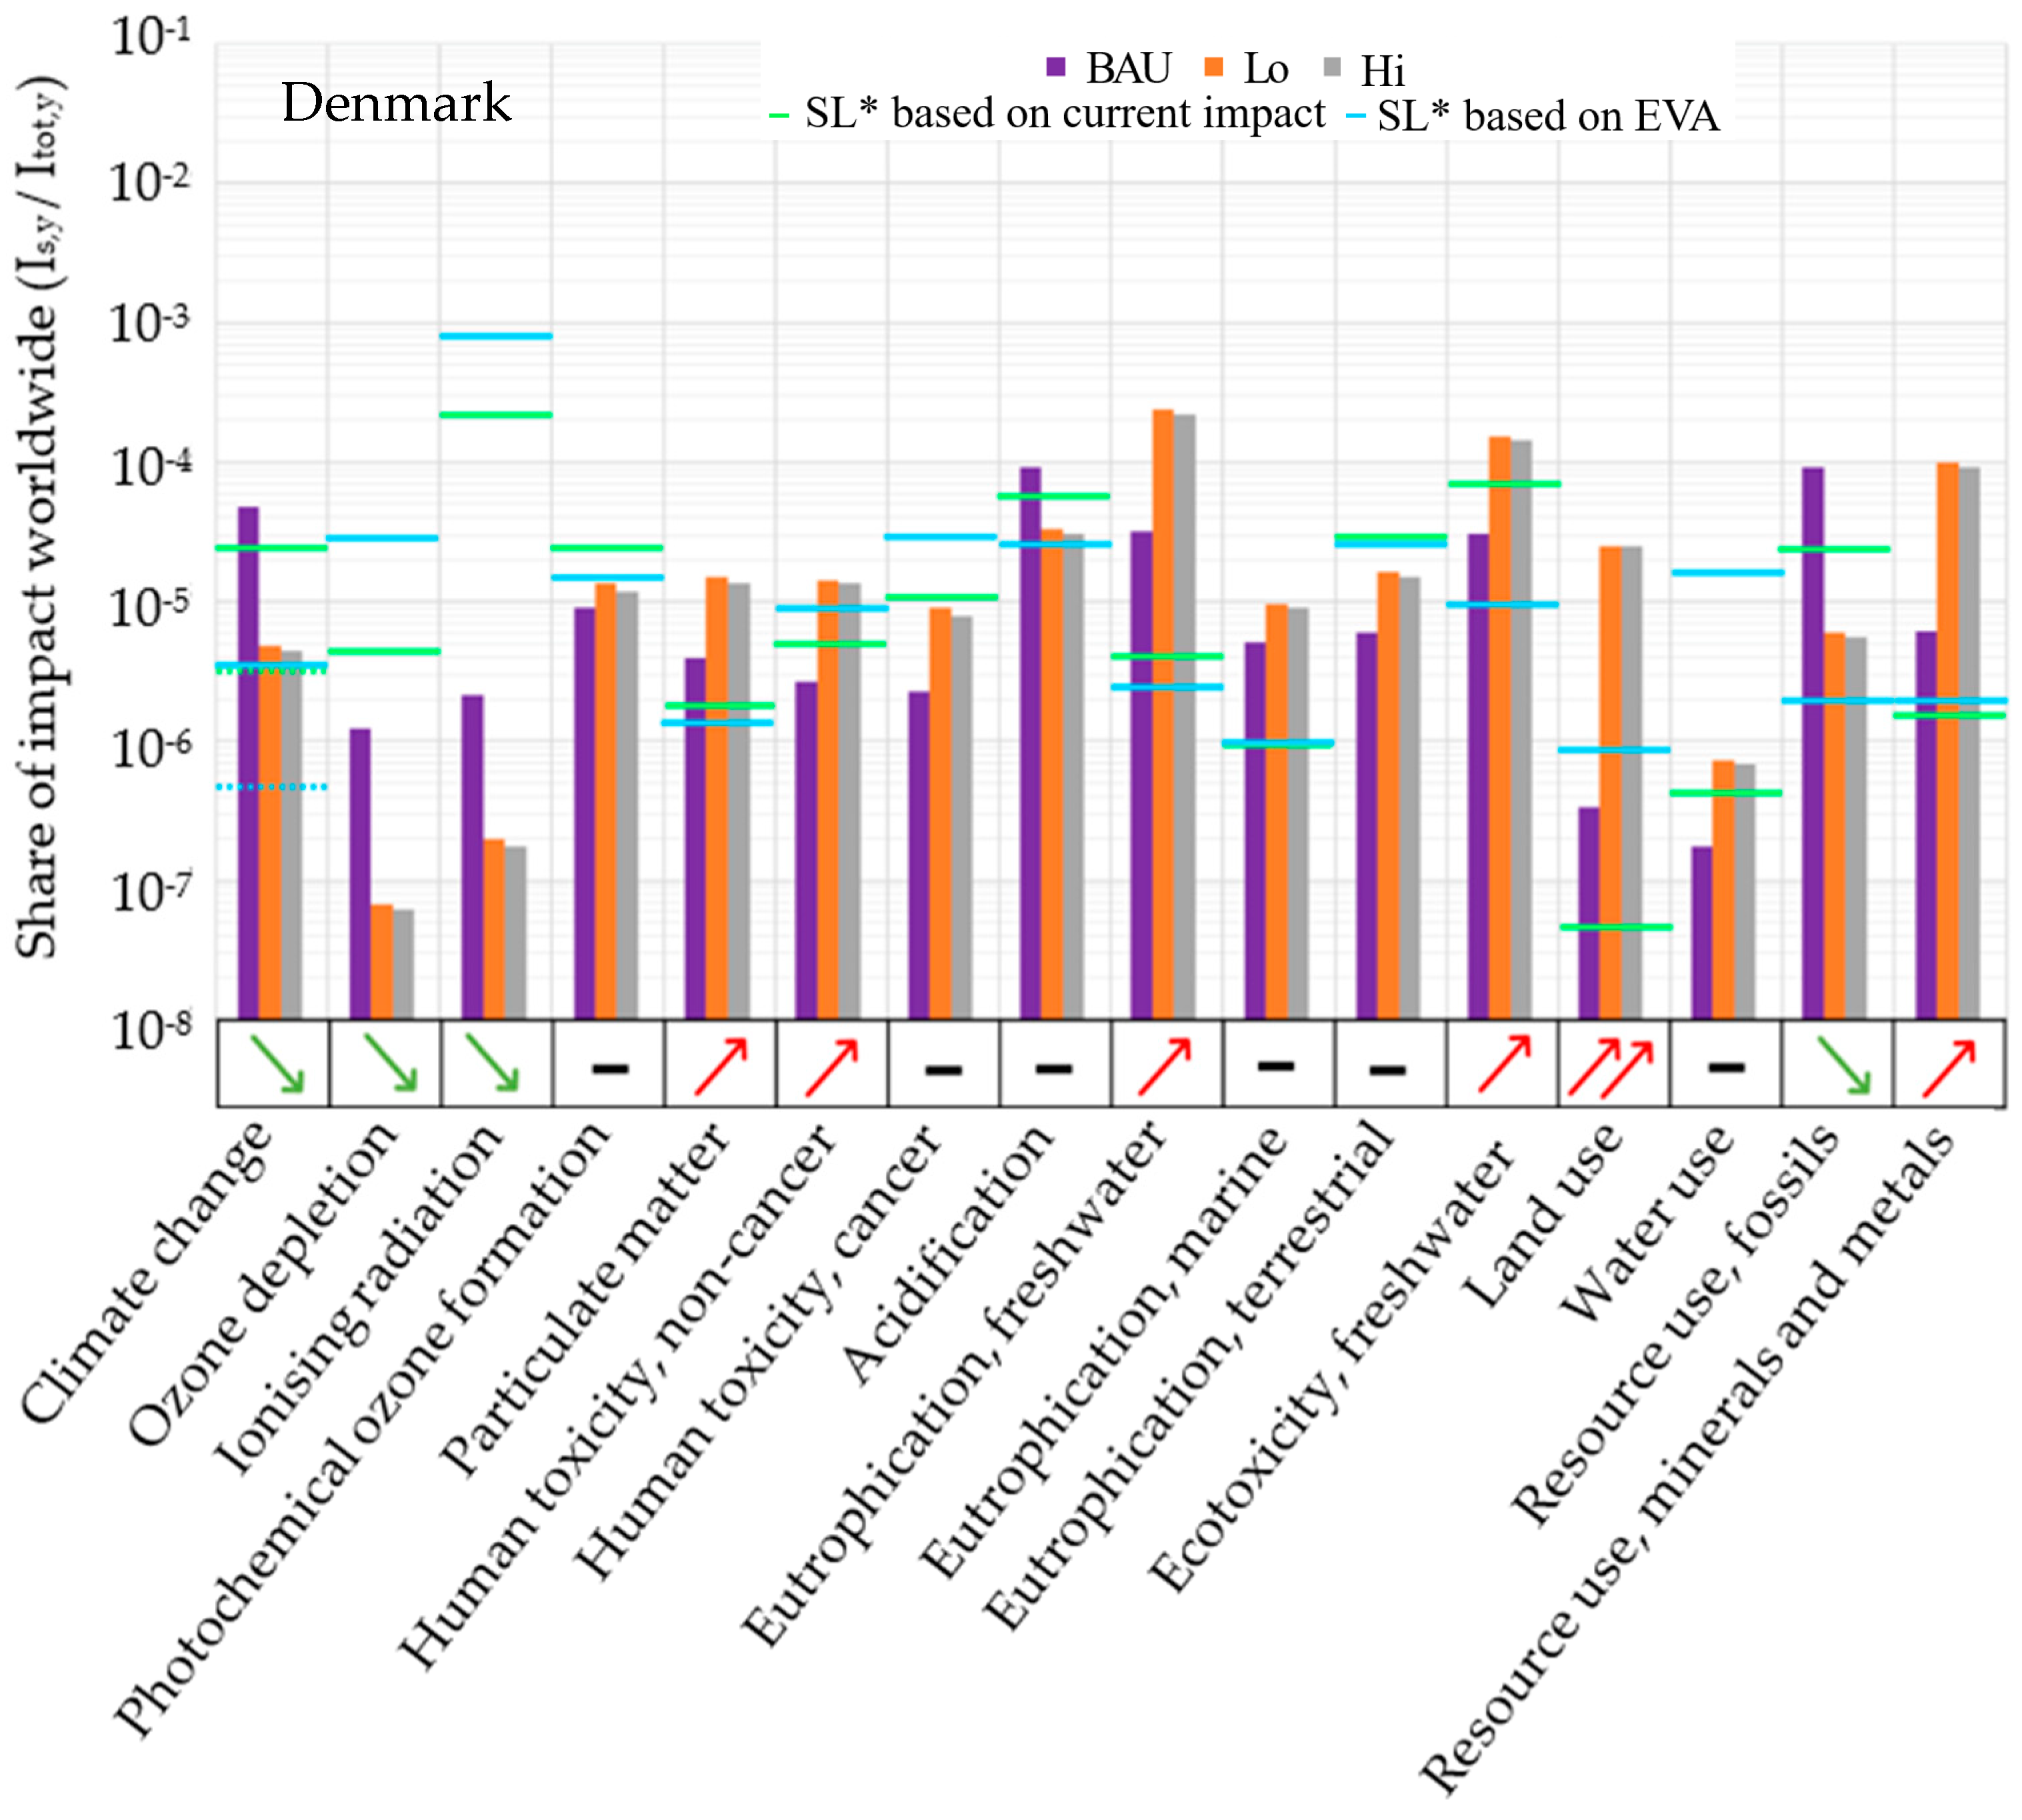
The environmental impacts of the “other food industry” sector are presented in Figure 2 for the three scenarios (BAU, Lo, and Hi), and with the sustainable levels calculated from the downscaling based on current emissions (in green, Equation (8)) and the EVA-based approach (in blue, Equation (9)). For the “climate change indicator”, the sustainability levels calculated with the two sharing principles for the periods 2040–2065 and 2065–2090 are plotted. The period 2015–2040 is not presented because the average gain over this period is marginal (reduction factor of 1.2), and therefore shows no change compared with the BAU level.
There are no significant differences between the Lo and Hi scenarios. However, when turning from BAU to Lo or Hi scenarios, significant variations in several impact categories can be observed, with four impact categories exhibiting different behaviours in the two countries:
  • Ionizing radiation”. The use of nuclear power leads to a significant increase in this indicator for France, while it decreases for Denmark due to the prevalence of wind and biomass in the mix. It is noteworthy that, despite this increase, the impact remains below sustainable levels.
  • Land use”. Both countries see a significant increase because current fossil-based mixes are the most efficient solutions for this indicator. However, the extent of the increase depends heavily on the transformation strategy. The difference between the 11-fold increase for France and the 59-fold for Denmark is mainly due to the use of biomass.
  • Resource use, fossil”. As the use of fissile material is included in this contribution, the presence of nuclear power impacts the French industry by maintaining a level close to the current one, while for the Danish mix, a significant decrease is observed.
  • Resource use, mineral and metal”. The increase is more significant for France, with a higher share of non-controllable energy (Table 3) and, therefore, a more significant use of batteries. Similar to the “land use” impact, it is observed that the sustainable level is overtaken by the sector because electrification leads to increased consumption of mineral resources.
Biomass generally enables the consumption of fossil and mineral resources to be limited, but it leads to an increase in land use and particle emissions. For both countries, electrification enables the reduction in the “climate change” indicator below the sustainable limits in the period 2040–2065, but at the expense of other environmental indicators. However, for the period 2065–2090, this indicator is below both sustainable limits, so other actions are required to cope with climate change.
As Figure 2 shows, the choice of the sharing principle has a major influence on the sustainable level of each environmental impact. For example, for the French case, the sustainable limit for “climate change” is three times lower with the EVA-based indicator than with the current impact-based indicator. On the other hand, the difference between the two indicators is the opposite for the “land use” impact, with a factor of 100 between the two allocation methods. The BAU scenario is in fact one of the worst in terms of “climate change” and, on the contrary, one of the best in terms of “land use”, due to the predominance of gas for heat production. Consequently, even if the calculated sustainable level for “climate change” is lower than the current level, it leaves room for other technologies with a better impact on “climate change”—such as those developed in the Lo and Hi scenarios—to reach this threshold. However, given that the total impact of “land use” also needs to be reduced by a factor of 9.33, and that the BAU scenario’s impact for this category is already low, this leaves no room for other technologies for this impact category. This example shows that defining sustainability on the basis of current impacts imposes limits on future technologies based on current production systems. However, the environmental impacts of alternative energy solutions are very different from current ones and therefore not compatible with this choice. On the contrary, the EVA-based sharing principle distributes the “right to impact” among all sectors of activity, on the sole basis of the economic value of their production, irrespective of the current energy system used for this production. This choice avoids imposing constraints that are specific to the type of energy initially installed, so as not to exceed the environmental impacts that are already the lowest for the current production system.
However, there is a limit to the method based solely on EVA, as this value is currently based on an unsustainable economy that exceeds a large number of planetary limits [20,48]. It would therefore be necessary to add other criteria to this analysis, for example, by differentiating between economic sectors vital to human needs and others, in order to attribute the “right to impact”.

3.2. Combined Sustainable Ratio and Contribution Level

In order to obtain a more complete picture of the impacts, the contribution level (CL, Equation (11)) is introduced in Figure 3 and compared to the sustainable ratio (SR, Equation (10)) for each environmental indicator presented in Figure 2 for both France and Denmark. As the differences between Lo and Hi scenarios are negligible for this industry sector, the latter is not displayed, but only BAU and Lo scenarios.
Four trends are identified in Figure 3:
  • Bottom-left zone. The sustainability ratio as well as the contribution level are lower than 1, meaning the reported impacts (e.g., “ozone depletion”) correspond to a sustainable level and to a contribution share below the average of human activities, i.e., the considered sector is not a major contributor in the global economy for these impact categories and is hence of less importance. Even if this sector grows in the future, it is not expected to have a major global impact for the considered environmental indicator.
  • Bottom-right zone. The sustainability ratio is lower than 1, while the contribution level is greater than 1. This is the case for impacts for which a sustainable level is reached but with a contribution share above the average. Hence, despite their sustainability, the significance of these categories in the global economy implies the need to look carefully at them. While no impact category is present in this zone for France, some can be found for Denmark, such as “acidification”, because of the importance of the agri-food sector.
  • Top-left zone. The sustainability ratio is greater than 1 while the contribution level is lower than 1. In this case, the resulting impacts are unsustainable, but the contribution share is low compared to that of the other activities. Consequently, the growth or decline in this economic sector is not expected to result in a major modification in compliance with global sustainability thresholds for the considered impact. “Eutrophication” for France and “resource use, mineral and metal” for Denmark are in this configuration.
  • Top-right zone. In this zone, both the sustainability ratios and the contribution level are greater than 1, meaning the impact categories concerned are both unsustainable, contributing more than the average of human activities. Categories such as “resource use, minerals and metals” are the most critical after electrification as the sector makes a major contribution to the unsustainability of these indicators. For Denmark, “land use” is also in this category due to the high share of biomass in the electricity mix.
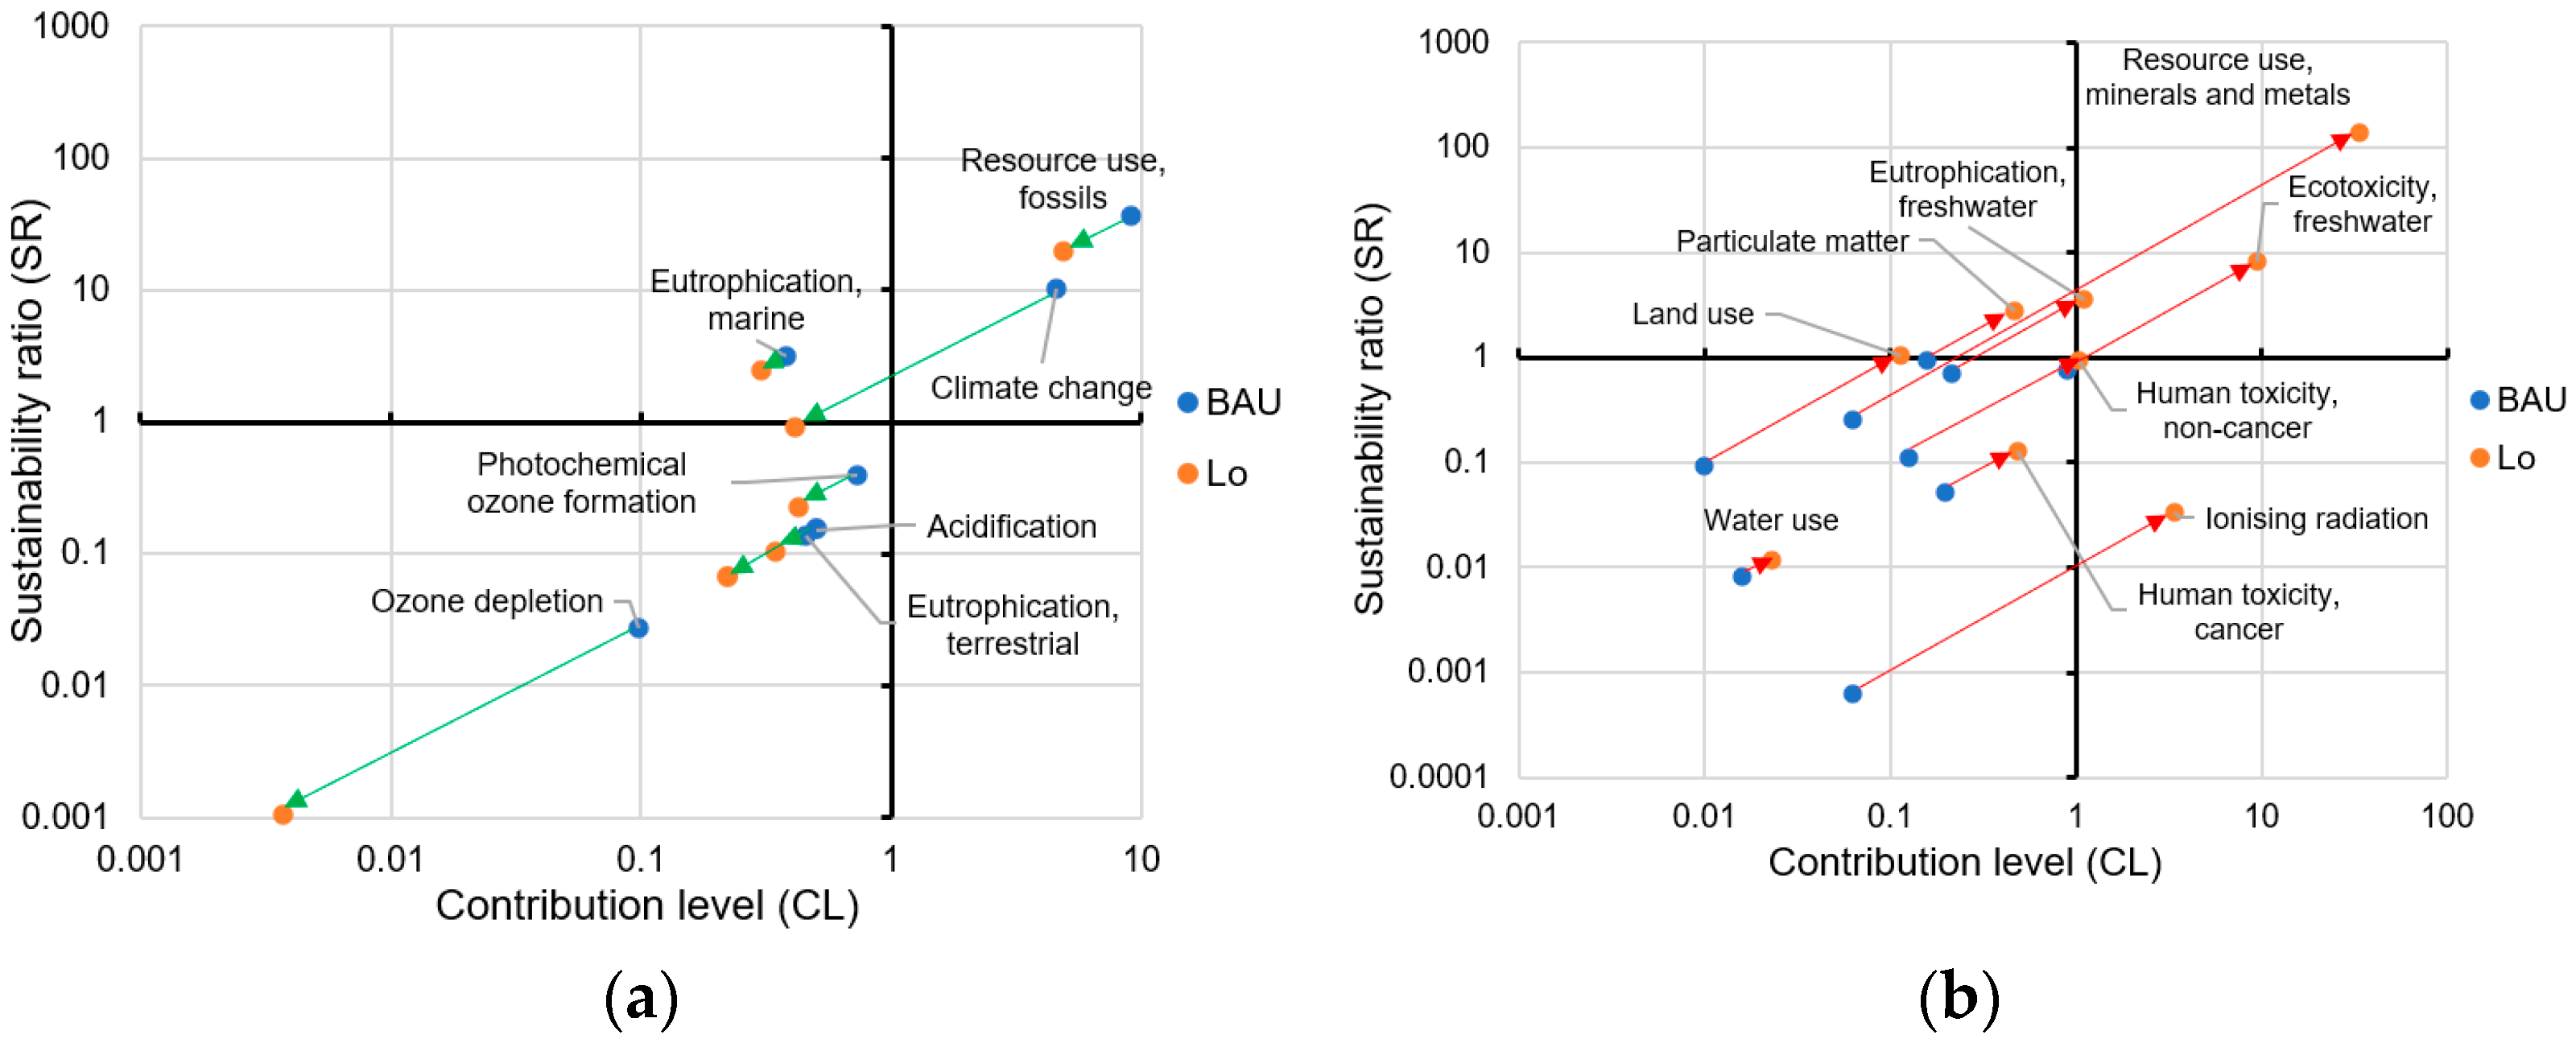
To better highlight the consequences of the electrification of the food industry, the changes in impact between BAU and Lo cases are plotted in Figure 4 for France. Electrification does not bring a general improvement in all environmental impact categories; improving indicators can be found in Figure 4a while worsening ones are in Figure 4b. This impact/contribution classification highlights the categories to be considered more specifically. In particular, impact categories located in the top-right zone are estimated to be within unsustainable ranges and may limit the growth of one sector and/or require a trade-off with other sectors. In the BAU configuration, the “other food industry” sector has a major impact on the “climate change” and “resource use, fossil” categories due to the use of fossil fuels. After electrification, the pressure on these two impact categories is less significant but results in an increase in other categories such as “land use” or “resource use, mineral and metal”. The sector is therefore in competition with other sectors such as agriculture for “land use”, or with electric mobility, for example, for “resource use, mineral and metal”.
From these results, it appears clearly that the heat decarbonization of the considered sectors by electrification is not compatible with achieving a sustainable level for all the assessed environmental indicators, as several potential significant environmental burden shifting issues were identified, like those for “land use” or “resource use, mineral and metal”. The chosen paths for electricity decarbonization determine the concerned impact categories, so the decision making-process has to properly consider the whole set of environmental indicators and the various roadmaps at the country level.
The results presented in this article focus on the agri-food sector for Denmark and France, but some conclusions can be generalized to a wider scope. In terms of applications, there are many sectors with significant potential [49]. The sustainability of these different sectors depends heavily on the efficiency of the substitution systems that can be considered for decarbonization. The food industry is a sector with strong potential for the development of MHP, which enables the overshoot of sustainable thresholds to be limited, with a COP that can be higher than 3 in most applications. For other sectors requiring higher temperatures or special processes (induction, etc.), electrification is likely to result in higher overshoots. In addition, the proposed approach needs to be combined with an economic assessment of electrification to ensure its feasibility and, above all, the motivation of industries to make this transition. Jovet et al. [7] proposed an approach for assessing the economic feasibility of switching from gas to electricity. To go further, it would be interesting to develop this approach for different types of electricity mixes in different geographical contexts to extend the analysis.
In addition, using an assessment method that corrects the sustainable level (SR) with the contribution level (CL) could offer interesting perspectives for evaluating mitigation solutions. This gives additional weight to sectors that have a higher ability to significantly reduce their overall impacts compared to other activities. This factor aims to correct the downscaling of a utilitarian method based on economic value by adding a prioritarian method that penalizes the least efficient solutions per unit of value added.

4. Conclusions

The present research work aims to go further in the assessment of the sustainability of industrial heat decarbonization than the standard approach based on LCA, by including sustainability criteria based on “sustainable levels”. To achieve this objective, new approaches are proposed to downscale a sector scale, using sustainability indicators that are mainly evaluated at the planet scale. A first approach consists in estimating the share of a given sector from an “utilitarian” point of view, referring to its share at the world scale in terms of the considered impact or to its economic importance (EVA, economic value added). To complement this first approach, the combination with a prioritarian criterion (penalization of highly contributing sectors) is proposed. The decarbonization of the food sector for Denmark and France through electrification is evaluated as a use case.
Compared to a reference configuration (i.e., heat production with a gas boiler), the electrification of heat production led to an improvement for some LCA indicators (e.g., climate change and ozone depletion for both cases) but also to the degradation of several (e.g., land use, and resource use, minerals and metals). The magnitude of the improvements/degradations is directly related to the characteristics of the country’s electricity mix and to the electrification scenario (two scenarios were evaluated: “Lo” for electrification up to 150 °C in temperature demand, and “Hi” for electrification up to 300 °C), which increases the share of food processes that can be covered.
From these results, a significant impact of the downscaling method on the evaluation of sustainability was highlighted. For example, for the French case, the sustainable limit for “climate change” is three times lower with the EVA-based indicator than with the current impact-based indicator. The limitation of the approach based on the actual share in the impact at the world scale is also evidenced in this work. For example, focusing on the “land use” criterion, the BAU (Business as Usual) scenario appears to be a better option to achieve “sustainability”; in contrast, based on the “gas boiler”, whose current contributions to “land use” are low, both electrification scenarios appear less sustainable. By shifting to EVA-based criterion, both electrifications scenarios were found to be very close to the sustainable level for France, and the importance of their contributions beyond sustainability was significantly reduced for Denmark. Hence, the approach based on EVA appears to be more relevant to the authors for appropriately assessing a transformation of an energy system in order to avoid discarding any modification because of the potential high efficiency of the BAU reference solution in many criteria.
To further improve the analysis of the sustainability, a “contribution level” indicator was introduced. To the sustainable level criteria, this adds an additional weight for sectors that have a higher ability to significantly reduce their overall impacts compared to other activities by combining their shares in both total EVA and total environmental impact. From the new mapping obtained, four categories were defined to easily identify the impact categories for which the sector will make a significant contribution compared to other sectors. In particular, this makes it possible to assess the relevance of a change in technical solutions by ensuring that it does not compete with other sectors where the impact may be critical. These four categories cover zones for which (1) a sustainable level is reached and the contribution is below the average of human activities, (2) a sustainable level is reached but the contribution is higher than the average of human activities, (3) no sustainable level is reached and the contribution is below the average of human activities, and (4) no sustainable level is reached and the contribution is higher than the average of human activities. Consequently, any indicator belonging to category no. 4 (e.g., “resource use, minerals and metals” for both France and Denmark) has to be considered a priority, while those belonging to category no. 1 can be overlooked (e.g., “ozone depletion” for both France and Denmark). This exhibits the benefit for integrating the proposed “contribution level” indicator in the assessment of pathways to decarbonize industrial heat.
As future work, the evaluation of other sectors and other countries to increase the size of the dataset would be of high interest. It would then be possible to define strategies for different sectors in order to reduce the competition that can arise over the long term by transforming these sectors following the conclusion of the same methodology. A thorough assessment of the main downscaling options is also needed to define the “right to impact” for each sector, so as to draw up a clear roadmap for industry. This type of approach is both technical (what are the best technical options?) and sociological (what changes are acceptable to society?), so an interdisciplinary approach is essential for this matter.

Author Contributions

Conceptualization, Y.J., F.L., A.L. and M.C.; methodology, Y.J., F.L., A.L. and M.C.; software, Y.J.; validation, Y.J., F.L., A.L. and M.C.; formal analysis, Y.J.; investigation, Y.J.; resources, Y.J.; data curation, Y.J.; writing—original draft preparation, Y.J.; writing—review and editing, Y.J., F.L., A.L. and M.C.; visualization, Y.J.; supervision, F.L., A.L. and M.C.; project administration, M.C.; funding acquisition, M.C. All authors have read and agreed to the published version of the manuscript.

Funding

This work was supported by the French Ministry of Higher Education and Research.

Data Availability Statement

The data presented in this study are available on request from the corresponding author.

Conflicts of Interest

The authors declare no conflicts of interest.

Appendix A

The LCA methodology is based on ISO 14040/14044 standards [38,39] and the present section presents the different steps of the methodology.
Goal. The goal of the environmental model is to assess the impact of different industrial heat production technologies using life cycle assessment. These results are compared to environmental thresholds to assess their sustainability. The study generates a large number of possible combinations of heat production technologies to meet industrial needs. The environmental assessment will be coupled with an economic and energy analysis of the process. This study is in a decision context, which can be described as a macro-level decision support (Situation B). This is defined by Hauschild et al. [29] as the assessment of a process “expected to cause structural changes in one or more processes of the systems that the studied product system interacts with”. The main limitations due to methodological choices are:
(i)
This study does not consider increased or decreased process need;
(ii)
The environmental threshold needs to be adapted for every process to consider this specificity;
(iii)
The solutions proposed in this study are a set of non-dominated solutions and there is no single dominant solution.
Scope. The goal of this study is to assess the environmental impact of electrification technologies for the food industry sector for different configurations, i.e., for France and Denmark, type of process, and level of temperature. For this matter, the functional unit used is the heat production needed to meet the current demand of the industrial processes over 1 year in France and Denmark in 2015.
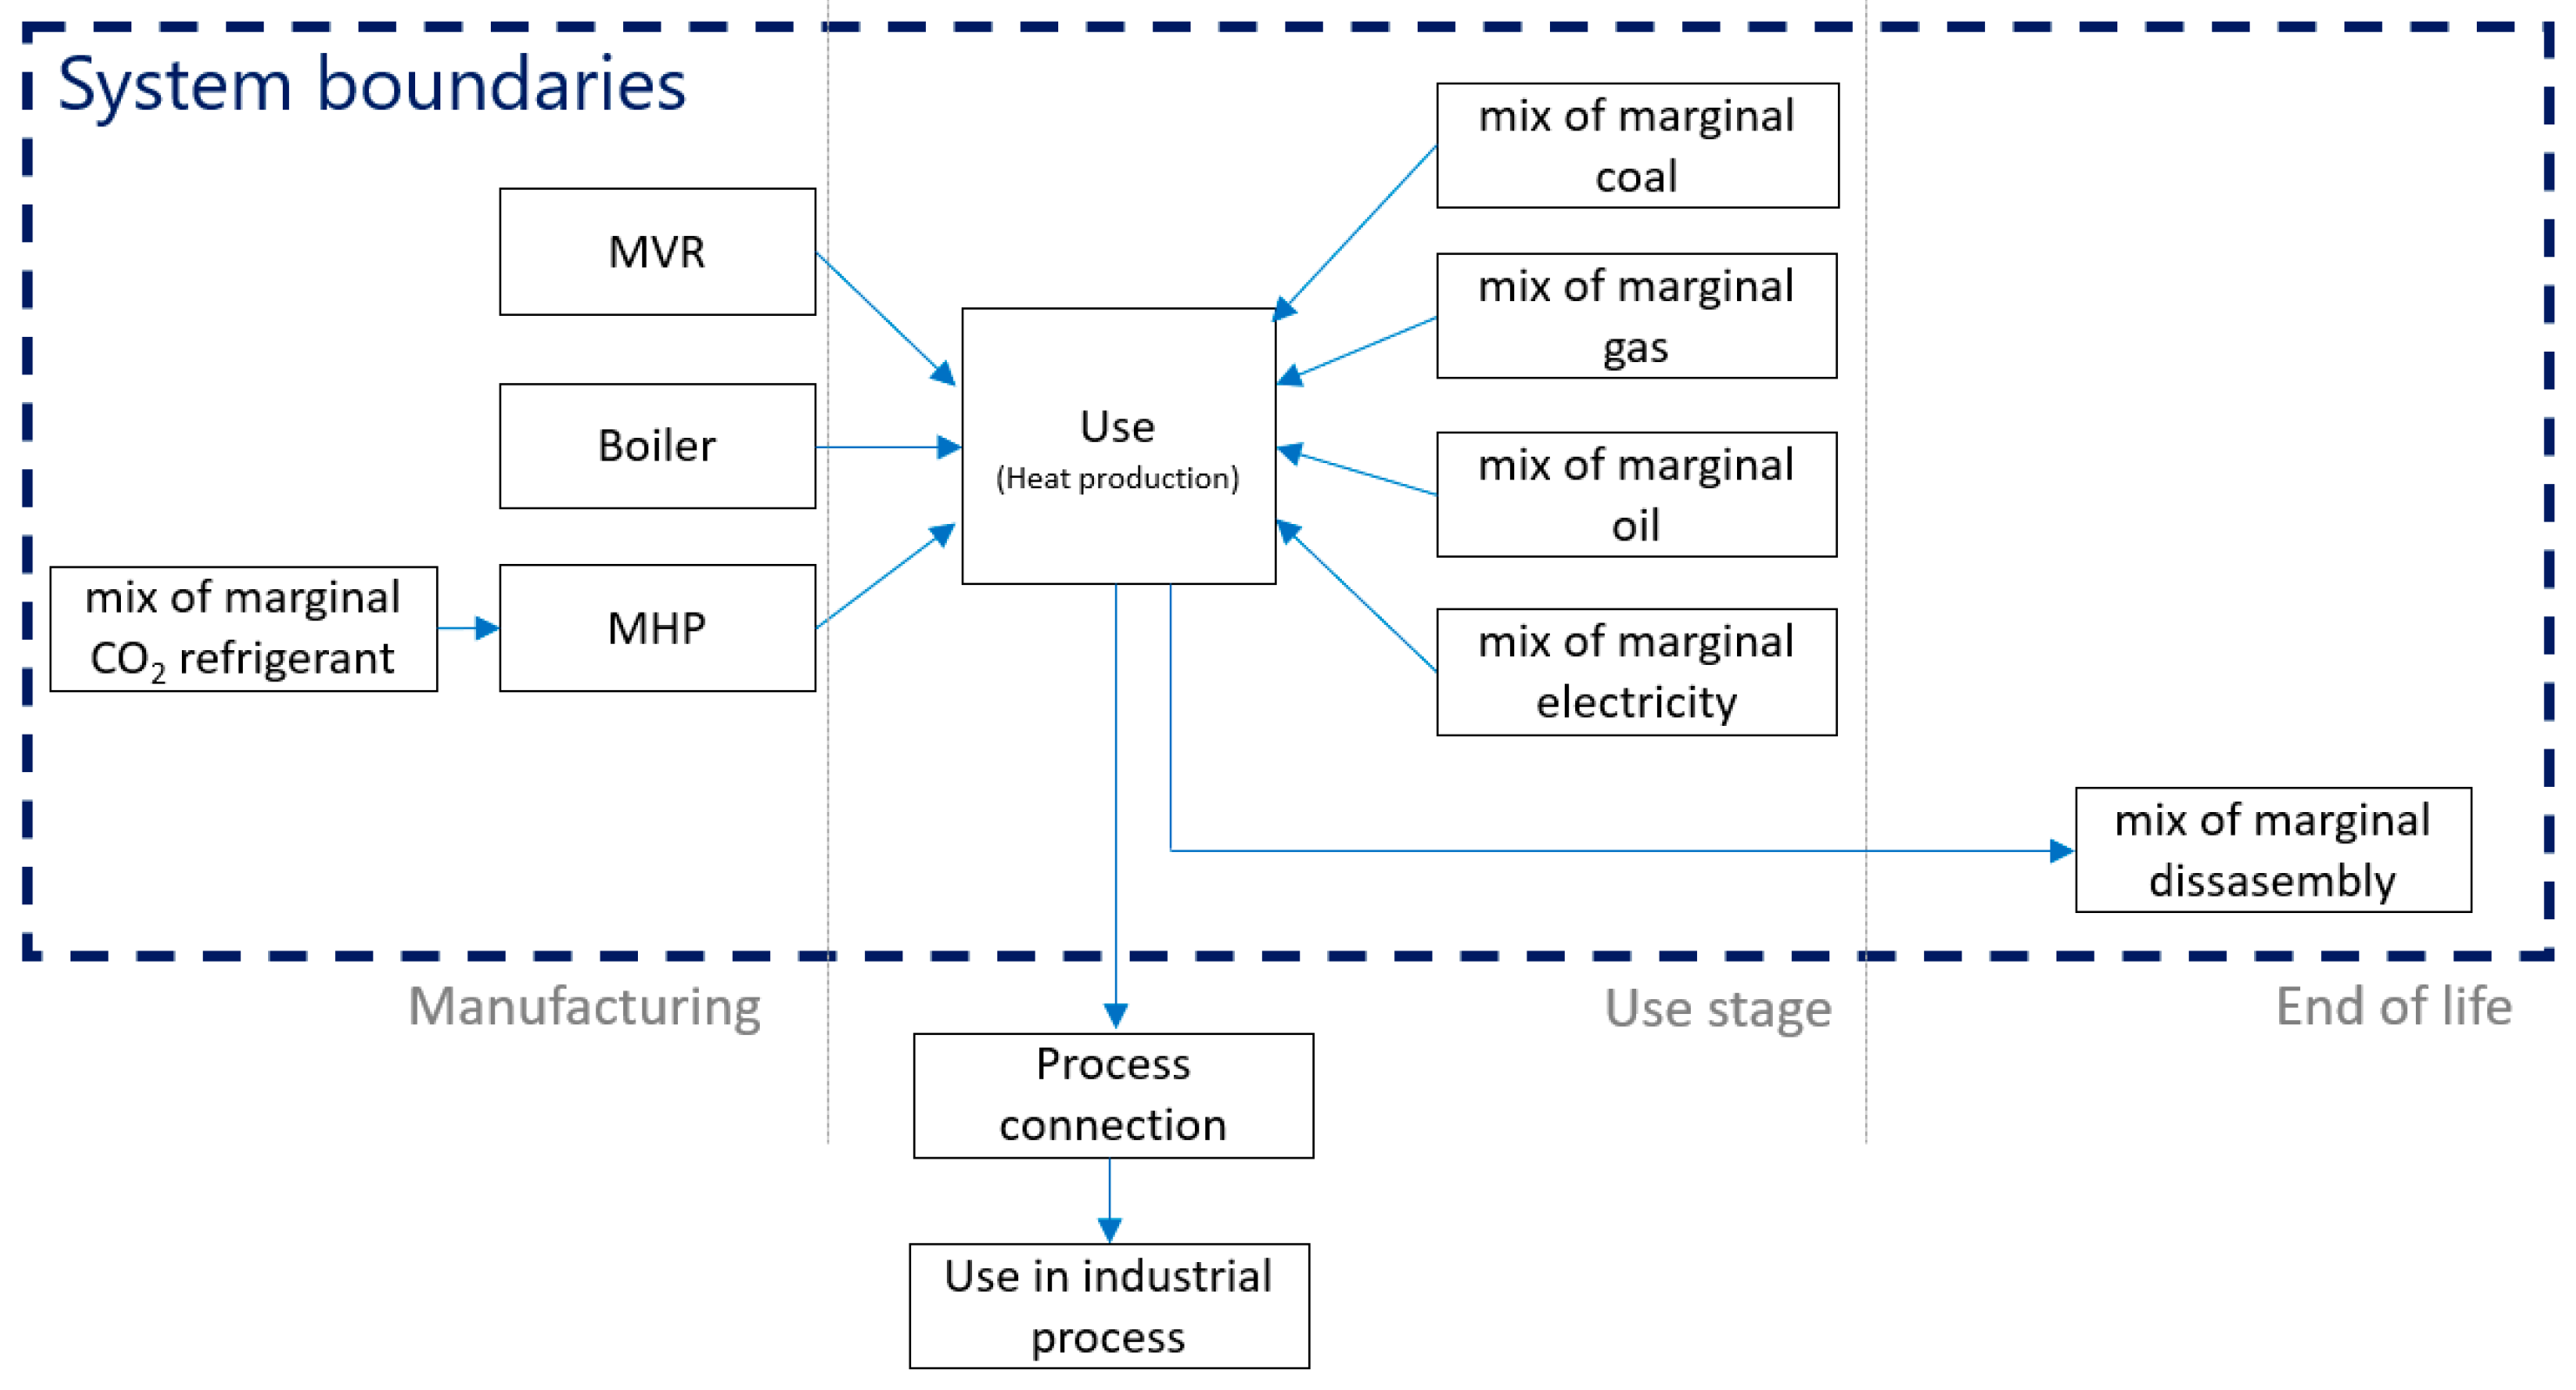
Life Cycle Inventory Analysis. This study considers consequential modeling as the aim is to evaluate the change induced by the system transformation. The environmental data are from the Ecoinvent database v3.7.1 [30]. Consequential modeling is defined by Hauschild et al. [29] as the “aim to describe the changes to the economy caused by the introduction of the studied product system”. There are no multifunctional processes in the life cycle inventory (LCI) modeling framework. The system boundary is presented in Figure A1, with the detail of every considered and excluded process from the LCA. The two main processes not considered in the study are (i) the connection with the process due to the high level of specificity and minor environmental impact compared to the process itself and its energy consumption, and (ii) the process requirements in material, chemical, and consumable sectors. It is possible to adapt the method to integrate a process as a whole, i.e., not only the energy part, but this would require a level of information on the process that is difficult to obtain in order to subsequently determine the level of impact that can be considered sustainable. The last element not considered in this study is the benefit from the gas avoided by the new system compared to the current one (which is mainly fossil-based). This choice was made in order to assess the level of impact from a technical solution compared to an acceptable level of impact, and not to compare the benefit of the change with the proposed solution compared to the current energy system.
Figure A1. Flow diagram. The blue line indicates the system boundaries; all processes outside of the line are not considered in this study. The grey box represents the avoided energy consumption due to the change in the heat production system.
Energies 17 02602 g0a1
Geographical, temporal, and technological scopes. The scenario is constructed using the currently available LCA data, which are corrected using the available energy scenarios (Figure A2). One of the assumptions is that the development of new electricity generation is sufficiently constant to assume that the distribution of new generation remains valid for a current evaluation. Finally, regarding the technological choice, the technologies considered in this study are those with a high level of maturity, with a TRL of 8 or 9. This study therefore does not consider any disruptive technology or any potential improvements in efficiency.
Figure A2. Modeling of heat production with future trends; figure adapted from Anderson et al. work [50].
Energies 17 02602 g0a2
Life Cycle Impact Assessment. Selection of impact categories, classification, and characterization are conducted using the EF 3.0 methodology developed with the Joint Research Center from the European commission [40] for the environmental analyses, and the methods named cumulative energy demand (CED) and cumulative exergy demand (CExD). The impact categories used with their description are presented in Table A1.
Table A1. Environmental and energy impact categories with descriptions from SIMAPRO software (v9).
SourceImpact CategoryUnitsDescription
EF 3.0Climate changekg CO2 eqRadiative forcing as Global Warming Potential GWP100 Baseline model of the IPCC 2013 with some factors adapted from EF guidance.
Ozone depletionkg CFC11 eqOzone Depletion Potential calculating the destructive effects on the stratospheric ozone layer over a time horizon of 100 years.
Ionising radiationkBq U-235 eqIonizing Radiation Potentials: Quantification of the impact of ionizing radiation on the population, in comparison to Uranium 235.
Photochemical ozone formationkg NMVOC eqExpression of the potential contribution to photochemical ozone formation.
Particulate matterdisease incidenceDisease incidence due to kg of PM2.5 emitted.
The indicator is calculated applying the average slope between the Emission Response Function (ERF) working point and the theoretical minimum-risk level. Exposure model based on archetypes that include urban environments, rural environments, and indoor environments within urban and rural areas.
Human toxicity, non-cancerCTUhComparative Toxic Unit for humans. Using USEtox consensus multimedia model. It spans two spatial scales: continental scale consisting of six compartments (urban air, rural air, agricultural soil, natural soil, freshwater and costal marine water), and the global scale with the same structure but without the urban air.
Human toxicity, cancerCTUh
Acidificationmol H+ eqAccumulated Exceedance characterising the change in critical load exceedance of the sensitive area in terrestrial and main freshwater ecosystems, to which acidifying substances deposit.
Eutrophication, freshwaterkg P eq
Eutrophication, marinekg N eqNitrogen equivalents: Expression of the degree to which the emitted nutrients reach the marine end compartment (nitrogen considered as limiting factor in marine water).
Eutrophication, terrestrialmol N eqAccumulated Exceedance characterising the change in critical load exceedance of the sensitive area, to which eutrophying substances deposit.
Ecotoxicity, freshwaterCTUeComparative Toxic Unit for ecosystems. Using USEtox consensus multimedia model. It spans two spatial scales: continental scale consisting of six compartments (urban air, rural air, agricultural soil, natural soil, freshwater and costal marine water), and the global scale with the same structure but without the urban air.
Land usePtSoil quality index.
Calculated by JRC starting from LANCA® v 2.2 as baseline model.
Water usem3 deprivationUser deprivation potential (deprivation-weighted water consumption)
Relative Available WAter REmaining (AWARE) per area in a watershed, after the demand of humans and aquatic ecosystems has been met. Blue water consumption only is considered, where consumption is defined as the difference between withdrawal and release of blue water. Green water, fossil water, sea water, and rainwater are not to be characterised with this methodology.
Resource use, fossilsMJAbiotic resource depletion fossil fuels; based on lower heating value ADP for energy carriers, based on van Oers et al., 2002 as implemented in CML, v. 4.8 (2016).
Resource use, minerals and metalskg Sb eqAbiotic resource depletion (ADP ultimate reserve) ADP for mineral and metal resources, based on van Oers et al., 2002 as implemented in CML, v. 4.8 (2016).
EcoinventCumulative energy demandMJMethod to calculate Cumulative Energy Demand (CED), based on the method published by Ecoinvent version 2.0 and expanded by PRé Consultants for raw materials available in the SimaPro 7 database. The method is based on higher heating values (HHVs).
Cumulative exergy demandMJIn this method exergy is used as a measure of the potential loss of “useful” energy resources.
In this work, we do not use the optional normalization developed by the EF 3.0 method to compare the impact with the current impact level, but we propose comparing the level of impact with the sustainable level defined in Section 2.4.

References

  1. European Commission. Masterplan for a Competitive Transformation of EU Energy-Intensive Industries Enabling a Climate-Neutral, Circular Economy by 2050. In Directorate-General for Internal Market, Industry, Entrepreneurship and SMEs; EU Publications: Luxembourg, 2019. [Google Scholar] [CrossRef]
  2. Obrist, M.D.; Kannan, R.; Schmidt, T.J.; Kober, T. Long-Term Energy Efficiency and Decarbonization Trajectories for the Swiss Pulp and Paper Industry. Sustain. Energy Technol. Assess. 2022, 52, 101937. [Google Scholar] [CrossRef]
  3. Bogdanov, D.; Gulagi, A.; Fasihi, M.; Breyer, C. Full Energy Sector Transition towards 100% Renewable Energy Supply: Integrating Power, Heat, Transport and Industry Sectors Including Desalination. Appl. Energy 2021, 283, 116273. [Google Scholar] [CrossRef]
  4. Directorate-General for Energy (European Commission); DTU; Trinomics; Öko-Institut e. V; Gerard, F.; Smit, T.; Rademaekers, K.; Braungardt, S.; Monejar Montagud, M.E.; Guevara Opinska, L. Policy Support for Heating and Cooling Decarbonisation: Roadmap; Publications Office of the European Union: Luxembourg, 2022; ISBN 978-92-76-52342-0. [Google Scholar]
  5. Aughinish Alumina Ltd. AAL SEB: Using Flexible Electrical Demand to Facilitate Higher Levels of Renewable Energy. Available online: https://climate.ec.europa.eu/document/download/02c679ea-43c7-4c9b-85f0-537e243ece6b_en?filename=if_pf_2021_aal_seb_en.pdf (accessed on 22 May 2024).
  6. Jibran, S.; Zuberi, M.; Hasanbeigi, A.; Morrow, W. Bottom-up Assessment of Industrial Heat Pump Applications in U.S. Food Manufacturing. Energy Convers. Manag. 2022, 272, 116349. [Google Scholar] [CrossRef]
  7. Jovet, Y.; Lefèvre, F.; Laurent, A.; Clausse, M. Combined Energetic, Economic and Climate Change Assessment of Heat Pumps for Industrial Waste Heat Recovery. Appl. Energy 2022, 313, 118854. [Google Scholar] [CrossRef]
  8. Schoeneberger, C.; Zhang, J.; McMillan, C.; Dunn, J.B.; Masanet, E. Electrification Potential of U.S. Industrial Boilers and Assessment of the GHG Emissions Impact. Adv. Appl. Energy 2022, 5, 100089. [Google Scholar] [CrossRef]
  9. Furszyfer Del Rio, D.D.; Sovacool, B.K.; Foley, A.M.; Griffiths, S.; Bazilian, M.; Kim, J.; Rooney, D. Decarbonizing the Glass Industry: A Critical and Systematic Review of Developments, Sociotechnical Systems and Policy Options. Renew. Sustain. Energy Rev. 2022, 155, 111885. [Google Scholar] [CrossRef]
  10. Furszyfer Del Rio, D.D.; Sovacool, B.K.; Foley, A.M.; Griffiths, S.; Bazilian, M.; Kim, J.; Rooney, D. Decarbonizing the Ceramics Industry: A Systematic and Critical Review of Policy Options, Developments and Sociotechnical Systems. Renew. Sustain. Energy Rev. 2022, 157, 112081. [Google Scholar] [CrossRef]
  11. Laurent, A.; Olsen, S.I.; Hauschild, M.Z. Limitations of Carbon Footprint as Indicator of Environmental Sustainability. Environ. Sci. Technol. 2012, 46, 4100–4108. [Google Scholar] [CrossRef]
  12. Laurent, A.; Owsianiak, M. Potentials and Limitations of Footprints for Gauging Environmental Sustainability. Curr. Opin. Environ. Sustain. 2017, 25, 20–27. [Google Scholar] [CrossRef]
  13. Jovet, Y.; Lefevre, F.; Laurent, A.; Clausse, M. Assessing the Relevance of Energy Indicators as Sustainability Screening Metrics for the Decarbonisation of Industrial Heat through Electrification. Energy 2024, 292, 130440. [Google Scholar] [CrossRef]
  14. Terlouw, T.; Gabrielli, P.; AlSkaif, T.; Bauer, C.; McKenna, R.; Mazzotti, M. Optimal Economic and Environmental Design of Multi-Energy Systems. Appl. Energy 2023, 347, 121374. [Google Scholar] [CrossRef]
  15. Urbano, D.G.; Aquino, A.; Scrucca, F. Energy Performance, Environmental Impacts and Costs of a Drying System: Life Cycle Analysis of Conventional and Heat Recovery Scenarios. Energies 2023, 16, 1523. [Google Scholar] [CrossRef]
  16. Marttila, M.P.; Uusitalo, V.; Linnanen, L.; Mikkilä, M.H. Agro-Industrial Symbiosis and Alternative Heating Systems for Decreasing the Global Warming Potential of Greenhouse Production. Sustainability 2021, 13, 9040. [Google Scholar] [CrossRef]
  17. Calero, M.; Clemente, G.; Fartdinov, D.; Bañón, S.; Muñoz, I.; Sanjuán, N. Upscaling via a Prospective LCA: A Case Study on Tomato Homogenate Using a Near-to-Market Pasteurisation Technology. Sustainability 2022, 14, 1716. [Google Scholar] [CrossRef]
  18. Fagerström, A.; Abdelaziz, O.; Poulikidou, S.; Lewrén, A.; Hulteberg, C.; Wallberg, O.; Rydberg, T. Economic and Environmental Potential of Large-Scale Renewable Synthetic Jet Fuel Production through Integration into a Biomass CHP Plant in Sweden. Energies 2022, 15, 1114. [Google Scholar] [CrossRef]
  19. Volkart, K.; Weidmann, N.; Bauer, C.; Hirschberg, S. Multi-Criteria Decision Analysis of Energy System Transformation Pathways: A Case Study for Switzerland. Energy Policy 2017, 106, 155–168. [Google Scholar] [CrossRef]
  20. Rockström, J.; Steffen, W.; Noone, K.; Persson, Å.; Chapin, F.S.I.; Lambin, E.; Lenton, T.M.; Scheffer, M.; Folke, C.; Schellnhuber, H.J.; et al. Planetary Boundaries: Exploring the Safe Operating Space for Humanity. Ecol. Soc. 2009, 14, 32. [Google Scholar] [CrossRef]
  21. Rubio Rodríguez, M.A.; Feitó Cespón, M.; De Ruyck, J.; Ocaña Guevara, V.S.; Verma, V.K. Life Cycle Modeling of Energy Matrix Scenarios, Belgian Power and Partial Heat Mixes as Case Study. Appl. Energy 2013, 107, 329–337. [Google Scholar] [CrossRef]
  22. Vargas-Gonzalez, M.; Witte, F.; Martz, P.; Gilbert, L.; Humbert, S.; Jolliet, O.; van Zelm, R.; L’Haridon, J. Operational Life Cycle Impact Assessment Weighting Factors Based on Planetary Boundaries: Applied to Cosmetic Products. Ecol. Indic. 2019, 107, 105498. [Google Scholar] [CrossRef]
  23. Sala, S.; Crenna, E.; Secchi, M.; Sanyé-Mengual, E. Environmental Sustainability of European Production and Consumption Assessed against Planetary Boundaries. J. Environ. Manag. 2020, 269, 110686. [Google Scholar] [CrossRef]
  24. Ryberg, M.W.; Andersen, M.M.; Owsianiak, M.; Hauschild, M.Z. Downscaling the Planetary Boundaries in Absolute Environmental Sustainability Assessments—A Review. J. Clean. Prod. 2020, 276, 123287. [Google Scholar] [CrossRef]
  25. Bjørn, A.; Chandrakumar, C.; Boulay, A.-M.; Doka, G.; Fang, K.; Gondran, N.; Hauschild, M.Z.; Kerkhof, A.; King, H.; Margni, M.; et al. Review of Life-Cycle Based Methods for Absolute Environmental Sustainability Assessment and Their Applications. Environ. Res. Lett. 2020, 15, 083001. [Google Scholar] [CrossRef]
  26. Hjalsted, A.W.; Laurent, A.; Andersen, M.M.; Olsen, K.H.; Ryberg, M.; Hauschild, M. Sharing the Safe Operating Space: Exploring Ethical Allocation Principles to Operationalize the Planetary Boundaries and Assess Absolute Sustainability at Individual and Industrial Sector Levels. J. Ind. Ecol. 2021, 25, 6–19. [Google Scholar] [CrossRef]
  27. Elmegaard, B.; Arjomand Kermani, N.; Bühler, F.; Nguyen, T.-V.; Bergamini, R.; Zühlsdorf, B.; Dupond Holdt, F. Electrification of Processes and Technologies for Danish Industry: Elforsk Project 350-038: Final Report; Technical University of Denmark: Lyngby, Denmark, 2021; p. 349. [Google Scholar]
  28. Bühler, F. Energy Efficiency in the Industry: A Study of the Methods, Potentials and Interactions with the Energy System, DTU Mechanical Engineering; DCAMM: Lyngby, Denmark, 2018. [Google Scholar]
  29. Hauschild, M.Z.; Rosenbaum, R.K.; Olsen, S.I. (Eds.) Life Cycle Assessment; Springer International Publishing: Cham, Switzerland, 2018; ISBN 978-3-319-56474-6. [Google Scholar]
  30. Wernet, G.; Bauer, C.; Steubing, B.; Reinhard, J.; Moreno-Ruiz, E.; Weidema, B. The Ecoinvent Database Version 3 (Part I): Overview and Methodology. Int. J. Life Cycle Assess. 2016, 21, 1218–1230. [Google Scholar] [CrossRef]
  31. Bühler, F.; Müller Holm, F.; Elmegaard, B. Potentials for the Electrification of Industrial Processes in Denmark: 32nd International Conference on Efficiency, Cost, Optimization, Simulation and Environmental Impact of Energy Systems. In Proceedings of the ECOS 2019: 32nd International Conference on Efficiency, Cost, Optimization, Simulation and Environmental Impact of Energy Systems, Wroclaw, Poland, 23–28 June 2019. [Google Scholar]
  32. AGRESTE. Consommation d’énergie Dans Les Industries Agroalimentaires et Les Scieries En 2019; Ministère de l’agriculture et de l’alimentation: Paris, France, 2021. [Google Scholar]
  33. RTE Futurs Énergétiques 2050: Les Scénarios de Mix de Production à l’étude Permettant d’atteindre La Neutralité Carbone à l’horizon 2050-Chap. 11 2021. Available online: https://www.rte-france.com/analyses-tendances-et-prospectives/bilan-previsionnel-2050-futurs-energetiques (accessed on 23 May 2024).
  34. RTE Futurs Énergétiques 2050: Les Scénarios de Mix de Production à l’étude Permettant d’atteindre La Neutralité Carbone à l’horizon 2050-Chap. 5 2021. Available online: https://www.rte-france.com/analyses-tendances-et-prospectives/bilan-previsionnel-2050-futurs-energetiques (accessed on 23 May 2024).
  35. Hesse, H.; Schimpe, M.; Kucevic, D.; Jossen, A. Lithium-Ion Battery Storage for the Grid—A Review of Stationary Battery Storage System Design Tailored for Applications in Modern Power Grids. Energies 2017, 10, 2107. [Google Scholar] [CrossRef]
  36. Suryatna, A.; Raya, I.; Thangavelu, L.; Alhachami, F.R.; Kadhim, M.M.; Altimari, U.S.; Mahmoud, Z.H.; Mustafa, Y.F.; Kianfar, E. A Review of High-Energy Density Lithium-Air Battery Technology: Investigating the Effect of Oxides and Nanocatalysts. J. Chem. 2022, 2022, 2762647. [Google Scholar] [CrossRef]
  37. Asian Development Bank Handbook on Battery Energy Storage System; Asian Development Bank: Manila, Philippines, 2018.
  38. ISO 14040:2006; Environmental Management—Life Cycle Assessment—Principles and Framework. ISO: Geneva, Switzerland, 2006.
  39. ISO 14044:2006; Environmental Management—Life Cycle Assessment—Requirements and Guidelines. ISO: Geneva, Switzerland, 2006.
  40. European Commission; Joint Research Centre. Supporting Information to the Characterisation Factors of Recommended EF Life Cycle Impact Assessment Methods: New Methods and Differences with ILCD; Publications Office: Luxembourg, 2018. [Google Scholar]
  41. IPCC/TEAP; Metz, B.; Kuijpers, L.; Solomon, S.; Andersen, S.O.; Davidson, O.; Pons, J.; de Jager, D.; Kestin, T.; Manning, M.; et al. (Eds.) Safeguarding the Ozone Layer and the Global Climate System: Issues Related to Hydrofluorocarbons and Perfluorocarbons; Cambridge University Press: Cambridge, UK, 2005; p. 246. [Google Scholar]
  42. Yang, C.; Seo, S.; Takata, N.; Thu, K.; Miyazaki, T. The Life Cycle Climate Performance Evaluation of Low-GWP Refrigerants for Domestic Heat Pumps. Int. J. Refrig. 2021, 121, 33–42. [Google Scholar] [CrossRef]
  43. Willett, W.; Rockström, J.; Loken, B.; Springmann, M.; Lang, T.; Vermeulen, S.; Garnett, T.; Tilman, D.; DeClerck, F.; Wood, A.; et al. Food in the Anthropocene: The EAT–Lancet Commission on Healthy Diets from Sustainable Food Systems. Lancet 2019, 393, 447–492. [Google Scholar] [CrossRef]
  44. Riahi, K.; Bertram, C.; Huppmann, D.; Rogelj, J.; Bosetti, V.; Cabardos, A.-M.; Deppermann, A.; Drouet, L.; Frank, S.; Fricko, O.; et al. Cost and Attainability of Meeting Stringent Climate Targets without Overshoot. Nat. Clim. Chang. 2021, 11, 1063–1069. [Google Scholar] [CrossRef]
  45. Shukla, P.R.; Al Khourdajie, A.; van Diemen, R.; McCollum, D.; Pathak, M.; Some, S.; Vyas, P.; Fradera, R.; Belkacemi, M.; Hasija, A.; et al. (Eds.) AR6 Climate Change 2022: Mitigation of Climate Change—IPCC; IPCC: Geneva, Switzerland, 2022. [Google Scholar]
  46. Statistics Denmark Production and Generation of Income (117-Grouping) by Transaction, Industry and Price Unit 2019. Available online: https://m.statbank.dk/TableInfo/NABP117 (accessed on 23 May 2024).
  47. E World Bank Gross Value Added at Basic Prices (GVA). Available online: https://databank.worldbank.org/metadataglossary/world-development-indicators/series/NY.GDP.FCST.CN#:~:text=Gross%20value%20added%20at%20basic%20prices%20(formerly%20GDP%20at%20factor,net%20product%20taxes%20from%20GDP (accessed on 23 May 2024).
  48. Rockström, J.; Gupta, J.; Qin, D.; Lade, S.J.; Abrams, J.F.; Andersen, L.S.; Armstrong McKay, D.I.; Bai, X.; Bala, G.; Bunn, S.E.; et al. Safe and Just Earth System Boundaries. Nature 2023, 619, 102–111. [Google Scholar] [CrossRef]
  49. Gailani, A.; Cooper, S.; Allen, S.; Pimm, A.; Taylor, P.; Gross, R. Assessing the Potential of Decarbonization Options for Industrial Sectors. Joule 2024, 8, 576–603. [Google Scholar] [CrossRef]
  50. Andersen, P.D.; Borup, M.; Krogh, T. Managing Long-Term Environmental Aspects of Wind Turbines: A Prospective Case Study. IJTPM 2007, 7, 339. [Google Scholar] [CrossRef]
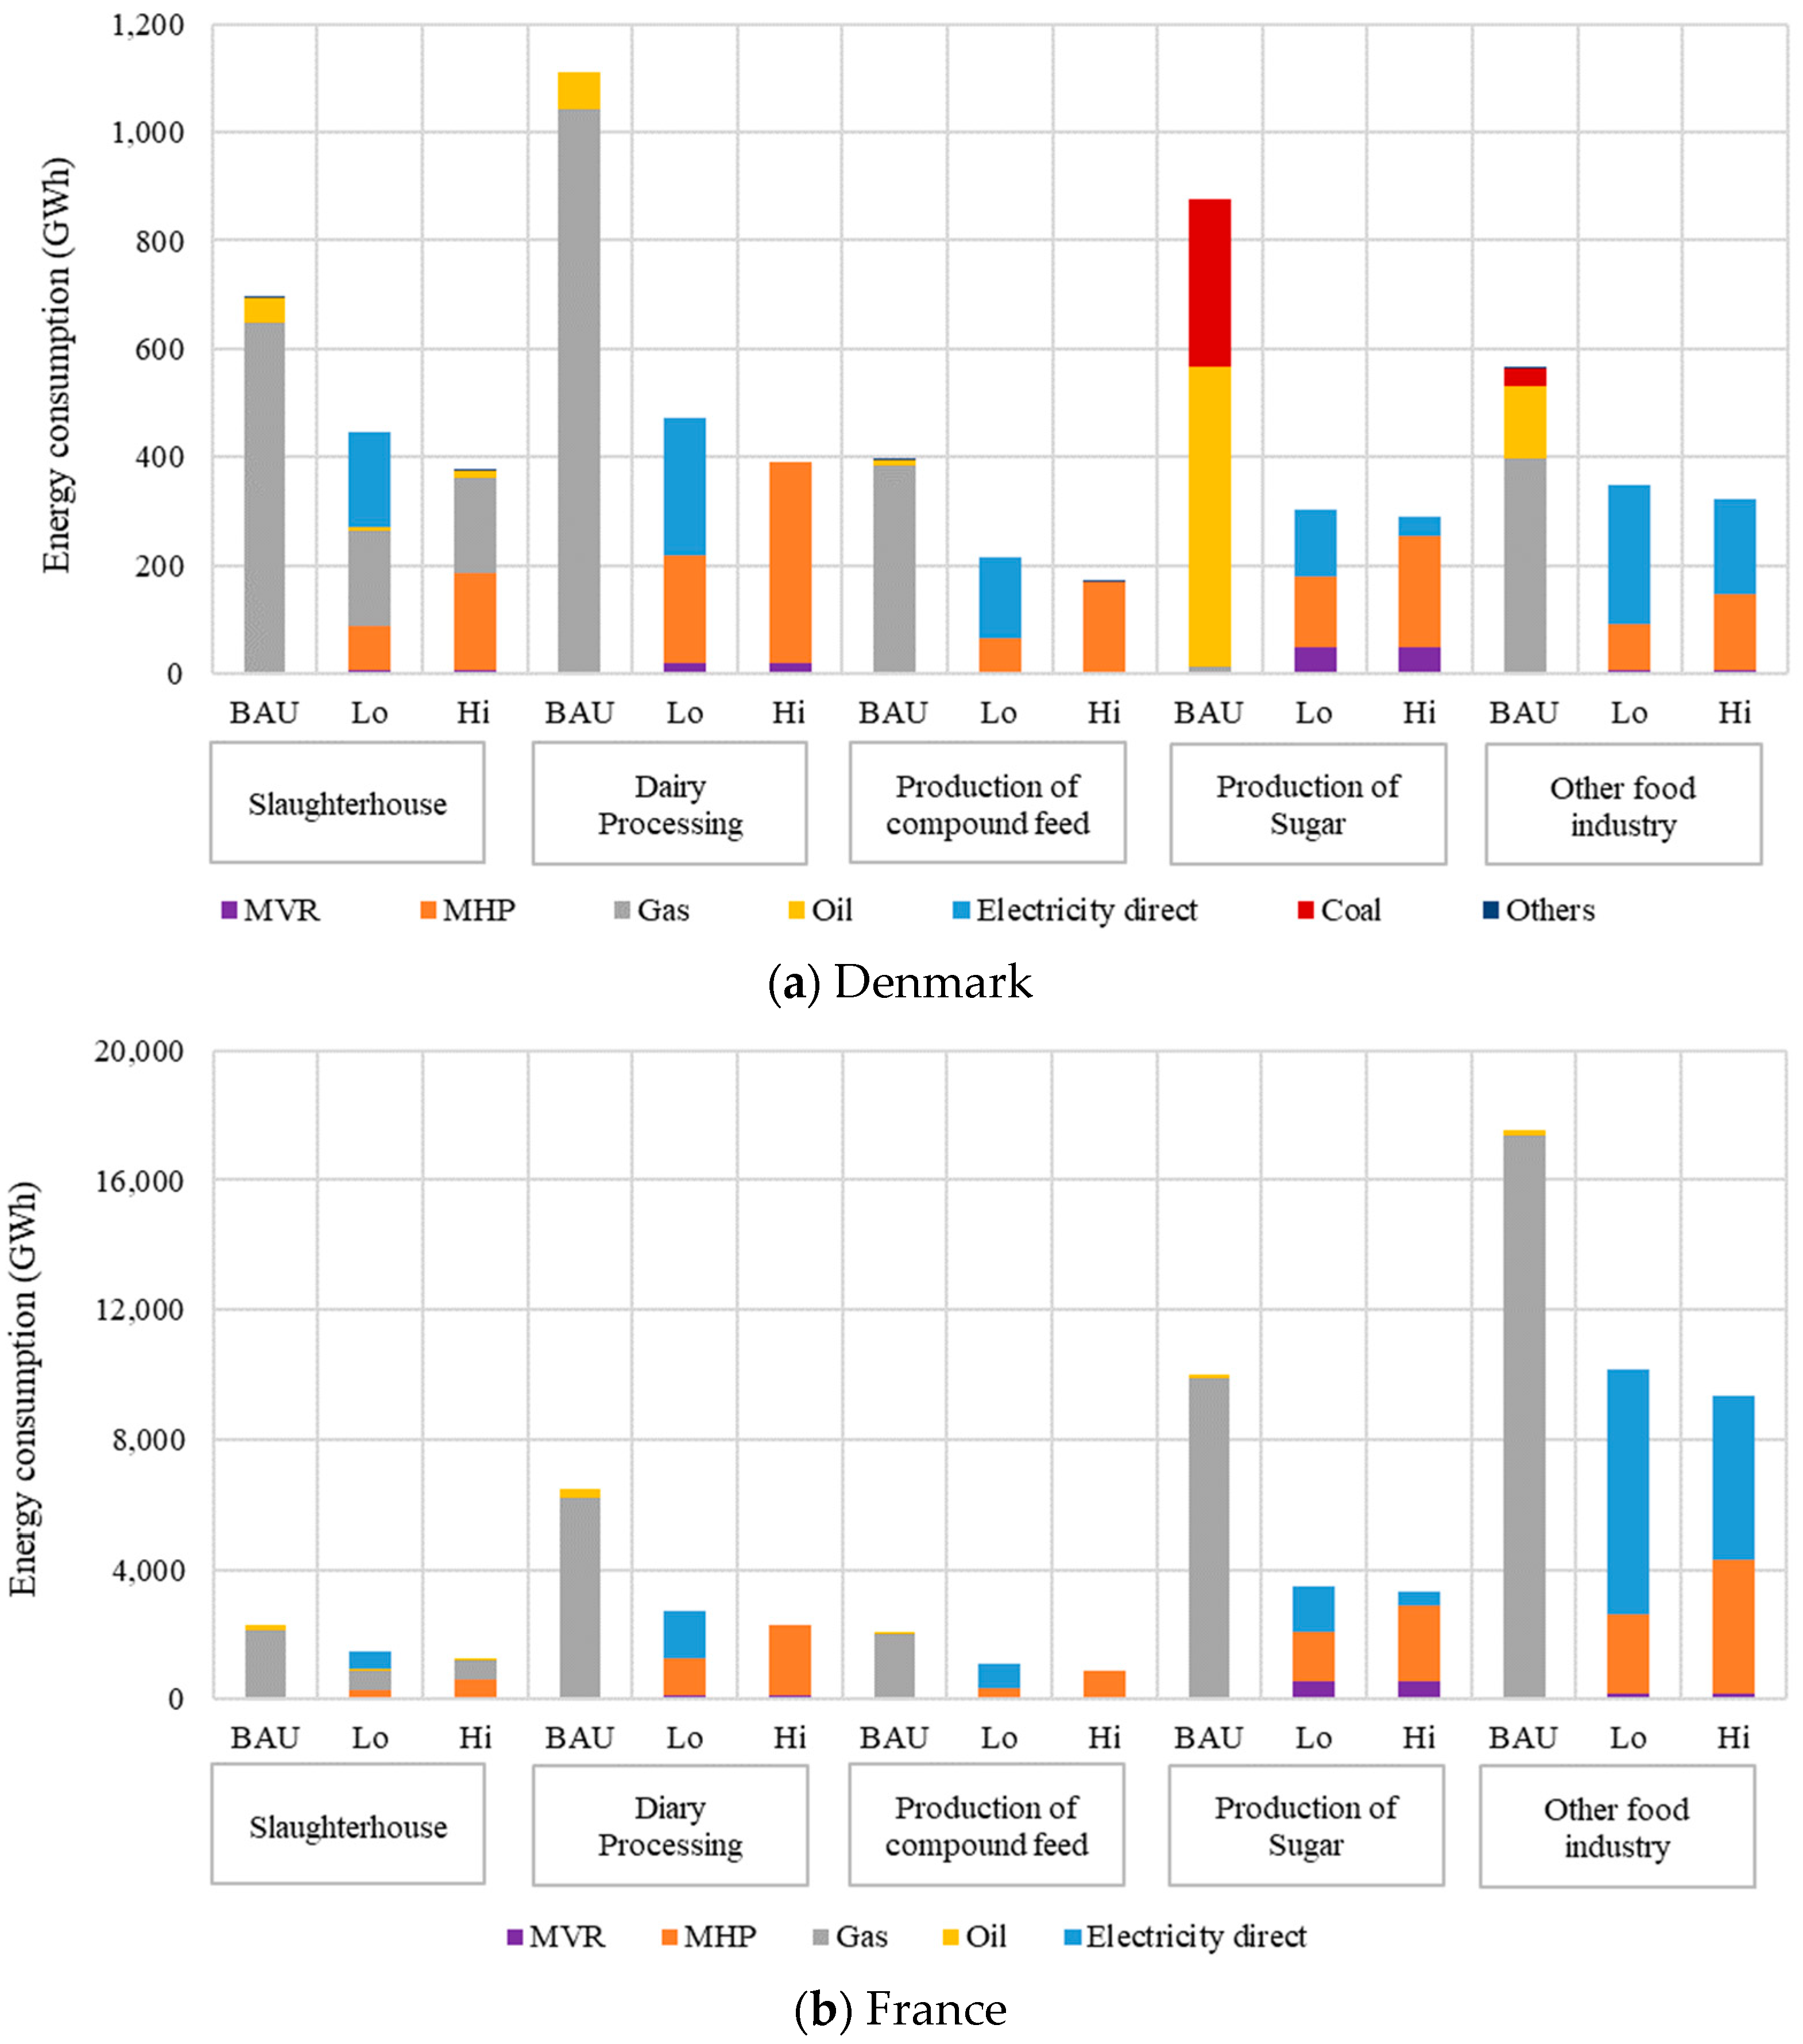
Figure 1. Food industry energy consumption by sub-sector and by energy source in 2015 for (a) Denmark and (b) France.
Energies 17 02602 g001
Figure 2. Results of the different impact categories for the “other food industry” sector in France and Denmark, using logarithmic scale. SL* is the sustainable level normalized by the total impact Itot. SL* based on current emissions is represented by a green line for each impact category and the EVA-based approach SL* is represented by light blue lines. For climate change, the solid lines represent the average target for 2040–2065 and the dotted lines represent the average target for 2065–2090. The arrows represent the consequence of electrification for the Lo and Hi scenarios.
Energies 17 02602 g002aEnergies 17 02602 g002b
Figure 3. EVA-based sustainability ratio versus contribution level for the 16 environmental indicators studied for the scenarios: (a) BAU–France, (b) BAU–Denmark, (c) Lo–France, (d) Lo–Denmark.
Energies 17 02602 g003
Figure 4. Impact categories’ evolution (symbolized with arrows) after electrification between BAU (blue dot) and Lo (orange dot) for France: (a) improving impact categories and (b) deteriorating impact categories.
Energies 17 02602 g004
Table 1. Share of energy losses within the system ε by fuel and temperature level, from [28].
Range [°C]Direct Electrical Heating [%]Other Fuel Efficiency (Gas, Oil or Coal) [%]
≤12000
120–3801015
≥3802530
Table 2. New electricity installed capacity by 2050; repartition for Denmark based on data from the Ecoinvent database and for France based on scenario N1 from French TSO.
DenmarkFrance
Wind power61%76%
Bio-energy39%0%
Hydro power0%1%
Nuclear0%23%
Others<1%<1%
Table 3. Battery data used in the modeling with (a) controllable rate scenarios and (b) electricity storage assumptions for batteries in France with the regression used to estimate the battery power needed to regulate the grid from five electricity mix scenarios [34].
(a)Controllable rateBattery requirement (BR) (kgbat/GWhgrid)
French electricity23%668.8
Danish electricity39%368.8
(b)Battery power capacity (GW)Battery power to electricity consumption ratio (GWbat/GWhgrid)Controllable electricity rate
Sc. N0311.5 × 10−662%
Sc. N223.0 × 10−642%
Sc. N191.3 × 10−538%
Sc. M1213.0 × 10−524%
Sc. M0263.6 × 10−511%
Table 4. Reduction factors used for the 16 impact categories from EF 3.0.
Impact CategoryReduction FactorSource
Climate change (budgeting 2015–2040)1.23[44]
Climate change (budgeting 2040–2065)2.22[44]
Climate change (budgeting 2065–2090)16.08[44]
Ozone depletion0.28[22]
Ionizing radiation0.01[22]
Photochemical ozone formation0.54[22]
Particulate matter5.97[22]
Human toxicity, non-cancer0.9[22]
Human toxicity, cancer0.26[22]
Acidification0.3[22]
Eutrophication, freshwater3.22[22]
Eutrophication, marine8.2[43]
Eutrophication, terrestrial0.3[22]
Ecotoxicity, freshwater0.85[22]
Land use9.33[22]
Water use0.51[22]
Resource use, fossils4.08[22]
Resource use, minerals and metals4.08[22]
Disclaimer/Publisher’s Note: The statements, opinions and data contained in all publications are solely those of the individual author(s) and contributor(s) and not of MDPI and/or the editor(s). MDPI and/or the editor(s) disclaim responsibility for any injury to people or property resulting from any ideas, methods, instructions or products referred to in the content.