Abstract
Due to its low calorific value, abnormal phenomena such as incomplete combustion and flameout may occur during the combustion process of biomass syngas. The applicability of adding hydrogen can assist in the combustion of biomass syngas in boilers to overcome the above defects, and the effects need to be investigated. In this study, a multi-mechanism model is employed to numerically simulate the flow and combustion of a horizontal boiler burning biomass syngas. The reliability verification of the model is conducted by comparing it with the experimental results of combustion in a domestic boiler with biomass syngas. From the views of multi-fields and synergy, the effects of hydrogen addition on the thermal performance and emissions of biomass syngas are further expounded. Two scenarios are taken into consideration: hydrogen addition at a constant fuel volume flow rate and constant heat input. The result indicates that hydrogen addition significantly affects the multi-field synergy, which is advantageous for improving the heat transfer performance and combustion efficiency of biomass syngas. However, when the hydrogen addition ratio exceeds 20% at a constant fuel volume flow rate and 25% at constant heat input, its impact may be reduced. When the hydrogen content increases, the outlet temperature of the combustion chamber decreases, and pollutant emissions are effectively controlled. The turbulent kinetic energy at the reversal section decreases, and the uniformity of the flow field improves. These results provide certain guidance for the efficient utilization of biomass syngas and the operation of boilers burning biomass syngas.
1. Introduction
Due to the global energy crisis and environmental pollution, developing clean alternative fuels is one of the effective means to address these issues. Biomass energy has good application prospects due to its clean, widely distributed, and renewable characteristics [1]. The United Nations Commission on Environment and Development (UNCED) stated in a research report that utilization of biomass energy will account for 50% of the world’s total energy consumption by 2050 [2].
The US Department of Energy (DOE) defines biomass as the organic matter present in all plants and animals [3]. The main types of biomass energy development and utilization are divided into direct combustion, thermochemical conversion, and biochemical conversion, involving gasification, liquefaction, carbonization, and pyrolysis, among which direct combustion and biomass gasification are the main methods used at present [4].
Direct combustion of biomass is prone to coking, and high-temperature alkali metal elements are easily generated during the combustion process, which can corrode the combustion equipment [5]. Biomass gasification is a technology that produces small molecule combustible gases by reacting solid biomass with gasification agents. Biomass syngas is used as fuel in thermal machinery such as boilers, engines, and gas turbines [6,7]. Biomass syngas has certain differences in composition due to its different preparation methods and raw materials [8]. The non-hydrocarbon gas content of biomass syngas is high, resulting in low volume calorific value, poor flame stability, and abnormal combustion phenomena such as incomplete combustion and misfire in the combustion process. How to improve the stability of biomass syngas combustion and reduce emissions is currently a research focus.
As a multi-component gas fuel, the reaction mechanism of biomass syngas combustion is extremely complex, and there is relatively little research on the numerical simulation of biomass syngas combustion. Zhang et al. [9] simulated biomass syngas combustion using four chemical reaction kinetics models and compared the simulation results with literature data and experimental results. The results showed a fair degree of consistency between the simulation results of FFCM-1 and GRI 3.0 and the experimental results. Wang et al. [10] simulated biomass syngas combustion using three chemical reaction mechanism models and compared the results with experimental results. The results showed that the GRI 3.0 reaction mechanism had the smallest deviation from experimental results under the conditions of lean and rich combustion. Liu et al. [11] simplified the GRI Mesh 3.0 mechanism to a 27-component, 54-reaction mechanism, analyzing the temperature sensitivity and key component concentration sensitivity in the 325 step reactions.
In order to solve the problems of poor combustion stability, easy flameout, and pollutant emission to a certain extent, some scholars have considered using different components of biomass syngas or mixing other gases with biomass syngas to study the impact on the combustion process. Khaleghi et al. [12] investigated the temperature, flame stability, and emissions of biogas vortex combustion under the condition of CO2 mole fraction volume percentage ranging from 0 to 40%. As the CO2 content of the biogas increased, the NOx generation rate monotonically decreased. Ilker et al. [13] conducted experiments to explore flame stability with a nitrogen dilution ratio ranging from 0% to 60%. The combustion stability reached the best state when N2 content reached 30%, and the stability decreased when it exceeded 30%. The dilution of N2 led to an increase in CO emission, and the NOx emission was the least when the N2 content was 20%. Hu et al. [14] experimented with the flame stability of biomass syngas in a combustion bomb with constant volume by changing the ratio of CO2 and H2. The flame stability decreased with the increase in CO2. Moreover, an increase in the hydrogen ratio led to an increase in both hydrodynamic instability and thermal mass diffusion instability and the appearance time of cellular flame was advanced. Mordaunt et al. [15] designed a combustion device to investigate the impact of increasing CO2 content on the combustion performance of biomass syngas. With the increase in CO2, lean oil flameout and combustion pressure oscillation were observed, which greatly limited the actual operation of gas turbines.
Hydrogen exhibits the lowest ignition energy and the highest heat generation per unit mass among all gaseous fuels. As a high calorific value fuel, hydrogen has become the primary choice as a blended fuel to solve the problems caused by the combustion of low calorific value fuel. In terms of combustion performance and emissions, Xie et al. [16] numerically simulated the impact of a hydrogen ratio varying from 0% to 100% on the combustion characteristics of laminar premixed methane in gas turbines. The results indicated that the combustion rate of laminar flames increased with the increase in hydrogen content, which increased the emission of NO and inhibited the generation of CO. Khare et al. [17] studied the impact of hydrogen concentration ranging from 0% to 20% by volume on the soot limits of methane/air laminar counterflow diffusion flames. The results indicated that the amount of hydrocarbons decreased as hydrogen concentration increased. Xu et al. [18] explored the impact of hydrogen addition on the combustion of n-decane/hydrogen/air mixtures. The results revealed a linear relationship between LBV and hydrogen addition ratio. The Markstein length decreased as the hydrogen addition ratio increased. Through chemical kinetic analysis, the molar fractions of H and OH led to a linear relationship between LBV and relative humidity. Antonio et al. [19] burned biomass syngas containing CH4, H2, and CO2 in a controlled auto-ignition engine to study the influence of different components of biomass syngas on NOx emission. An optimal biomass syngas composition was identified, allowing a reduction in NOx emission compared to traditional biomass syngas. Zhen et al. [20] conducted an experiment to study the impact of hydrogenation on the diffusion flame stability of biogas containing H2, CO2, and CH4. The results demonstrated that the 5% addition of hydrogen had an enhancing effect on combustion stability to a certain extent in this experiment. The effect of CO2 on flame instability exceeded that of N2. In terms of thermodynamic analysis, Liu et al. [21] studied the combustion of methane/hydrogen mixed fuel in engines. The H2 addition ratio increased from 0% to 70%, resulting in a decrease in thermal conductivity loss. The reactions with H2, H, and H2O as reactants were inhibited, decreasing the loss from chemical reaction. Zhao et al. [22] increased H2 substitution in a DME/H2/air flame mixture and found that the addition of H2 reduced the exergy losses from chemical reactions and heat conduction, increased the exergy losses from incomplete combustion, and overall reduced the exergy losses. In terms of energy requirement and cost, taking China as an example, the White Paper on China’s Hydrogen Energy and Fuel Cell Industry states that it is predicted that the total hydrogen demand in China will reach 30 million tons by 2025 and 35 million tons by 2030 [23]. Sun et al. [24] estimated that a 1 million kW gas power plant with 15% hydrogen addition combustion would require over 2000 vehicles (300 kg onboard) of hydrogen per year, with a transportation cost of CNY 9/kg.
As mentioned above, there are a lot of studies on hydrogen as a blended fuel, but most of them have used relatively single syngas components [25,26,27,28], and studies on biomass syngas combustion were mostly focused on combustion in engines [29,30,31] or constant volume combustion bombs [11,15], which are different from the structure of the boiler. Therefore, a multi-component mechanism model is employed to study the hydrogen addition of biomass syngas combustion. Multiple physical fields, turbulent kinetic energy (TKE), and field synergy are utilized to investigate and evaluate the effect of hydrogen addition on the thermal performance and emissions of biomass syngas, which has guiding significance for the efficient utilization of biomass syngas. Two hydrogen addition scenarios are used for a more comprehensive comparison. It provides guidance for the efficient utilization of biomass syngas and the design and operation of boilers.
In the following text, the structure of a practical horizontal boiler burning biomass syngas is first introduced, and the geometric and mathematical models are constructed and verified. Then, numerical calculation and result analysis are conducted under two hydrogen addition scenarios. Ultimately, three conclusions are listed.
2. Modeling and Solution
2.1. Geometric Model
The internal structure of a boiler burning biomass syngas involved in the study is shown in Figure 1. The front of the furnace is equipped with a combustor, which sends biomass syngas into the furnace for combustion. The high-temperature flue gas enters the reversal section from the main combustion section and is then discharged into the second return flue pipe. The flue gas and water exchange heat through the flue pipe and the wall of the combustion chamber. Then, the steam is generated. As shown in Figure 2, the research object is the first return journey of the boiler surrounded by the red line, which includes the inlet section, main combustion chamber, and reversal section. The biomass syngas wrapped by air enters the combustion chamber in a swirling, non-premixed way for combustion. The flue gas turns back from the reversal section to the outlet.
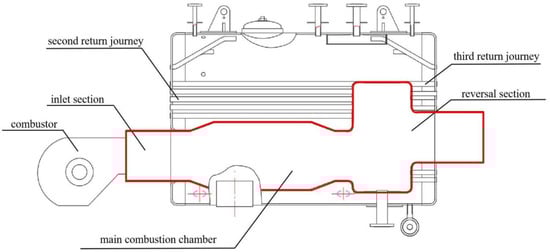
Figure 1.
Internal structure of the boiler.
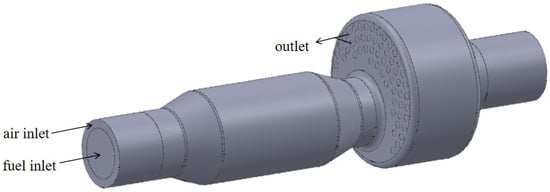
Figure 2.
Boiler combustion chamber.
To simplify the numerical calculation, facilitate the division of the calculation grid, and accelerate the convergence speed, the following assumptions are adopted in this study. (1) The study only focuses on the combustion characteristics of the boiler combustion chamber without considering the heat transfer characteristics of flue gas after entering the flue pipe. (2) A set of tangentially arranged blades is installed in the actual inlet section, which can cause the airflow to rotate. In order to simplify the calculation, the blade design is ignored in the model instead of considering the swirl effect caused by the blades in the boundary conditions.
2.2. Mathematic Models
2.2.1. Governing Equations
Whether in a mixed flow field with interaction or a flow field with multiple components, the conservation law must be followed. The governing equations involved in this study are as follows.
The mass conservation equation is as follows:
The momentum conservation equation is as follows:
The energy conservation equation is as follows:
The composition conservation equation is as follows:
2.2.2. Turbulence Model
The turbulence model used in the study is the Realizable k-ε model, which is an improved k-ε model. It works incredibly well in tackling issues such as uniform shear flow and separated flow of rotation [32].
Equation k in the Realizable k-ε model [33,34]:
Equation ε in the Realizable k-ε model:
2.2.3. Combustion Model
In this study, the GRI 3.0 chemical reaction mechanism model involving 53 components and 325 elementary reactions is employed to simulate the combustion of biomass syngas mixed with hydrogen. The key reaction formulas for biomass syngas combustion [11] are shown in Table 1. The simulation results of biomass syngas combustion using the GRI 3.0 mechanism model have less deviation from the experimental results, which are available in references [9,10].

Table 1.
The key chemical reactions based on the GRI 3.0 mechanism.
Considering the detailed chemical reaction mechanisms, the combustion model uses the Eddy Dissipation Concept (EDC) model. Magnussen et al. [35] developed the EDC model based on the Eddy Break Up model. Spalding et al. [36] proposed that this model can compensate for the shortcomings of Arrhenius’s law in predicting turbulent flames.
The concept of energy cascade is employed to analyze the mechanical energy in turbulence. The equations demonstrate that the energy dissipation rate is associated with the properties of fine structures [37].
The Reynolds number of the fine structure is defined and evaluated by the following formula. It can be seen that the fine structure is indeed in the dissipation range, because the Reynolds number is in order units.
The characteristic parameters of small-scale turbulent structures can be represented by turbulent characteristic parameters, and the characteristic length and characteristic time are defined as follows [35].
where = 0.135; = 0.5; = 2.1377; = 0.4082.
2.2.4. Radiation Model
The P-1 model is employed in this study, which utilizes curved coordinates to quickly process complex geometric models and takes into account material scattering and radiative heat transfer between gas and particles.
2.2.5. NOx Generation Model
Thermal NOx and prompt NOx are mainly considered in the study for the NOx generation model. Prompt NOx is generated at the root of the combustion flame, and the generation time is extremely short. It is mainly caused by the reaction between in the air and hydrocarbon ion groups (CH, etc.) in the fuel to generate CN compounds, which are then oxidized to generate NOx. The reaction equations mainly include
The generation of thermal NOx mainly occurs in a high-temperature combustion environment, and the chemical reaction begins with the dissociation of O atoms from the H2-O2 group or from O2. The specific equations are as follows.
2.2.6. Field Synergy Principle
The field synergy principle is grounded on coordinating the heat flux field and velocity field. It studies the uniform law of convective heat transfer and unifies the existing single-phase heat transfer enhancement theory. The multi-field synergy in the convective heat transfer region is introduced to evaluate the flow resistance and heat transfer [38,39].
Multiple synergy angles are employed to describe multi-field synergy. The synergy angles and are given as Equations (31) and (32).
where is the velocity; is the temperature gradient; is the velocity gradient.
2.3. Boundary Conditions and Parameters
The fuel inlet and air inlet are the velocity inlet boundary, and the velocity is calculated based on the specific flow rate of the case. The wall of the boiler, which is wrapped by saturated water, is set as an isothermal wall, and the heat flux density of the wall that is not wrapped by saturated water is constant. The outlet of the boiler is the pressure outlet boundary. The specific values are listed in Table 2.
Table 2.
Boundary conditions and parameters of the boiler.
2.4. Biogas Parameters
In this study, biomass syngas with components including CH4, CO, CO2, H2, and N2 is employed. In some literature, solid biomass has been gasified to produce syngas and similar components have been found in the results of the research. There are also studies on the combustion of biomass syngas with similar composition [40,41].
The volume fraction of non-combustible components CO2 and N2 remains constant. The volume percentage of hydrogen varies from 5% to 30%, while the volume percentage of other components decreases.
Two different scenarios are discussed in the study: one is hydrogen addition at a constant fuel volumetric flow rate (488 Nm3/h), and the specific parameters of fuels are listed in Table 3. The other is hydrogen addition at constant heat input (778.78 kW), and the specific parameters of fuels are listed in Table 4.
Table 3.
Parameters of hybrid fuels (at constant fuel volumetric flow rate).
Table 4.
Parameters of hybrid fuels (at constant heat input).
2.5. Grid Independence
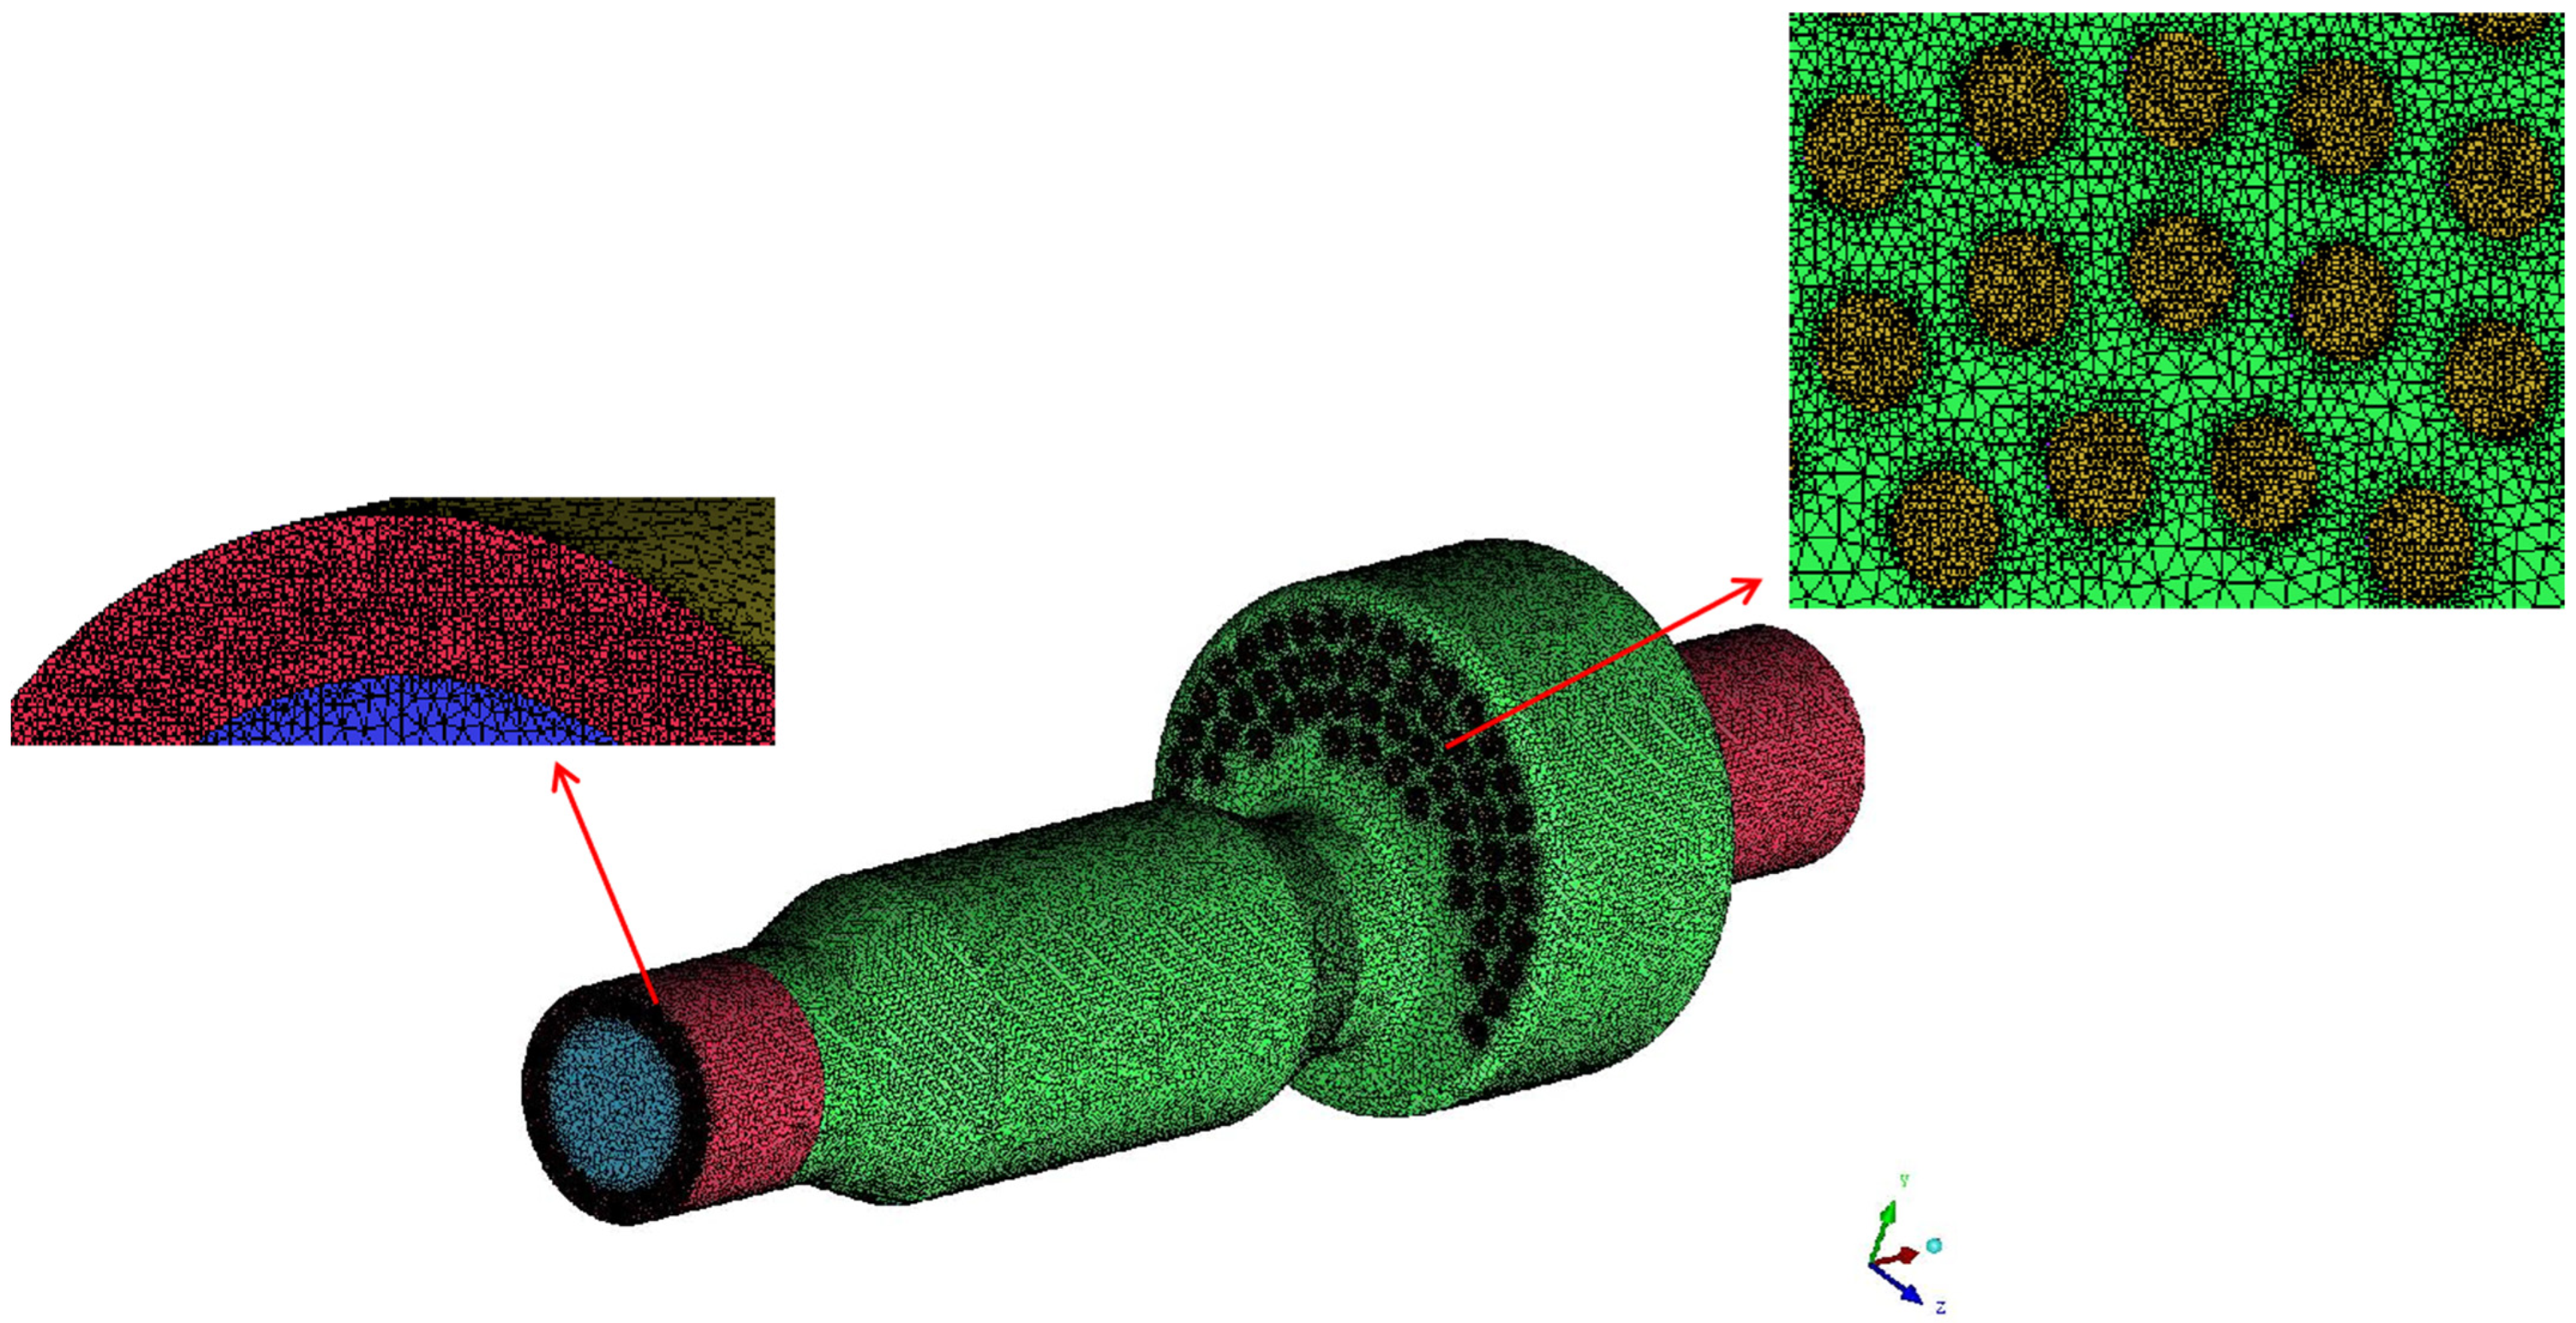
The computational domain is meshed using ICEM CFD 18.0 software. The grid at the outlet and swirl air inlet is locally encrypted, and the overall unstructured grid is shown in Figure 3.

Figure 3.
The grids of the computational domain.
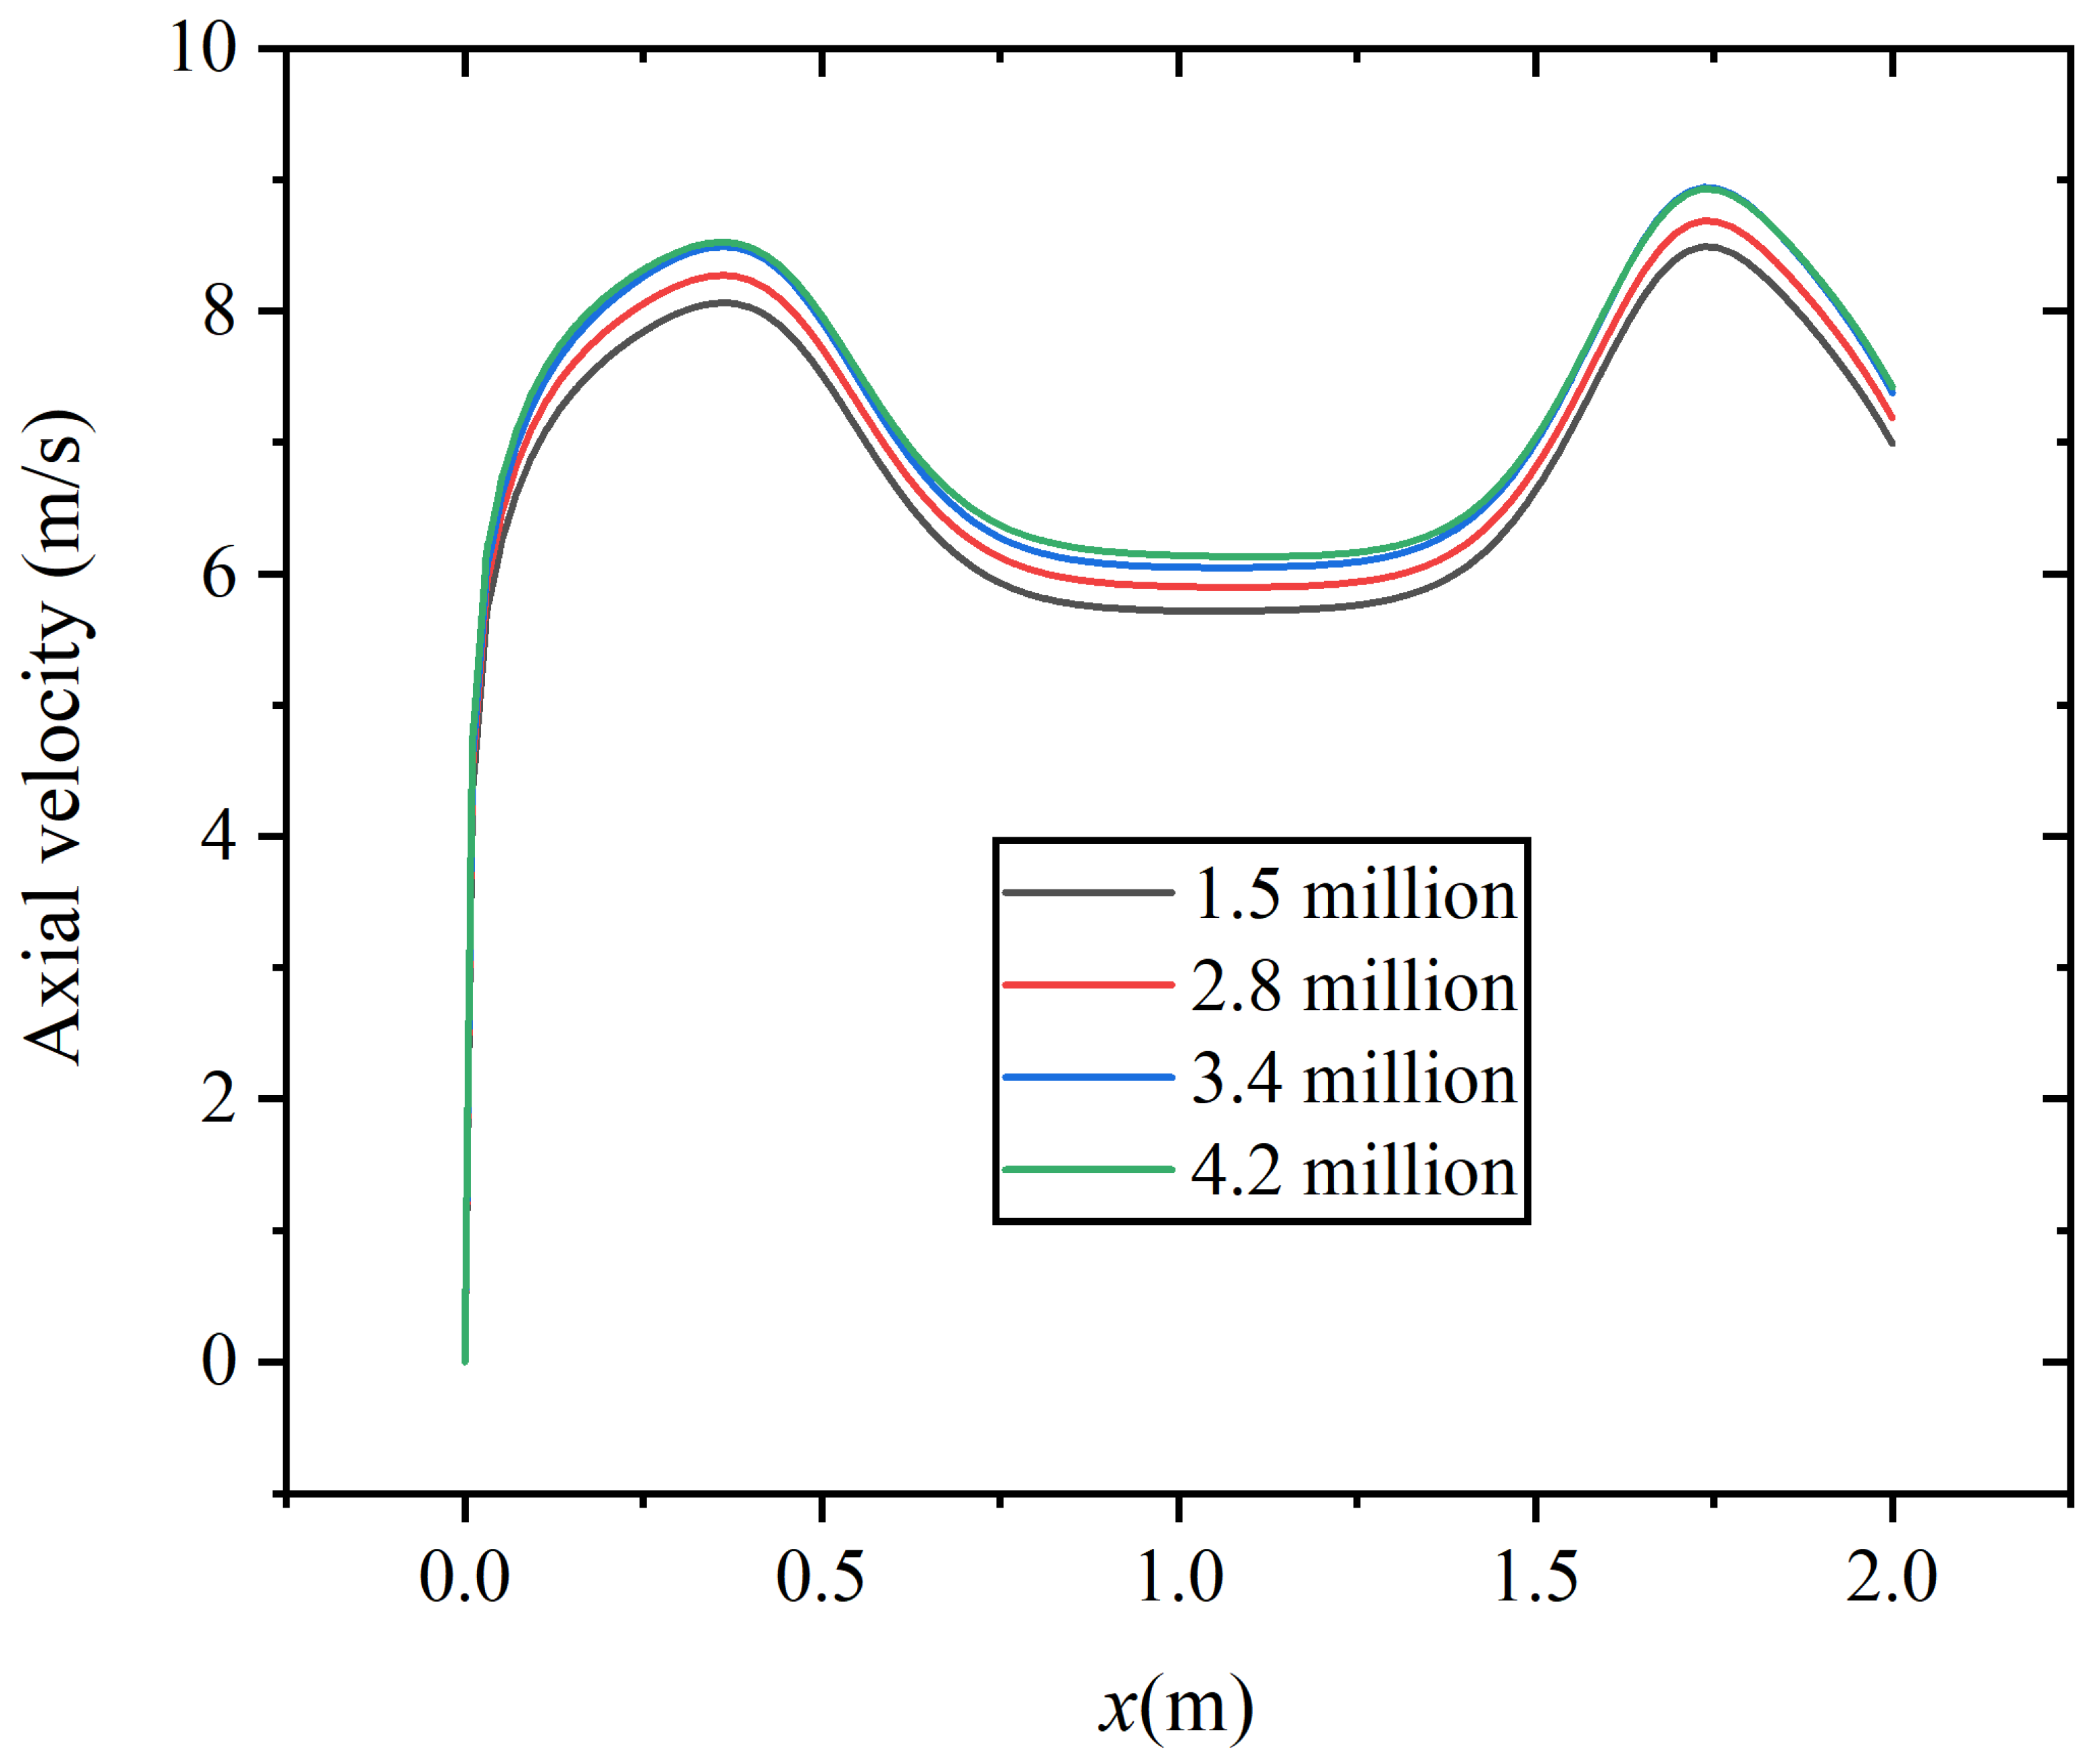
In this study, four different numbers of grids are adopted to conduct the grid independence validation, which are 1.5 million, 2.8 million, 3.4 million, and 4.2 million, respectively. The quality of the grid is checked in turn to ensure that it meets the quality requirements. Figure 4 shows the axial velocity distribution corresponding to the four sets of grids at the axial distance of x = 1.0 m. The results indicate that the maximum deviation between the results of 3.4 million grids and 4.2 million grids is 0.57%.
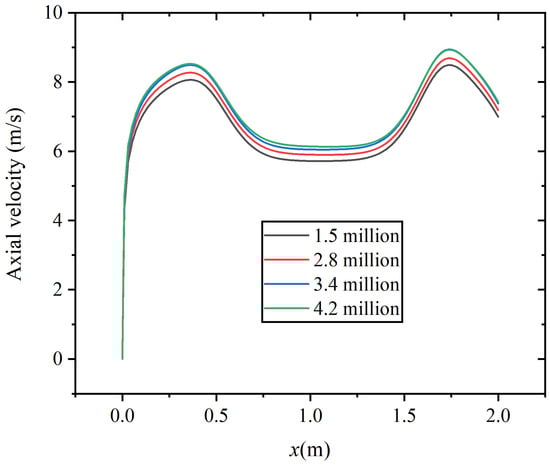
Figure 4.
Grid independence results of axial velocity.
On the premise of meeting the accuracy of the calculation, a relatively small number of grids should be selected to save memory during computer operation, accelerate calculation speed, and reduce the impact of grid numbers on experiments. In this study, the number of 3.4 million is ultimately selected as the subsequent simulation grid number.
2.6. Numerical Validation
Numerical simulation is conducted using ANSYS FLUENT 18.0, which is a commercial CFD software. The SIMPLE algorithm is employed to process the pressure–velocity coupling. The second-order upwind difference scheme is employed for the convection term, and the central difference scheme is employed for the diffusion term.
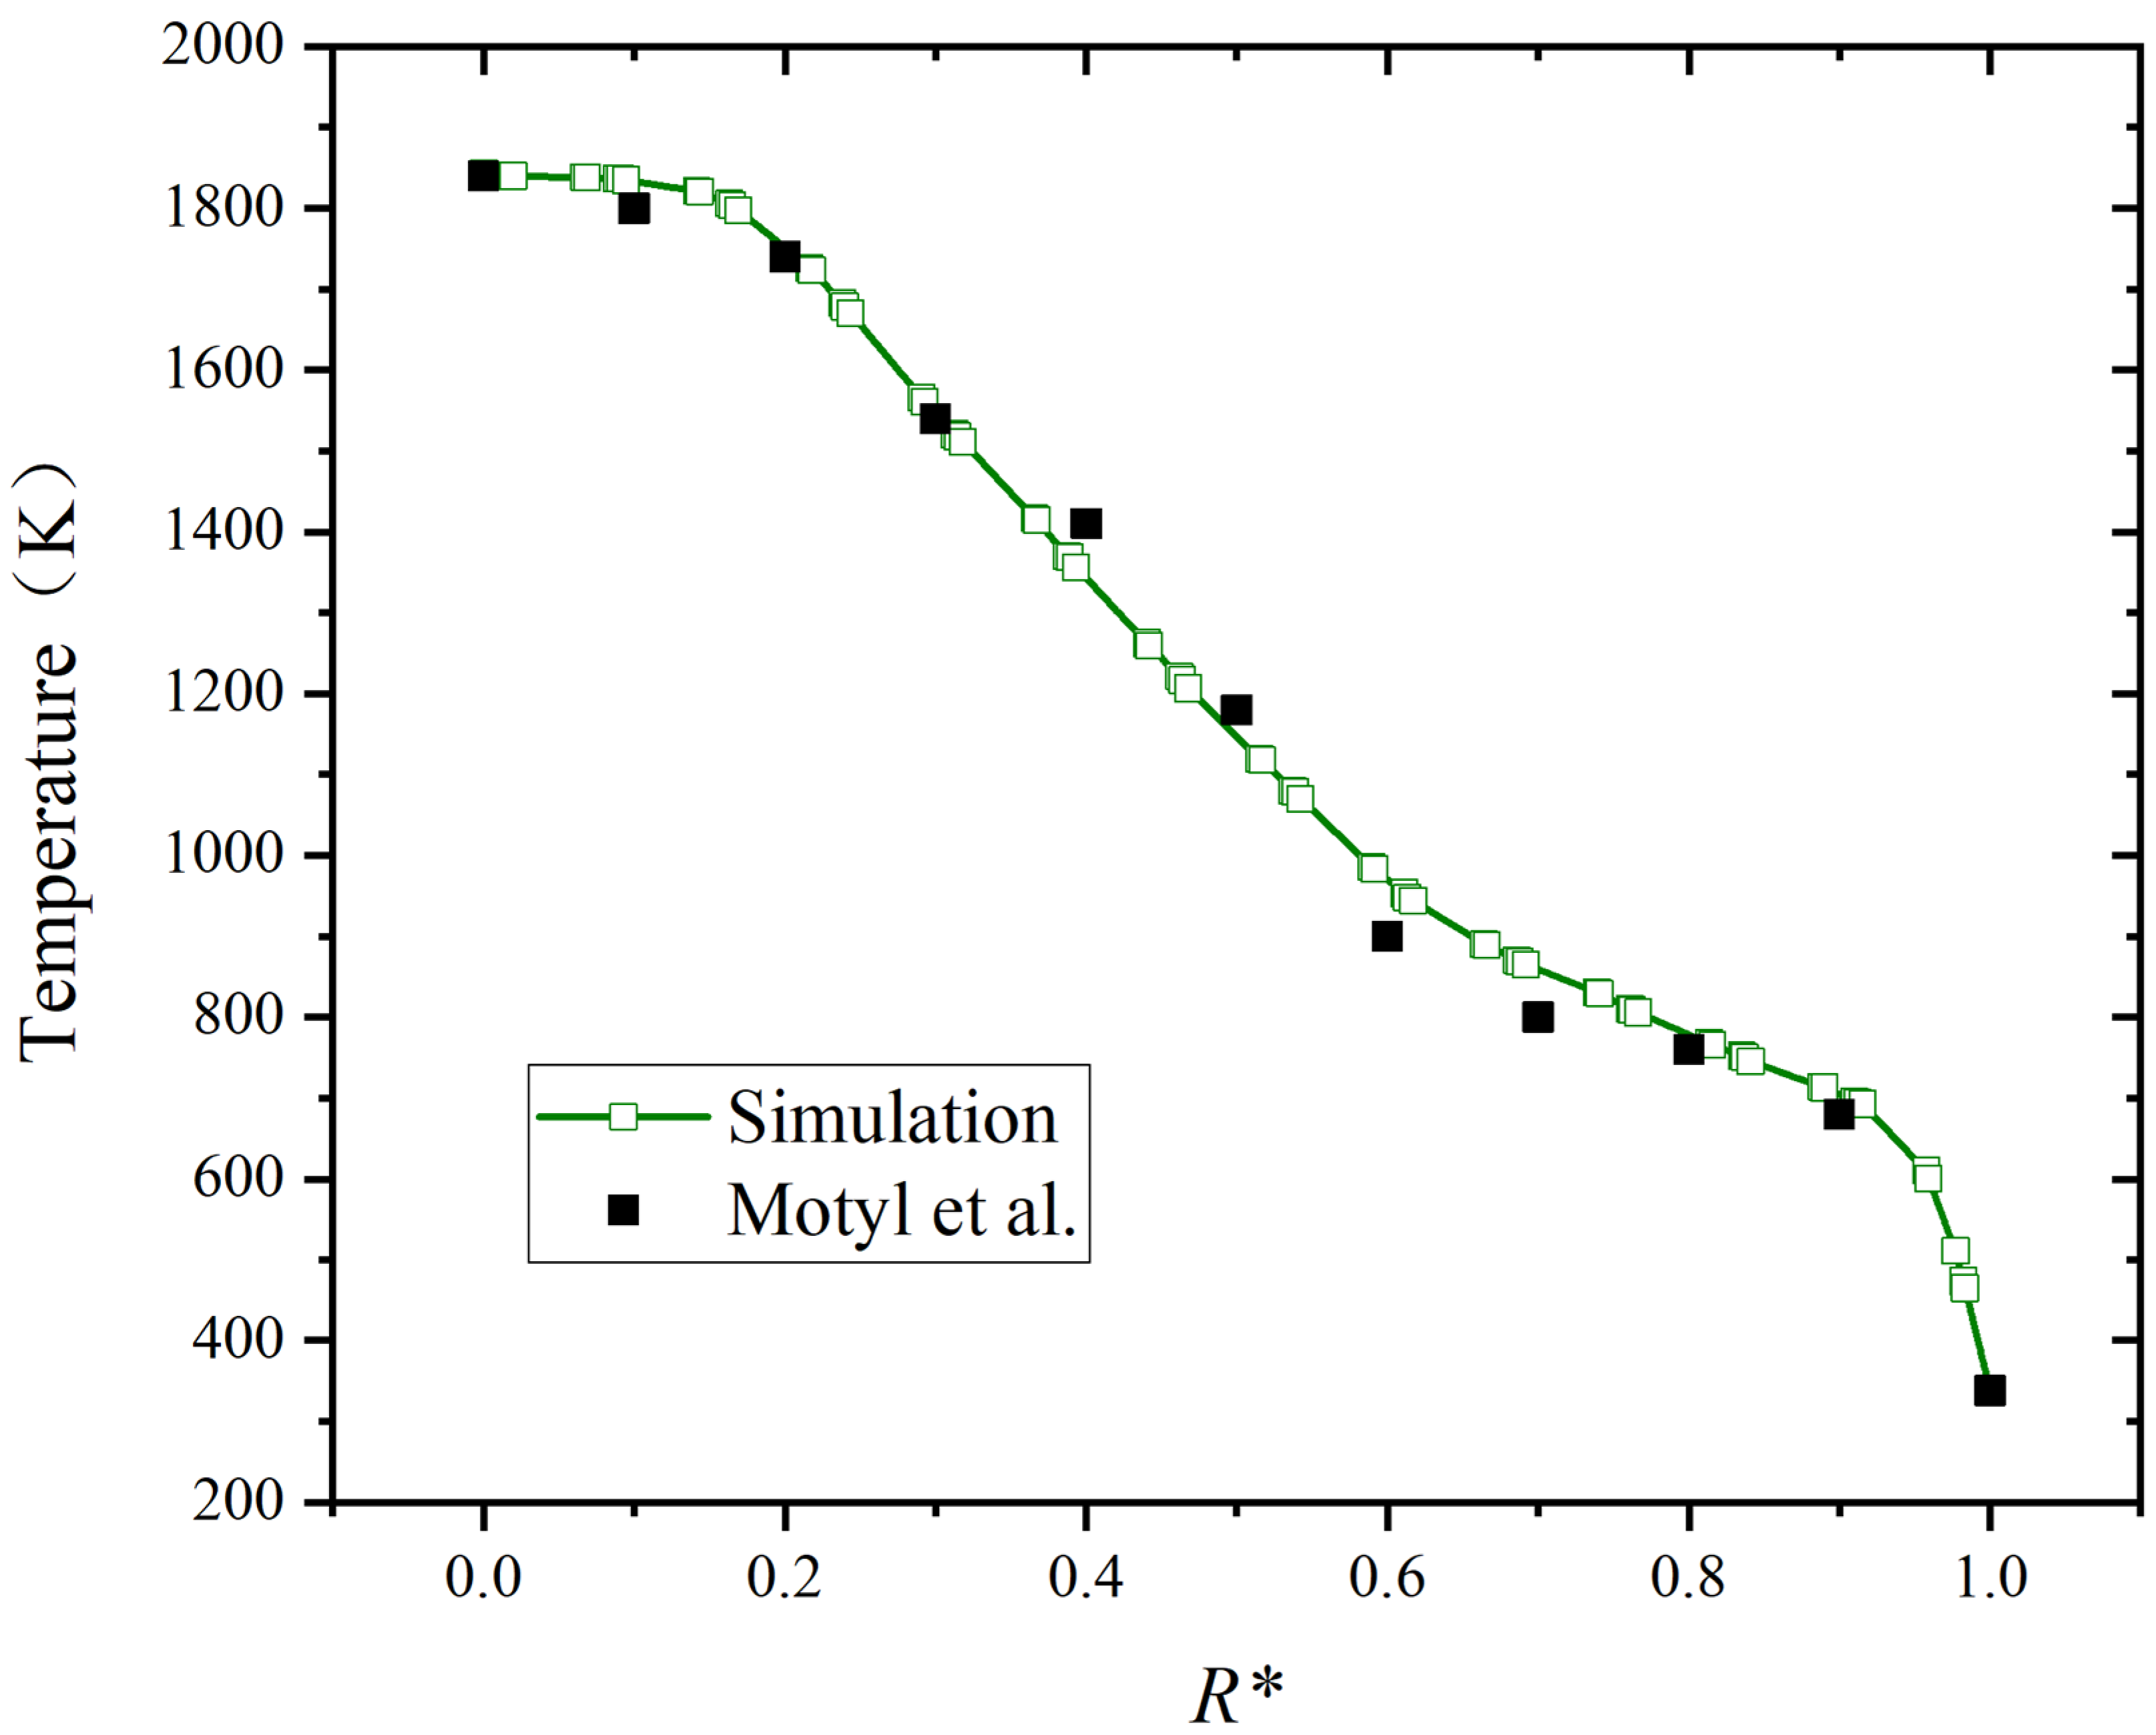
Ref. [42], which investigated domestic boiler combustion of biomass syngas, is referenced for the comparison. A new design of boiler fired with wood pellets was developed. The numerical calculation results were verified by experiments, and the boiler with the new structure met emission requirements. The gas components (15.1% CO2, 18.4% CO, 14.2% H2, 3.3% CH4, 49.0% N2), the fuel flow rate of 0.002059 Nm3/s, the fuel temperature of 1123 K, the airflow rate of 0.004314 Nm3/s, and the air temperature of 300 K are set. This study sets the same fuel parameters and inlet conditions as the reference to verify the reliability of the geometric and mathematical models used for simulation research.
Because the size of the boiler combustion chamber employed in the research is different from that in the literature, its radial distance is normalized. As shown in Figure 5, R* is the normalized radial distance at the highest temperature position. The maximum relative deviation of temperature is limited to 0.06. The results of the simulation align well with the results in the literature, confirming the model’s reliability.
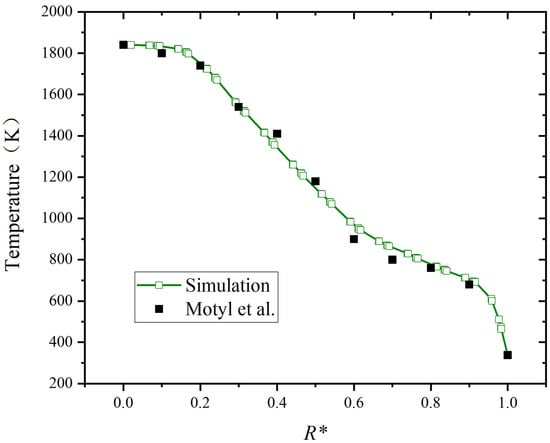
Figure 5.
Comparison of temperature distribution in radial distance [42].
3. Results and Discussion
The investigation is conducted under two hydrogen addition schemes, focusing on the effect of hydrogen addition on biomass syngas combustion from four perspectives: multi-physical fields, turbulent kinetic energy, field synergy, and emission characteristics.
3.1. Temperature Field and Velocity Field
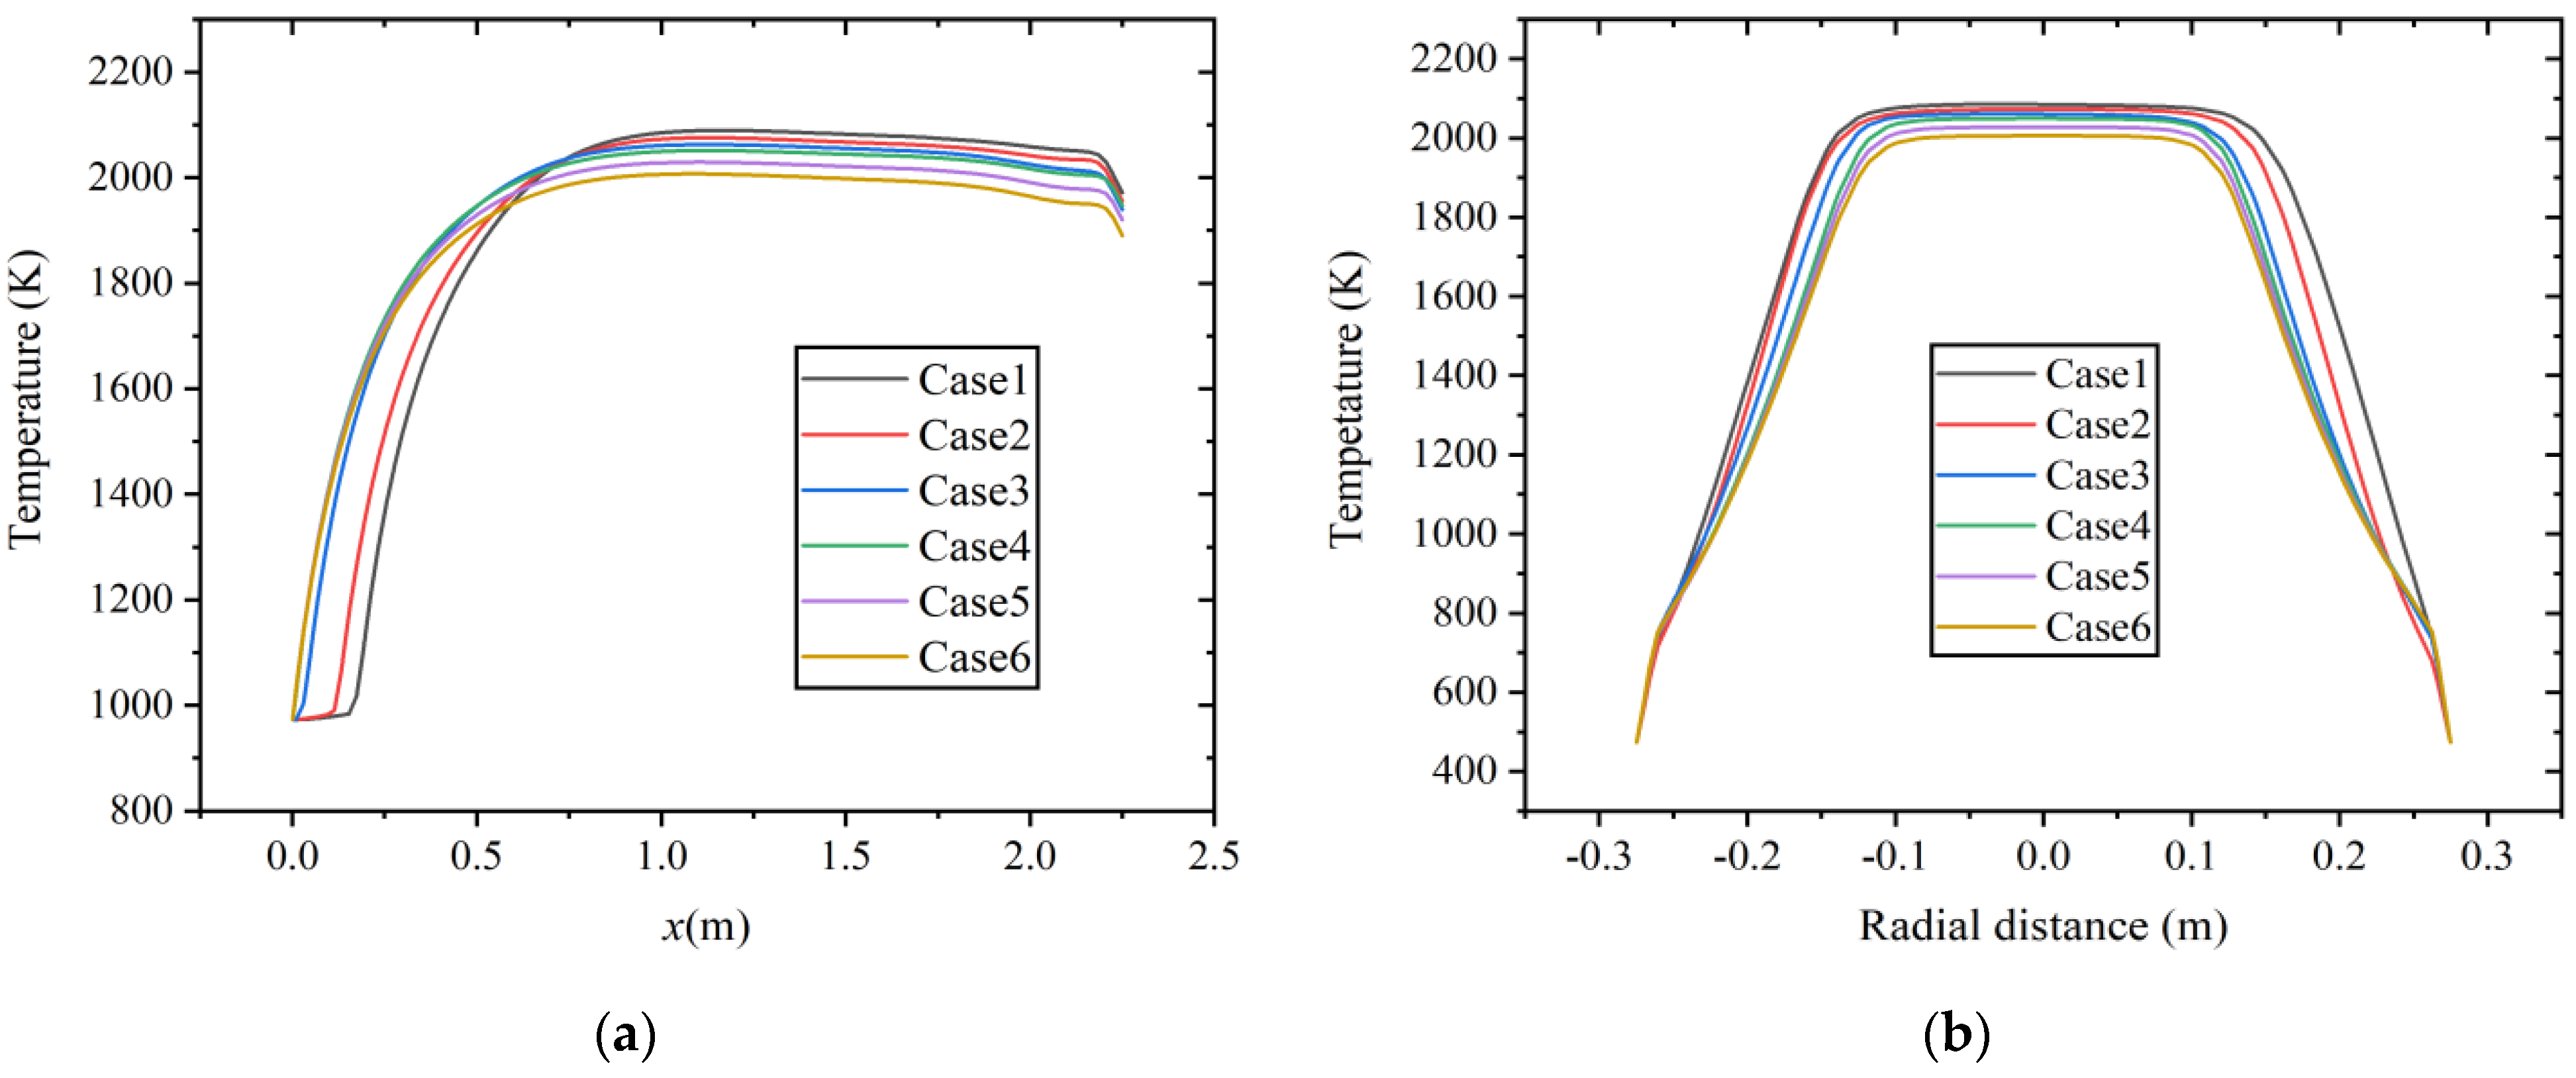
As shown in Figure 6, the temperature distribution results of six cases along the axial and radial directions (x = 1.0 m) at a constant volumetric flow rate. It is observed that as hydrogen content increases, the average temperature in the combustion chamber shows a decreasing trend, which is similar to the research results in Ref. [9]. In the study of CO/H2/CH4/CO2/N2 mixtures combustion with different H2 contents, the combustion temperature of the rich H2 mixture is lower. With the increase in hydrogen content, the content of other combustible gas components correspondingly decreases. Methane possesses a higher C-H ratio, resulting in a higher lower heating value (LHV). The volume energy density of hydrogen is about one-third that of methane. The LHV of fuel decreases, resulting in a decrease in heat input and temperature inside the combustion chamber.
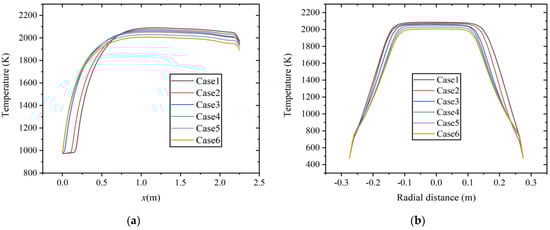
Figure 6.
Temperature distribution at constant fuel volumetric flow rate along the (a) axial direction and (b) radial direction.
In Figure 6a, it can also be observed that the low-temperature region in the inlet section significantly reduces with the increase in hydrogen content, the highest temperature is reached at about x = 1.0 m, and the increase in hydrogen concentration shows a certain combustion-supporting effect. As shown in Figure 6b, at the radial section of x = 1.0 m, as the hydrogen content increases, the high-temperature area concentrates towards the center position, and the range of the high-temperature area decreases.
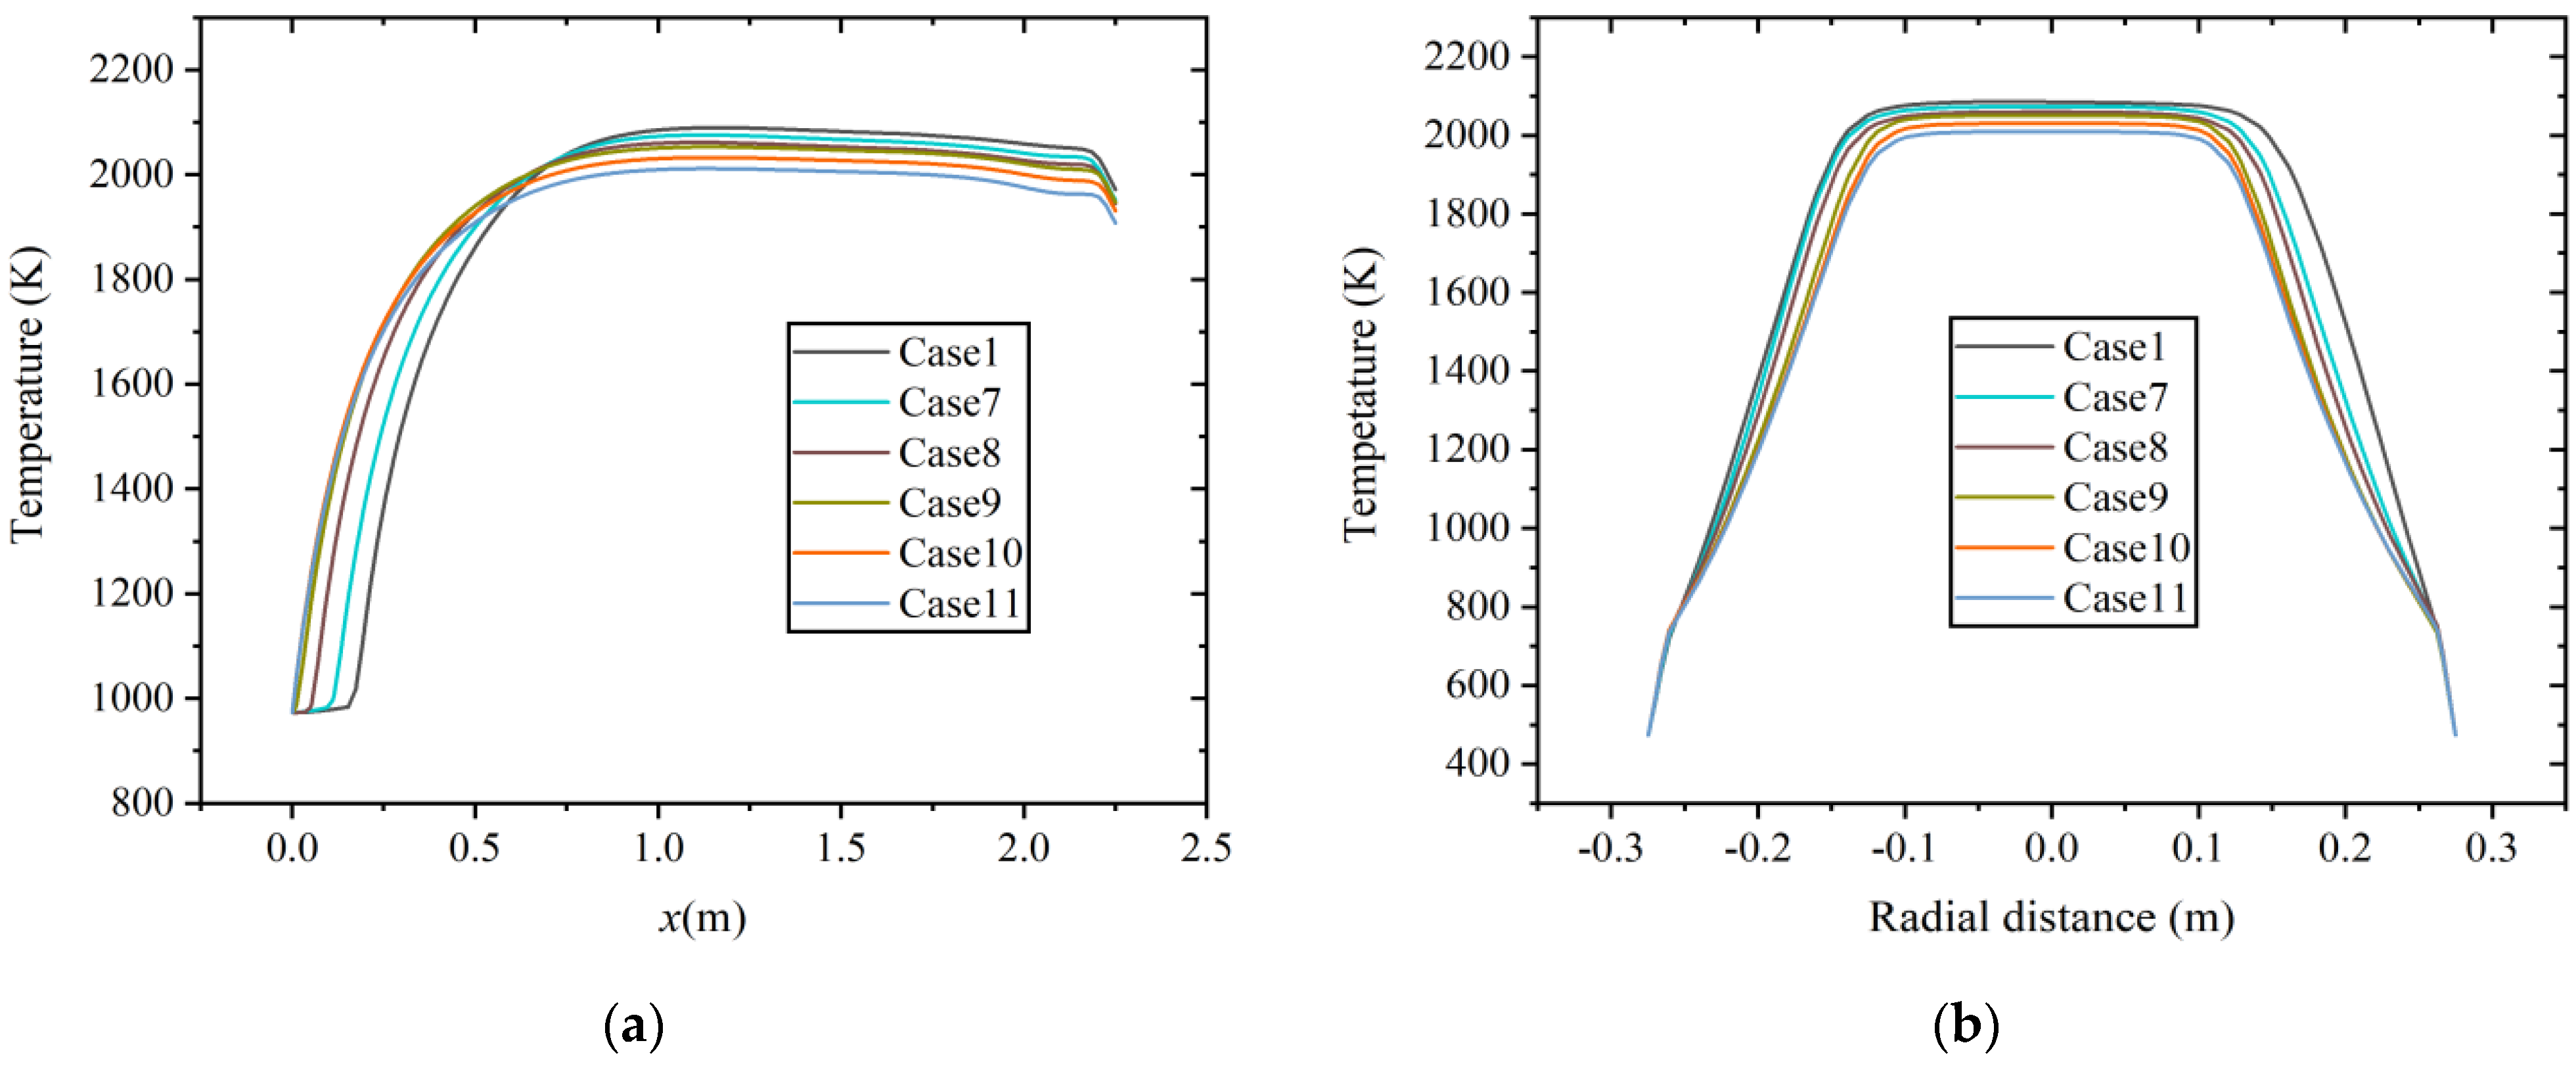
Figure 7 shows the temperature distribution of six cases along the axial and radial directions (x = 1.0 m) at constant heat input. With the increase in hydrogen content, the combustion temperature in the combustion chamber decreases, and the high-temperature region shrinks, which is similar to the results at a constant volumetric flow rate.
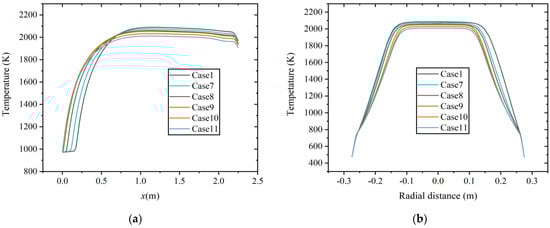
Figure 7.
Temperature distribution at constant heat input along the (a) axial direction and (b) radial direction.
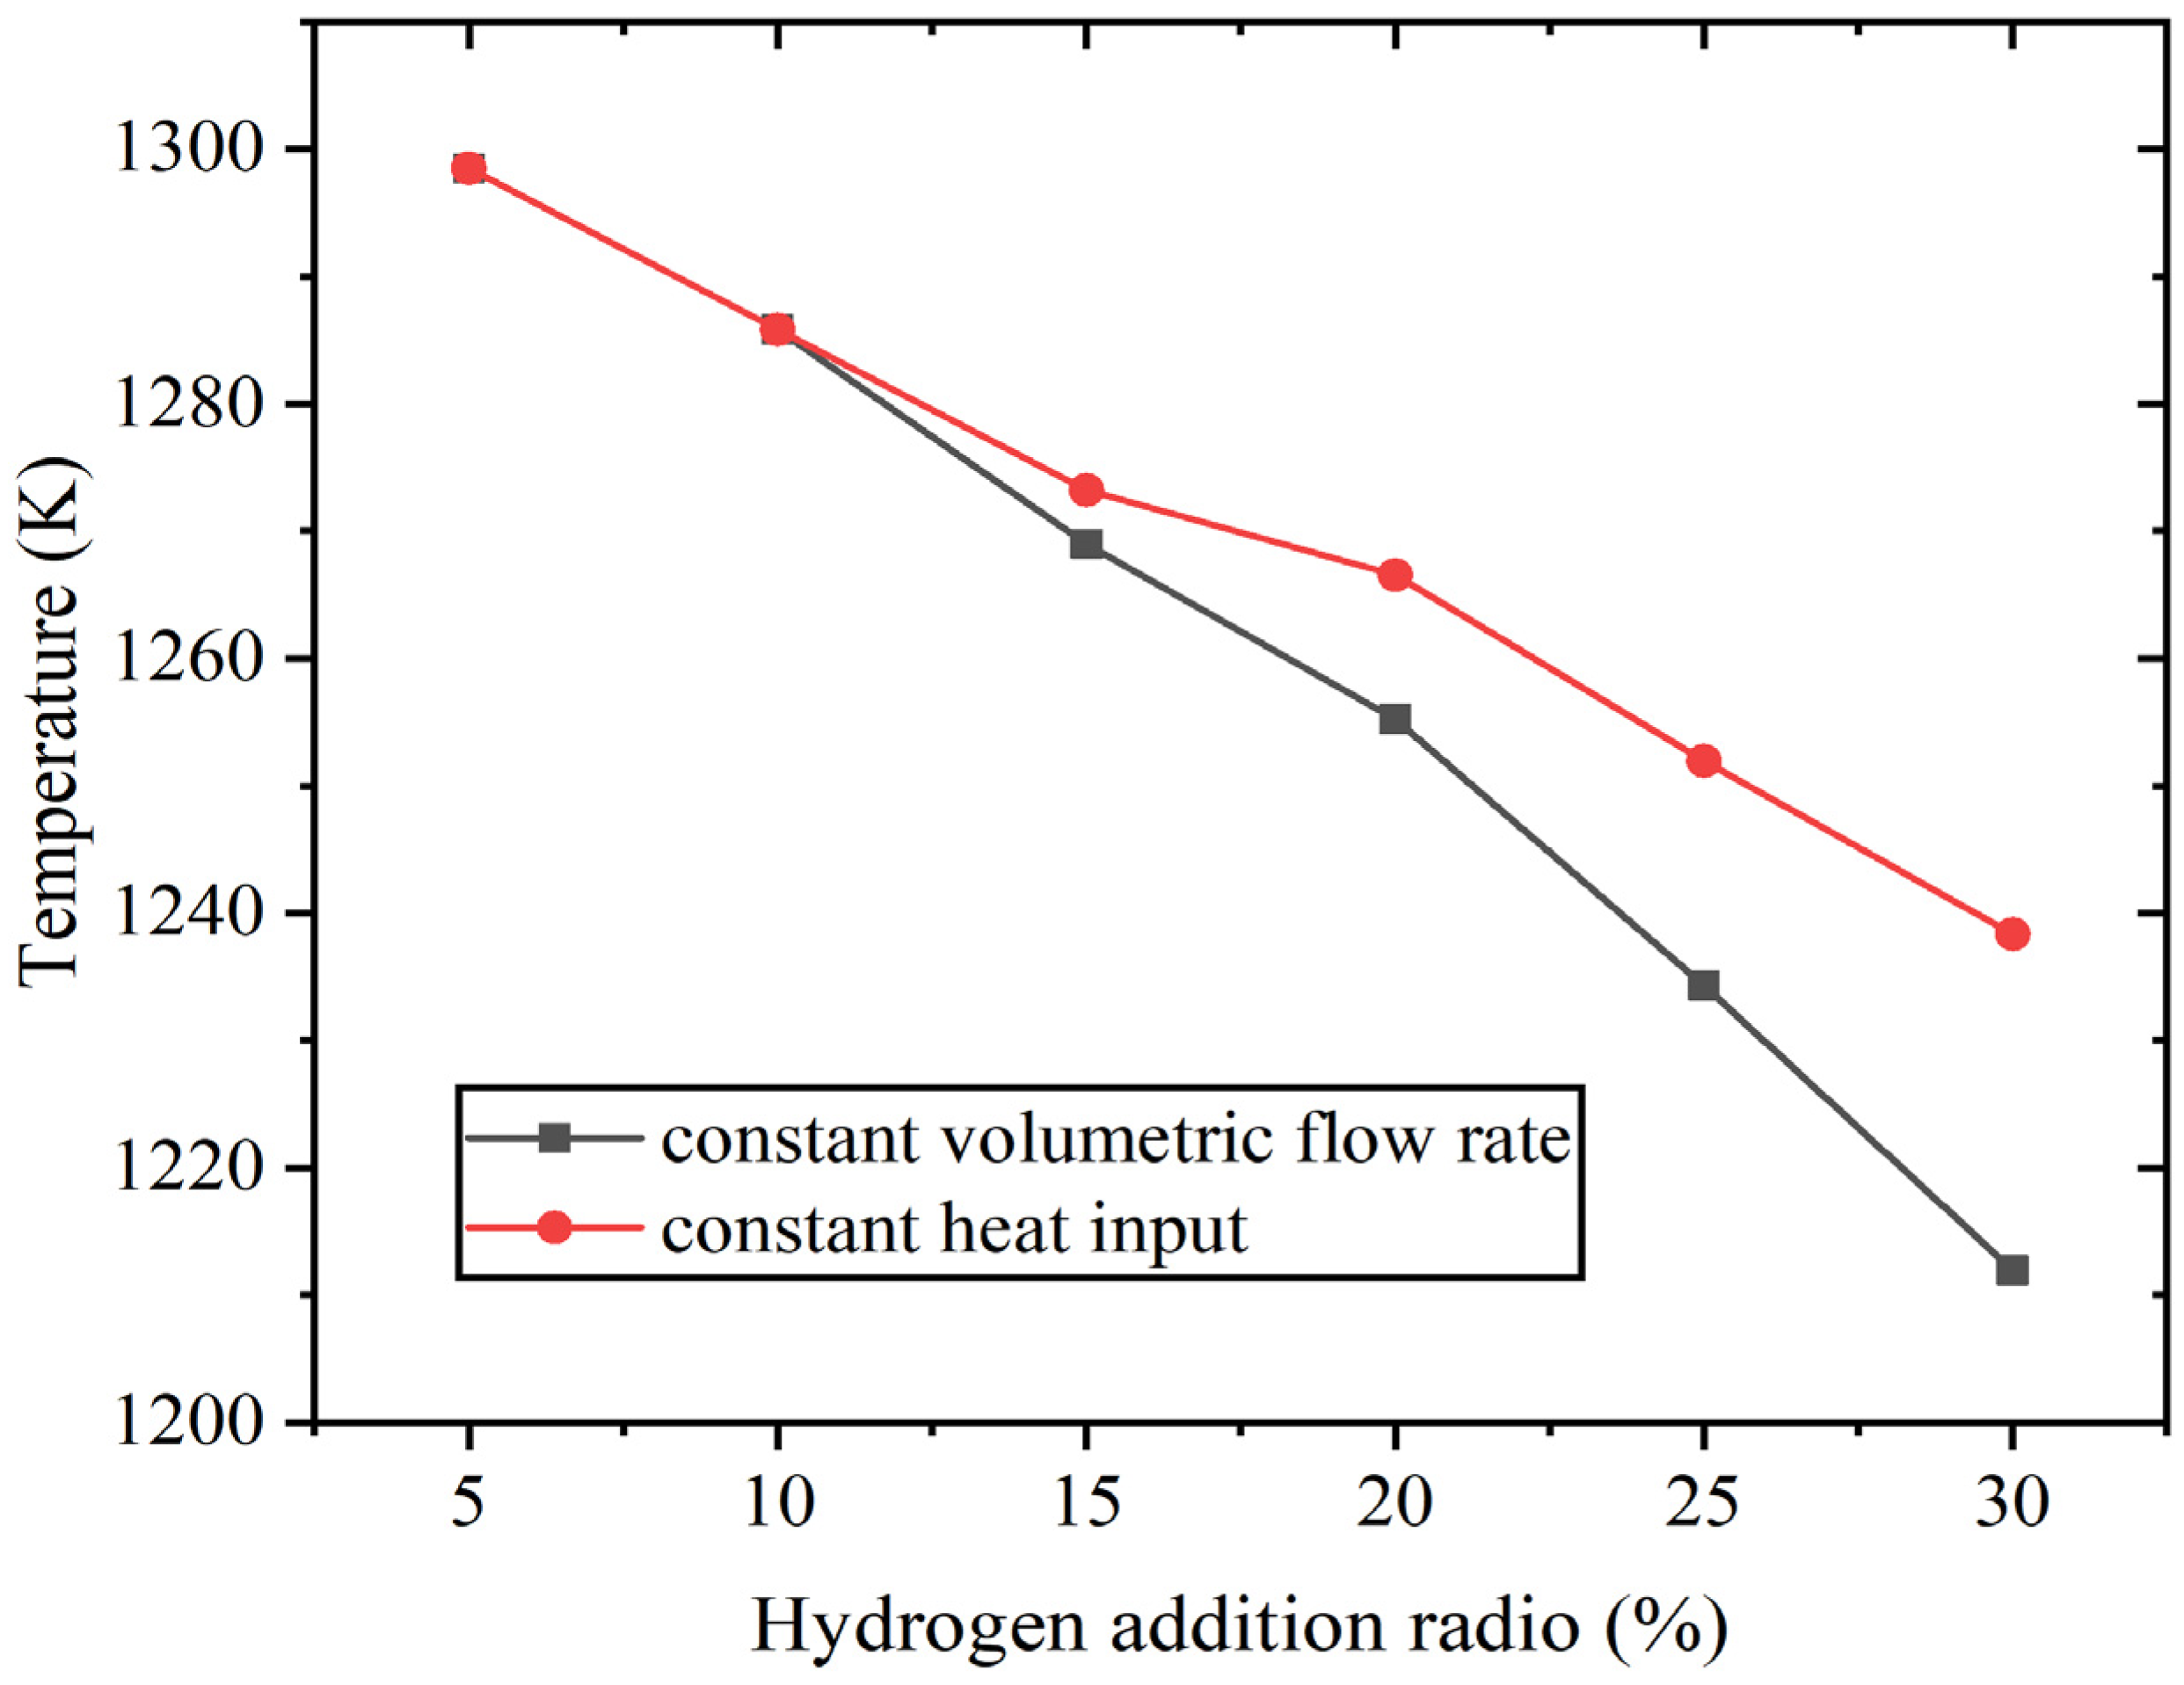
When the hydrogen content varies from 5% to 30%, the average outlet temperature also decreases to a certain extent. At constant volumetric flow rate, it decreases from 1298 K to 1212 K, and at constant heat input, it decreases to 1238 K. Figure 8 shows the average outlet temperature result.
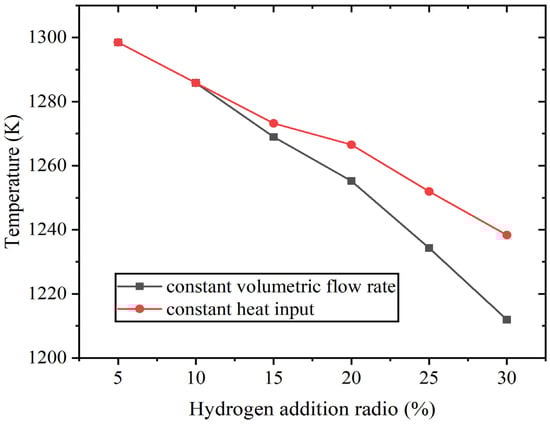
Figure 8.
The average outlet temperature at constant fuel volumetric flow rate and at constant heat input.
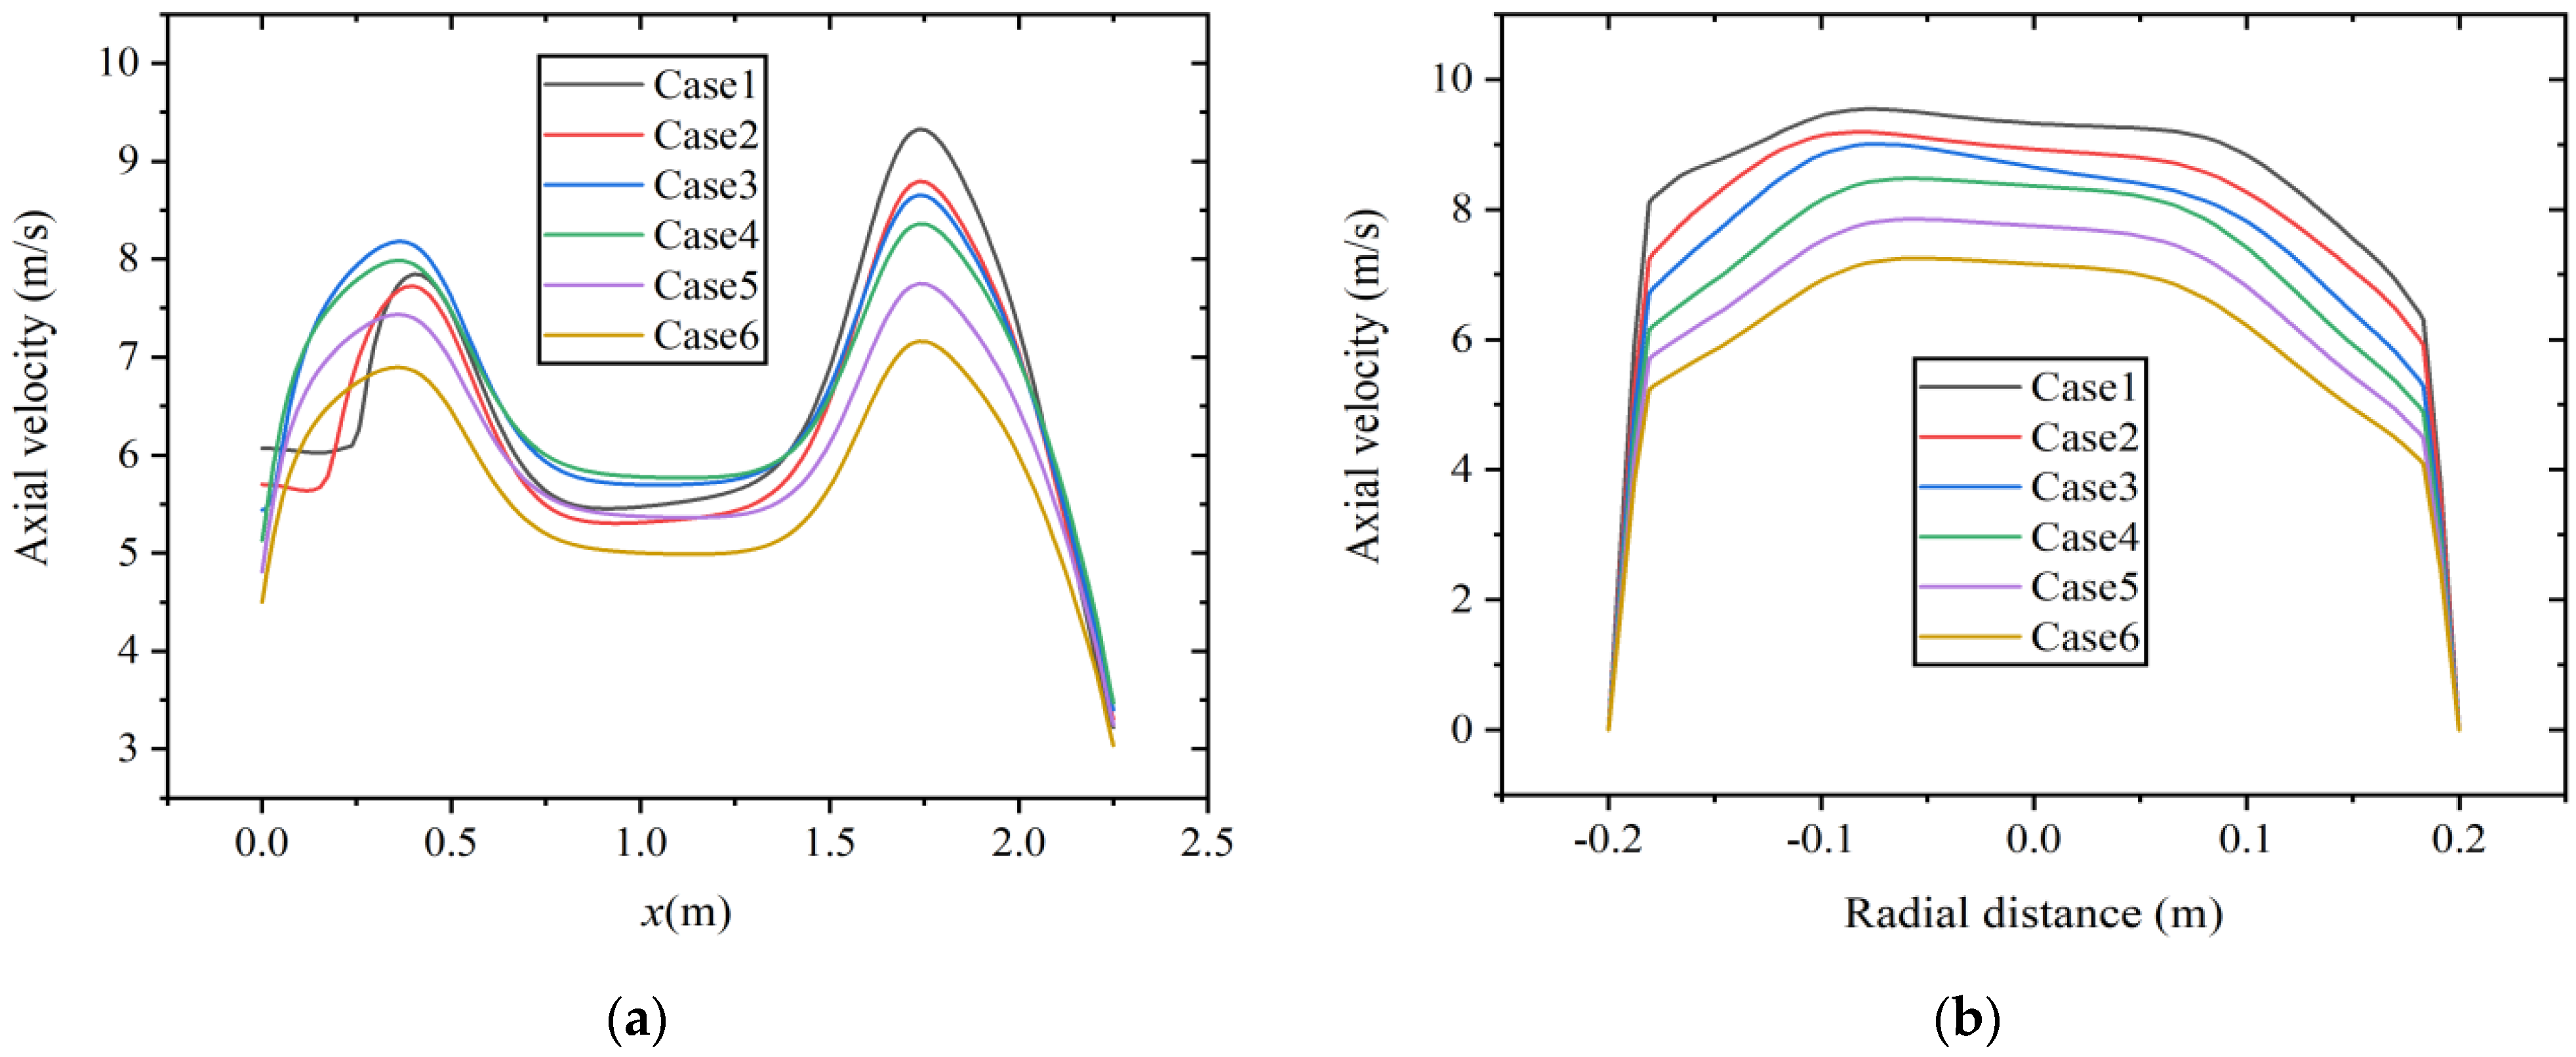
Figure 9 shows the velocity distribution along the axial and radial directions (at x = 1.75 m) at a constant volumetric flow rate. As shown in Figure 9a, the areas with high axial velocity are mainly distributed at x = 0.4~0.5 m and x = 1.75 m. When gas fuel enters the main combustion chamber, the gas diffusion rate is fast, and the axial velocity rapidly increases, forming a region with higher velocity. In addition, as the hydrogen content increases, the axial velocity decreases. The diameter of the boiler from the main combustion chamber to the reversal section shrinks, and the airflow is compressed, resulting in an increase in axial velocity. The maximum axial velocity occurs at a position of approximately x = 1.75 m. Figure 9b shows the axial velocity distribution at this radial section. According to the results shown in Figure 8, with the increase in hydrogen content, the temperature decreases to a certain extent. Due to the decrease in temperature and reaction intensity, it may lead to a decrease in axial velocity.
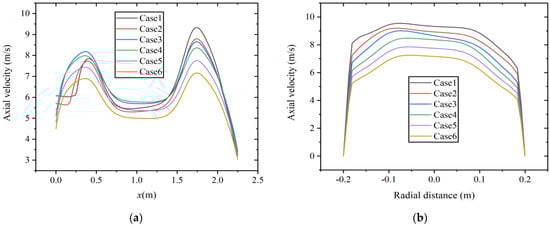
Figure 9.
Velocity distribution at constant fuel volumetric flow rate along the (a) axial direction and (b) radial direction.
Figure 10 shows the axial and radial distribution (at x = 1.75 m) of velocity at constant heat input. The region with high axial velocity is mainly distributed in the same position. Different from the results at a constant volumetric flow rate, the axial velocity increases with the increase in hydrogen content in the area from the inlet section to the main combustion furnace with an enlarged diameter. The reason is that at constant heat input, the increase in fuel mass flow rate causes an increase in the flow rate of the inlet premixed gas. In the area from the main combustion furnace to the reversal section with shrinking diameter, the axial velocity is smaller in the case of 10% and 15% hydrogen content. As shown in Figure 10b, at this position, the radial distribution of axial velocity has a higher coincidence degree when the hydrogen content is between 25% and 30%.
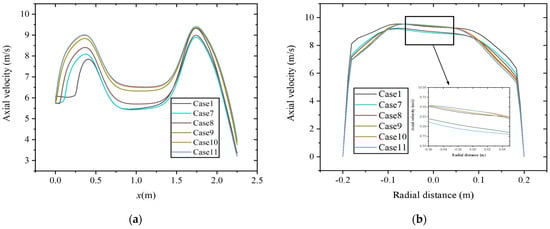
Figure 10.
Velocity distribution at constant heat input along the (a) axial direction and (b) radial direction.
The effects of hydrogen addition on temperature and velocity fields are significant. Under two hydrogen addition schemes, the temperature inside the combustion chamber decreases because of the lower heating value caused by changes in fuel composition. In the results of the velocity field, higher axial velocity occurs at the positions with sudden changes in the diameter of the combustion chamber. However, there is a significant difference in the effect of hydrogen addition on axial velocity under two hydrogen addition schemes. The reason is that the fuel mass flow rate decreases at a constant volumetric flow rate while it increases at constant heat input.
3.2. Turbulent Kinetic Energy
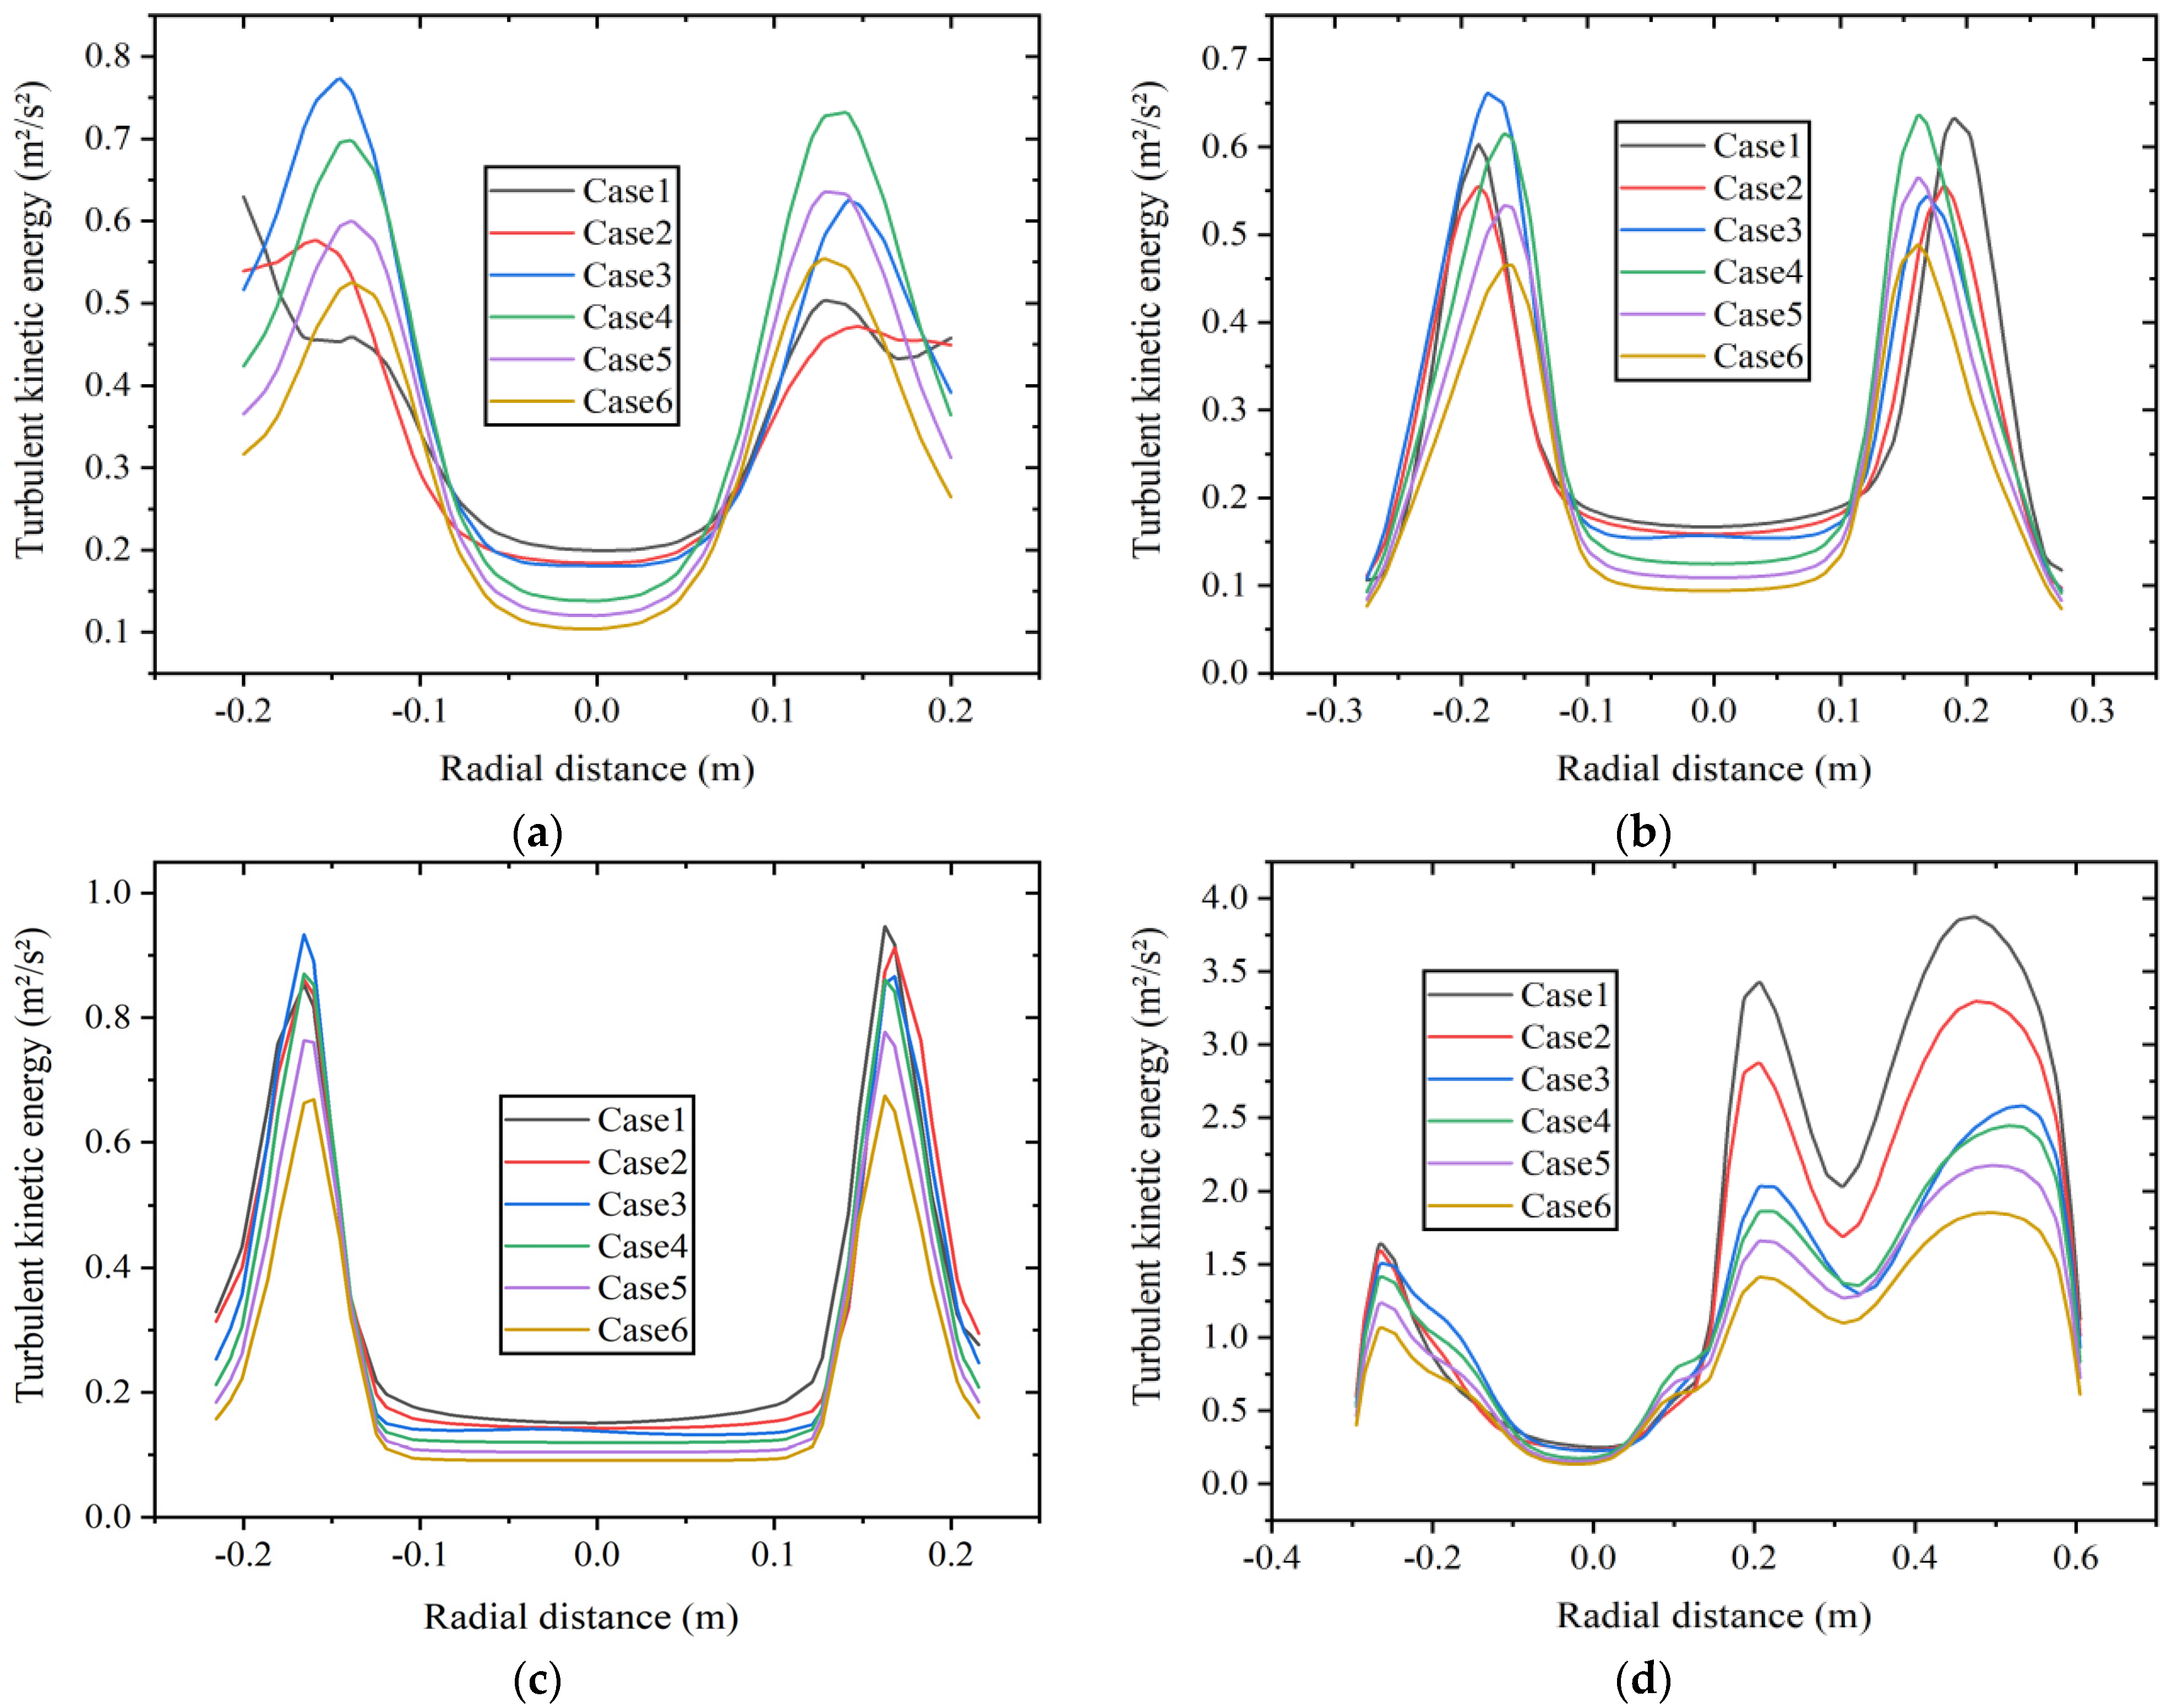
The distribution of TKE can be used to measure the stability of turbulent motion in the combustion chamber, and its value reflects the magnitude and range of energy loss to some extent. Figure 11 shows the radial TKE distribution at four axial positions: (a) x = 0.5 m boiler inlet section, (b) x = 1.0 m boiler main combustion chamber section, (c) x = 1.75 m furnace shrinkage section, and (d) x = 2.0 m reversal section at constant fuel volumetric flow rate. As shown in Figure 11a, the TKE at the center of the boiler inlet section is relatively low. At a volume percentage of 5% hydrogen, the peak value of TKE appears at the wall position, while in other cases, the peak value of TKE appears at the junction of fuel inlet and air inlet.
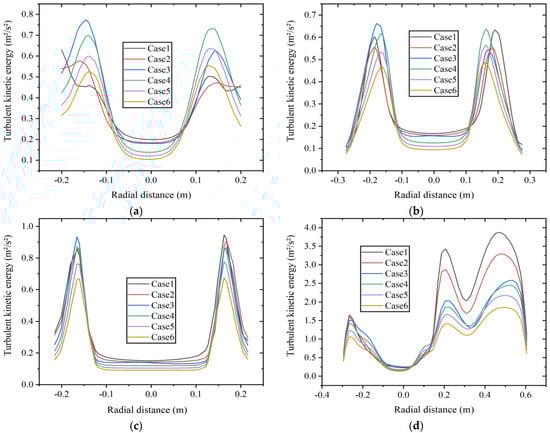
Figure 11.
Radial turbulent kinetic energy distribution at different axial positions of (a) x = 0.5 m, (b) x = 1.0 m, (c) x = 1.75 m, and (d) x = 2.0 m at constant fuel volumetric flow rate.
Figure 11b,c show the TKE at the positions in the main combustion chamber and the furnace shrinkage section. The average TKE with 30% hydrogen content is lower than that with other hydrogen contents, and the instability is weak.
As shown in Figure 11d, the situation of the TKE in the reversal section is relatively complex, and the average TKE here is higher than that in other positions. When the TKE is high, it can lead to energy loss of the fluid and an increase in the flow resistance. Compared with other positions, the fluid here is more unstable. As the hydrogen content increases, the TKE at the reversal section shows a decreasing trend. Due to the correlation between TKE and factors such as fluid velocity, density, and viscosity, an increase in hydrogen content leads to a decrease in TKE, which is in accordance with the results in Figure 9. The peak value of TKE with 30% hydrogen content is about 52% lower than that with 5% hydrogen content. Hydrogen addition weakens the instability of the fluid in this area.
Figure 12 shows the radial TKE distribution at four axial positions: (a) x = 0.5 m boiler inlet section, (b) x = 1.0 m boiler main combustion chamber section, (c) x = 1.75 m furnace shrinkage section, and (d) x = 2.0 m reversal section at constant heat input. As shown in Figure 12a, the TKE at the inlet section increases with the increase in hydrogen content, which may be related to the velocity here to a certain extent. The results are consistent with Figure 10. As shown in Figure 12b,c, the TKE at the positions of the main combustion chamber and the furnace shrinkage section is relatively similar at 20% to 30% hydrogen content, and it is larger than that at 5% to 15% hydrogen content. Figure 12d shows the radial distribution of TKE at the reversal section, which is numerically larger than the average TKE at other positions. The average TKE is highest at 5% hydrogen content, and the distribution of TKE is similar at 10% and 15% hydrogen content. The average TKE at 15% hydrogen content is 11.7% lower than that at 5% hydrogen content. The distribution of TKE is relatively similar at 20% to 30% hydrogen content, and the average TKE is the lowest at 20% hydrogen content. The average TKE at 20% hydrogen content is 13.8% lower than that at 5% hydrogen content.
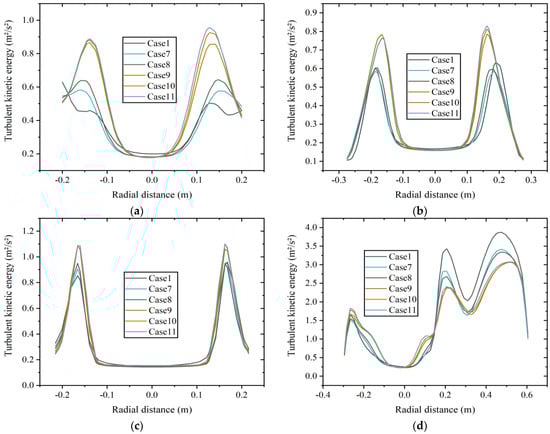
Figure 12.
Radial turbulent kinetic energy distribution at different axial positions of (a) x = 0.5 m, (b) x = 1.0 m, (c) x = 1.75 m, and (d) x = 2.0 m at constant heat input.
The average TKE is relatively high at the position of the reversal section, indicating significant energy loss. The reason is that the flow changes direction in the reversal section, resulting in complex turbulent motion. Under two different hydrogen addition schemes, the average TKE at this position shows a decreasing trend with the increase in hydrogen content to varying degrees, indicating a decrease in flow instability and energy loss.
3.3. Field Synergy
The field synergy principle was proposed to reveal the essence of enhanced convective heat transfer. The synergy of the velocity and temperature fields in the convective heat transfer area proved to be the underlying mechanism. The small synergy angle between the velocity and temperature gradient leads to a good heat transfer performance.
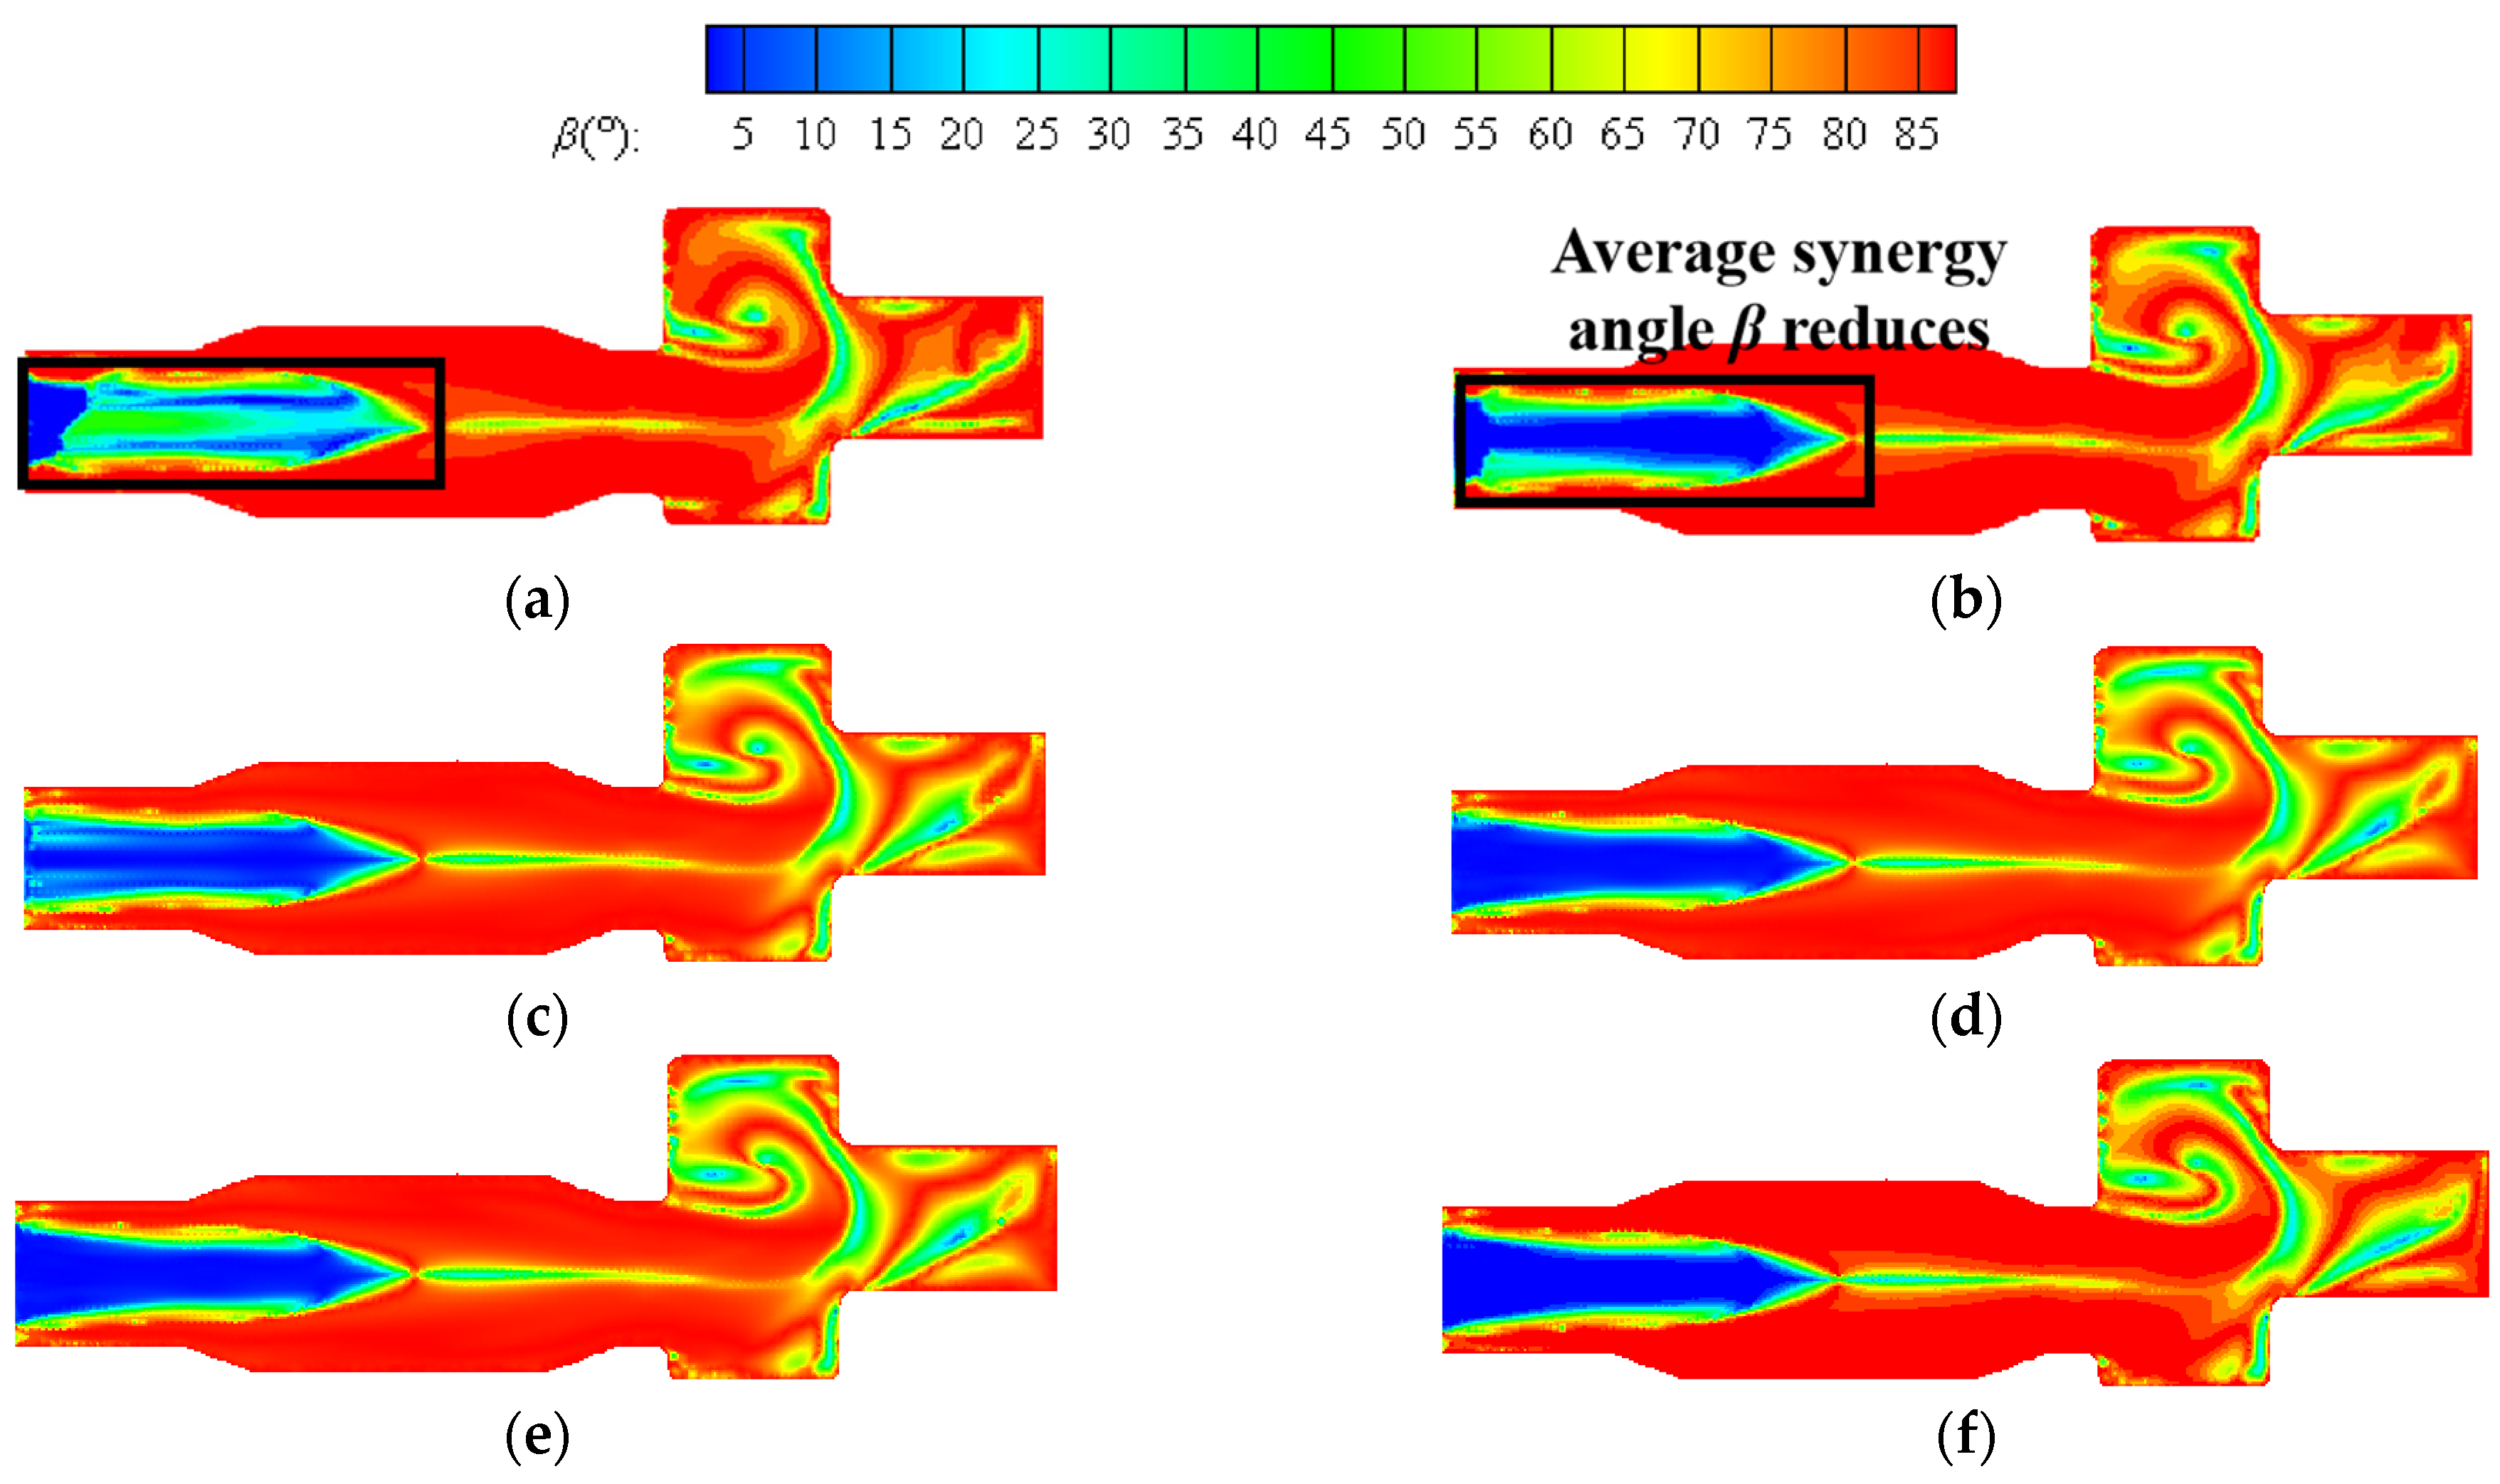
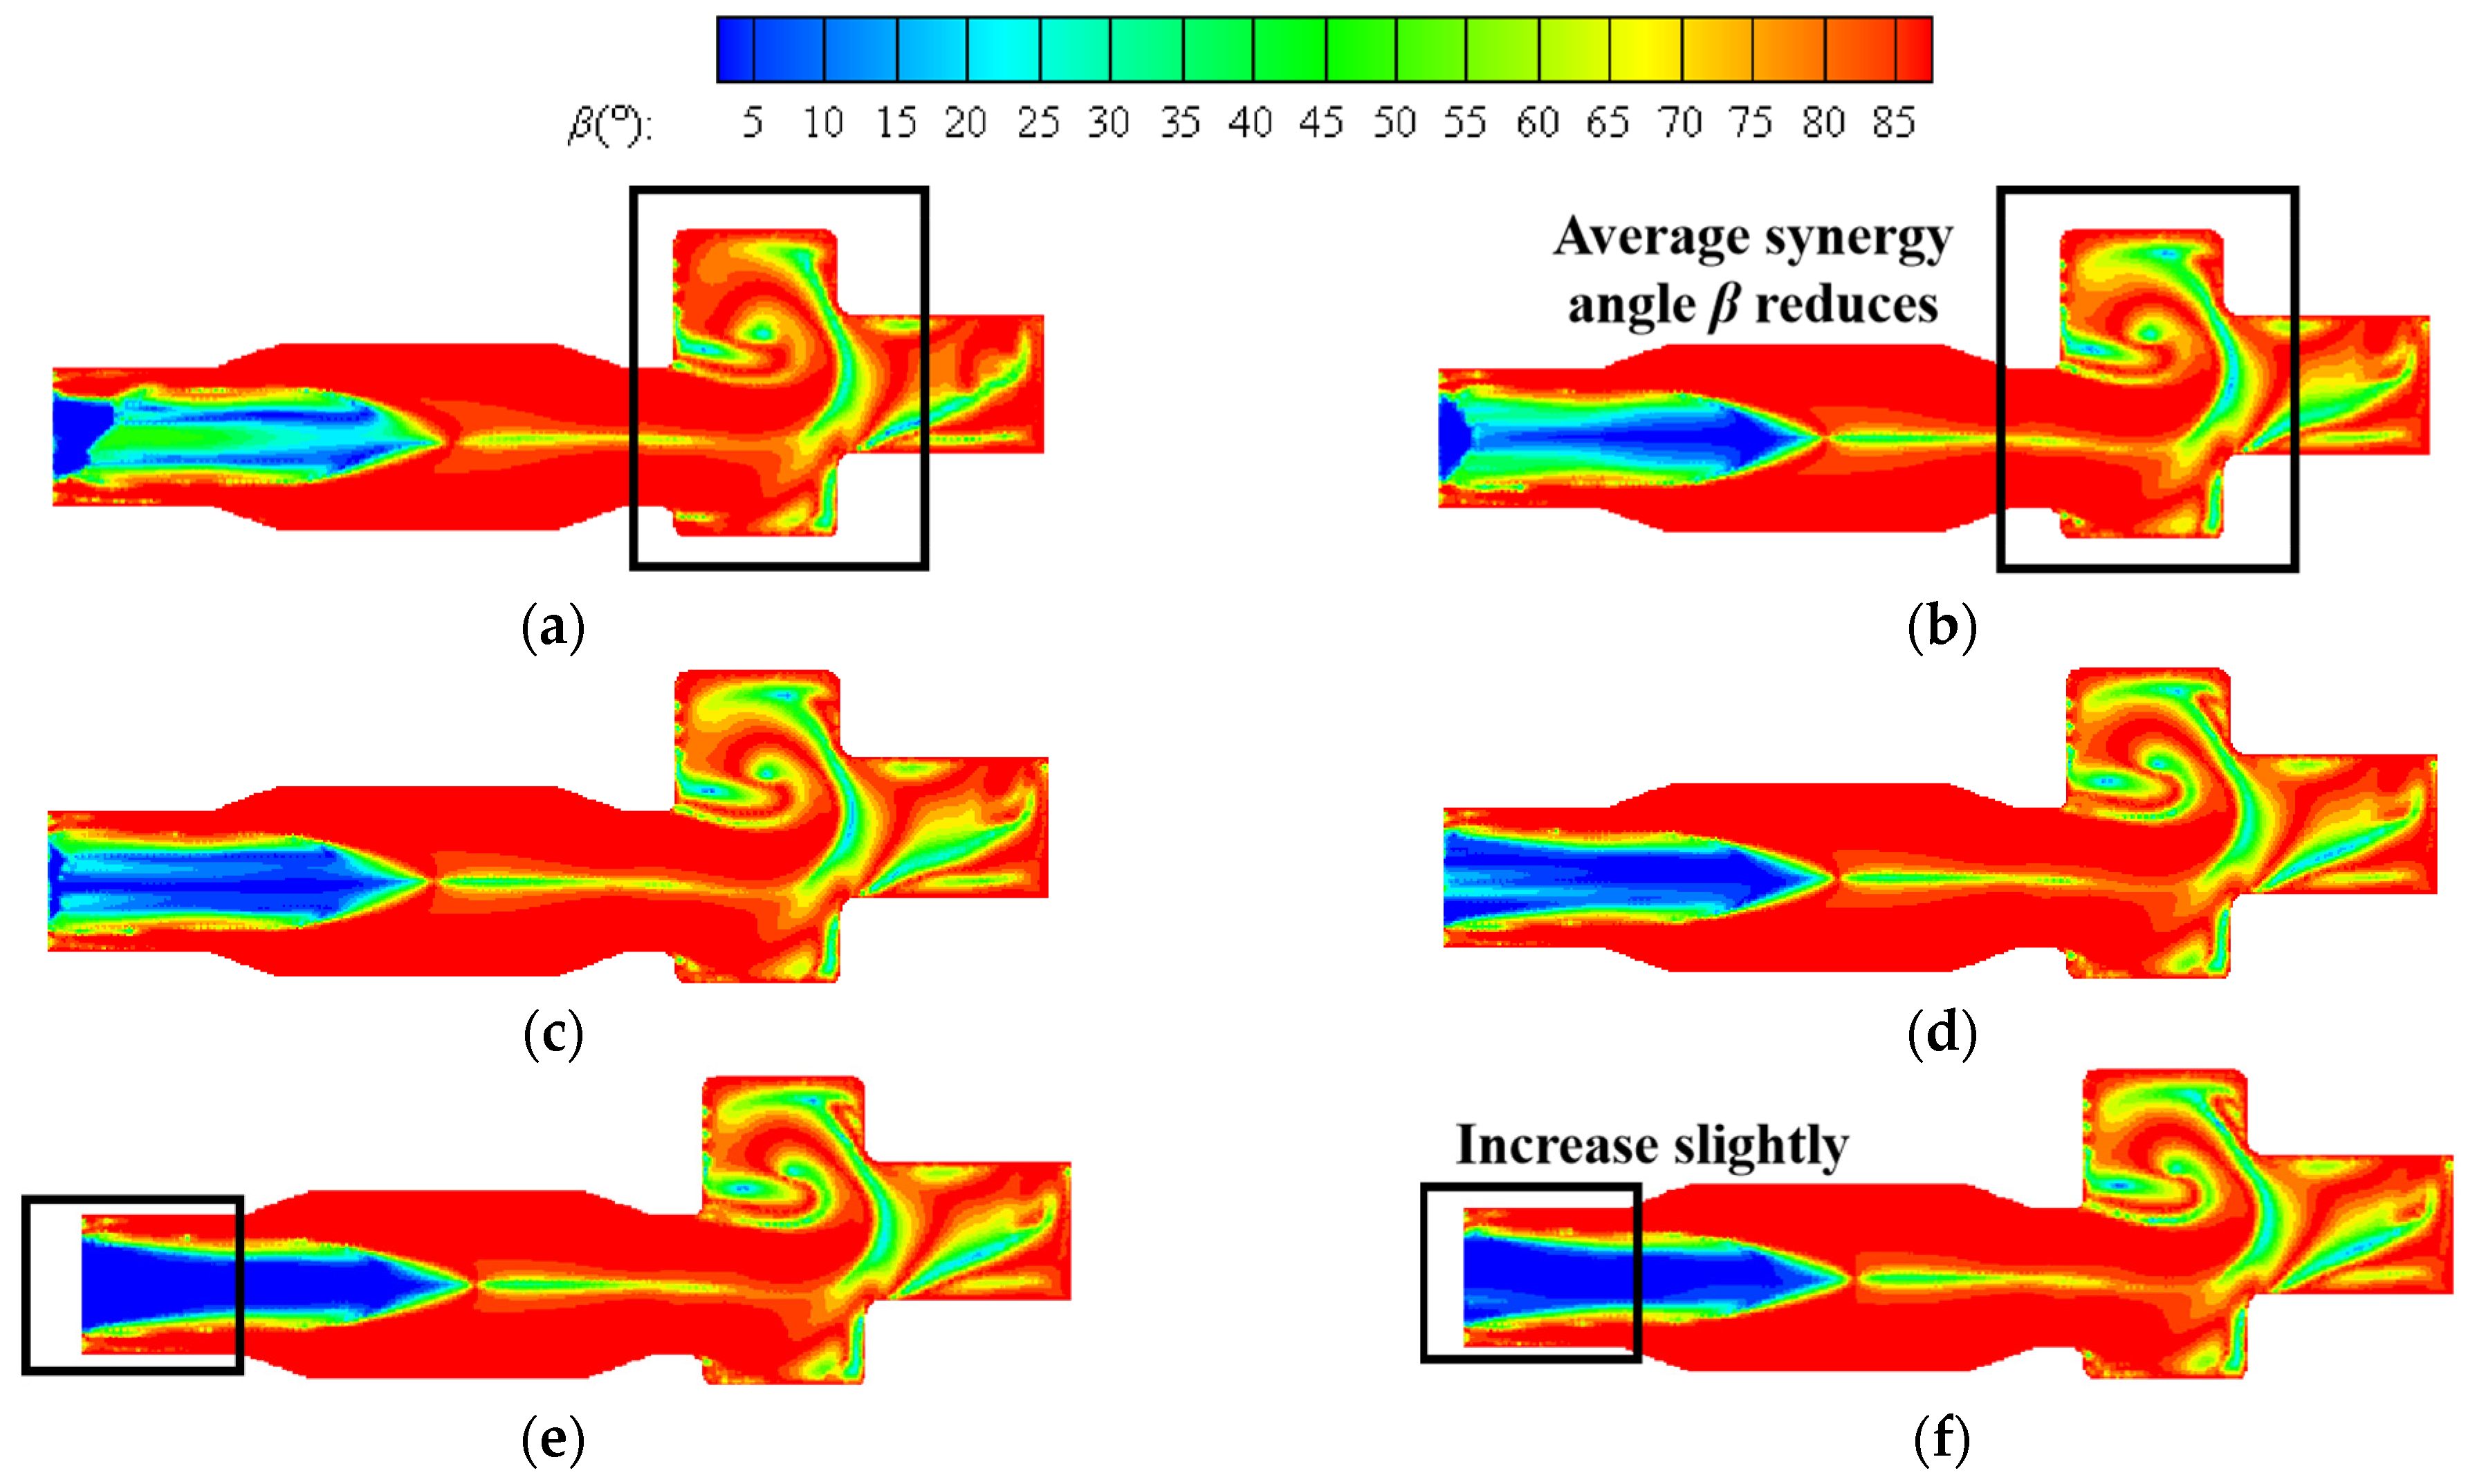
Figure 13 shows the contours of the synergy angle β at a constant volumetric flow rate. The better synergy of velocity and temperature gradient can be seen from the boiler inlet section to the central area of the furnace. As the hydrogen content increases, the region with small synergy angle β is enlarged to some extent. As can be seen from the figure, the area with small synergy angle β also appears in the reversal section, and the overall distribution of synergy angle β in this area is more complex. The reason is that the direction of the outlet is opposite to the direction of the fuel inlet, and the direction of the flue gas flow changes here, resulting in the flow field being more complex.
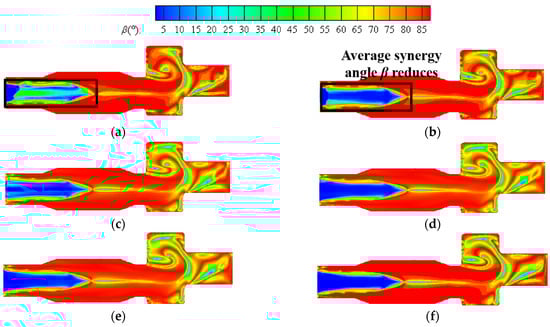
Figure 13.
Contours of synergy angle β at hydrogen addition ratios of (a) 5%, (b) 10%, (c) 15%, (d) 20%, (e) 25%, (f) 30% at constant fuel volumetric flow rate.
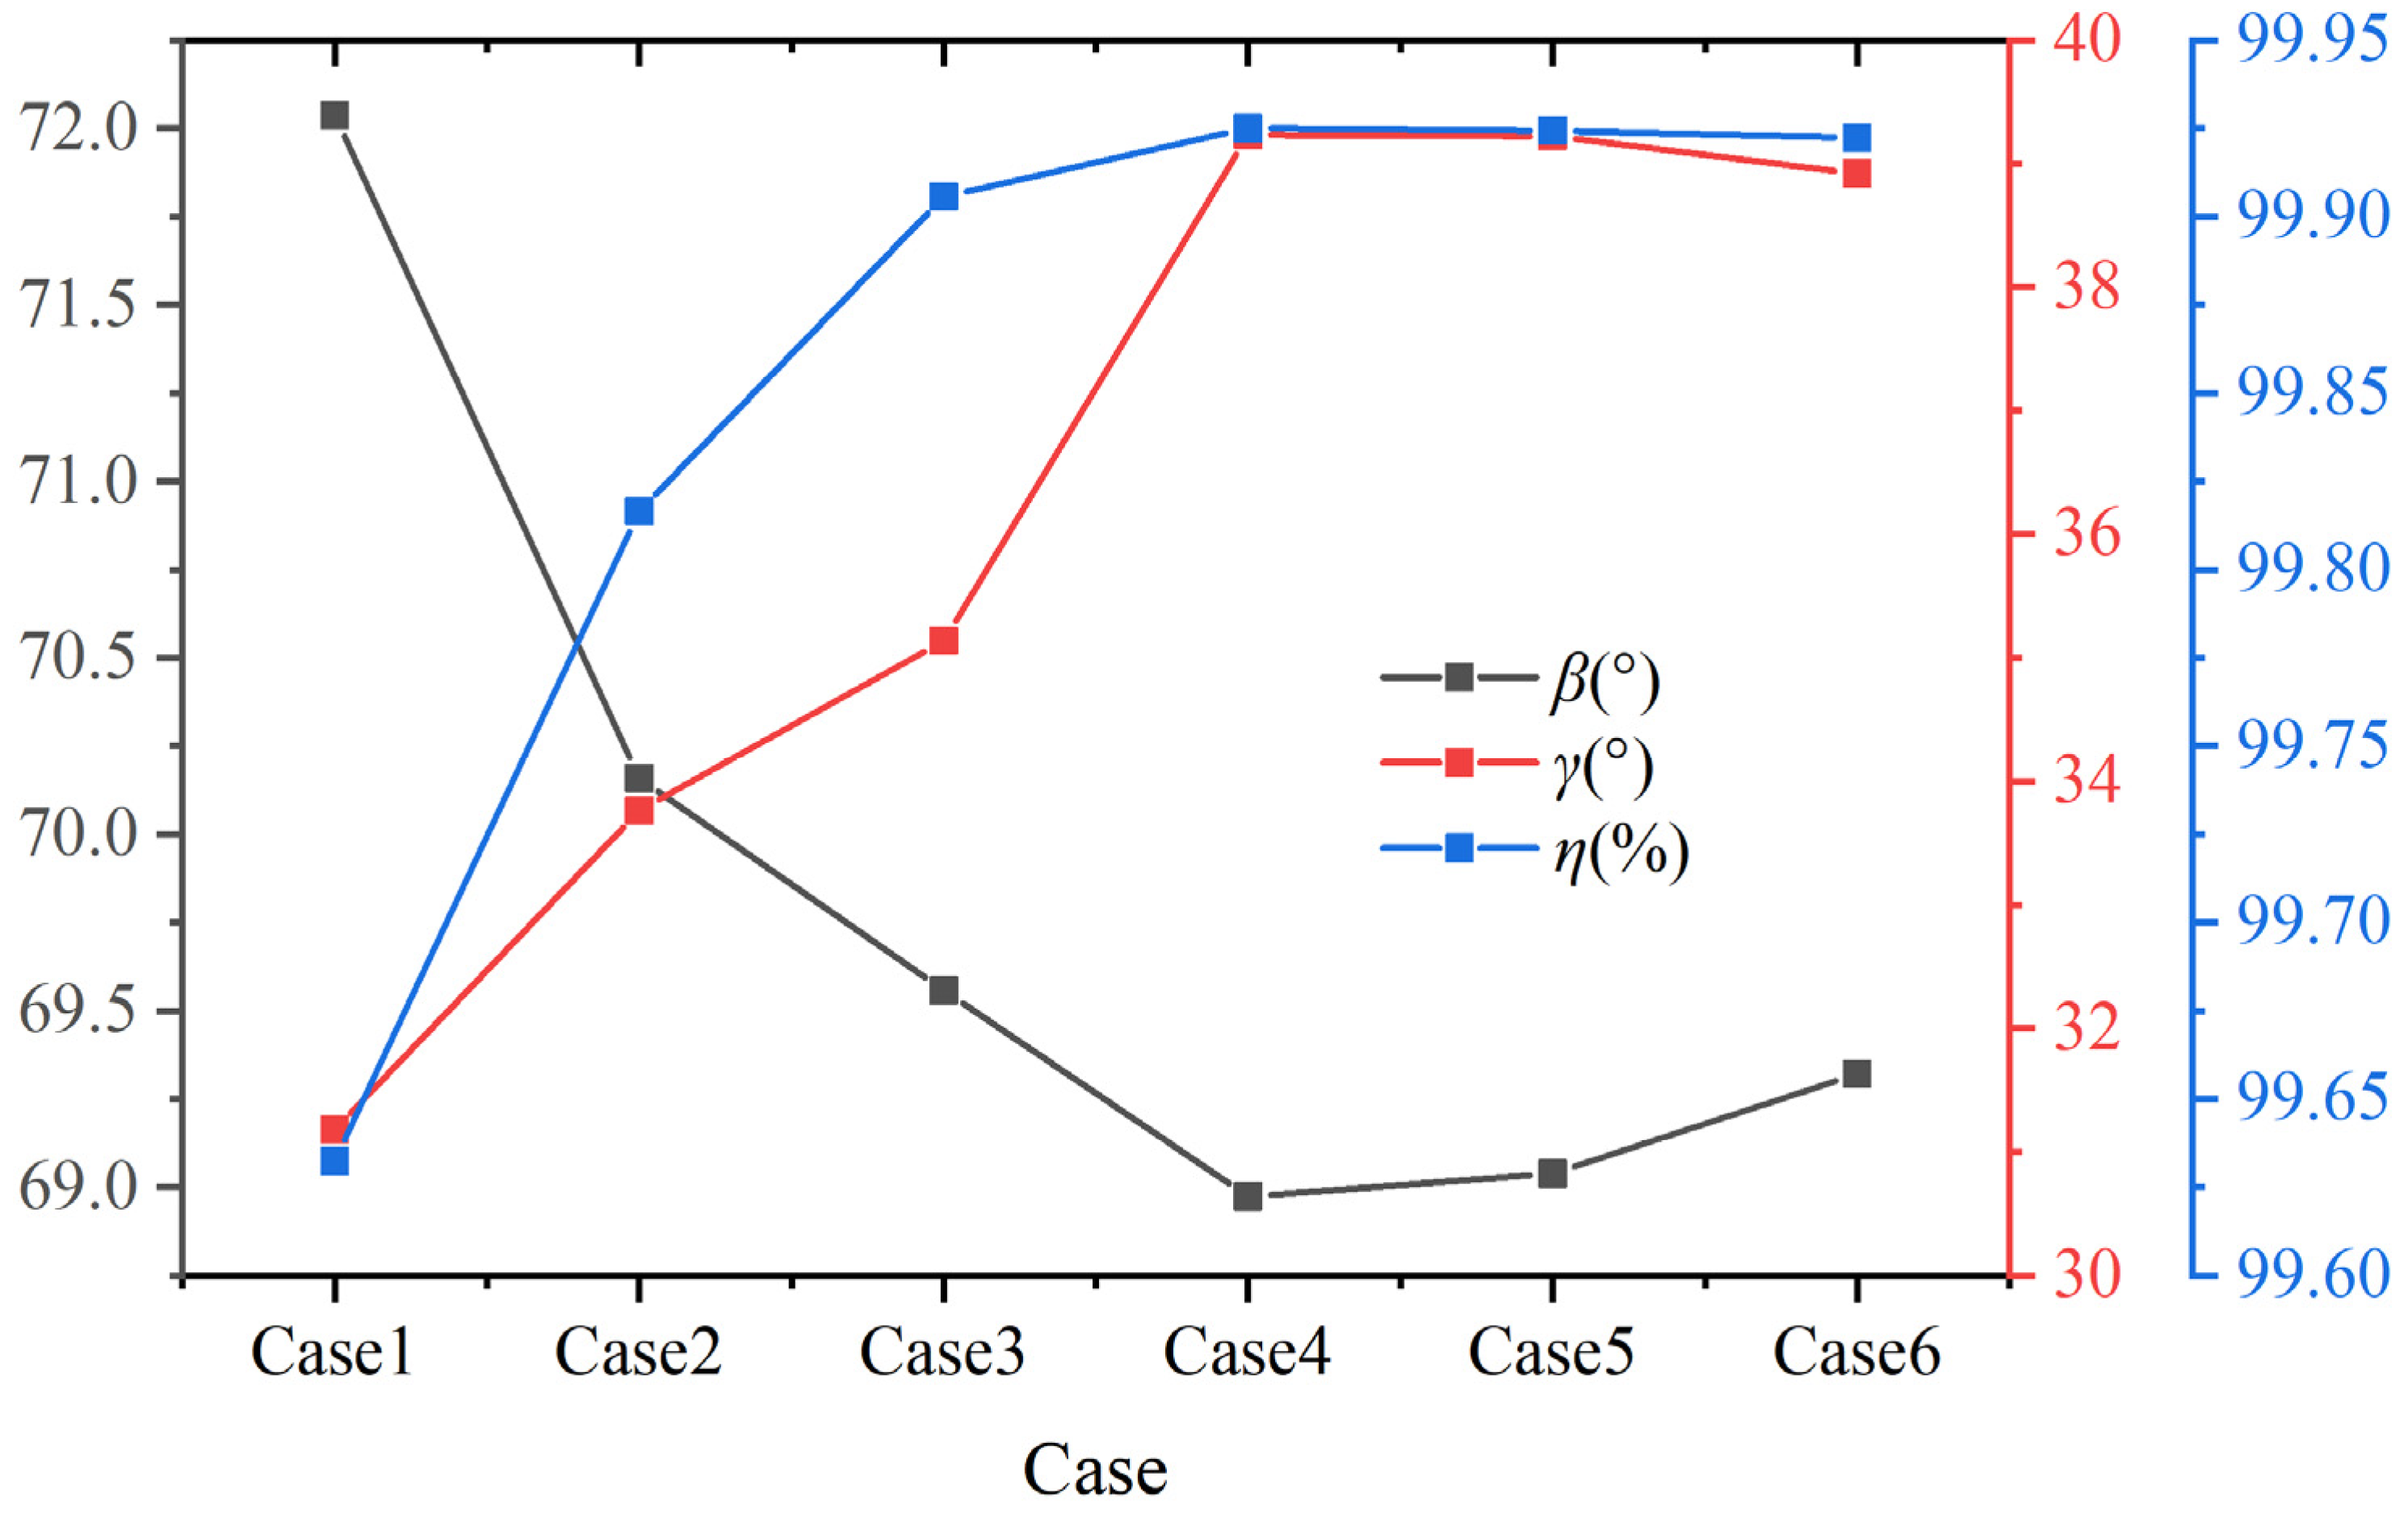
Figure 14 shows the volume average synergy angle β, γ, and the combustion efficiency η at different hydrogen contents at a constant volumetric flow rate. As shown in the figure, when the hydrogen content increases from 5% to 20%, the volume average synergy angle β shows a downward trend. When the hydrogen content is 5%, the volume average synergy angle β is approximately 72.04°. When the hydrogen content increases to 20%, the volume average synergy angle β reduces to 68.97°. When the hydrogen content is greater than 20%, the volume average β gradually increases. At a hydrogen content of 30%, the volume average synergy angle β rises to 69.32°. The heat transfer performance is better when the hydrogen content is 20%.
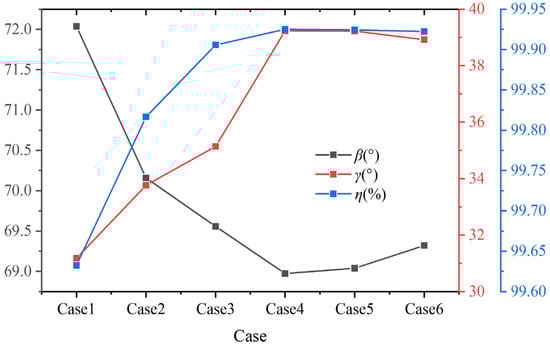
Figure 14.
Volume average synergy angle β, γ, and combustion efficiency η under different hydrogen content at constant fuel volumetric flow rate.
In addition, as shown in Figure 14, when the hydrogen content increases from 5% to 20%, the volume average synergy angle γ shows an upward trend. When the hydrogen content is 20%, the synergy angle γ is approximately 39.2°. As the hydrogen content continues to increase, the synergy angle γ gradually decreases. According to the field synergy theory, the comprehensive performance of enhanced heat transfer improves with the synergy angle γ [43]. Among the six different hydrogen addition ratios, the volume average synergy angle β of case 4 is the smallest, and the volume average synergy angle γ is the largest, which indicates the best heat transfer performance under this hydrogen addition ratio. To some extent, hydrogen addition can optimize the heat transfer performance of biomass syngas combustion, but excessive hydrogen addition may reduce the optimization effect. This result is similar to Ref. [26], as hydrogen addition within a certain range can improve the overall performance of flow resistance and heat transfer in the combustion chamber. In addition, the changing trend of combustion efficiency η is similar to synergy angle γ. The calculation formula of combustion efficiency η is given in Ref. [44].
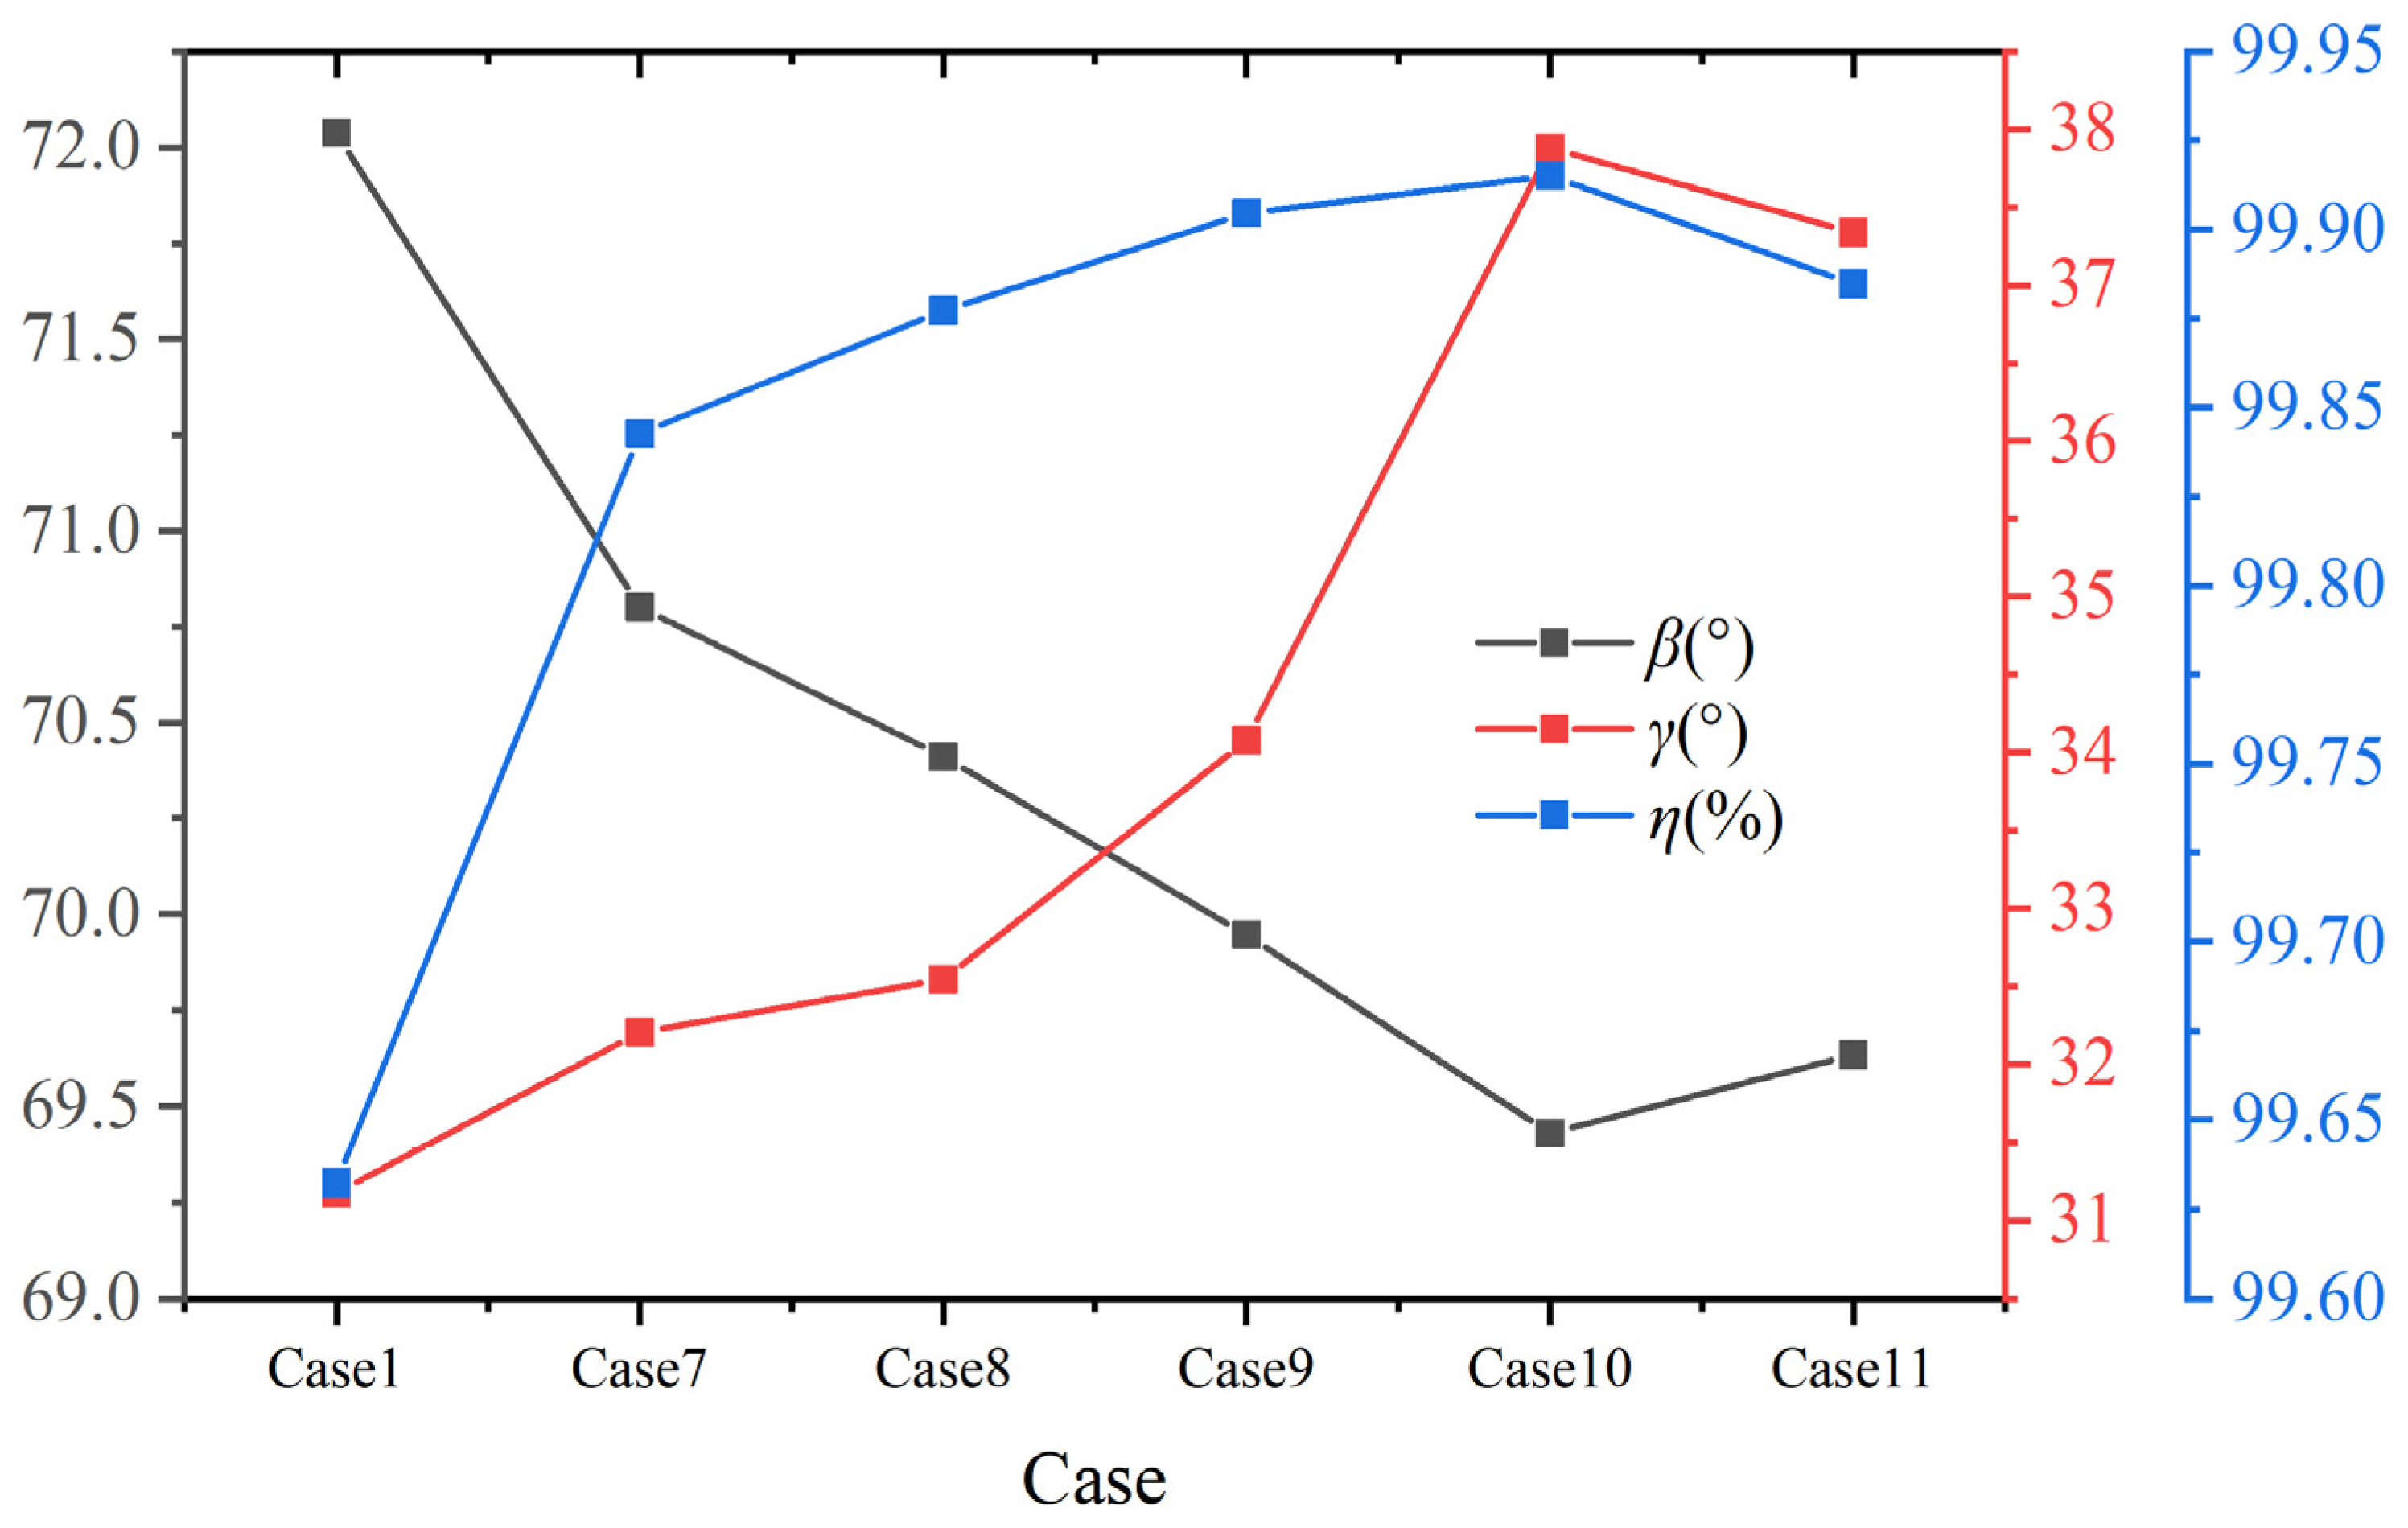
Figure 15 shows the contours of synergy angle β at six different hydrogen addition ratios in the center section of a combustion chamber at constant heat input. The distribution of contour is similar to that at a constant volumetric flow rate, and the area with good synergy is distributed from the inlet section of the boiler to the main combustion section. As the hydrogen content increases, the average synergy angle β at the inlet section significantly decreases. When the hydrogen content is 25%, the area with a smaller synergy angle at the inlet section expands to maximum, and the hydrogen content continues to increase to 30%. The average synergy angle at the inlet section slightly increases. When the hydrogen content increases from 5% to 10%, the average synergy angle β at the reversal section significantly decreases. If the hydrogen content continues to increase, the impact on heat transfer here is relatively small.

Figure 15.
Contours of synergy angle β at hydrogen addition ratios of (a) 5%, (b) 10%, (c) 15%, (d) 20%, (e) 25%, (f) 30% at constant heat input.
Figure 16 shows the volume average synergy angle β, γ, and combustion efficiency η with different hydrogen content at constant heat input. Combined with the distribution of synergy angle β in Figure 15 and Figure 16, it is evident that as the hydrogen addition ratios increase, the area with a small synergy angle β from the boiler inlet section to the center of the furnace expands significantly, indicating a great influence on the heat transfer in this area. When the hydrogen content is 25%, the volume average synergy angle β is the smallest, about 69.4°, and the synergy of velocity and temperature gradient is the best. Furthermore, as shown in Figure 16, the synergy angle γ first increases and then decreases with the increase in hydrogen content. It reaches the maximum value at 25% hydrogen content, about 37.9°, which has the best comprehensive performance for enhancing heat transfer. When hydrogen content increases from 20% to 25%, the synergy angle γ increases the most, about 11.1%. The combustion efficiency η reaches the maximum value at 25% hydrogen content. Therefore, at constant heat input, hydrogen addition improves the synergy and combustion efficiency, achieving the best results at 25% hydrogen content. However, if the hydrogen content continues to increase, the heat transfer effect weakens, and the combustion efficiency decreases.
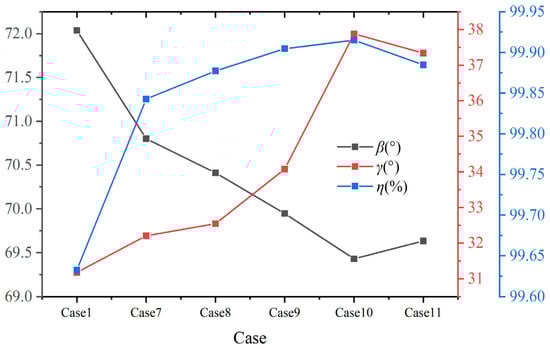
Figure 16.
Volume average synergy angle β, γ, and combustion efficiency η under different hydrogen content at constant heat input.
3.4. Pollutant Emissions
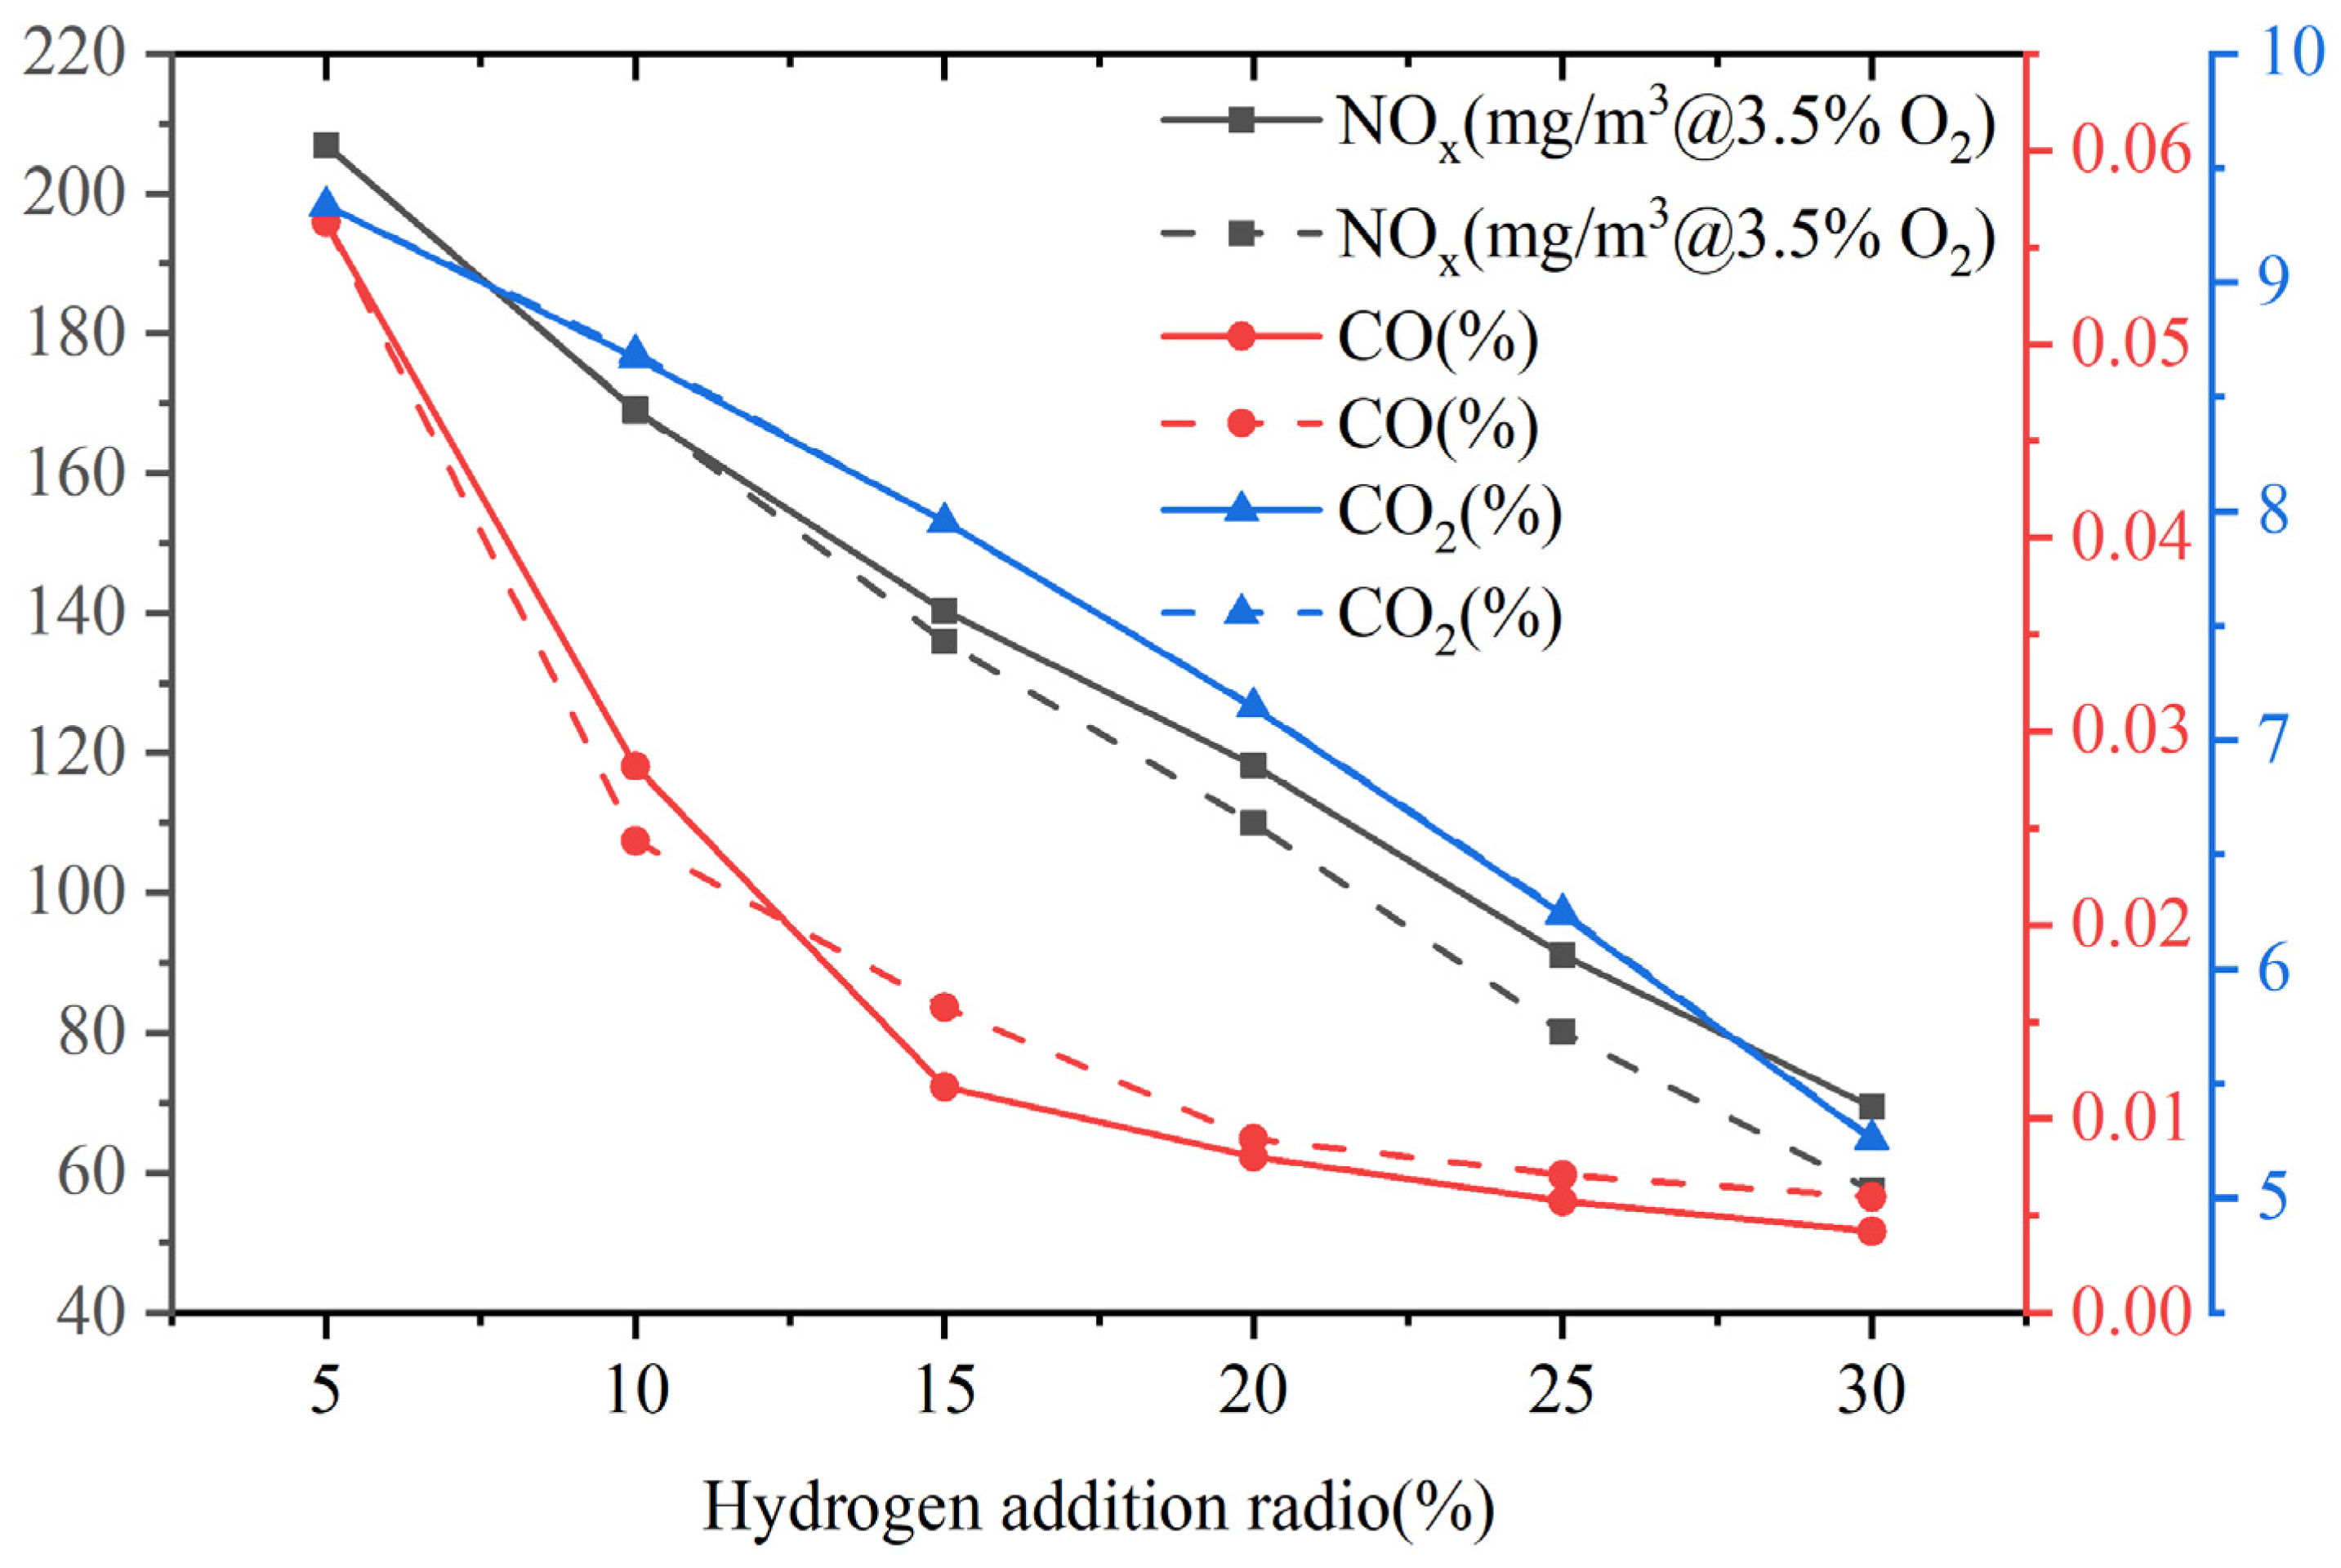
This study mainly considers thermal NOx and rapid NOx. Figure 17 shows the emissions of pollutants at the outlet of the combustor. At a constant volumetric flow rate, as the hydrogen content increases, the NOx emission decreases to a certain extent. When the hydrogen content varies from 5% to 30%, the NOx emission is reduced by 67%. There is a direct correlation between thermal NOx and temperature, and the reaction rate of thermal NOx is particularly important when the temperature is higher than 1800 K. As shown in Figure 6, due to the increase in hydrogen content, the calorific value of fuel and the combustion temperature in the boiler decrease, resulting in a decrease in NOx emission. Du et al. [45] investigated the combustion of H2/CO2/CH4 syngas in a micro gas turbine, and their results showed that the addition of carbon-free fuel (H2) effectively reduced CO emissions, and lower NOx emissions were caused by the decrease in flame temperature, which is consistent with the results of this study.
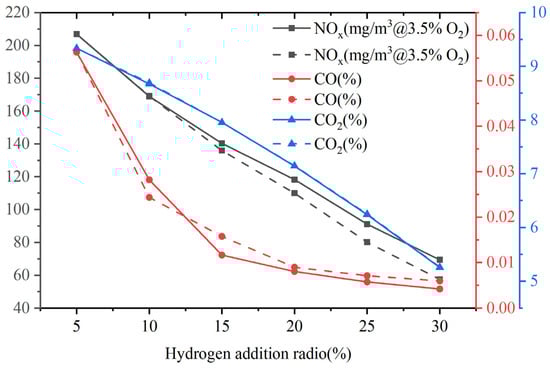
Figure 17.
Pollutant emissions at the exit of the combustor at constant fuel volumetric flow rate (solid line) and at constant heat input (dashed line).
In addition, an increase in hydrogen content leads to a decrease in carbon content in gas fuels, directly resulting in emissions of carbon compounds. Moreover, the improvement of combustion efficiency and stability in the combustion chamber makes the oxidation reaction efficiency better, reduces the generation of incomplete oxidation product CO, and also reduces the CO2 emission generated by CO oxidation. Hydrogen addition can effectively control the emissions of CO2 and CO.
Furthermore, the NOx, CO, and CO2 emissions at the outlet of the combustor at constant heat input, and the results are similar to those at a constant volumetric flow rate. The NOx, CO, and CO2 at constant volumetric flow rates all show a decreasing trend as the hydrogen content increases. The changes in CO emissions are extremely close. Li et al. [46] also found that NOx emission decreased effectively with the increase in hydrogen content. The reason is attributed to the decomposition of the hydrogen molecule providing two H atoms, which causes the reaction Equation (30) to proceed in reverse.
4. Conclusions
This study takes a certain type of horizontal biomass syngas boiler as the research object. Combined with the results of multiple physical fields, TKE, and field synergy, the effect of hydrogen addition on biomass syngas combustion and emissions is further expounded. Two scenarios are taken into consideration for fair comparison: hydrogen addition at a constant fuel volume flow rate and constant heat input. The conclusions are as follows:
- Temperature and velocity fields are significantly affected due to the addition of hydrogen. The temperature in the combustion chamber shows a decreasing trend as the hydrogen addition ratios increase and the temperature peak moves towards the inlet direction. The reduction in combustion temperature reduces the emission of thermal NOx, resulting in a significant reduction in the overall NOx emission. In addition, hydrogen addition effectively reduces the emissions of pollutants CO and CO2.
- The variation of hydrogen content significantly affects the velocity field and TKE distribution in the combustion chamber. Compared to other positions, the TKE at the position of the reversal section is greater, and the fluid instability is stronger. At a constant fuel volume flow rate, with the increase in hydrogen content, the TKE at the reversal section shows a decreasing trend, which is positively correlated with the trend of velocity changing with hydrogen content at this point. At constant heat input, the average TKE is highest at 5% hydrogen content.
- As the hydrogen content increases, the volume average synergy angle β initially decreases and subsequently increases, while the synergy angle γ and combustion efficiency first increases and then decreases. Hydrogen addition can optimize the heat transfer performance of biomass syngas combustion and improve the comprehensive heat transfer performance, but excessive hydrogen addition may reduce its positive effect. The addition of hydrogen has a slight impact on combustion efficiency, and the deviation between the maximum and minimum values does not exceed 0.3%.
Hydrogen addition can improve the comprehensive heat transfer performance and combustion efficiency of biomass syngas to a certain extent and reduce the emissions of NOx, CO, and CO2. Although this study involves a special type of boiler, the evaluation method and results of its combustion performance provide certain guidance for the efficient utilization of biomass syngas and the operation of boilers burning biomass syngas.
Author Contributions
S.S.: Conceptualization, Methodology. X.Y.: Methodology, Validation. J.L.: Investigation, Writing—original draft. X.L.: Investigation, Formal analysis. L.S.: Writing—original draft, Data Curation, and Software. J.Z.: Methodology, Writing—review and editing. Z.F.: Conceptualization, Methodology, and Supervision. Y.S.: Writing-review and editing. All authors have read and agreed to the published version of the manuscript.
Funding
This work was supported by the Gansu Provincial Science and Technology Major Program (Major Special Project-Industrial, Grant No. 22ZD11GA314). The name is “Integrated Development of Wind-Solar-Nuclear-Hydrogen-Storage Multi-energy Complementary Systems for Carbon Neutrality: Research and Demonstration of Comprehensive Innovative Technologies”.
Data Availability Statement
The original contributions presented in the study are included in the article, further inquiries can be directed to the corresponding author.
Conflicts of Interest
Authors Shengnan Suxing, Xiao Yu, Jinze Li and Xuelai Liu were employed by the company Gansu Diantong Electric Power Engineering Design Consulting Co., Ltd. The remaining authors declare that the research was conducted in the absence of any commercial or financial relationships that could be construed as a potential conflict of interest.
Correction Statement
This article has been republished with a minor correction to the Funding statement. This change does not affect the scientific content of the article.
Nomenclature
| linear-anisotropic phase function coefficient | contribution of pulsating expansion associated to the compressible turbulence, kg·m−1s−2 | ||
| specific heat capacity at constant pressure, J/(kg·K) | absorption coefficient | ||
| methane | synergy angle | ||
| carbon monoxide | density, kg/m3 | ||
| carbon dioxide | dynamic viscosity, Pa·s | ||
| strain rate of the flow | turbulent viscosity, m2s | ||
| source terms, kg·m−1s−3 | characteristic time | ||
| source terms, kg·m−1s−3 | viscous stress, Pa | ||
| volumetric stress, Pa | Stephen Boltzmann constant | ||
| incident radiation | turbulent Prandtl number of dissipation rate | ||
| turbulent kinetic energy caused by average velocity gradient, kg·m−1s−2 | turbulent Prandtl number of turbulent flow energy | ||
| hydrogen | scattering coefficient | ||
| turbulent kinetic energy, m2s−2 | combustion efficiency | ||
| mass flow, kg/s | expansion parameter | ||
| nitrogen | turbulent dissipation rate, m2s−3 | ||
| oxides of nitrogen | Levi-Civita symbol in three dimensions | ||
| pressure, Pa | thermal conductivity, W/(m·K) | ||
| heat flux density, W/m2 | characteristic length | ||
| heat effect of chemical reaction of a certain substance, J/m3 | |||
| Schmidt number | |||
| temperature, K | |||
| temperature gradient | Subscripts | ||
| velocity gradient | in | inlet | |
| velocity on the j component, m/s | out | outlet | |
| molecular kinematic viscosity, m2s | r | radiation | |
| chemical reaction rate, kg/(m3·s) | w | wall | |
References
- Wasif, M.Z.; Avik, S.; Zahoor, A.; Quande, Q.; Haider, Z.S.A. Effects of biomass energy consumption on environmental quality: The role of education and technology in Asia-Pacific Economic Cooperation countries. Renew. Sust. Energy Rev. 2021, 142, 110868. [Google Scholar]
- Boyle, G. Renewable Energy, Power for a Sustainable Future; Oxford University Press: Oxford, UK, 1996. [Google Scholar]
- Grammelis, P.; Skodras, G.; Kakaras, E. Effects of biomass co-firing with coal on ash properties. Part I: Characterisation and PSD. Fuel 2006, 85, 2310–2315. [Google Scholar] [CrossRef]
- Dasappa, S. Potential of biomass energy for electricity generation in sub-Saharan Africa. Energy Sustain. Dev. 2011, 15, 203–213. [Google Scholar] [CrossRef]
- Xiao, L.; Ha, Y.; Meng, F.; Liang, J.; Wang, P. Research and application progress on biomass gasification technologies. Mod. Chem. Ind. 2020, 40, 68–72. [Google Scholar]
- Cao, Y.; Wang, Y.; Riley, T.J.; Pan, W.P. A novel biomass air gasification process for producing tar-free higher heating value fuel gas. Fuel Process Technol. 2006, 87, 343–353. [Google Scholar] [CrossRef]
- Liu, A.; Fan, R.; Liu, Q.; Xi, L.; Zeng, W. Numerical and Experimental Study on Combustion Characteristics of Micro-Gas Turbine Biogas Combustor. Energies 2022, 15, 8302. [Google Scholar] [CrossRef]
- Hanaoka, T.; Inoue, S.; Uno, S.; Ogi, T.; Minowa, T. Effect of woody biomass components on air-steam gasification. Biomass Bioenergy 2005, 28, 69–76. [Google Scholar] [CrossRef]
- Zhang, Q.; Chen, G.; Wang, F.; Deng, H.; Wen, X. Experimental and model analyses of laminar combustion characteristics of variable composition CO/H2/CH4 mixtures at high N2 and CO2 concentrations. Int. J. Energy Res. 2020, 44, 7507–7524. [Google Scholar] [CrossRef]
- Wang, F.; Chen, Y.; Zhang, D.; Weng, X.; Zhang, A. Effect of hydrogen addition on the laminar combustion characteristics of biomass syngas. J. Saf. Environ. 2023, 23, 943–951. [Google Scholar]
- Liu, X. Study on the Chemical Reaction Mechanism of Biogas and Simulation of in Cylinder Combustion Process; Harbin Institute of Technology: Harbin, China, 2016. [Google Scholar]
- Khaleghi, M.; Hosseini, E.S.; Wahid, M. Experimental and numerical investigations of biogas vortex combustion. Proc. Inst. Mech. Eng. Part A J. Power Energy 2015, 229, 662–676. [Google Scholar] [CrossRef]
- Ilker, Y.; Yakup, C.; Bugrahan, A. Effect of N2 dilution on combustion instabilities and emissions in biogas flame. Fuel 2022, 308, 121943. [Google Scholar]
- Hu, Z.; Zhang, X. Experimental study on flame stability of biogas/hydrogen combustion. Int. J. Hydrogen Energy 2018, 44, 5607–5614. [Google Scholar] [CrossRef]
- Mordaunt, J.C.; Pierce, C.W. Design and preliminary results of an atmospheric-pressure model gas turbine combustor utilizing varying CO2 doping concentration in CH4 to emulate biogas combustion. Fuel 2014, 124, 258–268. [Google Scholar] [CrossRef]
- Xie, Y.; Qin, C.; Chen, Z.; Duan, P.; Guo, S. The impact of hydrogen addition to natural gas on flame stability. Int. J. Hydrogen Energy 2022, 47, 35851–35863. [Google Scholar] [CrossRef]
- Khare, R.; Vlavakis, P.; Von, L.T.; Loukou, A.; Khoseavi, M. Experimental investigation of the effect of hydrogen addition on the sooting limit and structure of methane/air laminar counterflow diffusion flames. Fuel 2022, 324, 124506. [Google Scholar] [CrossRef]
- Xu, C.; Wang, Q.; Li, X.; Liu, K.; Liu, W. Effect of hydrogen addition on the laminar burning velocity of n-decane/air mixtures: Experimental and numerical study. Int. J. Hydrogen Energy 2022, 47, 19263–19274. [Google Scholar] [CrossRef]
- Antonio, M.; Mario, M.; Andrea, U. Use of biogas containing CH4, H2 and CO2 in controlled auto-ignition engines to reduce NOx emissions. Fuel 2021, 301, 120925. [Google Scholar]
- Zhen, H.; Leung, C.; Cheung, C. Effects of hydrogen addition on the characteristics of a biogas diffusion flame. Int. J. Hydrogen Energy 2013, 38, 6874–6881. [Google Scholar] [CrossRef]
- Liu, Y.; Zhang, J.; Ju, D.; Huang, Z.; Han, D. Analysis of exergy losses in laminar premixed flames of methane/hydrogen blends. Int. J. Hydrogen Energy 2019, 44, 24043–24053. [Google Scholar] [CrossRef]
- Zhao, T.; Zhang, J.; Ju, D.; Huang, Z.; Han, D. Exergy losses in premixed flames of dimethyl ether and hydrogen blends. Front. Energy 2019, 13, 658–666. [Google Scholar] [CrossRef]
- China Hydrogen Energy Alliance. White Paper on China’s Hydrogen Energy and Fuel Cell Industry 2019 [EB/OL]. Available online: https://www.ligongku.com/resource/94551 (accessed on 24 May 2024).
- Sun, D.; Yan, W. Research on the Development Status and Whole Industry Chain Construction of Natural Gas Hydrogen Blended Power Generation. China Offshore Oil Gas 2023, 35, 189–197. [Google Scholar]
- Xi, X.; Tian, C.; Kuanliang, W. Effects of hydrogen addition on oblique detonations in methane–air mixtures. Int. J. Hydrogen Energy 2022, 47, 8621–8629. [Google Scholar] [CrossRef]
- Fu, Z.; Sui, L.; Lu, J.; Liu, J.; Weng, P. Investigation on effects of hydrogen addition to the thermal performance of a traditional counter-flow combustor. Energy 2023, 262, 125465. [Google Scholar] [CrossRef]
- Shih, H.; Liu, C. A computational study on the combustion of hydrogen/methane blended fuels for a micro gas turbines. Int. J. Hydrogen Energy 2014, 39, 15103–15115. [Google Scholar] [CrossRef]
- Meziane, S.; Bentebbiche, A. Numerical study of blended fuel natural gas-hydrogen combustion in rich/quench/lean combustor of a micro gas turbine. Int. J. Hydrogen Energy 2019, 44, 15610–15621. [Google Scholar] [CrossRef]
- Verma, S.; Das, L.; Kaushik, S.; Tyagi, S. An experimental investigation of exergetic performance and emission characteristics of hydrogen supplemented biogas-diesel dual fuel engine. Int. J. Hydrogen Energy 2018, 43, 2452–2468. [Google Scholar] [CrossRef]
- Porpatham, E.; Ramesh, A.; Nagalingam, B. Effect of swirl on the performance and combustion of a biogas fuelled spark ignition engine. Energy Convers. Manag. 2013, 76, 463–471. [Google Scholar] [CrossRef]
- Bora, B.J.; Saha, U.K.; Chatterjee, S.; Veer, V. Effect of compression ratio on performance, combustion and emission characteristics of a dual fuel diesel engine run on raw biogas. Energy Convers. Manag. 2014, 87, 1000–1009. [Google Scholar] [CrossRef]
- Yi, O.; Tang, K.; Yang, X.; Zou, H.; Chu, G. Evaluation of various turbulence models for numerical simulation of a multiphase system in a rotating packed bed. Comput. Fluids 2019, 194, 104296. [Google Scholar]
- Wang, Y.; Xu, Z.; Liu, J.; Zhang, A.; Xu, Z.; Meng, D.; Zhao, J. Study on flow field of electrochemical machining for large size blade. Int. J. Mech. Sci. 2021, 190, 106018. [Google Scholar] [CrossRef]
- Li, J.; Wang, D.; Zhu, D.; He, B. Analysis of the flow field in counter-rotating electrochemical machining. J. Mater. Process. Technol. 2020, 275, 116323. [Google Scholar] [CrossRef]
- Magnussen, B.F.; Hjertager, B.H. On mathematical modeling of turbulent combustion with special emphasis on soot formation and combustion. Symp. Combust. 1977, 16, 719–729. [Google Scholar] [CrossRef]
- Spalding, D.B. Mixing and chemical reaction in steady confined turbulent flames. Symp. Combust. 1971, 13, 649–657. [Google Scholar] [CrossRef]
- Magnussen, B. On the structure of turbulence and a generalized eddy dissipation concept for chemical reaction in turbulent flow. Otolaryngol.-Head Neck Surg. Off. J. Am. Acad. Otolaryngol.-Head Neck Surg. 1981, 140, 433–434. [Google Scholar]
- Fu, Z.; Gao, H.; Zeng, Z.; Liu, J.; Zhu, Q. Generation characteristics of thermal NOx in a double-swirler annular combustor under various inlet conditions. Energy 2020, 200, 117487. [Google Scholar] [CrossRef]
- Yao, P.; Zhai, Y.; Li, Z.; Shen, X.; Wang, H. Thermal performance analysis of multi-objective optimized microchannels with triangular cavity and rib based on field synergy principle. Case Stud. Therm. Eng. 2021, 25, 100963. [Google Scholar]
- Porpatham, E.; Ramesh, A.; Nagalingam, B. Effect of compression ratio on the performance and combustion of a biogas fuelled spark ignition engine. Fuel 2012, 95, 247–256. [Google Scholar] [CrossRef]
- Henriksen, U.; Ahrenfeldt, J.; Jensen, T.K.; Gobel, B.; Bentzen, J.D. The design, construction and operation of a 75 kW two-stage gasifier. Energy 2006, 31, 1542–1553. [Google Scholar] [CrossRef]
- Motyl, P.; Król, D.; Poskrobko, S.; Juszczak, M. Numerical Modelling and Experimental Verification of the Low-Emission Biomass Combustion Process in a Domestic Boiler with Flue Gas Flow around the Combustion Chamber. Energies 2020, 13, 5837. [Google Scholar] [CrossRef]
- Liu, W.; Liu, Z.; Ma, L. Application of a multi-field synergy principle in the performance evaluation of convective heat transfer enhancement in a tube. Chin. Sci. Bull. 2012, 57, 1600–1607. [Google Scholar] [CrossRef]
- E, J.; Zuo, W.; Liu, H.; Peng, Q. Field synergy analysis of the micro-cylindrical combustor with a step. Appl. Therm. Eng. 2016, 93, 83–89. [Google Scholar]
- Du Toit, M.; Engelbrecht, N.; Oelofse, S.P.; Bessarabov, D. Performance evaluation and emissions reduction of a micro gas turbine via the co-combustion of H2/CH4/CO2 fuel blends. Sustain. Energy Technol. Assess. 2020, 39, 100718. [Google Scholar] [CrossRef]
- Li, Y. Research and Numerical Simulation on the Combustion Characteristics of Biomass Gasification Gas; Zhejiang University: Hangzhou, China, 2019. [Google Scholar]


Disclaimer/Publisher’s Note: The statements, opinions and data contained in all publications are solely those of the individual author(s) and contributor(s) and not of MDPI and/or the editor(s). MDPI and/or the editor(s) disclaim responsibility for any injury to people or property resulting from any ideas, methods, instructions or products referred to in the content. |
© 2024 by the authors. Licensee MDPI, Basel, Switzerland. This article is an open access article distributed under the terms and conditions of the Creative Commons Attribution (CC BY) license (https://creativecommons.org/licenses/by/4.0/).