Abstract
High summer temperatures pose numerous challenges to the oil and gas recovery process in oil depots, including reduced adsorption tank recovery rates and decreased absorption tower desorption efficiency. This paper introduces a coupling design approach that integrates chemical process design with computational fluid dynamics simulation. The proposed approach is then utilized to investigate the optimal design and performance of the heat exchanger within the oil depot’s oil and gas recovery system. First, according to the given process design parameters, the heat exchanger is preliminary designed to determine the required heat exchange area and heat load. Based on the preliminary design results, a detailed design is carried out, resulting in the following calculations: the hot fluid has inlet and outlet temperatures of 40 °C and 29.52 °C, respectively, with an outlet flow velocity of 9.89 m/s. The cold fluid exhibits inlet and outlet temperatures of 25 °C and 26.98 °C, respectively, with an outlet flow velocity of 0.06 m/s. The specific structure and dimensions of the heat exchanger are determined, including the shell type, pipe specifications, and pipe length. Finally, CFD numerical simulation is utilized to analyze the flow field, velocity field, and pressure field within the designed heat exchanger. The calculations reveal the following findings: the hot fluid exhibited inlet and outlet temperatures of 40 °C and 29.54 °C, respectively, along with an outlet flow velocity of 9.94 m/s. On the other hand, the cold fluid shows inlet and outlet temperatures of 25 °C and 26.39 °C, respectively, with an outlet flow velocity of 0.061 m/s. The results show that the chemical process design and CFD numerical simulation results are consistent and can be mutually verified. The designed heat exchanger can efficiently cool oil and gas from 40 °C to 30 °C, and the oil and gas processing capacity can reach 870 m3/h, which is conducive to realizing the goals of energy saving, environmental protection, and safety.
1. Introduction
With the rapid development of industrialization and urbanization, fossil energy consumption has increased rapidly. Promoting energy conservation and consumption reduction can alleviate resource constraints, protect the environment, promote industrial upgrading, and meet market requirements [1]. The oil and gas volatilized by the oil in oil depots not only causes the waste of energy, but also does harm to human health and the environment [2]. Recycling and reusing volatile oil and gas can not only reduce environmental pollution and harm to the human body, but also save resources and improve resource utilization efficiency [3].
Most used oil and gas recovery devices are based on the activated carbon adsorption method [4]. Due to the high temperature in summer and the acceleration of oil volatilization, the amount of oil and gas to be recovered increases, and the original oil and gas recovery process of activated carbon adsorption coupled with gasoline spray can no longer meet the demand. In the high-temperature environment, the oil and gas recovery equipment will also be affected to some extent; for example, the adsorption performance of both the adsorbent and the spray gasoline is reduced [5], resulting in a reduction in the equipment operating efficiency, and the oil and gas recovery effect is not ideal. The high temperature in summer will also increase the difficulty of oil and gas treatment. Because the organic components contained in oil and gas are easily oxidized at high temperatures, resulting in adhesion, scaling, and other problems in the treatment process, the difficulty and cost of treatment are increased. In high-temperature environments, some harmful components in oil and gas may be volatilized, which may cause harm to the surrounding environment and human health. In addition, high temperatures may cause aging and damage to equipment, increasing security risks. Therefore, it is imperative to improve the heat transfer performance of heat exchangers to significantly lower the temperature of oil and gas prior to their entry into the adsorption tank [6]. This enhancement is crucial to strengthen the durability and optimize the efficiency of oil and fuel extraction processes [7].
A heat exchanger serves as a crucial device for transferring heat energy between solid substances and fluids or among multiple fluids, aiming to enhance energy utilization. Its extensive application spans various industries, including petrochemical, aerospace, and power energy industries, in which optimizing the structure and operating parameters of heat exchangers can significantly improve heat transfer coefficients and overall thermal performance [8]. Commonly used heat exchanger types include shell and tube, spiral plate, and plate heat exchangers. The heat transfer performance of a heat exchanger is influenced by its structural design, including the positioning of its tubes, the quantity of baffles and tubes, and the length of its tubes. A pressure drop represents a crucial constraint in the thermal design of shell and tube heat exchangers [9]. To enhance heat transfer coefficients and overall thermal performance, optimizing both the structural and operational parameters of the heat exchanger is essential. Numerous methods have been suggested and implemented to boost the heat and mass transfer efficiency in heat exchangers. These approaches involve the incorporation of rotating mechanisms, inserting tape elements, employing pulsating flow techniques, utilizing vortex generators, and implementing spiral tubing designs [10]. Over the years, the optimal design of plate-fin heat exchangers has focused on assessing the effectiveness of diverse methods for enhancing heat transfer. This involves exploring the utilization of various fin types, shapes [11], eddies, porous structures, and extended surfaces (fins or pins) to optimize heat exchanger performance. For plate heat exchangers, the flow and heat transfer characteristics have been extensively studied, mainly by optimizing the symmetry of plate heat exchangers and mixed herringbone angles to affect the heat transfer rate ratio, friction loss, and other indicators [12].
With the advancement of computer and numerical simulation technology, CFD simulation has emerged as a crucial research tool. Ahmad Aboul Khail et al. [13] employed computational fluid dynamics (CFD) to conduct a review of the numerical research and advancements in plate heat exchangers. They discussed how, during various time periods, researchers have utilized the entire heat exchanger as the computational domain for numerical simulations to achieve more comprehensive and realistic results. Furthermore, the paper outlined several techniques for validating numerical research methods and comparing results to ensure the precision of numerical simulation outcomes. Using the large eddy simulation (LES) method, Imran Afgan et al. [14] conducted an extensive numerical simulation and analysis of the crossflow of two serially arranged heated cylinders at sub-critical Reynolds numbers using the large eddy simulation (LES) method. Their study revealed crucial characteristics and patterns of the flow field topology and heat transfer mechanisms, serving as a valuable reference for deeper understanding in this field. Bhandurge et al. [15] conducted CFD simulation research on single-pass, countercurrent shell and tube heat exchangers, examining their performance at various direction angles including 0°, 15°, 30°, and 45°. Utilizing the Bell–Delaware method, they accurately estimated the heat transfer coefficient and pressure drop within the shell pass of a heat exchanger, employing a commonly employed geometric configuration. Their research delved into the heat transfer rate and pressure drop characteristics of the shell pass fluid. Mellal et al. [16] conducted a three-dimensional numerical simulation of turbulent volume flow and heat transfer on the shell side of shell and tube heat exchangers using the CFD method. Their study focused on two key parameters: baffle spacing, with values of 106.6, 80, and 64 mm, and baffle direction angles, tested at six different angles, namely 45°, 60°, 90°, 120°, 150°, and 180°. The results show that a baffle direction angle of 180° is the best at a baffle spacing of 64 mm. Li et al. [17] employed CFD simulation to investigate the flow field and heat transfer mechanisms within syngas cooling heat exchangers used in IGCC systems. They conducted three-dimensional numerical simulations, exploring various baffle configurations and operating conditions, and subsequently elucidated the impact of these factors on heat transfer and pressure drop characteristics. The results indicate that an increase in working pressure enhances heat transfer efficiency, yet it also leads to a larger pressure drop due to varying mass flow rates. Furthermore, the composition of syngas exerts a notable impact on both pressure drop and heat transfer characteristics. Iman et al. [18] analyzed the parameters of the double-tube heat exchanger through the implementation of a CFD-ANN hybrid approach, enabling a significant reduction in computational costs. Marwaan et al. [19] developed and validated a three-dimensional CFD model, leveraging experimental results to ascertain the optimal setup for a solar hot water system with an integrated collector storage intended for indirect heating. Their study focused on evaluating the impact of various parameters on the thermal performance of the system, aiming to minimize both initial and operational costs. The literature shows that CFD numerical simulation has been proved to be efficient and reliable in the field of heat exchanger optimization.
The optimization of heat exchangers primarily involves refining their structure based on specific performance types. However, there remains a scarcity of research on the optimization design of heat exchangers utilizing numerical simulation techniques. To enhance the comprehensive performance of the heat exchanger, the simulation technology coupled with chemical process design and computational fluid dynamics simulation was used to optimize the design of the shell and tube heat exchanger. Initially, the preliminary design of the heat exchanger was conducted to ascertain the necessary heat exchange area and heat load based on the provided condition parameters, encompassing the flow of cold and hot fluids, inlet and outlet temperatures and pressures, and other fundamental parameters. Then, utilizing the outcomes of the preliminary design, a detailed design was conducted to delineate the precise structure and dimensions of the heat exchanger, encompassing the shell form, pipe specifications, pipe length, pipe path, etc. Finally, the heat exchanger of the detailed design was simulated by the CFD method to study whether its performance meets the design requirements, which were compared with the detailed design.
The organization of this paper is as follows: Initially, the first section presents the studied problem. Subsequently, the second section outlines the proposed methodology, the third section takes the heat exchanger of an oil depot as a case study to illustrate the practicability of the proposed methodology, and the fourth section presents the conclusion.
2. Methodology
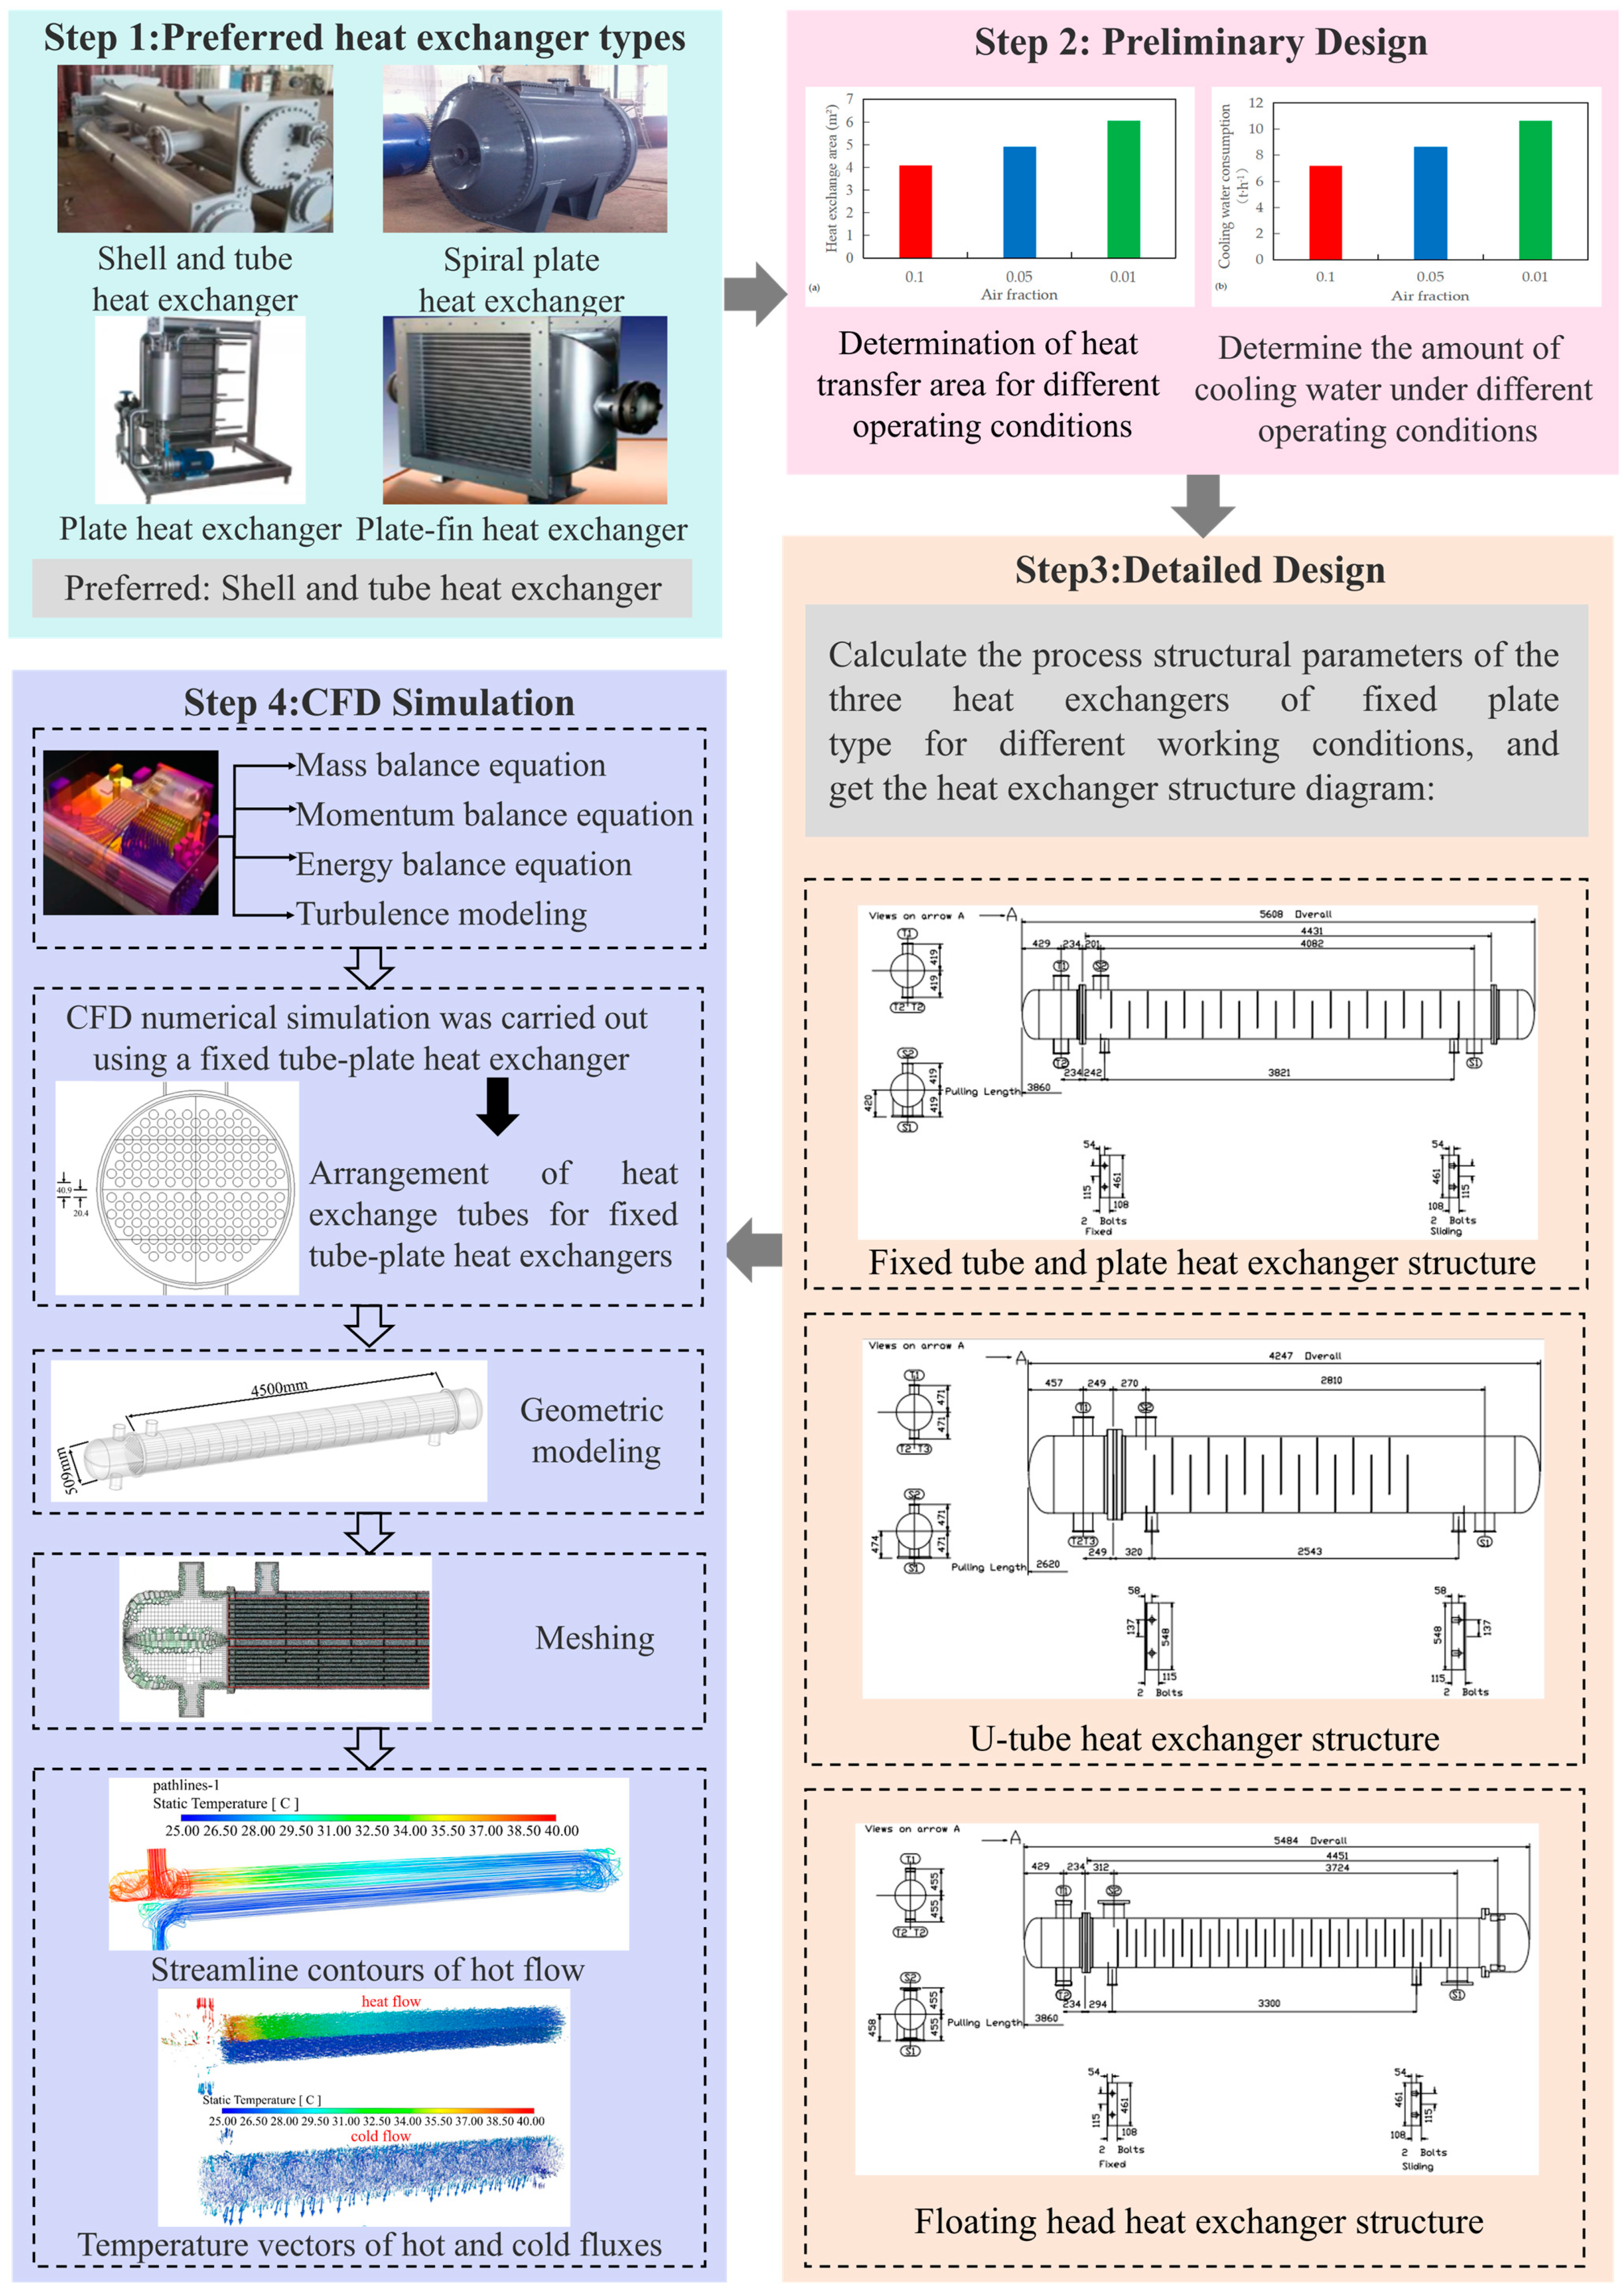
Heat exchangers come in diverse types, and the selection process must comprehensively evaluate their process performance and maintainability to ensure long-term stable operation while fulfilling usage requirements. To guarantee the heat exchanger’s performance, a thorough calculation of its size is performed, considering crucial factors like the heat transfer coefficient, fluid physical properties, and the fouling coefficient. Software calculations and simulations are utilized to ensure the precision and dependability of the design. The framework for the optimal design and performance research of heat exchangers is shown in Figure 1.

Figure 1.
Framework for optimal design and performance research of heat exchangers.
Firstly, the heat exchanger preliminaries are calculated, and the advantages and disadvantages of different heat exchanger types are compared. Subsequently, upon identifying the fundamental category of heat exchanger, a thorough optimization calculation is conducted. Ultimately, utilizing the comprehensive optimization calculation outcomes of the heat exchanger, computational fluid dynamics (CFD) modeling is used to solve the mathematical equations controlling various physical fields to check the working conditions of the heat exchanger.
2.1. Optimization of Heat Exchanger Type
Heat exchangers serve as crucial equipment for heat transfer and energy conversion [20], finding extensive applications across diverse processes such as oil refining, the chemical industry, natural gas processing, and numerous other fields. Heat exchangers can be categorized into the plate type, tube type, and other types based on the shape and configuration of their heat transfer surfaces. Common plate-type heat exchangers include spiral plate, plate, and plate-fin types, while the commonly employed tube-type heat exchanger is the shell and tube design. Other types of heat exchangers are those specifically tailored to meet unique operational requirements. Selecting the appropriate type of heat exchanger is crucial, considering the specific requirements of the production process while accounting for the respective advantages and disadvantages of different heat exchanger types. The advantages and disadvantages of these four commonly used heat exchangers are shown in Table 1.

Table 1.
Comparison of advantages and disadvantages of common heat exchangers.
Spiral plate and plate heat exchangers are suitable for a small working pressure and temperature range, and the manufacturing cost is relatively high; because of their compact structure, once damaged, the maintenance cost is also relatively high. The plate-fin heat exchanger is limited by the capacity of the brazing furnace and is not suitable for occasions with large capacity requirements. Although the shell and tube heat exchanger may not be as structurally compact or metal-efficient as the plate heat exchanger, its simplicity in design, ease of manufacturing, convenience in cleaning, and suitability for high-pressure and high-temperature environments render it a widely preferred choice in the petrochemical industry.
As a result of these analyses, three types of shell and tube heat exchangers were used in this study, namely fixed tube sheet [25], U-tube [26], and floating-head [27]. Several factors need to be paid attention to when selecting heat exchanger equipment: (1) process operating parameters, including temperature, pressure, flow, and other parameters; (2) the nature of the heat exchange medium, such as its corrosiveness and viscosity; (3) the cleaning and maintenance of the heat exchanger; and the (4) space limitations and layout requirements. Combined with the above problems, these three commonly used heat exchangers were subjected to detailed process design and calculations to ensure that the final selected heat exchanger meets the working requirements and can operate stably.
2.2. Preliminary Design
The preliminary design of a shell and tube heat exchanger determines the required heat exchange area and heat load according to the given condition parameters, including flow rates of cold and hot fluids, inlet and outlet temperature, and inlet pressure parameters.
When calculating two-phase flow, it is necessary to satisfy the energy conservation model [28], as shown in Equation (1):
The heat load is denoted by Q, W; the mass flow rate of the cold fluid is denoted by mc, kg/s; the mass flow rate of hot fluid is denoted by mh, kg/s; the constant pressure specific heat of cold fluid is denoted by cp,c, J/(kg·K); the constant pressure specific heat of hot fluid is denoted by cp,h, J/(kg·K); the inlet temperature of cold fluid is denoted by Tc,i, K; the outlet temperature of cold fluid is denoted by Tc,o, K; the inlet temperature of hot fluid is denoted by Th,i, K; the outlet temperature of hot fluid is denoted by Th,o, K.
In chemical thermodynamics, the equation of state model [29] represents the functional relationship between pressure (p), volume (V), and temperature (T), which can be used to calculate the phase equilibrium. Representative equations include the Redlich–Kwong (RK) equation, the Soave–Redlich–Kwong (SRK) equation, and the Peng–Robinson (PR) equation. The PR equation of state, as shown in Equation (2), can be used to calculate all thermodynamic properties, and reasonable results can be obtained under various temperature and pressure ranges:
The ideal gas constant, R, is assigned a value of 8.3144 J/(mol·K); p is pressure, kPa; T denotes the absolute temperature, K; V denotes the molar volume, m3; a denotes the energy parameter related to temperature; b denotes the temperature dependent volume parameter.
2.3. Detailed Design
The detailed design of a shell and tube heat exchanger is based on the heat exchange area of the heat exchanger calculated by the preliminary design, and determines the specific structure and size of the heat exchanger, including the selection of shell type, pipe specifications, pipe length, pipe number, and pipe arrangement.
Convective heat transfer, a process that facilitates the transfer of heat from a hot fluid to a cold fluid via the tube wall, takes place between the two fluids due to the existence of a temperature difference. The rate of heat transfer during this process is primarily determined by the average temperature difference between the fluids and the area available for heat transfer.
The occurrence of convective heat transfer between the cold and hot fluids, mediated by the tube wall, is attributed to the temperature disparity between them. This process enables the transfer of heat from the hotter fluid to the colder one through the wall of the tube. During the heat transfer process, the rate of heat transfer depends on the size of the heat transfer area and the mean temperature difference between the two fluids. The mathematical model is shown in Equation (3):
The heat transfer rate or heat load is denoted by Q, W; the overall heat transfer coefficient is denoted by K, W/(m2·K); the heat exchanger area is denoted by A, m2; the mean temperature difference between cold and hot fluids is denoted by Δtm, K; the logarithmic mean temperature difference is denoted by Δtm′, which characterizes the heat transfer between cold and hot fluids, K; FT is a correction factor used to account for the logarithmic mean temperature difference.
During the operation of the heat exchanger, deposits tend to accumulate on the oil side, while scale formation is more prone to occur on the water side. These accumulations can have significant effects on heat transfer efficiency and flow resistance. The fouling generation rate is mainly affected by the flow velocity. When the flow velocity is greater than 3 m/s, the fouling thermal resistance increase rate is almost 0 [30]. The fouling coefficient values used in the detailed design are shown in Table 2.
Table 2.
Partial fouling coefficient values.
The area margin, a metric that quantifies the extent of the heat exchanger’s rich area, typically necessitates a value exceeding 20% for condensers. The area margin is calculated according to Equation (4).
The area margin is denoted by Am, and the actual surface area of the heat exchanger is denoted by Ao, measured in square meters. The heat transfer area required for calculations is denoted by Areq, also expressed in square meters. This area is dependent on the heat transfer process and the logarithmic mean temperature difference.
2.4. CFD Numerical Simulation
The structural parameters of the heat exchanger can be obtained through preliminary and detailed design. Then, CFD numerical simulation can be carried out to analyze the operational performance of these structural parameters under various operating conditions.
(1) Mass conservation equation
The mass conservation formula [31] of the medium in the heat exchanger is:
ρ denotes the fluid density, kg/m3. τ represents the duration, expressed in seconds. w is the fluid velocity, m/s. Lastly, x serves as a one-dimensional coordinate, quantified in meters.
(2) Momentum conservation equation
The law of conservation of momentum is Newton’s second law [32], which can be expressed by Equation (6):
where represents the velocity in the direction , m/s, ; represents the mass force in the direction , N.
(3) Energy conservation equation
The equation includes , which denotes heat conduction, , which signifies the diffusion flux of substance , and , which represents the heat source. The three initial terms on the equation’s right-hand side correspond to the transfer of energy resulting from conduction, material diffusion, and viscous dissipation, respectively [33].
In the conservation of energy formula, E can be defined as:
Here the sensible heat enthalpy h of an incompressible flow can be defined as:
where represents the mass fraction of substance , and can be expressed as:
(4) Turbulence model
The RNG k-ε model allows for the calculation of turbulent kinetic energy (k) and dissipation rate (ε) using Equations (11) and (12) [34]:
In Equations (11) and (12), various factors are taken into account to determine turbulent kinetic energy and dissipation rate. represents the kinetic energy generated by buoyancy effects, while accounts for the kinetic energy produced by the mean velocity gradient. Additionally, considers the impact of compressible turbulent pulsation expansion on the overall dissipation rate. The coefficients and represent the inverse Prandtl numbers for and , respectively. Finally, and serve as source terms, and , and represent constants.
In addition, the turbulent viscosity can be obtained by and :
3. Case Study
Utilizing the aforementioned heat exchanger optimization design method, this section takes an oil depot’s heat exchanger as an example. The results of preliminary design and detailed design are presented. Then, CFD simulation is used to verify whether the detailed design results can meet the requirements under the design conditions.
3.1. Basic Data
According to the field conditions of the oil depot, the heat exchange device utilizes gasoline steam as the heat flow and water as the cold flow. The input and output parameters for both the cold and hot fluids are outlined in Table 3. Table 4 lists the gasoline components with a volume fraction of 0.01 or higher. The standard volume fractions of air are 0.1, 0.05, and 0.01. Additionally, the dimensions of the heat exchanger should not exceed 1.2 m by 6 m.
Table 3.
Design process parameters of hot and cold fluids.
Table 4.
Components of gasoline.
3.2. Preliminary Design
Considering the corrosion and scaling factors, the cooling water flows on one side of the shell and the thermal fluid circulates on one side of the pipe. The calculation results are shown in Figure 2.
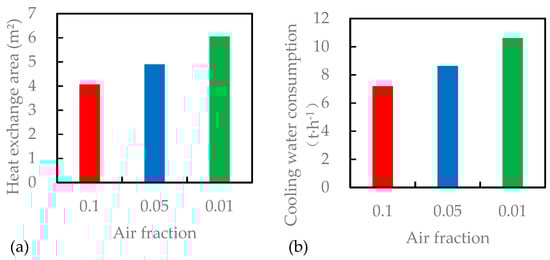
Figure 2.
Preliminary design calculation results under different working conditions: (a) heat exchange area, (b) cooling water consumption.
Figure 2a,b show that as the air volume fraction diminishes, the heat exchange area of the heat exchanger enlarges, accompanied by a concurrent rise in cooling water utilization. This is due to the fact that as the air fraction decreases, the ratio of oil to gas rises, so the heat exchange area must be enlarged and the cooling water increased to meet the increased heat demand. The results show that when the air volume fraction is 0.01, the heat exchange area and cooling water consumption of the heat exchanger are the largest, which are 6.06 m2 and 10.62 t/h. Therefore, a detailed design is conducted for the operating condition with an air volume fraction of 0.01.
3.3. Detailed Design
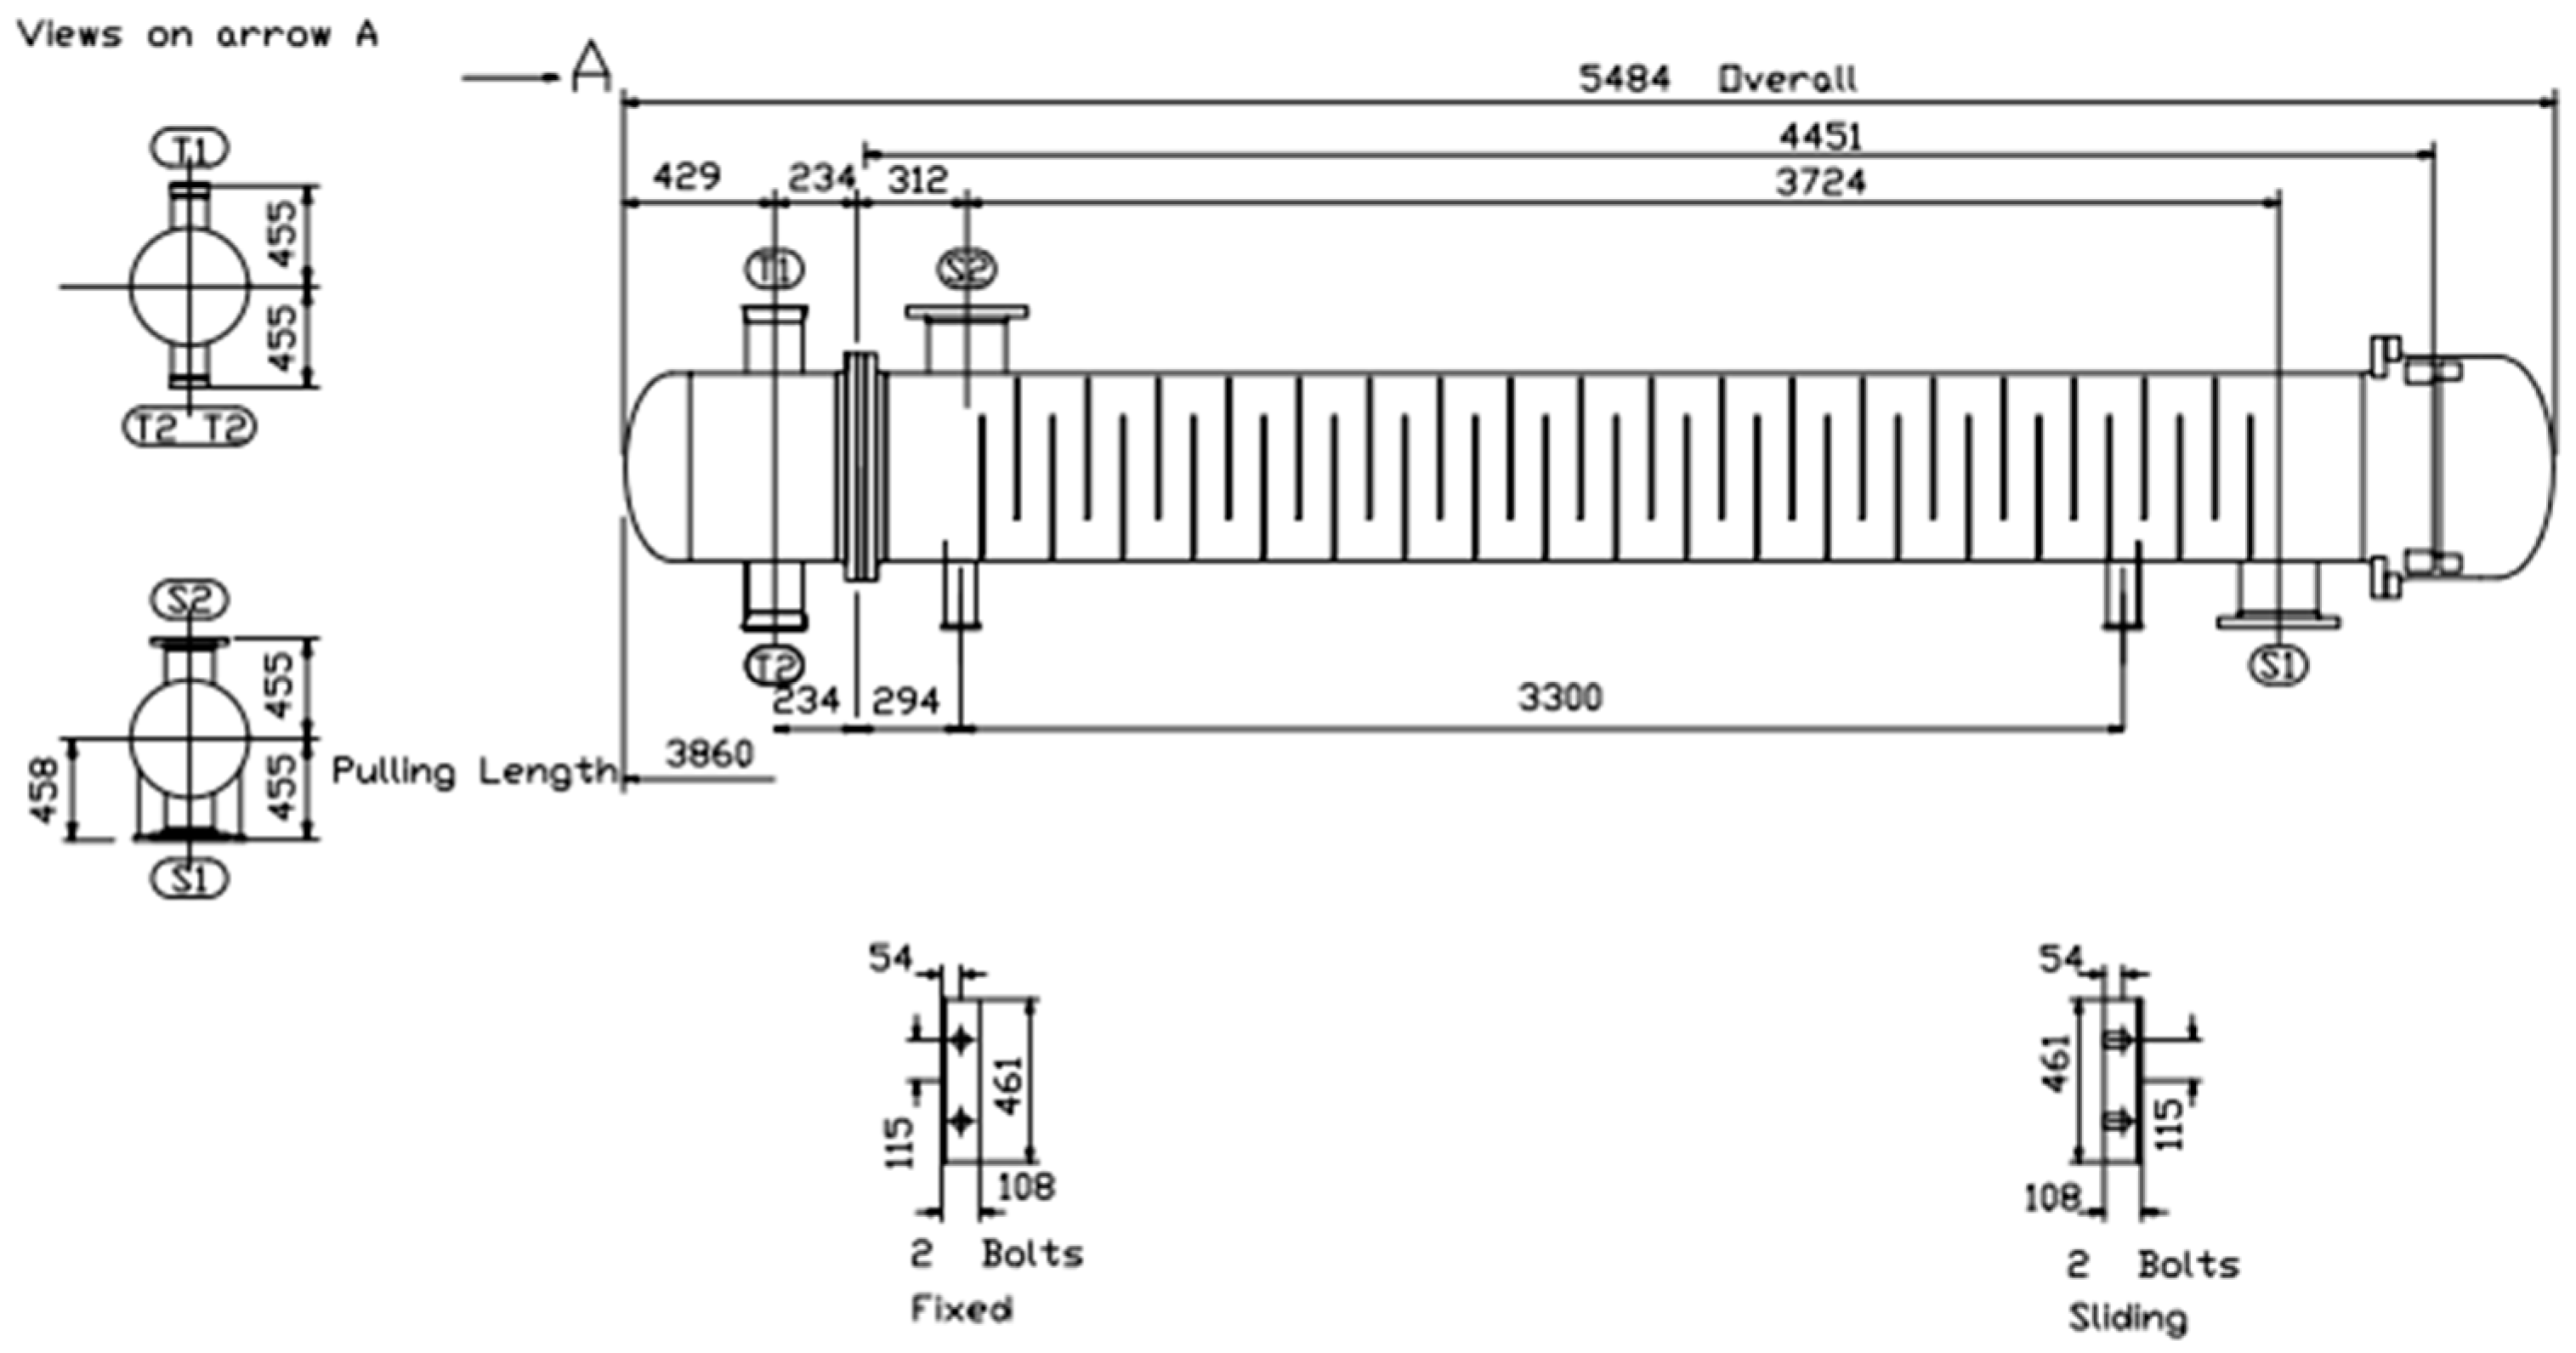
The volume flow rate is 870 m3/h, the pressure is normal pressure, the temperature is 40 °C, the standard volume fraction of the mixed air is 0.01, the heat exchange area of the heat exchanger is 6.06 m2, and the cooling water is 10.62 t/h. For these selected working conditions, the detailed design of fixed tube sheet, U-tube and floating-head heat exchangers was carried out to obtain the process structure parameters.
During the detailed design process, the flow velocity, pressure, and vibration should be verified. The design adheres to the same physical property parameters, utilizes various heat exchanger types, and evaluates the scheme based on the following principles: (1) The heat exchange area of each type of heat exchanger meets the specified requirements. (2) The overall size complies with the 1.2 × 6 m installation site requirement. (3) The mean flow velocity of the pipe and shell side falls within the range of accumulated experience data from industrial production. (4) Based on experience values, the total heat transfer coefficient falls within the anticipated range, and no vibration concerns are observed. Table 5 presents the process structure parameters obtained for three distinct types of heat exchanger.
Table 5.
Process structure parameters of three types of heat exchangers.
The designs of the three distinct heat exchangers are individually depicted in Figure 3, Figure 4 and Figure 5. The cleaning of U-tube heat exchangers is challenging due to the presence of elbows in the heat exchange tubes. Cleaning a floating-head heat exchanger requires removal of the heads at both ends, resulting in high cleaning costs. In contrast, fixed tube sheet heat exchangers are characterized by their simple structure, cost-effectiveness, and compact size. Therefore, this study ultimately adopts the use of fixed tube sheet heat exchangers.
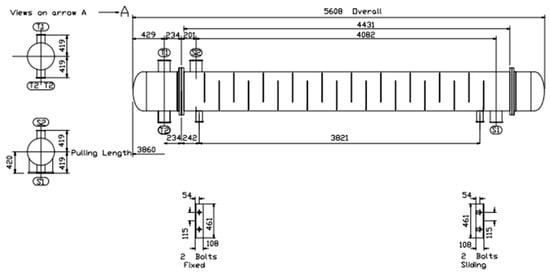
Figure 3.
Structure of fixed tube sheet heat exchanger.
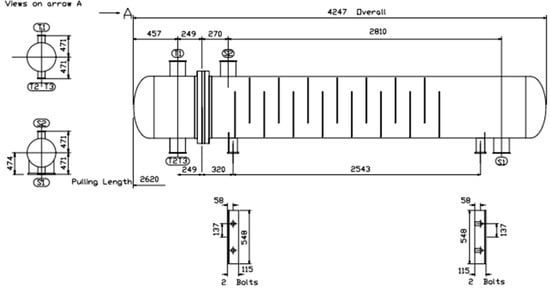
Figure 4.
Structure of U-tube heat exchanger.
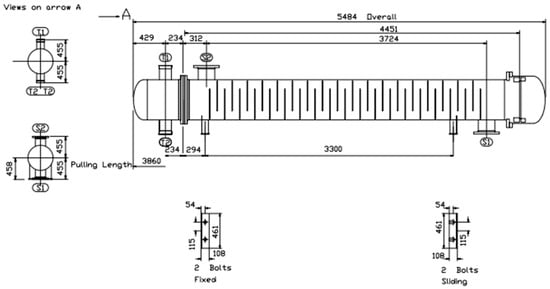
Figure 5.
Structure of floating-head heat exchanger.
3.4. CFD Simulation
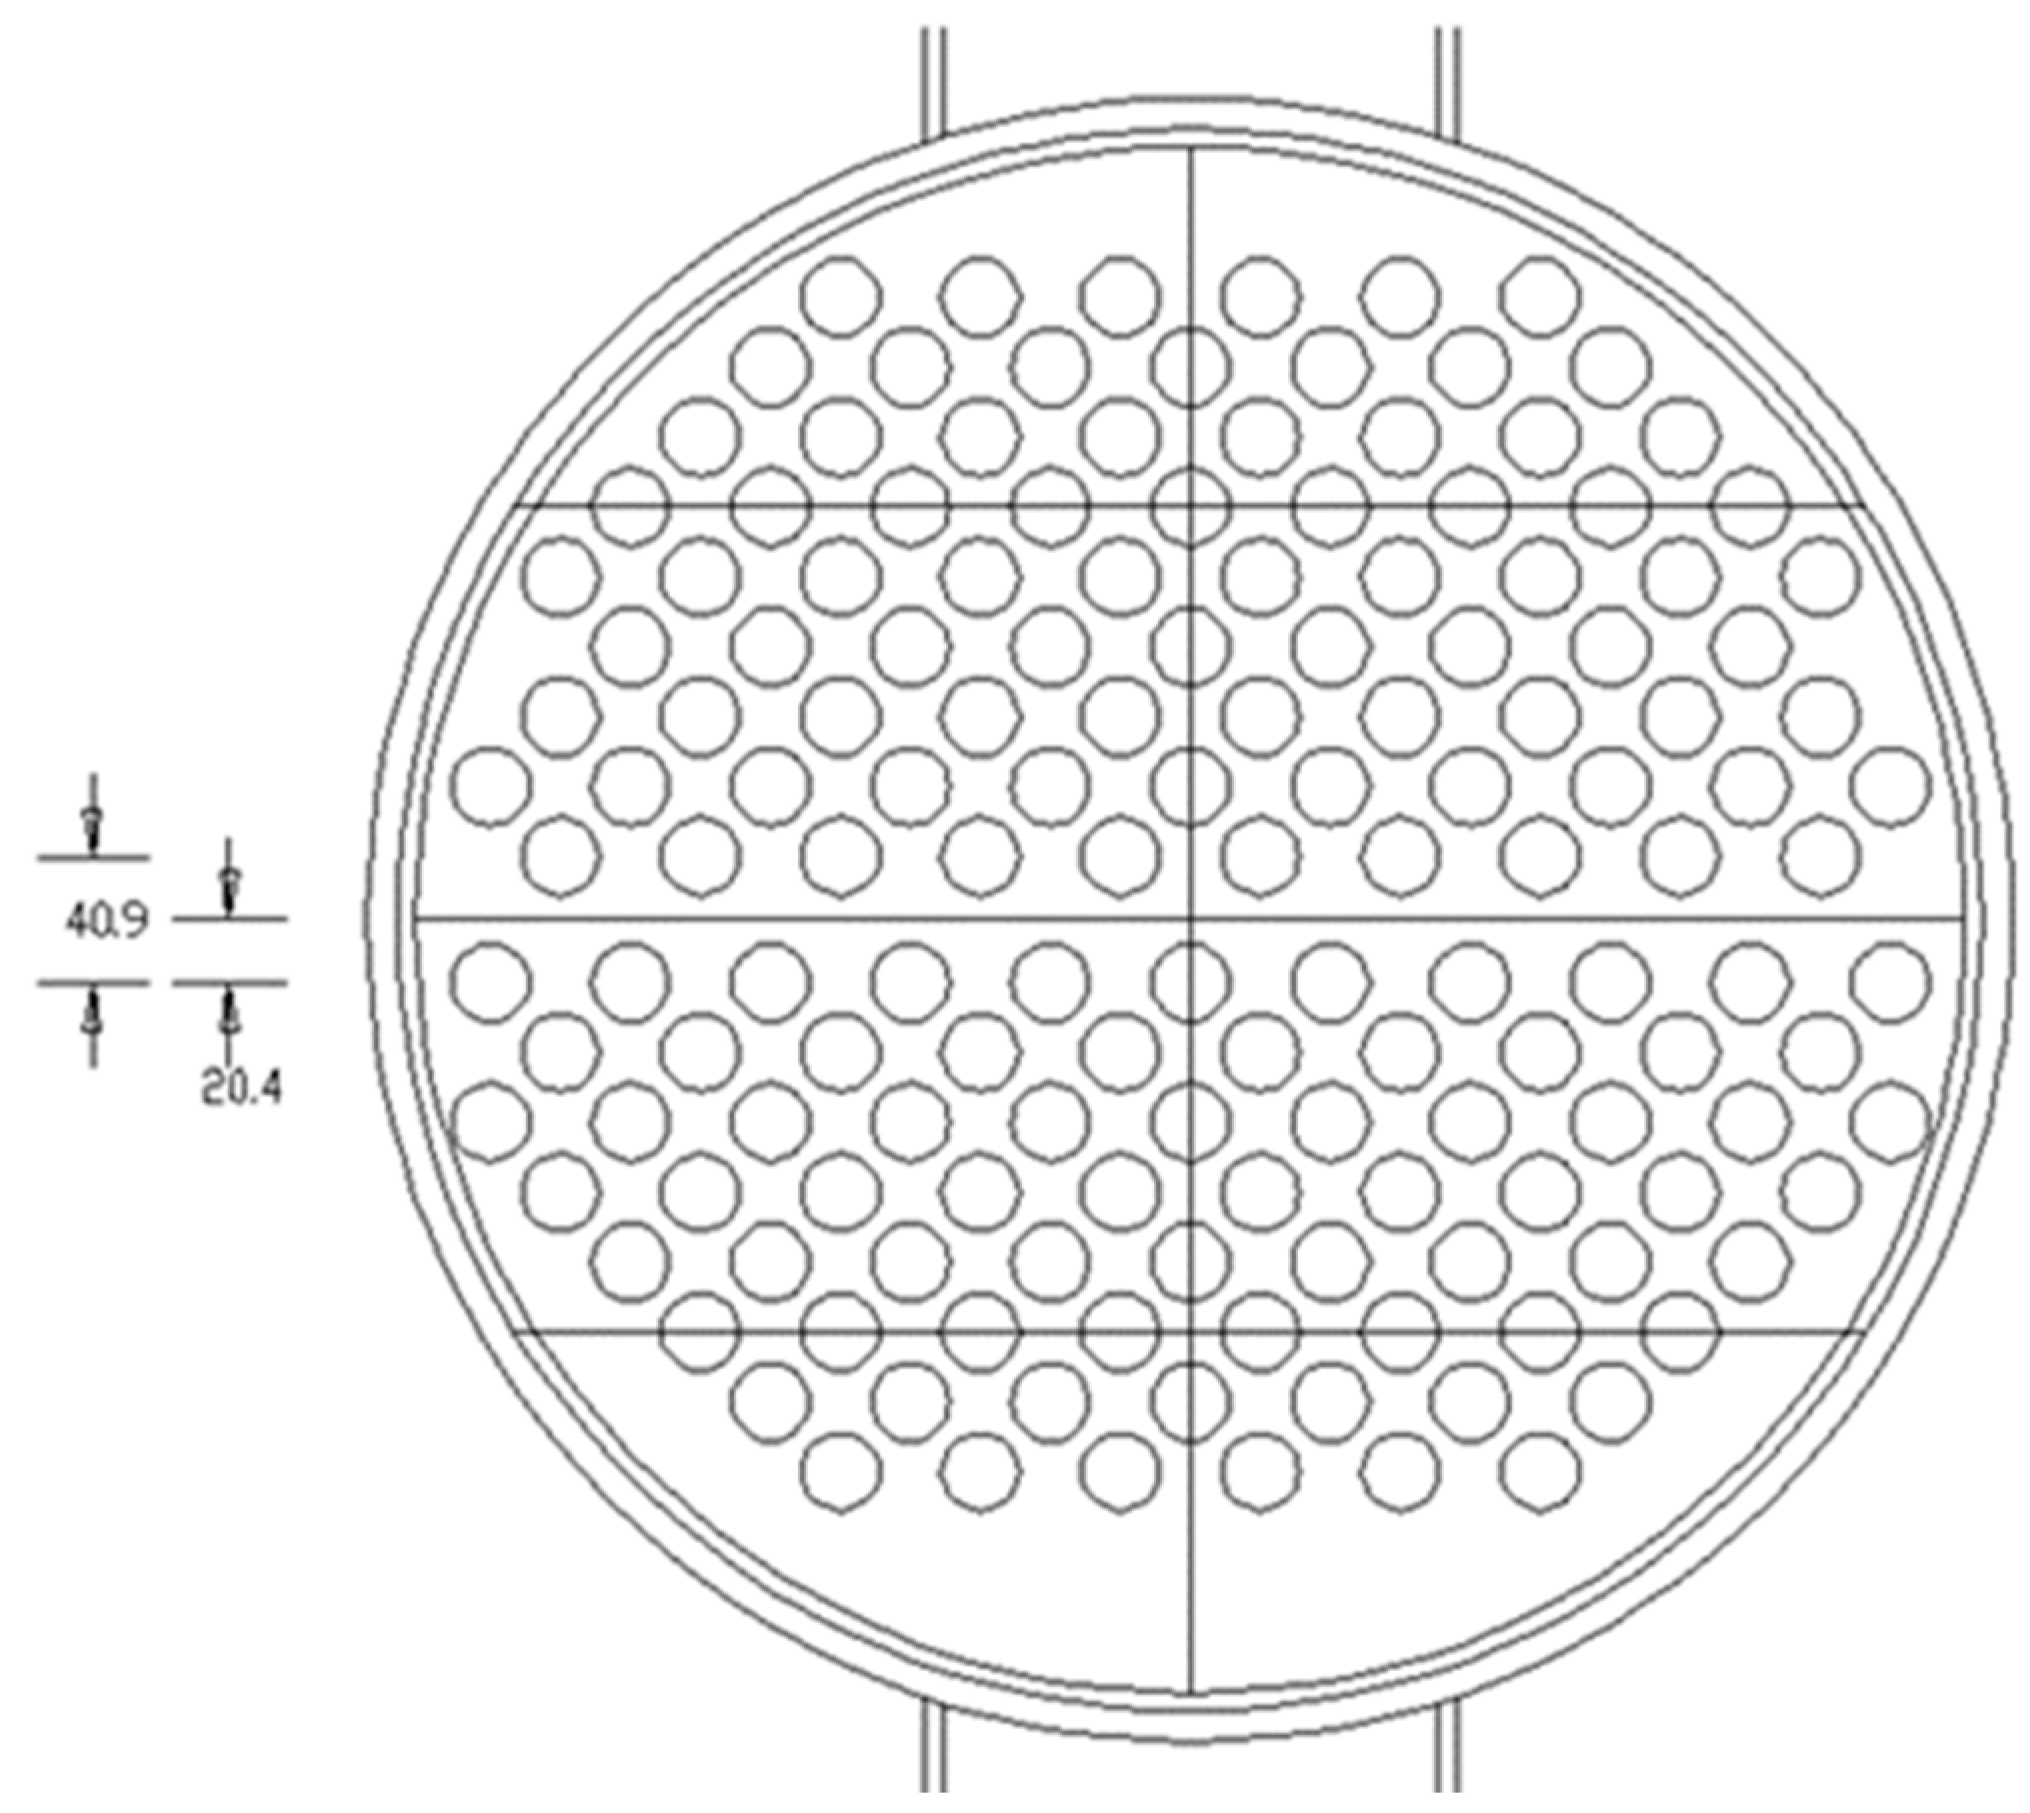
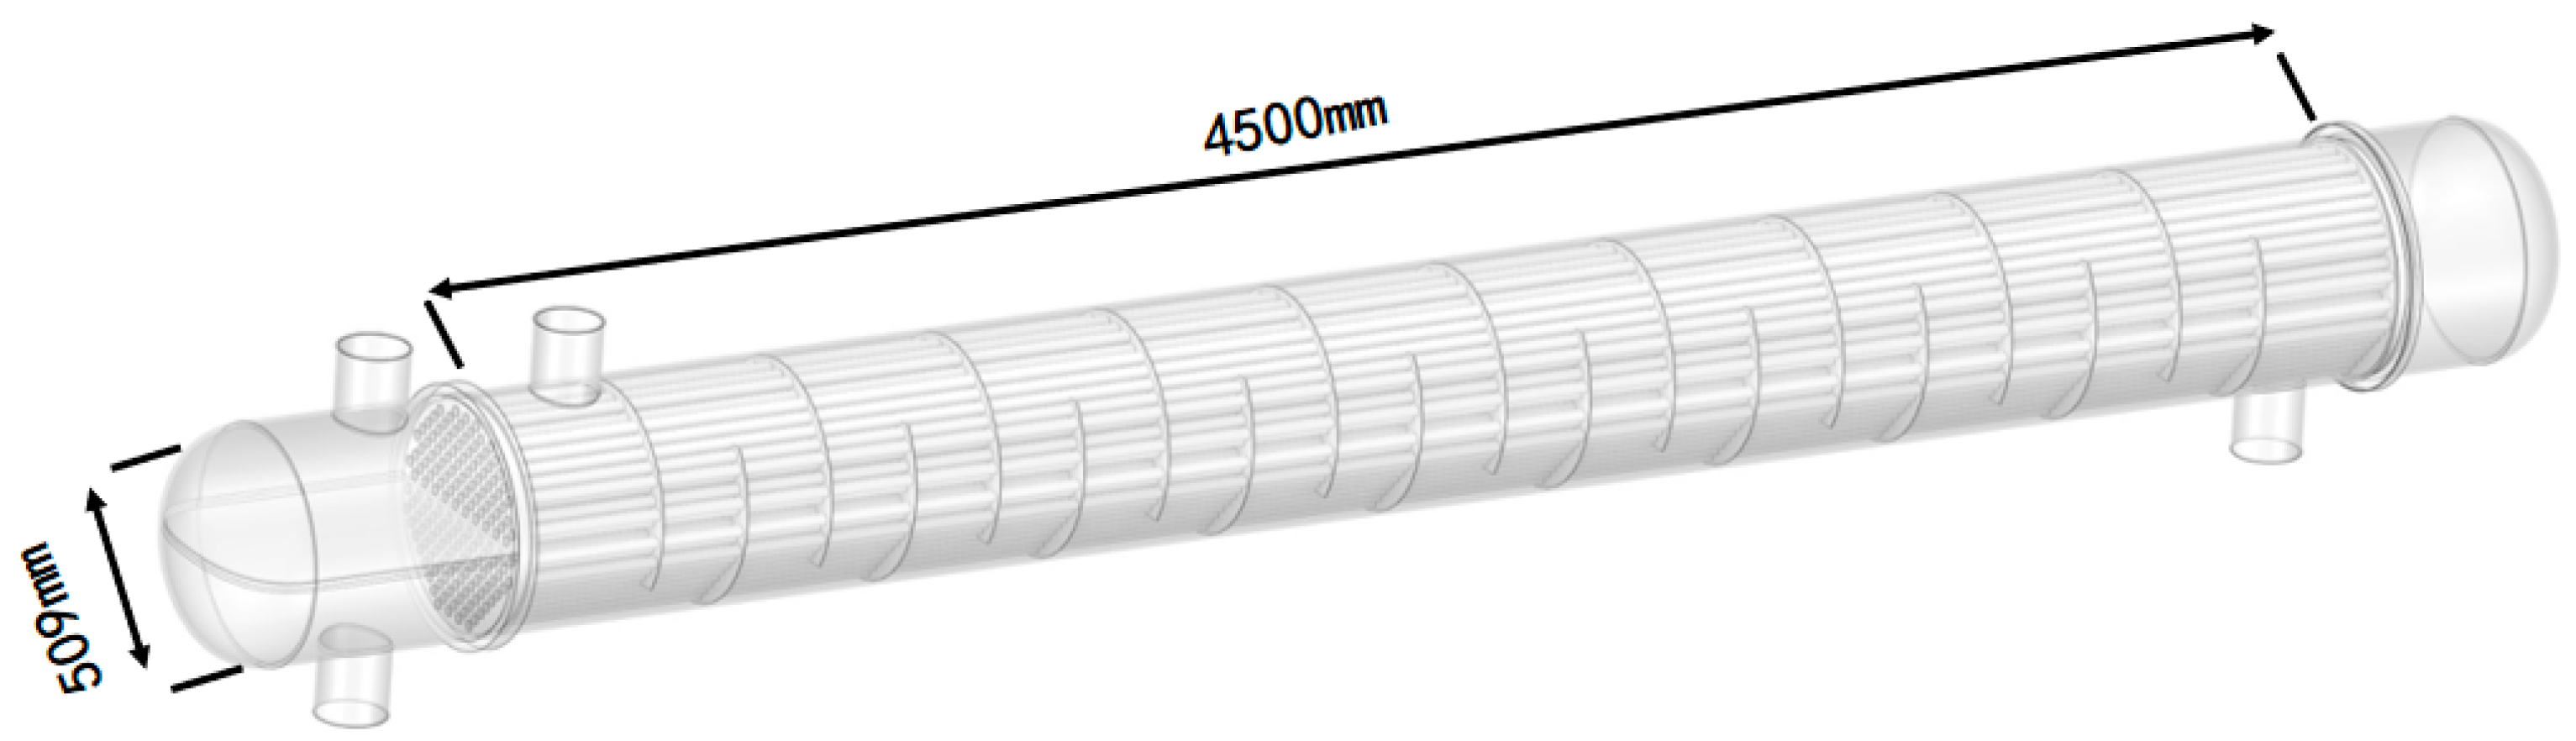
According to the detailed design results, the CFD numerical simulation of the fixed tube sheet heat exchanger was carried out. There are 164 heat exchange tubes in the model, with length of 4.5 m, wall thickness of 2 mm, outer diameter of 25 mm, and tube pitch of 22.6 mm. The specific arrangement is shown in Figure 6 below. The two ends of the heat exchange tube are installed with pore plates to fix the heat exchange tube and separate the cold and hot flow area. The inlet and outlet of the cold and hot flow of the heat exchanger feature an outer diameter of 159 mm and a wall thickness of 4.5 mm. The shell has an outer diameter of 530 mm and a wall thickness of 9 mm. Internally, 20 baffles with a thickness of 2.5 mm and a spacing of 200 mm (center distance between the front and back baffles) are employed to secure the heat exchange tubes and direct the flow. The heat exchange tube is made of steel.

Figure 6.
The arrangement of fixed tube sheet heat exchanger heat exchange tube.
3.4.1. Physical Structure
The horizontal shell and tube heat exchanger primarily comprises several key components, namely, the front and rear end covers, front and rear pore plates, shell, baffles, and heat exchange tubes. The three-dimensional configuration of this exchanger is depicted in Figure 7.
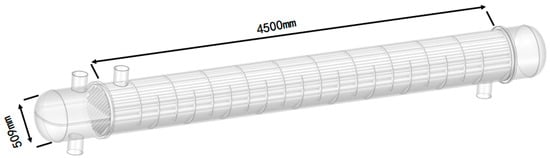
Figure 7.
Three-dimensional structure of the fixed tube sheet heat exchanger.
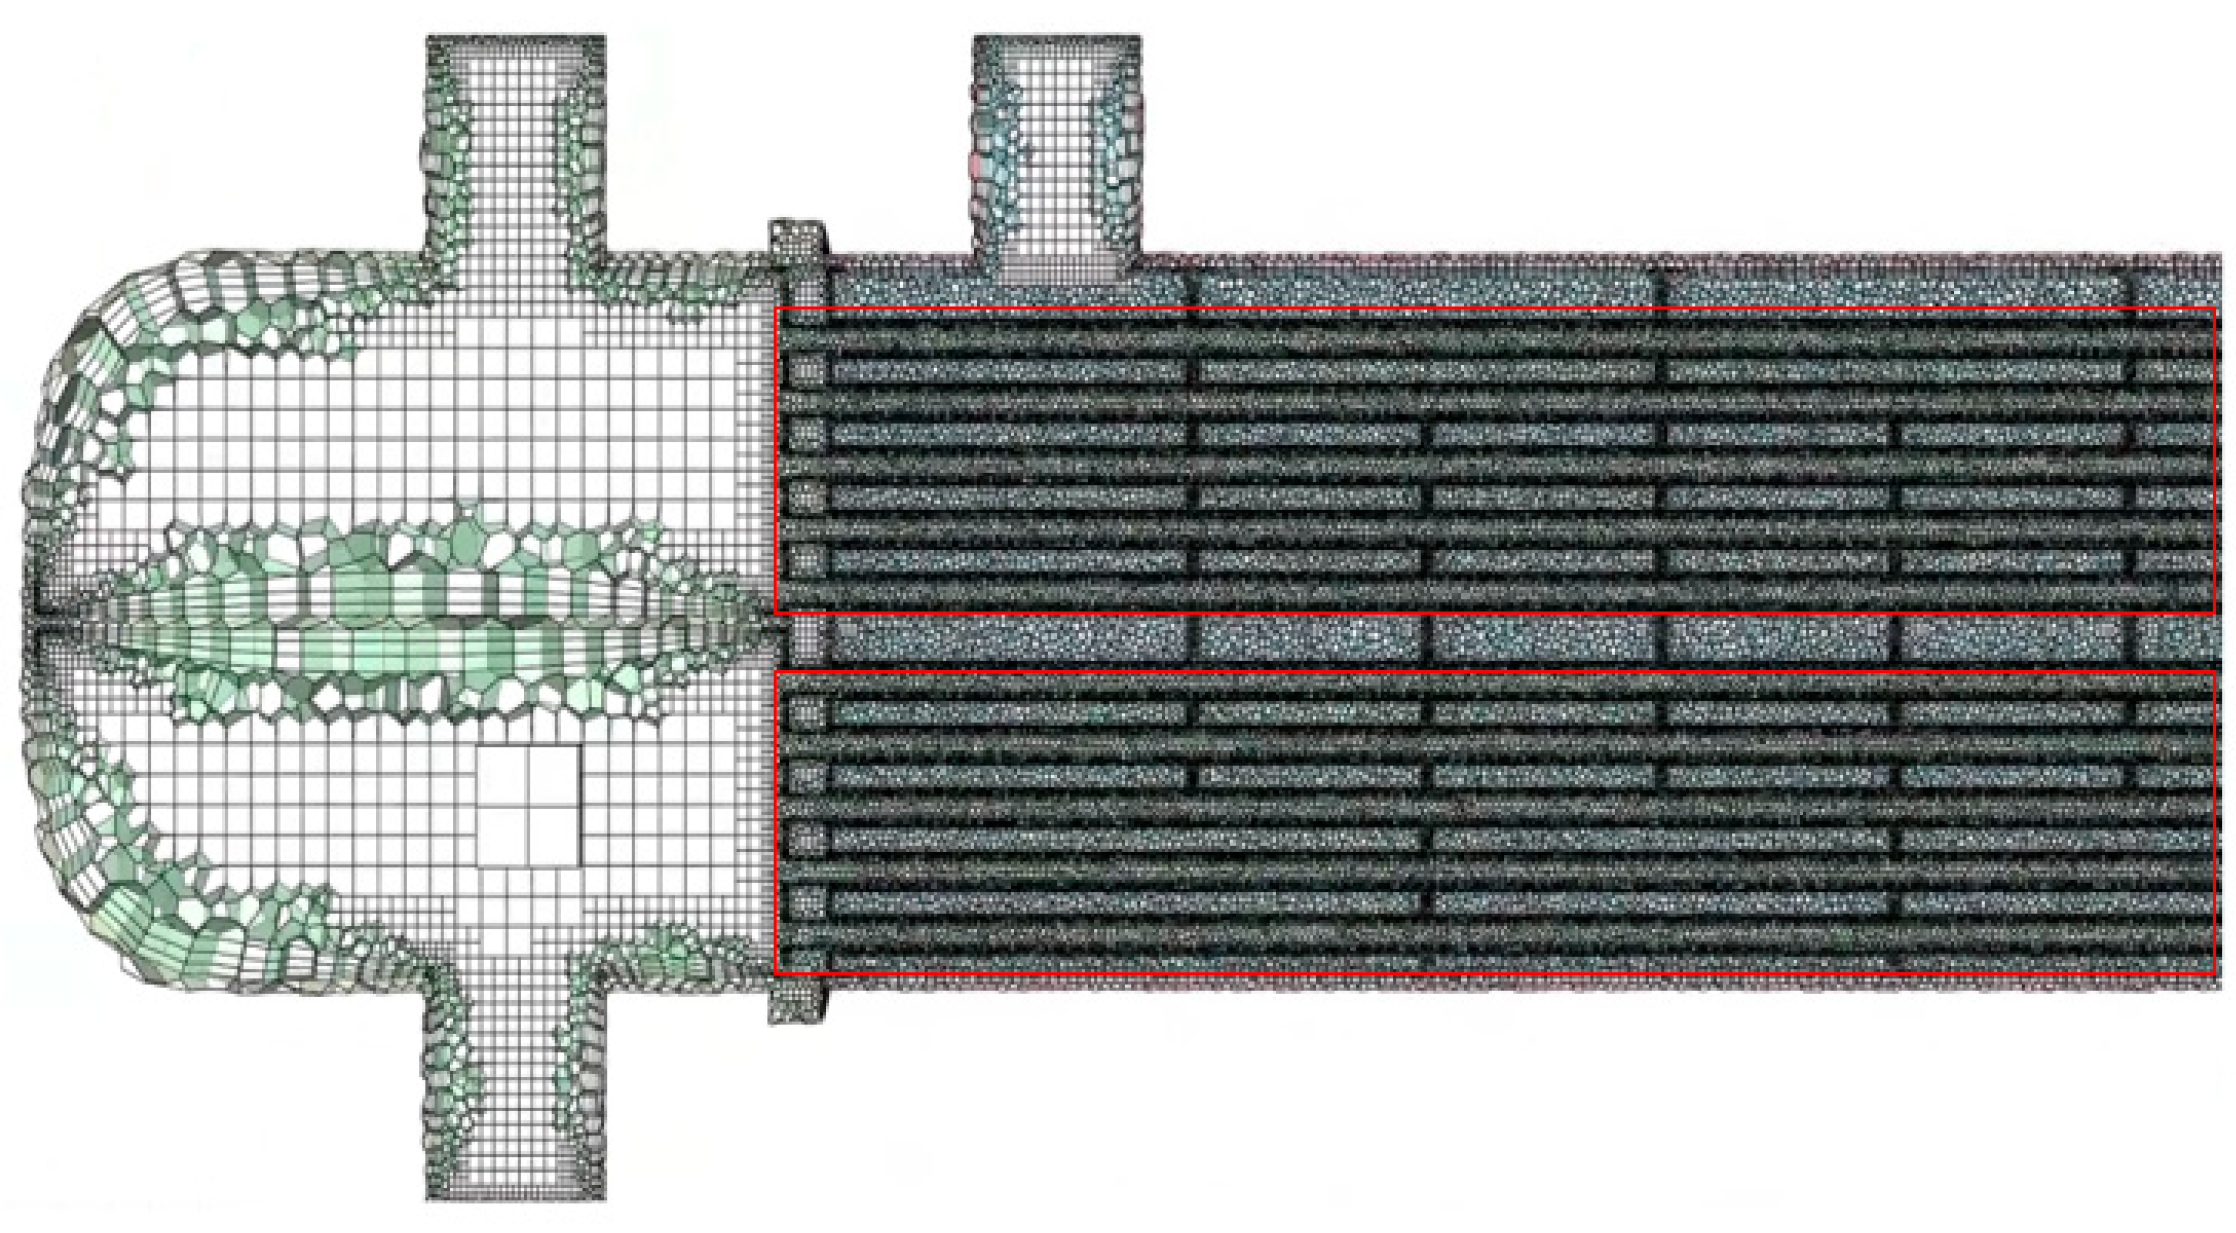
As shown in Figure 8, in this simulation, polyhedral mesh is used to mesh the heat exchanger (as shown below), and five boundary layers are set in the shell layer and the tube layer of the heat exchanger. According to the special physical structure of the heat exchanger with multiple basins and a large aspect ratio, BOI technology is used to encrypt the parts with a complex physical structure and a drastic flow field based on the conventional grid division strategy.
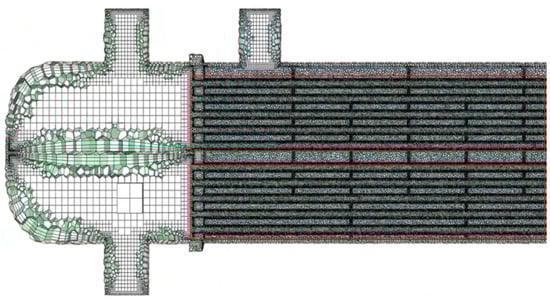
Figure 8.
Grid division of the fixed tube sheet heat exchanger.
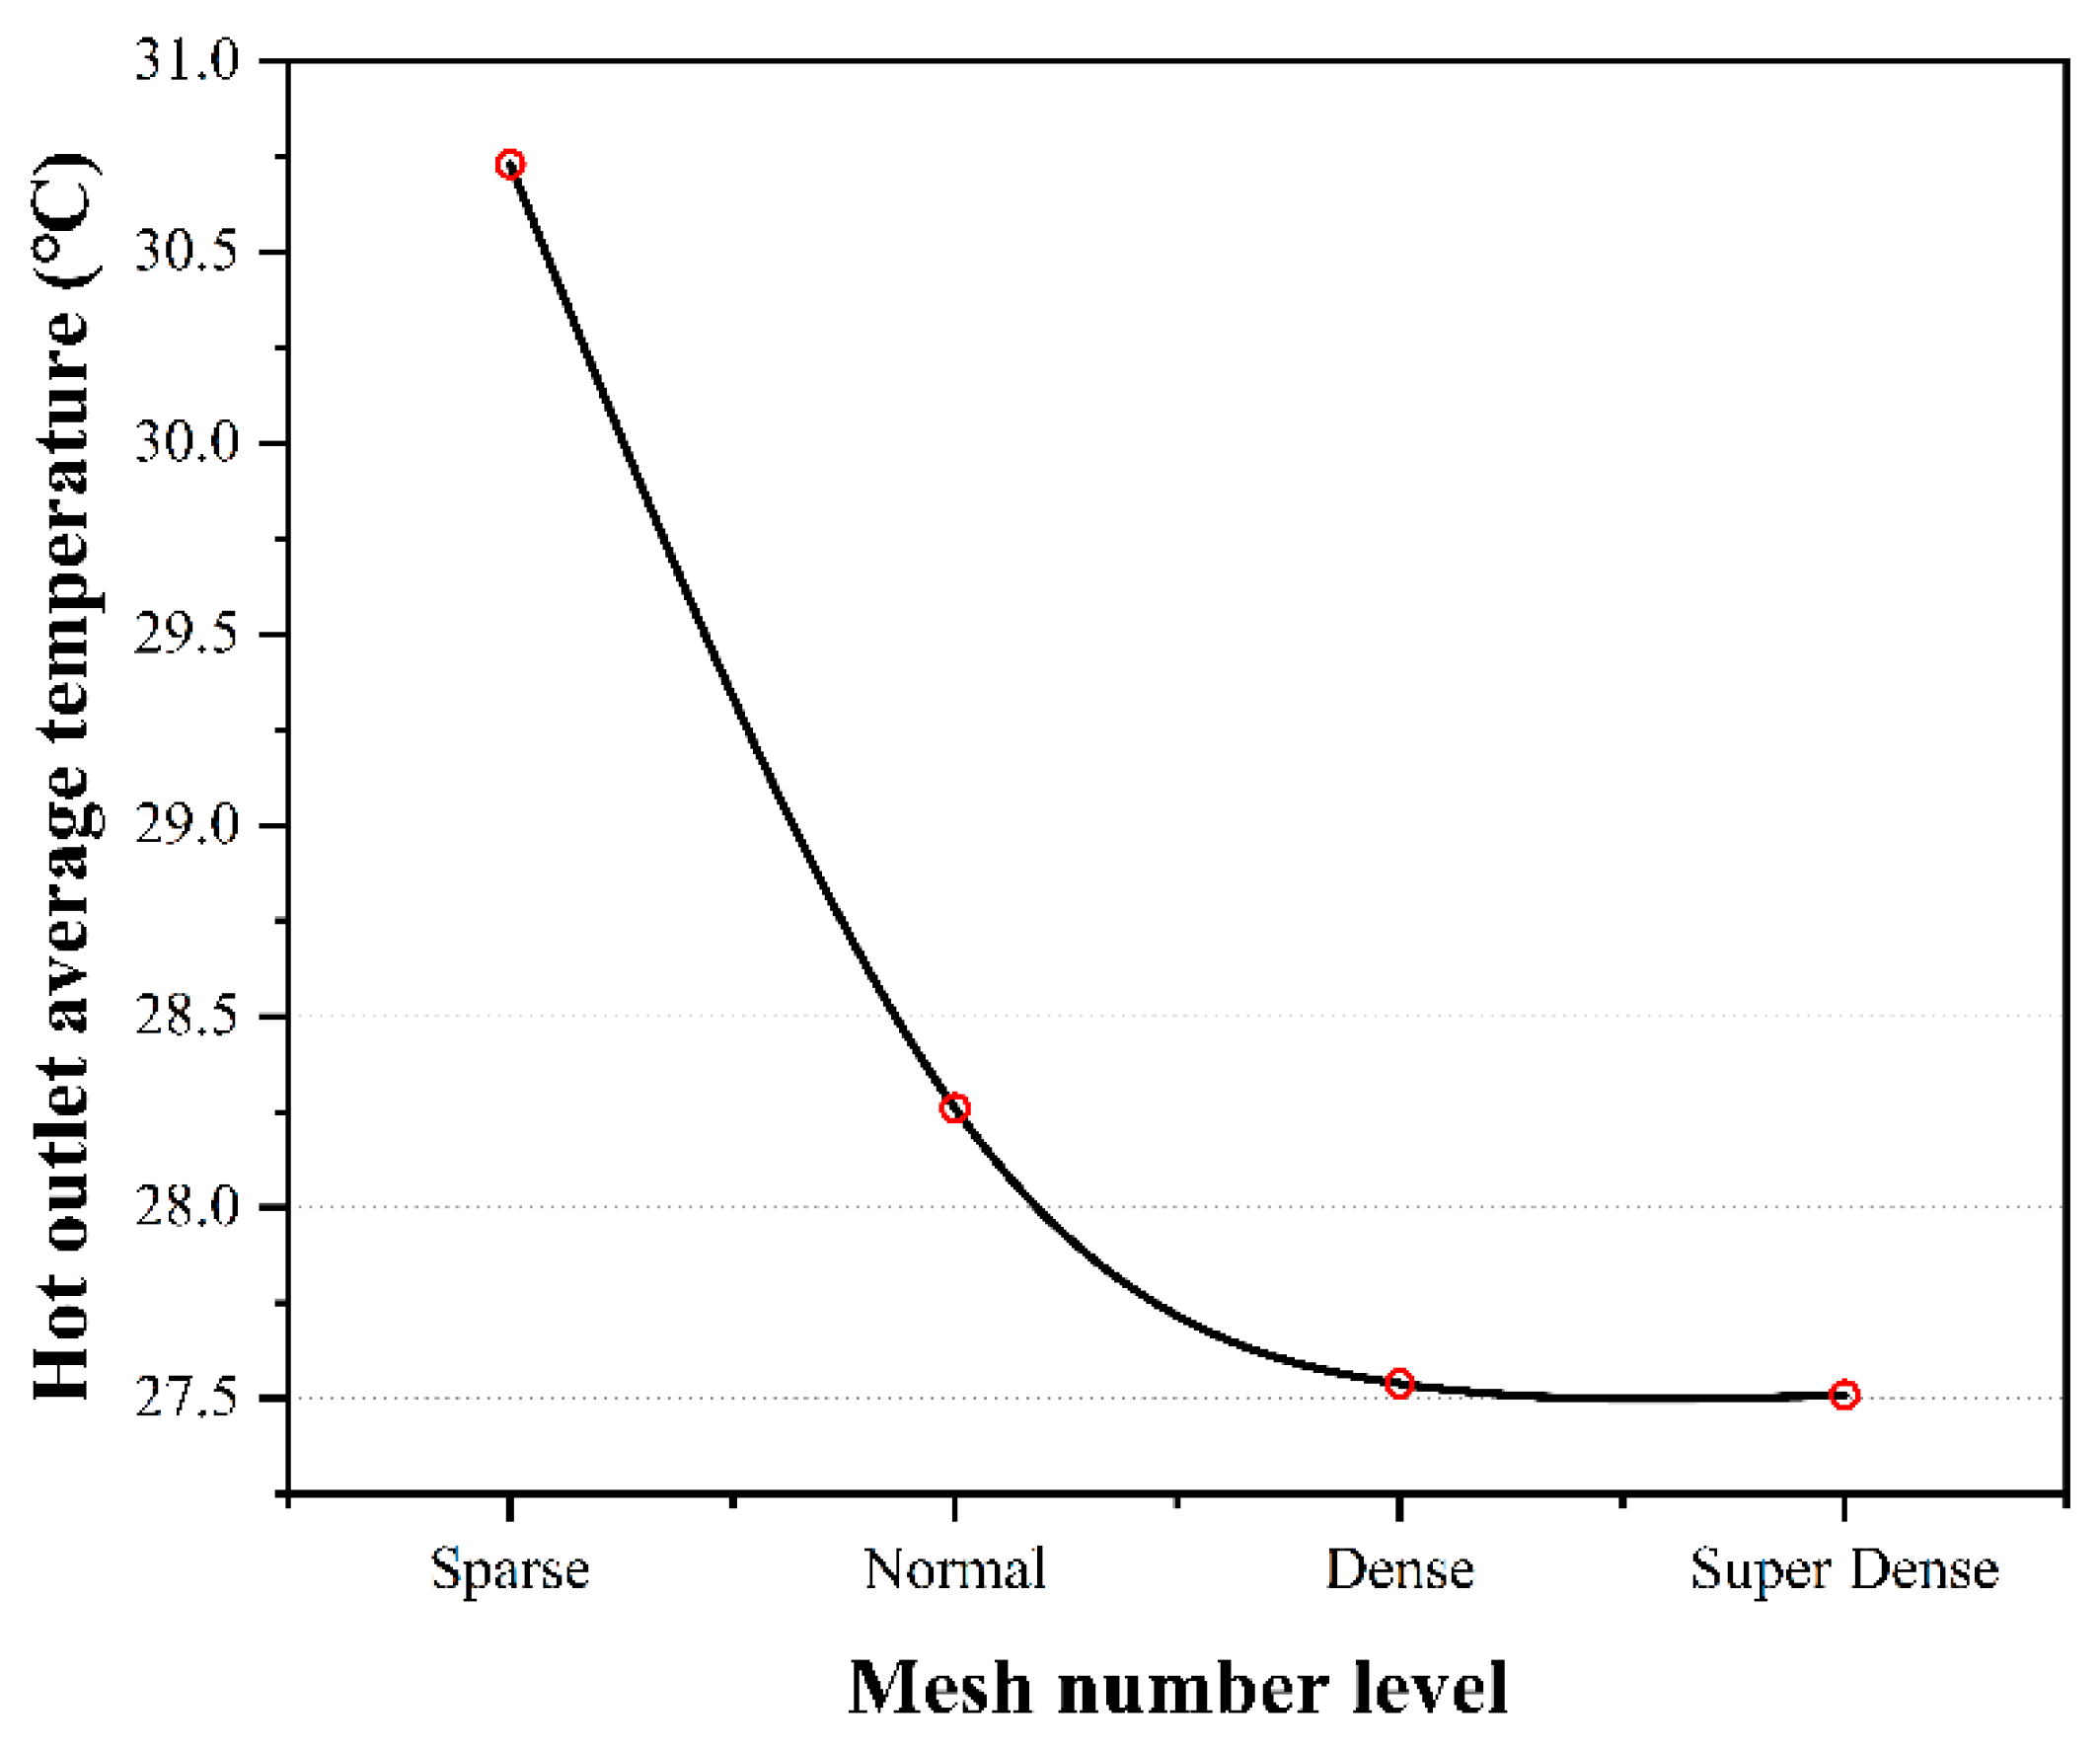
As shown in Figure 9, when the number of meshes reaches the dense level, the temperature change of the hot outlet is very small, so the mesh with the dense level can save computing resources while ensuring the accuracy. Therefore, in the subsequent calculations, we use the mesh of the dense level. Finally, the model comprises approximately 25 million meshes (60 G memory), and the orthogonal mass of the meshes is 0.25.

Figure 9.
Analysis of grid-independent solution.
3.4.2. Results and Analysis of Flow Field and Thermodynamic Performance
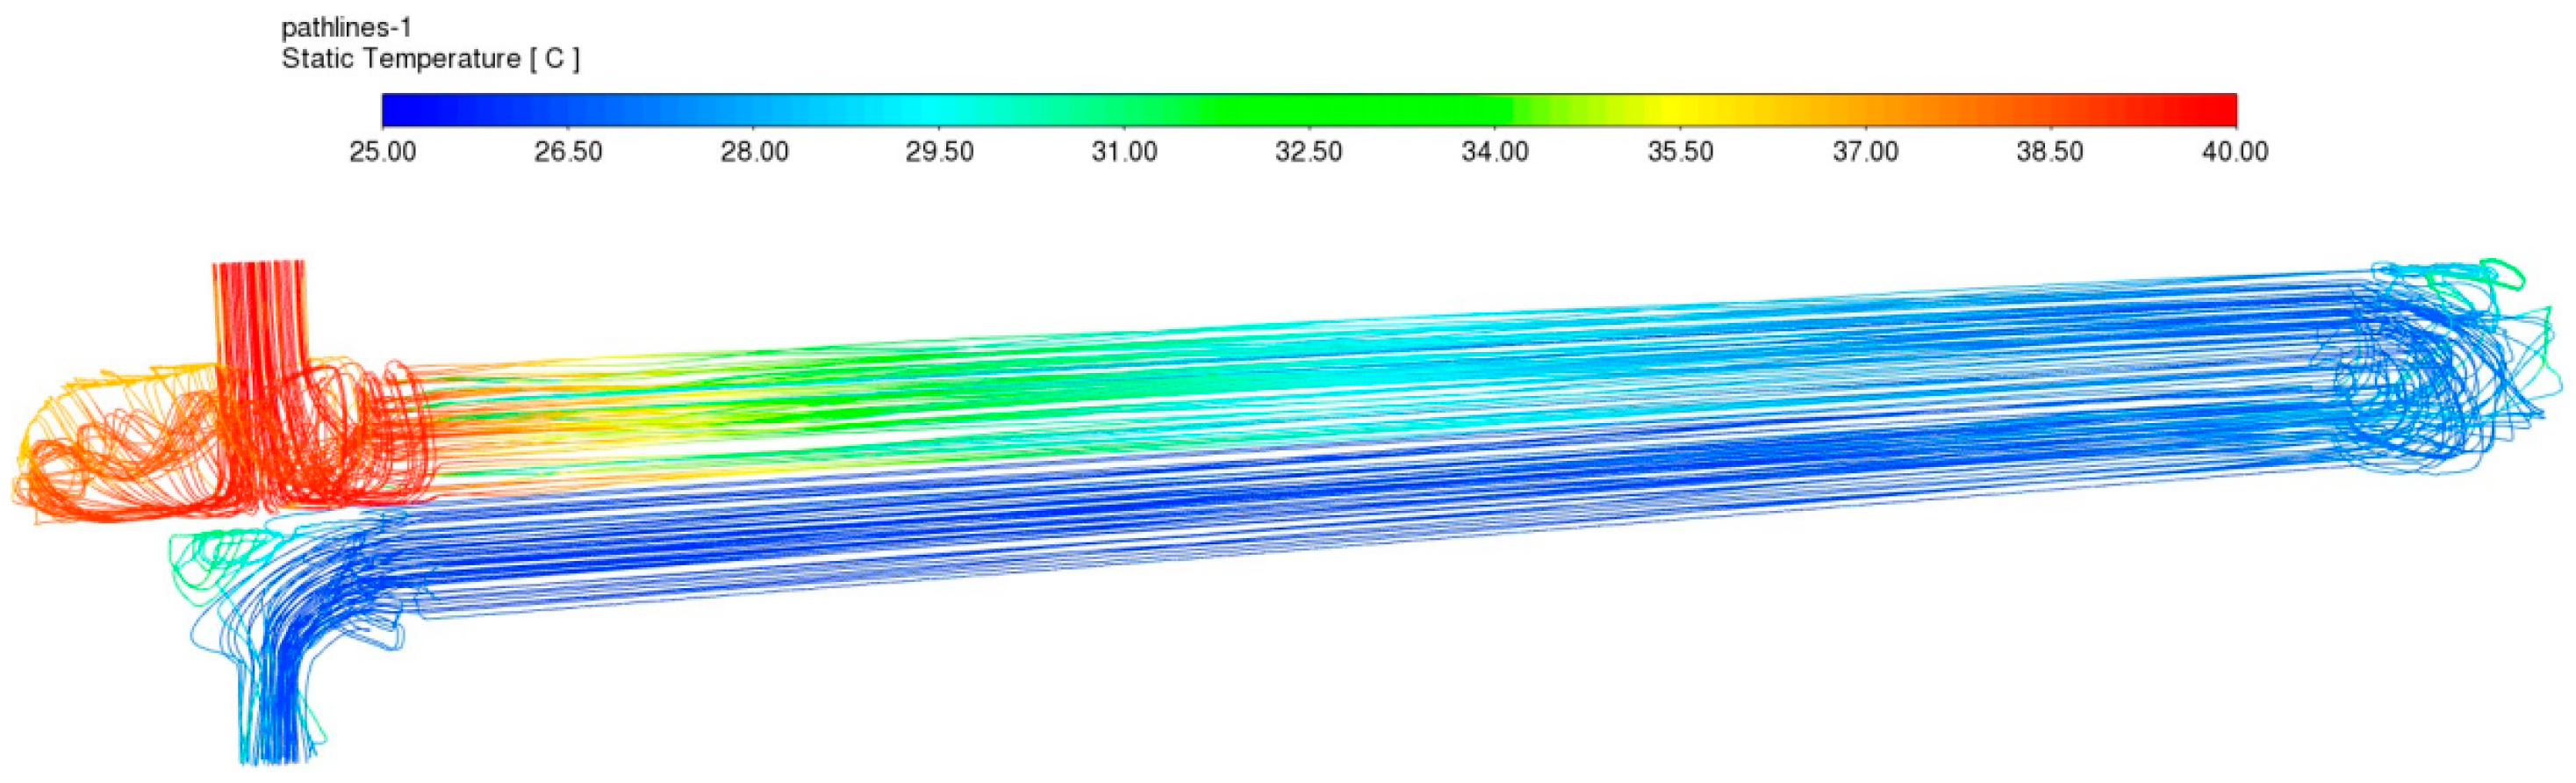
The heat flow within the tube course originates from the upper inflow through the left end cap and exits through the lower outflow of the same end cap after cooling. Meanwhile, the cold flow enters the shell from the lower right side and exits from the upper left side. Figure 10 presents the temperature cloud image of the hot fluid. The overall process of the hot fluid is that the upper left entrance enters the pipe path and enters the upper part of the pipe path after being blocked by the baffle plate. Concurrently, the cold flow within the shell path serves to cool the hot fluid entering the pipe path. As the hot fluid reaches the upper portion of the right end, it experiences initial cooling. Subsequently, it flows into the lower half of the right end and undergoes a secondary cooling cycle by recirculating through the pipeline until its final exit through the outlet at the lower left end. Therefore, the hot fluid enters from the entrance; due to the cooling of the cold flow, the temperature is continuously reduced, ultimately resulting in the outflow reaching its lowest temperature at the outlet. After cooling by the heat exchanger, the weighted mean temperature in the outlet region of the hot fluid is 27.54 °C.
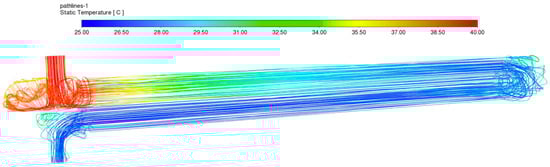
Figure 10.
Temperature cloud image of hot fluid.
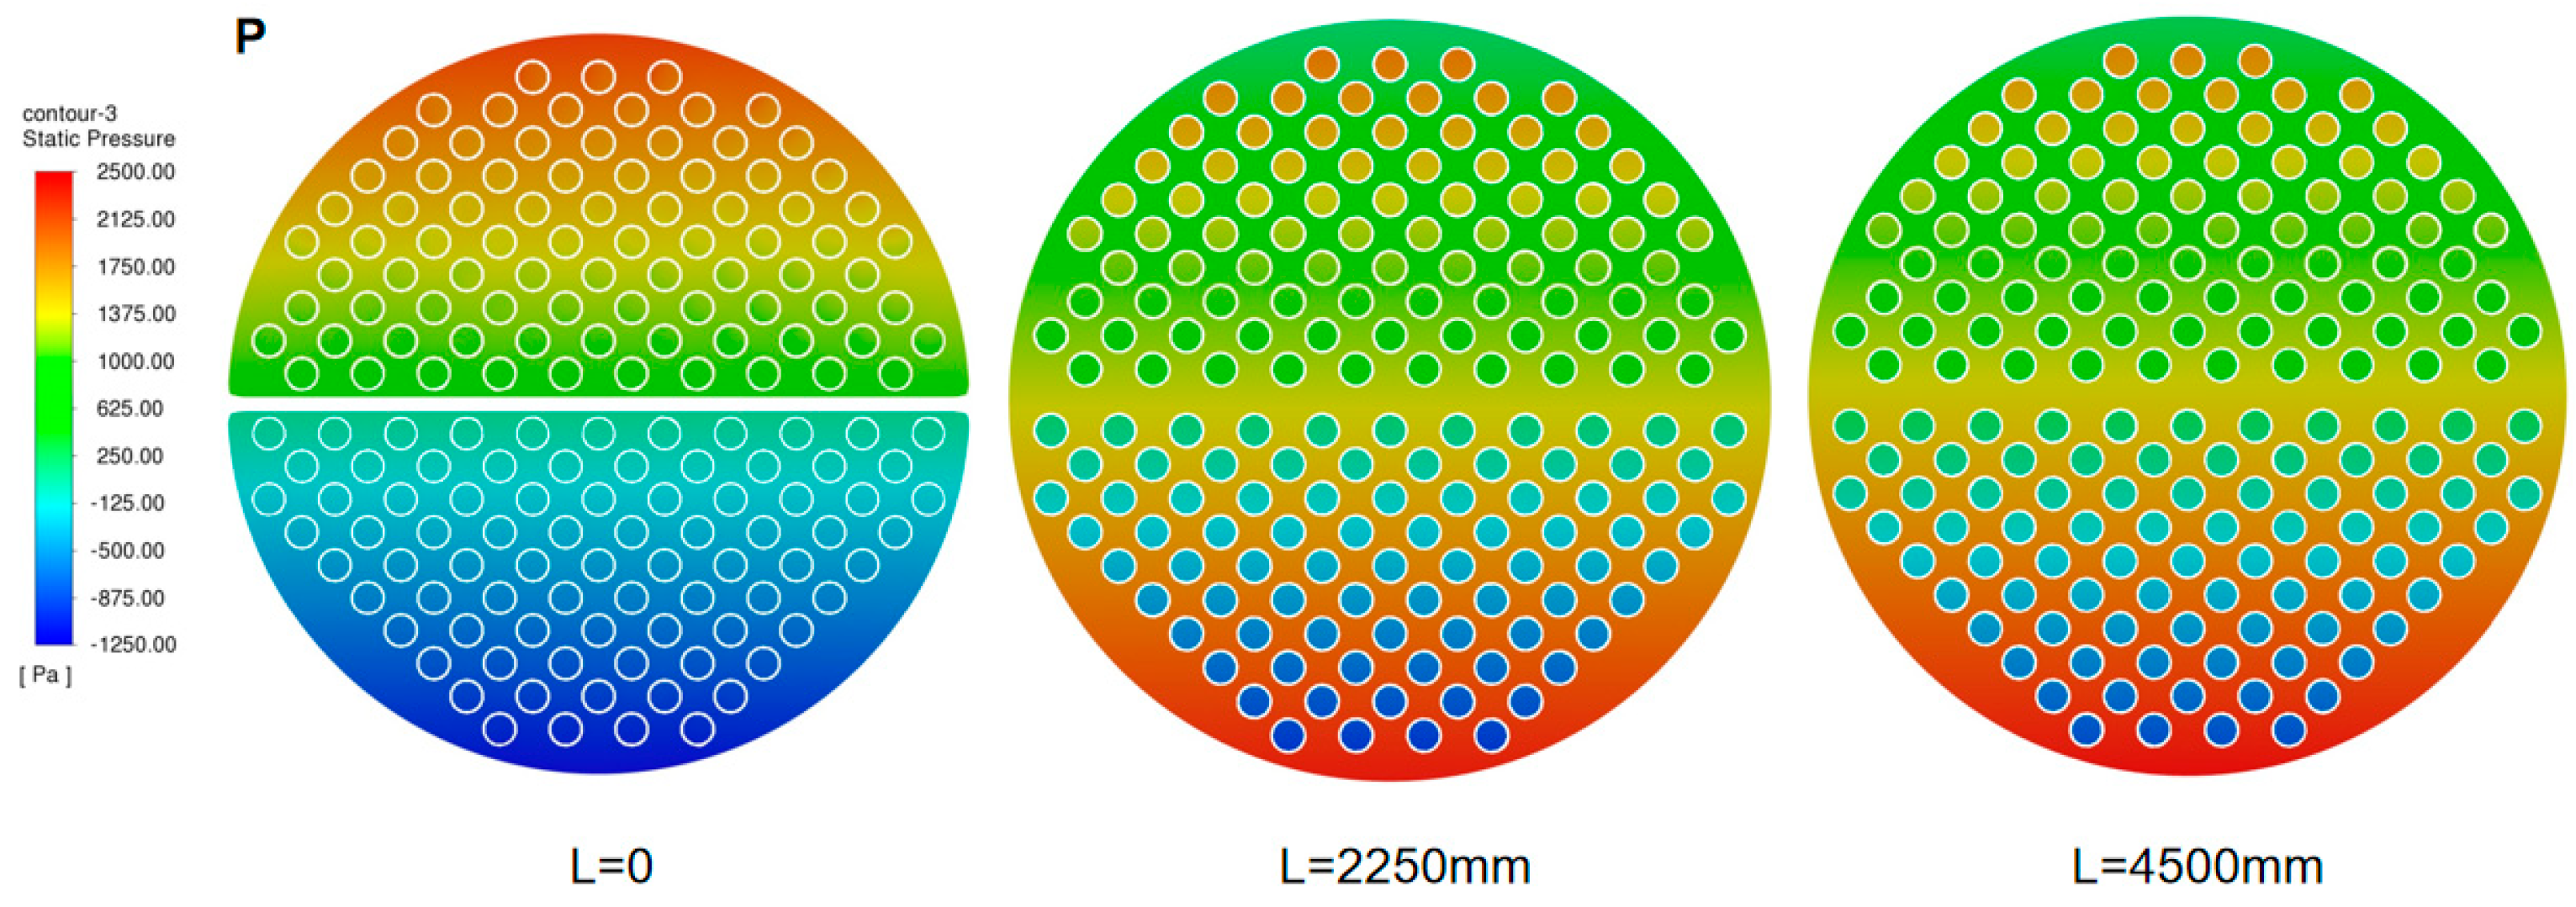
To investigate the interior of a fixed tube sheet heat exchanger, it is necessary to present the crucial parameters of the heat exchanger, particularly its cross-sectional and field distribution characteristics. Key parameters include the velocity field, temperature field, and pressure field within the heat exchanger. Figure 11, Figure 12 and Figure 13 show the velocity, temperature, and pressure states of different cross sections at the same time when they are stabilized after simulation: L = 0 mm, L = 2250 mm, and L = 4500 mm, respectively. In a steady state condition, Figure 11 illustrates the heat flow velocity variations at different locations within the heat exchanger. Initially, when L = 0 mm, the hot fluid enters the pipe at a relatively higher velocity. Upon entering the pipe, its velocity stabilizes, ultimately reaching a constant value of 9.94 m/s when L = 4500 mm. The flow of the hot fluid through the tube is unaffected by the velocity of the cold fluid circulating within the shell. Consequently, the hot fluid flow velocity remains uniform in both the upper and lower pipe segments for every cross-sectional location.
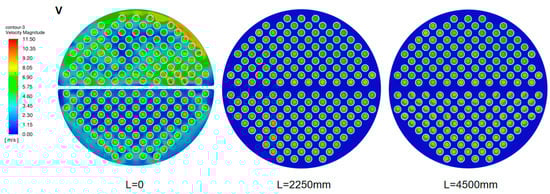
Figure 11.
Velocity cross section.
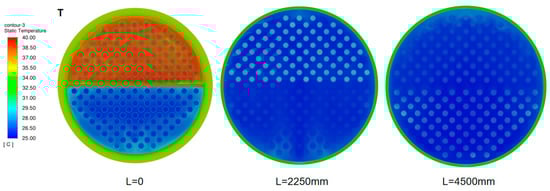
Figure 12.
Temperature cross section.
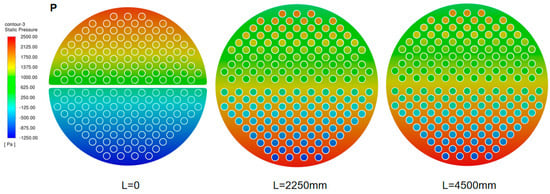
Figure 13.
Pressure cross section.
Figure 12 depicts the temperature distribution of the hot fluid at various locations within the heat exchanger in a steady state. When L = 0 mm, the hot fluid has just entered the upper part of the pipe and has not cooled, so the temperature is higher. When L = 2250 mm and L = 4500 mm, the cooling temperature of the cooling water in the shell gradually decreases. When the hot fluid is in the upper part of L = 4500 mm, it is first cooled, then flows to the lower part of L = 4500 mm, then back to L = 0 mm, and finally flows to the outlet. Therefore, at L = 0 mm, the temperature of the hot fluid attains its lowest point, ranging from 40 °C at the inlet to 27.54 °C at the outlet. This significant drop in temperature suggests that the heat exchanger’s heat exchange performance is well aligned with the desired target requirements.
The hot fluid pressure at different positions of the heat exchanger in a steady state is shown in Figure 13. When L = 0 mm, the hot fluid pressure just entering the upper part of the pipe is higher, and the closer to the entrance, the higher the pressure. As the cold fluid in the shell cools, the pressure inside the tube gradually decreases upon entry. The hot fluid is cooled for the first time in the upper part of L = 4500 mm, and then flows to the lower part of L = 4500 mm to returns to L = 0 mm, and finally flows to the outlet. At this stage, the pressure of the oil and gas in the pipe is also reduced to the lowest value, and the pressure drop from the inlet to the outlet is about 1.275 KPa.
In this paper, CFD results are compared with those of the chemical process design, and the results are shown in Table 6. The chemical process design by Aspen uses known import and export parameters to obtain structural parameters, while it is used to calculate the export parameters in the case of known inlet parameters and structural parameters, which can be regarded as a mutual positive and negative problem. The CFD calculations demonstrate a strong correlation between the inlet and outlet temperatures of both the cold fluid and the heat flow. Furthermore, the CFD results closely align with the detailed design outcomes in terms of the flow velocities at the inlet and outlet of both the cold and hot fluids. The only notable deviation is observed in the pressure drop between the cold and hot flows. Therefore, it can be concluded that that the inlet and outlet parameters of cold and hot fluids obtained in Aspen’s detailed design are consistent with the CFD simulation results.
Table 6.
Comparison of detailed design and CFD results.
4. Conclusions
This study integrates chemical process design with computational fluid dynamics (CFD) simulation to conduct an in-depth investigation of the heat exchanger, a critical component in the oil and gas recovery system. This study builds upon preceding research to address the gap in optimizing the design of heat exchangers through an innovative numerical simulation coupling approach. By leveraging cutting-edge chemical process design technology, a thorough performance analysis is conducted, encompassing comparisons across various heat exchanger types and operating conditions.
To validate the outcomes of the chemical process simulation software, computational fluid dynamics (CFD) was employed to replicate the simulation process. Upon comparing the CFD calculation results with the outcomes generated by the chemical process simulation software, it was observed that there was a strong congruency between the two. This congruence reinforced the precision and dependability of the results yielded by the simulation software, thereby establishing the authenticity of the research findings. The results demonstrate consistency between the process design and CFD numerical simulation outcomes, allowing for mutual verification. The designed heat exchanger can efficiently cool oil and gas from 40 °C to 30 °C, reducing the energy consumption required for subsequent processes. In addition, by reducing oil and gas temperatures, thermal runaway reactions and potential fire risks are reduced, improving operational stability and reliability. The designed heat exchanger can handle 870 m3/h of oil and gas, helping to prevent the release of harmful pollutants, such as volatile organic compounds, into the atmosphere, reducing greenhouse gas emissions and environmental impact.
This study has taken an important step in the optimization of fixed tube sheet heat exchangers, fully utilizing the advantages of chemical process simulation software and CFD analysis. By revealing the complex fluid and heat transfer mechanisms inside heat exchangers, it lays a solid foundation for designing more efficient and sustainable heat transfer systems, with potential applications ranging from industrial processes to renewable energy technologies. Considering the importance of experimental data verification of the calculation model, the device is currently being processed, and the plan is to further verify the model by collecting the actual operating parameters of the device and quantitatively comparing key performance parameters (such as temperature, pressure, heat transfer coefficient, and flow velocity) with numerical results. The findings of this study offer crucial references and guidelines for the design and optimization of fixed tube sheet heat exchangers, combining theoretical analysis with practical insights to address key challenges and advance more advanced thermal technology.
Author Contributions
Conceptualization, Z.C., Y.L. (Ye Luo), Z.W., L.G. and B.H.; methodology, Z.C., Z.W. and B.H.; software, Y.L. (Ye Luo) and B.H.; validation, Z.C., Y.L. (Ye Luo) and B.H.; formal analysis, Y.L. (Yulin Liu), Z.W. and Q.W.; investigation, Z.C., Z.W. and B.H.; data curation, Z.W. and L.G.; writing—original draft preparation, Z.C., Y.L. (Ye Luo), Z.W. and B.H.; writing—review and editing, Q.W. and L.G.; visualization, Y.L. (Yulin Liu), Q.W. and L.G.; funding acquisition, B.H. All authors have read and agreed to the published version of the manuscript.
Funding
This research was funded by the Project of Sinopec Sales Co., LTD. (32850024-23-ZC0607-0001), Basic Public Welfare Research Program of Zhejiang Province (LQ23E040004) and Zhoushan Science and Technology Project (No. 2021C21011).
Data Availability Statement
The original contributions presented in the study are included in the article, further inquiries can be directed to the corresponding author.
Conflicts of Interest
Authors Zengliang Chen and Ye Luo were employed by the company Sinopec Marketing Co., Ltd. Zhejiang Petroleum Branch. The remaining authors declare that the research was conducted in the absence of any commercial or financial relationships that could be construed as a potential conflict of interest.
Nomenclature
| Q | Heat load, W |
| mc | The mass flow rate of the cold fluid, kg/s |
| mh | The mass flow rate of hot fluid, kg/s |
| cp,c | The constant pressure specific heat of cold fluid, J/(kg·K) |
| cp,h | The constant pressure specific heat of hot fluid, J/(kg·K) |
| Tc,i | The inlet temperature of cold fluid, K |
| Tc,o | The outlet temperature of cold fluid, K |
| Th,i | The inlet temperature of hot fluid, K |
| Th,o | The outlet temperature of hot fluid, K |
| R | Ideal gas constant, J/(mol·K); |
| p | Pressure, kPa |
| T | The absolute temperature, K |
| V | The molar volume, m3 |
| a | The energy parameter related to temperature |
| b | The temperature dependent volume parameter. |
| K | The overall heat transfer coefficient, W/(m2·K) |
| A | The heat exchanger area, m2 |
| Δtm | The mean temperature difference between cold and hot fluids, K |
| Δtm’ | The logarithmic mean temperature difference, K |
| FT | A correction factor used to account for the logarithmic mean temperature difference |
| Am | The area margin |
| Ao | The actual surface area of the heat exchanger, m2 |
| Areq | The heat transfer area required, m2 |
| ρ | The fluid density |
| w | The fluid velocity, m/s |
| ui | The velocity in the direction i, m/s |
| Fi | The mass force in the direction i, N |
| E | The conservation of energy |
| h | The sensible heat enthalpy |
| Gb | The kinetic energy generated by buoyancy effects |
| Gk | The kinetic energy produced by the mean velocity gradient |
| YM | The impact of compressible turbulent pulsation expansion on the overall dissipation rate |
| αk | The inverse Prandtl numbers for |
| ∂ε | The inverse Prandtl numbers for |
| Sε | Source terms |
| μt | Turbulent viscosity |
References
- Hong, B.; Shao, B.; Zhou, M.; Qian, J.; Guo, J.; Li, C.; Xu, Y.; Zhu, B. Evaluation of Disaster-Bearing Capacity for Natural Gas Pipeline under Third-Party Damage Based on Optimized Probabilistic Neural Network. J. Clean. Prod. 2023, 428, 139247. [Google Scholar] [CrossRef]
- Li, Y.; Dai, G. Energy Saving and Emission Reduction of Fossil Energy Based on Low Carbon Economy and Its Consumption Structure Optimization. Int. J. Low-Carbon Technol. 2019, 14, 381–385. [Google Scholar] [CrossRef]
- Hua, L.-Y.; Cui, T.; Li, J.-X.; Zou, B.-D.; Yang, Y.-Y.; Cheng, G. VOCs Removal and Emission Monitoring of Beijing Bulk Gasoline Terminals in 2012–2019. Huan Jing Ke Xue 2021, 42, 1328–1332. [Google Scholar] [PubMed]
- Guo, T.; Jiao, Y.; Tang, Y.; Lu, D.; Kong, X.; Shen, J.; Jiang, Q. Marking the Status and Development of Marine VOCs Recovery Technology. E3S Web Conf. 2021, 248, 01010. [Google Scholar]
- Zhou, J.Y.; Wang, B.F.; Nie, L.H.; Lu, J.X.; Hao, Y.J.; Xu, R.R. Experimental Study on Emission of VOCs from Tanker Using Hollow Fiber Membrane Absorption Method with Different Absorbents. IOP Conf. Ser. Mater. Sci. Eng. 2018, 292, 012113. [Google Scholar] [CrossRef]
- Vlasenko, V.S.; Karakozov, A.A.; Perveev, A.A. Vapor Recovery Unit of Gasoline from the Tanks of Filling Stations with Gas-Dynamic Cooling. IOP Conf. Ser. Earth Environ. Sci. 2020, 459, 032043. [Google Scholar] [CrossRef]
- Fetisov, V.; Mohammadi, A.H.; Pshenin, V.; Kupavykh, K.; Artyukh, D. Improving the Economic Efficiency of Vapor Recovery Units at Hydrocarbon Loading Terminals. Oil Gas Sci. Technol.–Rev. IFP Energ. Nouv. 2021, 76, 38. [Google Scholar] [CrossRef]
- Wang, J.; Nan, J.; Wang, Y. CFD-Based Optimization of a Shell-and-Tube Heat Exchanger. Fluid Dyn. Mater. Process. 2023, 19, 2761–2775. [Google Scholar] [CrossRef]
- Aydin, A.; Yaşsar, H.; Engin, T.; Buyukkaya, E. Optimization and CFD Analysis of a Shell-and-Tube Heat Exchanger with a Multi Segmental Baffle. Therm. Sci. 2022, 26, 1–12. [Google Scholar] [CrossRef]
- Abushammala, O.; Hreiz, R.; Lemaître, C.; Favre, É. Optimal Design of Helical Heat/Mass Exchangers under Laminar Flow: CFD Investigation and Correlations for Maximal Transfer Efficiency and Process Intensification Performances. Int. J. Heat Mass Transf. 2020, 153, 119610. [Google Scholar] [CrossRef]
- Cavazzuti, M.; Agnani, E.; Corticelli, M.A. Optimization of a Finned Concentric Pipes Heat Exchanger for Industrial Recuperative Burners. Appl. Therm. Eng. 2015, 84, 110–117. [Google Scholar] [CrossRef]
- Dvořák, V.; Vít, T. CAE Methods for Plate Heat Exchanger Design. Energy Procedia 2017, 134, 234–243. [Google Scholar] [CrossRef]
- Khail, A.A.; Erisen, A. A Review: CFD Approaches of Plate Heat Exchangers. Arch. Comput. Method Eng. 2023, 30, 1157–1165. [Google Scholar] [CrossRef]
- Afgan, I.; Kahil, Y.; Benhamadouche, S.; Ali, M.; Alkaabi, A.; Berrouk, A.S.; Sagaut, P. Cross Flow over Two Heated Cylinders in Tandem Arrangements at Subcritical Reynolds Number Using Large Eddy Simulations. Int. J. Heat Fluid Flow 2023, 100, 109115. [Google Scholar] [CrossRef]
- Bhandurge, S.; Wankhade, A.M.; Jadhao, P.K. Analysis and experimentation of shell and tube heat exchanger with different orientation of baffles. Int. J. Res. Sci. Eng. Technol. 2016, 3, 7–14. [Google Scholar]
- Mellal, M.; Benzeguir, R.; Sahel, D.; Ameur, H. Hydro-Thermal Shell-Side Performance Evaluation of a Shell and Tube Heat Exchanger under Different Baffle Arrangement and Orientation. Int. J. Therm. Sci. 2017, 121, 138–149. [Google Scholar] [CrossRef]
- Li, Y.; Jiang, X.; Huang, X.; Jia, J.; Tong, J. Optimization of High-Pressure Shell-and-Tube Heat Exchanger for Syngas Cooling in an IGCC. Int. J. Heat Mass Transf. 2010, 53, 4543–4551. [Google Scholar] [CrossRef]
- Bashtani, I.; Esfahani, J.A.; Kim, K.C. Hybrid CFD-ANN Approach for Evaluation of Bio-Inspired Dolphins Dorsal Fin Turbulators of Heat Exchanger in Turbulent Flow. Appl. Therm. Eng. 2023, 219, 119422. [Google Scholar] [CrossRef]
- AL-Khaffajy, M.; Mossad, R. Optimization of the Heat Exchanger in a Flat Plate Indirect Heating Integrated Collector Storage Solar Water Heating System. Renew. Energy 2013, 57, 413–421. [Google Scholar] [CrossRef]
- Han, L.; Yang, K.; Yang, J.; Li, R.; Li, Y.; Deng, L.; Che, D. A Thermal Calculation Model for Tubular Condensing Heat Exchanger. Appl. Therm. Eng. 2024, 244, 122701. [Google Scholar] [CrossRef]
- Chen, L.-Y.; Adi, V.S.K.; Laxmidewi, R. Shell and Tube Heat Exchanger Flexible Design Strategy for Process Operability. Case Stud. Therm. Eng. 2022, 37, 102163. [Google Scholar] [CrossRef]
- Feng, T.-H.; Chen, C.-K. Numerical Investigation on Thermal-Hydraulic Performance of a Spiral Plate Heat Exchanger. Int. Commun. Heat Mass Transf. 2022, 134, 106057. [Google Scholar] [CrossRef]
- Kapustenko, P.O.; Klemeš, J.J.; Matsegora, O.I.; Arsenyev, P.Y.; Arsenyeva, O.P. Accounting for Local Thermal and Hydraulic Parameters of Water Fouling Development in Plate Heat Exchanger. Energy 2019, 174, 1049–1059. [Google Scholar] [CrossRef]
- Kumar, M.; Pal, S.; Patil, D. Parametric Design Optimization and Thermodynamic Analysis of Plate Fin Heat Exchanger for Helium Liquefaction System. Cryogenics 2024, 139, 103833. [Google Scholar] [CrossRef]
- Shen, S.; Cai, W.; Wang, X.; Wu, Q.; Yon, H. Investigation of Liquid Desiccant Regenerator with Fixed-Plate Heat Recovery System. Energy 2017, 137, 172–182. [Google Scholar] [CrossRef]
- Abdelmoety, A.M.; Muhieldeen, M.W.; Yen Tey, W.; Yin, X.; Beit, N.E. Numerical Investigations on Optimised Shell Designs of a U-Tube Heat Exchanger. Therm. Sci. Eng. Prog. 2024, 47, 102327. [Google Scholar] [CrossRef]
- Zhu, G.-D.; Qian, C.-F.; Fang, Z. An Analytical Theory for the Strength Solution of Tubesheets in Floating-Head Heat Exchangers with Back Devices. Int. J. Press. Vessel. Pip. 2019, 175, 103936. [Google Scholar] [CrossRef]
- Yixiong, S.; Liqing, Q.; Jin, L.; Liang, Z.; Sheng, S.; Shuai, J. Thermal Design and Analysis of Intermediate Heat Exchanger with Alternative Coolants. Ann. Nucl. Energy 2024, 203, 110516. [Google Scholar] [CrossRef]
- Mickoleit, E.; Breitkopf, C.; Jäger, A. Influence of Equations of State and Mixture Models on the Design of a Refrigeration Process. Int. J. Refrig. 2021, 121, 193–205. [Google Scholar] [CrossRef]
- Nitsche, M.; Gbadamosi, R.O. Heat Exchanger Design Guide: A Practical Guide for Planning, Selecting and Designing of Shell and Tube Exchangers; Butterworth-Heinemann: Amsterdam, The Netherlands; Boston, MA, USA, 2015. [Google Scholar]
- Hong, B.; Li, Y.; Li, Y.; Gong, J.; Yu, Y.; Huang, A.; Li, X. Numerical Simulation of Solid Particle Erosion in the Gas-Liquid Flow of Key Pipe Fittings in Shale Gas Fields. Case Stud. Therm. Eng. 2023, 42, 102742. [Google Scholar] [CrossRef]
- Hong, B.; Li, Y.; Li, X.; Ji, S.; Yu, Y.; Fan, D.; Qian, Y.; Guo, J.; Gong, J. Numerical Simulation of Gas-Solid Two-Phase Erosion for Elbow and Tee Pipe in Gas Field. Energies 2021, 14, 6609. [Google Scholar] [CrossRef]
- Hao, B.; Gao, J.; Guo, B.; Ai, B.; Hong, B.; Jiang, X. Numerical Simulation of Premixed Methane–Air Explosion in a Closed Tube with U-Type Obstacles. Energies 2022, 15, 4909. [Google Scholar] [CrossRef]
- Hong, B.; Li, X.; Li, Y.; Li, Y.; Yu, Y.; Wang, Y.; Gong, J.; Ai, D. Numerical Simulation of Elbow Erosion in Shale Gas Fields under Gas-Solid Two-Phase Flow. Energies 2021, 14, 3804. [Google Scholar] [CrossRef]


Disclaimer/Publisher’s Note: The statements, opinions and data contained in all publications are solely those of the individual author(s) and contributor(s) and not of MDPI and/or the editor(s). MDPI and/or the editor(s) disclaim responsibility for any injury to people or property resulting from any ideas, methods, instructions or products referred to in the content. |
© 2024 by the authors. Licensee MDPI, Basel, Switzerland. This article is an open access article distributed under the terms and conditions of the Creative Commons Attribution (CC BY) license (https://creativecommons.org/licenses/by/4.0/).