Article

Research on the Material Characteristics and Loss Calculation Method of Cryogenic Permanent Magnet Motor Stator for LNG Pump

National Engineering Research Center of Large Electric Machines and Heat Transfer Technology, Harbin University of Science and Technology, Harbin 150080, China
*
Author to whom correspondence should be addressed.
Energies 2024, 17(11), 2641; https://doi.org/10.3390/en17112641
Submission received: 4 May 2024 / Revised: 22 May 2024 / Accepted: 28 May 2024 / Published: 29 May 2024
(This article belongs to the Special Issue Advances in Gas Transportation by Pipeline and LNG)

Abstract

:
This paper explores the applicability of cryogenic permanent magnet motor stator materials for LNG pumps. First, this study selected four kinds of silicon steel sheets for motor stators tested at room temperature and ultra-low temperature and obtained the magnetization characteristics and loss characteristics of the four silicon steel sheets at room temperature and ultra-low temperature. Then, through a comparative analysis of experimental data, the applicability of silicon steel sheet material in an ultra-low-temperature environment was verified. Finally, the improved methods of the basic iron loss model of silicon steel sheets and the basic iron loss model of motors were proposed, and the accuracy and feasibility of the improved models were verified.

1. Introduction

With the continuous growth of China’s economy, China’s energy demand will also continue to increase; thus, the environmental pollution problem caused by the growth of energy demand urgently needs to be addressed. In order to achieve the mutual benefits of economic development and ecological protection, we should focus on optimizing the energy structure and take the development of clean energy as the main direction of adjusting the energy structure. Natural gas as a high-quality, clean energy will be the direction of China’s future development. In the future, the huge gap between the supply and demand of natural gas by domestic production is obviously difficult to meet, and will be satisfied incrementally by more imports. A large number of natural gas imports will bring corresponding transportation problems; the transportation of natural gas is generally achieved by liquefaction, and liquefied natural gas (LNG) in the transportation process is usually carried by LNG pumps [1,2,3,4,5].
LNG pumps are divided into submersible and non-submersible pumps, and submersible LNG pumps are commonly used at present. Submersible LNG pump motors need to be immersed in LNG to work, and the working environment temperature can reach −161 °C. Natural gas is a flammable and explosive gas, so it is necessary to control the operating temperature rise of the LNG pump motor, that is, reduce the loss of the LNG pump motor. This is to prevent the motor operating temperature from being too high and causing LNG gasification, resulting in operational safety issues.
Domestic and foreign experts have conducted a lot of research on motor loss. Reference [6] compared and analyzed the performance difference between silicon steel sheets and the SMC material in electric machines. The magnetic field and iron loss were computed and analyzed, and the iron loss variation law in different frequencies was derived through simulation. Reference [7] proposed a precise iron loss prediction model with piecewise variable coefficients. The main loss coefficients varied with the amplitude and frequency of the flux density, through which the influence of the fundamental and harmonic fields on iron losses were effectively considered. Reference [8] presented an algorithm for the identification of anomalous magnetic fields and loss for silicon steel sheets. The anomalous magnetic field was extracted from the measured hysteresis field by excluding the static hysteresis and eddy current fields. Reference [9] measured hysteresis loops and magnetic properties. The behavior of hysteresis loss and eddy current loss at liquid nitrogen temperature were discussed in detail. It was shown that the permeability and iron loss of nonoriented silicon steel is increased at low temperatures.
Motor loss is generally divided into stator loss, rotor loss, copper loss, wind friction loss, etc., of which motor stator loss generally accounts for a large proportion of and has a significant impact on the total motor loss. At present, most of the numerical studies on motor iron loss by domestic and foreign experts are based on the traditional iron loss model. The hysteresis loss coefficient and eddy current loss coefficient of the traditional iron loss model are constant, ignoring the influence of frequency and magnetic induction intensity on the iron loss coefficient. Some experts have carried out segmented studies on the coefficient of the iron loss model, but the iron loss calculation model has not been improved, and there is a lack of studies on the iron loss calculation model at ultra-low temperatures.
The silicon steel sheet material studied in this research was the stator material for a submerged LNG pump motor that was tested in an ultra-low-temperature environment below −161 °C. There are few studies on the magnetic properties and loss changes of silicon steel sheets in ultra-low-temperature environments. Therefore, this study tested various silicon steel sheet materials in room-temperature and ultra-low-temperature environments and compared the experimental data at room temperature and ultra-low temperature to verify whether the silicon steel sheet material for the motor stator could be used in an ultra-low-temperature environment. Based on the experimental data of the silicon steel sheets, a new approach is proposed to calculate the basic iron loss of silicon steel sheets in room-temperature and ultra-low-temperature environments, and the original formula for calculating the basic iron loss of silicon steel sheets is improved. The improved basic iron loss model can quickly and accurately calculate iron loss at different frequencies and magnetic induction intensities, which solves the problem of the large calculation error of the traditional basic iron loss model in the unconventional frequency range. This study also provides a calculation model for the numerical calculation of basic iron loss at ultra-low temperatures.

2. Ultra-Low-Temperature Experiment of Motor Stator Material

A cryogenic permanent magnet motor stator for an LNG pump works in −161 °C liquefied natural gas. In order to explore the characteristics of the motor stator material in an ultra-low-temperature environment and determine the applicability of the motor stator material for the LNG pump, ultra-low-temperature characteristic experiments of the motor stator materials were carried out in this paper. As liquefied natural gas (LNG) is a flammable and explosive liquid, in order to ensure the safety of the experiment, the ultra-low-temperature experiment of the motor stator material was carried out in liquid nitrogen. The ambient temperature of liquid nitrogen is −196 °C, lower than that of liquefied natural gas, thereby meeting the requirements of the ultra-low-temperature experiment environment.
In order to explore the applicability of the stator materials of the cryogenic permanent magnet motor for the LNG pump, four kinds of silicon steel sheets were selected for ultra-low-temperature characteristic experiments. The experimental instrument was the SY-8258 hysteresis-loop measurement instrument. In order to compare the influence of ultra-low-temperature environments on the characteristics of silicon steel sheets, the four kinds of silicon steel sheets were tested at room temperature and ultra-low temperature. The room-temperature experiment was completed in a room-temperature environment of 20 °C and the ultra-low-temperature experiment was completed in a liquid nitrogen environment of −196 °C. The experimental equipment at room temperature and ultra-low temperature are shown in Figure 1 and Figure 2. Two copper wires were wound around the silicon steel sheet samples, which respectively served as the primary coil and the secondary coil. During the room-temperature experiment, the silicon steel sheet sample was placed in the test box and connected to the test box by copper wire. During the ultra-low-temperature experiment, the silicon steel sheet sample was completely immersed in liquid nitrogen for 1 h until it was stable and connected to the test box by the copper wire wound around the sample. During the test, the sample was placed in a liquid nitrogen container, which needed to be as closed as possible to prevent the rapid volatilization of the liquid nitrogen when in contact with air, which would have affected the test results [10].

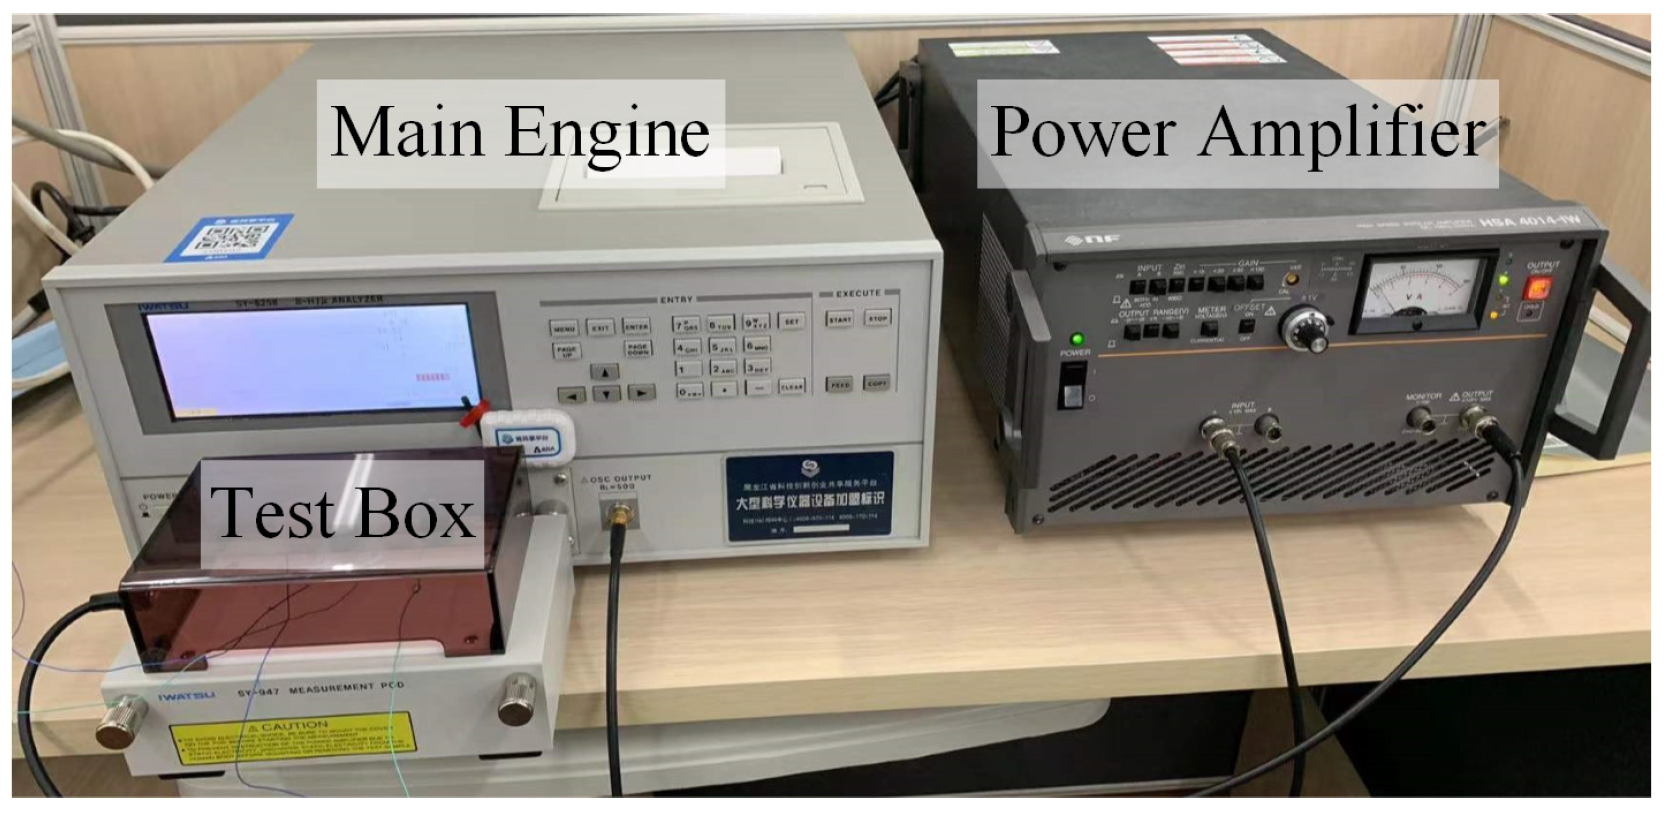
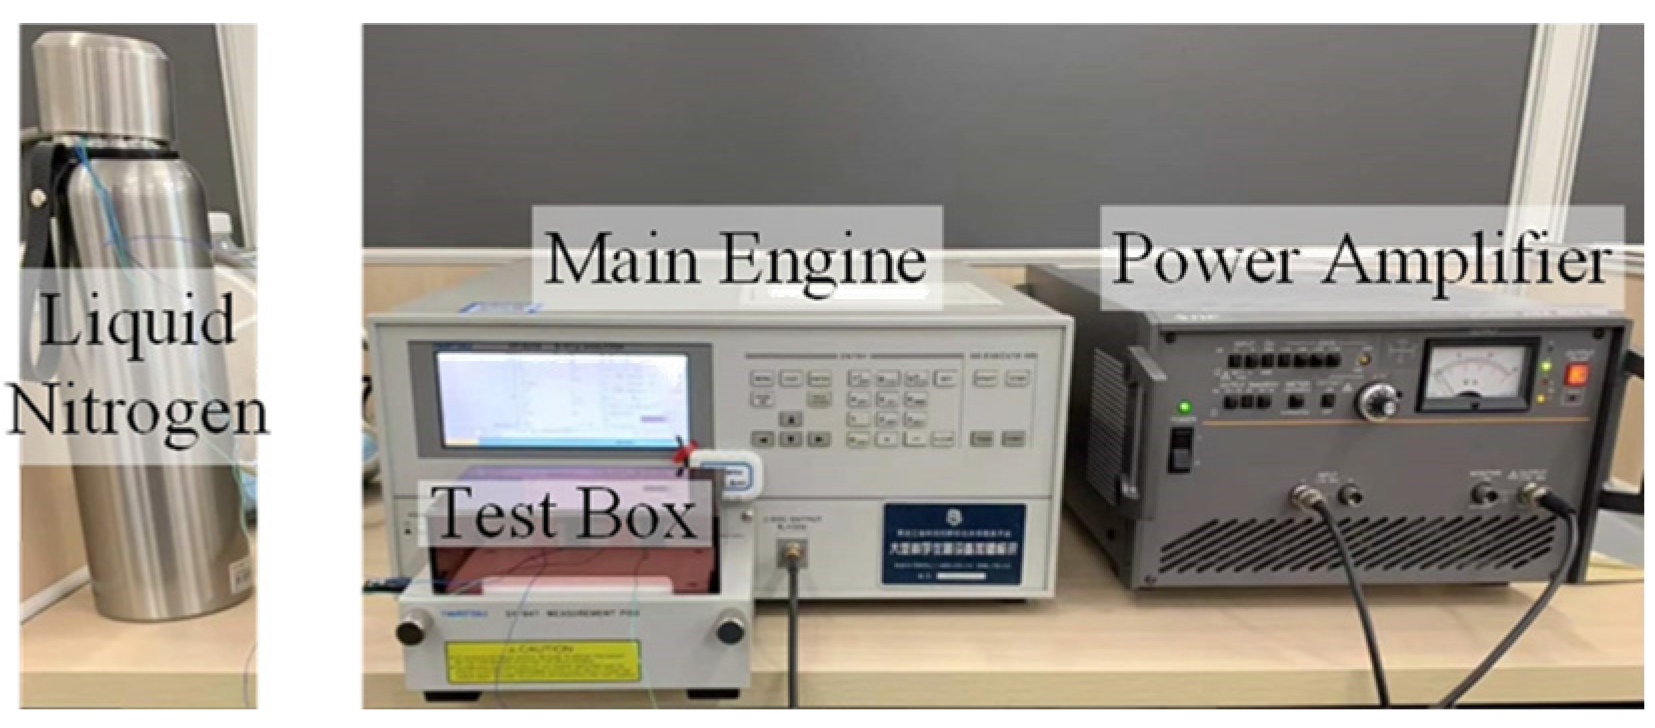
2.1. Magnetization Experiment of Silicon Steel Sheets

In this study, the four kinds of silicon steel sheets were sample 1, 15SW1100 (medium-frequency thin strip series products); sample 2, 20SW1500 (stress relief annealing series products); sample 3, 30SWH1500 (high-efficiency series products); and sample, 4 50W310 (national standard general series products). The above four kinds of silicon steel sheets were magnetized at room temperature and ultra-low temperature, and the magnetization curves (BH curves) of the four silicon steel sheets are shown in Figure 3.
Figure 3 shows that under the same magnetic field intensity, the magnetic induction intensity of the four silicon steel sheets at ultra-low temperature was higher than that at room temperature. When the material was saturated, the magnetic induction intensity of sample 1 at ultra-low temperature was 1.1% higher than that at room temperature, the magnetic induction intensity of sample 2 at ultra-low temperature was 1.2% higher than that at room temperature, the magnetic induction intensity of sample 3 at ultra-low temperature was 1.7% higher than that at room temperature, and the magnetic induction intensity of sample 4 at ultra-low temperature was 4.2% higher than that at room temperature. By comparison, the magnetic induction intensity of the four silicon steel sheets after saturation from large to small was sample 4, sample 3, sample 2, and sample 1.
In this research, a cryogenic permanent magnet motor for an LNG pump was studied. The ambient temperature during motor operation was −161 °C (LNG) and the ambient temperature during motor shutdown was room temperature. The motor in this study was repeatedly at ultra-low temperature and room temperature. In order to explore whether the characteristics of the four silicon steel sheets were affected after being restored to room temperature from ultra-low temperature, the silicon steel sheets that had been stable at ultra-low temperature (liquid nitrogen −196 °C) were taken out and measured after standing at room temperature (20 °C) for 1 h. The magnetization curves (BH curves) of the four silicon steel sheets are shown in Figure 4.
Figure 4 shows that the magnetization curves of the four silicon steel sheets after being restored to room temperature from ultra-low temperature basically coincided with the magnetization curves at initial room temperature, without any loss of magnetization characteristics. Therefore, these four kinds of silicon steel sheets can repeatedly work at ultra-low temperature and room temperature.
Figure 3 and Figure 4 show that the four kinds of silicon steel sheets did not have ultra-low temperature magnetic loss, and the magnetic induction intensity after saturation did not change with the ambient temperature. Therefore, the magnetization characteristics of the four silicon steel sheets were not affected by ultra-low-temperature environmental factors and can be used for cryogenic temperature permanent magnet motors for LNG pumps.

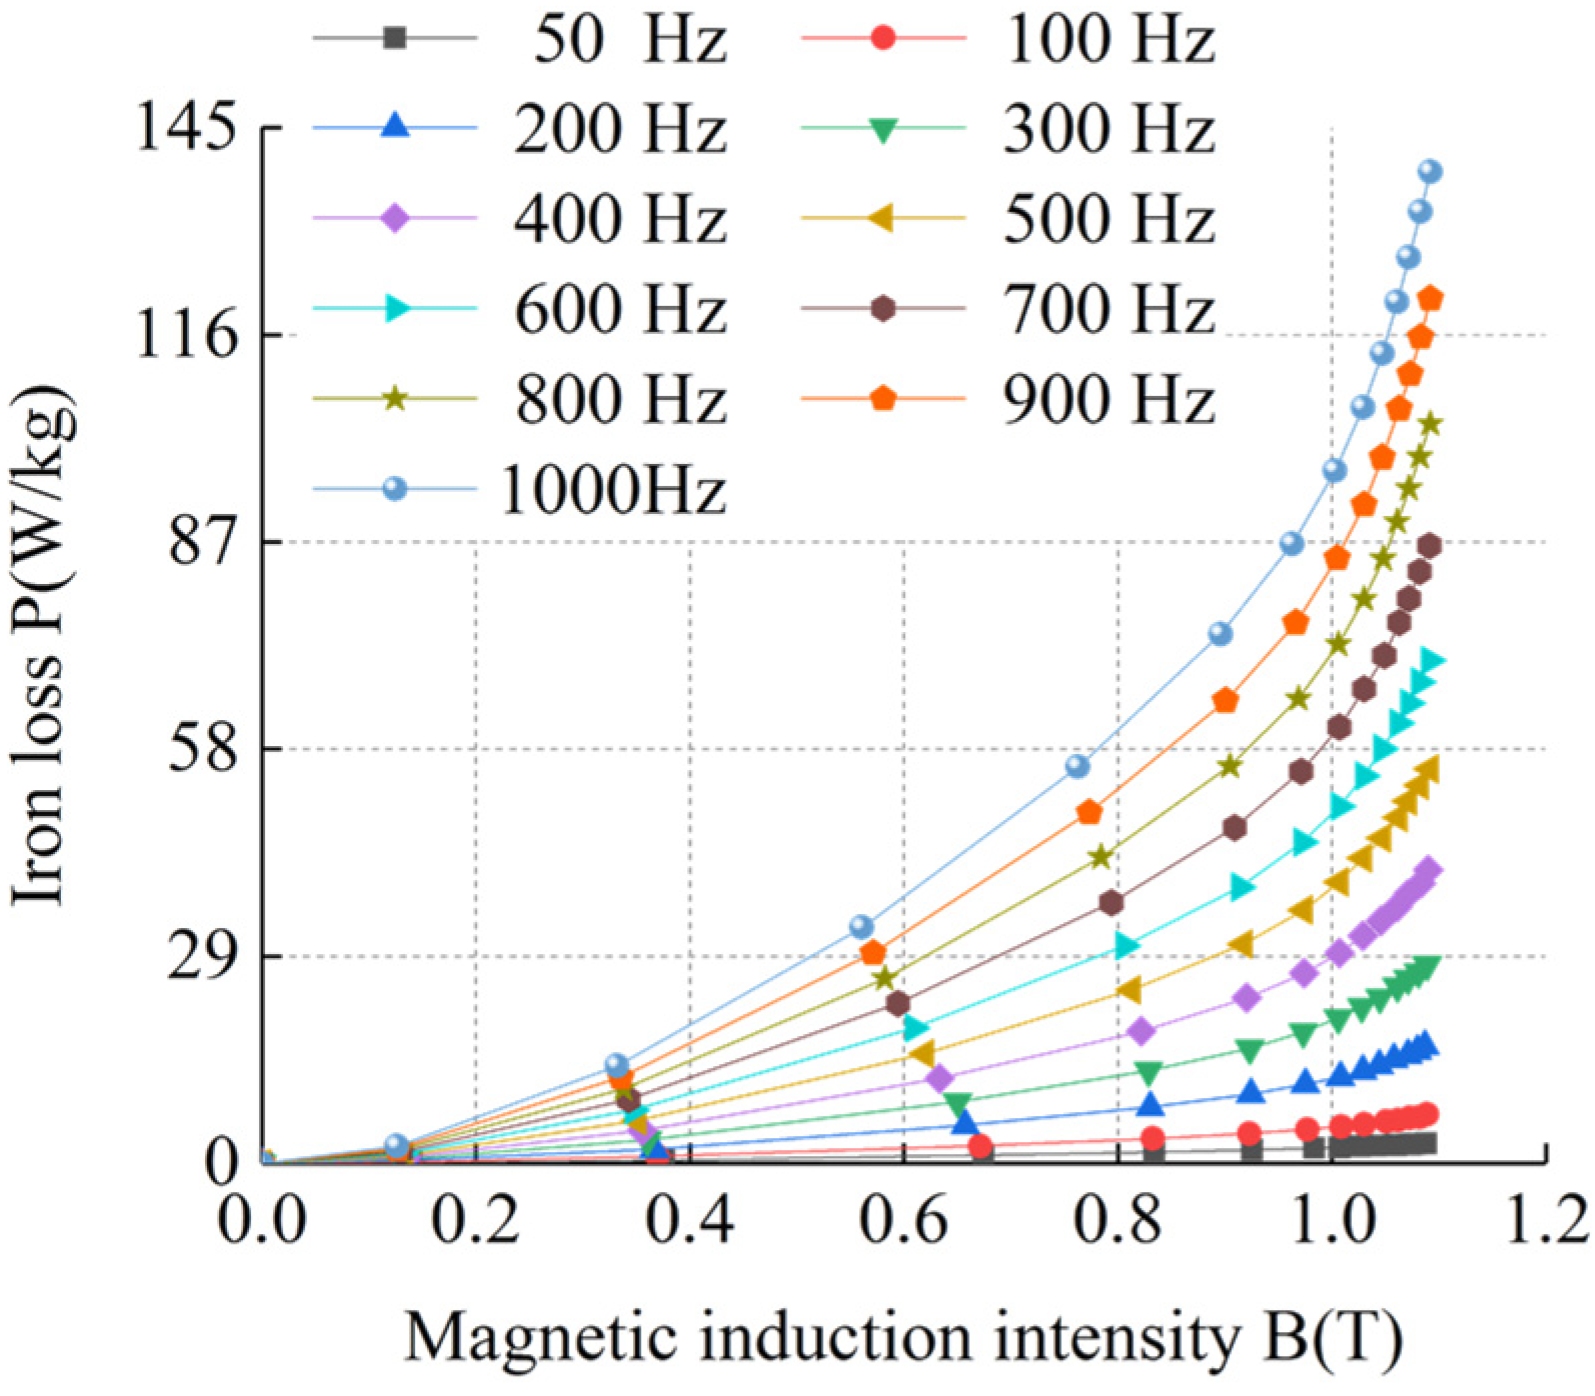
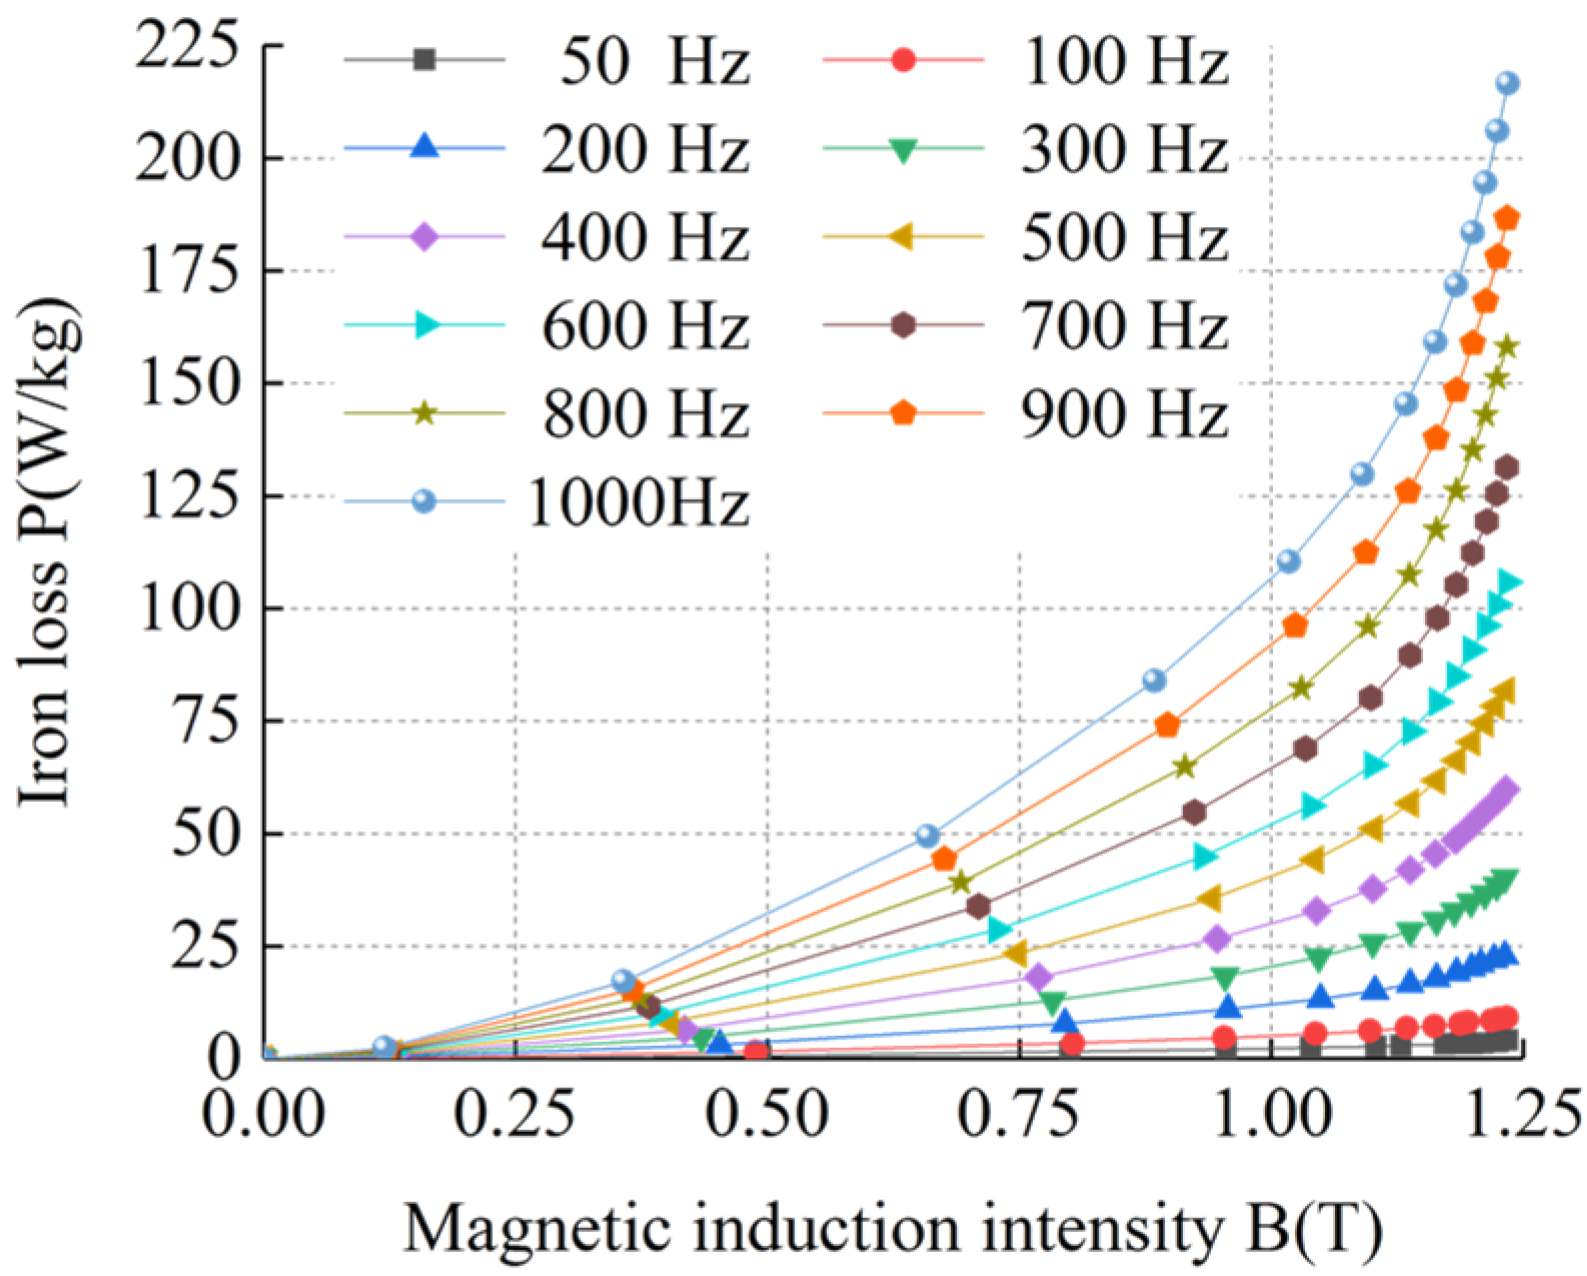
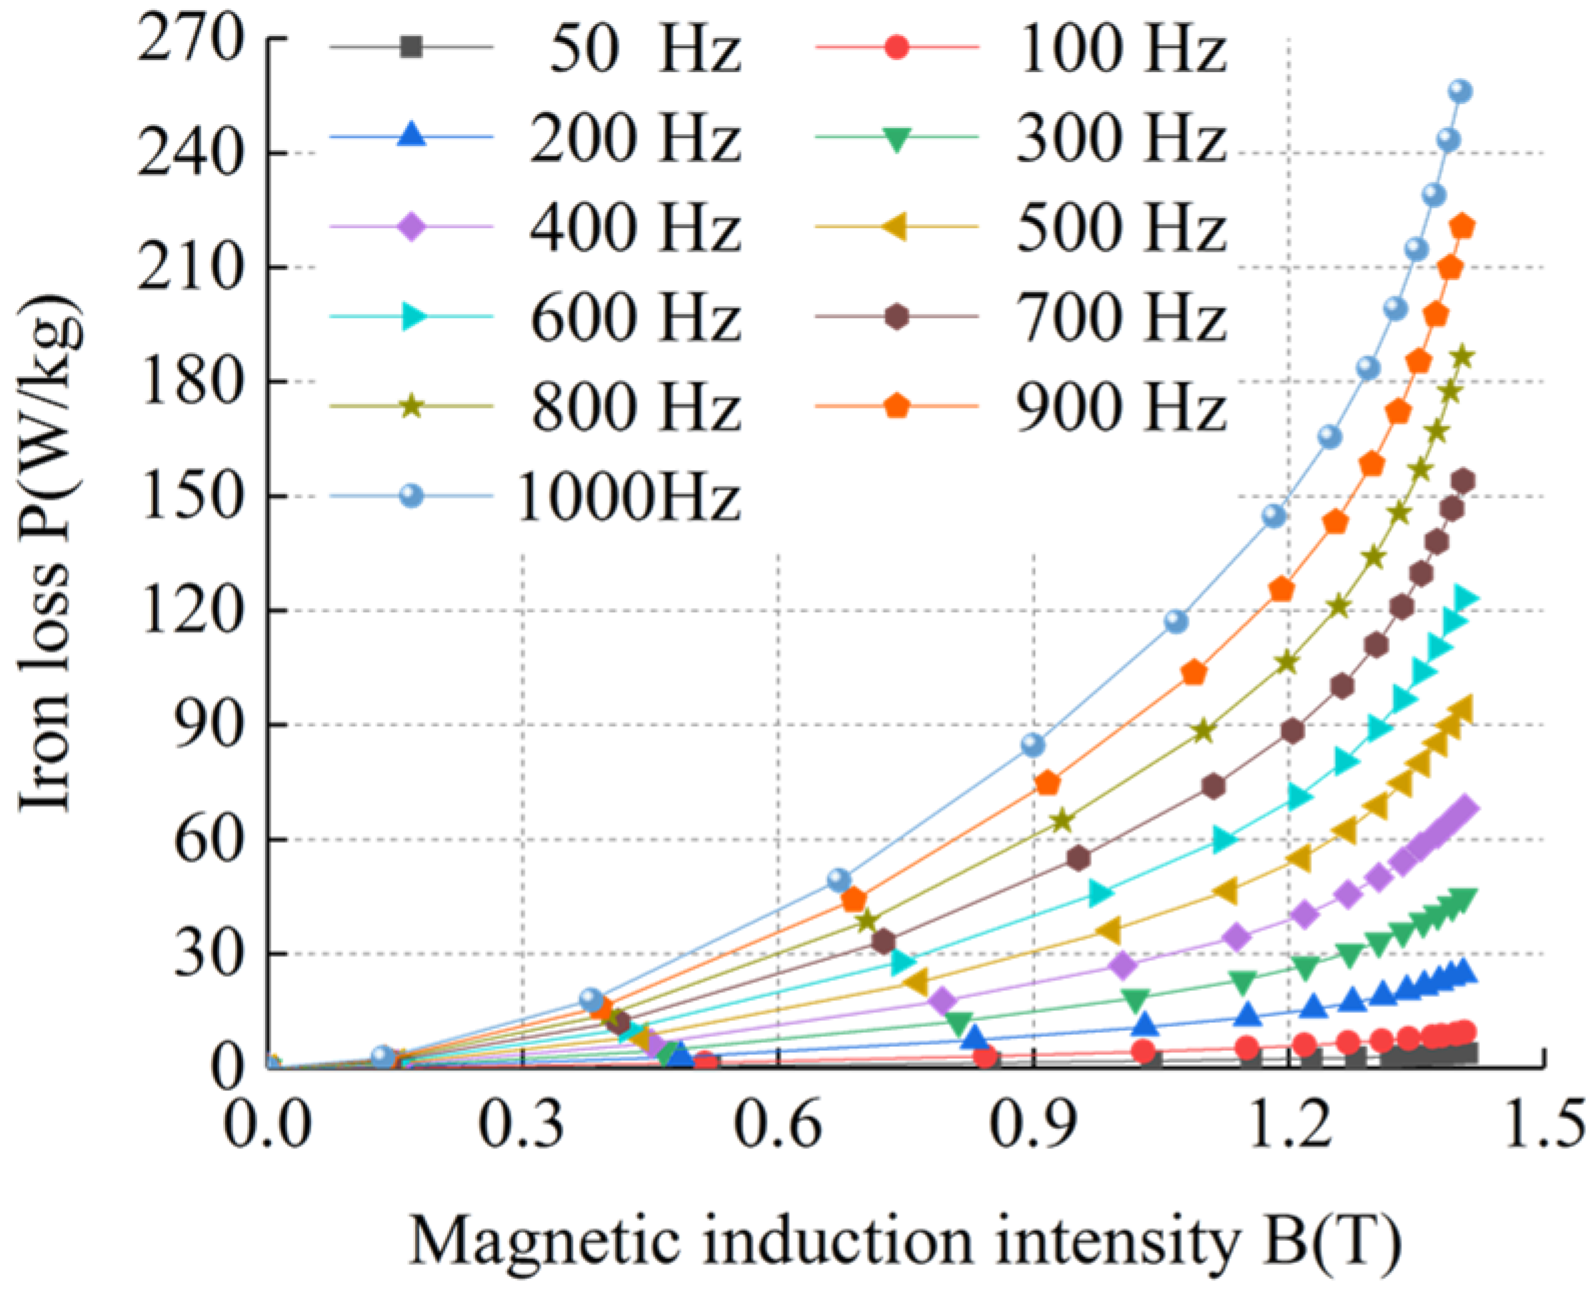
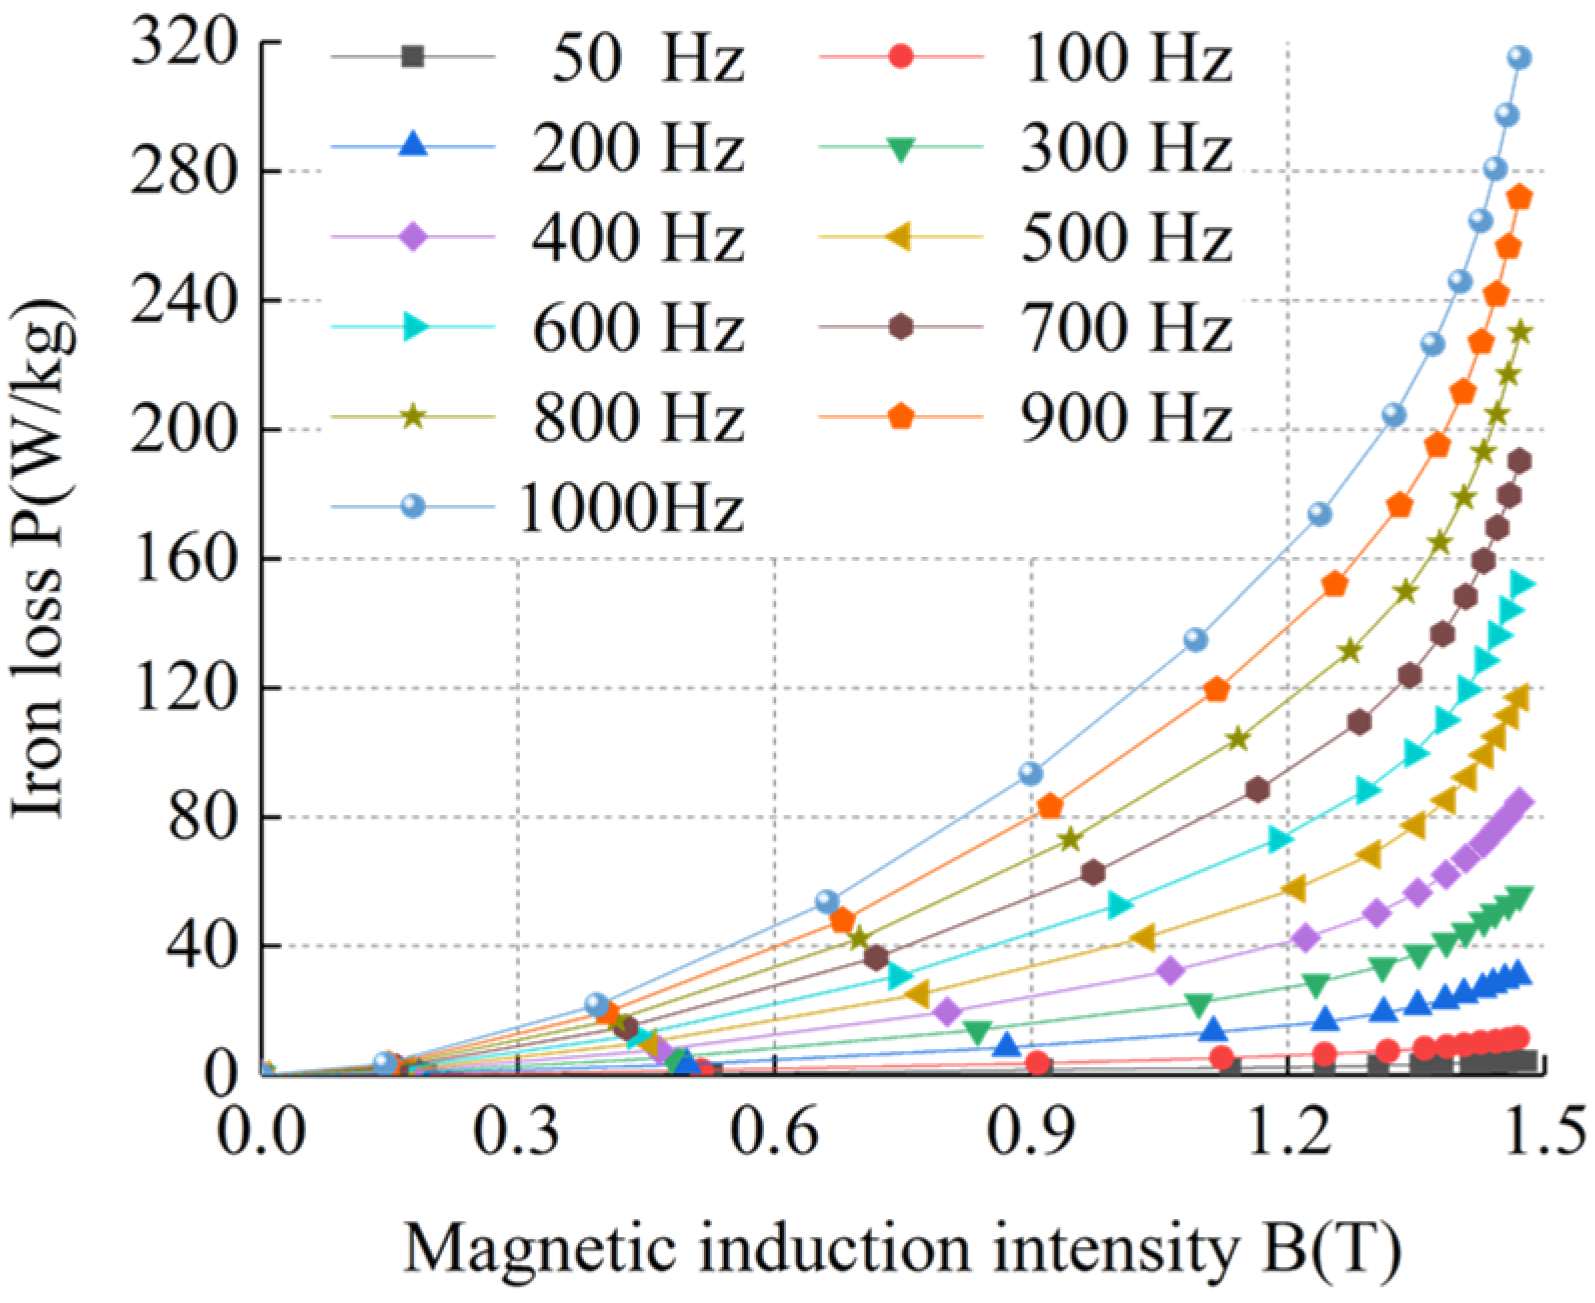
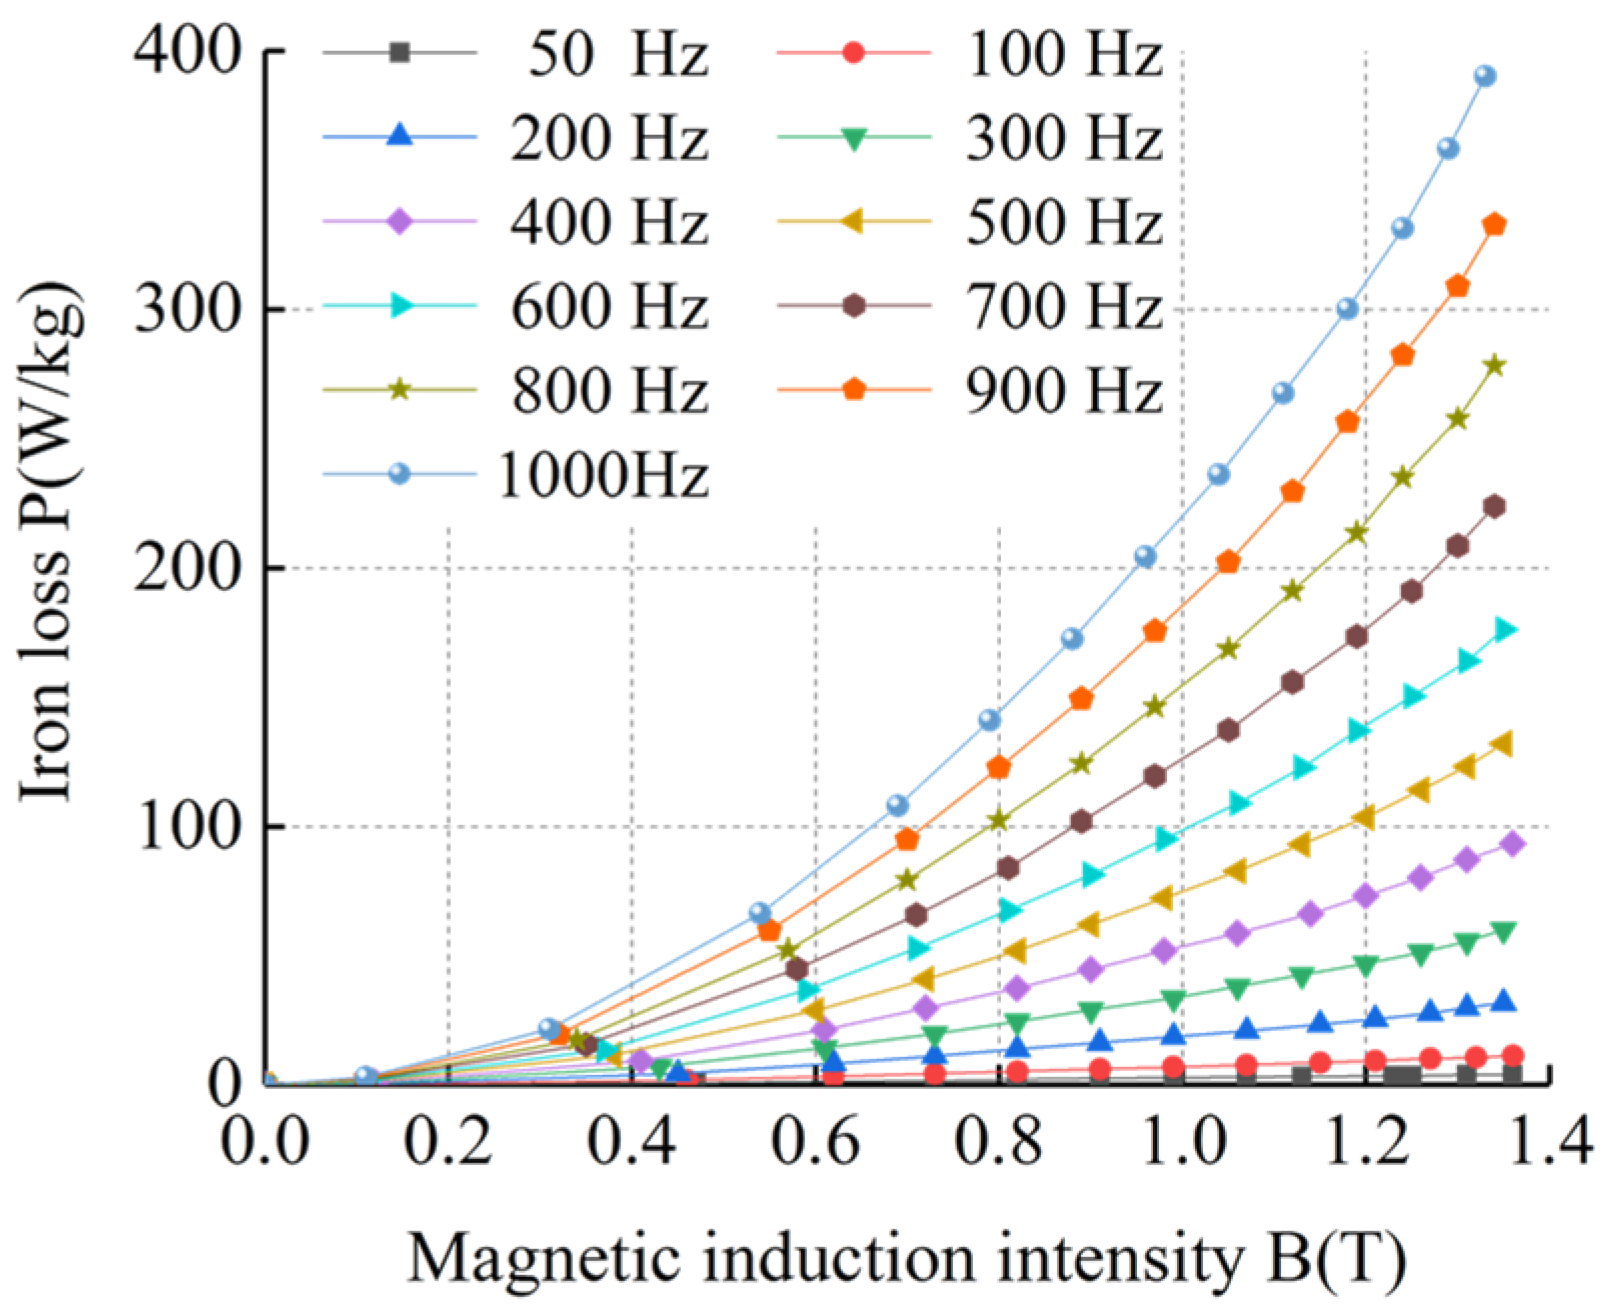
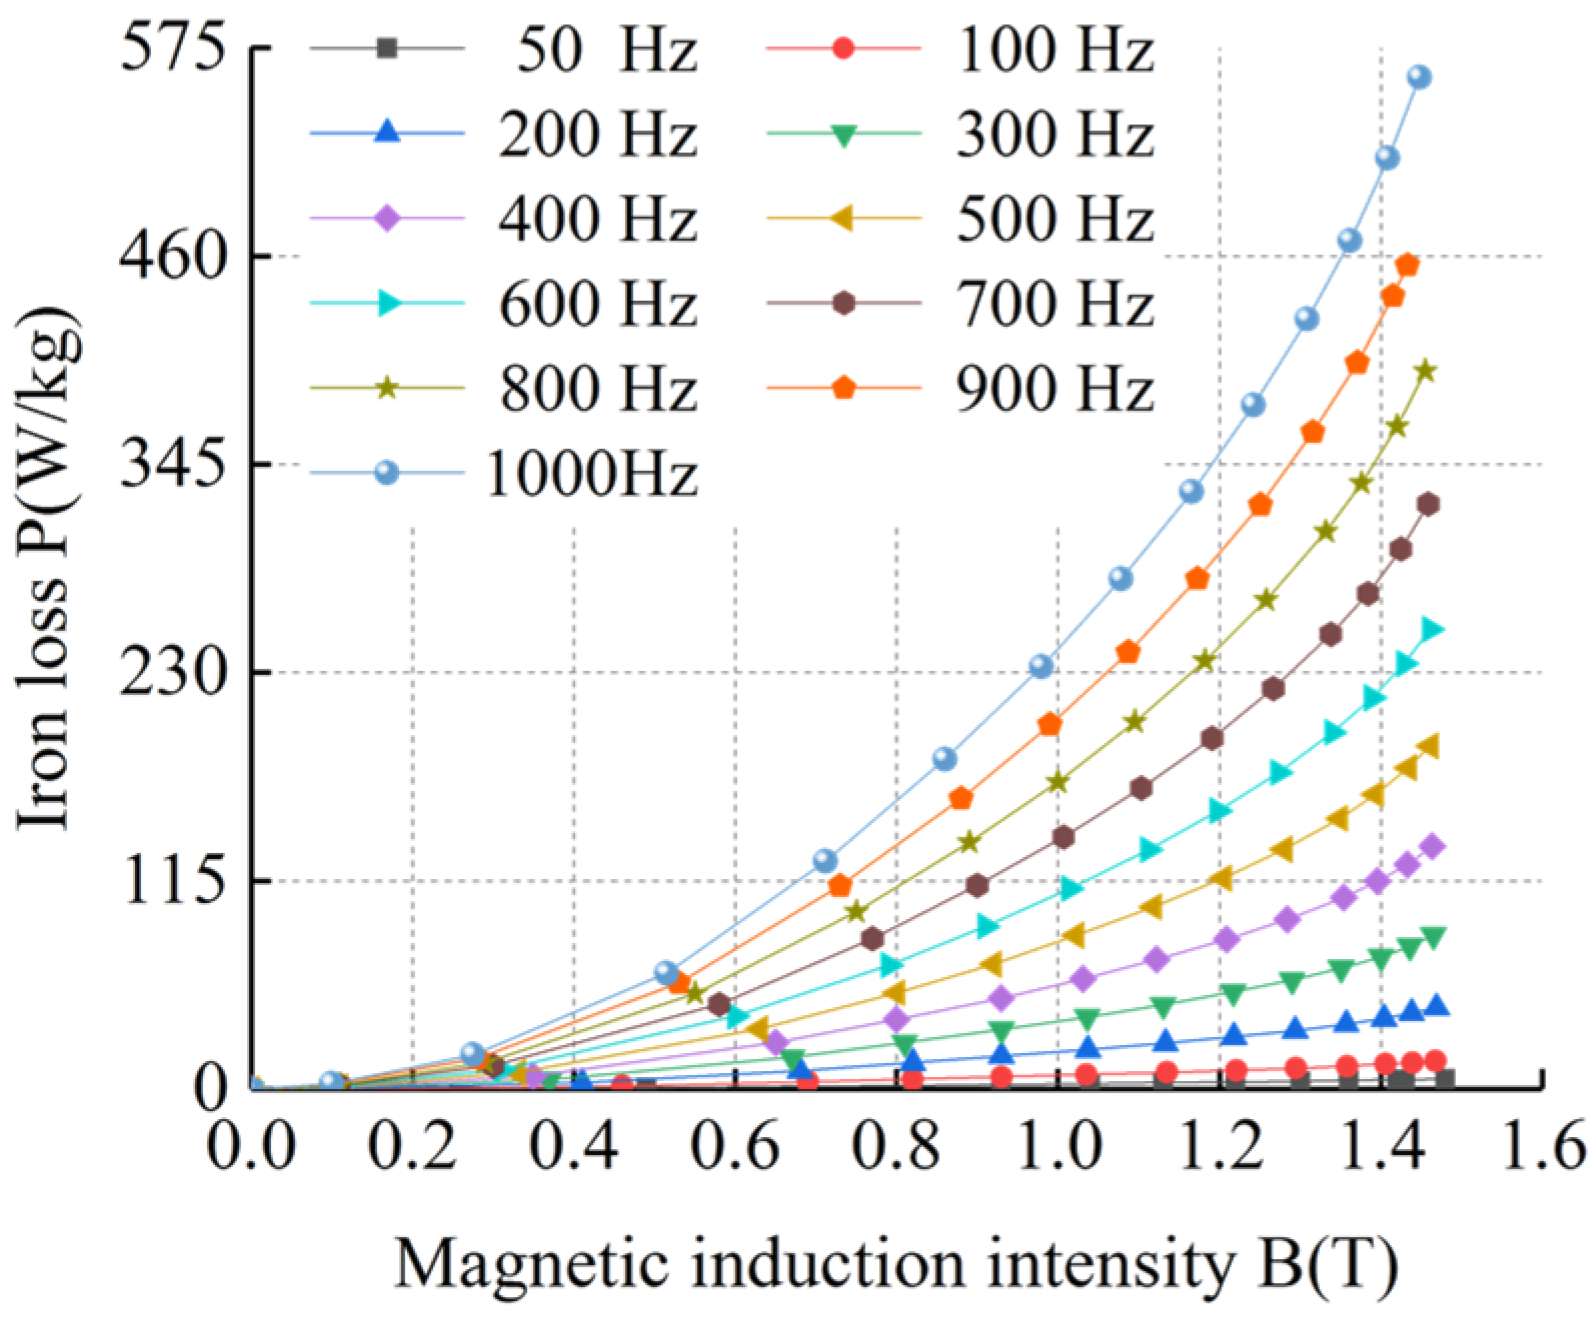
2.2. Loss Experiment of Silicon Steel Sheets

In order to explore the influence of an ultra-low-temperature environment on the loss characteristics of silicon steel sheets, the four kinds of silicon steel sheets were tested at room temperature and ultra-low temperature, and the loss curves (BP curves) of the four silicon steel sheets are shown in Figure 5, Figure 6, Figure 7, Figure 8, Figure 9, Figure 10, Figure 11 and Figure 12.
Figure 5, Figure 6, Figure 7, Figure 8, Figure 9, Figure 10, Figure 11 and Figure 12 show that the loss curve trends of the four silicon steel sheets were basically the same at room temperature and ultra-low temperature. The loss gradually increased with the increase in magnetic induction intensity and also with the increase in frequency. By comparing the loss curves of the same silicon steel sheet at room temperature and ultra-low temperature, it can be seen that under the same frequency and magnetic induction intensity, the losses of the four silicon steel sheets at ultra-low temperature were always higher than those at room temperature. When the frequency and magnetic flux density were the same, the losses of the four silicon steel sheets from high to low were sample 4, sample 3, sample 2, and sample 1 at room temperature and ultra-low temperature.
In order to explore the impact of the four silicon steel sheets being repeatedly in room-temperature and ultra-low-temperature environments on their loss characteristics, the silicon steel sheets that had been stabilized in the ultra-low-temperature environment (−196 °C) were taken out and measured after standing in a room-temperature environment (20 °C) for 1 h. Because there were many frequencies tested in this study, in order to better reflect the comparison results, three frequency data were selected for comparison in this paper. The selected frequencies are 50 Hz, 500 Hz, and 1000 Hz. A comparison of these three frequency data for the four silicon steel sheets is shown in Figure 13, Figure 14, Figure 15 and Figure 16.
Figure 13, Figure 14, Figure 15 and Figure 16 show that the loss curves at room temperature and ultra-low temperature recovery to room temperature basically coincided, without any loss characteristics missing. Therefore, these four kinds of silicon steel sheets can repeatedly work in ultra-low-temperature and room-temperature environments.

3. Research on Basic Iron Loss of Silicon Steel Sheets

3.1. Basic Iron Loss Model of Silicon Steel Sheets

The basic iron loss of silicon steel sheets mainly consists of hysteresis loss and eddy current loss. In order to facilitate the numerical calculation of the basic iron loss of silicon steel sheets, an improved method of the basic iron loss calculation model of silicon steel sheets per unit weight was proposed. The improved calculation model for the basic iron loss of silicon steel sheets per unit weight is a function of frequency and magnetic induction intensity, which can reduce the numerical calculation steps of the basic iron loss of silicon steel sheets and increase the numerical calculation speed of motor stator iron loss [11,12,13]. The establishment of the improved iron loss model of silicon steel sheets is based on the following assumptions: the silicon steel sheet is uniformly laminated, the magnetic induction intensity is uniformly distributed in the silicon steel sheet, and the influence of the eddy current skin effect is ignored.
Hysteresis loss calculation formula:
p h = k h f B α
Eddy current loss calculation formula:
p e = k e ( f B ) 2
Basic iron loss of silicon steel sheet calculation formula:
p Fe = p h + p e = k h f B α + k e ( f B ) 2
where p Fe is the basic iron loss per unit weight, p h is the hysteresis loss per unit weight, p e is the eddy current loss per unit weight, k h is the hysteresis loss coefficient, k e is the eddy current loss coefficient, and α is the material magnetic coefficient.
According to the comparison of loss curves of the silicon steel sheets, the loss of sample 1 was the lowest when the frequency and magnetic induction intensity were the same at room temperature and ultra-low temperature. Taking sample 1 as an example, based on the measured data of silicon steel sheet loss at room temperature and ultra-low temperature, the loss curve of silicon steel sheets was fitted by the least square method [14]. The hysteresis loss coefficient k h , eddy current loss coefficient k e , and material magnetic coefficient α of sample 1 at different frequencies in room-temperature and ultra-low-temperature environments are shown in Table 1 and Table 2 [15].
According to the fitting data in Table 1 and Table 2, the curves of hysteresis loss coefficient and eddy current loss coefficient at room temperature and ultra-low temperature are shown in Figure 17 and Figure 18.
Figure 17 and Figure 18 show that the variation trends of hysteresis loss coefficient and eddy current loss coefficient were basically the same at room temperature and ultra-low temperature. The hysteresis loss coefficient and eddy current loss coefficient at ultra-low temperature were both higher than those at room temperature. The objective function Formula (4) was selected based on the curve of hysteresis loss coefficient and eddy current loss coefficient, and the curve was fitted by the least square method.
y = a 1 e x b 1 + a 2 e x b 2 + c
The fitting functions of hysteresis loss coefficient and eddy current loss coefficient at room temperature and ultra-low temperature were obtained by parameter fitting, as shown in (5)–(8).
Hysteresis loss coefficient fitting formula at room temperature:
k h = 1.68 e f 76.88 10.55 e f 722.97 + 11.24 × 10 3
Hysteresis loss coefficient fitting formula at ultra-low temperature:
k h = 4.55 e f 385.58 2.87 e f 42.42 + 5.39 × 10 3
Eddy current loss coefficient fitting formula at room temperature:
k e = 15.8 e f 42.77 + 3.65 e f 280.66 + 0.8 × 10 4
Eddy current loss coefficient fitting formula at ultra-low temperature:
k e = 16.8 e f 40.42 + 3.88 e f 270.79 + 0.85 × 10 4
In order to verify the accuracy of the fitting function of the hysteresis loss coefficient and eddy current loss coefficient, the error between the fitted value of the fitting function and the calculated value was calculated based on the error formula.
Error calculation formula:
k e r = k f i k c a k c a × 100 %
where k e r is the percentage of error, k f i is the fitted value, and k c a is the calculated value.
The fitted values and fitting errors of the hysteresis loss coefficient and eddy current loss coefficient fitting functions at room temperature and ultra-low temperature are shown in Table 3 and Table 4.
Table 3 and Table 4 show that the average fitting errors of the hysteresis loss coefficient and eddy current loss coefficient fitting functions at room temperature and ultra-low temperature were within 3%, which was within a reasonable range and met the actual engineering calculation requirements. By substituting the fitting function Formulas (5)–(8) into the basic iron loss calculation model of silicon steel sheets, the improved calculation formulas of the basic iron loss of silicon steel sheets could be obtained.

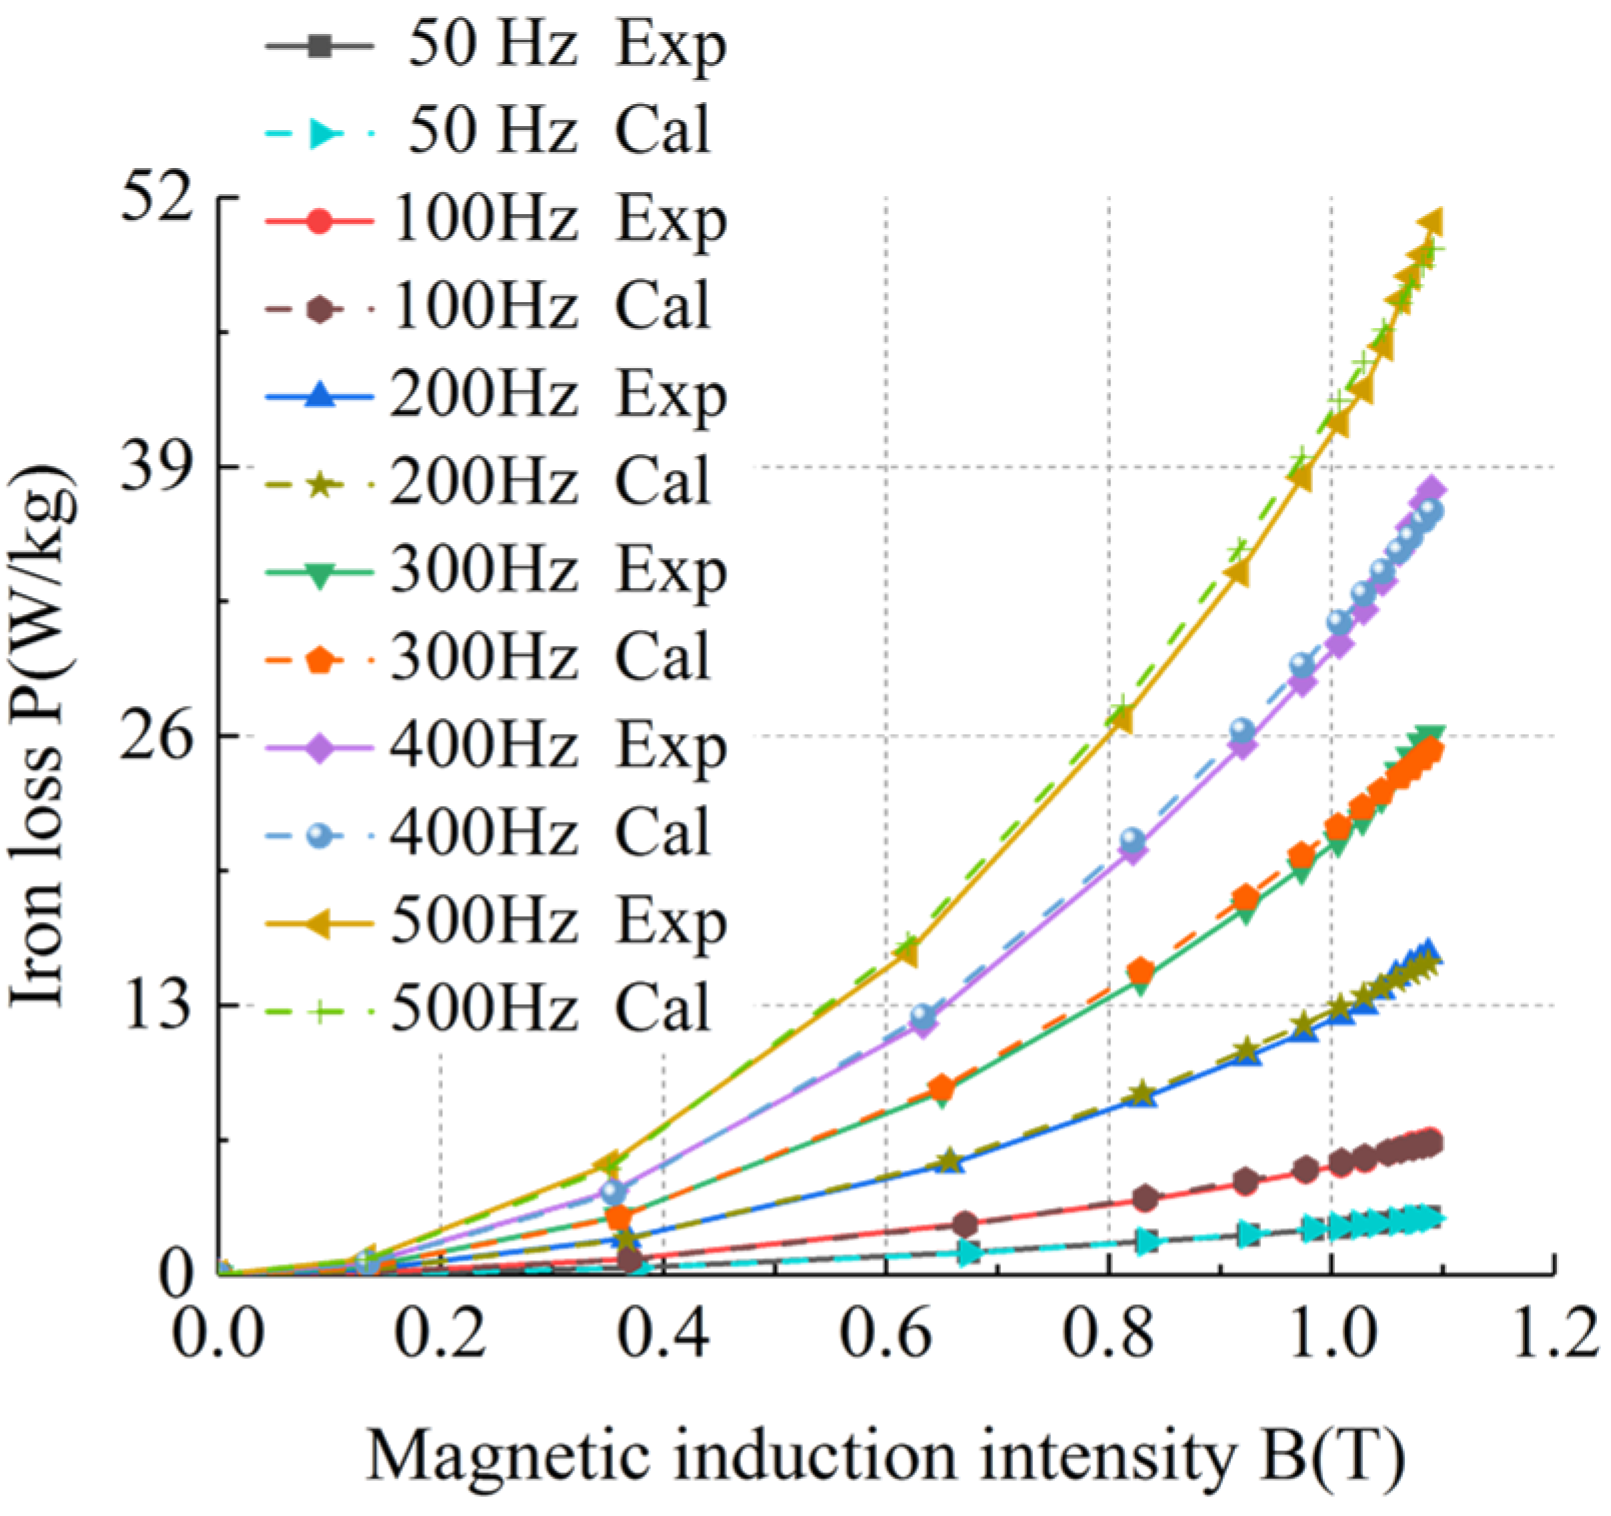
3.2. Feasibility Verification of the Improved Basic Iron Loss Model of Silicon Steel Sheets

Based on the basic iron loss model of silicon steel sheets, an improved model of basic iron loss of silicon steel sheets was obtained by fitting the hysteresis loss coefficient and eddy current loss coefficient using the least squares method. Taking sample 1 as an example, the calculated value of the improved basic iron loss model of silicon steel sheets was compared with the experimental value to verify the accuracy and feasibility of the improved basic iron loss model of silicon steel sheets. The comparison results of the iron loss of silicon steel sheets under different frequencies at room temperature and ultra-low temperature are shown in Figure 19, Figure 20, Figure 21 and Figure 22.
The errors between the calculated values of the improved basic iron loss model of sample 1 and the experimental values at room temperature and ultra-low temperature are shown in Table 5.
Table 5 shows that the errors between the calculated values of the improved basic iron loss model and the experimental values were within 3%, meeting the actual engineering calculation requirements and verifying the accuracy and feasibility of the improved basic iron loss model of silicon steel sheets.

4. Research on the Basic Iron Loss for Motors

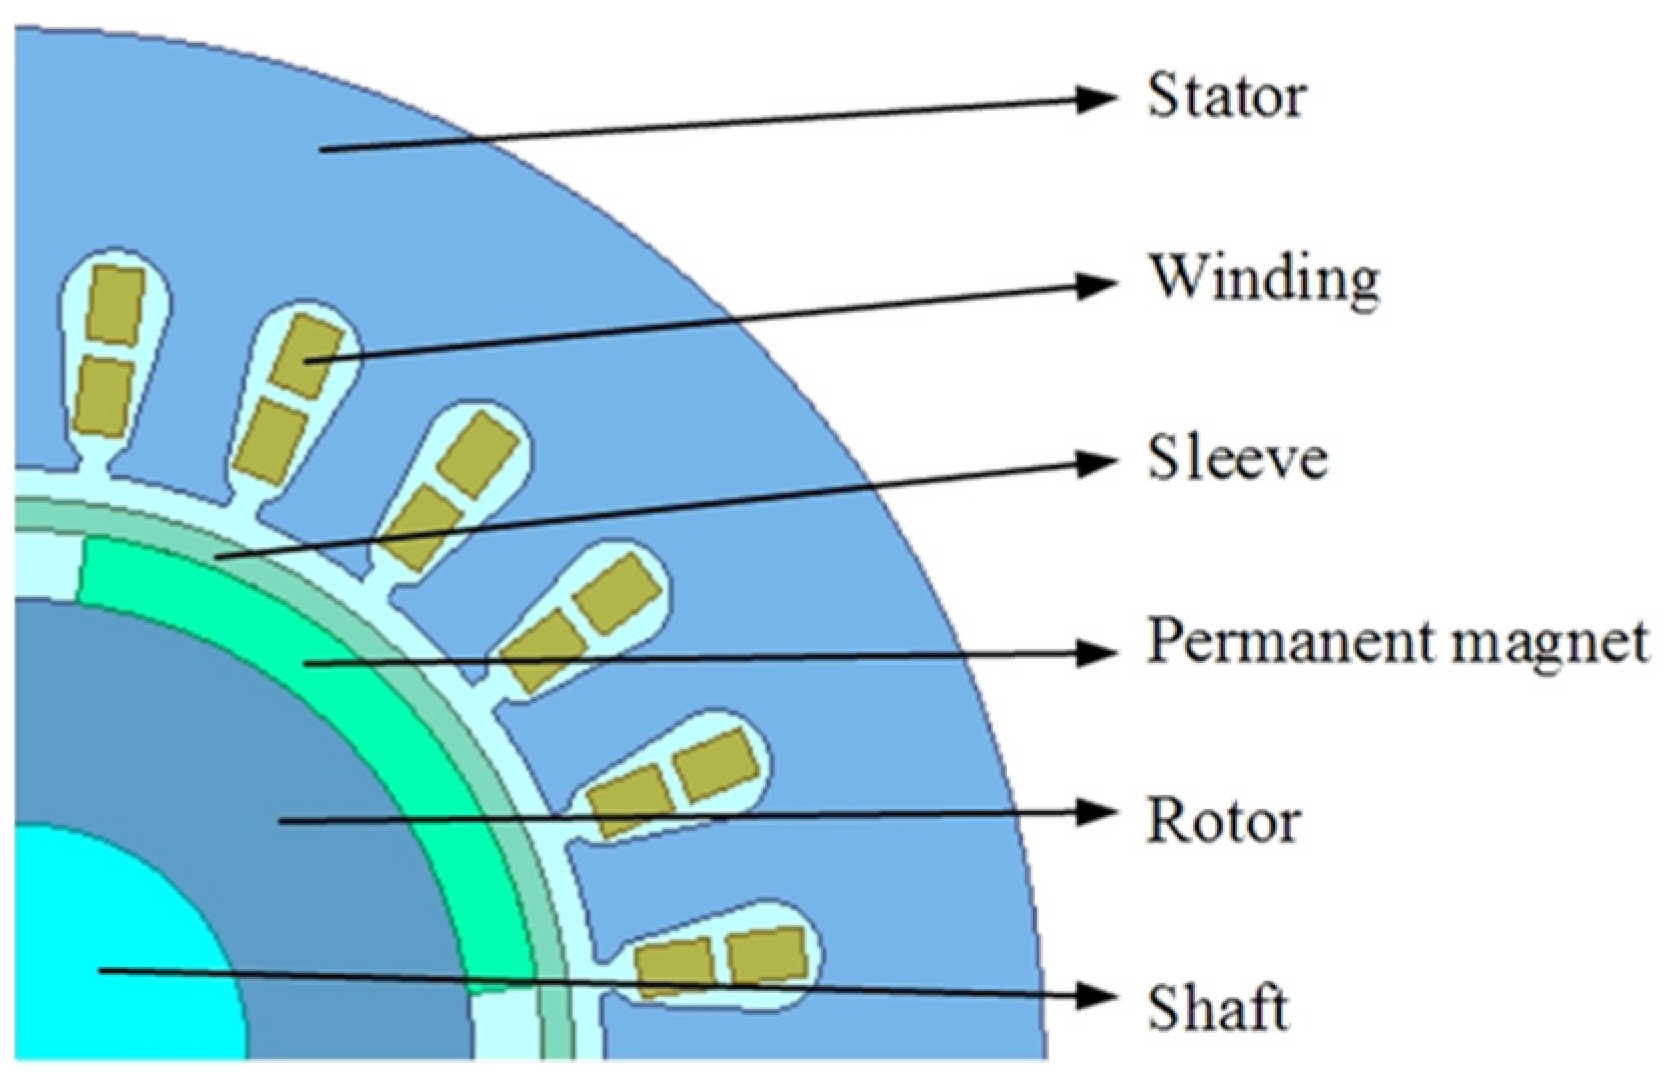
4.1. Basic Iron Loss Model of Motors

Silicon steel sheets need to be laminated for motor production. After the silicon steel sheet is laminated, the distribution of magnetic induction intensity is uneven, the variation of magnetic induction intensity is non-sinusoidal, and the loss difference between rotating magnetization and alternating magnetization causes the loss to increase. Therefore, in this study, a 30 kW cryogenic permanent magnet motor for an LNG pump was taken as an example, as shown in Figure 23, in order to explore the basic iron loss model of motors at room temperature and ultra-low temperature.
The exploration of the basic iron loss model of motors took sample 1 as an example. The motor stator material was set as sample 1. The finite element simulation was carried out on the motor to simulate the motor loss with different frequencies and stator magnetic induction intensities. In order to ignore the influence of the motor stator structure on the basic iron loss model of the motor, the extracted magnetic induction intensity of the motor stator was the average value. After finite element simulation, the iron losses of the motor stator with different frequencies and stator magnetic induction intensities at room temperature and ultra-low temperature are shown in Figure 24.
Figure 24 shows that under the same frequency and magnetic induction intensity, the iron loss of the motor stator at ultra-low temperature was always higher than that at room temperature, which is consistent with the change of the silicon steel sheet. It can be seen that the performance of the silicon steel sheet determined the change in motor iron loss, so the basic iron loss model of the motor could be studied based on the improved basic iron loss model of silicon steel sheets. The calculation formula of the basic iron loss for motors is shown in (10).
Basic iron loss for motors calculation formula:
P Fe = k c p Fe G Fe
where k c is the conversion coefficient, p Fe is the basic iron loss for silicon steel sheets, and G Fe is the calculating component weight.
The iron loss of the motor stator was calculated based on the basic iron loss model of silicon steel sheets. The conversion coefficient of the basic iron loss model of the motor was obtained by comparing the calculated value with the simulated value of the motor stator iron loss. The conversion coefficients with different frequencies and stator magnetic induction intensities at room temperature and ultra-low temperature are shown in Figure 25.
The objective function Formula (11) was determined according to the change in the three-dimensional surface in Figure 25. The fitting functions of the conversion coefficient at room temperature and ultra-low temperature were obtained by surface fitting, as shown in (12)–(13).
z = z 0 + n = 1 + a n x n + n = 1 + b n y n
Conversion coefficient fitting formula at room temperature:
k c = 73.779 0.01 f + 3.025 × 10 5 f 2 5.01 × 10 8 f 3 + 4.169 × 10 11 f 4 1.35 × 10 14 f 5   + 493.552 B 1196.852 B 2 + 1395.942 B 3 782.333 B 4 + 167.685 B 5
Conversion coefficient fitting formula at ultra-low temperature:
k c = 90.116 0.01 f + 3.065 × 10 5 f 2 4.909 × 10 8 f 3 + 3.954 × 10 11 f 4 1.248 × 10 14 f 5   + 583.073 B 1384.303 B 2 + 1585.51 B 3 875.472 B 4 + 185.705 B 5

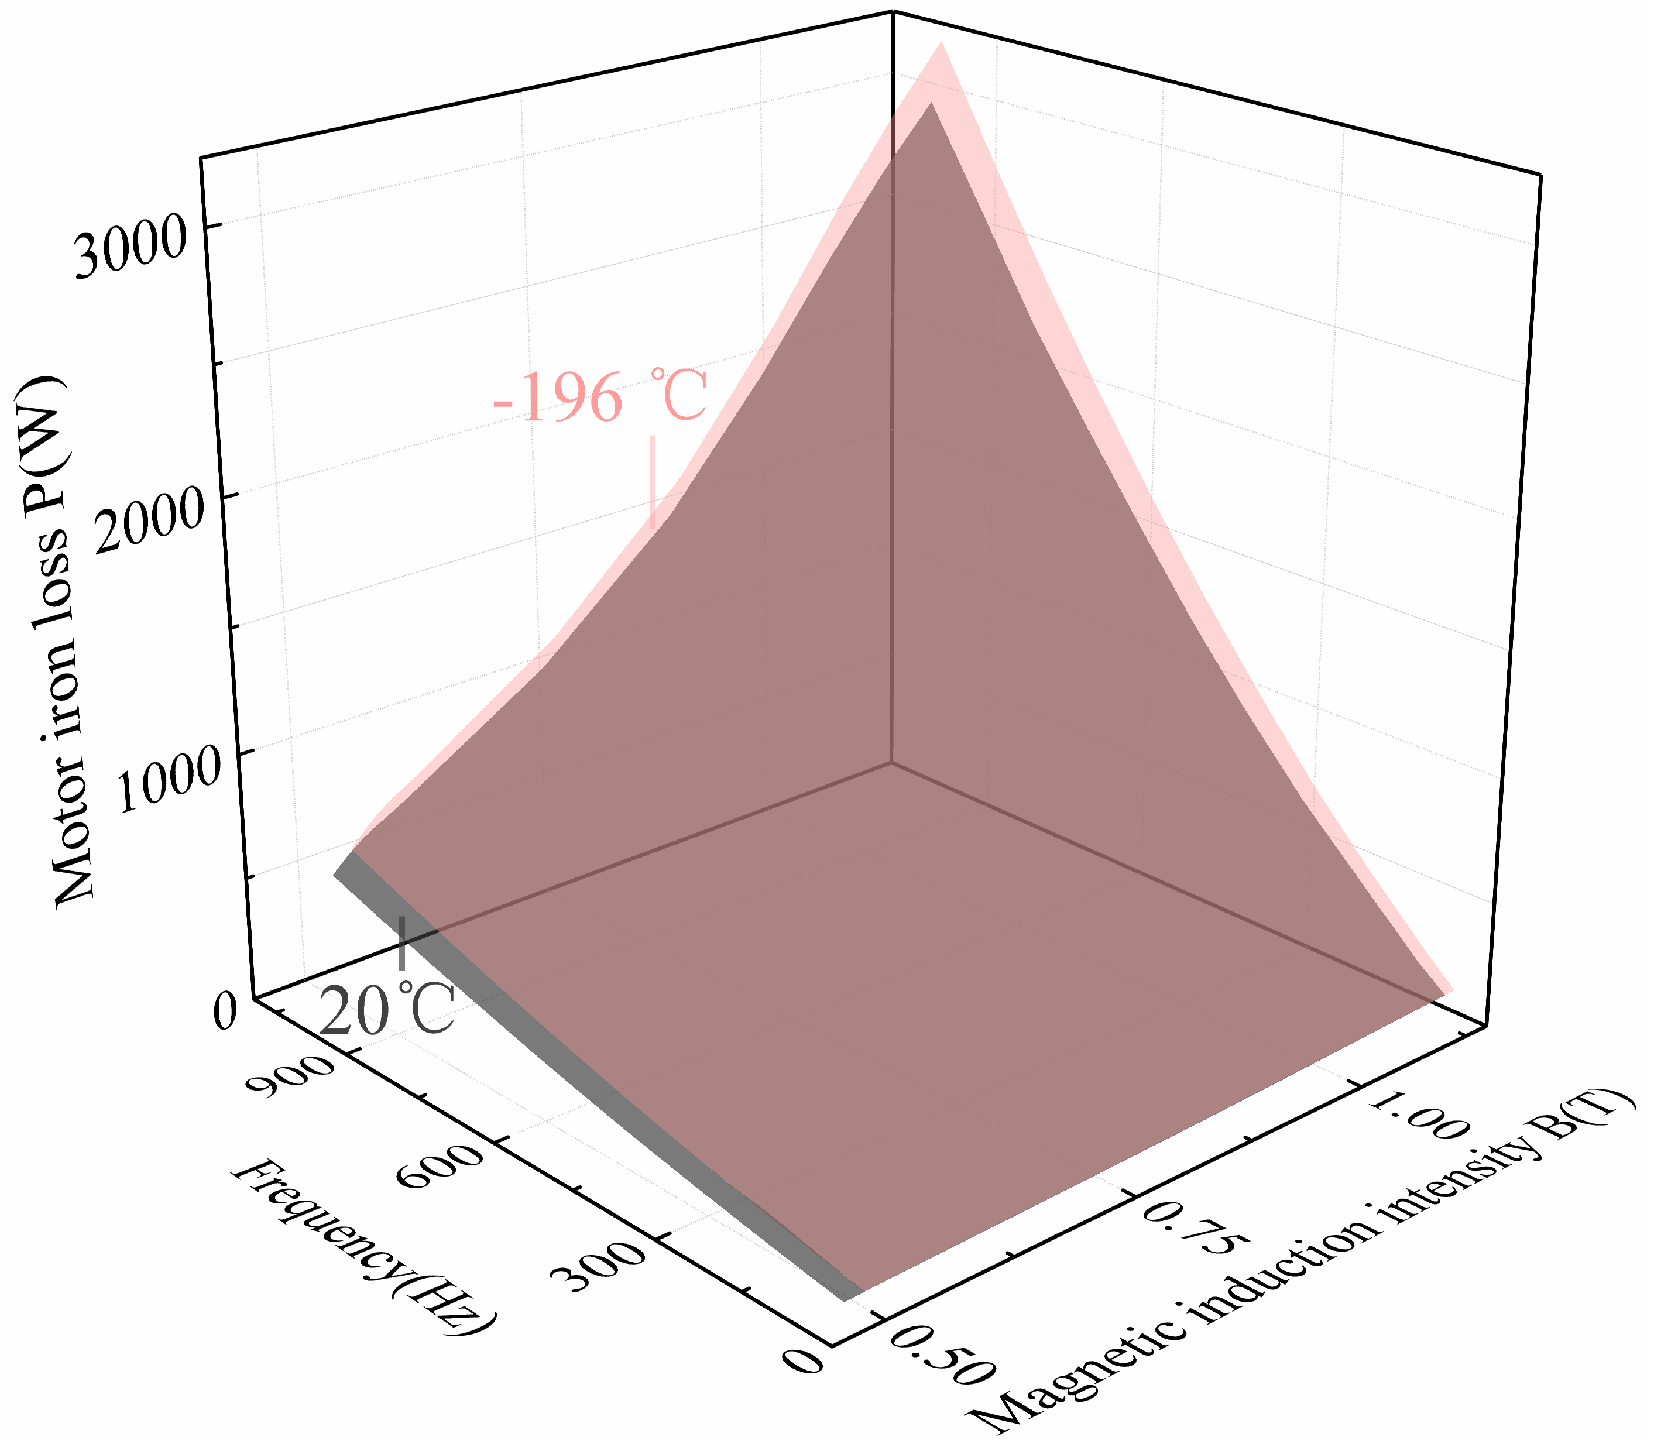
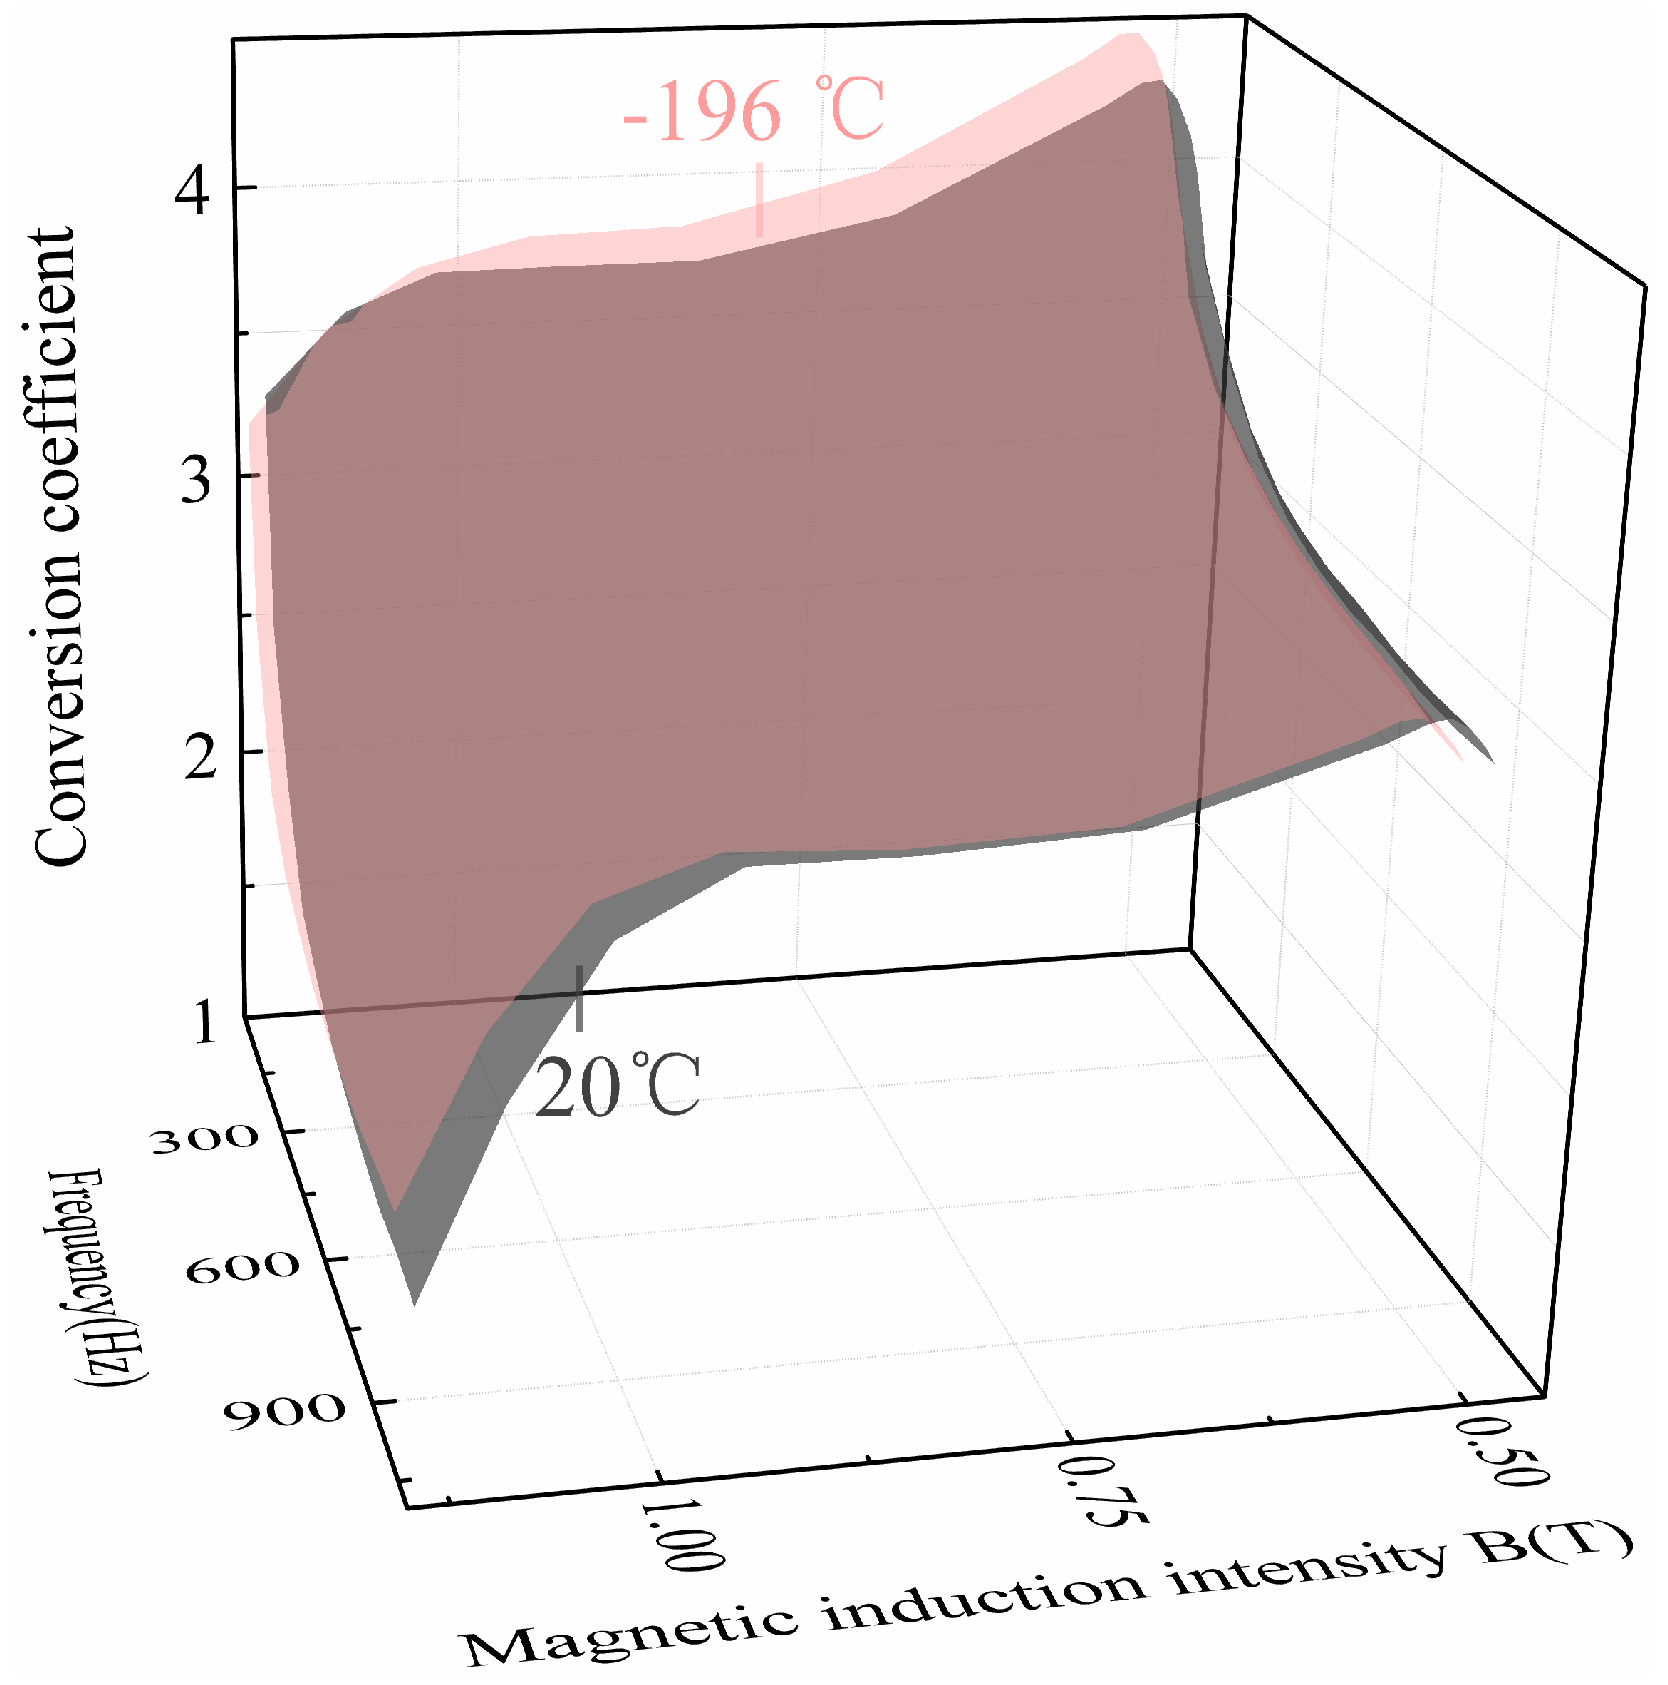
4.2. Feasibility Verification of the Basic Iron Loss Model of Motors

In order to verify the accuracy of the fitting function of the conversion coefficient, the calculated value of the conversion coefficient was compared with the fitted value. The comparison results of the conversion coefficient at room temperature and ultra-low temperature are shown in Figure 26 and Figure 27.
According to comparative analysis, the average fitting errors of the conversion coefficient fitting function at room temperature and ultra-low temperature were within 2%, meeting the actual engineering calculation requirements. The fitting function of the conversion coefficient was substituted into Formula (10) to obtain the iron loss of the motor stator. The calculated value of the motor stator iron loss was compared with the simulated value. The comparison results of the motor stator iron loss at room temperature and ultra-low temperature are shown in Figure 28 and Figure 29.
According to comparative analysis, the average errors between the calculated and simulated values of the motor stator iron loss at room temperature and ultra-low temperature were within 2%, meeting the actual engineering calculation requirements and verifying the accuracy and feasibility of the basic iron loss model of motors.

5. Conclusions

In this study, different types of silicon steel sheets were tested to explore the applicability of a stator material of a cryogenic permanent magnet motor for an LNG pump. Taking sample 1 as an example, improved models of basic iron loss of silicon steel sheets and motors at room temperature and ultra-low temperature were proposed. The obtained conclusions can be summarized as follows.
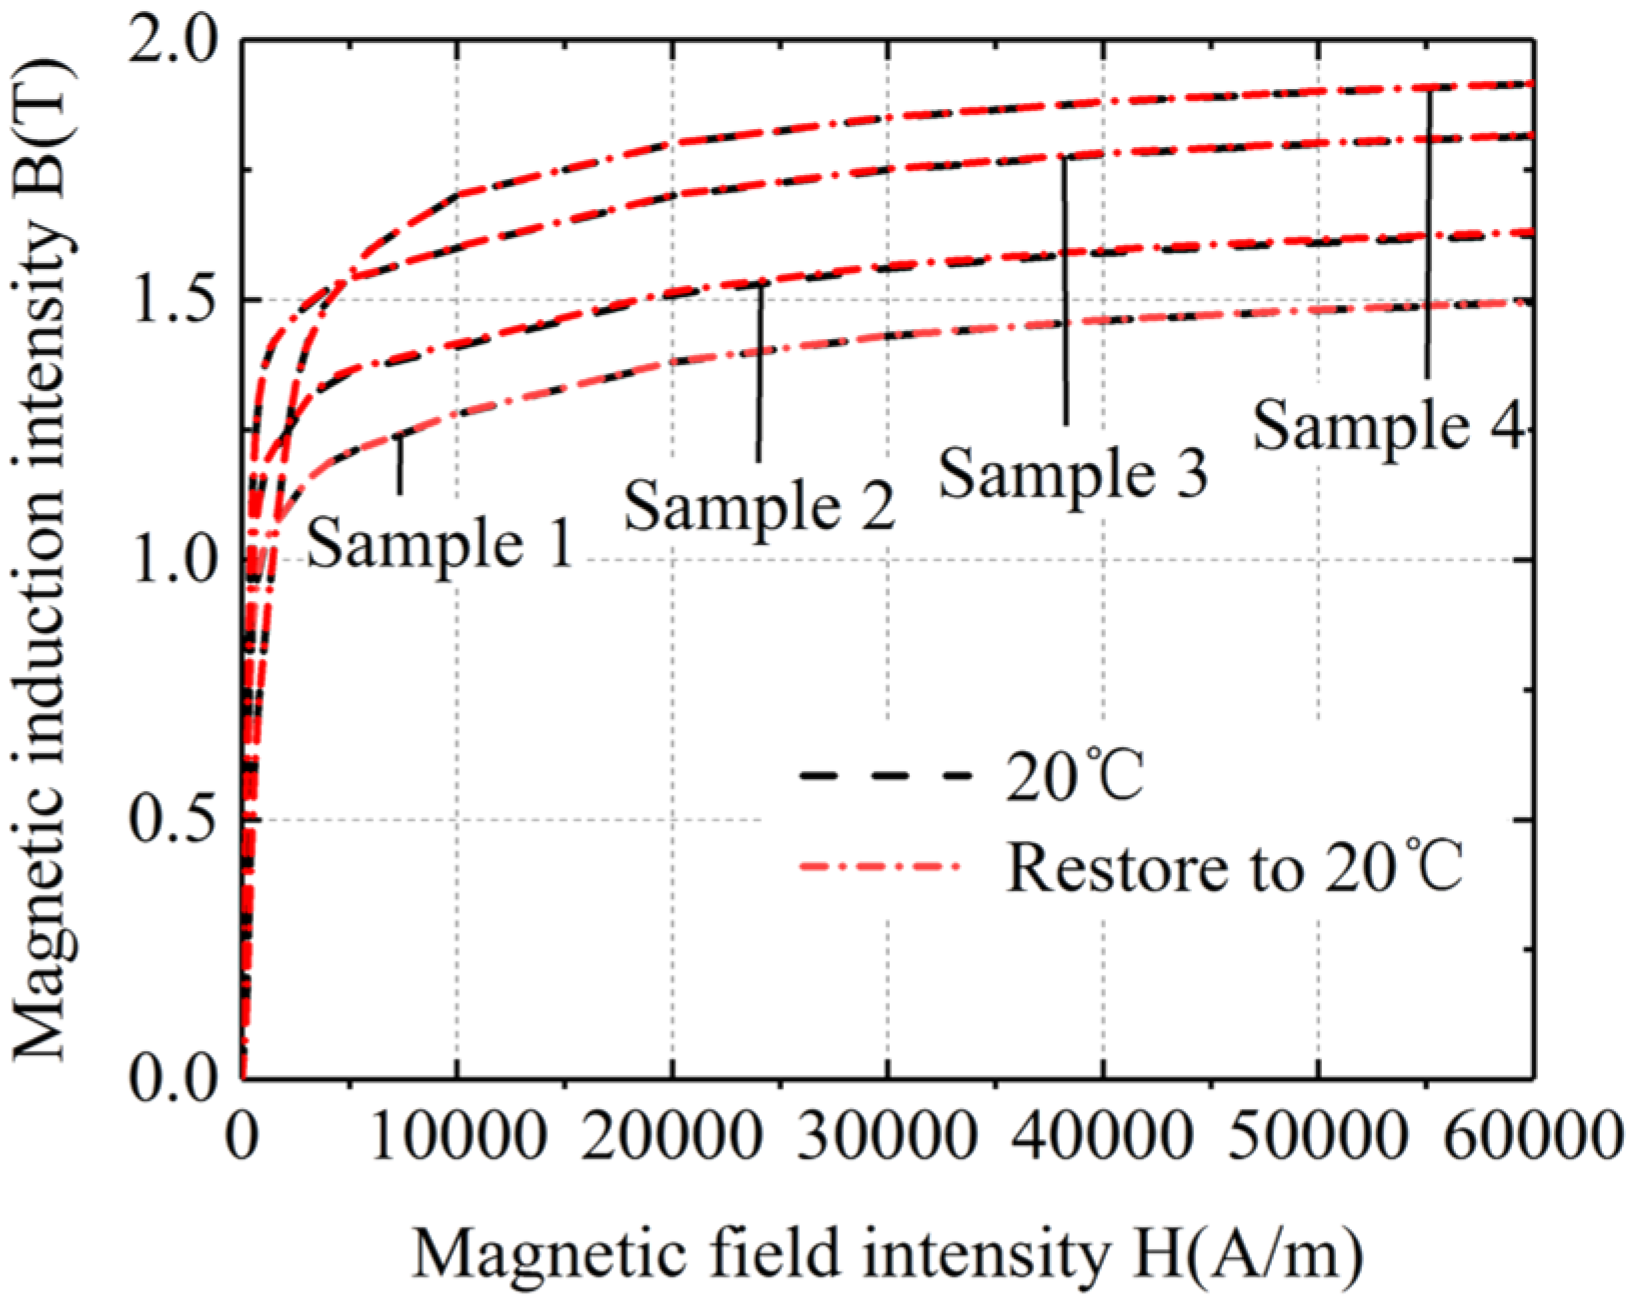
  • Under the same magnetic field intensity, the magnetic induction intensity of the silicon steel sheets at ultra-low temperature was higher than that at room temperature.
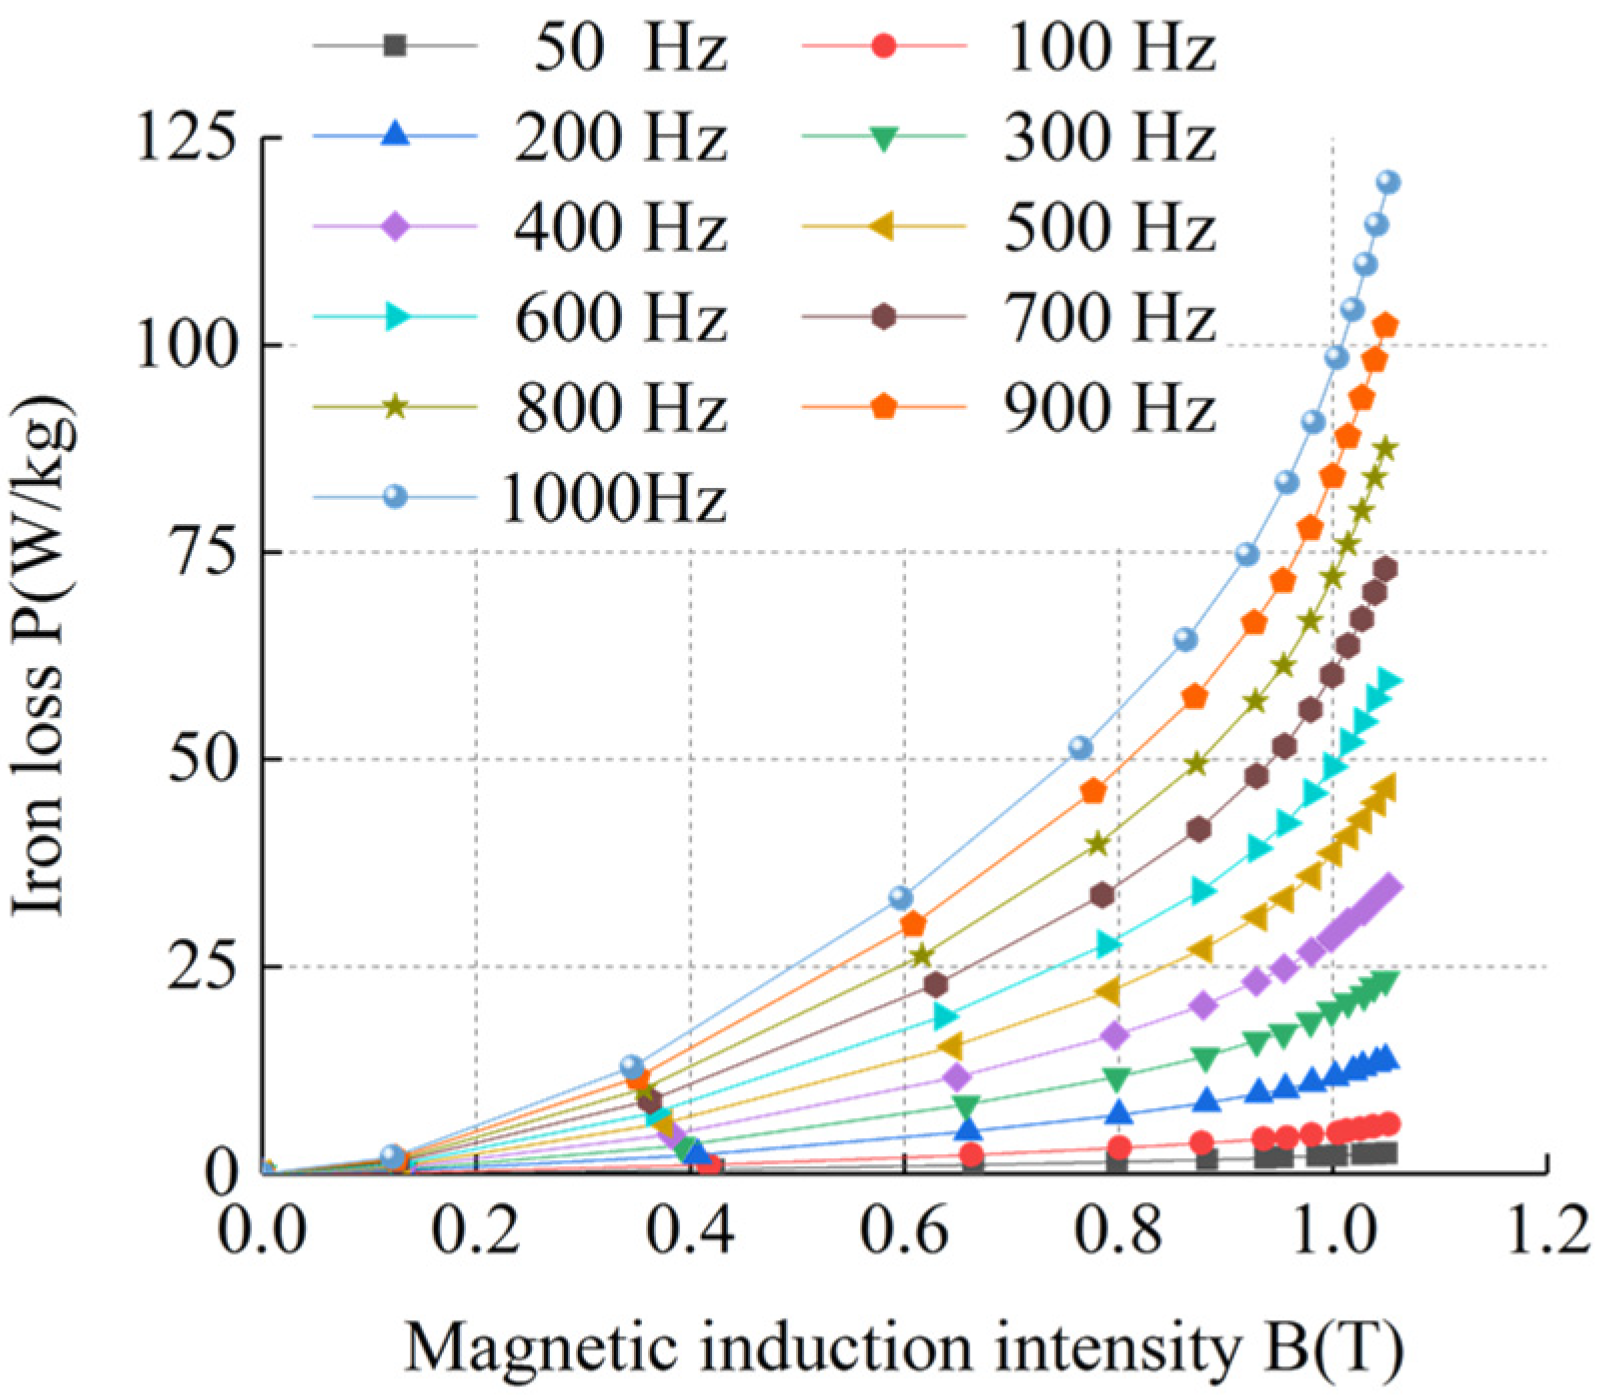
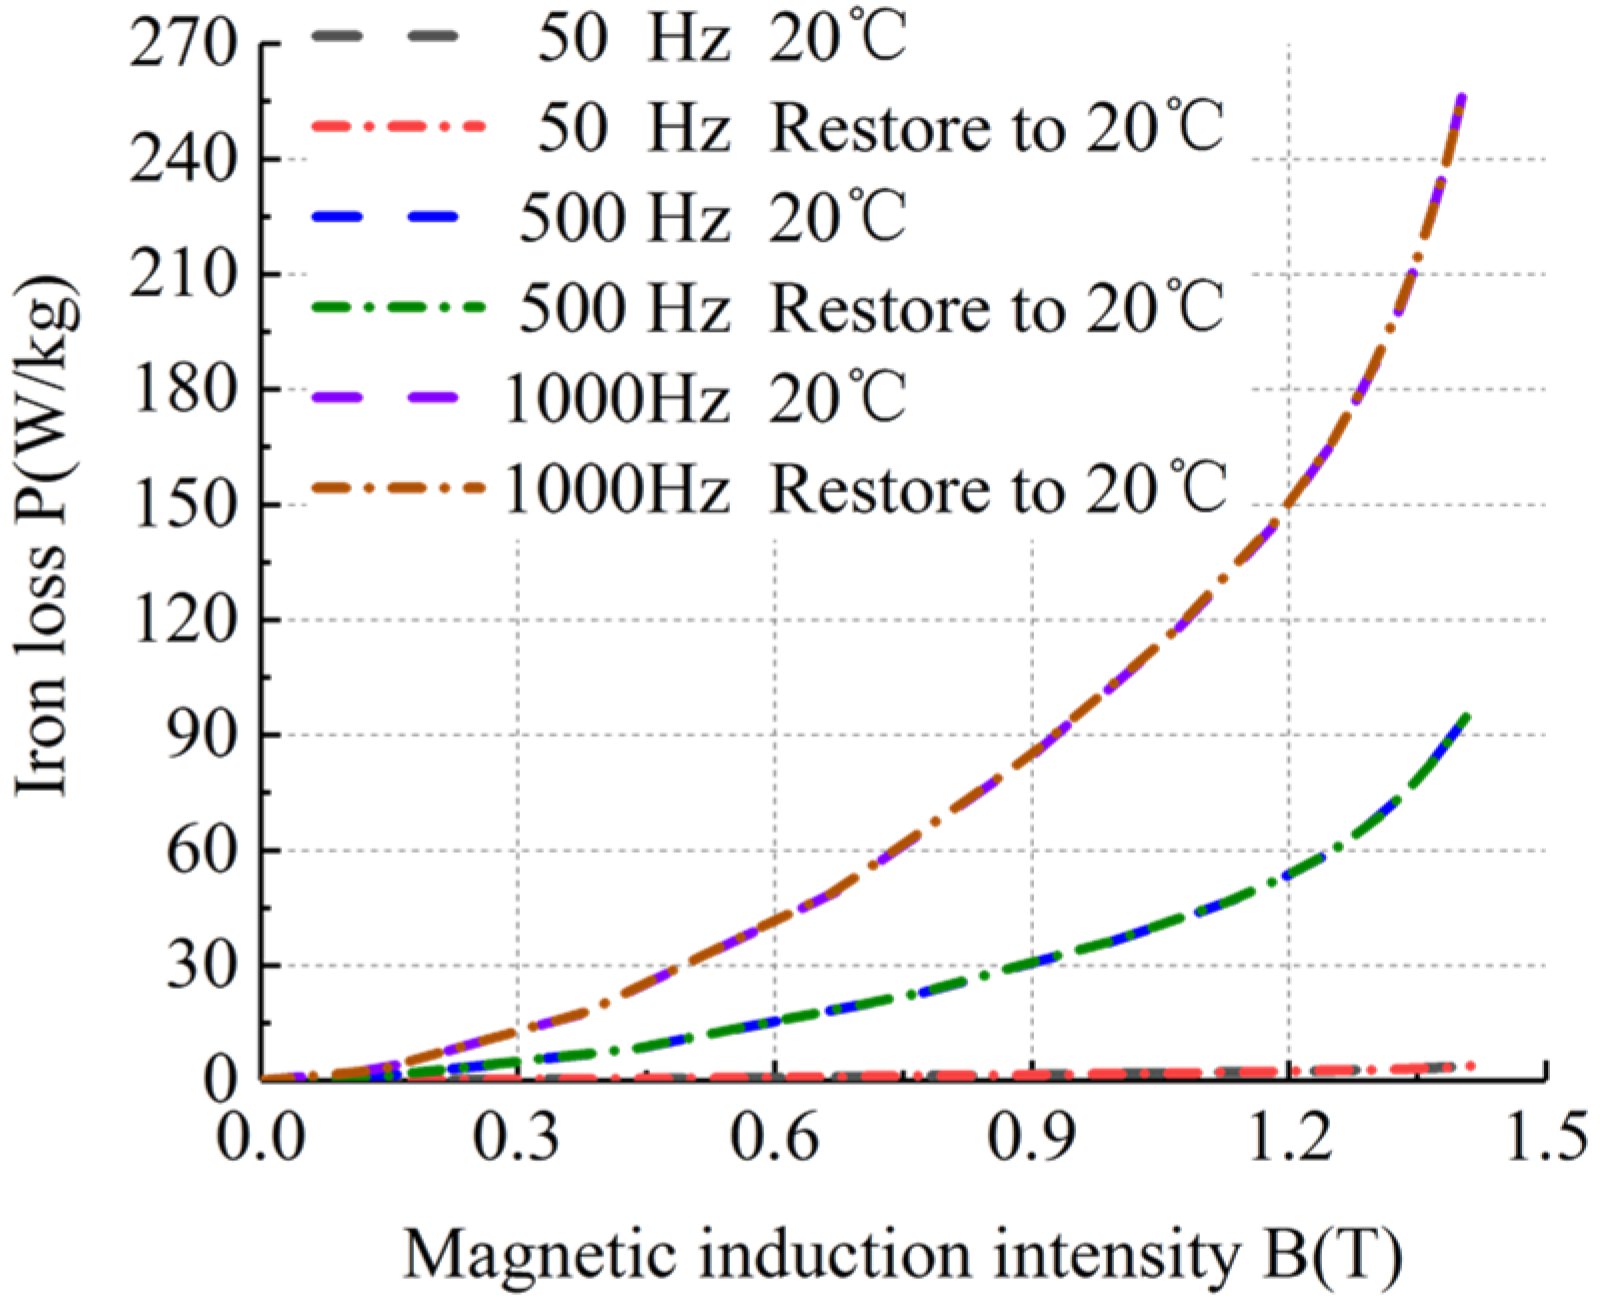
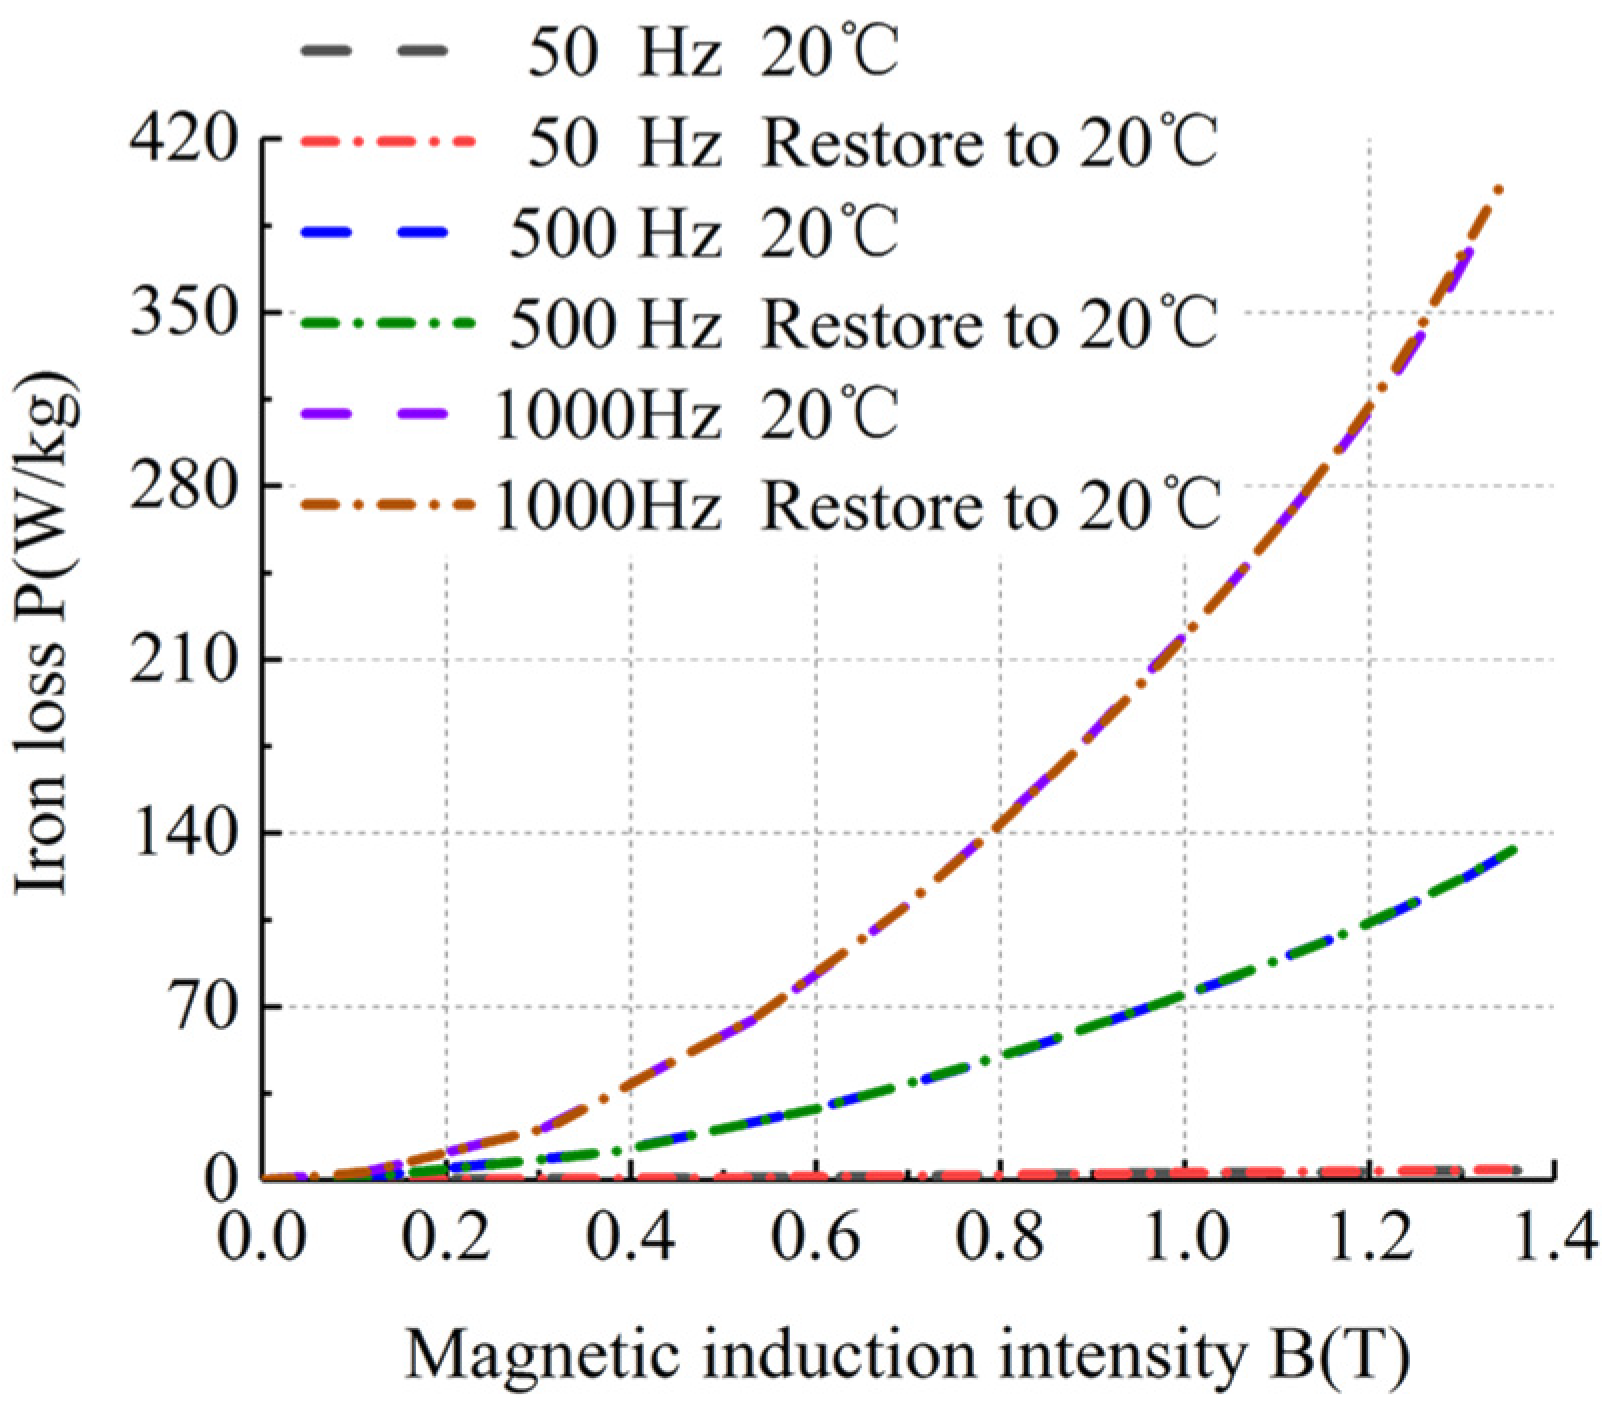
  • Under the same frequency and the same magnetic induction intensity, the iron loss of silicon steel sheets at ultra-low temperature was always higher than the iron loss at room temperature.
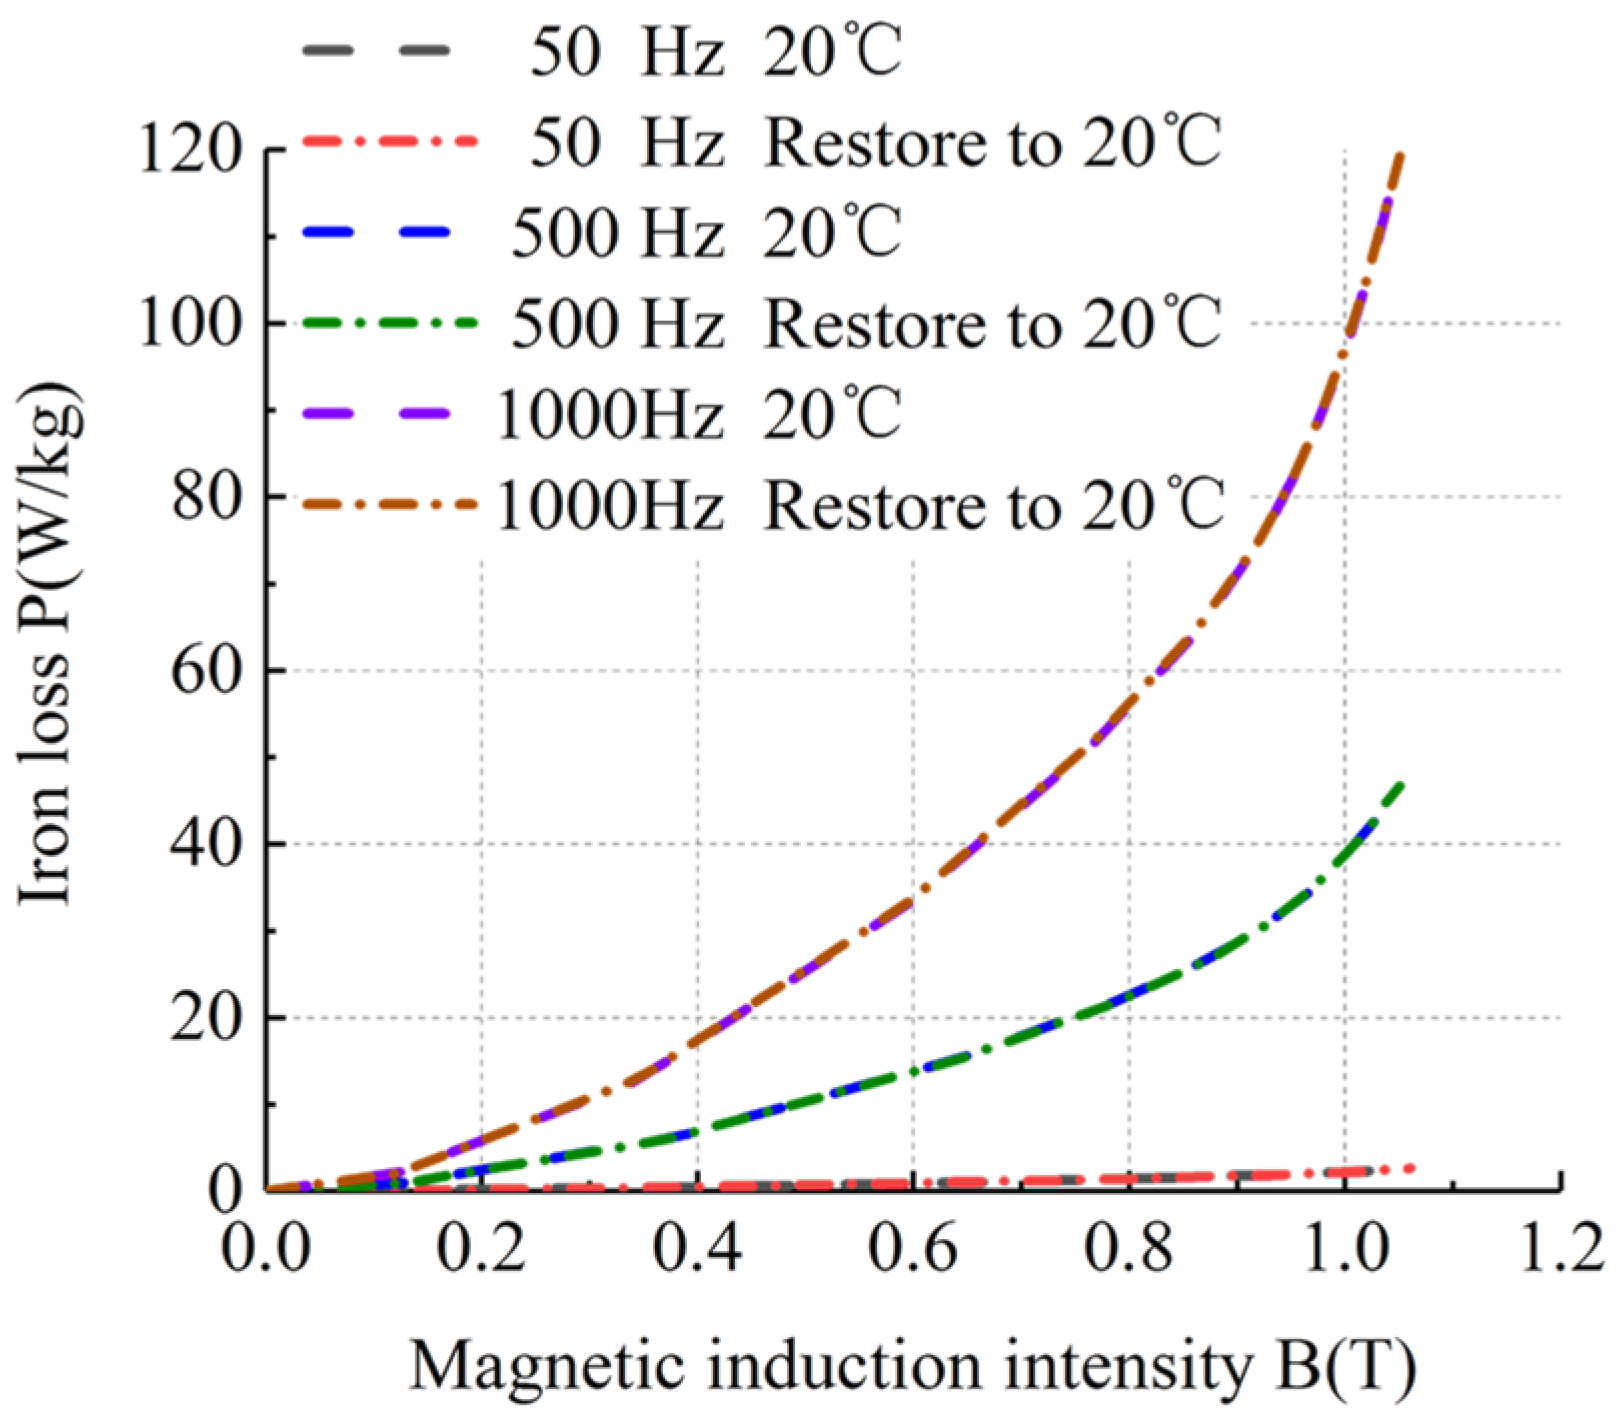
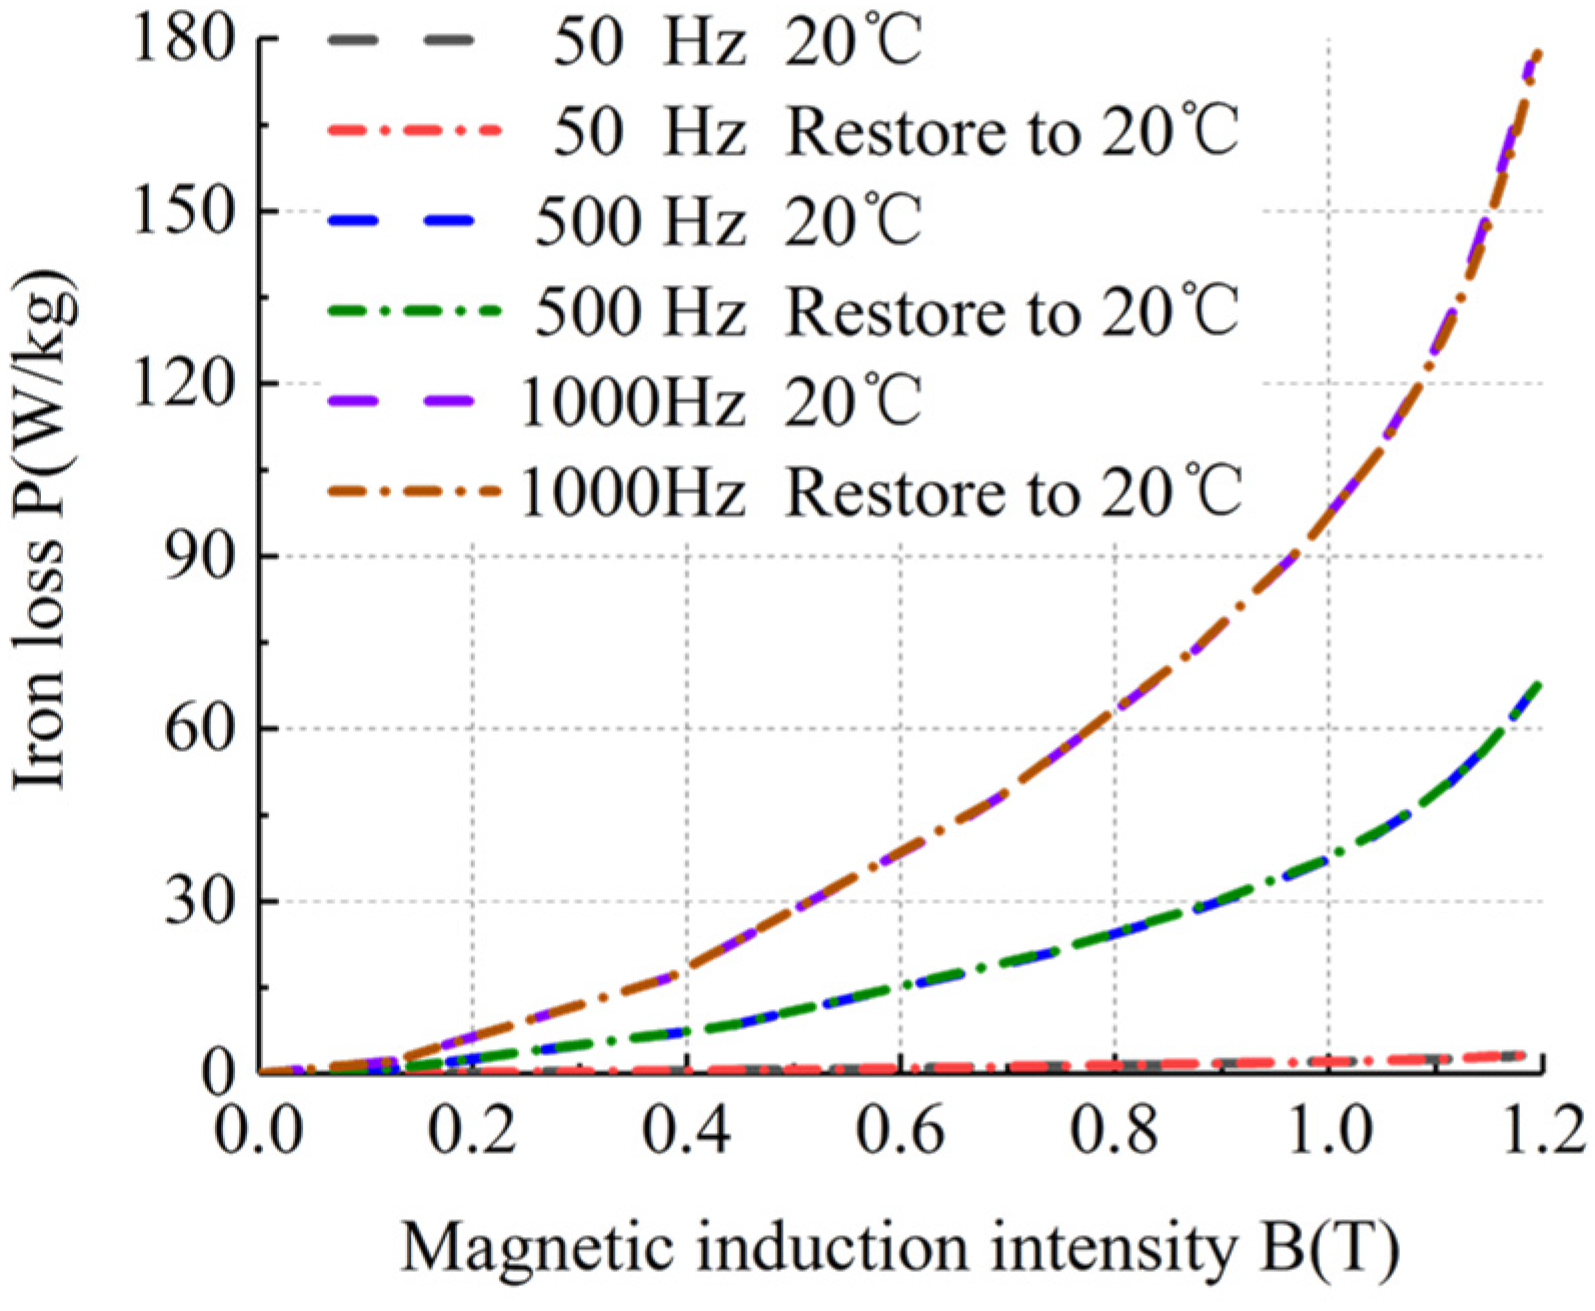
  • The magnetization curve of the silicon steel sheets after being restored to room temperature from ultra-low temperature basically coincided with the magnetization curves at initial room temperature, without any loss of magnetization characteristics. Therefore, the tested silicon steel sheets can repeatedly work at ultra-low temperatures and room temperature.
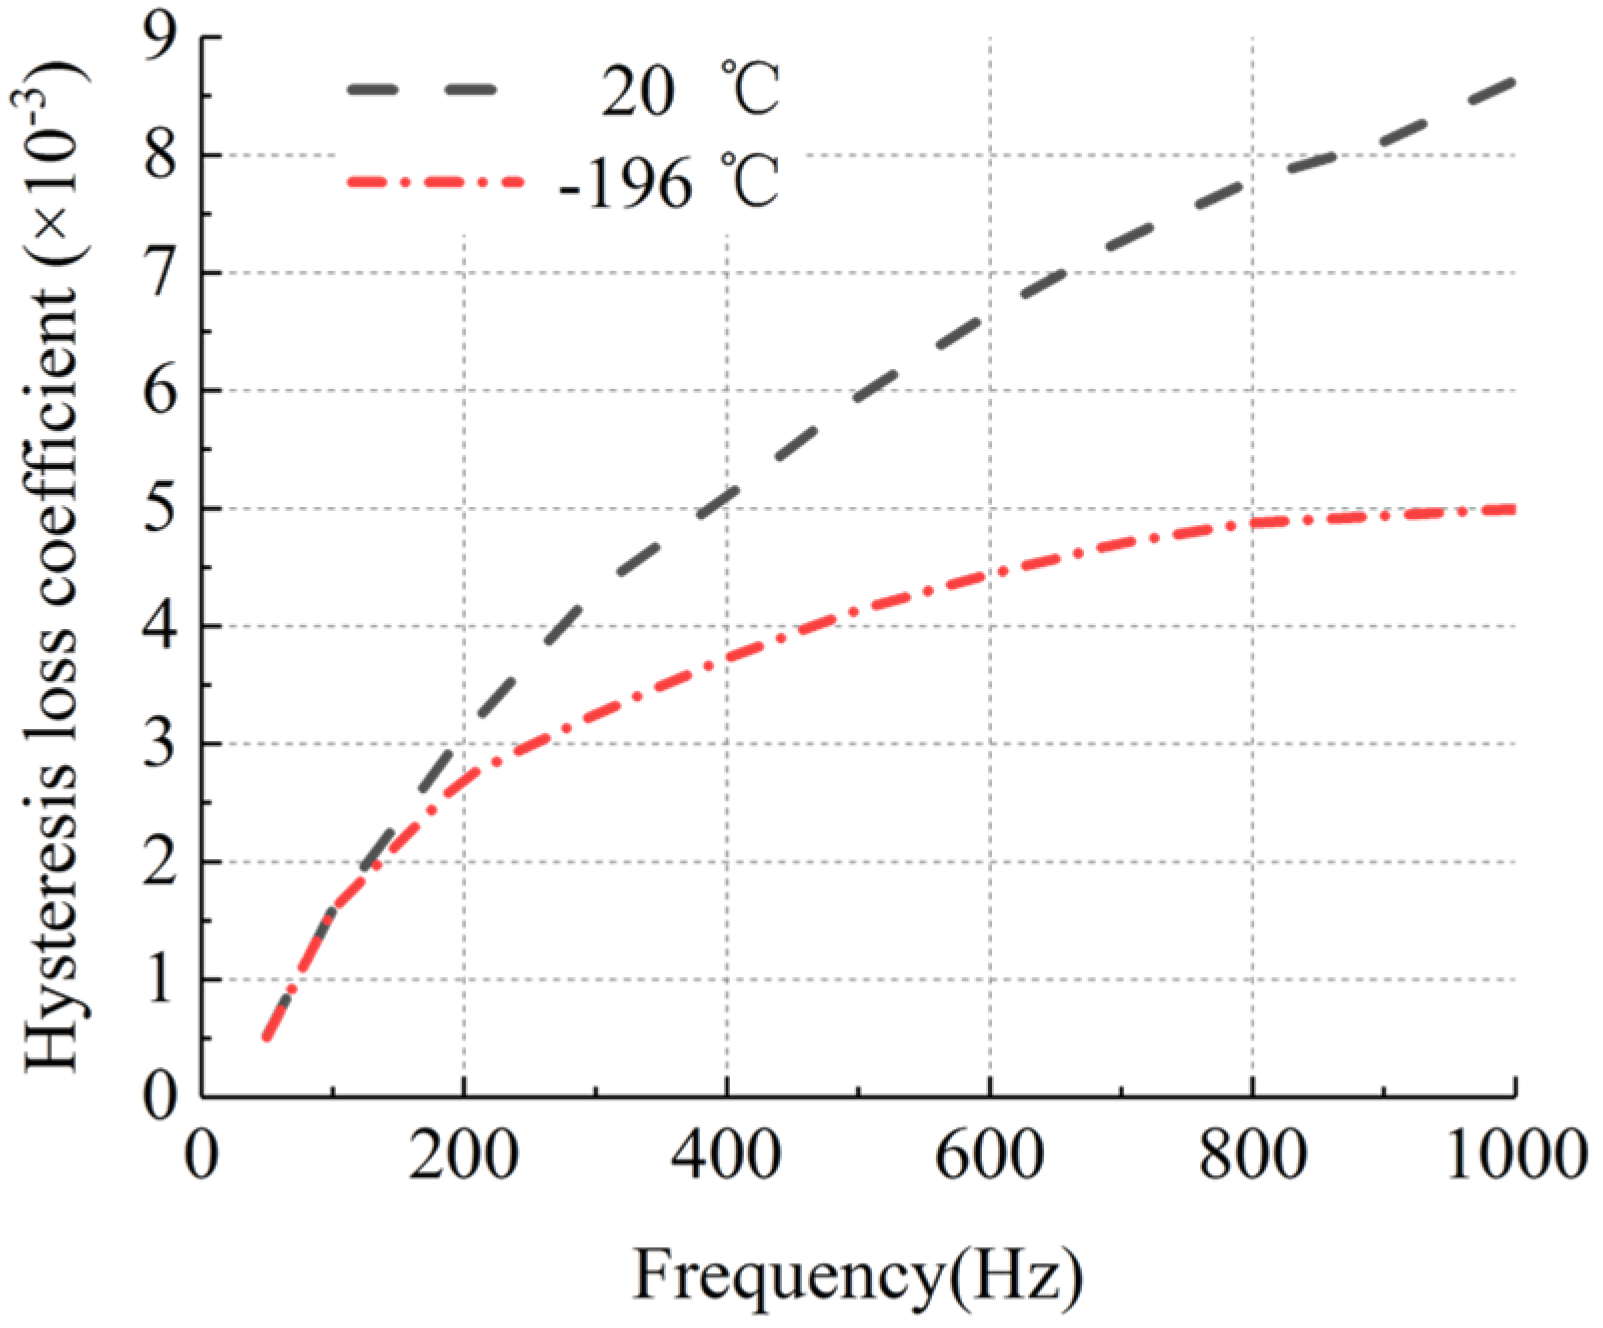
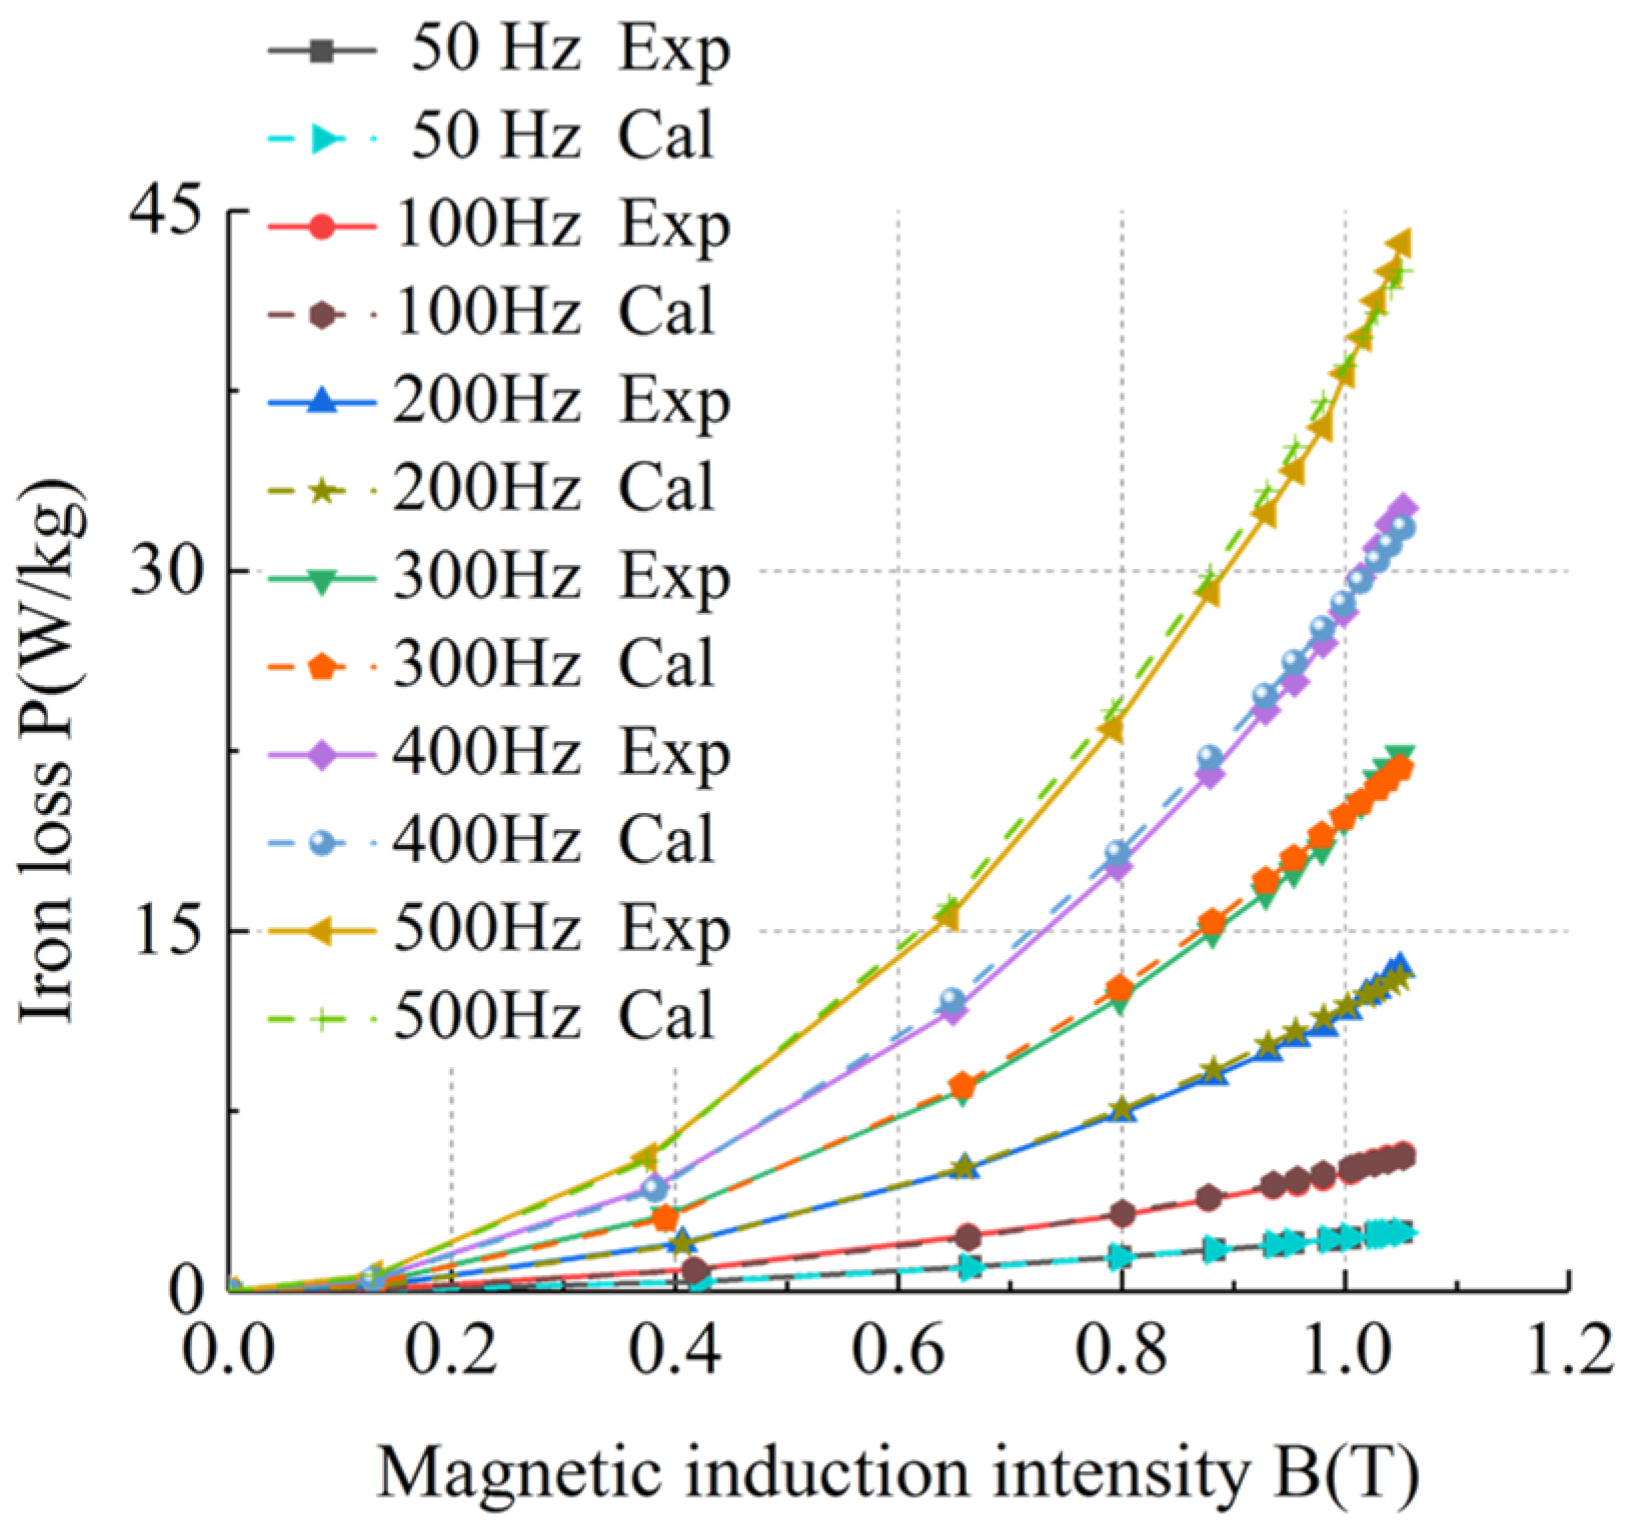
  • Based on the basic iron loss model of silicon steel sheets, the improved models of basic iron loss of silicon steel sheets were obtained by fitting the hysteresis loss coefficient and eddy current loss coefficient using the least squares method at room temperature and ultra-low temperature. The accuracy and feasibility of the improved basic iron loss models of silicon steel sheets were verified.
  • Based on the improved basic iron loss model of silicon steel sheets, the basic iron loss models for motors were obtained by finite element simulation and comparative analysis at room temperature and ultra-low temperature. The accuracy and feasibility of the basic iron loss models for motors were verified.
This article only took sample 1 as an example, and the research ideas of the basic iron loss model of silicon steel sheets and the basic iron loss model of motors were proposed and verified. According to the research idea proposed in this paper, only the material properties of any material are known, and the basic iron loss model of the corresponding silicon steel sheet and the basic iron loss model of the corresponding motor can be summarized, which is convenient to calculate the iron loss of motors at room temperature and ultra-low temperature. The summarized iron loss calculation model can quickly calculate the iron loss of motors at room temperature and ultra-low temperatures, which provides a basis for the iron loss calculation of motor design, allowing researchers to quickly verify the rationality of motor design. Due to the limited space of this paper, the iron loss models of other samples at room temperature and ultra-low temperature will continue to be studied in the future, and the iron loss models proposed in this paper will be compared and analyzed.

Author Contributions

Conceptualization, L.W.; Data curation, Y.W.; Writing–original draft, S.L.; Project administration, B.G. All authors have read and agreed to the published version of the manuscript.

Funding

This research received no external funding.

Data Availability Statement

Data is contained within the article.

Conflicts of Interest

The authors declare no conflict of interest.

References

  1. Mei, Q.; Hu, Q.; Liu, X.; Zhao, R.; Yang, C.; Wang, P.; Qi, Y.; Yang, Y.; Yuan, Q. YUAN Qirui, Research on the Evolution of Global LNG Maritime Transportation Network and Trade Condition of China. J. Geo-Inf. Sci. 2022, 24, 1701–1716. [Google Scholar]
  2. Huang, H. Characteristics and development trends of the global LNG market in 2021. Int. Pet. Econ. 2022, 30, 79–91. [Google Scholar]
  3. Zhou, S.W.; Zhu, J.; Shan, T.; Fu, Q.; Zhang, D.; Wang, J. Development status and outlook of natural gas and LNG industry in China. China Offshore Oil Gas 2022, 34, 1–8. [Google Scholar]
  4. Hou, Z.; Luo, J.; Cao, C.; Ding, G. Development and Contribution of Natural Gas Industry Under the Goal of Carbon of Carbon Neutrality in Chuna. Adv. Eng. Sci. 2023, 55, 243–252. [Google Scholar]
  5. Lyu, Y. Opportunities and Challenges of China’s natural gas development under the background of carbon peaking and carbon neutrality goals. Ecol. Environ. 2022, 114, 91–93. [Google Scholar]
  6. Zhao, G.; Kong, D.; Gao, X. Performance Difference Study on Permanent Magnet Synchronous Motor Based on Soft Magnetic Composite Material and Silicon Steel Sheet. Trans. China Electrotech. Soc. 2018, 33, 75–81. [Google Scholar]
  7. Zhang, D.; Zhao, H.; Wang, Y.; Xu, G.; Liu, X. A Piecewise Variable Coefficient Model for Precise Analysis on Iron Losses of Electrical Machines. Trans. China Electrotech. Soc. 2016, 31, 16–24. [Google Scholar]
  8. He, Z.; Zhu, L.; Wang, Z.; Koh, C.-S. Anomalous Loss and Hysteresis Loop in Electrical Steel Sheet. IEEE Trans. Magn. 2021, 57, 6300804. [Google Scholar] [CrossRef]
  9. Miyagi, D.; Otome, D.; Nakano, M.; Takahashi, N. Measurement of Magnetic Properties of Nonoriented Electrical Steel Sheet at Liquid Nitrogen Temperature Using Single Sheet Tester. IEEE Trans. Magn. 2010, 46, 314–317. [Google Scholar]
  10. Breining, P.; Veige, M.; Doppelbauer, M.; Liu, Y.; Noe, M. Iron loss measurement of nonoriented silicon and cobalt iron electrical steel sheets at liquid nitrogen temperature using ring specimen. In Proceedings of the 2017 IEEE International Electric Machines and Drives Conference (IEMDC), Miami, FL, USA, 21–24 May 2017. [Google Scholar]
  11. Luo, Y.; Zhao, H.; Yao, B.; Chen, W. Engineering Computation Methods Analysis of Iron Losses of AC Electric Machines. Electr. Mach. Control Appl. 2010, 37, 1–10. [Google Scholar]
  12. Li, M.; Wang, W. Correction and Analysis for the Iron Loss Coefficient of Permanent Magnet Motor. Micromotors 2016, 49, 33–36. [Google Scholar]
  13. Zhu, L.F.; Tong, W.M.; Han, X.Y.; Zhu, J.G. Iron loss research of amorphous alloy motor by considering the influences of solidifying and annealing on stator core. COMPEL-Int. J. Comput. Math. Electr. Electron. Eng. 2017, 36, 1612–1622. [Google Scholar] [CrossRef]
  14. Meng, R.; Kuang, J. The Application of the Method of Least Squares Parameter Fitting of Core Loss. Mod. Sci. Instrum. 2013, 147, 91–96. [Google Scholar]
  15. Zhang, J.; Su, J.; Fu, R.; Bian, C. Calculation of Stator Iron Losses in a High-speed AC Permanent Magnet Generator. Micromotors 2014, 47, 10–14. [Google Scholar]
Figure 1. The experimental equipment for room temperature.
Energies 17 02641 g001
Figure 2. The experimental equipment for ultra-low temperature.
Energies 17 02641 g002
Figure 3. BH curves of four silicon steel sheets at room temperature and ultra-low temperature.
Energies 17 02641 g003
Figure 4. BH curves of four silicon steel sheets at room temperature and at return to room temperature following ultra-low temperature.
Energies 17 02641 g004
Figure 5. BP curves of sample 1 at room temperature.
Energies 17 02641 g005
Figure 6. BP curves of sample 1 at ultra-low temperature.
Energies 17 02641 g006
Figure 7. BP curves of sample 2 at room temperature.
Energies 17 02641 g007
Figure 8. BP curves of sample 2 at ultra-low temperature.
Energies 17 02641 g008
Figure 9. BP curves of sample 3 at room temperature.
Energies 17 02641 g009
Figure 10. BP curves of sample 3 at ultra-low temperature.
Energies 17 02641 g010
Figure 11. BP curves of sample 4 at room temperature.
Energies 17 02641 g011
Figure 12. BP curves of sample 4 at ultra-low temperature.
Energies 17 02641 g012
Figure 13. BP curves of sample 1 at room temperature and ultra-low temperature recovery to room temperature.
Energies 17 02641 g013
Figure 14. BP curves of sample 2 at room temperature and ultra-low temperature recovery to room temperature.
Energies 17 02641 g014
Figure 15. BP curves of sample 3 at room temperature and ultra-low temperature recovery to room temperature.
Energies 17 02641 g015
Figure 16. BP curves of sample 4 at room temperature and ultra-low temperature recovery to room temperature.
Energies 17 02641 g016
Figure 17. Hysteresis loss coefficient curve of sample 1 at room temperature and ultra-low temperature.
Energies 17 02641 g017
Figure 18. Eddy current loss coefficient curve of sample 1 at room temperature and ultra-low temperature.
Energies 17 02641 g018
Figure 19. Comparison of the improved iron loss model of silicon steel sheets under 50–500 Hz at room temperature.
Energies 17 02641 g019
Figure 20. Comparison of the improved iron loss model of silicon steel sheets under 600–1000 Hz at room temperature.
Energies 17 02641 g020
Figure 21. Comparison of the improved iron loss model of silicon steel sheets under 50–500 Hz at ultra-low temperature.
Energies 17 02641 g021
Figure 22. Comparison of the improved iron loss model of silicon steel sheets under 600–1000 Hz at ultra-low temperature.
Energies 17 02641 g022
Figure 23. Model of cryogenic permanent magnet motor for LNG pump.
Energies 17 02641 g023
Figure 24. Data diagram of motor stator iron loss at room temperature and ultra-low temperature.
Energies 17 02641 g024
Figure 25. Data diagram of conversion coefficient at room temperature and ultra-low temperature.
Energies 17 02641 g025
Figure 26. Comparison of conversion coefficient at room temperature.
Energies 17 02641 g026
Figure 27. Comparison of conversion coefficient at ultra-low temperature.
Energies 17 02641 g027
Figure 28. Comparison of motor stator iron loss at room temperature.
Energies 17 02641 g028
Figure 29. Comparison of motor stator iron loss at ultra-low temperature.
Energies 17 02641 g029
Table 1. BP curve fitting data of sample 1 at room temperature.
Frequency (Hz) k h (×10−3) k e (×10−4) α
500.5208.76420
1001.6004.87220
2003.0942.75920
3004.3082.04120
4005.1001.65620
5005.9461.41420
6006.6511.24620
7007.2731.11920
8007.7851.02120
9008.1140.94420
10008.6340.87620
Table 2. BP curve fitting data of sample 1 at ultra-low temperature.
Frequency (Hz) k h (×10−3) k e (×10−4) α
500.5138.97320
1001.5934.94720
2002.7172.85220
3003.2532.11820
4003.7291.71920
5004.1391.46920
6004.4391.29420
7004.7071.16420
8004.8781.06520
9004.9350.98720
10004.9930.92320
Table 3. Fitting error of hysteresis loss coefficient fitting function for sample 1 at room temperature and ultra-low temperature.
Frequency
(Hz)
Fitted Value (×10−3)
(20 °C)
Fitting Error
(20 °C)
Fitted Value (×10−3)
(−196 °C)
Fitting Error
(−196 °C)
500.5180.333%0.5100.542%
1001.5950.292%1.6080.925%
2003.1150.680%2.6562.257%
3004.2391.598%3.2981.375%
4005.1641.252%3.7771.297%
5005.9540.139%4.1460.167%
6006.6390.187%4.4300.200%
7007.2330.544%4.6491.223%
8007.7510.436%4.8191.218%
9008.2021.082%4.9490.286%
10008.5940.460%5.0501.139%
Table 4. Fitting error of eddy current loss coefficient fitting function for sample 1 at room temperature and ultra-low temperature.
Frequency
(Hz)
Fitted Value (×10−4)
(20 °C)
Fitting Error
(20 °C)
Fitted Value (×10−4)
(−196 °C)
Fitting Error
(−196 °C)
508.7580.068%8.9600.150%
1004.8770.095%4.9530.131%
2002.7340.920%2.8270.864%
3002.0651.158%2.1441.248%
4001.6761.234%1.7391.143%
5001.4120.118%1.4640.358%
6001.2281.433%1.2741.531%
7001.0991.766%1.1431.786%
8001.0091.177%1.0531.158%
9000.9460.241%0.9900.334%
10000.9022.889%0.9472.560%
Table 5. The error of the improved iron loss model of silicon steel sheets at room temperature and ultra-low temperature.
Frequency (Hz)Average Error (20 °C)Average Error (−196 °C)
501.690%2.086%
1002.589%2.535%
2002.122%2.699%
3002.364%2.480%
4002.528%2.372%
5002.688%2.387%
6002.386%2.326%
7002.268%2.212%
8002.426%2.402%
9002.437%2.478%
10002.398%2.576%
Disclaimer/Publisher’s Note: The statements, opinions and data contained in all publications are solely those of the individual author(s) and contributor(s) and not of MDPI and/or the editor(s). MDPI and/or the editor(s) disclaim responsibility for any injury to people or property resulting from any ideas, methods, instructions or products referred to in the content.

