Article

The New Policy for Innovative Transformation in Regional Industrial Chains, the Conversion of New and Old Kinetic Energy, and Energy Poverty Alleviation

Honors College, Tianjin Foreign Studies University, Tianjin 300011, China
*
Author to whom correspondence should be addressed.
Energies 2024, 17(11), 2667; https://doi.org/10.3390/en17112667
Submission received: 25 April 2024 / Revised: 23 May 2024 / Accepted: 27 May 2024 / Published: 30 May 2024
(This article belongs to the Section C: Energy Economics and Policy)

Abstract

:
As the world’s largest emerging market country, not only has China faced the contradiction between its huge population size and per capita energy scarcity for a long time, but the rigid constraints brought by energy poverty have also plagued the lives and production of Chinese residents. Based on panel data from 30 provinces (except Tibet) in mainland China from 2009 to 2021, this study employs double machine learning and spatial difference-in-difference for causal inference to explore the impact of a medium- to long-term regional innovation pilot policy in China—the new policy for innovative transformation in regional industrial chains—on energy poverty alleviation. This study also introduces China’s conversion of new and old kinetic energy into this quasi-natural experiment. This study presents the following findings: (1) The new policy for innovative transformation in regional industrial chains and the concept of the conversion of new and old kinetic energy can both significantly promote energy poverty alleviation. (2) The mechanism pathway of “the new policy for innovative transformation in regional industrial chains → the conversion of new and old kinetic energy → the energy poverty alleviation in heating/household electricity/transportation segments” has proved to be an effective practice in China. (3) Based on the spatial double difference model, the spatial direct effect of the new regional industrial chain innovation and change policy on energy poverty alleviation is significantly positive, while the spatial direct effect and spatial spillover effect of the new and old kinetic energy transformation on energy poverty alleviation are both significantly positive. (4) Based on the counterfactual framework analysis, in addition to the causal mediating mechanism of the demand-side conversion of new and old kinetic energy being impeded, both the supply-side and the structural-side conversion of new and old kinetic energy are able to play a significant positive causal mediating role in both the treatment and control groups.

1. Introduction

Over the past two centuries, humans have released vast amounts of carbon dioxide into the atmosphere, totaling tens of trillions of tons. This has led to increasingly severe issues such as the greenhouse effect and ozone layer depletion, significantly impacting the global climate and causing substantial harm to ecological equilibrium [1]. Against this global backdrop, China has introduced, for the first time, the concepts of “peak carbon dioxide emissions” and “carbon neutrality”. These initiatives aim to preserve ecological balance, mitigate greenhouse gas emissions, and pursue a green economic trajectory aligned with principles of sustainable development. The pursuit of these “dual carbon” objectives not only holds profound strategic importance for China’s high-quality development but also underscores China’s international commitment to fostering a shared future for humanity [2].
However, in the extensive rural areas of China, particularly in remote mountainous regions, historical energy shortages have led residents to depend heavily on traditional biomass fuels such as straw, firewood, and animal dung for daily cooking and heating needs [3]. This phenomenon is widespread in some remote areas. Therefore, driving energy transition in poor regions is paramount for realizing the “dual carbon” objectives [4].
Current deliberations on addressing the issue of “energy poverty” predominantly explore avenues such as employment, government fiscal spending, innovation in renewable energy technologies, and the shift toward low-carbon energy sources [5]. However, in the literature, scant attention has been to the potential impact of China’s innovative transformation policies on addressing the issue of “energy poverty”.
As a developing nation, China boasts a vast territorial expanse, diverse levels of economic development, and a varied distribution of energy resources. Due to the economic disparities among regions, the Chinese government must employ policy interventions to harmonize energy development across regions, thereby facilitating comprehensive energy system optimization and fostering long-term sustainability [6].
The primary thrust of the new policy for innovative transformation in regional industrial chains lies in the effective allocation of innovative resources and targeted industry support measures [7]. It aims to drive the optimization and elevation of regional industrial chains, bolster the overall competitiveness and sustainability of regional industries, and propel sustained and robust growth of the regional economy through innovation [8].
In 2013, the Chinese Ministry of Science and Technology designated Jiangsu Province as the pioneering pilot province for implementing the new policy for innovative transformation in regional industrial chains. By the end of 2021, 11 provinces had been approved as pilot regions for this policy. This innovative policy aims to drive technological innovation in the energy industry and foster the research and industrialization of renewable energy technologies such as wind power, hydropower, and photovoltaics, thereby enhancing energy efficiency and significantly curbing energy poverty [9]. Consequently, by implementing relevant policies, the transformation of traditional high-energy-consuming industries into renewable energy industries can be effectively facilitated, thereby promoting the green and sustainable development of industrial chains and aiding in addressing the issue of energy poverty across regions [10].
Based on the above analysis, the new policy for innovative transformation in regional industrial chains aims to promote clean energy and a circular economy, thereby optimizing the energy structure and driving the realization of the conversion of new and old kinetic energy. The conversion of new and old kinetic energy encompasses three dimensions: demand side, supply side, and structural side, involving the gradual replacement of traditional energy modes, formats, technologies, and materials with new ones, thereby fostering industrial upgrading [11].
Driven by the concept of the conversion of new and old kinetic energy, traditional high-emission energy industries gradually shift toward renewable new energy sectors. With its high value-added characteristics, the new energy industry can stimulate more employment opportunities in less developed areas, enhance local employment rates and income levels, and ultimately alleviate the economic strain caused by energy poverty [12].
In summary, a close interconnection exists between the new policy for innovative transformation in regional industrial chains, the conversion of new and old kinetic energy, and energy poverty alleviation. Building upon this, this study devises a quasi-natural experiment. It initially delves into the specific mechanisms through which the new policy for innovative transformation in regional industrial chains, alongside the conversion of new and old kinetic energy, impacts energy poverty alleviation at a theoretical level. Subsequently, this study draws empirical conclusions and offers targeted policy recommendations based on these findings.

2. Mechanism Analysis

2.1. The Impact of the New Policy for Innovative Transformation in Regional Industrial Chains on Energy Poverty Alleviation

The new policy for innovative transformation in regional industrial chains aims to effectively allocate resources for innovation, promote the optimization and upgrading of regional industrial chains, and stimulate innovative development through policies such as talent introduction and cultivation, targeted industrial support, and the stimulation of innovative potential. This policy provides strong support for building a modern economic system. The new policy completely transforms traditional institutional mechanisms by breaking through China’s institutional barriers to innovation at institutional arrangements, talent services, industry–academia–research integration, scientific research infrastructure construction, and primary research policy sources. It enables regional innovation dynamics to flow fully and exerts a strong policy effect on the overall development of regions and the forging of high-value industrial chains.
In the realm of energy systems, the new policy for innovative transformation in regional industrial chains holds the potential to fundamentally reshape the dynamics of energy exploration, development, processing, and utilization. Boasting the world’s largest population and ranking among the foremost emerging economies, China grapples with significant energy poverty pressures amidst its drive toward modernization [13]. Zhejiang Province is one of China’s leading regions in terms of economic output and per capita income. In the summer of 2022, its total societal electricity demand surged beyond 110 million kilowatt hours, rivaling the consumption of South Korea in Asia and surpassing that of Germany, the largest industrial powerhouse in the European Union. China’s vast energy demands and strained supply networks present an intricate dilemma [14]. The suboptimal efficiency in energy utilization not only engenders substantial wastage but also exacerbates issues of lagging industrial capacity and environmental degradation, particularly in rural and select urban pockets, thereby impeding China’s march towards modernity [15]. However, the new policy for innovative transformation in regional industrial chains introduces novel institutional mechanisms, including a prioritized examination of intellectual property rights in specialized industrial domains and a “technology bounty” system, thus revolutionizing the regional innovation ecosystem and effectively mitigating the challenges of excessive energy demands, energy utilization bottlenecks, and energy poverty within China.
Viewed from the development pattern of energy in China, the new policy for innovative transformation in regional industrial chains has mitigated the pressures stemming from China’s energy poverty by addressing the “impossible triangle” dilemma within the Chinese energy system. This dilemma encompasses the challenges of simultaneously ensuring security (a stable and secure supply), economic viability (feasibility, accessibility, and affordability), and environmental sustainability (ecological friendliness, environmental compatibility, and cleanliness) [16]. China’s energy system has historically been reliant on fossil fuels such as coal and oil, and it has operated as a vast emission system while also exposing the nation, as a net importer of primary energy, to vulnerabilities in energy security [17]. The new policy for innovative transformation in regional industrial chains initially promotes technological shifts within the energy sector, fostering the research and industrialization of new energy technologies such as solar, wind, hydro, and hydrogen energy. By ensuring the cleanliness of the energy supply and fostering long-term alternatives to fossil fuels, these policies secure the safe and stable provision of clean and renewable energy at a reduced cost [18]. For instance, Fujian, as one of the regions selected to pilot the new policy, is leveraging the province’s endowment in new energy industries; as a result, there has been a gradual dismantling of institutional barriers, paving the way for sustained mechanisms that drive the efficient resolution of significant technical challenges and support ongoing innovation in the energy sector. In 2023, Fujian’s local government proactively sought solutions to significant technological challenges in the energy domain from a global pool of scientific research teams, offering substantial incentives and maintaining an open approach to team composition, thus injecting fresh impetus into industries and technologies grappling with long-standing barriers, such as the widespread adoption of hydrogen fuel cells and the integration of hydrogen in urban low-pressure pipeline gas systems.
From the implementation effects of the new policy for innovative transformation in regional industrial chains in various pilot areas, it can be seen that it can play a role in alleviating the “impossible triangle” of the energy system itself, that is photovoltaics, wind power, hydropower, hydrogen energy and other new energy sources as strategic emerging energies that can support regional development. It is inevitably the critical support object of the regional new industrial chain innovative transformation policy. At the same time, this policy has a profound impact on the energy demand side. China’s historical industrial supply chains suffer from low production capacity, hindering sustainable development. Moreover, traditional high-energy-consuming industries in China deplete significant energy resources, exacerbating societal energy poverty. Furthermore, China’s decentralized fiscal and centralized political control model incentivizes local government officials to prioritize GDP growth during their terms, perpetuating dependence on mature traditional industries and fostering a “race to the bottom” [19]. The new policy aims to transform traditional high-energy-consuming industries into new energy sectors by promoting clean energy and circular economy practices, facilitating green industrial development, and alleviating energy poverty at the regional level.
The new policy for innovative transformation in regional industrial chains aims to propel the development of emerging and future industries by fostering future technological advancements. It supports and nurtures a range of novel formats, models, and industries, which is exemplified by the industrial metaverse, generative artificial intelligence, and big data supercomputing centers [20]. This policy facilitates the structural transformation and upgrading of regional industries, positioning them strategically in the value chain. It shifts the region’s growth trajectory away from reliance on traditional high-energy-consuming industries, gradually phasing out outdated production capacities and facilitating structural changes to alleviate energy poverty. Furthermore, the emergence of these new formats, models, and industries creates additional high-value employment opportunities, boosts residents’ income, and enhances their resilience against energy poverty risks.
Moreover, the new policy for innovative transformation in regional industrial chains incentivizes heightened investment in local energy infrastructure and technological advancements. Its objective is to notably enhance energy supply efficiency while concurrently reducing the economic burden associated with energy acquisition, thus effectively easing the strain on energy-deprived regions. Additionally, spurred by this policy impetus, the innovative transformation of industrial chains in neighboring regions will catalyze a renewal of vitality within the local energy industry chain, fostering inter-industry synergy. This synergy is poised to dynamically propel the flourishing of pertinent local industries, consequently fostering marked advancements in the regional economy and the gradual mitigation of energy poverty issues. Consequently, the following hypotheses are posited for empirical scrutiny:
H1: 
The new policy for innovative transformation in regional industrial chains can facilitate energy poverty alleviation.
H2: 
The spatial direct and spillover effects of the new policy for innovative transformation in regional industrial chains on energy poverty alleviation are both significantly positive.

2.2. The Impact of the Conversion of New and Old Kinetic Energy on Energy Poverty Alleviation

The Chinese government recognizes that China’s current development is at a juncture characterized by a shifting growth trajectory, structural adjustment pains, and the culmination of earlier stimulus policies. To navigate this phase effectively, there is a pressing need to replace outdated models, formats, technologies, materials, and energy sources with their newer counterparts. This entails transitioning from a growth model focused on quantity to one emphasizing quality, from extensive expansion to intensive development, and from reliance on labor-intensive practices to knowledge-intensive economic growth [21]. This transition will realize the conversion of new and old kinetic energy from the supply, demand, and structural sides, thereby influencing regional energy poverty alleviation.
The conversion of new and old kinetic energy on the supply side involves a transition from the kinetic energy of capital investment to technical progress kinetic energy of human capital, fostering the adoption of environmentally friendly practices by enterprises. Human capital, comprising a diverse range of resources within organizations capable of generating value, encompasses knowledge reservoirs, practical experience, specialized skills, personal attributes, intrinsic motivation, and collaborative teamwork [22]. Recognized as a pivotal factor in research and development capabilities, the significance of human capital is becoming increasingly pronounced. It catalyzes technological innovation, facilitates the rapid dissemination of technology, and enhances the capacity of organizations to absorb new technologies. Consequently, this enhances the technological capabilities and energy efficiency of enterprises, leading to more effective and sustainable development within the energy sector and ultimately contributing to the energy poverty alleviation [23].
The conversion of new and old kinetic energy on the supply side also manifests in the transition from the kinetic energy of financial development to the innovative kinetic energy based on the Schumpeterian effect and the precise release of kinetic energy from financing pressures through the integration of technology and finance [24]. The innovative kinetic energy based on the Schumpeterian effect will drive technological innovation and entrepreneurial activities, leading to the emergence of more innovative business models and industrial sectors. On the one hand, the emergence of new business models and industrial sectors will create more job opportunities, potentially increasing income for rural residents. On the other hand, as clean energy continues to develop, its cost of use will decrease accordingly. Consequently, this will make it more convenient and appealing for rural residents to access and afford clean energy, effectively aiding them in overcoming energy poverty [25].
The precise release of kinetic energy from financing pressures through the integration of technology and finance refers to a novel economic growth momentum spawned by the deep integration of technology and finance, playing a catalytic role in technological innovation development and infusing fresh vitality into the financial sector. This synergy significantly propels the innovative progression of fintech. Fintech is an optimal amalgamation of technological and financial means that leverages cutting-edge technologies such as big data, cloud computing, artificial intelligence, and blockchain. Moreover, fintech has profoundly innovated traditional financial products and services. Its application in green finance notably elevates service standards and operational efficiencies, introducing innovative solutions across multiple domains including green credit, ESG investment and financing, green inclusive finance, financial transformation, carbon asset assessment, and carbon inclusivity [26]. This not only propels the flourishing development of green and emerging industries but also offers more adaptable, diverse financing avenues for clean energy projects, fostering deep research and application of green energy by enterprises, thus mitigating social inequalities stemming from energy poverty [27].
The demand side of the conversion of new and old kinetic energy manifests in the shift from the external demand kinetic energy based on comparative advantages to the internal demand kinetic energy based on the Engel effect. In recent years, domestic demand has contributed more than 100% to China’s economic growth in seven out of the past years, and it remains high in the first half of this year. This trend indicates a diminishing comparative advantage for China in external demand, which was previously reliant on raw material processing, inexpensive resources, and demographic dividends, giving way to the emergence of a vast unified domestic market. As China evolves from being a global processing hub to exporting high-value products, it not only enhances residents’ income but also compels domestic industries to undergo innovative transformations and upgrades, phasing out production models dependent on resource inefficiencies and large-scale, low-skilled labor inputs. This transition aims to facilitate comprehensive energy poverty alleviation and foster sustainable development across China [28].
The structural side of the conversion of new and old kinetic energy refers to the process of transforming the structural conversion of kinetic energy based on the Baumol effect and the kinetic energy of capital market development to the kinetic energy of advanced industrial structure and the value ascension kinetic energy of the industrial chain. The kinetic energy of advanced industrial structures involves the phasing out of outdated and inefficient capacities while actively nurturing strategically important emerging industries. This fosters deeper collaboration along the industrial chain, enhancing its overall value and innovation efficiency [29]. Simultaneously, the increasing value within the global industrial chain enables China to allocate more funds and resources towards research and innovation in energy technology. This aims to reduce energy waste and improve the development and utilization of new energy sources, thus contributing to a more robust industrial and financial foundation for energy poverty alleviation in regions.
The conversion of new and old kinetic energy exhibits significant spatial spillover effects. Firstly, this transformation accelerates the flow of factors across regions, leading to a “siphoning effect”. However, with diminished capital returns in central cities, production factors gradually disperse to peripheral cities, amplifying the “diffusion effect” and fostering a more balanced regional energy system. Secondly, as the Chinese central government increasingly prioritizes environmentally sustainable economic development, environmental governance holds a growing share in the performance evaluations of local governments. To meet assessment criteria, local authorities are likely to emulate the successful experience of neighboring places and enact policies encouraging local enterprises to innovate in energy, thereby reinforcing regional energy infrastructure [30].
Consequently, the following hypotheses are posited for examination:
H3: 
The conversion of new and old kinetic energy can facilitate energy poverty alleviation.
H4: 
The spatial direct and spillover effects of the conversion of new and old kinetic energy on energy poverty alleviation are both significantly positive.

2.3. The Mediating Effect of the Conversion of New and Old Kinetic Energy

Driven by the immediate objectives of policy implementation, the new policy for innovative transformation in regional industrial chains serves as a key initiative aimed at fostering high-quality development within regional supply chains and promoting industrial innovation. It is poised to catalyze a comprehensive overhaul in regional economic growth drivers, facilitating a shift in development paradigms and the emergence of new centers of growth and development momentum. While China’s prolonged period of high growth has propelled its populace past the era of widespread poverty and scarcity, since 2012, the nation has confronted pronounced downward pressures within its economic cycle. Despite widespread consensus among the Chinese government and scholars regarding the onset of a connotative, high-quality “new normal” in development, it is also acknowledged that China is currently navigating through a phase marked by concurrent challenges, including a “shift in growth momentum”, “structural adjustment pains”, and the “digestion phase of previous stimulus policies”. Consequently, there is a pressing need for China to adopt extraordinary measures to address the issue of insufficient economic growth momentum and strive for a state of high-growth, high-quality development. Hence, the Chinese government is endeavoring to effectuate the conversion of new and old kinetic energy through a series of governance strategies. The new policy for innovative transformation in regional industrial chains undeniably stands as a comprehensive, unconventional, and far-reaching strategic initiative embarked upon by the Chinese government through regional pilot implementations.
Therefore, the new policy for innovative transformation in regional industrial chains can profoundly impact the conversion of new and old kinetic energy. Specifically, by guiding and supporting the transition of traditional industries to the new energy sector, these policies empower traditional industries to undergo technological renovations and equipment upgrades amid market pressures and technological constraints, thereby facilitating a comprehensive restructuring and upgrading of the industrial landscape. Furthermore, through financial backing and incentives, the policies strongly advocate for technological innovation and foster deeper collaboration between industry, academia, and research, thus significantly enhancing the technological prowess and innovation capacity of emerging industries and laying a robust foundation for their rapid advancement. This not only fosters the emergence of new economic drivers but also fosters a conducive environment for transforming and enhancing traditional industries, expediting the conversion of new and old kinetic energy.
The primary objective of implementing the new policy for innovative transformation in regional industrial chains is to drive the conversion of new and old kinetic energy. Therefore, in examining the impact mechanisms of these policies on China’s energy poverty alleviation, this study inevitably delves into the mechanism effect of the conversion of new and old kinetic energy. It is essential to investigate the transmission pathway of “the new policy for innovative transformation in regional industrial chains → the conversion of new and old kinetic energy the alleviation of regional energy poverty”.
Furthermore, after examining the distinct mechanisms of the new policy for innovative transformation in regional industrial chains and the conversion of new and old kinetic energy on the alleviation of regional energy poverty, this study posits that the conversion of new and old kinetic energy can significantly facilitate positive conduits between regional value chain innovation transformation and energy poverty alleviation through its expansion of demand-side functions, upgrading of supply side values, and innovative adjustments in structural-side aspects. From the vantage point of this study, energy poverty alleviation encompasses fundamental aspects of urban and rural residents’ survival and livelihoods, including heating, food and accommodation, electricity services, and transportation. Therefore, this study elaborates on the conduits of four paths: “the new policy for innovative transformation in regional industrial chains → the conversion of new and old kinetic energy → the energy poverty alleviation in the heating segment”, “the new policy for innovative transformation in regional industrial chains → the conversion of new and old kinetic energy→ the energy poverty alleviation in the food and accommodation segment”, “the new policy for innovative transformation in regional industrial chains → the conversion of new and old kinetic energy → the energy poverty alleviation in the household electricity service segment”, and “the new policy for innovative transformation in regional industrial chains → the conversion of new and old kinetic energy → the energy poverty alleviation in the transportation segment”.

2.3.1. The New Policy for Innovative Transformation in Regional Industrial Chains → the Conversion of New and Old Kinetic Energy → the Energy Poverty Alleviation in the Heating Segment

Ensuring food and clothing security, particularly for rural dwellers, has long been of paramount concern for the Chinese government. In 2021, the government declared the nationwide elimination of poverty in this regard. Nevertheless, many rural areas still grapple with inadequate air conditioning and heating access. At the same time, urban regions face substantial energy system strain due to winter and summer heating and cooling demands. Coal has historically served as the primary heating source in rural China [31]. The nation’s heating and power infrastructure heavily leans on fossil fuels, chiefly coal, notwithstanding abundant domestic reserves, which, due to prolonged exploitation, have intensified energy dilemmas. Concurrently, sustained dependence on imported resources, notably oil, underscores significant energy pressures in China’s heating sector [32].
Driven by the new policy for innovative transformation in regional industrial chains, a new energy industry chain centered on renewable energy sources such as nuclear, wind, and solar can be forged on the energy supply front. In various regions, local governments actively foster innovation and development in the new energy sector through strategies such as prioritizing intellectual property examination, providing fiscal incentives, establishing new energy industry clusters, and fostering innovation hubs [33]. Notably, regions such as Fujian, Shaanxi, and Zhejiang embrace the new energy sector as key growth drivers, facilitating the conversion from conventional to renewable energy sources [34]. On the energy demand side, the policy emphasizes phasing out outdated production capacities represented by traditional high-energy-consuming industries in favor of developing emerging and future industries. This conversion promises significant energy savings for societal heating needs.

2.3.2. The New Policy for Innovative Transformation in Regional Industrial Chains → the Conversion of New and Old Kinetic Energy → the Energy Poverty Alleviation in the Food and Accommodation Segment

As the new policy for innovative transformation in regional industrial chains drives the conversion of new and old kinetic energy, the outdated energy consumption pattern characterized by high energy consumption and emissions is gradually replaced by a more efficient and cleaner one. This shift fosters the widespread adoption of clean energy in the accommodation and catering sectors, leading to continuous improvements in the energy consumption structure and effective energy poverty alleviation issues [35]. Renewable energy sources such as solar, wind, and biomass energy are increasingly finding applications in accommodation and catering, supported by the growing popularity of solar energy devices such as solar water heaters and photovoltaic systems in residential households [36]. Additionally, promoting biomass energy technology enables the effective conversion and utilization of waste from the catering industry, yielding clean energy products such as biogas and organic fertilizers. These advancements not only mitigate environmental pollution but also provide residents with more convenient, efficient, and cleaner energy services, thereby fostering a safer, cleaner, and greener living environment. For instance, environmentally friendly green building technologies and energy-saving measures are widely adopted in accommodation facilities, significantly reducing energy consumption [37]. Similarly, energy-efficient kitchenware and intelligent cooking equipment in the catering sector contribute to reduced energy consumption during cooking. Such optimization of the energy consumption structure, particularly in economically underdeveloped regions, not only helps lower residents’ energy expenses but also positively impacts living comfort and health levels.

2.3.3. The New Policy for Innovative Transformation in Regional Industrial Chains → the Conversion of New and Old Kinetic Energy → the Energy Poverty Alleviation in the Household Electricity Service Segment

China’s current power energy structure is facing numerous challenges, such as imbalances in power supply and demand, insufficient generation of energy sources, and severe environmental pollution. Data indicate that as of 2021, almost 70% of China’s energy supply relies on coal, leading to significant adverse impacts on the environment, economy, and society due to this excessive dependence on fossil fuels. The extensive activities of coal mining, transportation, and combustion have severely damaged China’s environment [38]. The high external costs associated with China’s coal-power chain primarily stem from the high energy consumption in power energy production and related industries, coupled with the low efficiency of environmental protection facilities [39]. However, the new policy for innovative transformation in regional industrial chains is driving the conversion of new and old kinetic energy, which can promote the adoption of clean energy and enhance energy utilization efficiency [40].
The new policy for innovative transformation in regional industrial chains promotes the development of emerging industries with low energy consumption and high added value while imposing restrictions or phasing out traditional industries with high energy consumption and low added value. For instance, after Anhui participated in the pilot program for the new policy for innovative transformation in regional industrial chains, its provincial planning emphasized the accelerated advancement of new materials, energy conservation, environmental protection, new energy vehicles, intelligent connected vehicles, and high-end equipment manufacturing. It also encourages residents to actively engage in technological innovation activities in resource and environmental management, energy efficiency, emission reduction, and circular economy. Consequently, in the implementation phase, the policy mandates the closure and conversion of traditional high-energy-consuming industries, focusing mainly on critical sectors such as steel, electrolytic aluminum, cement, flat glass, refining, synthetic ammonia, and calcium carbide, which have the most significant energy consumption impact in the region. This initiative aims to overhaul technological, procedural, and equipment aspects to foster an energy-efficient industrial chain. Such a comprehensive transformation of industrial chain processes directs energy towards more efficient and environmentally sustainable industries, thereby enhancing overall energy utilization efficiency.
These initiatives not only aid in lowering household electricity expenses but also alleviate the overall strain on energy supply. Simultaneously, the policy strongly advocates adopting clean and renewable energy technologies, incentivizing households to embrace clean energy sources such as solar and wind power and reducing overreliance on fossil fuels. This enhances the sustainability and security of household electricity consumption, contributing to realizing energy poverty alleviation goals within the household electricity service sector.

2.3.4. The New Policy for Innovative Transformation in Regional Industrial Chains → the Conversion of New and Old Kinetic Energy → the Energy Poverty Alleviation in the Transportation Segment

As urbanization accelerates, the issues of traffic congestion, air pollution, and energy consumption are becoming increasingly prominent. Constructing smart cities is an essential objective of the new policy for innovative transformation in regional industrial chains in China [41]. By utilizing advanced information technology and collecting, analyzing, and utilizing data, smart cities provide adequate decision support for urban management decision-makers. This leads to optimizing resource allocation and enhancing overall city operations, thus establishing a solid technological foundation for promoting green travel [42]. As a critical component, the intelligent transportation system integrates advanced technologies such as the Internet of Things, big data, and cloud computing. It enables real-time monitoring and prediction of traffic flow changes, optimization of traffic signal control logic, and effective reduction in traffic congestion. The implementation of these intelligent measures in the realm of public transportation not only reduces commuting costs for citizens but also further encourages the adoption of low-carbon travel methods. Furthermore, it provides real-time traffic information to drivers, assisting them in selecting the most optimal routes, thereby reducing commuting time and fuel consumption [43]. Additionally, this system supports intelligent traffic management, enhancing traffic efficiency to reduce tailpipe emissions and fuel wastage, thus contributing to the achievement of energy conservation and emission reduction goals in the transportation sector.
Another key objective of the new policy for innovative transformation in regional industrial chains is to actively promote the rise of new formats, models, and industries, particularly in the realm of new energy driven by the conversion of new and old kinetic energy, such as the burgeoning new energy vehicle sector. Owing to a combination of policy support, technological innovation, and increasing market demand, China’s new energy vehicle sector has achieved remarkable breakthroughs. Over the past decade, the pilot regions designated under the policy initiative have provided fresh opportunities for addressing energy poverty in the transportation sector of China [44]. For example, since the designation of Guangdong Province as a pilot province, it has leveraged its rich heritage in the traditional automotive industry, coupled with robust policy incentives and a growing market appetite, to foster homegrown champions such as BYD and GAC Aion, propelling the rapid expansion of new energy vehicle clusters in Guangzhou and Shenzhen.
Building upon the preceding analysis, this study posits the following hypotheses for empirical verification:
H5: 
The conversion of new and old kinetic energy serves as a positive mediator between the new policy for innovative transformation in regional industrial chains and the energy poverty alleviation.
H5(1): 
The conversion of new and old kinetic energy serves as a positive mediator between the new policy for innovative transformation in regional industrial chains and the energy poverty alleviation in the heating segment.
H5(2): 
The conversion of new and old kinetic energy serves as a positive mediator between the new policy for innovative transformation in regional industrial chains and the energy poverty alleviation in the food and accommodation segment.
H5(3): 
The conversion of new and old kinetic energy serves as a positive mediator between the new policy for innovative transformation in regional industrial chains and the energy poverty alleviation in the household electricity service segment.
H5(4): 
The conversion of new and old kinetic energy serves as a positive mediator between the new policy for innovative transformation in regional industrial chains and the energy poverty alleviation in the transportation segment.

2.4. The Causal Mediating Effect of the Conversion of New and Old Kinetic Energy: A Counterfactual Framework Analysis

The counterfactual framework, also known as the potential outcomes, is currently a significant focus in empirical economics for causal inference. This tool is used to explore the outcomes individuals would observe under different exposure conditions. Essentially, individuals may experience two outcomes under treatment and control conditions but cannot simultaneously belong to both groups, necessitating logical analysis and empirical methods to reveal potential outcomes under different conditions.
Regarding the subject of this study, the mechanism path of “the new policy for innovative transformation in regional industrial chains → the conversion of new and old kinetic energy → the energy poverty alleviation” has been identified as a feasible policy transmission path. However, it is essential to analyze, based on the logic of the counterfactual framework, whether this path is established in the treatment group of the new policy and whether it remains valid when extended to the control group (areas not part of the pilot implementation).
In the treatment group, the mechanism pathway of “the new policy for innovative transformation in regional industrial chains → the conversion of new and old kinetic energy → the energy poverty alleviation” has been established. Simultaneously, the transmission pathway of this policy can be analyzed from specific dimensions of the conversion of new and old kinetic energy, including supply-side, demand-side, and structural-side aspects. Specifically, the primary impact of the new policy for innovative transformation in regional industrial chains on the conversion of new and old kinetic energy lies in the enhancement of the supply side. In designated regions, this policy facilitates the increase in the value of China’s domestic industrial chains, reshaping the previous pattern where China’s research and development, as well as high-end brands, were predominantly outsourced, thus fostering a shift toward domestically produced high-tech products, high-end brands, and high-value industrial chains. Moreover, the direct influence of this policy on the conversion of new and old kinetic energy can be observed on the demand side. Through revitalizing the value of domestic industrial chains and leveraging the regulatory effect of China’s vast domestic market, the policy gradually transitions China’s economic growth from being export-driven to being fueled by domestic consumption [45]. Furthermore, the comprehensive impact of this policy on the conversion of new and old kinetic energy manifests in the structural side. By fundamentally transforming the innovation level of industrial chains, China’s economic momentum no longer heavily relies on extensive fiscal policies or wage differentials driven by inexpensive labor. Instead, this shift allows China to harness new industries and technologies to cultivate energy-efficient, environmentally sustainable, high-value-added, and internationally competitive new dynamics within its economic structure.
Implementing the new policy for innovative transformation in regional industrial chains within the treatment group has not only optimized the energy consumption structure, enhanced energy efficiency, and eradicated energy poverty but also laid the groundwork for the conversion of new and old kinetic energy. Generated by the conversion of new and old energy sources on the supply side, the innovation kinetic energy of the Schumpeter Effect, the technology-driven energy bias toward human capital, and the precise deployment of dynamic energy through the fusion of science and finance can rectify the conventional energy system’s “impossible triangle”, addressing its deviations and distortions [46]. This fuels the development and supply of new energy technologies and precisely nurtures the growth of new energy industries through avenues such as green finance and technology funding [47]. Providing residents with more widespread and accessible clean energy options such as solar and hydrogen power alleviates energy poverty [48]. Consequently, residents now have greater access to inclusive and sustainable clean energy sources such as photovoltaic and hydrogen, thereby advancing energy poverty alleviation efforts. On the demand side, the conversion of new and old kinetic energy has fostered new formats, models, and industries, effectively replacing domestic production across various sectors, stimulating the domestic demand economy, and shifting external demand energy toward domestic channels. Furthermore, the policy-induced emergence of new formats, models, and industries has elevated the innovation and industrial chain levels, resulting in upgraded value-added levels within regional industrial chains. This has created numerous new employment opportunities, particularly benefiting low-income groups, thereby boosting residents’ income and enabling them to afford energy consumption costs [49]. Consequently, economic poverty alleviation has facilitated energy poverty alleviation [50]. Additionally, on the structural side, the conversion of new and old kinetic energy has fundamentally reshaped the energy system across industrial forms, structures, and value compositions within industrial chains. This has not only facilitated the dissemination and adoption of new green universal energy sources but has also transformed traditional, energy-intensive industrial chains into high-value, low-energy technological ones, thereby significantly reducing energy losses in residents’ energy consumption. In essence, the mechanism pathway of “the new policy for innovative transformation in regional industrial chains → the conversion of new and old kinetic energy → the energy poverty alleviation” is indeed operational within the treatment group. In other words, removing the new policy for innovative transformation in regional industrial chains would likely impede progress in addressing energy poverty in pilot areas.
Furthermore, the mechanism outlined as “the new policy for innovative transformation in regional industrial chains → the (supply-side, demand-side, structural-side) conversion of new and old kinetic energy → the energy poverty alleviation” has proven effective even in the control group. Throughout the implementation of these policies, various pilot regions have developed standard institutional models and matured institutional experiences. For instance, by establishing a collaborative innovation system integrating industry, academia, and research, these regions have successfully transitioned scientific breakthroughs into tangible productivity. They have also enhanced innovation incentives to ignite the innovative spirit among enterprises and societal stakeholders. Moreover, by fostering an innovation cooperation network spanning various levels and fields, they have fostered the sharing and complementary utilization of innovative resources, thereby fostering the optimization, upgrading, and innovative evolution of regional industrial chains [51]. These institutional models and experiences have played pivotal roles not only in driving the conversion of new and old kinetic energy but also in providing a robust institutional foundation for tackling energy poverty. The new policy for innovative transformation in regional industrial chains, guided by its intrinsic innovative ethos and revolutionary institutional practices, has yielded remarkable results in pilot areas. Concurrently, these innovative practices and outcomes serve as invaluable references and benchmarks for non-pilot regions striving for development. Looking ahead, as the policy continues to be implemented to advance the strategy of kinetic energy conversion, this mechanism is poised to exert an even more pronounced impact across a broader spectrum of regions.
Consequently, within the outlined counterfactual framework, the following hypotheses are formulated for examination:
H6: 
The causal pathway of “the new policy for innovative transformation in regional industrial chains → the conversion of new and old kinetic energy → the energy poverty alleviation” is established within the treatment group, with the potential for generalization to the control group.
H6(1): 
The causal pathway of “the new policy for innovative transformation in regional industrial chains → the conversion of new and old kinetic energy on the supply side → the energy poverty alleviation” is established within the treatment group, with the potential for generalization to the control group.
H6(2): 
The causal pathway of “the new policy for innovative transformation in regional industrial chains → the conversion of new and old kinetic energy on the demand side → the energy poverty alleviation” is established within the treatment group, with the potential for generalization to the control group.
H6(3): 
The causal pathway of “the new policy for innovative transformation in regional industrial chains → the conversion of new and old kinetic energy on the structural side → the energy poverty alleviation” is established within the treatment group, with the potential for generalization to the control group.

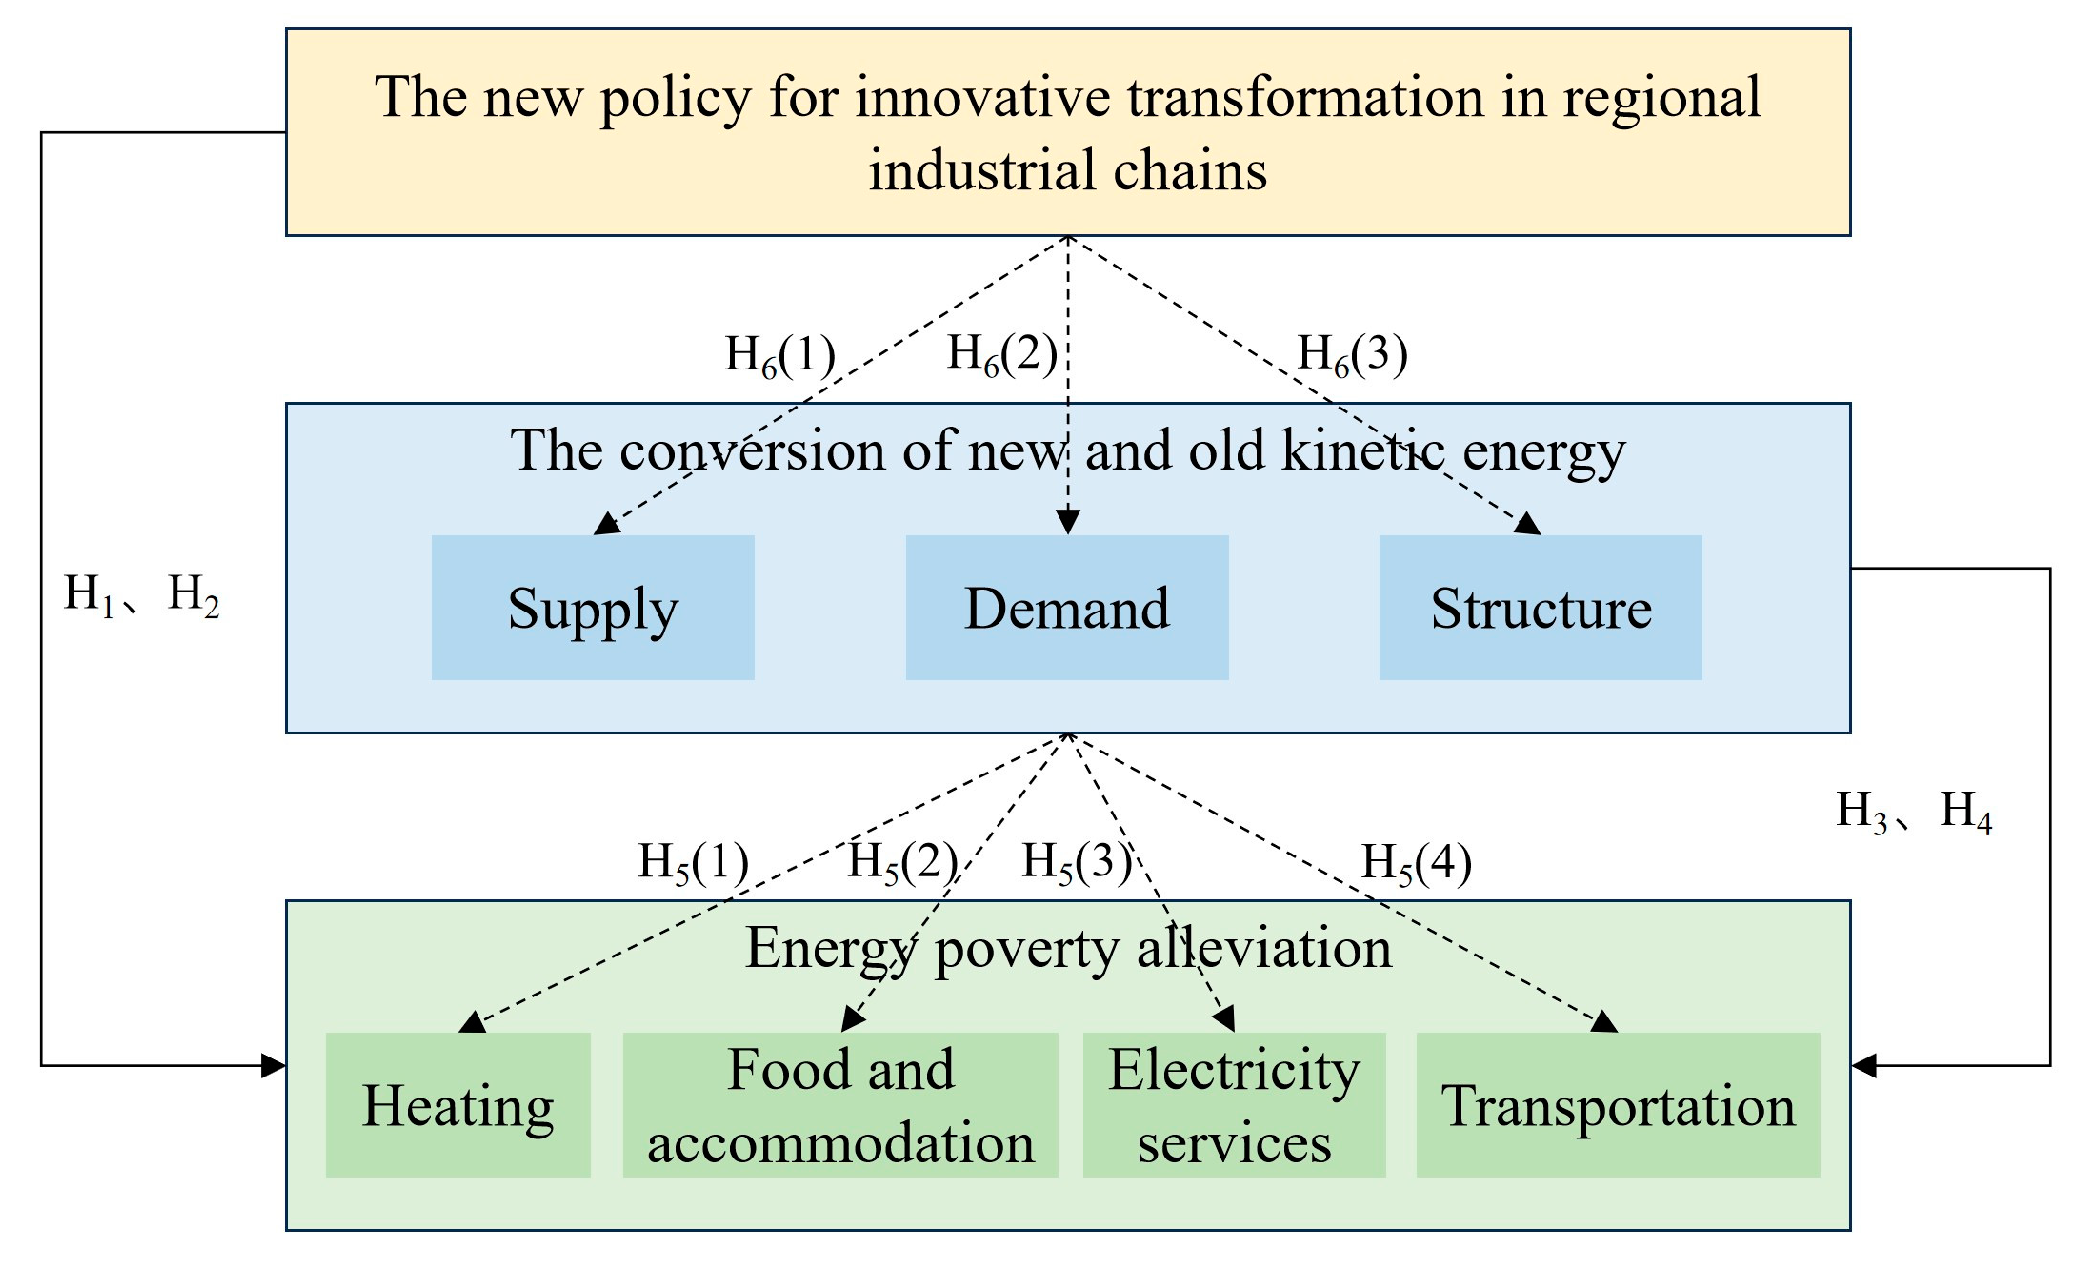
2.5. The Summary, Connection, and Validation Ideas of Mechanism Hypotheses

The hypotheses presented in the “2.2 Mechanism Analysis” section of the paper aim to provide insights into the causal relationship between policy and energy poverty alleviation and the mechanisms by which it works. These hypotheses form the support system for the core argument of the paper and help to build a logical and coherent argumentative framework. Figure 1 shows the relationship between these hypotheses.
First, Hypotheses H1 and H2 focus on the positive impacts of the direct and spillover effects of the new policy for innovative transformation in regional industrial chains on energy poverty alleviation. They aim to verify whether the policy can effectively contribute to energy poverty alleviation and whether their effects are spatially direct as well as positive spillovers through interregional demonstrations and interactions. This provides the article with an empirical basis for the effectiveness of policy interventions. The formulation of Hypotheses H1 and H2 lays the foundation for the research in this paper by clarifying the spatial direct and spillover effects of the policy on energy poverty alleviation. These two hypotheses point out that the policy not only directly reduces energy poverty in pilot areas, but also drives significant improvements in energy poverty in the wider region through spatial spillovers. The article utilizes panel data, combined with the double machine learning model and the spatial difference-in-difference model, to make in-depth causal inferences, which in turn provide a quantitative assessment of the direct and spillover impacts of the policy on energy poverty.
Hypotheses H3 and H4 then shift the perspective to the conversion of new and old kinetic energy, exploring the role of this transformation process itself for energy poverty alleviation and its spatial direct and spillover effects. These two hypotheses reinforce the importance of the conversion of new and old kinetic energy as an independent variable for addressing energy poverty, adding another dimension to the path of policy influence. Hypotheses H3 and H4 focus on the independent contribution of the conversion of new and old kinetic energy to energy poverty alleviation, emphasizing the positive effects of this transformation process in different dimensions. In order to test this mechanism hypothesis, the article needs to make the necessary quantification of the conversion of new and old kinetic energy based on panel data, and use a series of methods such as econometrics, which can reveal the impact relationship between the variables, to analyze the specific impacts of the conversion of new and old kinetic energy on energy poverty alleviation.
H5 and its sub-hypotheses further refine the mechanism analysis by proposing that the conversion of new and old kinetic energy is a positive mediating variable between the new policy for innovative transformation in regional industrial chains and energy poverty alleviation. This implies that the policy indirectly contributes to energy poverty alleviation in different areas of living consumption (e.g., heating, food and accommodation, household electricity services, and transportation) by facilitating the conversion of new and old kinetic energy. This set of hypotheses reveals a non-linear path from policy to energy poverty, emphasizing the bridging role of kinetic energy conversion in transmitting policy effects. H5 and its segmentation hypotheses emphasize the conversion of new and old kinetic energy as a key mediating mechanism linking the policy and energy poverty alleviation, providing a micro-level explanation for a deeper understanding of how policy can contribute to energy poverty alleviation through the substitution of new kinetic energy for old kinetic energy. The article analyzes the conversion of new and old kinetic energy as a mechanism variable placed between the new policy for innovative transformation in regional industrial chains and energy poverty alleviation. By employing a quasi-natural experimental design and incorporating specific indicators of the conversion of new and old kinetic energy, it is verified whether the mechanistic pathways of policy transmission to different areas of energy poverty (e.g., heating, food and accommodation, household electricity services, and transportation) do indeed exist as analyzed by classical theory.
Finally, the H6 series of hypotheses introduce a counterfactual framework to analyze the causal mediating role of the conversion of new and old kinetic energy at three specific levels: the supply side, the demand side, and the structural side, and to explore whether this mechanism can be generalized to the control group (non-policy implementation area) after it is established in the treatment group (policy implementation area). These hypotheses deepen the understanding of the policy mechanism, test the universality of the policy effect and the consistency of the mechanism, and provide a theoretical basis for policy replication. The H6 series of hypotheses delves into the specific mechanisms of the conversion of new and old kinetic energy as causal paths in the three dimensions of supply, demand, and structure, providing micro-level evidence of the mechanisms for a comprehensive understanding of the impacts of the new policy for innovative transformation in regional industrial chains. By constructing counterfactual scenarios and applying a series of advanced methods similar to machine learning algorithms, Monte Carlo algorithms, etc., which are able to effectively generalize and create counterfactual frameworks, the article helps to explore in depth the deviation between the real situation and the counterfactual scenarios, in order to clarify how the conversion of new and old kinetic energy can specifically contribute to the energy poverty alleviation along the three dimensions, and to further explore their general applicability and replication value.

3. Quasi-Natural Experiment Design, Variable Interpretation, and Data Sources

3.1. Quasi-Natural Experiment Design and Model Construction

3.1.1. Construction of Spatial Difference-in-Difference Model

Drawing on Dubé et al.’s derivation method, this paper establishes three types of spatial difference-in-difference models:
Spatial autoregressive difference-in-difference model (SAR-SDID):
Model   1 :   EPA it = ρ W y it + α 1 DID it 1 + α 2 X it 1 + μ i + ε it
Spatial error difference-in-difference model (SEM-SDID):
Model   2 :   EPA it = α 1 DID it 1 + α 2 X it 1 + μ i + μ it μ it = λ W μ it + ε it
Spatial Durbin difference-in-difference model (SDM-SDID):
M o d e l   3 :   EPA it = ρ W y it + α 1 DID it 1 + β 1 W DID it 1 + α 2 X it 1 + β 2 W x it 1 + μ i + ε it
In this context, W represents the spatial weight matrix. The economic distance weight matrix W e is selected to construct the spatial relationship between 30 provinces (excluding Tibet) in mainland China. Its elements are obtained by calculating the absolute average per capita GDP difference between region i and region j during the sample period and taking the reciprocal. When the spatial weight matrix W is combined with different variables ( W DID , W μ   and   W y ), it indicates the spatial impact of neighboring provinces’ average effects on energy poverty alleviation in this region.

3.1.2. Construction of Double Machine Learning Model

(1)
Benchmark Regression Model Based on Double Machine Learning Model
The concept of double machine learning was formally introduced into academic research by Chernozhukov et al. in 2018 [52], bringing new vitality to the field of machine learning. Farbmacher et al. employed a combined approach of double machine learning and causal mediating analysis [53]. Utilizing data from the National Longitudinal Study of Youth conducted by the U.S. Bureau of Labor Statistics, they extensively explored the causal relationship between health insurance coverage and the health status of young individuals within a counterfactual framework. Building upon their research, this paper will employ a double machine learning model to thoroughly assess the implementation effects of the new policy for innovative transformation in regional industrial chains. Initially, the construction of partially linear double machine learning models is as follows:
Model   4 :     EPA it + 1   = θ 0 DID it + g X it + U it E U it DID it , X it = 0
Model   5 :     EPA it + 1 =   θ 1 Conv it + g X it + U it E U it Conv it , X it = 0
In this context, i represents the province, and t represents the year. EPA it + 1   is the dependent variable, signifying energy poverty alleviation. DID i t denotes the treatment variable, indicating the implementation status of the new policy for innovative transformation in regional industrial chains, while Conv i t represents one of the pivotal explanatory variables, depicting the conversion of new and old kinetic energy. In this study, θ 0   and θ 1 emerge as the core parameters of specific interest, serving as the treatment coefficients. X i t constitutes a high-dimensional set of control variables, necessitating the utilization of machine learning algorithms to estimate its precise form g X it . U it represents the error term, with a conditional mean of 0. Notably, the double machine learning model inherently carries “regularization bias”, resulting in its lack of unbiasedness. To address this issue, exemplified by Model 1, this paper constructs the following auxiliary regression:
  DID it = m X it + V it E V it X it = 0
In this context, m X it represents the regression relationship of the treatment variable concerning the high-dimensional set of control variables, and its specific form m ^ X it needs to be estimated using machine learning algorithms. V it   denotes the error term, with its conditional mean set to 0. Subsequently, V ^ it   is employed as the instrumental variable for DID i t   in regression analysis, yielding unbiased coefficient estimates.
(2)
Testing the Mediating Effect of the Conversion of New and Old Kinetic Energy Based on Double Machine Learning Model
In order to test the hypotheses of H5, the following model is constructed:
Model   6 :             EPA ( DEM ,   Sup , Str ) i , t + 1 = θ 0 DID i , t & + g X i , t + U i , t , E U i , t X i , t ,   DID i , t = 0   Conv i , t =   θ 0   DID i , t + g X i , t + U i , t , E U i , t X i , t ,   DID i , t = 0   EPA ( DEM ,   Sup , Str ) i , t + 1 =   θ 0   DID i , t + θ 1   Conv i , t + g X i , t + U i , t , E U i , t X i , t ,   DID i , t = 0          
Model 6 conducts a stepwise regression analysis of the mediating mechanism pathways based on a double machine learning model. The first regression equation is used to examine the total effect of   DID i , t   on   EPA   ( DEM ,   Sup ,   Str ) i , t + 1 . The second and third regressions, in turn, assess the direct and indirect effects of the pathway “ DID i , t   Conv i , t EPA   ( DEM ,   Sup ,   Str ) i , t + 1 ”.
(3)
Testing the Causal Mediating Effect under Counterfactual Framework Based on Double Machine Learning Model
In order to test the causal mediating effect in the counterfactual framework in the hypotheses of H6, this paper constructs Model 7, which is an empirical analysis process in the counterfactual framework.
Model   7 :                                 θ 1 = E EPA 1 , Conv 1 EPA 0 , Conv 1 θ 0 = E EPA 1 , Conv 0 EPA 0 , Conv 0 δ ( 1 ) = E EPA 1 , Conv 1 EPA 0 , Conv 1 δ ( 0 ) = E EPA 0 , Conv 1 EPA 0 , Conv 0
In simple terms, EPA DID ,   Conv DID   reveals the dual influence of the explanatory variable EPA by DID and Conv DID , with Conv potentially taking different values under different DID states ( DID = 1   or   0 ).
Model 7 allows for assessing the direct effect ( θ 1 ) in the treatment group, which can be regarded as the expected difference between the actual occurrence of EPA 1 ,   Conv 1   and the counterfactual occurrence when DID is taken to 0 and Conv DID   is taken to Conv 1 . θ 1 is also known as the total natural direct effect. Similarly, the indirect effect ( δ 1 ) in the treatment group can be seen as the expected difference between the actual occurrence of EPA 1 ,   Conv 1   and the counterfactual occurrence when DID is taken to 0 and Conv DID   is taken to Conv 1 ). δ 1 is also called the total natural indirect effect. The presence of the mechanism pathway in the treatment group can be assessed based on the magnitude of EPA before and after policy removal using θ 1   and δ 1 .
Simultaneously, the direct effect in the control group ( θ 0 ) can be regarded as the expected difference between the counterfactual occurrence and the actual occurrence of EPA(0, Conv(0)) when DID is taken to 1 and Conv DID   is taken to Conv 0 , where θ 1   is also referred to as the pure natural direct effect. Similarly, the indirect effect in the treatment group δ 0 can be seen as the expected difference between the actual occurrence of EPA 0 , Conv 0 and the counterfactual occurrence when DID is taken to 0 and Conv DID   is taken to Conv 1 ), where δ 0   is also known as the pure natural indirect effect. Using   θ 0 and δ 0 allows us to determine whether the mechanism pathway still exists when the policy is extended to pilot areas.

3.2. Variable Interpretation and Sources

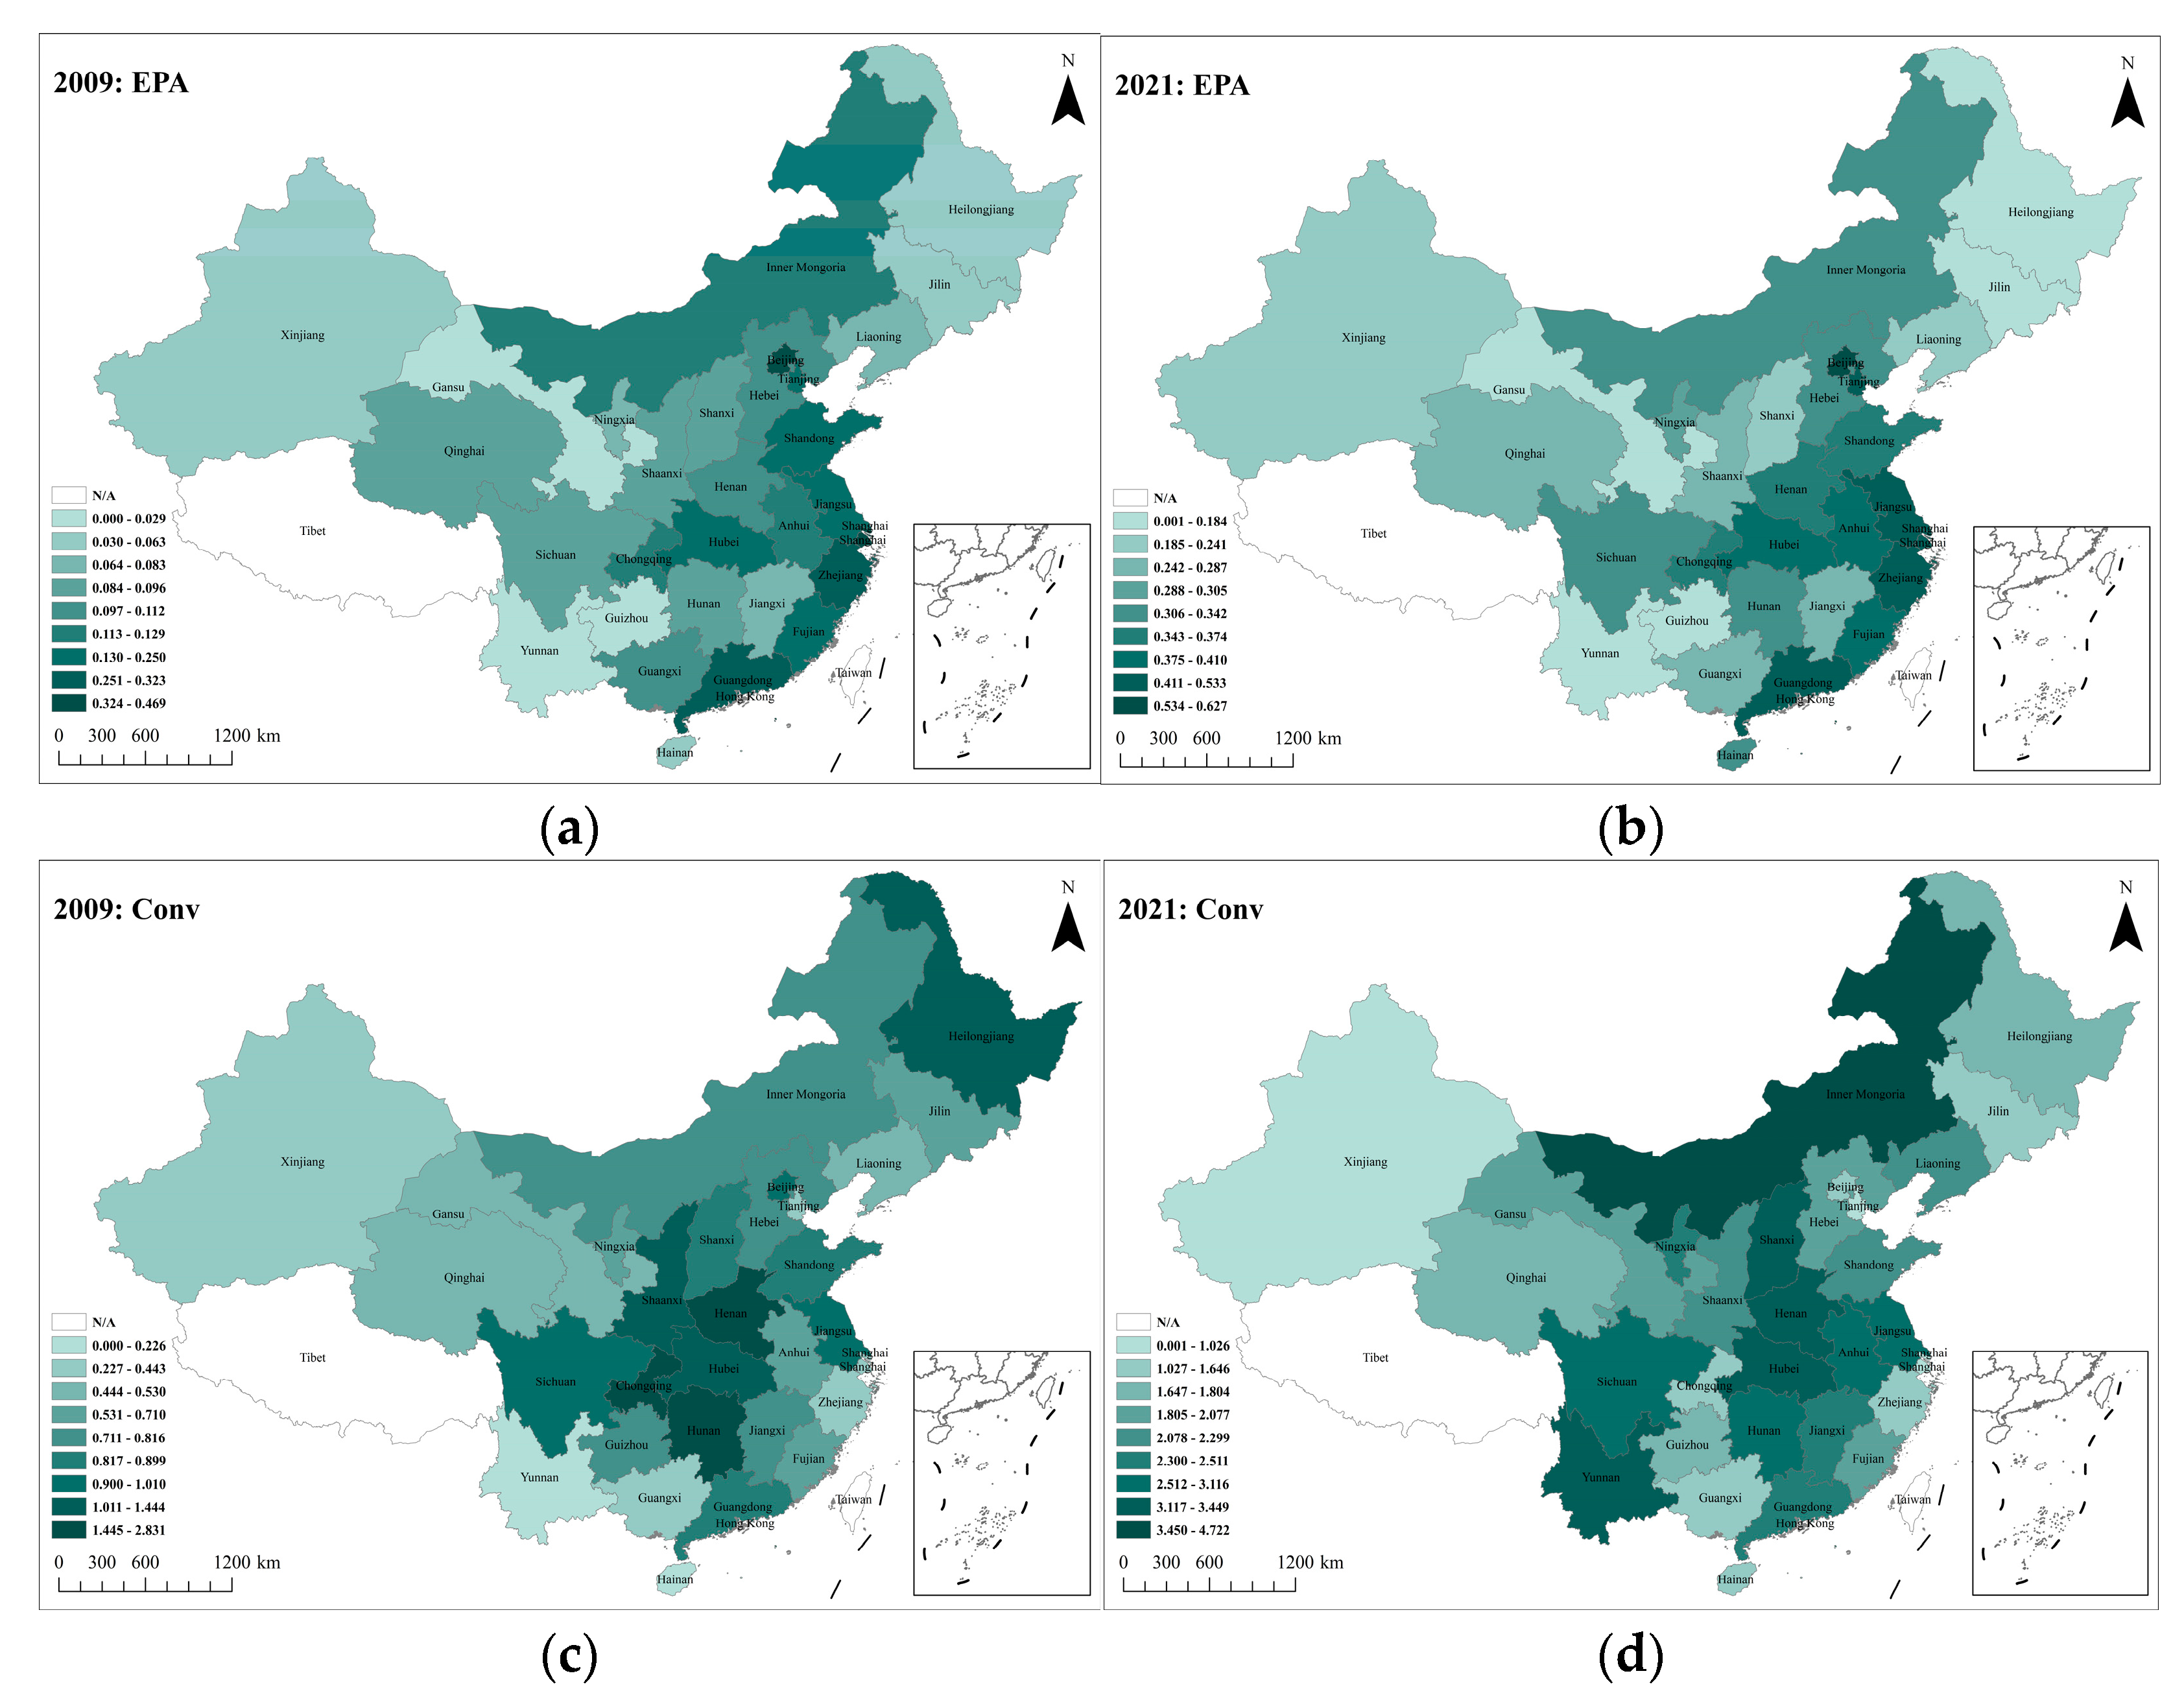
3.2.1. Explained Variable: Energy Poverty Alleviation Index (EPA) of Provinces in China

As the world’s largest developing country and emerging market, China’s central government has long been committed to the construction and governance of a modern energy system. However, the instability and imbalance of the energy system have plagued China’s energy governance efforts. In 2021, the Chinese central government announced the eradication of poverty nationwide. However, with the elimination of absolute poverty and regional overall poverty, China’s governance of structural resource imbalances has entered a new development phase. As a novel form of structural imbalance in resources, energy poverty has constrained China’s medium- and long-term development.
As a fundamental research variable in this study, assessing and measuring energy poverty alleviation at the provincial level in China (Energy Poverty Alleviation Index of Chinese Provinces) is imperative. Hence, drawing on the research conducted by Su and Sun [54], this study devises the Chinese provincial energy poverty alleviation index (EPA), depicted in Table 1. This study divides the examination of the energy poverty alleviation in China into four segments: heating, food and accommodation, electricity services, and transportation, and constructs a three-tier evaluation system. Data are sourced from the “China Agricultural Statistical Yearbook”, the “China Energy Statistical Yearbook”, the “China Statistical Yearbook”, the “China Rural Statistical Yearbook”, and the CEIC database. To address missing data, linear interpolation was employed for completion. Upon the data’s acquisition, they were compiled into panel data spanning from 2009 to 2021, encompassing 30 provinces, municipalities, and autonomous regions (excluding Tibet) in mainland China. This study utilizes the entropy method to initially evaluate the energy poverty alleviation indexes for heating (Heat), food and accommodation (F and A), electricity services (Elec), and transportation (Trans) to facilitate dimensional exploration. Subsequently, these indexes are aggregated to form the Chinese provinces’ comprehensive energy poverty alleviation index.

3.2.2. Explanatory Variable: Treatment Variable of the New Policy for Innovative Transformation in Regional Industrial Chains (DID)

The new policy for innovative transformation in regional industrial chains serves as the central explanatory variable examined in this study to investigate the mechanisms by which regional integrated innovation policies impact the energy poverty alleviation in China. It is also the experimental treatment variable for quasi-natural experiments in the empirical analysis conducted herein.
In 2013, Jiangsu Province in China became the first to be selected as a pilot province for the “Innovative Province” policy initiative. This policy advocates for improving the acquisition and utilization mechanisms of existing innovation elements at the regional level, reducing the invisible thresholds for innovation and entrepreneurship, and lowering various institutional transaction costs. Its objective is to establish an open innovation ecosystem conducive to innovative enterprises’ sustained birth and growth and foster co-prosperity. Concurrently, the policy aims to establish a diverse innovation system encompassing policy, industrial, financial, and social innovation. It particularly emphasizes the implementation of significant industrial technology innovation initiatives or projects, accelerating breakthroughs in key core technologies of industries and their widespread application, nurturing and developing strategic emerging industries, supporting the transformation and upgrading of traditional industries, enhancing the level of innovation and development in the service industry, and accelerating the development of modern agriculture. Therefore, from the perspective of policy objectives, the pilot initiative of the “Innovative Province” policy focuses on institutional mechanism innovation as an intermediate goal, aiming to drive the transformation of regional industrial chain innovation. Hence, the “Innovative Province” policy is considered a new policy for innovative transformation in regional industrial chains.
Given that the new policy for innovative transformation in regional industrial chains is poised to revolutionize China’s existing regional policies through institutional reform, particularly by driving unconventional leapfrog innovation in the industrial chain through “disruptive innovation” in the institutional realm, the Chinese central government has opted for a strategy of regional linkage, gradually expanding the policy by progressively selecting regions for policy trials. Consequently, this policy represents a long-term, dynamically adjusted pilot initiative. As of 2023, 11 regions in China have been selected as pilot areas for this innovative transformation, including Jiangsu (2013), Anhui (2013), Shaanxi (2013), Zhejiang (2013), Hubei (2016), Guangdong (2016), Fujian (2016), Sichuan (2017), Shandong (2017), Hunan (2018), and Jilin (2021), with the year of selection denoted in parentheses.
This study employs a dummy variable to represent the policy’s treatment variable (DID), setting the variable to one for provinces selected for the pilot and zero for others.

3.2.3. Explanatory Variable/Mechanism Variable: Conversion of New and Old Kinetic Energy (Conv)

This study primarily focuses on the conversion of new and old kinetic energy from three dimensions: demand side, structural side, and supply side. Drawing on the research of Yin and Zhang [55], this study takes these as the main dimensions and devises an evaluation index system for the conversion of new and old kinetic energy in Chinese provincial regions, as illustrated in Table 2. Broadly, this index system delineates the specific processes of the conversion of new and old kinetic energy (from conventional to new kinetic energy) into the following three segments: the transformation of the external demand kinetic energy based on comparative advantages into the internal demand kinetic energy based on the Engel effect; the shift from the kinetic energy of capital investment and financial development to the technical progress kinetic energy of human capital; and the innovative kinetic energy based on the Schumpeterian effect and the precise release of kinetic energy from financing pressures through the integration of technology and finance. Additionally, the index system encompasses the structural transition from the structural conversion of kinetic energy based on the Baumol effect and the kinetic energy of capital market development to the kinetic energy of advanced industrial structure and the value ascension kinetic energy of the industrial chain.
The panel data still span over 30 mainland Chinese provinces from 2009 to 2021 (excluding Tibet), primarily sourced from the “China Statistical Yearbook”, the “China High-Tech Industry Statistical Yearbook”, the “China Industrial Statistical Yearbook”, the “China Business Yearbook”, and the CNRDS database.
Furthermore, building upon the research of Song et al. [56] and guided by the Global Financial Stability Board’s (FSB) definition of financial technology, an extensive search was conducted on the Chinese search engine Baidu for core keywords related to financial technology, including “fintech”, “Internet of Things”, “big data”, “cloud computing”, “blockchain”, “artificial intelligence”, etc. These keywords were then cross-referenced with terms in the financial domain, such as “finance”, “insurance”, “credit”, “clearing”, “payment”, etc., as well as with provincial names and years in China. Subsequently, Python was utilized to crawl the web pages annually for the core financial technology keywords pertinent to Chinese provinces and serve them as proxy variables for the fintech index.
This study refers to the classic measurement method proposed by Hausman et al. [57] and adopts the formula j = 1 n ( x ij / x i ) i = 1 n x ij / x i j = 1 n x ij / x i y i to measure and evaluate the comprehensive technological complexity of 22 categories of Chinese exported goods, where y i   represents the per capita GDP of region i , x ij   represents the export value of commodity j   in regions i , and x i   represents the total export value of region i .
After constructing the index system and obtaining the data, this study employed the entropy method to further measure the conventional kinetic energy on the demand side (DeC), supply side (SuC), structural side (StC), as well as the new kinetic energy on the demand side (DeN), supply side (SuN), and structural side (StN). Subsequently, the entropy method was used to calculate the conversion of new and old kinetic energy on the demand side (Dem), supply side (Sup), and structural side (Str), accordingly.
Dem it = DeN it DeC it
Sup it = SuN it SuC it
  Str it = StN it StC it
Subsequently, utilizing the entropy method, the conventional kinetic energy on the demand side (DeC), supply side (SuC), and structural side (StC) were comprehensively evaluated as the conventional energy index (CEI). Similarly, the new kinetic energy on the demand side (DeN), supply side (SuN), and structural side (StN) was aggregated into the new energy index (NEI). Thus, the composite index for the conversion of new and old kinetic energy (Conv) was computed.
  Conv it = NEI it ORI it

3.2.4. Control Variables

This study selects rationalization of industrial structure (RIS), natural population growth rate (PGR), per capita GDP growth rate (GGR), openness to international trade (Open), level of higher education development (HE), and green investment (GI) as control variables.
Among them, the measurement of RIS refers to the method proposed by Gan Chunhui et al. [58], and the measurement method is as follows:
RIS = 1 i = 1 n ( Y i Y ) ln ( Y i L i / Y L )
This method is the inverse of the Theil index, where i i = 1 , 2 , 3   represents the three industries, Y i   is the output value of the i industry, L i   is the number of employees in the i industry, Y is the total output value of the three industries in the region, and L is the total employment in the three industries in the region.
In addition, this study adopts the ratio of incremental foreign investment to regional GDP growth as the proxy variable for assessing openness to international trade (Open); the ratio of teacher to student population in colleges and universities serves as the proxy variable for the level of higher education development (HE); and the ratio of investment in regional environmental pollution control to regional GDP is used as the proxy variable for green investment (GI).
The variables above were compiled into panel data for 30 provinces, municipalities, and autonomous regions (excluding Tibet) in mainland China from 2009 to 2021. The relevant data were sourced from the “China Statistical Yearbook”, the “China Environmental Statistical Yearbook”, the “China Education Statistical Yearbook”, and the statistical yearbooks of respective regions.

3.2.5. Spatial Weight Matrix

Spatial weight matrices were used to reflect the interdependence between spatial units. To examine the spatial spillover effects of the policy and the conversion of new and old kinetic energy on the energy poverty alleviation based on the spatial difference-in-difference model, it is necessary to adopt a specific spatial weight matrix to reflect the spatial dependence of variables.
This study posits that China’s marketization has surpassed 40 years, with the establishment of the “national unified large market” in 2021 as a new strategic goal for marketization. With the ongoing development of transportation technology, infrastructure, and market integration, the impact of geographical distance on the spillover and migration of economic variables is negligible. Instead, the economic exchanges among regions significantly contribute to the spatial spillover effects of economic variables. Based on this, this study plans to utilize the economic distance spatial weight matrix as the spatial weight matrix for the research.
The specific construction of elements for this matrix is outlined as follows:
  W ij = 1 | y i y j | 0 , i j ,   i = j  
In the above equation, W ij   is the matrix element corresponding to regions i and j in the spatial weight matrix. y i   and y j are the GDP per capita of regions i and j .
Figure 2a,b show the spatial and temporal distribution of the Energy Poverty Alleviation Index for 2009 and 2021, respectively, and Figure 2c,d show the spatial and temporal distribution of the conversion of new and old kinetic energy for 2009 and 2021, respectively. As can be seen from the figures, both in 2009 and 2021, EPA shows high levels in Inner Mongolia and the southeastern region of China, while it is relatively low in the northwestern, southwestern, and northeastern regions. For Conv, values were higher in Heilongjiang and south-central China in 2009, and relatively lower in northwest and southwest China. However, by 2021, Conv values have increased in Inner Mongolia and Southwest China, except in South Central China, where Conv values are still high.

4. Empirical Analysis

4.1. Empirical Analysis Based on Spatial Difference-in-Difference Model

4.1.1. Spatial Autocorrelation Test—Based on Global Moran’s I and Local Moran Scatter Plot

As indicated in Table A1, the global Moran’s I values for regional energy poverty alleviation are consistently positive and statistically significant, demonstrating a spatial distribution characterized by positive autocorrelation rather than randomness. This observation underscores the validity of employing spatial econometric analysis techniques. Nevertheless, while Moran’s I index serves as a pivotal measure of spatial correlation, in order to ensure the precision and comprehensiveness of the study, it remains imperative to corroborate and analyze the findings in conjunction with other pertinent datasets.
In order to assess the local spatial correlation of variables, this study illustrates the local Moran scatter plots of the Energy Poverty Alleviation Index across Chinese provinces, as depicted in Figure 3. Figure 3a,b show local Moran scatter plots for EPA in 2009 and 2021, respectively. Analysis of the graphical representation reveals a predominant concentration of data points in the first and third quadrants for most provinces, with fewer regions occupying the second and fourth quadrants. This observation underscores the notable spatial distribution pattern of energy poverty alleviation in China, characterized by a tendency towards the formation of high–high (HH) and low–low (LL) spatial agglomerations.
Based on the examination results of the local Moran scatter plot and global Moran index, it is reasonable to choose the spatial difference-in-difference model to investigate the mechanism of the new policy for innovative transformation in regional industrial chains and the conversion of new and old kinetic energy on energy poverty alleviation.

4.1.2. Model Selection and Applicability Test

To select an appropriate spatial econometric model, this study utilizes the autocorrelation test method to determine the most suitable model among these three models. Firstly, the LM test is conducted to ensure model selection accuracy, with detailed results provided in Table A2. The results of the Lagrange multiplier test indicate significance for both LM-Lag and LM-Error. Therefore, it is necessary to conduct the robust Lagrange multiplier test further. The results reveal that both robust LM-Lag and robust LM-error are significant. Consequently, this study should adopt the spatial Durbin difference-in-difference model as the research model for further analysis.
To examine the possibility of the spatial Durbin difference-in-difference model degenerating into either the spatial autoregressive difference-in-difference model or the spatial error difference-in-difference model, the LR test and Wald test were further conducted. Based on the test outcomes detailed in Table A2, both LR and Wald statistics exhibit significance at the 1% level. This unequivocally suggests that the spatial Durbin difference-in-difference model remains distinct from the spatial autoregressive difference-in-difference model and the spatial error difference-in-difference model. Relying solely on the other two models to investigate spatial spillover effects might introduce errors. Consequently, this study opts for employing the spatial Durbin difference-in-difference model with a foundation in random effects.

4.1.3. Empirical Results Report of Spatial Difference-in-Difference Model

After a thorough validation process, this study adopts the spatial Durbin difference-in-difference model to examine how the new policy for innovative transformation in regional industrial chains and the conversion of new and old kinetic energy affect energy poverty alleviation from the perspective of spatial spillover effects. The findings in Table A3 reveal a significant negative spatial autoregressive coefficient (ρ) at the 1% significance level, indicating that for every unit increase in EPA in other regions, there is a corresponding decrease of 0.302 units in EPA in the local region.
As depicted in Table A3, the spatial direct effect coefficient of DID is 0.0113, which is significant at the 10% significance level, which suggests a notable positive direct effect of the new policy on energy poverty alleviation within the local area. This underscores the policy’s ability to enhance energy efficiency by introducing advanced technologies and management practices, thereby reducing unnecessary energy consumption and alleviating the energy burden in impoverished areas. However, the non-significant spatial spillover coefficient of DID indicates that Hypothesis H2 is not supported. This could be attributed to the siphoning effect induced by policy measures. Moreover, achieving energy poverty alleviation necessitates close alignment with each region’s existing energy structure and industrial model, implying that policy spillover effects may not uniformly manifest significant impacts across regions.
The spatial direct effect coefficient and spillover coefficient of Conv are 0.0115 and 0.0284, respectively, both passing the 5% significance threshold. This suggests that energy poverty alleviation in the region is not only significantly facilitated by the local the conversion of new and old kinetic energy, but also by the positive spatial transmission effects generated by the conversion of new and old kinetic energy in adjacent regions. With this analysis in mind, hypothesis H4 is confirmed validly.
Furthermore, introducing the interaction term between the policy and the the conversion of new and old kinetic energy in the spatial Durbin difference-in-difference model is noteworthy. Empirical examination reveals that the spatial direct effect coefficient of the interaction term is 0.0415, surpassing the 1% significance level. Additionally, its spatial spillover coefficient stands at 0.0245, signifying significance at the 10% level. This underscores that the interaction term has both significantly positive spatial direct effects and significantly positive spatial spillover effects on energy poverty reduction. In essence, the new policy for innovative transformation in regional industrial chains not only positively modulates the promotional effects of the conversion of new and old kinetic energy on local energy poverty alleviation but also amplifies its positive spatial spillover effects in adjacent areas.

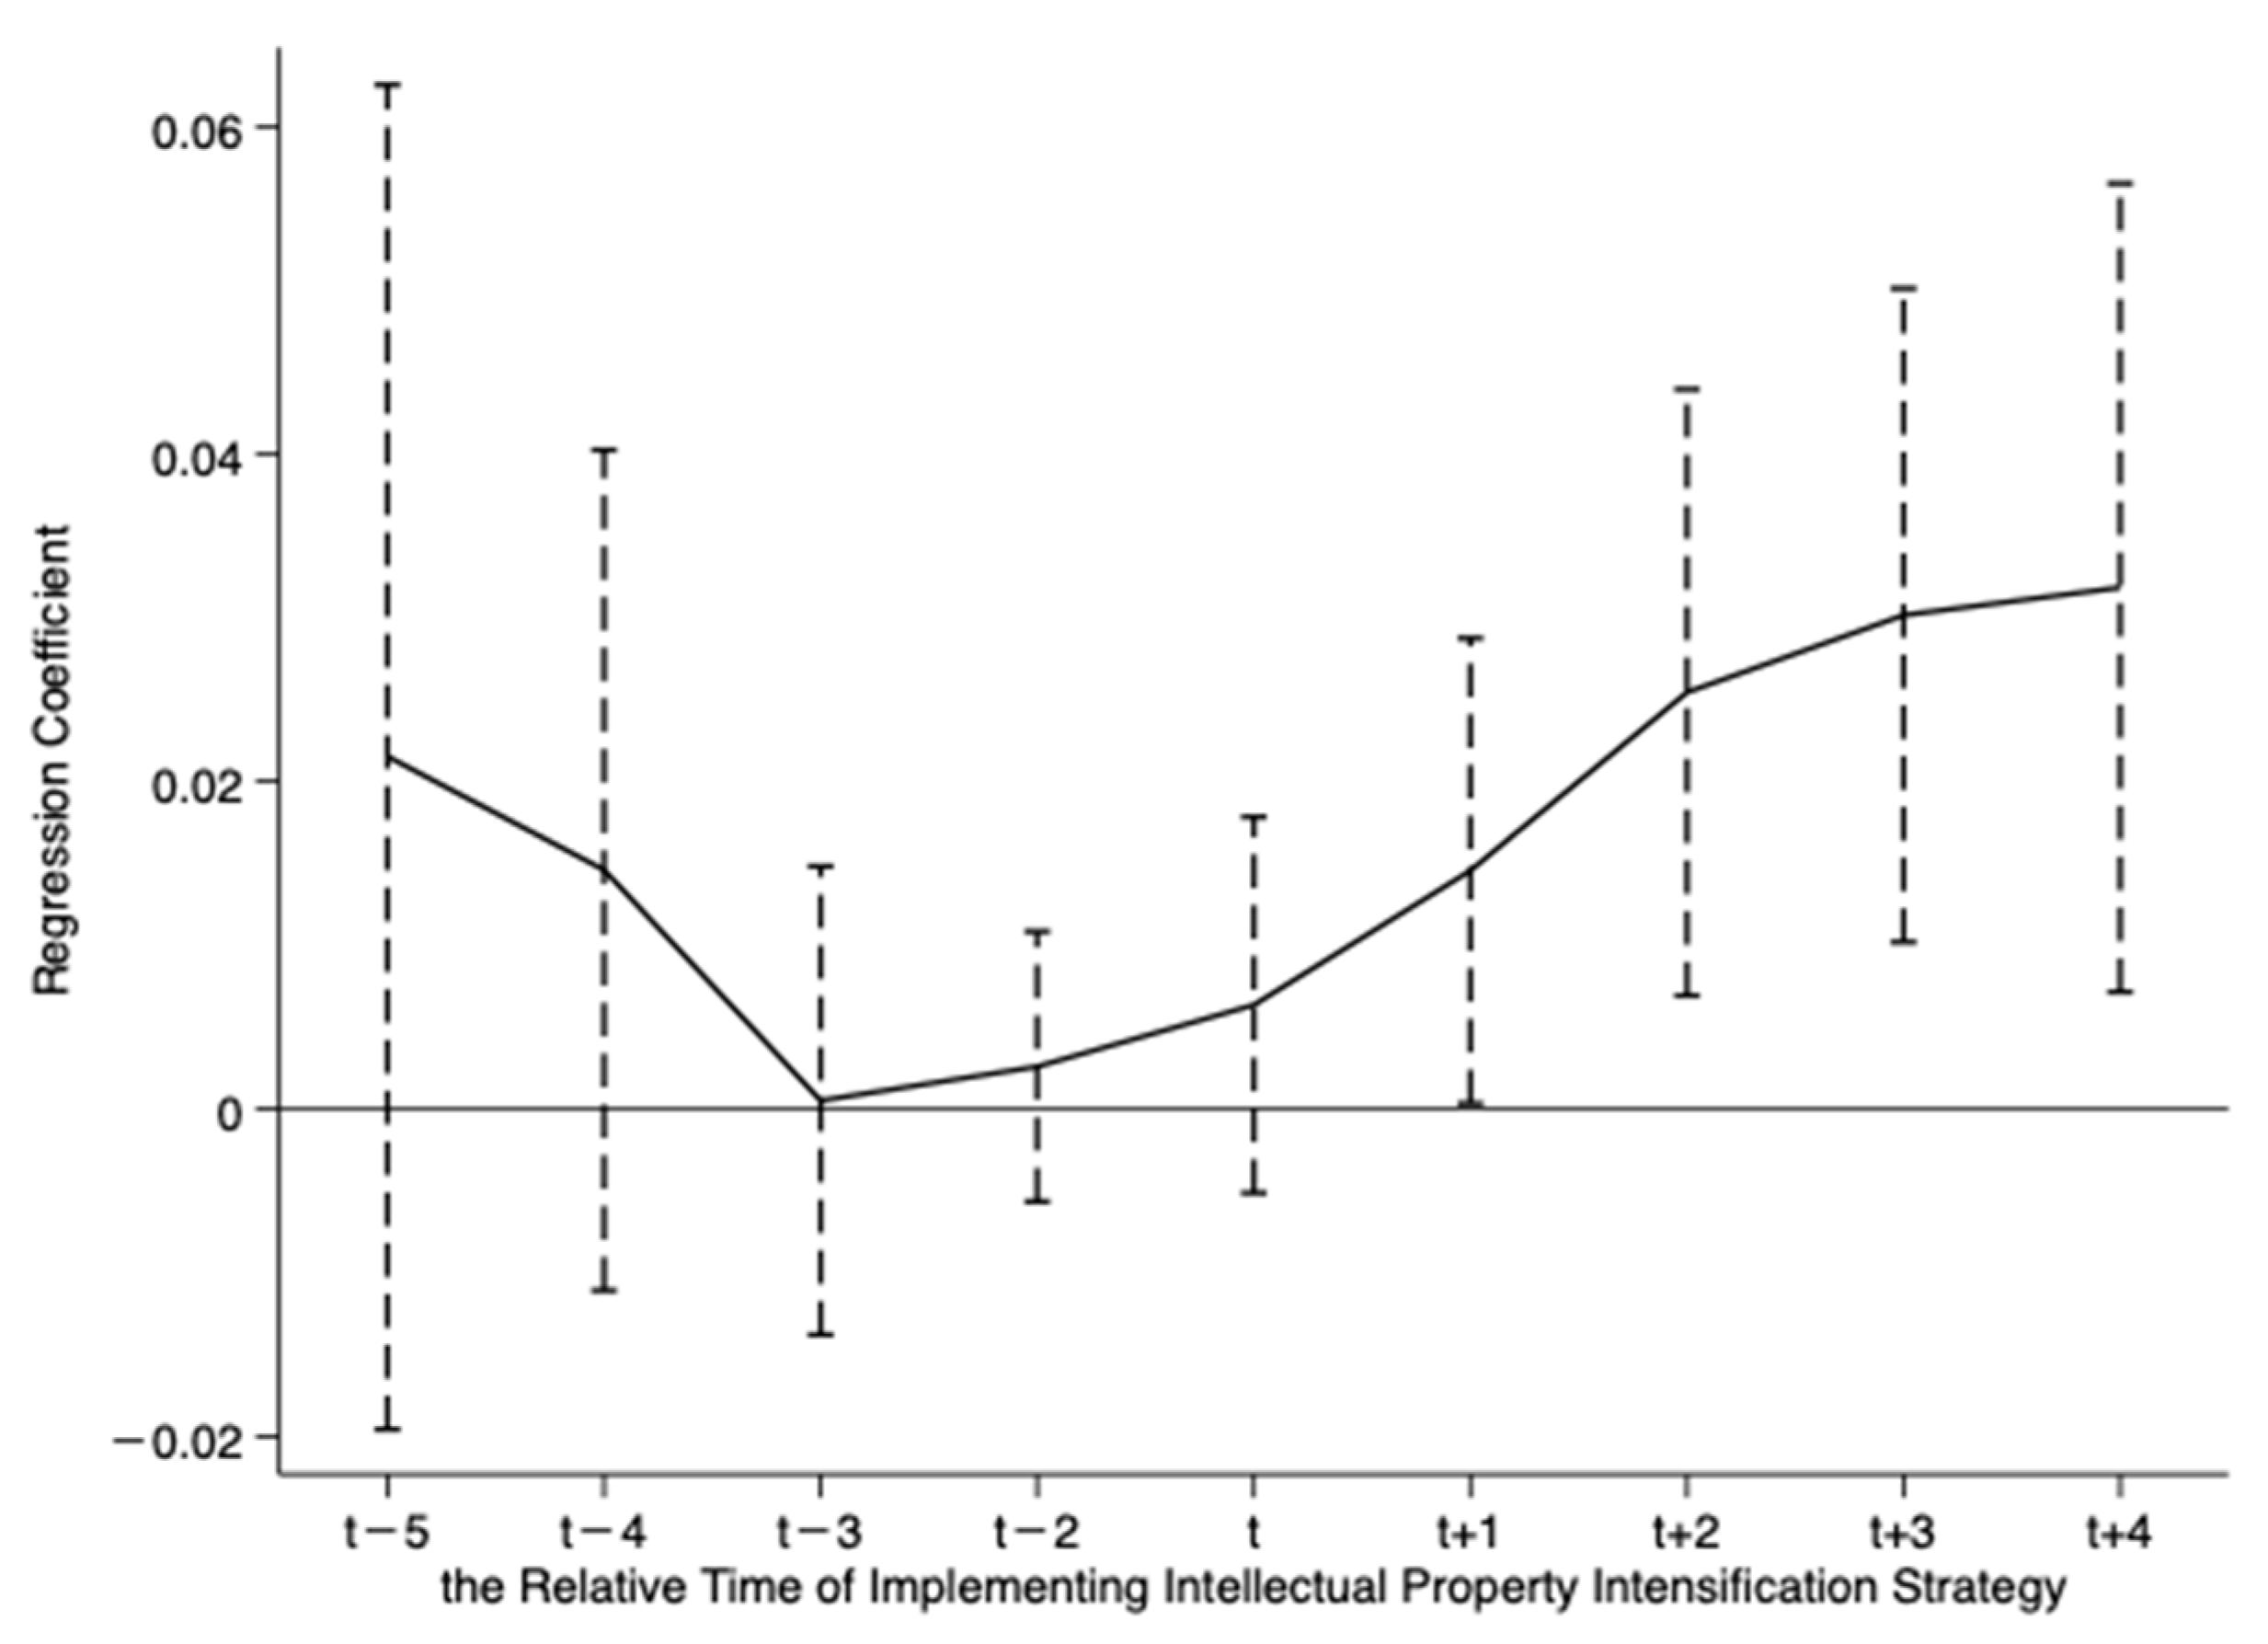
4.1.4. Parallel Trend Test

The double difference approach requires that the treatment and control groups should meet the parallel trend assumption to ensure the unbiasedness of the estimates. Drawing on Beck et al. [59], this paper constructs the following model to conduct the test for parallel trends:
EPA it = & α +   θ 1 policy i , t 5 +   θ 2 policy i , t 4 + +   θ 9 policy i , t + 4 + θ 10 policy i , t + 5 + γ x it 1 +   μ i +   ε it
Among these, policy i , t ± n   represents virtual variables for the years before and after policy implementation, with the initiation of the new policy for innovative transformation in regional industrial chains serving as the delineating point, and the year prior to the policy implementation as the baseline. This aims to investigate the trends in energy poverty alleviation across provinces over the five years preceding and four years following the introduction of the policy. If the regression coefficient approaches zero before the implementation of the policy (indicating nonsignificance of policy i , t n   coefficients), and the regression coefficient is significantly greater than zero after the implementation (demonstrating significant positive coefficients of policy i , t n ). In that case, it suggests that prior to policy intervention, both the treatment and control groups exhibited parallel trends in energy poverty alleviation within their respective regions. This indicates that other factors predominantly influence pre-policy disparities in energy poverty alleviation between the treatment and control groups. After the policy was implemented, the primary driver of disparities in energy poverty alleviation between the treatment and control groups is the policy intervention. Figure 4 illustrates the regression coefficients of policy i , t ± n alongside 90% confidence intervals, revealing nonsignificant coefficients pre-period t and a significantly positive coefficient for policy i , t + n , thus affirming the validity of the parallel trends test.

4.2. Empirical Analysis Based on Double Machine Learning Model

4.2.1. Benchmark Regression Analysis

This paper employs the double machine learning model based on the random forest algorithm to estimate parameters for both the primary and auxiliary regressions, with a sample split ratio of 1:4. The findings of Models 1 and 2 are presented in Table A4. In Model 1, the coefficient of DID is 0.0644, passing a 1% significance test, suggesting that the new policy for innovative transformation in regional industrial chains significantly promotes energy poverty alleviation, thus reaffirming hypothesis H1.
Model 2 reveals that a 1-unit increase in the conversion of new and old kinetic energy leads to a corresponding 0.0517-unit increase in energy poverty alleviation under unchanged conditions, indicating a significant driving force of the conversion of new and old kinetic energy on energy poverty alleviation at the 1% significance level and once again confirming hypothesis H3.

4.2.2. Mediating Effect Analysis Based on Stepwise Regression

Subsequently, employing the double machine learning method, this paper further validates the mechanism path DID → Conv → EPA through stepwise regression. The results of the mediating effect paths are then scrutinized using the Sobel, Aroian, and Goodman tests. Table A5 reveals that the mechanism paths DID → Conv → EPA, DID → Conv → Heat, DID →Conv → Elec, and DID → Conv → Trans are partial mediating effect paths with mediating shares of 31.57%, 35.91%, 15.06%, and 27.26%, respectively. Moreover, all paths successfully pass the Sobel, Aroian, and Goodman tests, indicating a significant positive mediating effect of the conversion of new and old kinetic energy between the new policy for innovative transformation in regional industrial chains and various aspects of energy poverty alleviation, including heating, household electricity service, and transportation. Hypotheses H5, H5(1), H5(3), and H5(4) are thus validated.
However, the pathway of DID → Conv → F&A is not significant, and there is no mediating effect. Hypothesis H5(2) remains unverified. Empirical analysis data reveal that the conversion of new and old kinetic energy fails to effectively address energy poverty alleviation in China’s food and accommodation sector. The impetus for transforming energy utilization in this sector is limited. Firstly, this limitation could be attributed to the inherent rigidity of residents’ behaviors regarding food and accommodation, which constitute fundamental aspects of daily life. Over time, residents have developed specific habits in food and accommodation, closely intertwined with particular energy utilization methods, thus less susceptible to the influence of policies regarding the conversion of new and old kinetic energy. Furthermore, factors such as traditional culture and regional customs may profoundly influence cooking and heating methods, rendering these habits resistant to change. Additionally, given their economic capacity, residents are willing to bear the cost of energy utilization. Secondly, energy consumption in the food and accommodation sector is relatively modest compared to industrial production and transportation. Moreover, the Chinese government has long encouraged the use of affordable natural gas for cooking through policies like the transition from oil to gas for both urban and rural residents. In rural areas, straw and firewood remain prevalent for heating and cooking. Consequently, profound changes in energy utilization methods based on the conversion of new and old kinetic energy are unnecessary in the food and accommodation sector.

4.2.3. Robustness Test

In order to ensure the robustness of the DID → Conv → EPA pathway, this study has implemented several robustness tests. Firstly, excluding data from the first year of policy implementation. This was deemed necessary because most policy pilot provinces typically fully engage in their respective policy implementations midway through the first year. Including data from the entire first year of policy implementation in the empirical analysis could potentially introduce unnecessary disturbances to the results. Therefore, the first year of policy implementation was excluded from the analysis to mitigate this potential confounding factor. Secondly, excluding similar policies. When assessing the impact of the new policy for innovative transformation in regional industrial chains on energy poverty alleviation, potential interference from similar concurrent policies during the same period was considered. To ensure the accuracy of the policy impact assessment, this study specifically identified and controlled for two similar policies implemented during the same period: comprehensive innovation and reform policies, and intellectual property strong province policies. Consequently, virtual variables for these two policies were included in the regression analysis to account for the influence of these concurrent policies. Thirdly, adjusting the sample split ratio from the original 1:4 to 1:7 and 1:3 ratios. Fourthly, adjusting the algorithm, shifting from the original random forest approach to gradient boosting and support vector machine algorithms. The regression results are presented in Table A6. The results of the robustness tests indicate a high level of consistency with the initial conclusions. The significant policy effect of the new policy for innovative transformation in regional industrial chains remains unchanged, with all mediating effects validated through Sobel, Aroian, and Goodman tests. This provides robust evidence for the mediating effects highlighted in this study.

4.2.4. Heterogeneity Analysis

(1)
Construction Period Heterogeneity
Building upon the successful implementation of the new policy for innovative transformation in regional industrial chains at the urban level, the provincial pilot policies for this transformation are now gradually being rolled out. Before some provinces were officially designated as innovative pilot provinces, the prefecture-level cities under their jurisdiction may have already embarked on initiatives to transform their regional industrial chains.
Take Jiangsu Province as an example. Though the provincial approval for the new policy came in 2013, its cities like Nanjing, Nantong, Lianyungang, Wuxi, and Suzhou had already been designated pilot cities for this transformation. Consequently, these provinces typically possess abundant innovation resources and a notable talent pool, and they are more economically developed. In order to examine the varying impacts on energy poverty alleviation after the implementation of pilot policies in provinces with different levels of industrial chain transformation, this study has categorized the provinces based on the number of cities approved as pilot cities, using an ascending order. Taking the median 2 as the benchmark for construction periods, the 30 provinces in mainland China (except Tibet) were classified into 2 groups: 1 category is mature areas. Before being designated as pilot provinces for the new policy for innovative transformation in regional industrial chains, these provinces already had several cities recognized as pilot cities for the same policy. The criteria for such recognition rely on having more than two approved cities (for directly administered municipalities, including one district as a pilot city qualifies them). Another category is emerging areas, where the number of approved pilot cities for this policy is two or fewer.
Grouped regression analysis was employed to evaluate the policy effects on provinces grouped by different construction cycles. Refer to Table A7 for specific regression outcomes. The findings indicate that the total pathway DID → Conv → EPA is significant in mature areas, with an observed intermediate effect verified through Sobel, Aroian, and Goodman tests. Conversely, results in emerging areas are insignificant, failing to establish a total pathway and lacking an intermediate effect. This may be attributed to the shorter construction cycles in emerging regions, such as Jilin Province, which was only designated as a pilot in 2021. Furthermore, emerging areas lack sufficient institutional experience, hindering the full realization of policy effects. Consequently, the new policy for innovative transformation in regional industrial chains proves ineffective in alleviating energy poverty and fails to facilitate the conversion of new and old kinetic energy.
(2)
Geographical Division Heterogeneity
Based on geographical divisions, this study categorizes the 30 provinces in mainland China (except Tibet) into eastern, central, and western areas, and employs grouped regression to assess the policy effects of provinces in different regional groups. As shown in Table A8, the total path DID → Conv → EPA results are significant and pass the test in the eastern and central areas, with intermediate effect proportions at 50.63% and 24.75%. Conversely, the western area shows non-significant results, with no established total path and intermediate effects. While the new policy for innovative transformation in regional industrial chains directly impacts energy poverty alleviation in the region, it fails to indirectly promote it through the conversion of new and old kinetic energy. This is likely due to the western area’s economic and technological lag, substantial gaps in infrastructure and talent compared to the eastern and central areas, and a predominant heavy industry industrial structure that hinders effective policy implementation. Additionally, the western region faces dual pressures of adjusting its industrial structure and upgrading the conversion of new and old kinetic energy. On the one hand, traditional high-energy-consuming and high-polluting industries require rapid elimination and transformation. On the other hand, developing emerging and modern service industries needs significant support, presenting challenges to the region’s total path intermediate effect implementation.

4.2.5. Causal Mediating Effect Analysis Based on Counterfactual Framework

Utilizing Model 7, this study delves into the causal mediating effects within the counterfactual framework. It further explores the mechanisms behind “the new policy for innovative transformation in regional industrial chains → the conversion of new and old kinetic energy → energy poverty alleviation” and investigates the potential generalizability of this pathway to pilot regions (see Table A9 for results). The findings in Table A9 indicate that the paths of DID → Conv → EPA, DID → Sup → EPA, and DID → Str → EPA exhibit significant direct and indirect effects for both the treatment and control groups, suggesting their efficacy not only within the treatment group but also when extended to the control group. Hypotheses H6, H6(1), and H6(3) are supported.
However, while the direct effect of the DID → Dem → EPA pathway on the treatment group shows significance, neither the indirect effects of the treatment group nor the direct and indirect effects of the control group demonstrate significance. Hypothesis H6(2) remains unconfirmed. One possible explanation is that the full potential of domestic demand momentum in China has yet to be realized. Persistent weaknesses in domestic demand, coupled with a historical overreliance on exports, continue to impede the nation’s economic progress. Despite China’s ascent to becoming the world’s leading exporter through years of rapid development, the concomitant deficiencies in domestic market demand and subdued consumer growth have emerged as formidable barriers to further economic advancement. Contributing factors to inadequate domestic demand in China include widespread low incomes among its populace and pronounced wealth disparities, among other societal challenges. Income forms the bedrock of consumption, and when a significant portion of the population sustains comparatively low-income levels, their capacity for consumption is inherently restricted. Furthermore, pronounced wealth disparities exacerbate imbalances in the social consumption landscape. Although affluent demographics possess relatively robust spending power, their consumption needs are often adequately met, thus constraining their inclination to drive further consumption growth. On the contrary, lower-income segments, constrained by their income levels, struggle to turn pressing consumption needs into meaningful purchasing power. Such disparities in consumption patterns lead to a weakening of overall consumption demand.

5. Conclusions and Policy Suggestions

5.1. Conclusions

Utilizing panel data for 30 provinces in mainland China (excluding Tibet) between 2009 and 2021, this study employed a multivariate empirical analysis approach that combined double machine learning and spatial difference-in-difference models to delve deeply into the inherent connections and operational mechanisms among the new policy for innovative transformation in regional industrial chains, the conversion of new and old kinetic energy, and the alleviation of energy poverty. This study revealed the following findings: (1) Both the new policy for innovative transformation in regional industrial chains and the conversion of new and old kinetic energy significantly facilitate the alleviation of energy poverty. (2) Mechanism tests demonstrate that the new policy for innovative transformation in regional industrial chains effectively propels the process of energy poverty alleviation through the crucial pathway of conversion of new and old kinetic energy. (3) The new policy for innovative transformation in regional industrial chains fosters energy poverty alleviation in heating, household electricity services, and transportation sectors via the conversion of new and old kinetic energy. However, there is no mediating effect in the pathway of “the new policy for innovative transformation in regional industrial chains → the conversion of new and old kinetic energy → the energy poverty alleviation in the food and accommodation segment”. (4) The effects exhibit construction period heterogeneity, with mature areas showing significant results for the overall pathway of “the new policy for innovative transformation in regional industrial chains → the conversion of new and old kinetic energy → the alleviation of energy poverty”, and there is a mediating effect, while the emerging areas yield nonsignificant results, suggesting no mediating effect. Furthermore, the effects exhibit geographic division heterogeneity, with significant outcomes and passing tests observed in eastern and central areas for the overall pathway, while the results in western areas are not significant, indicating the total path is not established, and there is no mediating effect. (5) Findings from the counterfactual framework reveal that in the pathways “the new policy for innovative transformation in regional industrial chains → the conversion of new and old kinetic energy → the alleviation of energy poverty”, “the new policy for innovative transformation in regional industrial chains → the conversion of new and old kinetic energy on the supply side → the alleviation of energy poverty”, and “the new policy for innovative transformation in regional industrial chains → the conversion of new and old kinetic energy on the structural side → the alleviation of energy poverty”, both direct and indirect effects of the treatment and control groups are significant and pass the tests. However, in the pathway of “the new policy for innovative transformation in regional industrial chains → the conversion of new and old kinetic energy on the demand side → the alleviation of energy poverty”, only the direct effect of the treatment group is significant, while the indirect effect of the treatment group and both the direct and indirect effects of the control group are nonsignificant.

5.2. Policy Suggestions

According to the conclusions drawn from the previous studies, this study puts forth the following targeted policy recommendations:
(1)
It is recommended to promote the expansion of domestic demand in China and fully unleash potential consumption behaviors. Primarily, a multifaceted approach should be adopted to increase residents’ disposable incomes, bolstering their tangible consumption capacities while stabilizing and broadening the middle-income demographic. To realize this goal, there is a pressing need to vigorously cultivate strategic emerging industries and those on the cusp of future development, infusing the job market with heightened dynamism and significantly elevating residents’ earning potential and proclivity to consume. Simultaneously, a measured expansion of consumer credit facilities can empower residents with greater capacity for intertemporal consumption, propelling the economy towards a trajectory of high-quality growth. In addition, continuous efforts must be directed toward enhancing the domestic consumption market’s ambiance and diversifying the purview of consumption activities. This serves to amplify consumers’ sense of attainment, contentment, and security and catalyzes the bolstering of their consumption drive. By continually refining consumption policies and bolstering measures aimed at safeguarding consumer rights, especially within the realm of e-commerce after-sales services, the legitimate interests of consumers can be effectively upheld. Through the implementation of these impactful initiatives, the creation of a congenial, secure, and trust-inspiring consumption environment is envisaged, fostering heightened consumer willingness and, in turn, perpetuating the exploration of a broader domestic consumption market. Lastly, concerted endeavors are essential in crafting novel consumption scenarios to enrich the consumption experiences of Chinese citizens. Going forward, China stands to leverage cutting-edge digital technologies such as artificial intelligence, big data, and cloud computing to propel technological innovation forward. These technologies are poised to serve as linchpins in overhauling industrial structures and enhancing product supply quality. By pioneering innovative consumption scenarios and consistently refining the consumption experience, China can substantially elevate consumption standards, thereby catalyzing the dual upgrading of industrial structures and residents’ consumption patterns.
(2)
There is a need to enhance policy support for provinces with relatively underdeveloped innovation environments and expedite the implementation of policies. To address the construction period heterogeneity, on the one hand, the new policy for innovative transformation in regional industrial chains should be extended to provinces with fewer pilot cities to address issues such as the weak innovation development foundation in emerging regions due to the lack of pilot cities. This will help unlock the full innovation potential of these areas, alleviate regional development imbalances, and have a positive impact on national industrial upgrading. On the other hand, for provinces newly included in the pilot program, expediting the policy implementation process is crucial to swiftly boost their innovation levels and accelerate the establishment of core hubs for technology innovation and emerging industry clusters driven by innovation.
(3)
Policy formulation should consider regional disparities, guiding tailored policy-driven development models with local characteristics in each area. Recognizing the geographical division heterogeneity in policy impact, policies need to account for variations in innovation levels among provinces to foster coordinated and equitable development across regions. Simultaneously, provinces should adopt the new policy for innovative transformation in regional industrial chains as a strategic guide, leveraging unique local resources, industrial structures, development levels, and locational advantages to establish regionally distinctive innovation platforms. Moreover, prioritizing the innovation-driven growth of the western regions is crucial from the perspective of advancing national innovation. This entails bolstering policy support to facilitate industrial structural upgrades in western provinces. Additionally, there should be a concerted effort to establish a radiating mechanism, gradually extending from China’s eastern and central regions to the west, in order to facilitate the balanced development of industrial chain innovation transformation nationwide.

6. Discussion

6.1. Marginal Contribution

This paper contributes to the existing body of knowledge by the following three aspects:
Firstly, the Chinese government has been committed to gaining greater credibility through poverty alleviation, and China’s energy poverty alleviation not only involves overcoming the material deprivation of the majority of the population, but also facing the dilemmas of China’s poor fossil energy resource endowment and low per capita energy reserves. Therefore, the Chinese government has accumulated more institutional experiences in the energy poverty alleviation practices. Previous studies have focused more on the statistical measurement of energy poverty in China, the role of energy policies and the “Pegu tax” on energy poverty, and few studies have explored the impact of the new policy for innovative transformation in regional industrial chains on energy poverty alleviation based on regional innovation changes and industrial policies. The marginal contribution of this study is to systematically sort out the impact mechanism of the new policy for innovative transformation in regional industrial chains on regional energy poverty that is being promoted in China, extract the inherent institutional experience, and provide empirical analyses, so as to provide a new reference for the practice of energy poverty alleviation and related decision-making in emerging market countries and developing economies, represented by China.
Secondly, most of the current studies have explored the mechanism of regional innovation change on the level of energy utilization, but how the regional industrial innovation policy is transmitted to the energy poverty link is a theoretical “black box”. This study provides a new research framework for the relevant studies, that is, the new policy for innovative transformation in regional industrial chains, the conversion of new and old kinetic energy and regional energy poverty alleviation into the same theoretical system to explore. This paper provides a new research framework for related research, which is to include the new regional industrial chain innovation change policy, new and old kinetic energy transformation and regional energy poverty alleviation into the same theoretical system, which can reveal that the implementation of regional industrial innovation policy in developing countries can be transmitted to energy poverty alleviation based on the mechanism of the conversion of new and old kinetic energy.
Thirdly, the current causal inference research based on the traditional econometric model of difference-in-difference series cannot meet the unbiased estimation of small samples and complex systems, and the statistical inference based on historical data is also difficult to reveal a real “counterfactual framework”. In this study, we use a combination of spatial difference-in-difference model and double machine learning model to analyze the spatial spillover effects in the research system of “the new policy for innovative transformation in regional industrial chains—the conversion of new and old kinetic energy—energy poverty alleviation”, so that the role of policies in the transmission of regional energy systems has been visualized in a more three-dimensional way. Secondly, based on the powerful “generalization” ability of machine learning, it makes “unbiased inference” on the causal relationship between variables, and demonstrates the effectiveness and generalization of the transmission mechanism of “the new policy for innovative transformation in regional industrial chains → the conversion of new and old kinetic energy → energy poverty alleviation” under the framework of counterfactual. These two models corroborate each other, not only reflecting the reliability of the research findings, but also providing a potential research paradigm for related studies.

6.2. Research Deficiencies and Future Prospects

Firstly, the transmission mechanism of the new policy for innovative transformation in regional industrial chains on energy poverty alleviation can be not only through the conversion of new and old kinetic energy, but also through specific links such as changes in the policy environment and the speeding up of the life cycle of technology iteration. Therefore, the internal mechanism of this transmission mechanism still needs to be further revealed.
Secondly, in exploring the topic of energy poverty alleviation, the core concern ultimately comes down to whether residents have truly escaped from the plight of energy deprivation, and whether there is an enhanced sense of well-being and access. However, this paper is confined to the availability of data and the advanceability of the study, and mainly adopts regional macro data as the basis of the study in the research design and empirical analysis. In the future, in order to gain a deeper understanding of the issue, micro-level tracking surveys could be conducted on residents in regions where energy conflicts are particularly prominent, thereby further exploring the impact of regional industrial policies on residents’ energy use.
Thirdly, China is an emerging economy with a well-developed market economy and technological level, especially in the field of photovoltaic and new energy in recent years, with significant technological progress. Energy poverty is widespread in emerging markets and less-developed economies, so a study of China alone is insufficient to reveal the universality of the mechanism. In the future, based on the information disclosed by the International Energy Agency or other data sources, we can use samples and data from less developed economies such as Africa, Latin America, and Southeast Asia to make further comparisons and observations of the energy poverty alleviation effects of regional industrial innovation policies.

Author Contributions

Conceptualization, D.C. and Q.H.; methodology, D.C.; software, D.C.; validation, D.C. and Q.H.; formal analysis, D.C.; data curation, D.C.; writing—original draft preparation, D.C.; writing—review and editing, D.C. and Q.H.; visualization, D.C.; supervision, Q.H.; project administration, Q.H. All authors have read and agreed to the published version of the manuscript.

Funding

This research was funded by Tianjin Philosophy and Social Science Project of which the topic is The Impact of Family Control on the Sustainable Development of Business Performance, under grant number TJGLQN18-017.

Institutional Review Board Statement

Not applicable.

Informed Consent Statement

Not applicable.

Data Availability Statement

The data that support the findings of this study are available from the corresponding author, Qianxuan Huang, upon reasonable request.

Conflicts of Interest

The authors declare no conflicts of interest.

Appendix A

Table A1. Global Moran’s Index (2009–2021).
YearMoran’s IE (I)Sd (I)zSignificance Level (p)
20090.383 ***−0.0340.0894.6740.000
20100.378 ***−0.0340.0904.5870.000
20110.376 ***−0.0340.0924.4570.000
20120.388 ***−0.0340.0924.5890.000
20130.386 ***−0.0340.0924.5780.000
20140.378 ***−0.0340.0924.4710.000
20150.364 ***−0.0340.0924.3130.000
20160.351 ***−0.0340.0924.1840.000
20170.139 *−0.0340.0921.8840.060
20180.293 ***−0.0340.0933.5260.000
20190.294 ***−0.0340.0933.5250.000
20200.284 ***−0.0340.0933.4140.001
20210.276 ***−0.0340.0933.3310.001
*** represents 1% significance, * represents 10% significance.
Table A2. LM test results.
TestStatisticsp-Value
Spatial lag:
Lagrange multiplier84.739 ***0.000
Robust Lagrange multiplier48.734 ***0.001
Spatial error:
Lagrange multiplier40.621 ***0.000
Robust Lagrange multiplier4.616 **0.036
SDM or SAR:
Wald Test44.14 ***0.0000
LR Test41.76 ***0.0000
SDM or SEM:
Wald Test42.01 ***0.0000
LR Test39.98 ***0.0000
*** represents 1% significance, ** represents 5% significance.
Table A3. Parameter estimation results of spatial difference-in-difference model.
EPAEPA
Spatial Direct EffectSpatial Spillover EffectTotal EffectSpatial Direct EffectSpatial Spillover EffectTotal Effect
DID0.0113 *0.005390.0166−0.0661 ***−0.0349−0.101 ***
(1.83)(0.41)(1.16)(−4.62)(−1.12)(−3.51)
Conv0.0115 **0.0284 **0.0399 ***0.006690.0222 **0.0289 ***
(2.10)(2.53)(3.02)(1.27)(2.39)(2.73)
DID × Conv 0.0415 ***0.0245 *0.0660 ***
(6.40)(1.85)(4.93)
RIS0.000417 **0.00188 **0.00230 ***0.000453 **0.00166 **0.00211 ***
(2.09)(2.39)(2.81)(2.30)(2.39)(3.10)
RGR−0.00248−0.0221 ***−0.0246 ***−0.000435−0.0192 ***−0.0196 ***
(−1.48)(−5.28)(−5.70)(−0.28)(−4.91)(−5.01)
GGR−0.156 ***−0.0995−0.255 **−0.107 **−0.0419−0.149
(−3.14)(−0.88)(−2.25)(−2.17)(−0.41)(−1.55)
Open0.00000342−0.0000135−0.00001010.00000484 *−0.000001860.00000298
(1.36)(−1.19)(−0.88)(1.88)(−0.18)(0.29)
HE−0.00349 *0.005520.00202−0.002680.006610.00393
(−1.83)(1.04)(0.38)(−1.61)(1.26)(0.78)
GI0.7001.6472.347 *0.7571.4452.202 *
(1.37)(1.37)(1.82)(1.56)(1.35)(1.92)
Fixed areayesyesyesyesyesyes
Fixed timeyesyesyesyesyesyes
ρ−0.302 ***−0.192 **
(−3.49)(−2.22)
Variance
sigma2_e0.000599 ***0.000682 ***
(13.81)(13.89)
N390390
R20.3410.364
*** represents 1% significance, ** represents 5% significance, * represents 10% significance, and the t statistic is in parentheses.
Table A4. Benchmark regression results.
Model 4Model 5
EPAEPA
DID0.0644 ***
(5.83)
Conv 0.0517 ***
(9.36)
_cons−0.000290−0.000224
(−0.13)(−0.11)
Control variableyesyes
Fixed individualyesyes
Fixed timeyesyes
N390390
R2--
*** represents 1% significance.
Table A5. Stepwise regression results.
Mediating PathDependent VariablePolicyMediating VariableControl VariableFixed AreaFixed TimeMediating ProportionSobel
(Z Statistic)
Aroian
(Z Statistic)
Goodman
(Z Statistic)
DID → Conv → EPAEPA0.0644 *** YesYesYes31.6%3.490 ***3.469 ***3.511 ***
(5.83)
Conv0.445 *** YesYesYes
(3.85)
EPA0.0498 ***0.0457 ***YesYesYes
(5.57)(8.24)
DID → Conv → HeatHeat0.115 *** YesYesYes35.9%3.458 ***3.436 ***3.481 ***
(4.69)
Conv0.445 *** YesYesYes
(3.85)
Heat0.0857 ***0.0930 ***YesYesYes
(4.14)(7.85)
DID → Conv →F&AF&A0.0171 *** YesYesYesNo mediating effect
(5.12)
Conv0.445 *** YesYesYes
(3.85)
F&A0.0130 **0.00208YesYesYes
(2.54)(0.58)
DID → Conv → ElecElec0.0426 *** YesYesYes15.1%1.919 *1.862 *1.982 **
(3.45)
Conv0.315 *** YesYesYes
(3.21)
Elec0.0322 **0.0204 **YesYesYes
(2.27)(2.39)
DID → Conv → TransTrans0.0240 ** YesYesYes27.3%1.842 *1.796 *1.892 *
(2.28)
Conv0.445 *** YesYesYes
(3.85)
Trans0.0193 *0.0147 **YesYesYes
(1.87)(2.10)
*** represents 1% significance, ** represents 5% significance, * represents 10% significance, and the t statistic is in parentheses.
Table A6. Robustness test results.
Robustness TestDependent VariablePolicyMediating VariableCovariateFixed AreaFixed TimeMediating ProportionSobel
(Z Statistic)
Aroian
(Z Statistic)
Goodman
(Z Statistic)
Excluding the first yearEPA0.0782 *** YesYesYes33.3%4.547 ***4.521 ***4.574 ***
(7.10)
Conv0.622 *** YesYesYes
(5.87)
EPA0.0522 ***0.0419 ***YesYesYes
(5.08)(7.18)
Excluding parallel policy interferenceEPA0.0487 *** YesYesYes26.0%2.488 **2.469 **2.508 **
(4.19)
Conv0.298 *** YesYesYes
(2.64)
EPA0.0353 ***0.0425 ***YesYesYes
(3.54)(7.54)
Sample split changed to 1:7EPA0.0647 *** YesYesYes20.1%2.829 ***2.811 ***2.847 ***
(5.85)
Conv0.290 *** YesYesYes
(3.01)
EPA0.0515 ***0.0449 ***YesYesYes
(6.08)(8.33)
Sample split changed to 1:3EPA0.0688 *** YesYesYes26.7%3.269 ***3.250 ***3.289 ***
(5.72)
Conv0.350 *** YesYesYes
(3.55)
EPA0.0507 ***0.0504 ***YesYesYes
(5.61)(8.36)
Algorithm changed to gradient boosting (gradboost)EPA0.0482 *** YesYesYes18.3%2.232 **2.212 **2.254 **
(4.18)
Conv0.242 ** YesYesYes
(2.36)
EPA0.0392 ***0.0364 ***YesYesYes
(3.92)(6.85)
Algorithm changed to support vector machine (svm)EPA0.0835 *** YesYesYes30.9%4.888 ***4.865 ***4.912 ***
(7.69)
Conv0.713 *** YesYesYes
(8.13)
EPA0.0578 ***0.0360 ***YesYesYes
(5.40)(6.12)
*** represents 1% significance, ** represents 5% significance, and the t statistic is in parentheses.
Table A7. Results of construction period heterogeneity analysis.
Sample DifferentiationDependent VariablePolicyMediating VariableCovariateFixed AreaFixed TimeMediating ProportionSobel
(Z Statistic)
Aroian
(Z Statistic)
Goodman
(Z Statistic)
Emerging regionsEPA0.0379 YesYesYesNo mediating effect
(0.70)
Conv−0.313 YesYesYes
(−0.63)
EPA0.05310.0426 ***YesYesYes
(1.46)(5.95)
Mature regionsHeat0.115 *** YesYesYes29.1%3.026 ***2.990 **3.063 ***
(4.69)
Conv0.445 *** YesYesYes
(3.85)
Heat0.0857 ***0.0930 ***YesYesYes
(4.14)(7.85)
*** represents 1% significance, ** represents 5% significance, and the t statistic is in parentheses.
Table A8. Results of geographical division heterogeneity analysis.
Sample DifferentiationDependent VariablePolicyMediating VariableCovariateFixed AreaFixed TimeMediating ProportionSobel
(Z Statistic)
Aroian
(Z Statistic)
Goodman
(Z Statistic)
Eastern regionsEPA0.0654 *** YesYesYes50.6%3.348 ***3.313 ***3.383 ***
(5.72)
Conv0.597 *** YesYesYes
(5.49)
EPA0.0311 ***0.0555 ***YesYesYes
(2.62)(4.22)
Central regionsEPA0.0739 *** YesYesYes27.4%1.760 *1.696 *1.832 *
(3.77)
Conv0.372 ** YesYesYes
(2.26)
EPA0.0541 ***0.0491 ***YesYesYes
(2.66)(2.81)
Western regionsEPA0.0386 ** YesYesYesNo mediating effect
(2.27)
Conv0.225 YesYesYes
(1.06)
EPA0.0362 **0.0197YesYesYes
(2.46)(1.44)
*** represents 1% significance, ** represents 5% significance, * represents 10% significance, and the t statistic is in parentheses.
Table A9. Results of causal mediating effect analysis.
Mediating PathDir. TreatDir. ControlIndir. TreatIndir. Control
DID → Conv → EPA0.045 ***0.041 ***0.019 ***0.014 **
p-value = 0.001p-value = 0.005p-value = 0.002p-value = 0.088
DID → Dem → EPA0.092 ***−3.0253.1170.001
p-value = 0.000p-value = 0.319p-value = 0.305p-value = 0.573
DID → Sup → EPA0.030 ***0.032 ***0.047 ***0.049 ***
p-value = 0.004p-value = 0.005p-value = 0.000p-value = 0.000
DID → Str → EPA0.084 ***0.078 ***0.013 **0.006 ***
p-value = 0.000p-value = 0.000p-value = 0.028p-value = 0.000
*** represents 1% significance, ** represents 5% significance.

References

  1. Okada, M. The earth and global environmental issues. J. Jpn. Soc. Tribol. 2000, 45, 783–788. [Google Scholar]
  2. Jiang, Y.; Ni, H.; Ni, Y.; Guo, X. Assessing environmental, social, and governance performance and natural resource management policies in China’s dual carbon era for a green economy. Resour. Policy 2023, 85, 104050. [Google Scholar] [CrossRef]
  3. Jiang, X.; Tan, T.; Yuan, B.; Wang, C.; Zhang, Y. How does the green development program promote rural economy: Energy and environmental effects in rural development of China. Econ. Chang. Restruct. 2024, 57, 42. [Google Scholar] [CrossRef]
  4. Yang, G.; Zhang, G.; Cao, D.; Zha, D.; Gao, X.; Su, B. China’s provincial-level sustainable energy transition requires accelerating renewable energy technological innovation. Energy 2024, 288, 129672. [Google Scholar] [CrossRef]
  5. Amin, A.; Wang, Z.; Shah, A.H.; Chandio, A.A. Exploring the dynamic nexus between renewable energy, poverty alleviation, and environmental pollution: Fresh evidence from E-9 countries. Environ. Sci. Pollut. Res. 2023, 30, 25773–25791. [Google Scholar] [CrossRef] [PubMed]
  6. Zhang, S.; Li, J.; Jiang, B.; Guo, T. Government intervention, structural transformation, and carbon emissions: Evidence from China. Int. J. Environ. Res. Public Health 2023, 20, 1343. [Google Scholar] [CrossRef] [PubMed]
  7. Han, Y.; Huang, L.; Wang, X. Does Industrial Policy Promote the upgrading of Local Industrial Structure?—Theoretical Explanation and Empirical Test Based on Development-Oriented Local Government. J. Econ. Res. 2017, 8, 33–48. [Google Scholar]
  8. Zeng, J.; Wang, Q. Evaluation of the effect of provincial innovation policy on driving innovation ability: A case study of China’s provincial panel Data during the 11th Five-Year Plan Period. Soft Sci. 2017, 8, 25–30. [Google Scholar]
  9. Biernat-Jarka, A.; Trębska, P.; Jarka, S. The role of renewable energy sources in alleviating energy poverty in households in Poland. Energies 2021, 14, 2957. [Google Scholar] [CrossRef]
  10. Chan, H.K.; He, H.; Wang, W.Y. Green marketing and its impact on supply chain management in industrial markets. Ind. Mark. Manag. 2012, 41, 557–562. [Google Scholar] [CrossRef]
  11. Tseng, C.C.; Zeng, J.Y.; Hsieh, M.L.; Hsu, C.H. Analysis of Innovation Drivers of the Conversion of New and Old Kinetic Energy Using a Hybrid Multiple-Criteria Decision-Making Model in the Post-COVID-19 Era: A Chinese Case. Mathematics 2022, 10, 3755. [Google Scholar] [CrossRef]
  12. Bian, X.; Chen, P.; Gao, Z.; Fang, G. How to promote the energy transition?—An analysis based on the size and technology effect in new energy industry. Front. Energy Res. 2023, 10, 1082368. [Google Scholar] [CrossRef]
  13. Sy, S.A.; Mokaddem, L. Energy poverty in developing countries: A review of the concept and its measurements. Energy Res. Soc. Sci. 2022, 89, 102562. [Google Scholar] [CrossRef]
  14. Lv, Y.; Chen, W.; Cheng, J. Modelling dynamic impacts of urbanization on disaggregated energy consumption in China: A spatial Durbin modelling and decomposition approach. Energy Policy 2019, 133, 110841. [Google Scholar] [CrossRef]
  15. Deka, A.; Bako, S.Y.; Ozdeser, H.; Seraj, M. The impact of energy efficiency in reducing environmental degradation: Does renewable energy and forest resources matter? Environ. Sci. Pollut. Res. 2023, 30, 86957–86972. [Google Scholar] [CrossRef] [PubMed]
  16. Thaler, P.; Hofmann, B. The impossible energy trinity: Energy security, sustainability, and sovereignty in cross-border electricity systems. Political Geogr. 2022, 94, 102579. [Google Scholar] [CrossRef]
  17. Zhou, Q.; Li, J.; Lv, Q.; Wang, D.; Yang, S. Research on China’s New Energy Cross-Provincial Marketization Mechanism Under the Background of “Double Carbon”. Front. Energy Res. 2022, 10, 846870. [Google Scholar] [CrossRef]
  18. Mitrašinović, A.M. Photovoltaics advancements for transition from renewable to clean energy. Energy 2021, 237, 121510. [Google Scholar] [CrossRef]
  19. Aklin, M.; Urpelainen, J. Political competition, path dependence, and the strategy of sustainable energy transitions. Am. J. Political Sci. 2013, 57, 643–658. [Google Scholar] [CrossRef]
  20. Kumar, A.; Shankar, A.; Behl, A.; Gupta, B.B.; Mavuri, S. Lights, camera, metaverse!: Eliciting intention to use industrial metaverse, organizational agility, and firm performance. J. Glob. Inf. Manag. JGIM 2023, 31, 1–20. [Google Scholar] [CrossRef]
  21. Yang, J.; Wu, Y. An emprical study on the role of new energy transformation and upgrading in promoting china’s economy. Environ. Eng. Manag. J. EEMJ 2023, 22, 157. [Google Scholar] [CrossRef]
  22. Harris, C.M.; Wright, P.M.; McMahan, G.C. The emergence of human capital: Roles of social capital and coordination that drive unit performance. Hum. Resour. Manag. J. 2019, 29, 162–180. [Google Scholar] [CrossRef]
  23. Yao, Y.; Ivanovski, K.; Inekwe, J.; Smyth, R. Human capital and energy consumption: Evidence from OECD countries. Energy Economics 2019, 84, 104534. [Google Scholar] [CrossRef]
  24. Ferreira, J.J.; Fayolle, A.; Fernandes, C.; Raposo, M. Effects of Schumpeterian and Kirznerian entrepreneurship on economic growth: Panel data evidence. Entrep. Reg. Dev. 2017, 29, 27–50. [Google Scholar] [CrossRef]
  25. Acheampong, A.O.; Nghiem, X.H.; Dzator, J.; Rajaguru, G. Promoting energy inclusiveness: Is rural energy poverty a political failure? Util. Policy 2023, 84, 101639. [Google Scholar] [CrossRef]
  26. Desalegn, G.; Tangl, A. Enhancing green finance for inclusive green growth: A systematic approach. Sustainability 2022, 14, 7416. [Google Scholar] [CrossRef]
  27. Zakari, A.; Oryani, B.; Alvarado, R.; Mumini, K. Assessing the impact of green energy and finance on environmental performance in China and Japan. Econ. Change Restruct. 2023, 56, 1185–1199. [Google Scholar] [CrossRef]
  28. Szalavetz, A. Digitalisation, automation and upgrading in global value chains–factory economy actors versus lead companies. Post-Communist Econ. 2019, 31, 646–670. [Google Scholar] [CrossRef]
  29. Ukko, J.; Saunila, M. Understanding the practice of performance measurement in industrial collaboration: From design to implementation. J. Purch. Supply Manag. 2020, 26, 100529. [Google Scholar] [CrossRef]
  30. Sugar, K.; Webb, J. Value for money: Local authority action on clean energy for net zero. Energies 2022, 15, 4359. [Google Scholar] [CrossRef]
  31. Streimikiene, D.; Kyriakopoulos, G.L.; Lekavicius, V.; Pazeraite, A. How to support sustainable energy consumption in households? Acta Montan. Slovaca 2022, 27, 479–490. [Google Scholar]
  32. Xie, L.; Hu, X.; Zhang, X.; Zhang, X.B. Who suffers from energy poverty in household energy transition? Evidence from clean heating program in rural China. Energy Econ. 2022, 106, 105795. [Google Scholar] [CrossRef]
  33. Pisa, N.; Viviers, W.; Rossouw, R. Enhancing industrial cluster formation through the realistic export opportunities of the TRADE-DSM. S. Afr. J. Econ. 2017, 85, 386–404. [Google Scholar] [CrossRef]
  34. Xu, S.; Ge, J. Sustainable development of clean heating in rural northern China: Locally tailored energy options. Sustain. Prod. Consum. 2023, 35, 655–667. [Google Scholar] [CrossRef]
  35. Damette, O.; Delacote, P.; Del Lo, G. Households energy consumption and transition toward cleaner energy sources. Energy Policy 2018, 113, 751–764. [Google Scholar] [CrossRef]
  36. Bossink, B.; Blankesteijn, M.L.; Hasanefendic, S. Upscaling sustainable energy technology: From demonstration to transformation. Energy Res. Soc. Sci. 2023, 103, 103208. [Google Scholar] [CrossRef]
  37. Anzagira, L.F.; Duah, D.; Badu, E.; Simpeh, E.K.; Amos-Abanyie, S.; Marful, A. Application of green building concepts and technologies for sustainable building development in Sub-Saharan Africa: The case of Ghana. Open House Int. 2022, 47, 408–427. [Google Scholar] [CrossRef]
  38. Han, J.; Chang, H. Development and opportunities of clean energy in China. Appl. Sci. 2022, 12, 4783. [Google Scholar] [CrossRef]
  39. Yao, X.; Lei, H.; Yang, L.; Shao, S.; Ahmed, D.; Ismaail, M.G.A. Low-carbon transformation of the regional electric power supply structure in China: A scenario analysis based on a bottom-up model with resource endowment constraints. Resour. Conserv. Recycl. 2021, 167, 105315. [Google Scholar] [CrossRef]
  40. Tesfamichael, M.; Twinomujuni, E.; Ogeya, M.; Ssebagala, S.; Mulugetta, Y. Barriers to the institutionalization of industrial energy efficiency in Africa: A case study from Uganda. Wiley Interdiscip. Rev. Energy Environ. 2022, 11, 427. [Google Scholar] [CrossRef]
  41. Kim, J. Smart city trends: A focus on 5 countries and 15 companies. Cities 2022, 123, 103551. [Google Scholar] [CrossRef]
  42. Chandra Shit, R. Crowd intelligence for sustainable futuristic intelligent transportation system: A review. IET Intell. Transp. Syst. 2020, 14, 480–494. [Google Scholar] [CrossRef]
  43. Balasubramaniam, A.; Paul, A.; Hong, W.H.; Seo, H.; Kim, J.H. Comparative analysis of intelligent transportation systems for sustainable environment in smart cities. Sustainability 2017, 9, 1120. [Google Scholar] [CrossRef]
  44. Ruoso, A.C.; Ribeiro, J.L.D. The influence of countries’ socioeconomic characteristics on the adoption of electric vehicle. Energy Sustain. Dev. 2022, 71, 251–262. [Google Scholar] [CrossRef]
  45. Ouyang, Y.; Li, P. On the nexus of financial development, economic growth, and energy consumption in China: New perspective from a GMM panel VAR approach. Energy Econ. 2018, 71, 238–252. [Google Scholar] [CrossRef]
  46. Parlikar, A.; Tepe, B.; Möller, M.; Hesse, H.; Jossen, A. Quantifying the carbon footprint of energy storage applications with an energy system simulation framework—Energy System Network. Energy Convers. Manag. 2024, 304, 118208. [Google Scholar] [CrossRef]
  47. Crijns-Graus, W.; Wild, P.; Amineh, M.P.; Hu, J.; Yue, H. International comparison of research and investments in new renewable electricity technologies: A focus on the European union and China. Energies 2022, 15, 6383. [Google Scholar] [CrossRef]
  48. Oruc, O.; Dincer, I. Development and performance assessment power generating systems using clean hydrogen. Energy 2021, 215, 119100. [Google Scholar] [CrossRef]
  49. Pereira, M.G.; Freitas, M.A.V.; da Silva, N.F. The challenge of energy poverty: Brazilian case study. Energy Policy 2011, 39, 167–175. [Google Scholar] [CrossRef]
  50. Shidong, L.; Chupradit, S.; Maneengam, A.; Suksatan, W.; The, C.P.; Ngoc, Q.N. The moderating role of human capital and renewable energy in promoting economic development in G10 economies: Evidence from CUP-FM and CUP-BC methods. Renew. Energy 2022, 189, 180–187. [Google Scholar] [CrossRef]
  51. González-Torres, T.; Rodríguez-Sánchez, J.L.; Montero-Navarro, A.; Gallego-Losada, R. Visualizing research on industrial clusters and global value chains: A bibliometric analysis. Front. Psychol. 2020, 11, 565977. [Google Scholar] [CrossRef] [PubMed]
  52. Chernozhukov, V.; Chetverikov, D.; Demirer, M.; Duflo, E.; Hansen, C.; Newey, W.; Robins, J. Double/Debiased Machine Learming for Treatment and Structural Parameters. Econom. J. 2018, 21, C1–C68. [Google Scholar] [CrossRef]
  53. Farbmacher, H.; Huber, M.; Lafférs, L.; Langen, H.; Spindler, M. Causal Mediation Analysis with Double Machine Learning. Econom. J. 2022, 25, 277–300. [Google Scholar] [CrossRef]
  54. Su, Y.; Sun, P. Analysis of the spatio-temporal evolution and influencing factors of regional energy poverty. Stat. Decis. Mak. 2023, 39, 63–66. [Google Scholar]
  55. Yin, X.; Zhang, T. A test of the effect of old and new kinetic energy transformation in promoting the coordinated devel opment of double-cycle economy. Stat. Decis. Mak. 2023, 39, 79–84. [Google Scholar]
  56. Song, M.; Zhou, P.; Si, H. Fintech and Corporate Total Factor Productivity-Perspectives on “Empowerment” and Credit Rationing. China Ind. Econ. 2021, 4, 138–155. [Google Scholar]
  57. Hausmann, R.; Hwang, J.; Rodrik, D. What You Export Matters. J. Econ. Growth 2007, 12, 1–25. [Google Scholar] [CrossRef]
  58. Gan, C.; Zheng, R.; Yu, D. Impact of industrial structure change on economic growth and volatility in China. Econ. Res. 2011, 46, 4–16+31. [Google Scholar]
  59. Beck, T.; Levine, R.; Levkov, A. Big bad banks: The winners and losers from bank deregulation in the United States. J. Financ. 2010, 65, 1637–1667. [Google Scholar] [CrossRef]
Figure 1. The relationship between the hypotheses above.
Energies 17 02667 g001
Figure 2. Spatio–temporal distribution of EPA and Conv. (a) Spatial-temporal distribution of EPA in 2009. (b) Spatial-temporal distribution of EPA in 2021. (c) Spatial-temporal distribution of Conv in 2009. (d) Spatial-temporal distribution of Conv in 2021.
Energies 17 02667 g002
Figure 3. Local Moran scatter plots of Chinese provincial EPAs in 2009 and 2021. (a) Local Moran scatter plot of EPA in 2009. (b) Local Moran scatter plot of EPA in 2021.
Energies 17 02667 g003
Figure 4. Parallel trend test.
Energies 17 02667 g004
Table 1. China’s provincial Energy Poverty Alleviation Index (EPA) evaluation index system.
DimensionThree-Level Evaluation IndexMeasure MethodIndex Attribute
Energy poverty alleviation of heating segment (Heat)Personal heating business energy consumptionDomestic coal consumption per capitaPositive
Average number of air conditioners per hundred urban households at the end of the yearPositive
Average number of air conditioners per hundred rural households at the end of the yearPositive
Energy poverty alleviation of food and accommodation segment (F&A)Personal cooking business energy consumptionTotal gas consumption per capitaPositive
Total consumption of liquefied petroleum gas per capitaPositive
Urban gas pipelines per capitaPositive
Gas penetration ratePositive
Public food and accommodation business energy consumptionConsumption of living energy per capitaPositive
Value added of accommodation and catering industry Positive
Energy poverty alleviation of household electricity service segment (Elec)Personal electricity consumptionLiving electricity consumption of urban residents per capitaPositive
Total power of agricultural machinery per capita in rural areas Positive
Proportion of new energy generation Positive
Installed capacity of electricity generation per capitaPositive
Average number of refrigerators per hundred urban households at the end of the yearPositive
Average number of refrigerators per hundred rural households at the end of the yearPositive
Average number of computers per hundred urban households at the end of the year Positive
Average number of computers per hundred rural households at the end of the year Positive
Energy poverty alleviation of transportation segment (Trans)Personal transportation energy consumptionUrban domestic oil consumption per capitaPositive
Rural domestic oil consumption per capitaPositive
Average number of household cars per hundred urban households at the end of the yearPositive
Average number of motorcycles per hundred rural households at the end of the yearPositive
Public transportation energy consumptionTransportation, storage and postal energy consumption per capitaPositive
Public transportation passenger volume Positive
Number of public transportation vehicles per ten thousand peoplePositive
Railway coverage ratePositive
Road coverage ratePositive
Table 2. Evaluation index system for the conversion of new and old kinetic energy.
DimensionIndex NameMeasure MethodIndex Attribute
Conventional energy index
(CEI)
Demand side
(DeC)
The external demand kinetic energy based on comparative advantagesTotal export value of goods/Gross regional productPositive
Supply side
(SuC)
The kinetic energy of capital investmentTotal investment in fixed assets/Gross regional productPositive
The kinetic energy of financial developmentBalance of deposits and loans at the end of the year/GDPPositive
Structural side
(StC)
The structural conversion kinetic energy based on Baumol effectValue added of tertiary industry/GDPPositive
The kinetic energy of capital market developmentAmount of venture capital investment/Fixed capital stockPositive
New energy
Index
(NEI)
Demand side
(DeN)
The internal demand kinetic energy based on Engel effectNon-food expenditure of residents per capita/Consumption expenditure per capitaPositive
Supply Side
(SuN)
The technical progress kinetic energy of human capitalNumber of employees in high-tech industries/Total employmentPositive
The innovative kinetic energy based on Schumpeterian effectInternal R&D expenditures of industrial enterprises above scale/Main business incomePositive
The precise release of kinetic energy from financing pressures through the integration of technology and financeFinancial technology indexPositive
Structural side
(StN)
The kinetic energy of advanced industrial structureSales revenue of new products in high-tech industries/Main business income of industrial enterprises above scalePositive
The value ascension kinetic energy of industrial chainExport Complexity of ProductsPositive
Disclaimer/Publisher’s Note: The statements, opinions and data contained in all publications are solely those of the individual author(s) and contributor(s) and not of MDPI and/or the editor(s). MDPI and/or the editor(s) disclaim responsibility for any injury to people or property resulting from any ideas, methods, instructions or products referred to in the content.

