Article

Stimulating Methane Production from Poultry Manure Digest with Sewage Sludge and Organic Waste by Thermal Pretreatment and Adding Iron or Sodium Hydroxide

1
Department of Environmental Engineering and Biotechnology, Faculty of Infrastructure and Environment, Czestochowa University of Technology, 42-200 Czestochowa, Poland
2
Department of Green Chemistry and Technology, Faculty of Bioscience Engineering, Ghent University, 9000 Ghent, Belgium
*
Author to whom correspondence should be addressed.
Energies 2024, 17(11), 2679; https://doi.org/10.3390/en17112679
Submission received: 4 May 2024 / Revised: 23 May 2024 / Accepted: 29 May 2024 / Published: 31 May 2024
(This article belongs to the Special Issue New Trends in Biofuels and Bioenergy for Sustainable Development II)

Abstract

:
The European Union’s energy policy favors increasing the share of renewable energy in total energy production. In this context, the co-digestion of various waste streams seems an interesting option. This study aimed to determine the effect of selected pretreatment methods on the efficiency and kinetics of the co-digestion process of poultry manure with sewage sludge and organic waste. This research was carried out in four stages: (1) the selection of the third component of the co-digestion mixture; (2) the determination of the most favorable inoculum-to-substrate ratio for the co-digestion mixture; (3) the selection of the most favorable pretreatment parameters based on changes in volatile fatty acids, ammonium nitrogen, extracellular polymers substances (EPS) and non-purgeable organic carbon (NPOC); and (4) the evaluation of anaerobic co-digestion based on the result of the BMP tests and kinetic studies. All the pretreatment methods increased the degree of organic matter liquefaction as measured by the NPOC changes. Waste with a high fat content showed the highest methane potential. The addition of grease trap sludge to feedstock increased methane yield from 320 mL/g VSadd to 340 mL/g VSadd. An optimal inoculum-to-substrate ratio was 2. The pretreatment methods, especially the thermochemical one with NaOH, increased the liquefaction of organic matter and the methane yield, which increased from 340 mL/g VSadd to 501 mL/g VSadd (trial with 4.5 g/L NaoH).

1. Introduction

One of the primary challenges currently confronting the energy sector is achieving autonomy from diminishing reserves of fossil fuels. For this reason, a pivotal course of action for the advancement of this industry involves shifting towards eco-friendly energy systems with reduced emissions. New renewable energy sources are being sought to pursue this objective, and existing solutions are being developed. Waste generated in rural and urban areas seems to be a valuable raw material for energy production. Among these resources are animal waste, sewage sludge, the organic fraction of municipal waste, by-products from the food industry such as fat waste, whey, or brewery grain, and energy crops like corn and forest biomass [1,2,3].
Poultry manure’s high organic matter content and highly biodegradable substances make it a promising material for anaerobic digestion (AD). However, to address the high nitrogen levels which could impede the AD process, it is crucial to modify the C/N ratio for this waste [4,5] For this reason, various methods are used, e.g., dilution, so that the feedstock sent to the digestion chambers contains about 3–6% total solids (TSs). This approach helps mitigate ammonia inhibition issues but often results in an insufficient methane content in the produced biogas, thereby impacting the economic viability of the process. Moreover, the large volume of waste to be processed resulting from dilution makes this method economically unattractive [4]. An alternative strategy to improve biogas production efficiency is adding co-substrates into the digestion broth [6,7]. Poultry manure has been co-digested with a wide range of waste types, including lignocellulosic biomass [8], kitchen waste [9], sugar mill press mud [10], wine vinasse [11], sewage sludge [12,13,14], water hyacinth [15], sheep manure [16], etc. Co-digestion (AcD) not only boosts biogas output but also facilitates the dilution of harmful substances, reduces the operational expenses, and enhances the C/N balance, thereby increasing the appeal of this approach [17,18,19]. An interesting option is their joint anaerobic digestion with sewage sludge [4]. Compared to the AD of sewage sludge alone, after introducing poultry manure into the AD chambers, an increase of up to 40% in the daily biogas production has been observed [20].
The simultaneous processing of many waste types and improving AD efficiency align with the current European Union policy, supporting the increase in the share of renewable energy in the overall energy balance. This strategic focus suggests that co-digestion may play a more significant role in energy production in the future than the current dominant mono-digestion practice. However, the production of biogas from diverse waste materials might be constrained by factors such as the slow rate of biodegradation of the feedstock, the low efficiency of the AD process, and the low methane production [21,22]. Implementing pretreatment methods for feedstock (co-digestion mixture) appears promising in addressing these challenges. Such a pretreatment, an additional stage carried out before the AD/AcD process, makes it possible to increase the degree of liquefaction of the feedstock, improve its biodegradation, and, consequently, improve the efficiency of AD/AcD [23,24,25].
The selection of appropriate pretreatment techniques is crucial. This decision should be based on the substrate’s physical and chemical properties and address specific critical requirements because pretreatment techniques have to meet certain criteria, including leading to a reduced substrate size, enhancing porosity, and increasing the feedstock’s degradability and solubility. Additionally, eliminating inhibitory by-products (which may be produced following conditioning) and a low energy input are essential to ensure the method’s cost-effectiveness [23]. Pretreatment methods can generally be categorized into three main groups: physical, chemical, and biological pretreatments. Sometimes, at least two pretreatment methods may be employed simultaneously to enhance the degradability of waste materials and eliminate toxic compounds [25,26]. Opinions on the effectiveness of combining AcD and pretreatments are divided. For this reason, further research focusing on integrating these two processes is required, as it allows for a better understanding of the interactions between the properties of substrates and determining their impact on the kinetics and efficiency of the process.
In this context, this research aimed to (1) select the third component of the co-digestion mixture (together with sewage sludge and poultry manure), (2) determine the most favorable inoculum-to-substrate ratio for the co-digestion mixture, and (3) determine the impact of the selected pretreatment methods on the efficiency and kinetics of the co-digestion process of sewage sludge and organic waste.
The novelty of this research is the selection of local co-substrates and the determination of the impact of pretreatment on the efficiency of the process. Of all types of manure, poultry manure is the least described in terms of the possibility of recovering methane from it. Most often, these publications concern its co-digestion with other waste generated on the farm. Taking into account the recent legislative changes (revision of the wastewater treatment directive), which provide for the energy self-sufficiency of wastewater treatment plants (WWTPs), we decided to determine the impact of poultry manure on the anaerobic digestion of sewage sludge. In order to further improve the profitability of the solution, the selection of the third component of the co-digestion mixture was made. To the best of our knowledge, no one has so far investigated the potential for the joint AD of sewage sludge with poultry manure and another organic waste type. In our research, we focused on the selection of the third component among local waste types, which could further direct their generators to manage these products in a sustainable and, at the same time, economical way. The added value of this work is its focus on changes in the EPS structure that are not often found in the literature in the context of co-digestion processes.

2. Materials and Methods

2.1. Raw Materials

The substrate in the research was the following:
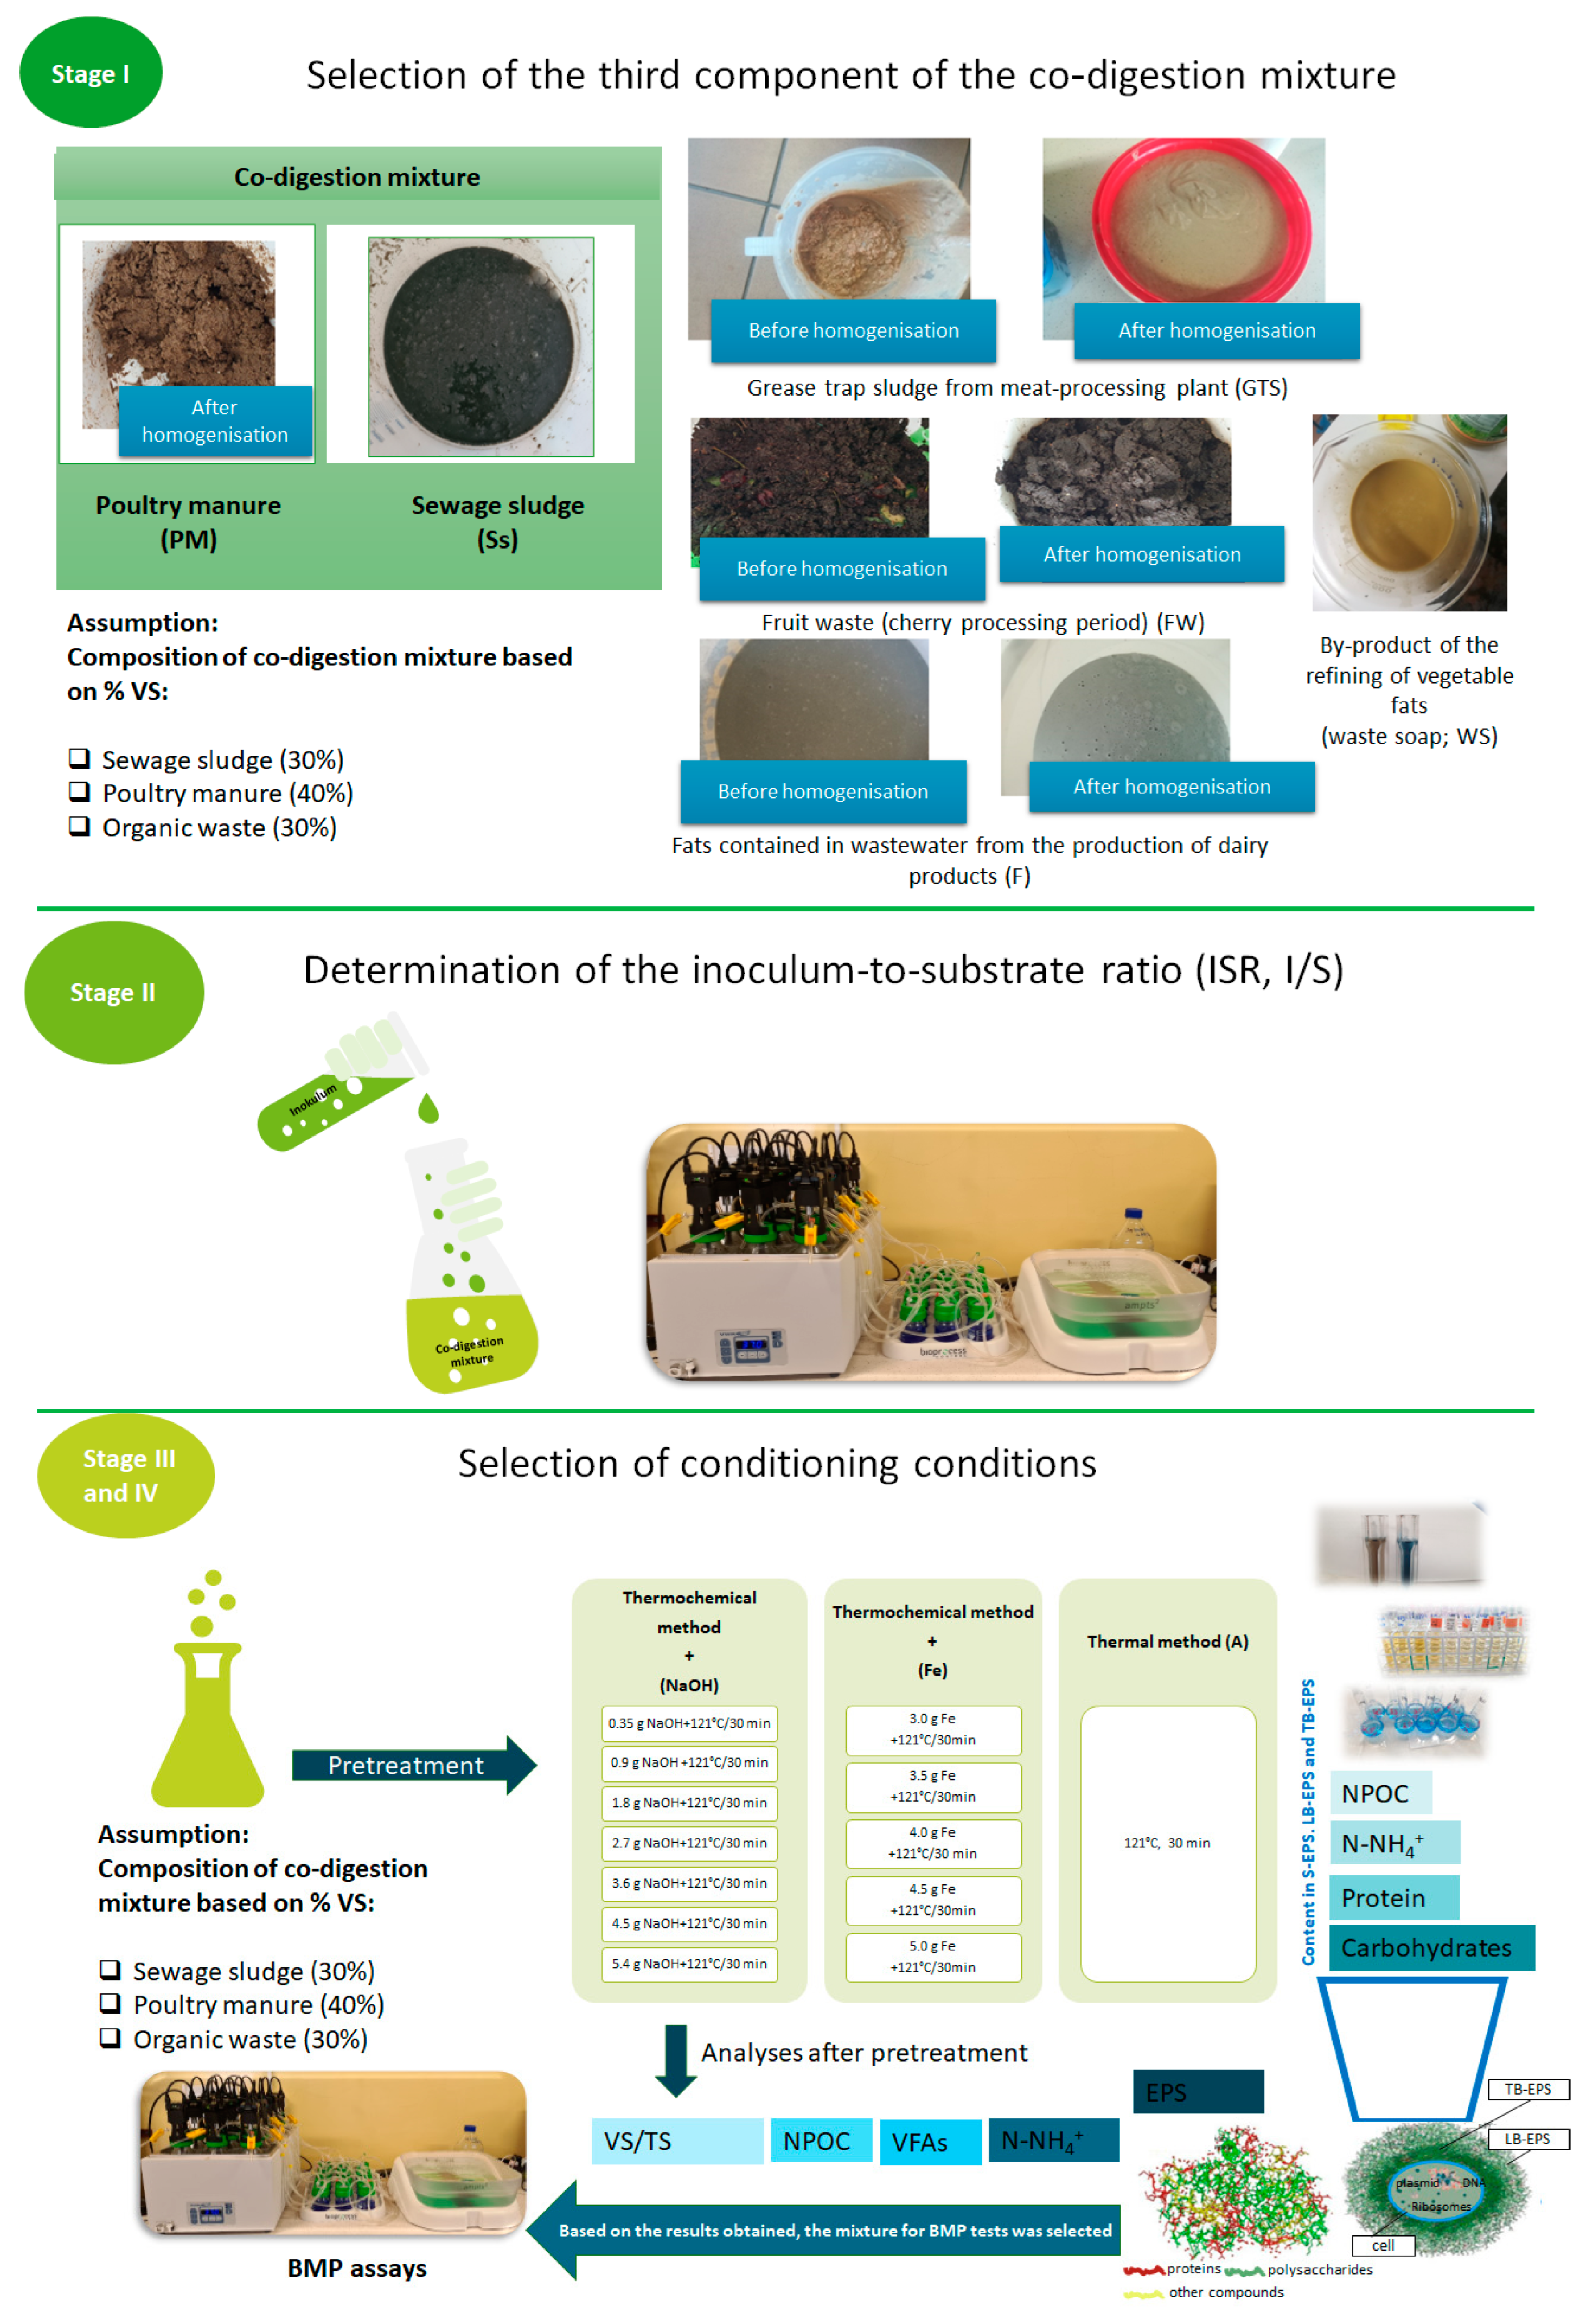
  • The co-digestion mixture consisted of poultry manure and a mixture of primary and excess sludge. Sewage sludge (Ss) was collected from a municipal wastewater treatment plant located in the Silesian Voivodeship, while poultry manure (PM) was sourced from a laying poultry farm in the Silesia region of Poland. The manure was homogenized before the preparation of the co-digestion mixture, and the share of PM in the co-digestion mixture was 40% based on volatile solids (VSs);
  • Inoculum—digested sludge collected from heat exchangers at a municipal wastewater treatment plant located in the Silesian Voivodeship (I). The WWTP produces annually approx. 3200 Mg dry mass of sewage sludge and treats about 90,000 m3/d of wastewater. In the mentioned WWTP, a mixture of waste-activated sludge and primary sludge was digested under mesophilic conditions, and the HRT of AD was equal to 30 d;
  • Selected organic waste listed in Table 1.
The characteristics of the substrates are shown in Table 2.

2.2. Experimental Procedure

This research was carried out in the following stages (Figure 1):
  • Selecting, based on the results of the biomethane potential (BMP) tests, the third component of the co-digestion mixture (the methane potential of the waste itself was assessed, and then, for the selected waste, their joint anaerobic co-digestion with sewage sludge and poultry manure was carried out); based on our previously conducted research, it was assumed that the third component would constitute 30% of the co-digestion mixture based on the VS [27,28,29];
  • Determination of the most favorable inoculum-to-substrate ratio (I/S) for the co-digestion mixture. This research determined the impact of I/S ratios of 0.5, 1.0, 1.5, and 2 on the methane yield factor;
  • Selection of the most favorable parameters for the pretreatment of the feedstock based on changes in volatile fatty acids (VFAs), ammonium nitrogen, TS, VS, and non-purgeable organic carbon (NPOC), as well as the content of extracellular polymers substances (EPS) in individual fractions broken down by their concentration of carbohydrates, ammonium nitrogen, protein, and NPOC. The three-component co-digestion mixture and sewage sludge were treated with the following pretreatment methods (Figure 1): (a) the thermochemical method—thermal method using various doses of NaOH [g/L], temperature 121 °C, conditioning time 30 min (NaOH); (b) thermochemical method—thermal method using various doses of metallic iron, [g/L], temperature 121 °C, conditioning time 30 min (Fe); and (c) the thermal method—temperature 121 °C, conditioning time 30 min (A);
  • Determining the impact of the pretreatment methods of the feedstock (three-component co-digestion mixture) selected in stage 3 on the effectiveness of the anaerobic co-digestion process measured by the methane yield, the VS removal, and the kinetic parameter.
Anaerobic digestion (BMP tests) was carried out using the AMPTS II (Automatic Methane Potential Test System) from Bioprocess control. The AMPTS II device consists of three units connected. The first unit (unit A) consists of a water bath and a set of 15 bioreactors whose contents are mixed using mechanical mixers. In the second unit (unit B) (Duran bottles filled with sodium hydroxide), acidic biogas components such as CO2 and H2S are adsorbed. Adding thymolphthalein as a pH indicator to each of the vessels enables a simple, optical assessment of the ability of the NaOH solution to bind CO2. Only methane flows through this unit and goes to the third unit (unit C) of the gas quantity measurement system.
BMP assays were performed in triplicate for each substrate–inoculum combination. The process was monitored daily for 21 days and carried out in mesophilic conditions (37 °C). The collected data were the basis for estimating the kinetic parameters. The mentioned parameters were determined using the models listed in Table 3.
In turn, sample pretreatment was carried out using the ELMI ESS 207 industrial autoclave.

2.3. Physicochemical and Physical Analyses

During this study the following analyses were carried out: (a) volatile fatty acids (VFAs) by indirect distillation with steam, with a Büchi K-355 distiller in accordance with [30]; (b) ammonium nitrogen (N-NH4+) by the distillation method, in accordance with the APHA [30], and, in the case of the EPS fraction, spectrophotometrically, using the phenol-hypochlorite method described in Schillak [31]; (c) non-removable organic carbon (NPOC), determined after dry combustion using the Multi N/C H1300 carbon and nitrogen analyzer from Analytykjena; (d) total solids and volatile solids, residue after ignition, losses on ignition, dry organic matter, by the weight method, in accordance with [30]; (e) pH, via the potentiometric method in accordance with [30]; (f) extracellular polymers substances (EPS), for which individual fractions were extracted according to the methodology described by Yang et al. [32]; (g) carbohydrates, measured spectrophotometrically according to the procedure described by Nielsen [33]; and (h) proteins, via the Bradford method according to the Thermo Scientific™ procedure, using the Coomassie (Bradford) Protein Assay Kit number 23200. Equations (1)–(3) show how the VS and TS contents were calculated.
% T S = A B   ×   100 C B
V S   ( % T S ) = A D   ×   100 A B
% V S = % T S   ×   V S   ×   % T S
  • A—weight of dried residue + dish, g
  • B—weight of dish, g
  • C—weight of wet sample + dish, g
  • D—weight of residue + dish after ignition, g
Additionally, to determine whether there was a synergistic effect between the components of the mixture, the co-digestion performance index (CPI) often used in AcD studies was estimated according to the formula presented in Ebner et al. [34].

2.4. Statistical Analyses

The results were treated for statistical analysis. For this purpose, a one-way analysis of variance was used. For data for which significant statistical differences were found, further tests were performed, namely post hoc, more precisely Tukey’s test. The analyzes were performed in the Statistica 10 software by Statistica.

3. Results and Discussion

3.1. Selection of the Third Component of the Co-Digestion Mixture

Among the organic waste types tested as part of this research, the highest methane yield was observed in waste with a high fat content, for which this parameter ranged from 630 to 750 mL/g VSadd (Table 4). Therefore, this type of waste was within the typical range indicated in the literature (430–990 mL/g VSadd) (Table 5). The methane yield in the case of the other tested waste types was much lower and most often below 300 mL/g VSadd. An exception to this rule was noted only for sewage sludge and a two-component co-digestion mixture consisting of poultry manure and sewage sludge. Similarly to waste with a high fat content, the obtained methane yield did not differ from the values reported in the literature (Table 5).
The BMP tests in the next phase for the three-component co-digestion mixture confirmed the assumption that the highest methane production was achieved for waste with a high fat content. Based on the results obtained, it was decided to conduct further research using a co-digestion mixture consisting of poultry manure, sewage sludge, and grease trap sludge from meat-processing plants (Table 6). Due to its highest cumulative production of methane, GTS was selected for further research as the third co-substrate of the co-digestion mixture.

3.2. Determination of the Inoculum-to-Substrate Ratio (ISR, I/S)

One of the most important parameters in batch tests, but often ignored in the research, is the proportion of inoculum to substrate. In the literature, this ratio is often marked as ISR or I/S (inoculum-to-substrate ratio), and sometimes an inverse relationship is given. Then, it is described with the symbol S/X (waste-to-inoculum ratio) or SIR (substrate-to-inoculum ratio). The I/S ratio may be expressed in terms of TS, VS, or chemical oxygen demand, and the second method is most often used for the above. The influence of the discussed ratio on the BMP test result is unclear. Theoretically, it should not affect the value of the methane/biogas yield but only the kinetics of the process, including the length of the lag phase (it shortens as the I/S value increases) [36,37,38]. Numerous literature reports, however, demonstrate the significance of the I/S ratio in preventing the process inhibition caused by the accumulation of inhibitors like VFAs, while also impacting the efficacy of the anaerobic digestion process [39]. Each substrate has an optimal characteristic value of the I/S ratio, and its value is a specific compromise between the endogenous production of inoculum biogas, the acceptable lag phase length, and the buffer capacity. For instance, Agrawal et al. [40] recorded the highest biogas production at an I/S of 0.3. Above the indicated value, they observed a decrease in biogas production, which they associated with the imbalance of nutrients in the feedstock (fruit and vegetable waste). In turn, Al-Iraqi et al. [39], for a feedstock composed of simulated food waste and common reeds, recommend an I/S ratio of 1. Other studies have shown that, for easily biodegradable substrates like household waste, I/S ratios ranging from 5 to 15 are suitable for batch assays without volatile fatty acid accumulation [41]. Meanwhile, in Elsayed et al. [42], the highest methane yield was noted at an I/S ratio of 3 during the anaerobic co-digestion of sludge, straw, and buckwheat husk. Most often, the value of the I/S quotient given in the literature ranges from 1 to 4 [43]. Therefore, this research determined the impact of the following I/S ratios on the co-digestion of poultry manure, sewage sludge, and selected organic waste: 0.5, 1.0, 1.5, and 2 (Table 7).
A one-way ANOVA showed statistically significant differences between the obtained methane production coefficients and the I/S ratio (F = 12.44, p = 0.002) (Table 8). Based on these results, it was decided to carry out further research for an I/S of 2.0.

3.3. Selection of Pretreatment Conditions

In accordance with “Regulation (EC) No. 1774/2002 of the European Parliament and of the Council of 3 October 2002 laying down health rules concerning animal by-products not intended for human consumption” [44], animal manure is classified in the second category. For this reason, sterilization was used to pretreat the feedstock in this study. Additionally, the thermal method was combined with a chemical pretreatment to examine how the addition of iron or sodium hydroxide would affect the efficiency of the process.
The use of an alkaline pretreatment involves the application of chemicals that are mostly environmentally friendly and not prone to causing corrosion, such as different forms of ammonia (aqueous, liquid, and gaseous), sodium hydroxide, sodium carbonate, and calcium hydroxide (commonly known as lime). Compared to acid pretreatment, alkaline pretreatment can be conducted under less-severe conditions, making it a more feasible option for many applications [45]. In this study, sodium hydroxide was used for this purpose, with a dose not exceeding the inhibitory level reported in the literature [46]. In turn, iron’s impact on anaerobic digestion (AD) can be significant because it acts as a cofactor for enzymes involved in various metabolic pathways and serves as a catalyst for certain reactions (e.g., stimulation of direct interspecies electron transfer). Furthermore, iron is a crucial micronutrient for many microbial species, and its availability can affect their growth rates and metabolic activities and create a more favorable environment for them by reducing the ORP level. The source of iron in studies on its influence on AD included, among others, iron(III) chloride, nZVI (nano-zero-valent iron), iron(III) hydroxide, amorphous ferric, oxyhydroxide, ferrihydrite, lepidocrocite, hematite, magnetite, and akaganeite [47,48].
Regardless of the pretreatment method used, there was no significant increase in the concentration of volatile fatty acids in the supernatant. The highest VFA content was recorded in the pre-conditioned sample using the thermochemical method with the lowest dose of sodium hydroxide. However, it was less than eight percent higher than the untreated mixture. Increasing the base dose gradually decreased the indicator concentration (Figure 2a, Supplementary Materials, Table S1).
A one-way ANOVA showed statistically significant differences between the ammonium nitrogen content in the samples (Figure 2b, Table S2). The highest ammonium nitrogen content was noted in the thermochemically conditioned sample 1, specifically in the mixture in which NaOH had been dosed at 5.4 g/L. The concentration of ammonium nitrogen was 1355.2 mg/L. Compared to the control sample, it was 196 mg/L higher and eight times higher than that observed in unconditioned and pretreated sewage sludge. The ammonium nitrogen content was 154 and 176.4 mg/L, respectively (Table S2). Dosing iron into the mixture resulted in a lower concentration of ammonium nitrogen in the overlying liquid compared to the control sample. A similar trend was noted in the research by Yang et al. [32], who hypothesized that iron could effectively inhibit the transformation of organic nitrogen into ammonium nitrogen.
Pretreatment of the co-digestion mixture positively affected the degree of liquefaction of organic matter measured by changes in the non-removable organic carbon (NPOC). However, the iron dose did not statistically affect the NPOC changes (Table S3, Figure 2c). The opposite trend was observed for the first of the tested thermochemical methods. Moreover, the NPOC concentration increased with the increase in the NaOH dose. For the highest dose of NaOH, the NPOC content was 2.4 times higher than for the control sample (increase from 5.55 to 13.14 mg/L). The lowest NPOC value was obtained for sewage sludge only (1.02 g/L), and it was slightly higher for conditioned sewage sludge (1.90 g/L). A much more significant increase in the decomposition and liquefaction of organic matter is reported in the literature. For instance, Liu and others [49] reported an almost six-fold increase in SCOD after the alkaline pretreatment of polyacrylamide flocculant waste-activated sludge. In turn, they noted a 7-fold increase for the thermal method, and the combination of both approaches resulted, in their study, in an almost 12-fold increase in SCOD.
Because one of its components was poultry manure, the co-digestion mixture had a much higher pH than the sewage sludge. According to what had been expected, introducing hydroxide into the mixture increased the pH. The pH increased with the hydroxide dosed into the co-digestion mixture (Figure 2d, Table S4). The dose of iron did not significantly impact the changes in the described indicator. For all the tested doses, the pH of the mixture after pretreatment was lower than that of the control sample (<6.89). This observation is inconsistent with the data presented in the work by Yang et al. [32]. The research substrate in the mentioned publication was sludge from an industrial sewage treatment plant located at a coking plant. The authors attributed the pH decrease to iron precipitation during the reaction with OH- ions.
The pretreatment method influenced changes in the TS of the samples. A reduction in TS was observed for the thermochemical method with NaOH above a dose of 1.8 g/L. A similar trend was observed for samples with the addition of iron, regardless of its dose (Figure 2e, Table S5). The reduction in TS could probably be caused by the release of VFAs that had been oven drying during indicator measurement [50]. In turn, in the case of thermochemical method 2 (addition of iron), it could be identified by dosing metallic iron in powder. The changes in TS were reflected in the content of VS. Only for the thermochemical test with the addition of sodium hydroxide at the level of 3.5 g/L was the value of the indicator higher than for the control sample (untreated co-digestion mixture) (Figure 2f, Table S6). Rahman et al. [51] also observed an increase in ash content with a simultaneous decrease in VS during the co-digestion of poultry droppings and briquette wheat straw at mesophilic and thermophilic conditions.
Extracellular polymeric substances (EPS) are essential in the matrix of sludge and other organic wastes. EPS are complex mixtures of high-molecular-weight compounds secreted by microorganisms, playing a pivotal role in bioaggregation and in the formation of biofilms. Understanding and manipulating EPS within pretreatment processes can significantly impact the hydrolysis step of anaerobic digestion, the solubilization of organic matter and the accessibility of substrates to microbial action. Sewage sludge forms a flocculent structure because bacterial micelles are grouped into the given structure due to the secretion of extracellular polymers substances (EPS) into the environment. In the existing literature, three fractions are distinguished in the structure of extracellular polymers substances: soluble EPS (S-EPS or SB-EPS), loosely bound EPS (LB-EPS) and tightly bound EPS (TB-EPS) (Figure S1). In this context, how the composition of the mentioned fractions changed depending on the conditioning method was discussed [52,53,54]. As part of this work, the concentration of ammonium nitrogen, NPOC, protein, and carbohydrate content was examined in individual fractions (Figure 3, Figure 4, Figure 5 and Figure 6, Tables S7–S26).
Tukey’s test, carried out as part of this research, showed statistically significant differences in the concentration of NPOC (p < 0.05) in the extracellular polymers. Moreover, it proved that the pretreatment method significantly impacted the distribution of NPOC in individual EPS fractions (Tables S12–S16, Figure 3). This observation is consistent with the literature reports [55]. For all the tested methods for the first two fractions (EPS-S, EPS-LB), a significant increase in the NPOC concentration was noted compared to the control sample (Tables S13 and S14). Meanwhile, for the fraction of tightly bound EPS (EPS-TB), the trend for NPOC was utterly different. The NPOC concentration was lower than for the control sample for all the samples (Table S15). The highest degree of liquefaction of organic matter measured by NPOC changes was recorded for the thermochemical method, precisely the Na5.4 sample, i.e., with the addition of 5.4 g NaOH/L (Figure 3).
A one-way analysis of variance showed that the pretreatment method affected the ammonium nitrogen content in individual fractions of extracellular polymers (Tables S8–S11, Figure 4). EPS’s highest ammonium nitrogen concentration was recorded for the control sample (Figure 4, Table S11). In turn, the most significant reduction in the total ammonium nitrogen content in EPS compared to the control was recorded for the thermochemical method, when the NaOH dose ranged from 2.7 to 5.4 g/L. Only for tightly EPS (TB-EPS), in two samples, there was an increase in the nitrogen concentration recorded compared to the control sample. These were the Na0.9 and Fe3 samples (Table S10).
Tukey’s test showed that the pretreatment method had a statistically significant impact on the changes in the carbohydrate concentration in individual EPS fractions (Tables S16–S21, Figure 5). For all the samples treated with the conditioning agent, it was noted that the total carbohydrate content in the fractions was higher than in the control sample (Table S21, Figure 4). However, in relation to the iron, the dose of the chemical reagent did not affect the concentration of the mentioned indicator. It was also noted that, in regard to the carbohydrates determined in the EPS-S and EPS-LB fractions, the indicator values for all the conditioned samples were higher than for the control sample. The opposite trend was observed for the carbohydrates determined in the EPS-TB fraction.
As in the case of the other components, Tukey’s test showed for the proteins that the pretreatment method affected the distribution of the indicator in individual fractions of extracellular polymers (Tables S22–S26). The highest protein concentrations were determined in the first fraction (Figure 6). Small fluctuations in the total protein content were observed for dosed iron samples. In turn, for thermochemical method 2, an increase in the indicator concentration was observed with an increase in the NaOH dose. Compared to the control sample (Figure 6 and Table S26), only in mixtures to which at least 3.6 g/L of NaOH had been added, an increase in the total protein content was determined in the three EPS fractions.

3.4. Methane Production and VS Removal

Based on the results of series 3, several conditions for the pretreatment process were selected for further research. Their impact on biogas production and VS removal is shown in Figure 7 and Figure 8. For the untreated co-digestion mixture, the methane yield was 340 mL/g VS. After the thermal pretreatment, an increase in the methane yield of 29% was recorded. Meanwhile, for the mixture treated with the thermochemical method with the application of sodium hydroxide to the feedstock, an increase to 501 mL/g VS was recorded; thus, it was 47% higher than that of the control sample (Figure 7). The method used did not statistically significantly affect VS removal (F = 0.076; p = 0.99) (Figure 8). The higher methane yields in the pretreatment samples could be associated with changes in the EPS structure. This phenomenon was particularly well observed in the liquefaction of organic matter measured by NPOC. This indicator increased significantly compared to the unconditioned co-digestion mixture. Furthermore, a significant decrease in its concentration in tightly bound EPS was observed in favor of an increase in the remaining fractions weakly bound to the cells. The higher methane yield for the samples conditioned with sodium hydroxide may have been related to an increased protein concentration in all the EPS fractions (Table 9). It has been estimated that 1 g of carbohydrates and proteins could theoretically obtain 830 mL (CH4 of 50%) and 921 mL (CH4 of 68.8%) of biogas. Saponification plays a crucial role in anaerobic digestion by increasing organic waste’s solubility in the presence of a high lipid content, namely, the fraction with the highest methane potential (1425 mL/g, CH4 of 69.5%) [56]. Moreover, saponification pretreatment with alkali reactants significantly increases the rates of hydrolysis, acidogenesis, and methanogenesis, ultimately improving the overall efficiency of the process [57,58].
For all the pretreatment co-digestion mixtures, co-digestion performance index (CPI) values higher than 1 were recorded (1.04 to 1.19). This clearly indicated the synergistic effect of AcD and the pretreatment methods used.
Due to the fact that no one had so far tested the possibility of improving methane production from poultry manure using a hybrid solution combining anaerobic co-digestion with a pretreatment, there were no direct data to which the obtained results can be compared. Therefore, the effectiveness of the process was compared with the pretreatment of poultry manure itself, its co-digestion with other waste streams, or data on the possibility of using hybrid solutions (Table 10). Generally, a much higher efficiency of methane production for poultry manure was achieved if it was digested with other waste than if it had been conditioned. Often, combining several unit operations in a hybrid system significantly improved process efficiency, although this was strongly dependent on the composition of the co-digestion mixture.
Table 11 summarizes the results of the kinetic studies. An increase in the methane production rate was recorded for all the tested methods. Another important factor determining the co-digestion process’ effectiveness was the adaptation phase’s duration (λ). As shown by the data in Table 11, the pretreatment of the mixture usually resulted in an extension of the adaptation time of the microorganisms. Moreover, it was found that, with an increase in the dose of sodium hydroxide, the adaptation time of the microorganisms was prolonged. A similar trend was noted by Almomani and Bhosale during the anaerobic co-digestion of agricultural waste with cow dung (CD) and the use of alkaline pretreatment with sodium bicarbonate [70]. In turn, Wu et al. [71] observed that saponification with calcium enhanced the methane yield for fat, oil, and grease as well as reduced the lag phase. Despite the longer lag time phase in anaerobic co-digestion reactors, the results clearly showed that methanogens consumed organic acids quite quickly in these reactors, which consequently led to an increase in the rate of methane production and a higher methane yield, thus confirming previous observations from the literature according to which the carefully selected addition of co-substrates to digesters can help improve the rate of methane production during co-digestion [72,73,74,75].
All the models showed a very good fit to the experimental results and estimated parameters, as evidenced by the value of the coefficient of determination (R2 > 0.99).

4. Conclusions

This study’s primary objective was to investigate the impact of selected pretreatment techniques on the efficiency of anaerobic digestion (AD) of a three-component co-digestion mixture. In addition to conducting biochemical methane potential (BMP) tests, the analysis focused on examining the characteristics of the supernatant post pretreatment and identifying the most suitable inoculum-to-substrate ratio. This study’s findings led to several key conclusions:
  • Waste with a high fat content has the highest potential for methane production;
  • The addition of a third co-substrate to the mixture of sewage sludge and poultry manure resulted in a substantial increase in methane production;
  • The inoculum-to-substrate ratio (I/S) has a statistically significant impact on the methane yield;
  • The highest value of methane yield was obtained for an I/S equal to 2;
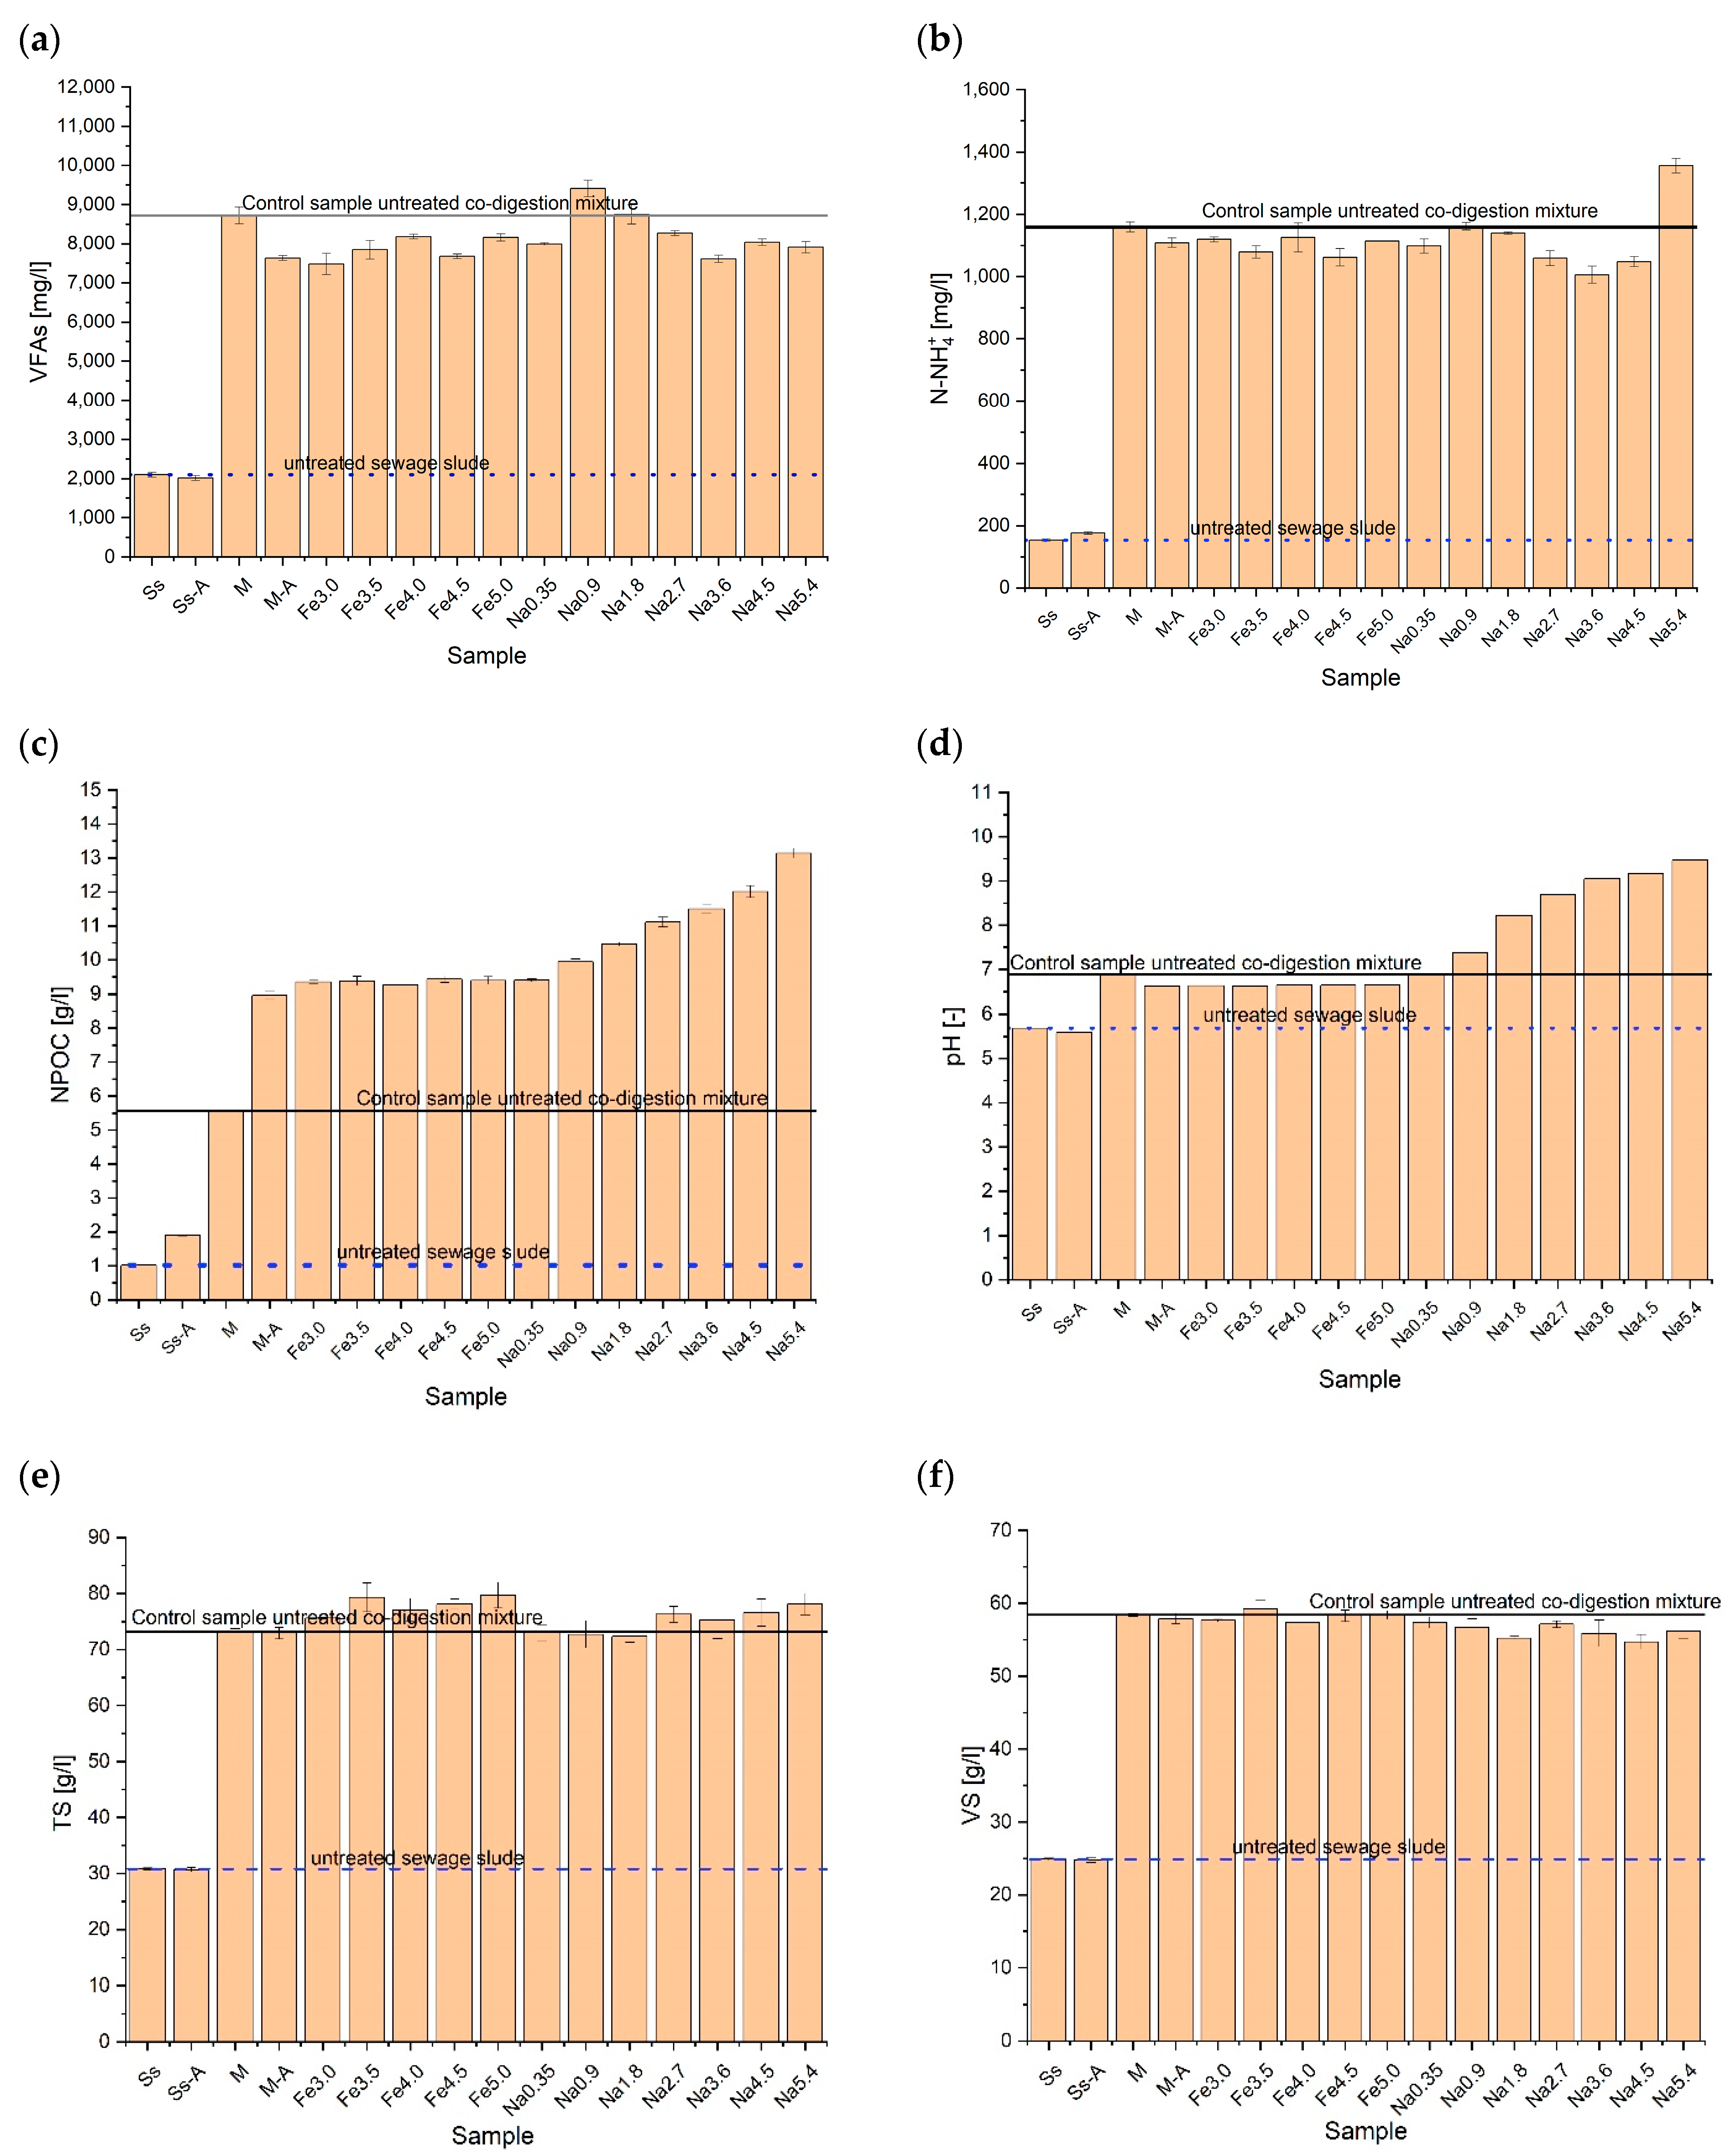
  • Pretreatment of the three-component co-digestion mixture frequently led to a reduction in volatile fatty acids (VFAs) within the digestion broth;
  • All the pretreatment methods used resulted in an increase in the degree of liquefaction of organic matter measured by changes in the NPOC;
  • With an increase in the dose of sodium hydroxide, an increase in the NPOC parameter was observed;
  • Iron did not result in statistically significant changes in the NPOC levels;
  • The pretreatment generally did not impact the total solid (TS) and volatile solid (VS) content of the three-component co-digestion mixture;
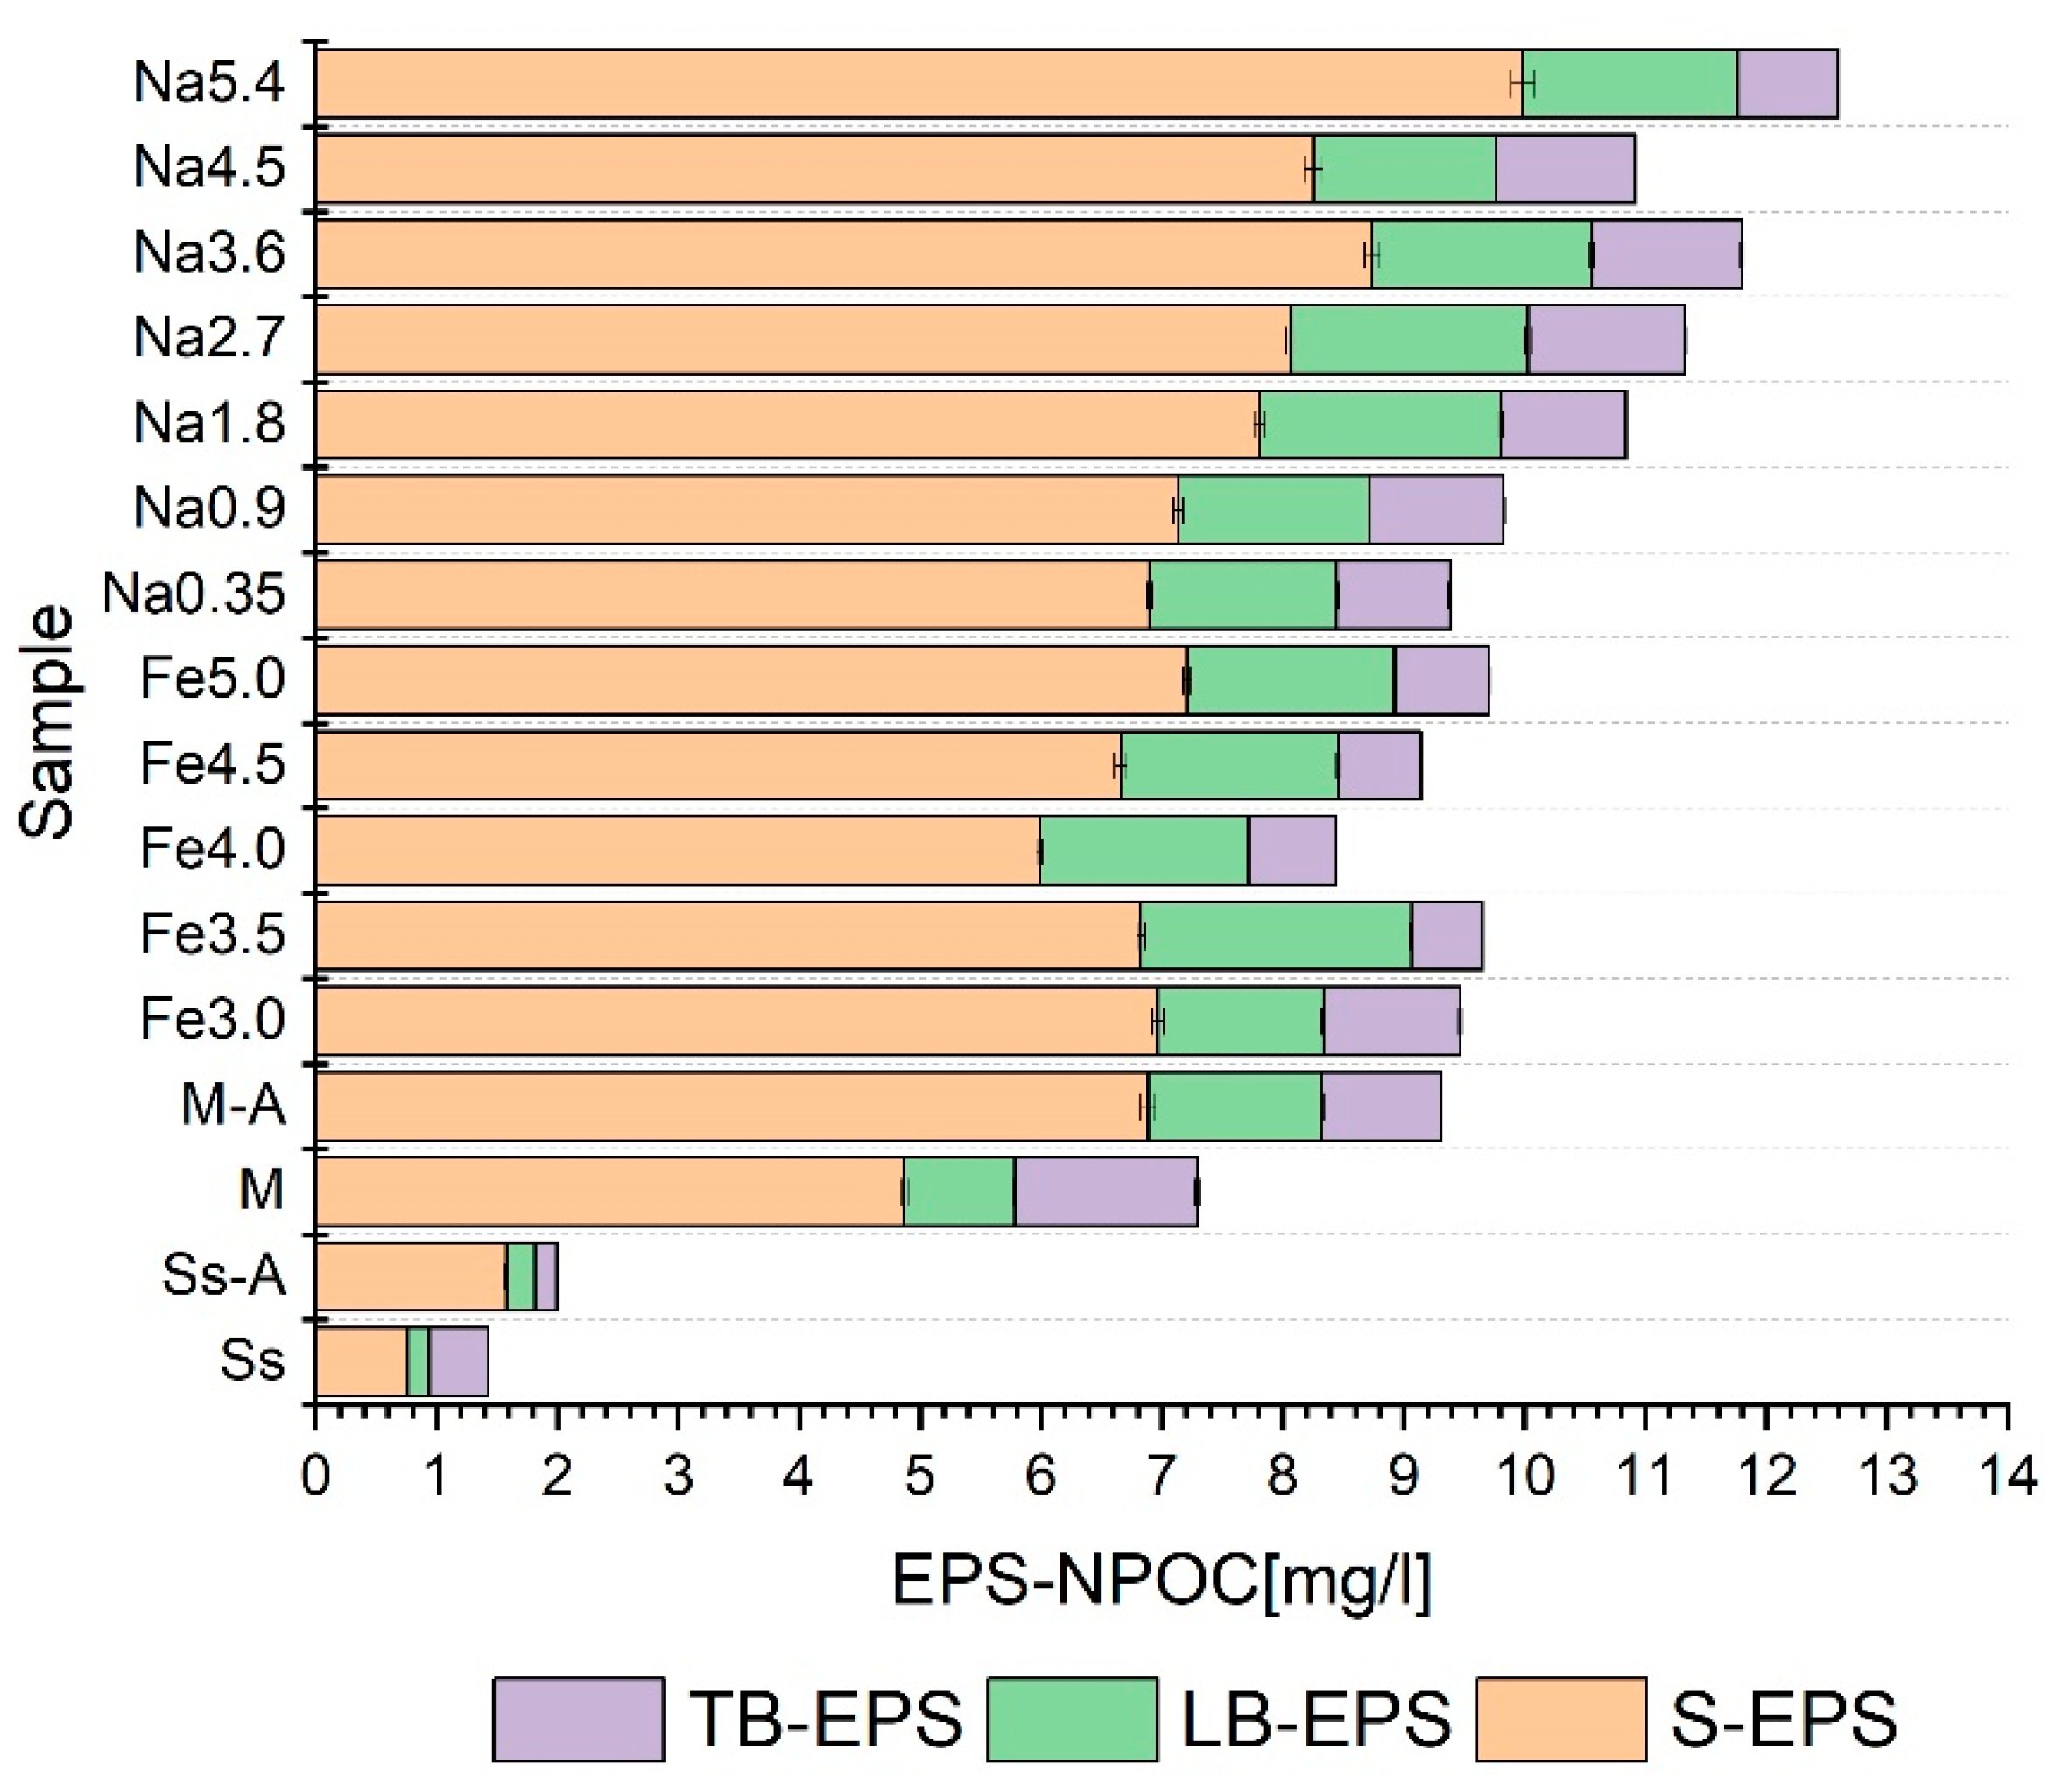
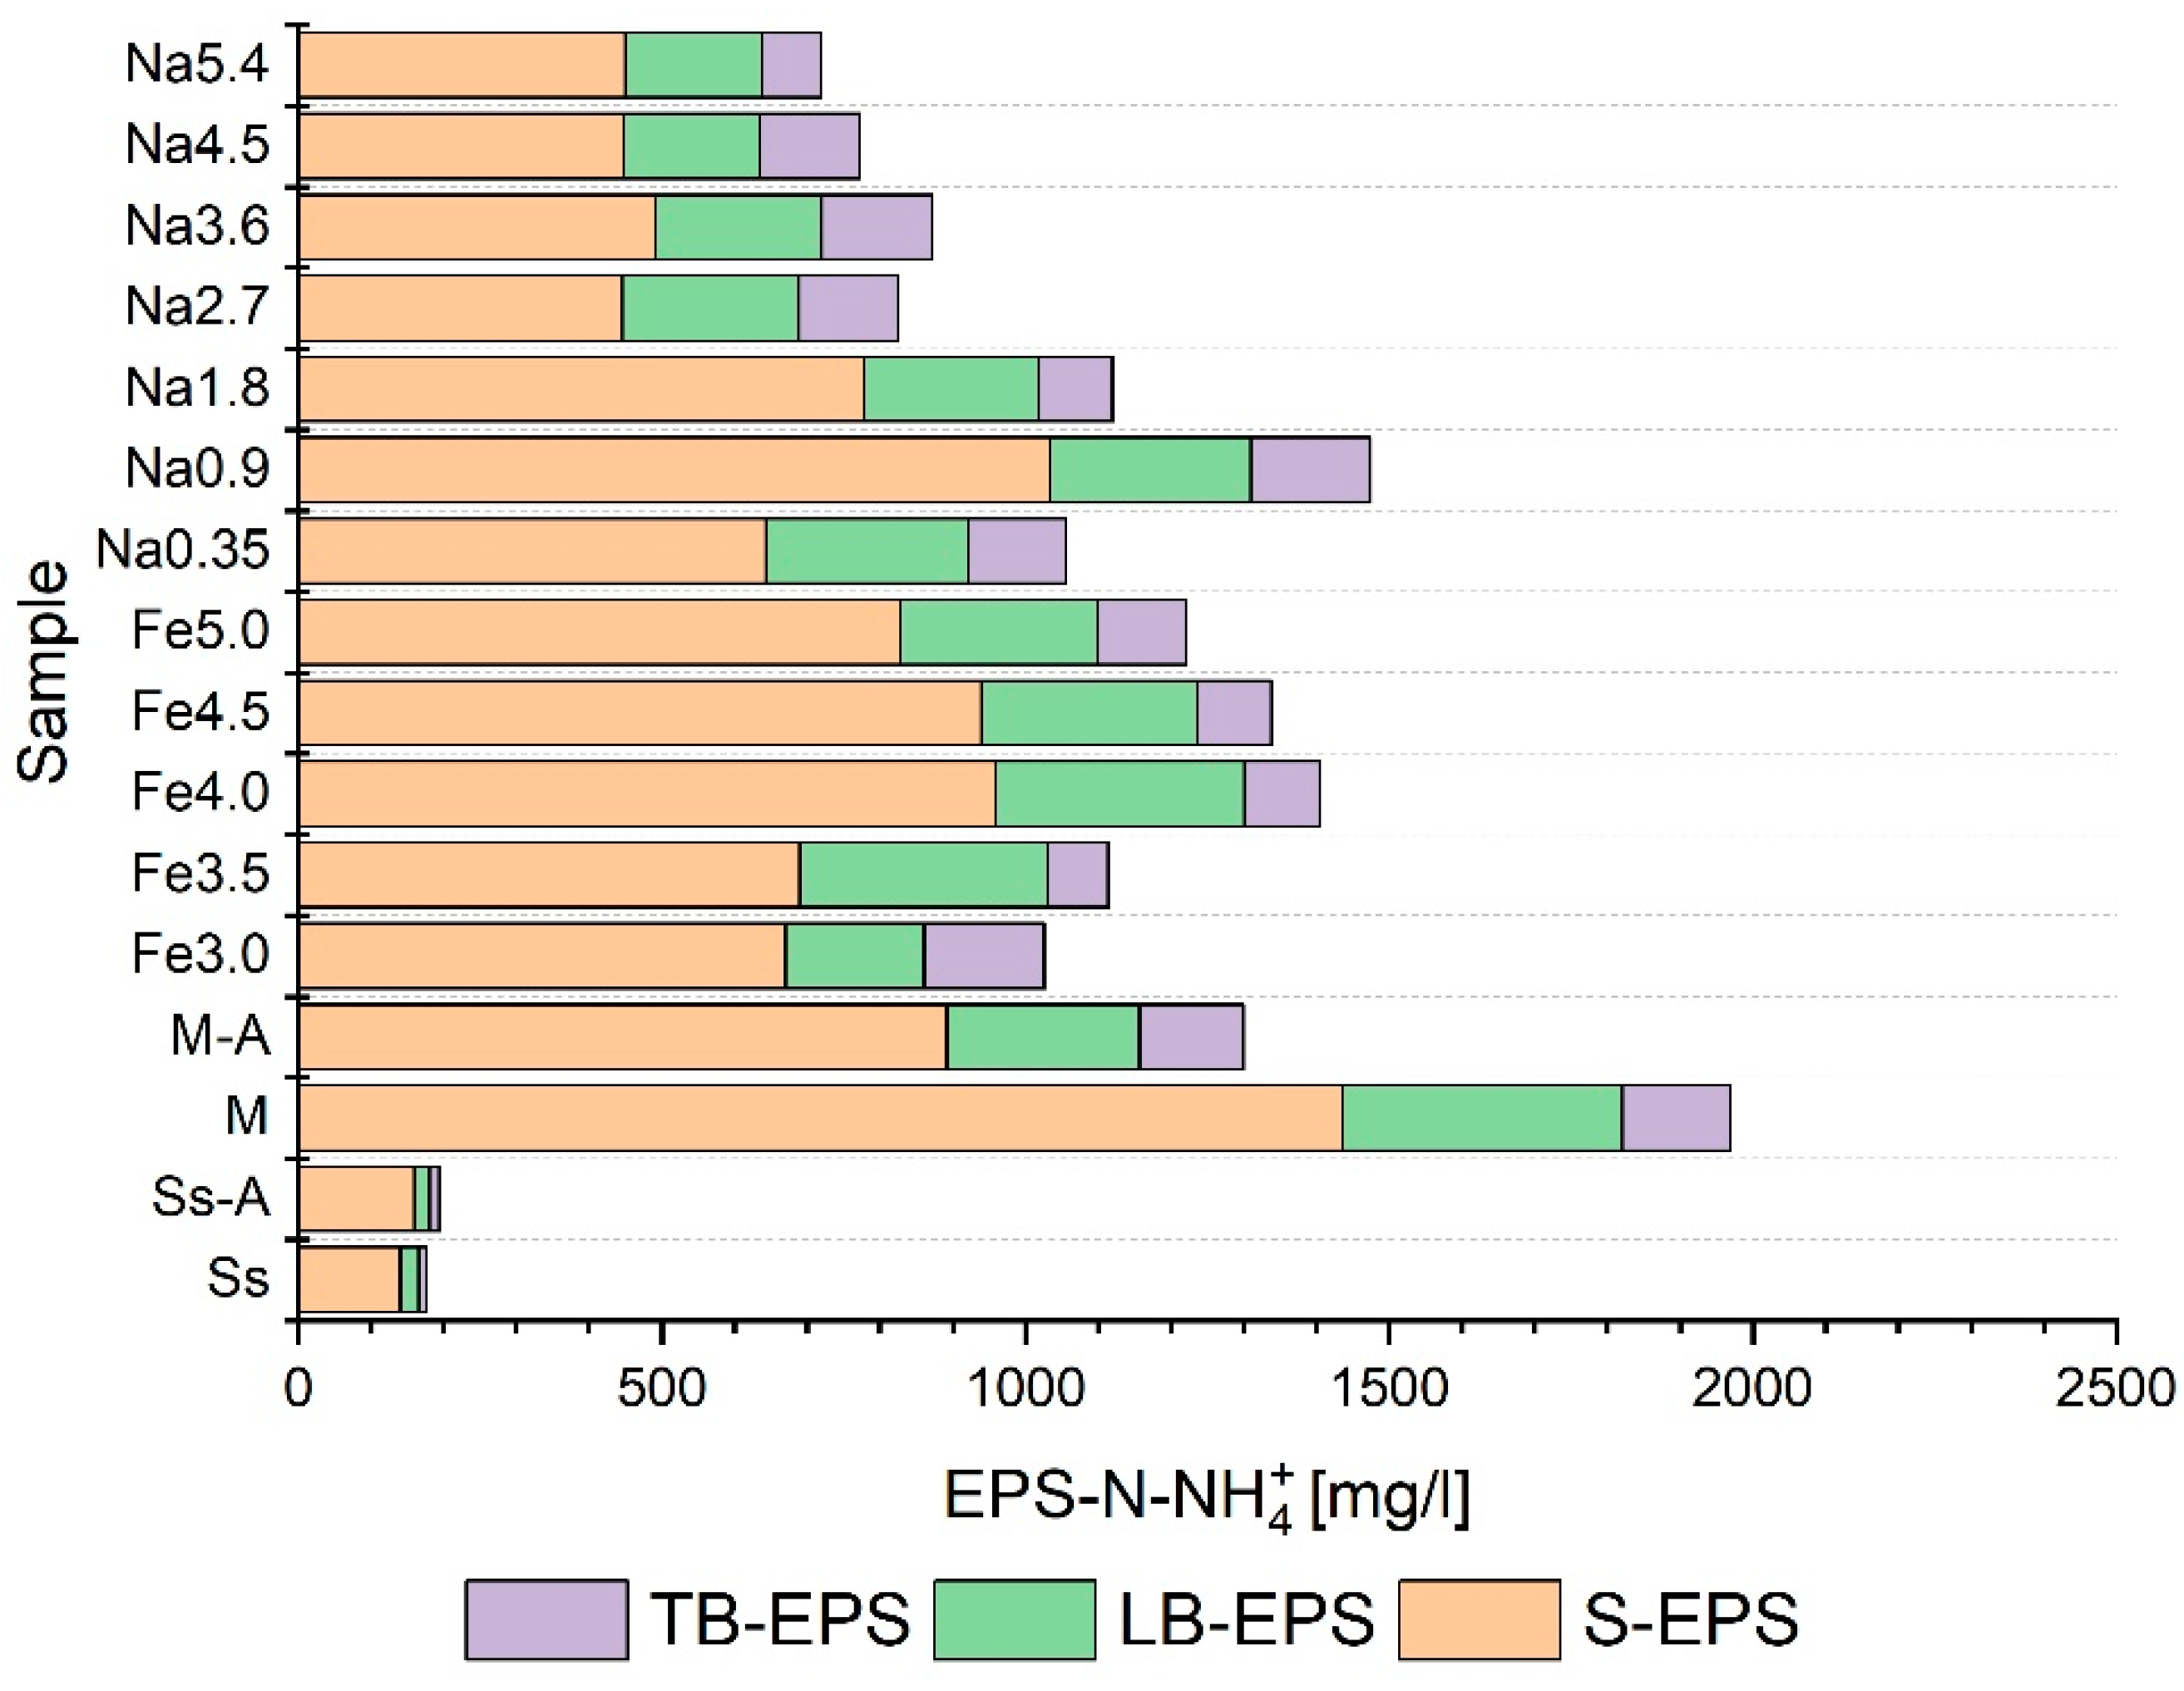
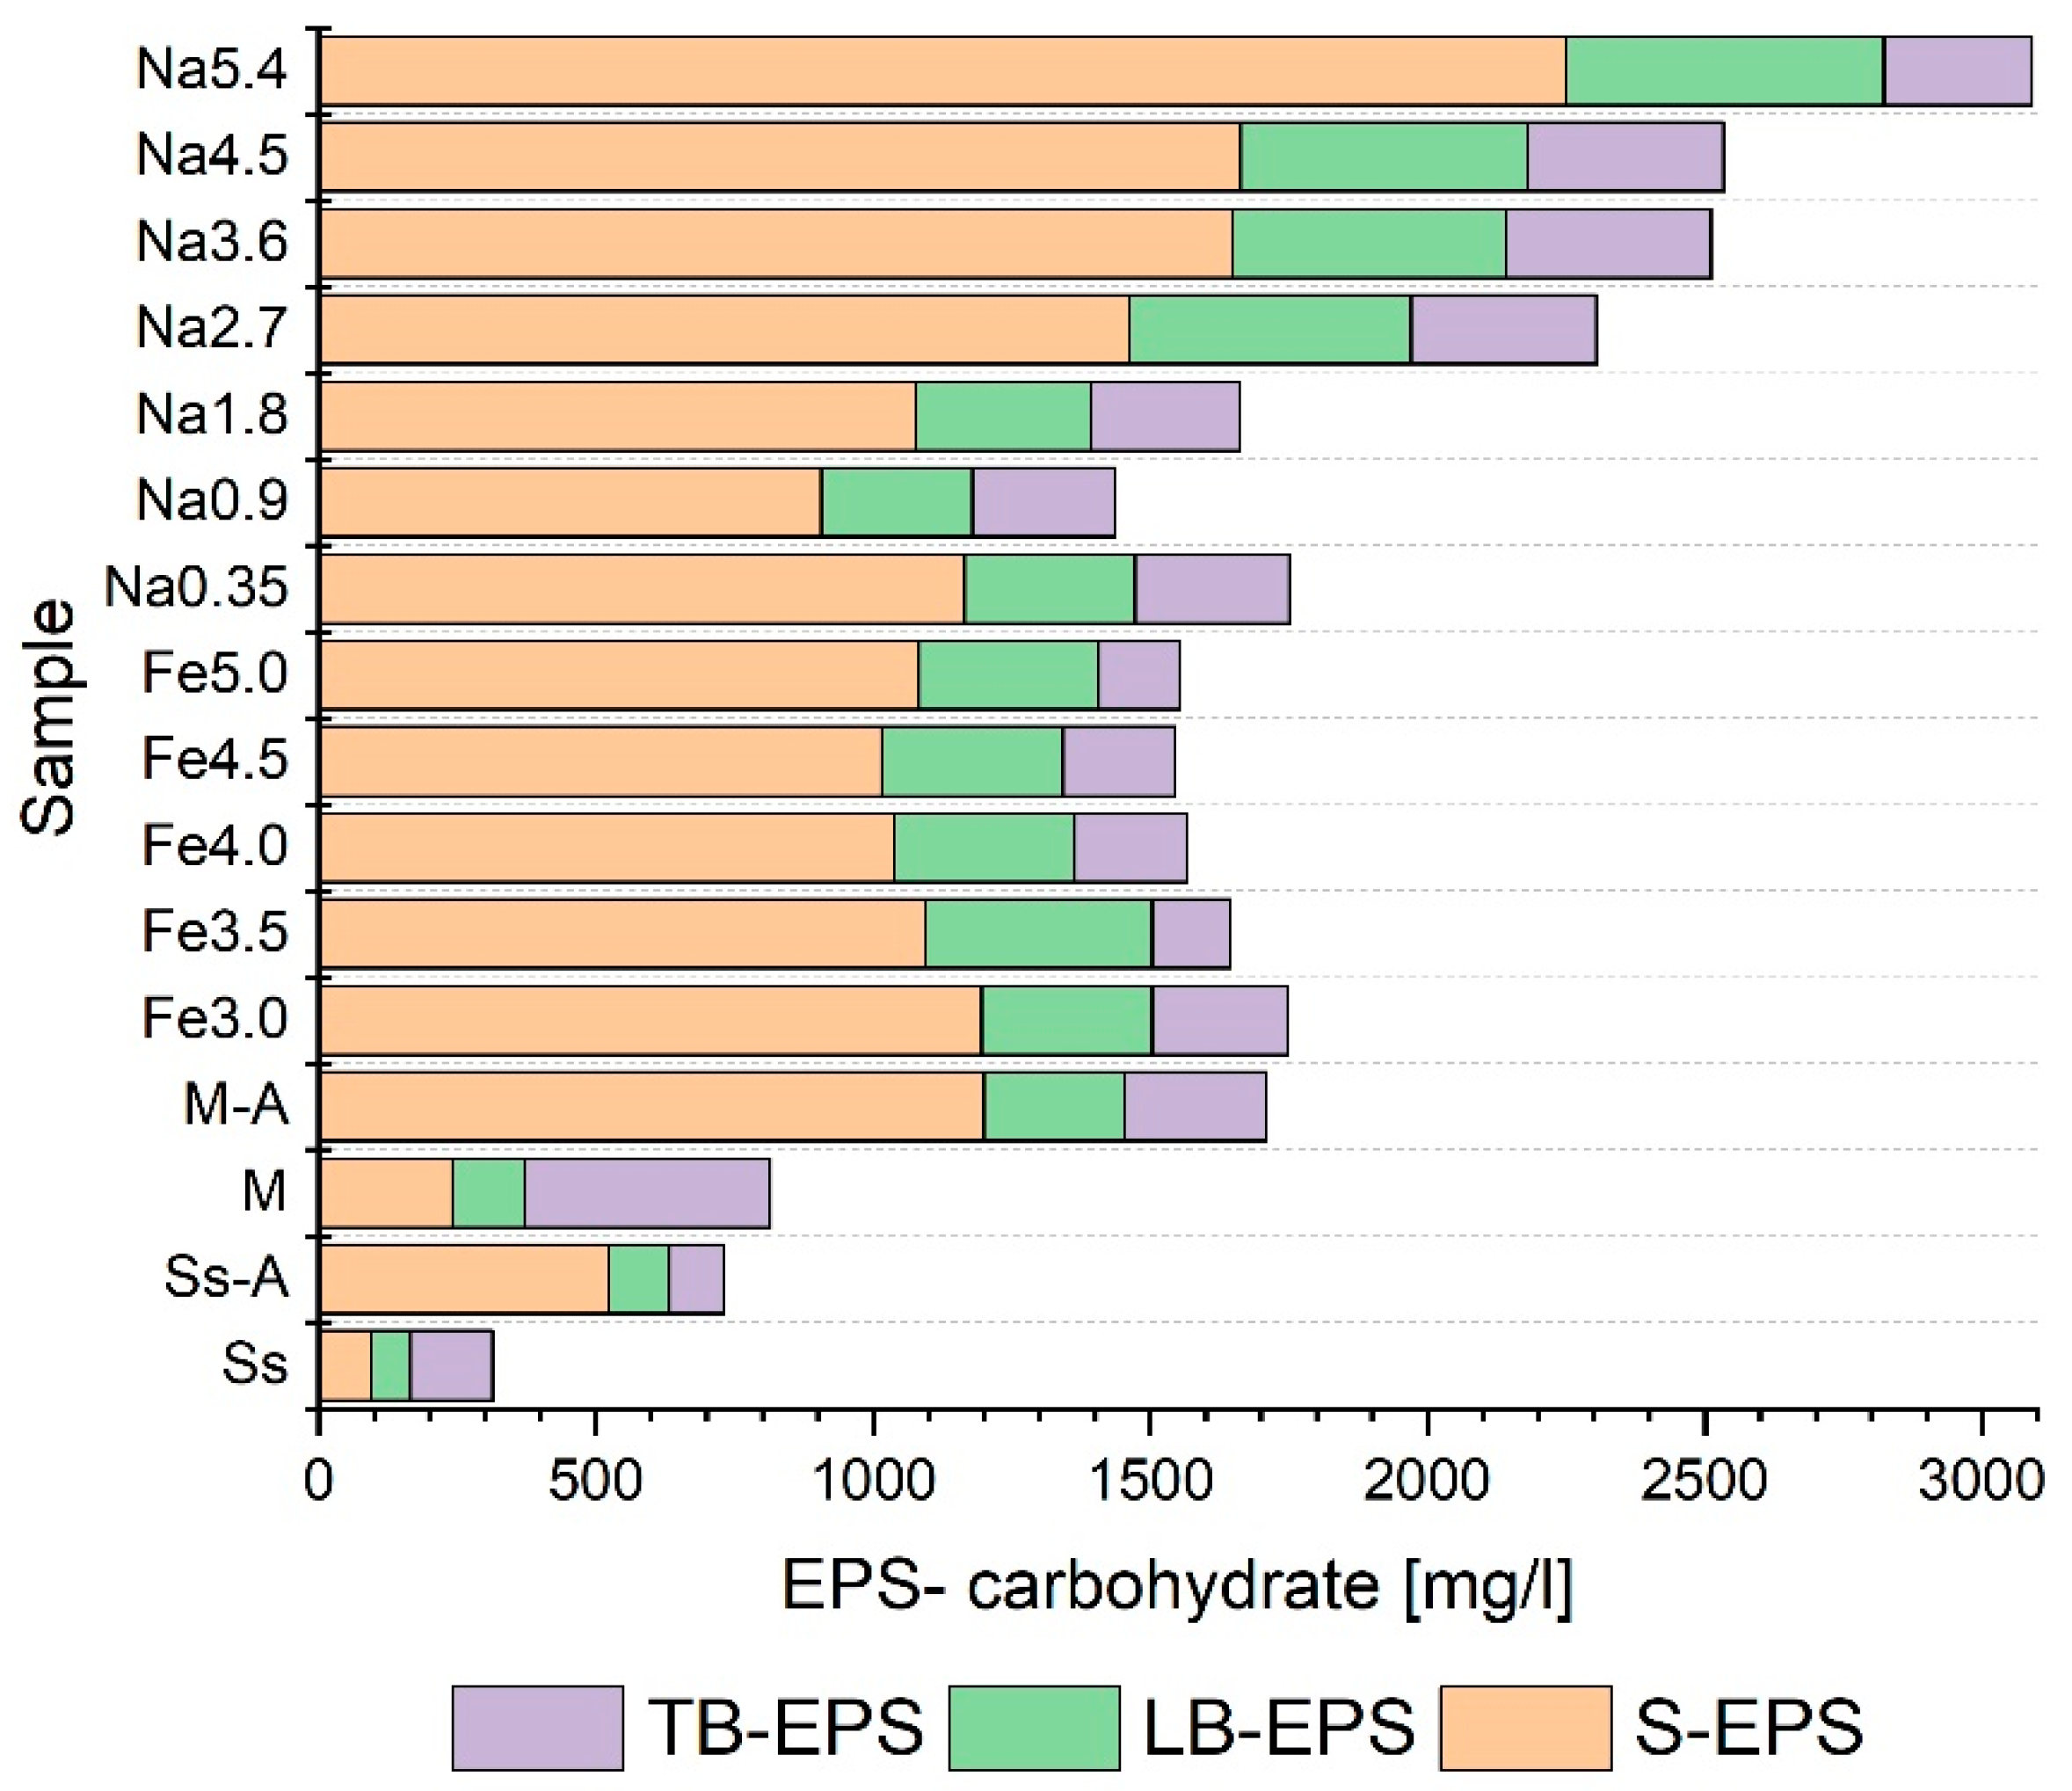
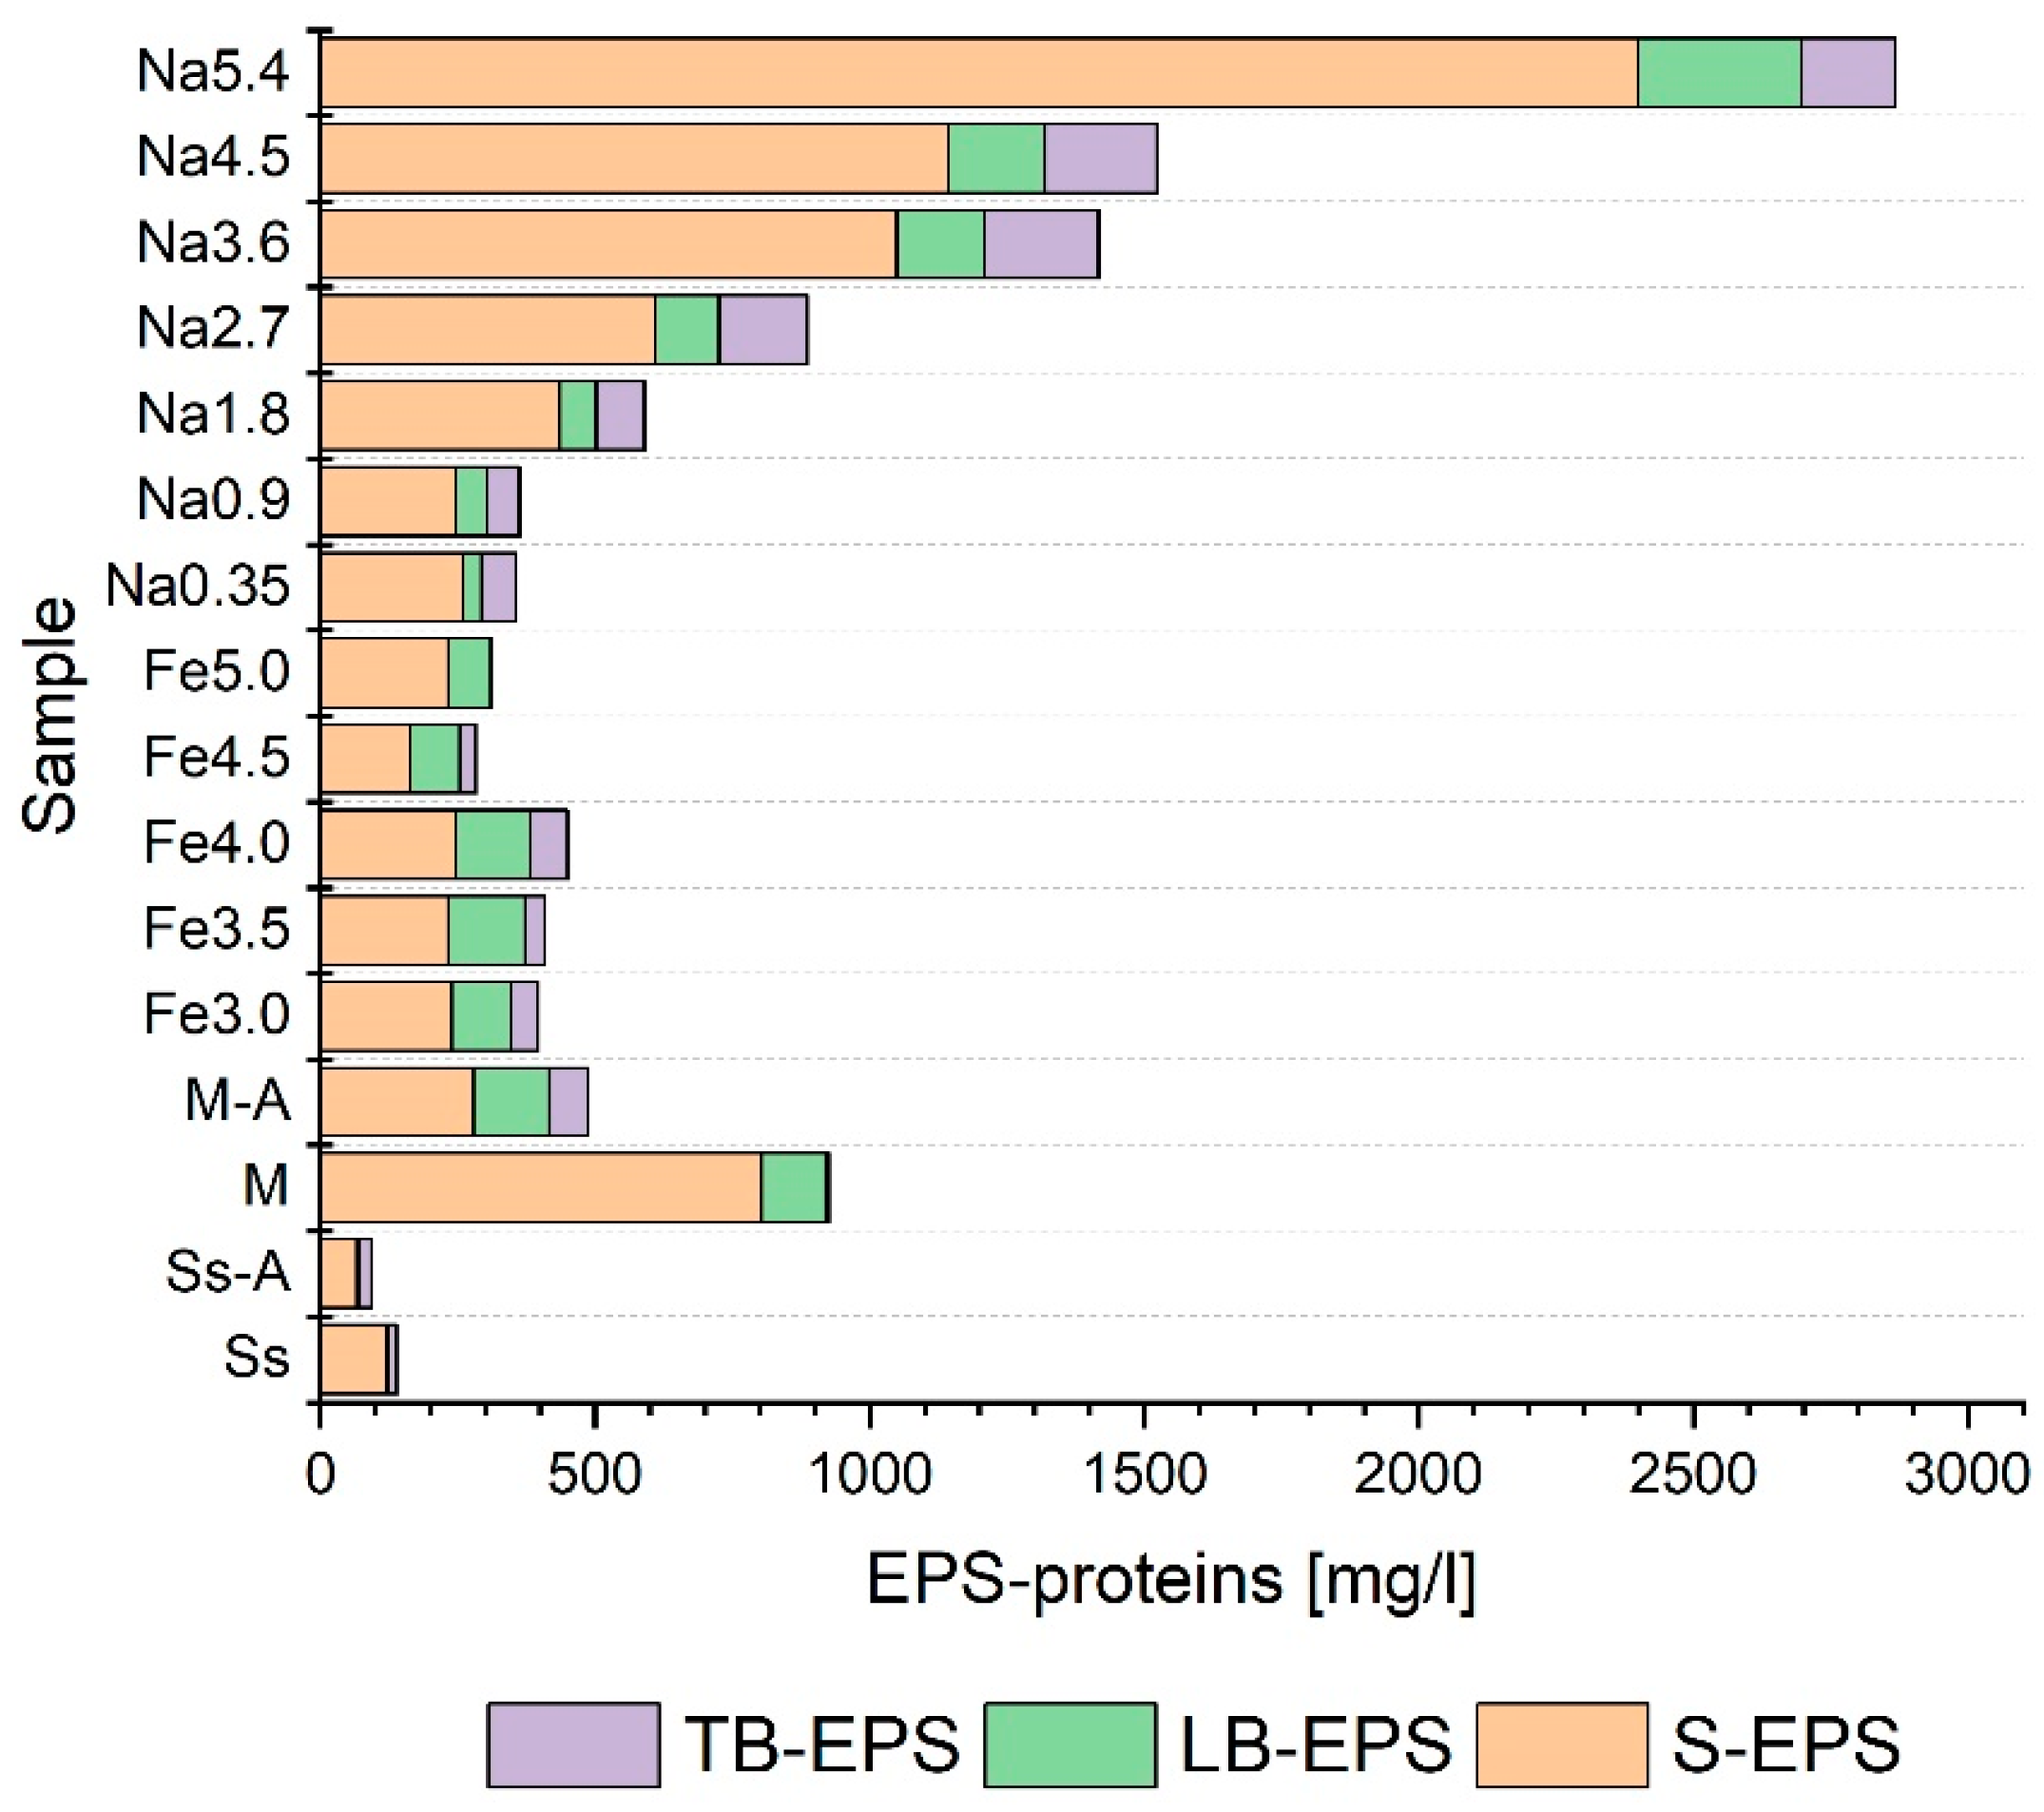
  • The pretreatment methods had a significant statistical impact on the distribution of the analyzed indicators in individual EPS fractions;
  • The samples treated using thermochemical methods exhibited lower total ammonium nitrogen contents in extracellular polymers than the control sample;
  • The use of pretreatment on the co-digestion mixture usually resulted in an increase in the degree of liquefaction of organic matter (measured by changes in NPOC, protein, and carbohydrates) in all the fractions of extracellular polymers;
  • Pretreatment intensifies methane production (for all the tested methods, the methane yield was higher than for the control sample);
  • The most substantial methane yield was observed following thermochemical pretreatment with 4.5 g NaOH/L (501 mL/g VS);
  • An increase in the sodium hydroxide concentration prolonged the adaptation time of microorganisms (lag phase extension);
  • The pretreatment methods used slightly improved VS removal. This indicator compared to the unconditioned co-digestion mixture increased from 50.8 to 52.5%; however, the one-way analysis of variance showed that this change was not statistically significant. It is worth emphasizing that, compared to the AD of sewage sludge itself, for which VS removal is usually around 30–40%, the values obtained in the tests were satisfactory.

Supplementary Materials

The following supporting information can be downloaded at https://www.mdpi.com/article/10.3390/en17112679/s1: Figure S1 Structure of extracellular polymers, based on [76], where SB-EPS-soluble EPS; LB-EPS-loosely bound EPS; TB-EPS-tightly bound EPS Table S1 Tukey test for VFAs result; Table S2 Tukey test for N-NH4+ result; Table S3 Tukey test for NPOC result; Table S4 Tukey test for pH result; Table S5 Tukey test for TS result; Table S6 Tukey test for VS result; Table S7 Results of one-way analysis of variance for ammonium nitrogen content in three fractions of extracellular polymers (EPS-N-NH4+); Table S8 Tukey test for ammonium nitrogen content in SB-EPS; Table S9 Tukey test for ammonium nitrogen content in LB-EPS; Table S10 Tukey test for ammonium nitrogen content in TB-EPS; Table S11 Results of one-way analysis of variance for ammonium nitrogen content in three fractions of extracellular polymers (EPS-N-NH4+); Table S12 Results of one-way analysis of variance for NPOC content in three fractions of extracellular polymers (EPS-NPOC); Table S13 Tukey test for NPOC in SB-EPS; Table S14 Tukey test for NPOC in LB-EPS; Table S15 Tukey test for NPOC in TB-EPS; Table S16 Results of one-way analysis of variance for NPOC content in three fractions of extracellular polymers (EPS-N-NPOC); Table S17 Results of one-way analysis of variance for carbohydrates content in three fractions of extracellular polymers (EPS-NPOC); Table S18 Tukey test for carbohydrates in SB-EPS; Table S19 Tukey test for carbohydrates in LB-EPS; Table S20 Tukey test for carbohydrates in TB-EPS; Table S21 Results of one-way analysis of variance for carbohydrates content in three fractions of extracellular polymers; Table S22 Results of one-way analysis of variance for proteins content in three fractions of extracellular polymers; Table S23 Tukey test for proteins in SB-EPS; Table S24 Tukey test for proteins in LB-EPS; Table S25 Tukey test for proteins in TB-EPS; Table S26 Results of one-way analysis of variance for proteins content in three fractions of extracellular polymers.

Author Contributions

Conceptualization, A.G. and A.J.; methodology, A.G. and A.J.; software, A.G.; validation, A.G. and A.J.; formal analysis, A.G., A.J. and D.P. investigation, A.G., A.J. and D.P. resources, A.G. and E.M.; data curation, A.G., A.J. and D.P.; writing—original draft preparation, A.G., A.J. and D.P.; writing—review and editing, A.G., A.J., E.M. and D.P.; visualization, A.G., A.J. and D.P.; supervision, A.G. and E.M.; project administration, A.G. and E.M. All authors have read and agreed to the published version of the manuscript.

Funding

This research was funded by the European Union’s Horizon 2020 research and innovation program under grant agreement no [773682] and the statute subvention of the Czestochowa University of Technology, Faculty of Infrastructure and Environment, project no BS/PB-400-301/24.

Data Availability Statement

Data are contained within the article.

Acknowledgments

This research work was performed within the joint PhD program between two partner universities, the Czestochowa University of Technology and Ghent University, under the Nutri2Cycle project, which received funding from the European Union’s Horizon 2020.

Conflicts of Interest

The authors declare no conflicts of interest.

References

  1. Kumar, B.; Subrahmanyam, B.; Akhil, P.; Prashanth, B. Biogas: A Renewable Energy for Future. Int. J. Mech. Eng. Res. Dev. 2017, 6. Available online: https://papers.ssrn.com/sol3/papers.cfm?abstract_id=3516504 (accessed on 3 May 2024).
  2. Depren, S.K.; Kartal, M.T.; Çelikdemir, N.Ç.; Depren, Ö. Energy Consumption and Environmental Degradation Nexus: A Systematic Review and Meta-Analysis of Fossil Fuel and Renewable Energy Consumption. Ecol. Inform. 2022, 70, 101747. [Google Scholar] [CrossRef]
  3. Holechek, J.L.; Geli, H.M.E.; Sawalhah, M.N.; Valdez, R. A Global Assessment: Can Renewable Energy Replace Fossil Fuels by 2050? Sustainability 2022, 14, 4792. [Google Scholar] [CrossRef]
  4. Jasińska, A.; Grosser, A.; Meers, E. Possibilities and Limitations of Anaerobic Co-Digestion of Animal Manure—A Critical Review. Energies 2023, 16, 3885. [Google Scholar] [CrossRef]
  5. Maj, I. Significance and Challenges of Poultry Litter and Cattle Manure as Sustainable Fuels: A Review. Energies 2022, 15, 8981. [Google Scholar] [CrossRef]
  6. Bhatnagar, N.; Ryan, D.; Murphy, R.; Enright, A.M. A Comprehensive Review of Green Policy, Anaerobic Digestion of Animal Manure and Chicken Litter Feedstock Potential–Global and Irish Perspective. Renew. Sustain. Energy Rev. 2022, 154, 111884. [Google Scholar] [CrossRef]
  7. Tawfik, A.; Eraky, M.; Osman, A.I.; Ai, P.; Zhou, Z.; Meng, F.; Rooney, D.W. Bioenergy Production from Chicken Manure: A Review. Environ. Chem. Lett. 2023, 21, 2707–2727. [Google Scholar] [CrossRef]
  8. de Oliveira Paranhos, A.G.; Adarme, O.F.H.; Barreto, G.F.; de Queiroz Silva, S.; de Aquino, S.F. Methane Production by Co-Digestion of Poultry Manure and Lignocellulosic Biomass: Kinetic and Energy Assessment. Bioresour. Technol. 2020, 300, 122588. [Google Scholar]
  9. Rahman, M.A.; Shahazi, R.; Nova, S.N.B.; Uddin, M.R.; Hossain, M.S.; Yousuf, A. Biogas Production from Anaerobic Co-Digestion Using Kitchen Waste and Poultry Manure as Substrate—Part 1: Substrate Ratio and Effect of Temperature. Biomass Convers. Biorefin. 2023, 13, 6635–6645. [Google Scholar] [CrossRef]
  10. Rahman, M.A.; Møller, H.B.; Saha, C.K.; Alam, M.M. The Effect of Temperature on the Anaerobic Co-Digestion of Poultry Droppings and Sugar Mill Press Mud. Biofuels 2022, 13, 139–147. [Google Scholar] [CrossRef]
  11. Sillero, L.; Solera, R.; Perez, M. Improvement of the Anaerobic Digestion of Sewage Sludge by Co-Digestion with Wine Vinasse and Poultry Manure: Effect of Different Hydraulic Retention Times. Fuel 2022, 321, 124104. [Google Scholar] [CrossRef]
  12. Bista, U.; Rayamajhi, B.; Dhungana, B.; Lohani, S.P. Biogas Production by Co-Digestion of Food Waste with Sewage Sludge and Poultry Litter: A Way Towards Sustainable Waste-to-Energy Conversion. J. Renew. Energy Environ. 2023, 10, 39–44. [Google Scholar]
  13. Burka, M.S.; Basamykina, A.N.; Kharlamova, M.D. Technological Features of Biogas Production While Anaerobic Co-Digestion of Faecal Sludge, Sewage Sludge and Livestock. In Proceedings of the IOP Conference Series: Earth and Environmental Science; IOP Publishing: Bristol, UK, 2021; Volume 666, p. 42052. [Google Scholar]
  14. Hassan, M.; Aboelenin, S.M.; Soliman, M.M.; Attia, H.F.; Metwally, K.A.; Salem, H.M.; El-Tahan, A.M.; El-Saadony, M.T.; Khalaphallah, R. Biogas Manufacture from Co-Digestion of Untreated Primary Sludge with Raw Chicken Manure under Anaerobic Mesophilic Environmental Conditions. Saudi J. Biol. Sci. 2022, 29, 2969–2977. [Google Scholar]
  15. Okewale, A.O.; Adesina, O.A. Evaluation of Biogas Production from Co-Digestion of Pig Dung, Water Hyacinth and Poultry Droppings. Waste Dispos. Sustain. Energy 2019, 1, 271–277. [Google Scholar] [CrossRef]
  16. Song, L.; Li, D.; Cao, X.; Tang, Y.; Liu, R.; Niu, Q.; Li, Y.-Y. Optimizing Biomethane Production of Mesophilic Chicken Manure and Sheep Manure Digestion: Mono-Digestion and Co-Digestion Kinetic Investigation, Autofluorescence Analysis and Microbial Community Assessment. J. Environ. Manag. 2019, 237, 103–113. [Google Scholar] [CrossRef] [PubMed]
  17. Karki, R.; Chuenchart, W.; Surendra, K.C.; Shrestha, S.; Raskin, L.; Sung, S.; Hashimoto, A.; Kumar Khanal, S. Anaerobic Co-Digestion: Current Status and Perspectives. Bioresour. Technol. 2021, 330, 125001. [Google Scholar] [CrossRef] [PubMed]
  18. Ibro, M.K.; Ancha, V.R.; Lemma, D.B. Impacts of Anaerobic Co-Digestion on Different Influencing Parameters: A Critical Review. Sustainability 2022, 14, 9387. [Google Scholar] [CrossRef]
  19. Kadam, R.; Jo, S.; Lee, J.; Khanthong, K.; Jang, H.; Park, J. A Review on the Anaerobic Co-Digestion of Livestock Manures in the Context of Sustainable Waste Management. Energies 2024, 17, 546. [Google Scholar] [CrossRef]
  20. Jasińska, A.; Grosser, A.; Meers, E.; Robles, A. Energy Recovery from Poultry Manure in the Process of Semi-Continuous Anaerobic Co-Digestion with Sewage Sludge. [CrossRef]
  21. Obileke, K.; Nwokolo, N.; Makaka, G.; Mukumba, P.; Onyeaka, H. Anaerobic Digestion: Technology for Biogas Production as a Source of Renewable Energy—A Review. Energy Environ. 2021, 32, 191–225. [Google Scholar] [CrossRef]
  22. Lisowyj, M.; Wright, M.M. A Review of Biogas and an Assessment of Its Economic Impact and Future Role as a Renewable Energy Source. Rev. Chem. Eng. 2020, 36, 401–421. [Google Scholar] [CrossRef]
  23. Atelge, M.R.; Atabani, A.E.; Banu, J.R.; Krisa, D.; Kaya, M.; Eskicioglu, C.; Kumar, G.; Lee, C.; Yildiz, Y.Ş.; Unalan, S. A Critical Review of Pretreatment Technologies to Enhance Anaerobic Digestion and Energy Recovery. Fuel 2020, 270, 117494. [Google Scholar] [CrossRef]
  24. Nguyen, V.K.; Chaudhary, D.K.; Dahal, R.H.; Trinh, N.H.; Kim, J.; Chang, S.W.; Hong, Y.; La, D.D.; Nguyen, X.C.; Ngo, H.H. Review on Pretreatment Techniques to Improve Anaerobic Digestion of Sewage Sludge. Fuel 2021, 285, 119105. [Google Scholar] [CrossRef]
  25. Kasinath, A.; Fudala-Ksiazek, S.; Szopinska, M.; Bylinski, H.; Artichowicz, W.; Remiszewska-Skwarek, A.; Luczkiewicz, A. Biomass in Biogas Production: Pretreatment and Codigestion. Renew. Sustain. Energy Rev. 2021, 150, 111509. [Google Scholar] [CrossRef]
  26. Kumar, B.; Bhardwaj, N.; Agrawal, K.; Chaturvedi, V.; Verma, P. Current Perspective on Pretreatment Technologies Using Lignocellulosic Biomass: An Emerging Biorefinery Concept. Fuel Process. Technol. 2020, 199. [Google Scholar] [CrossRef]
  27. Grosser, A. Determination of Methane Potential of Mixtures Composed of Sewage Sludge, Organic Fraction of Municipal Waste and Grease Trap Sludge Using Biochemical Methane Potential Assays. A Comparison of BMP Tests and Semi-Continuous Trial Results. Energy 2018, 143, 488–499. [Google Scholar] [CrossRef]
  28. Grosser, A.; Neczaj, E. Sewage Sludge and Fat Rich Materials Co-Digestion-Performance and Energy Potential. J. Clean. Prod. 2018, 198, 1076–1089. [Google Scholar] [CrossRef]
  29. Grosser, A. The Influence of Decreased Hydraulic Retention Time on the Performance and Stability of Co-Digestion of Sewage Sludge with Grease Trap Sludge and Organic Fraction of Municipal Waste. J. Environ. Manage. 2017, 203, 1143–1157. [Google Scholar] [CrossRef] [PubMed]
  30. American Public Health Association. APHA Standard Methods for the Examination of Water and Wastewater; American Public Health Association: Washington, DC, USA, 1999. [Google Scholar]
  31. Schillak, R. Oznaczanie Azotu Mineralnego w Glebie. Rocz. Glebozn. 1958, 7, 185–189. [Google Scholar]
  32. Yang, Z.; Kang, X.; Chen, B.; Qiu, G.; Wei, J.; Li, F.; Wei, C. Effects of Alkali, Autoclaving, and Fe+ Autoclaving Pretreatment on Anaerobic Digestion Performance of Coking Sludge from the Perspective of Sludge Extracts and Methane Production. Environ. Sci. Pollut. Res. 2020, 28, 13151–13161. [Google Scholar] [CrossRef]
  33. Nielsen, S.S.; Nielsen, S.S. Total Carbohydrate by Phenol-Sulfuric Acid Method. Food Anal. Lab. Man. 2017, 137–141. [Google Scholar]
  34. Ebner, J.H.; Labatut, R.A.; Lodge, J.S.; Williamson, A.A.; Trabold, T.A. Anaerobic Co-Digestion of Commercial Food Waste and Dairy Manure: Characterizing Biochemical Parameters and Synergistic Effects. Waste Manag. 2016, 52, 286–294. [Google Scholar] [CrossRef] [PubMed]
  35. Orlando, M.Q.; Borja, V.M. Pretreatment of Animal Manure Biomass to Improve Biogas Production: A Review. Energies 2020, 13, 3573. [Google Scholar] [CrossRef]
  36. Koch, K.; Hafner, S.D.; Weinrich, S.; Astals, S.; Holliger, C. Power and Limitations of Biochemical Methane Potential (BMP) Tests. Front. Energy Res. 2020, 8, 63. [Google Scholar] [CrossRef]
  37. Pearse, L.F.; Hettiaratchi, J.P.; Kumar, S. Towards Developing a Representative Biochemical Methane Potential (BMP) Assay for Landfilled Municipal Solid Waste–A Review. Bioresour. Technol. 2018, 254, 312–324. [Google Scholar] [CrossRef] [PubMed]
  38. Filer, J.; Ding, H.H.; Chang, S. Biochemical Methane Potential (BMP) Assay Method for Anaerobic Digestion Research. Water 2019, 11, 921. [Google Scholar] [CrossRef]
  39. Al-Iraqi, A.R.; Gandhi, B.P.; Folkard, A.M.; Barker, P.A.; Semple, K.T. Influence of Inoculum to Substrate Ratio and Substrates Mixing Ratio on Biogas Production from the Anaerobic Co-Digestion of Phragmites Australis and Food Waste. Bioenergy Res. 2023, 17, 1277–1287. [Google Scholar] [CrossRef]
  40. Agrawal, A.; Chaudhari, P.K.; Ghosh, P. Effect of Inoculums Type and Optimization of Inoculum to Substrate Ratio on the Kinetics of Biogas Production of Fruit and Vegetable Waste. Environ. Eng. Res. 2024, 29, 220518. [Google Scholar] [CrossRef]
  41. Chamchoi, N.; Garcia, H.; Angelidaki, I. Methane Potential of Household Waste; Batch Assays Determination. Appl. Environ. Res. 2010, 33, 13–26. [Google Scholar]
  42. Elsayed, M.; Andres, Y.; Blel, W.; Hassan, R.; Ahmed, A. Effect of Inoculum VS, Organic Loads and I/S on the Biochemical Methane Potential of Sludge, Buckwheat Husk and Straw. Desalin. Water Treat. 2019, 157, 69–78. [Google Scholar] [CrossRef]
  43. Raposo, F.; Fernández-Cegrí, V.; de la Rubia, M.A.; Borja, R.; Béline, F.; Cavinato, C.; Demirer, G.; Fernández, B.; Fernández-Polanco, M.; Frigon, J.C.; et al. Biochemical Methane Potential (BMP) of Solid Organic Substrates: Evaluation of Anaerobic Biodegradability Using Data from an International Interlaboratory Study. J. Chem. Technol. Biotechnol. 2011, 86, 1088–1098. [Google Scholar] [CrossRef]
  44. Directive 2008/98/EC of the European Parliament and of the Council of 19 November 2008 on Waste and Repealing Certain Directives; OJ L 312, 22.11.2008, p. 0003–0030. Available online: https://eur-lex.europa.eu/legal-content/EN/TXT/?uri=celex%3A32008L0098 (accessed on 3 May 2024).
  45. Seok, J.; Lee, Y.Y.; Hyun, T. Bioresource Technology A Review on Alkaline Pretreatment Technology for Bioconversion of Lignocellulosic Biomass. Bioresour. Technol. 2016, 199, 42–48. [Google Scholar] [CrossRef] [PubMed]
  46. Appels, L.; Baeyens, J.; Degrève, J.; Dewil, R. Principles and Potential of the Anaerobic Digestion of Waste-Activated Sludge. Prog. Energy Combust. Sci. 2008, 34, 755–781. [Google Scholar] [CrossRef]
  47. Zhang, J.; Qu, Y.; Qi, Q.; Zhang, P.; Zhang, Y.; Tong, Y.W.; He, Y. The Bio-Chemical Cycle of Iron and the Function Induced by ZVI Addition in Anaerobic Digestion: A Review. Water Res. 2020, 186, 116405. [Google Scholar] [CrossRef] [PubMed]
  48. Baek, G.; Kim, J.; Lee, C. A Review of the Effects of Iron Compounds on Methanogenesis in Anaerobic Environments. Renew. Sustain. Energy Rev. 2019, 113, 109282. [Google Scholar] [CrossRef]
  49. Liu, X.; Xu, Q.; Wang, D.; Yang, Q.; Wu, Y.; Li, Y.; Fu, Q.; Yang, F.; Liu, Y.; Ni, B.J.; et al. Thermal-Alkaline Pretreatment of Polyacrylamide Flocculated Waste Activated Sludge: Process Optimization and Effects on Anaerobic Digestion and Polyacrylamide Degradation. Bioresour. Technol. 2019, 281, 158–167. [Google Scholar] [CrossRef] [PubMed]
  50. Mehari, B.B.; Chang, S.; Hong, Y.; Chen, H. Temperature-Phased Biological Hydrolysis and Thermal Hydrolysis Pretreatment for Anaerobic Digestion Performance Enhancement. Water 2018, 10, 1812. [Google Scholar] [CrossRef]
  51. Rahman, A.; Bjarne, H.; Kumer, C.; Alam, M.; Wahid, R.; Feng, L. Anaerobic Co-Digestion of Poultry Droppings and Briquetted Wheat Straw at Mesophilic and Thermophilic Conditions: In Fl Uence of Alkali Pretreatment. Renew. Energy 2018, 128, 241–249. [Google Scholar] [CrossRef]
  52. Huang, L.; Jin, Y.; Zhou, D.; Liu, L.; Huang, S.; Zhao, Y.; Chen, Y. A Review of the Role of Extracellular Polymeric Substances (EPS) in Wastewater Treatment Systems. Int. J. Environ. Res. Public Health 2022, 19, 12191. [Google Scholar] [CrossRef] [PubMed]
  53. Salama, Y.; Chennaoui, M.; Sylla, A.; Mountadar, M.; Rihani, M.; Assobhei, O. Characterization, Structure, and Function of Extracellular Polymeric Substances (EPS) of Microbial Biofilm in Biological Wastewater Treatment Systems: A Review. Desalin. Water Treat. 2016, 57, 16220–16237. [Google Scholar] [CrossRef]
  54. Shi, Y.; Huang, J.; Zeng, G.; Gu, Y.; Chen, Y.; Hu, Y.; Tang, B.; Zhou, J.; Yang, Y.; Shi, L. Exploiting Extracellular Polymeric Substances (EPS) Controlling Strategies for Performance Enhancement of Biological Wastewater Treatments: An Overview. Chemosphere 2017, 180, 396–411. [Google Scholar] [CrossRef]
  55. Park, J.; Cayetano, R.D.A.; Kim, G.B.; Jo, Y.; Kwon, Y.; Lei, Z.; Kim, S.H. Sludge Disintegration and Anaerobic Digestion Enhancement by Alkaline-Thermal Pretreatment: Economic Evaluation and Microbial Population Analysis. Bioresour. Technol. 2022, 346, 126594. [Google Scholar] [CrossRef]
  56. Awe, O.W.; Lu, J.; Wu, S.; Zhao, Y.; Nzihou, A.; Lyczko, N.; Minh, D.P. Effect of Oil Content on Biogas Production, Process Performance and Stability of Food Waste Anaerobic Digestion. Waste Biomass Valorization 2018, 9, 2295–2306. [Google Scholar] [CrossRef]
  57. Diamantis, V.; Eftaxias, A.; Stamatelatou, K.; Noutsopoulos, C.; Vlachokostas, C.; Aivasidis, A. Bioenergy in the Era of Circular Economy: Anaerobic Digestion Technological Solutions to Produce Biogas from Lipid-Rich Wastes. Renew. Energy 2021, 168, 438–447. [Google Scholar] [CrossRef]
  58. Salama, E.S.; Saha, S.; Kurade, M.B.; Dev, S.; Chang, S.W.; Jeon, B.H. Recent Trends in Anaerobic Co-Digestion: Fat, Oil, and Grease (FOG) for Enhanced Biomethanation. Prog. Energy Combust. Sci. 2019, 70, 22–42. [Google Scholar] [CrossRef]
  59. Konkol, I.; Świerczek, L.; Cenian, A. Chicken Manure Pretreatment for Enhancing Biogas and Methane Production. Energies 2023, 16, 5442. [Google Scholar] [CrossRef]
  60. Zahan, Z.; Othman, M.Z. Bioresource Technology E Ff Ect of Pre-Treatment on Sequential Anaerobic Co-Digestion of Chicken Litter with Agricultural and Food Wastes under Semi-Solid Conditions and Comparison with Wet Anaerobic Digestion. Bioresour. Technol. 2019, 281, 286–295. [Google Scholar] [CrossRef]
  61. Costa, J.C.; Barbosa, S.G.; Alves, M.M.; Sousa, D.Z. Thermochemical Pre- and Biological Co-Treatments to Improve Hydrolysis and Methane Production from Poultry Litter. Bioresour. Technol. 2012, 111, 141–147. [Google Scholar] [CrossRef]
  62. Deepanraj, B.; Sivasubramanian, V.; Jayaraj, S. Effect of Substrate Pretreatment on Biogas Production through Anaerobic Digestion of Food Waste. Int. J. Hydrogen Energy 2017, 42, 26522–26528. [Google Scholar] [CrossRef]
  63. Ahamed, J.U.; Raiyan, M.F.; Hossain, M.S.; Rahman, M.M.; Salam, B. Production of Biogas from Anaerobic Digestion of Poultry Droppings and Domestic Waste Using Catalytic Effect of Silica Gel. Int. J. Automot. Mech. Eng. 2016, 13, 3503–3517. [Google Scholar] [CrossRef]
  64. Schumacher, B.; Wedwitschka, H.; Weinrich, S.; Mühlenberg, J.; Gallegos, D.; Oehmichen, K.; Liebetrau, J. The Influence of Pressure Swing Conditioning Pre-Treatment of Chicken Manure on Nitrogen Content and Methane Yield. Renew. Energy 2019, 143, 1554–1565. [Google Scholar] [CrossRef]
  65. Yin, D.M.; Qiao, W.; Negri, C.; Adani, F.; Fan, R.; Dong, R.J. Enhancing Hyper-Thermophilic Hydrolysis Pre-Treatment of Chicken Manure for Biogas Production by in-Situ Gas Phase Ammonia Stripping. Bioresour. Technol. 2019, 287, 121470. [Google Scholar] [CrossRef]
  66. Raju, C.S.; Sutaryo, S.; Ward, A.J.; Møller, H.B. Effects of High-Temperature Isochoric Pre-Treatment on the Methane Yields of Cattle, Pig and Chicken Manure. Environ. Technol. 2013, 34, 239–244. [Google Scholar] [CrossRef]
  67. Nava-Valente, N.; Hernández-Aguilar, E.; Alvarado-Lassman, A.; Méndez-Contreras, J.M. Effect of Acid Pretreatment on the Anaerobic Codigestion of Sewage Sludge, Chicken Litter, and Sugarcane Waste (SCW) for Biogas Production. Bioenergy Res. 2023, 16, 1889–1901. [Google Scholar] [CrossRef]
  68. Alkhrissat, T.; Kassab, G.; Abdel-Jaber, M. Impact of Iron Oxide Nanoparticles on Anaerobic Co-Digestion of Cow Manure and Sewage Sludge. Energies 2023, 16, 5844. [Google Scholar] [CrossRef]
  69. Mansour, M.N.; Lendormi, T.; Louka, N.; Maroun, R.G.; Hobaika, Z.; Lanoisellé, J.L. Anaerobic Digestion of Poultry Droppings in Semi-Continuous Mode and Effect of Their Co-Digestion with Physico-Chemical Sludge on Methane Yield. Sustainability 2023, 15, 5997. [Google Scholar] [CrossRef]
  70. Almomani, F.; Bhosale, R.R. Enhancing the Production of Biogas through Anaerobic Co-Digestion of Agricultural Waste and Chemical Pre-Treatments. Chemosphere 2020, 255, 126805. [Google Scholar] [CrossRef]
  71. Wu, K.; Xu, W.; Lu, J.; Wang, C.; Liao, J.; He, X. Saponification with Calcium Enhanced Methane Yield in Anaerobic Digestion of Fat, Oil, and Grease: The Essential Role of Calcium. Renew. Energy 2022, 195, 1103–1112. [Google Scholar] [CrossRef]
  72. Aromolaran, A.; Sartaj, M.; Abdallah, M. Supplemental Sewage Scum and Organic Municipal Solid Waste Addition to the Anaerobic Digestion of Thickened Waste Activated Sludge: Biomethane Potential and Microbiome Analysis. Fermentation 2023, 9, 237. [Google Scholar] [CrossRef]
  73. Grosser, A.; Grobelak, A.; Rorat, A.; Courtois, P.; Vandenbulcke, F.; Lemière, S.; Guyoneaud, R.; Attard, E.; Celary, P. Effects of Silver Nanoparticles on Performance of Anaerobic Digestion of Sewage Sludge and Associated Microbial Communities. Renew. Energy 2021, 171, 1014–1025. [Google Scholar] [CrossRef]
  74. Şenol, H.; Açıkel, Ü.; Demir, S.; Oda, V. Anaerobic Digestion of Cattle Manure, Corn Silage and Sugar Beet Pulp Mixtures after Thermal Pretreatment and Kinetic Modeling Study. Fuel 2020, 263, 116651. [Google Scholar] [CrossRef]
  75. Yu, Q.; Cui, S.; Sun, C.; Liu, R.; Sarker, M.; Guo, Z.; Lai, R. Synergistic Effects of Anaerobic Co-Digestion of Pretreated Corn Stover with Chicken Manure and Its Kinetics. Appl. Biochem. Biotechnol. 2021, 193, 515–532. [Google Scholar] [CrossRef] [PubMed]
  76. Lan, B.; Jin, R.; Liu, G.; Dong, B.; Zhou, J.; Xing, D. Improving Waste Activated Sludge Dewaterability with Sodium Periodate Pre-oxidation on Extracellular Polymeric Substances. Water Environ. Res. 2021, 93, 1680–1689. [Google Scholar] [CrossRef] [PubMed]
Figure 1. Scheme of this experiment.
Energies 17 02679 g001
Figure 2. The influence of the pretreatment methods on selected indicators: (a) VFAs; (b) N-NH4+; (c) NPOC; (d) pH; (e) TS; and (f) VS. Ss—untreated sewage sludge; Ss-A—sewage sludge treated with a thermal method; M—untreated co-digestion mixture of sewage sludge, poultry manure, and grease trap sludge (control sample); M-A—co-digestion mixture treated with the thermal method; Fe3, Fe3.5, Fe4, Fe4.5, and Fe5—co-digestion mixture treated with the thermochemical methods with iron addition, where the digit is the amount of iron used in the study, i.e., respectively, 3, 3.5, 4, 4.5, and 5 g/L; Na0.35, Na0.9, Na1.8, Na2.7, Na3.6, Na4.5, and Na5.4—co-digestion mixture treated with the thermochemical methods with NaOH addition, where the digit is the amount of NaOH used in the study, i.e., respectively, 0.35, 0.9, 1.8, 2.7, 3.6, 4.5, and 5.4 g/L.
Energies 17 02679 g002
Figure 3. The influence of the pretreatment methods on the composition of the EPS measurement of changes in the NPOC concentration. SB-EPS—soluble EPS; LB-EPS—loosely bound EPS; TB-EPS—tightly bound EPS; Ss—untreated sewage sludge; Ss-A—sewage sludge treated with the thermal method; M—untreated co-digestion mixture of sewage sludge, poultry manure, and grease trap sludge (control sample); M-A—co-digestion mixture treated with the thermal method; Fe3 Fe3.5, Fe4, Fe4.5, and Fe5—co-digestion mixture treated with the thermochemical methods with iron addition, where the digit is the amount of iron used in the study, i.e., respectively, 3, 3.5, 4, 4.5, and 5 g/L; Na0.35, Na0.9, Na1.8, Na2.7, Na3.6, Na4.5, and Na5.4—co-digestion mixture treated with the thermochemical methods with NaOH addition, where the digit is the amount of NaOH used in the study, i.e., respectively, 0.35, 0.9, 1.8, 2.7, 3.6, 4.5, and 5.4 g/L.
Energies 17 02679 g003
Figure 4. The influence of the pretreatment methods on the composition of the EPS measurement of changes in the N-NH4+ concentration. SB-EPS—soluble EPS; LB-EPS—loosely bound EPS; TB-EPS—tightly bound EPS; Ss—untreated sewage sludge; Ss-A—sewage sludge treated with the thermal method; M—untreated co-digestion mixture of sewage sludge, poultry manure, and grease trap sludge (control sample); M-A—co-digestion mixture treated with the thermal method; Fe3, Fe3.5, Fe4, Fe4.5, and Fe5—co-digestion mixture treated with the thermochemical methods with iron addition, where the digit is the amount of iron used in the study, i.e., respectively, 3, 3.5, 4, 4.5, and 5 g/L; Na0.35, Na0.9, Na1.8, Na2.7, Na3.6, Na4.5, and Na5.4—co-digestion mixture treated with the thermochemical methods with NaOH addition, where the digit is the amount of NaOH used in the study, i.e., respectively, 0.35, 0.9, 1.8, 2.7, 3.6, 4.5, and 5.4 g/L.
Energies 17 02679 g004
Figure 5. The influence of the pretreatment methods on the composition of the EPS measurement of changes in the carbohydrate concentration. SB-EPS—soluble EPS; LB-EPS—loosely bound EPS; TB-EPS—tightly bound EPS; Ss—untreated sewage sludge; Ss-A—sewage sludge treated with the thermal method; M—untreated co-digestion mixture of sewage sludge, poultry manure, and grease trap sludge (control sample); M-A—co-digestion mixture treated with the thermal method; Fe3, Fe3.5, Fe4, Fe4.5, and Fe5—co-digestion mixture treated with the thermochemical methods with iron addition, where the digit is the amount of iron used in the study, i.e., respectively, 3, 3.5, 4, 4.5, and 5 g/L; Na0.35, Na0.9, Na1.8, Na2.7, Na3.6, Na4.5, and Na5.4—co-digestion mixture treated with the thermochemical methods with NaOH addition, where the digit is the amount of NaOH used in the study, i.e., respectively, 0.35, 0.9, 1.8, 2.7, 3.6, 4.5, and 5.4 g/L.
Energies 17 02679 g005
Figure 6. The influence of the pretreatment methods on the composition of the EPS measurement of changes in the protein concentration. SB-EPS—soluble EPS; LB-EPS—loosely bound EPS; TB-EPS—tightly bound EPS; Ss—untreated sewage sludge; Ss-A—sewage sludge treated with the thermal method; M—untreated co-digestion mixture of sewage sludge, poultry manure, and grease trap sludge (control sample); M-A—co-digestion mixture treated with the thermal method; Fe3, Fe3.5, Fe4, Fe4.5, and Fe5—co-digestion mixture treated with the thermochemical methods with iron addition, where the digit is the amount of iron used in the study, i.e., respectively, 3, 3.5, 4, 4.5, and 5 g/L; Na0.35, Na0.9, Na1.8, Na2.7, Na3.6, Na4.5, and Na5.4—co-digestion mixture treated with the thermochemical methods with NaOH addition, where the digit is the amount of NaOH used in the study, i.e., respectively, 0.35, 0.9, 1.8, 2.7, 3.6, 4.5, and 5.4 g/L.
Energies 17 02679 g006
Figure 7. The influence of the selected pretreatment methods on the methane yield. M—untreated co-digestion mixture of sewage sludge, poultry manure, and grease trap sludge (control sample); M-A—co-digestion mixture treated with the thermal method; Na0.9, Na3.6, Na4.5, and Na5.4—co-digestion mixture treated with the thermochemical methods with NaOH addition, where the digit is the amount of NaOH used in the study, i.e., respectively, 0.9, 3.6, 4.5, and 5.4 g/L; and Fe3—co-digestion mixture treated with the thermochemical method with an iron addition of 3 g/L. Results obtained with an I/S ratio equal to 2.
Energies 17 02679 g007
Figure 8. Impact of the pretreatment method on VS removal. M—untreated co-digestion mixture of sewage sludge, poultry manure, and grease trap sludge (control sample); M-A—co-digestion mixture treated with the thermal method; Na0.9, Na3.6, Na4.5, and Na5.4—co-digestion mixture treated with the thermochemical methods with NaOH addition, where the digit is the amount of NaOH used in the study, i.e., respectively, 0.9, 3.6, 4.5, and 5.4 g/L; and Fe3—co-digestion mixture treated with the thermochemical method with an iron addition of 3 g/L. Results obtained with an I/S ratio equal to 2.
Energies 17 02679 g008
Table 1. Place of collection of organic waste considered as the third component of the co-digestion mixture.
SubstrateCollection Site
By-product of the refining of vegetable fats (waste soap—WS)Refining technological line
Fats contained in wastewater from the production of dairy products—flotation-thickened sludge (F)Grease trap sludge
Grease trap sludge from meat-processing plant (GTS)Grease trap sludge
Fruit waste (cherry processing period) (FW)Waste storage yard
Table 2. Characteristics of raw materials.
SubstrateTS (%)VS (% TS)VS (%)VS/TSpH (−)
AverageSDAverageSDAverageAverageSD
F11.380.1277.220.118.790.776.180.01
GTS14.620.0289.050.5613.020.895.440.01
WS17.010.1091.850.0615.630.926.020.01
FW12.870.0787.880.2911.310.884.210.01
PM27.440.2473.580.8120.190.745.410.01
Ss3.21–3.4377.77–80.672.59–2.660.77–0.815.69–5.81
I2.46–2.4762.85–63.321.55–1.560.62–0.638.47–8.51
Table 3. Kinetic models.
ModelEqual
Modified Gompertz equation (MG) y = P × e x p e x p R m × e P × λ 1 + 1
Logistic function model (LF) y = P 1 + e x p 4 R m × λ t P + 2
Transference function (TF) y = P × 1 e x p R m × λ 1 P
y—the cumulative of specific methane production, mL CH4/g VS. P—potential methane production, mL CH4/g VS. Rm—maximum rate of methane production, mL CH4/(g VS d). t—measured time, d. λ—lag time phase.d, and, e—base of the natural logarithms, namely, 2.718282.
Table 4. Methane yield (YM) of the tested organic waste.
FeedstockYM
(mL/g VSadd)
SD
By-product of the refining of vegetable fats (waste soap—WS)63050
Fats contained in wastewater from the production of dairy products—flotation-thickened sludge (F)75070
Grease trap sludge from meat-processing plant (GTS)74060
Fruit waste (cherry processing period) (FW)25030
Poultry manure (PM)27020
Sewage sludge (Ss)30740
Ss + PM32030
Table 5. Summary of the methane yield for selected group waste [27,35].
FeedstockYM
(mL/g VS)
Sewage sludge143–460
Fruit and vegetable waste420
Fruit waste180–732
Fats from flotation600–700
Grease trap sludge700 (1000)
Waste from grease trap sludge845–928
Poultry manure150–410
Table 6. Cumulative methane production for a three-component co-digestion mixture.
FeedstockCumulative Methane Production (mL)SD
Ss + PM + F1061.87.933
Ss + PM + GTS1297.431.8
Ss + PM + WS1110.2728.5
Ss + PM + FW696.74.8
Table 7. The influence of I/S on the methane yield of a mixture of poultry manure and sewage sludge.
I/SCumulative Methane Production (mL)SDYM
(l/kg VS)
SD
0.52137.579.15372.051.34
1.01356.9319.98370.514.57
1.51028.5714.15380.434.41
2.0826.776.35385.502.50
Table 8. Post hoc test results.
I/SYM
(l/kg VS)
abc
I/S_1.0372.05****
I/S_0.5370.51********
I/S_1.5380.43 ********
I/S_2.0385.50 ****
****—average values included in the same statistical group.
Table 9. The influence of the pretreatment methods on the feedstock compared to the untreated co-digestion mixture.
IndicatorSample
M-ANa-0.9Na-3.6Na-4.5Na-5.4Fe-3.0
VFAs
N-NH4+
NPOC
N-NH4+SB-EPS
LB-EPS
TB-EPS-
Sum
NPOCSB-EPS
LB-EPS
TB-EPS
Sum
carbohydrateSB-EPS
LB-EPS
TB-EPS
Sum
ProteinSB-EPS
LB-EPS
TB-EPS
Sum
SB-EPS—soluble EPS; LB-EPS—loosely bound EPS; TB-EPS—tightly bound EPS; ↓—lower than the control sample; and ↑—higher than the control sample.
Table 10. The impact of various strategies on methane production from poultry manure (pretreatment and/or in a mixture with various types of organic waste).
FeedstockPretreatmentAD ConditionsRemarksReference
Chicken manureExtraction (by shaking) of chicken manure with water
in the amount of 5 g fresh weight of manure per 100 mL of deionized water.
Batch assay, 2 L reactor, 38 ± 2 °CWithout pretreatment YB: 362.5 mL/g VS
With pretreatment
YB: 420.6–527.8 mL/g VS

Enhancement: +45%
[59]
Chicken litter5% of NaOH 90 min, 120 °C +3% of H2SO4 90 min, 120 °C With pretreatment
YM: 137 mL/g VS

Enhancement: -
[60]
Chicken litter and chicken feathersCa(OH)2 at 90 °C, 1.27 bar pressureBatch assay, 50 mL bottles, 37 °CWith pretreatment
YM: 101 mL/g VS

Enhancement: -
[61]
Poultry manureClostridium cellulolyticum, Clostridium saccharolyticum, and Clostridium thermocellum as bioaccumulation strainsWith pretreatment
YM: 102 mL/g VS

Enhancement: +15%
Food waste + poultry manure120 °C, 10 bar, 30 minBatch assay, 2.0 L bottles, 30 dUntreated: 8921 mL

Enhancement: +4–11%
[62]
2450 MHz, power 1460 W, wavelength of 12.24 cm, and cavity size of 470
Ultrasonication: 20 kHz, 130 W, 30 min
Poultry droppings + kitchen wasteThe addition of silica gel as a catalyst26–31 °C, 8% TSWith pretreatment
YM:
10,545 mL/kg
Enhancement: +31.12% compared to trail without silica gel
[63]
Chicken litter (CL) + wheat straw (WS) + food waste (FW)NaOH (1–5% w/v), 30–90 min, 60–120 °CBatch assay, 1 L, 37 °CCL YM: 321.1 mL/g VSadded
With pretreatment
YM:
440–590 mL/g VSadded
Enhancement: up to 83.7%
[60]
Sequential alkaline acid pretreatment 1%, 2%, and 3% (w/v) H2SO4With pretreatment
YM: 470–625 mL/g VSadded
Enhancement: up to 94.6%
Poultry manure150 °C/5 min and 4.8 baAMPTS device (Bio-
Process control, Lund, Sweden), 39 ± 1 °C
With pretreatment
YM: 288 mL/g VSadded
Enhancement: up to 14.4%
[64]
Chicken manurehyper-thermophilic
(70 °C) pretreatment
continuously stirred tank reactors, 12 L, 100 rpm, 55 °CWith pretreatment
YM: 518 mL/g VSadded
Enhancement: up to 54.6%
[65]
Chicken manure (CM)pretreated at
100 °C, 125 °C, 150 °C, 175 °C, 200 °C, and 225 °C
Batch assay, 35 ± 1 °CCM: YM: 340 mL/g VSadded
Enhancement: −7.86
[66]
Co-digestion (AcD)
a mixture of 60% sewage sludge, 20% chicken manure, and 20% sugarcane waste (SCW)
Acid pretreatment with different doses of acetic acid (2%, 3%, and 4% v/v); duration: 30–90 minBatch assay, 450 mL bottles, 30 ± 4 °C, 150 rpmRaw agroindustrial waste: YM: 426.9 mL/g VSrem

Enhancement: up to 1392.9 mL/g VSrem
[67]
Chicken manure (CM) and sewage sludge (SS)Iron oxide nanoparticles at dosages of 40, 80, 120, and 160
mg/L
Batch assay, 1 L, 35 °CSS YM: 278.8 mL/g VS
CM: SS (70:30 on VS base): 3389.7 mL/g VS
AcD with iron: YM: 421.9–560.6 mL/g VS
[68]
Poultry manure (PM) and lignocellulosic materials-Batch assay, 120 mL bottles, 35 °C, 180 rpmThe best result was achieved for a food-to-inoculum ratio equal to 0.5
YM for PM: 13–302 mL/g VS
YM for co-digestion PM with rice straw, corn cob, peanut shell, sawdust, coffee husks, or sugarcane bagasse lower than for AD of PM alone
[8]
Kitchen waste (KW)
and poultry manure (wet weight basis) at
ratios of 1:0, 1:1, 2:1, and 3:1
-Batch assay, 1 L bottles, 28 and 37 °CKW YB: 312 mL/g VS (28 °C); 532 mL/g VS
(37 °C)
AcD: 360–396 mL/g VS (28 °C); 452–920 mL/g VS (37 °C)
[9]
Poultry droppings (PDs) with two different ratios of physicochemical sludge (20% and 40%, based on the VS) Continuously stirred anaerobic digestor, 12 L, 37 °C, HRT 30 dPD, YM: 270 mL/g VS

Enhancement: up to 54%
[69]
Table 11. Summary of the estimated kinetic parameters.
SampleP [mL CH4/g VS]Rm [mL CH4/(g VS d)]λ [d]R2
Modified Gompertz equation (MG)
M340.362463.495020.2352760.99933
M-A438.446566.907780.2658490.99895
Na0.9463.665372.928380.3898540.99915
Na3.6488.748477.755260.5488160.99912
Na4.5501.015081.166760.5520480.99900
Na5.4496.826181.760550.5892160.99862
Fe3.0457.632568.747860.2900880.99895
Logistic function model (LF)
M338.993558.931890.1774590.99879
M-A435.858762.604830.2136610.99705
Na0.9461.013268.713670.3731780.99800
Na3.6485.990673.898030.5755180.99902
Na4.5498.266877.187210.5817750.99908
Na5.4494.096578.134110.6364460.99896
Fe3.0454.835064.428610.2428880.99693
Transference function (TF)
M342.8943114.40200.6093480.99474
M-A443.7058117.52560.6738990.99564
Na0.9469.2031126.16820.7217100.99437
Na3.6494.8274131.58030.7860650.99226
Na4.5507.0182137.41990.7819300.99190
Na5.4502.7924137.52150.7922500.99115
Fe3.0463.4191120.16800.6917500.99576
Disclaimer/Publisher’s Note: The statements, opinions and data contained in all publications are solely those of the individual author(s) and contributor(s) and not of MDPI and/or the editor(s). MDPI and/or the editor(s) disclaim responsibility for any injury to people or property resulting from any ideas, methods, instructions or products referred to in the content.

