Article

A Comparative Analysis of Bio-Oil Collected Using an Electrostatic Precipitator from the Pyrolysis of Douglas Fir, Eucalyptus, and Poplar Biomass

by
Manish Sakhakarmy
1,
Ayden Kemp
1,
Bijoy Biswas
1,
Sagar Kafle
1 and
Sushil Adhikari
1,2,*
1
Biosystems Engineering Department, Auburn University, 200 Corley Building, Auburn, AL 36849, USA
2
Center for Bioenergy and Bioproducts, Auburn University, 519 Devall Drive, Auburn, AL 36849, USA
*
Author to whom correspondence should be addressed.
Energies 2024, 17(12), 2800; https://doi.org/10.3390/en17122800
Submission received: 19 April 2024 / Revised: 3 June 2024 / Accepted: 3 June 2024 / Published: 7 June 2024
(This article belongs to the Special Issue New Trends in Biofuels and Bioenergy for Sustainable Development II)

Abstract

:
The conversion of biomass into bio-oil through the pyrolysis process offers numerous benefits, such as bio-fuel and bio-resin synthesis. However, for bio-oil usage for any application, understanding its composition is vital. Therefore, this study investigated the effects of different commonly available woody biomass (Douglas fir, eucalyptus, and poplar) on bio-oil composition. The bio-oil was produced through fast pyrolysis at 500 °C in a fluidized bed reactor and collected using an electrostatic precipitator. The chemical composition was analyzed using gas chromatography–mass spectroscopy, and the hydroxyl groups were quantified using phosphorous-31 nuclear magnetic resonance. The poplar bio-oil had the most significant proportion (67 area%) of lignin-derived compounds and the highest OH concentration (6 mmol g−1). However, the proportion of carbohydrate-derived compounds was the largest (44 area %) in bio-oil produced from Douglas fir. Based on the OH concentration, poplar would be the most suitable feedstock for resin synthesis among the three feedstocks tested.

1. Introduction

The increasing demand for transportation fuels and its impact on greenhouse gas emissions have led to the necessity to ramp up bio-fuel production [1,2]. Additionally, biomass ought to be used for the production of other valuable chemicals such as resins, lubricants, and additives because bio-based materials have less of an environmental impact [3,4,5,6].
Several technologies, such as gasification, pyrolysis, and hydrothermal liquefaction, can be used to produce fuels and chemicals from biomass [7]. Compared to other thermochemical conversion processes, pyrolysis has been reported as the most efficient and economical way to produce value-added chemicals and bio-fuels [8,9]. In pyrolysis, biomass is converted into bio-oil and bio-char by applying heat at moderate temperatures (400–600 °C) under inert conditions [10]. Fast pyrolysis is performed at a high heating rate (greater than 100 °C min−1) with a short residence time (0.5–2 s) and rapid cooling of the vapors obtained from the process to increase the bio-oil yield [11].
Numerous studies have been conducted on the pyrolysis of woody biomass and have investigated the effects of varying operating conditions such as the feed rate, nitrogen flow rate, reaction temperature, and feed particle size on the yield and properties of bio-oil, such as its elemental composition, viscosity, high heating value (HHV), etc. [9,12,13,14,15,16]. Characterization of the bio-oil obtained in such studies showed several phenolic compounds, in addition to carboxylic acids, sugars and dehydrosugars, hydroxy aldehydes, and hydroxy ketones, which are attributed to the thermal depolymerization of lignin, cellulose, and hemicellulose [14,17,18].
Although there have been numerous studies on the pyrolysis of woody biomass, most of them have focused on the macroscopic properties (such as yield, proximate and ultimate analysis, HHV, and viscosity) of the bio-oils obtained after pyrolysis for the purpose of bio-fuel production [12]. As a result, they have not quantified the hydroxyl (-OH) groups present in the bio-oil, which is the most crucial factor in determining its potential for resin synthesis [19,20]. Resin synthesis is one of several applications of the bio-oil obtained from pyrolysis and, to this date, has been largely uninvestigated. The phenols present in the bio-oil can be used to replace an equivalent amount of synthetic phenols to produce bio-resins such as phenol-formaldehyde, phenol-acetaldehyde, and epoxy resins [3,21]. Bio-oil with higher concentrations of OH groups is better suited for bio-resin synthesis applications.
Additionally, the bio-oil obtained from previous studies had a higher water content (>20%), which is not beneficial for industrial applications such as resin and fuel synthesis. In this study, an electrostatic precipitator (ESP), in addition to the usual condensation system, was used to collect the organic phase of the bio-oil. The addition of an ESP, in conjunction with a regular condensation system, results in the collection of an organic fraction with a lower water content and a lower concentration of oxygenates, which can be used further to produce bio-resin, bio-fuel, and lubricants [17,22,23].
The novelty of this work lies in the quantification of the hydroxyl (-OH) groups using 31P-NMR (phosphorous nuclear magnetic resonance) for bio-resin synthesis and detailed characterization of the bio-oils obtained from fast pyrolysis in a fluidized bed reactor of three types of forest biomass, namely Douglas fir, eucalyptus, and poplar. These biomasses were chosen due to their wide availability (Douglas fir in North America, eucalyptus in Australia and tropical climates worldwide, and poplar in all parts of the Northern Hemisphere) and fast-growing properties [24,25]. Understanding bio-oil composition is essential for its use in any application but is critical for bio-resin synthesis. Hence, this work investigated the potential of different biomasses to produce bio-oil with high concentrations of OH groups.

2. Materials and Methods

2.1. Materials

The ground biomass (without any bark or leaves) with a sieve size between 30 (600 µm) and 50 (300 µm) for the pyrolysis experiments was obtained from ForestConcepts, LLC (Auburn, WA, USA). Airgas Inc. (Opelika, AL, USA) provided high-purity nitrogen (99.99%). Sand for the fluidization of the pyrolysis reactor was obtained from Ward’s Science (St. Catharines, ON, Canada). Deuterated chloroform and pyridine for the nuclear magnetic resonance (NMR) spectroscopy were purchased from Thermo Scientific (Waltham, MA, USA), and the phosphitylation reagent for the 31P-NMR analysis, 2-chloro-4,4,5,5-tetramethyl-1,3,2-dioxaphospholane (TMDP), was obtained from Sigma-Aldrich (Burlington, MA, USA). All the other chemicals were from VWR (Radnor, PA, USA) and were used as received.

2.2. Feedstocks Characterization

Proximate, ultimate, and component analyses were performed by following the standard procedures to characterize the biomass used for the pyrolysis experiments (Table S1). For proximate analysis, the moisture content (MC), volatile matter, and ash content were determined. The ultimate analysis (CHNS/O) was conducted to find the elemental composition of the biomass.

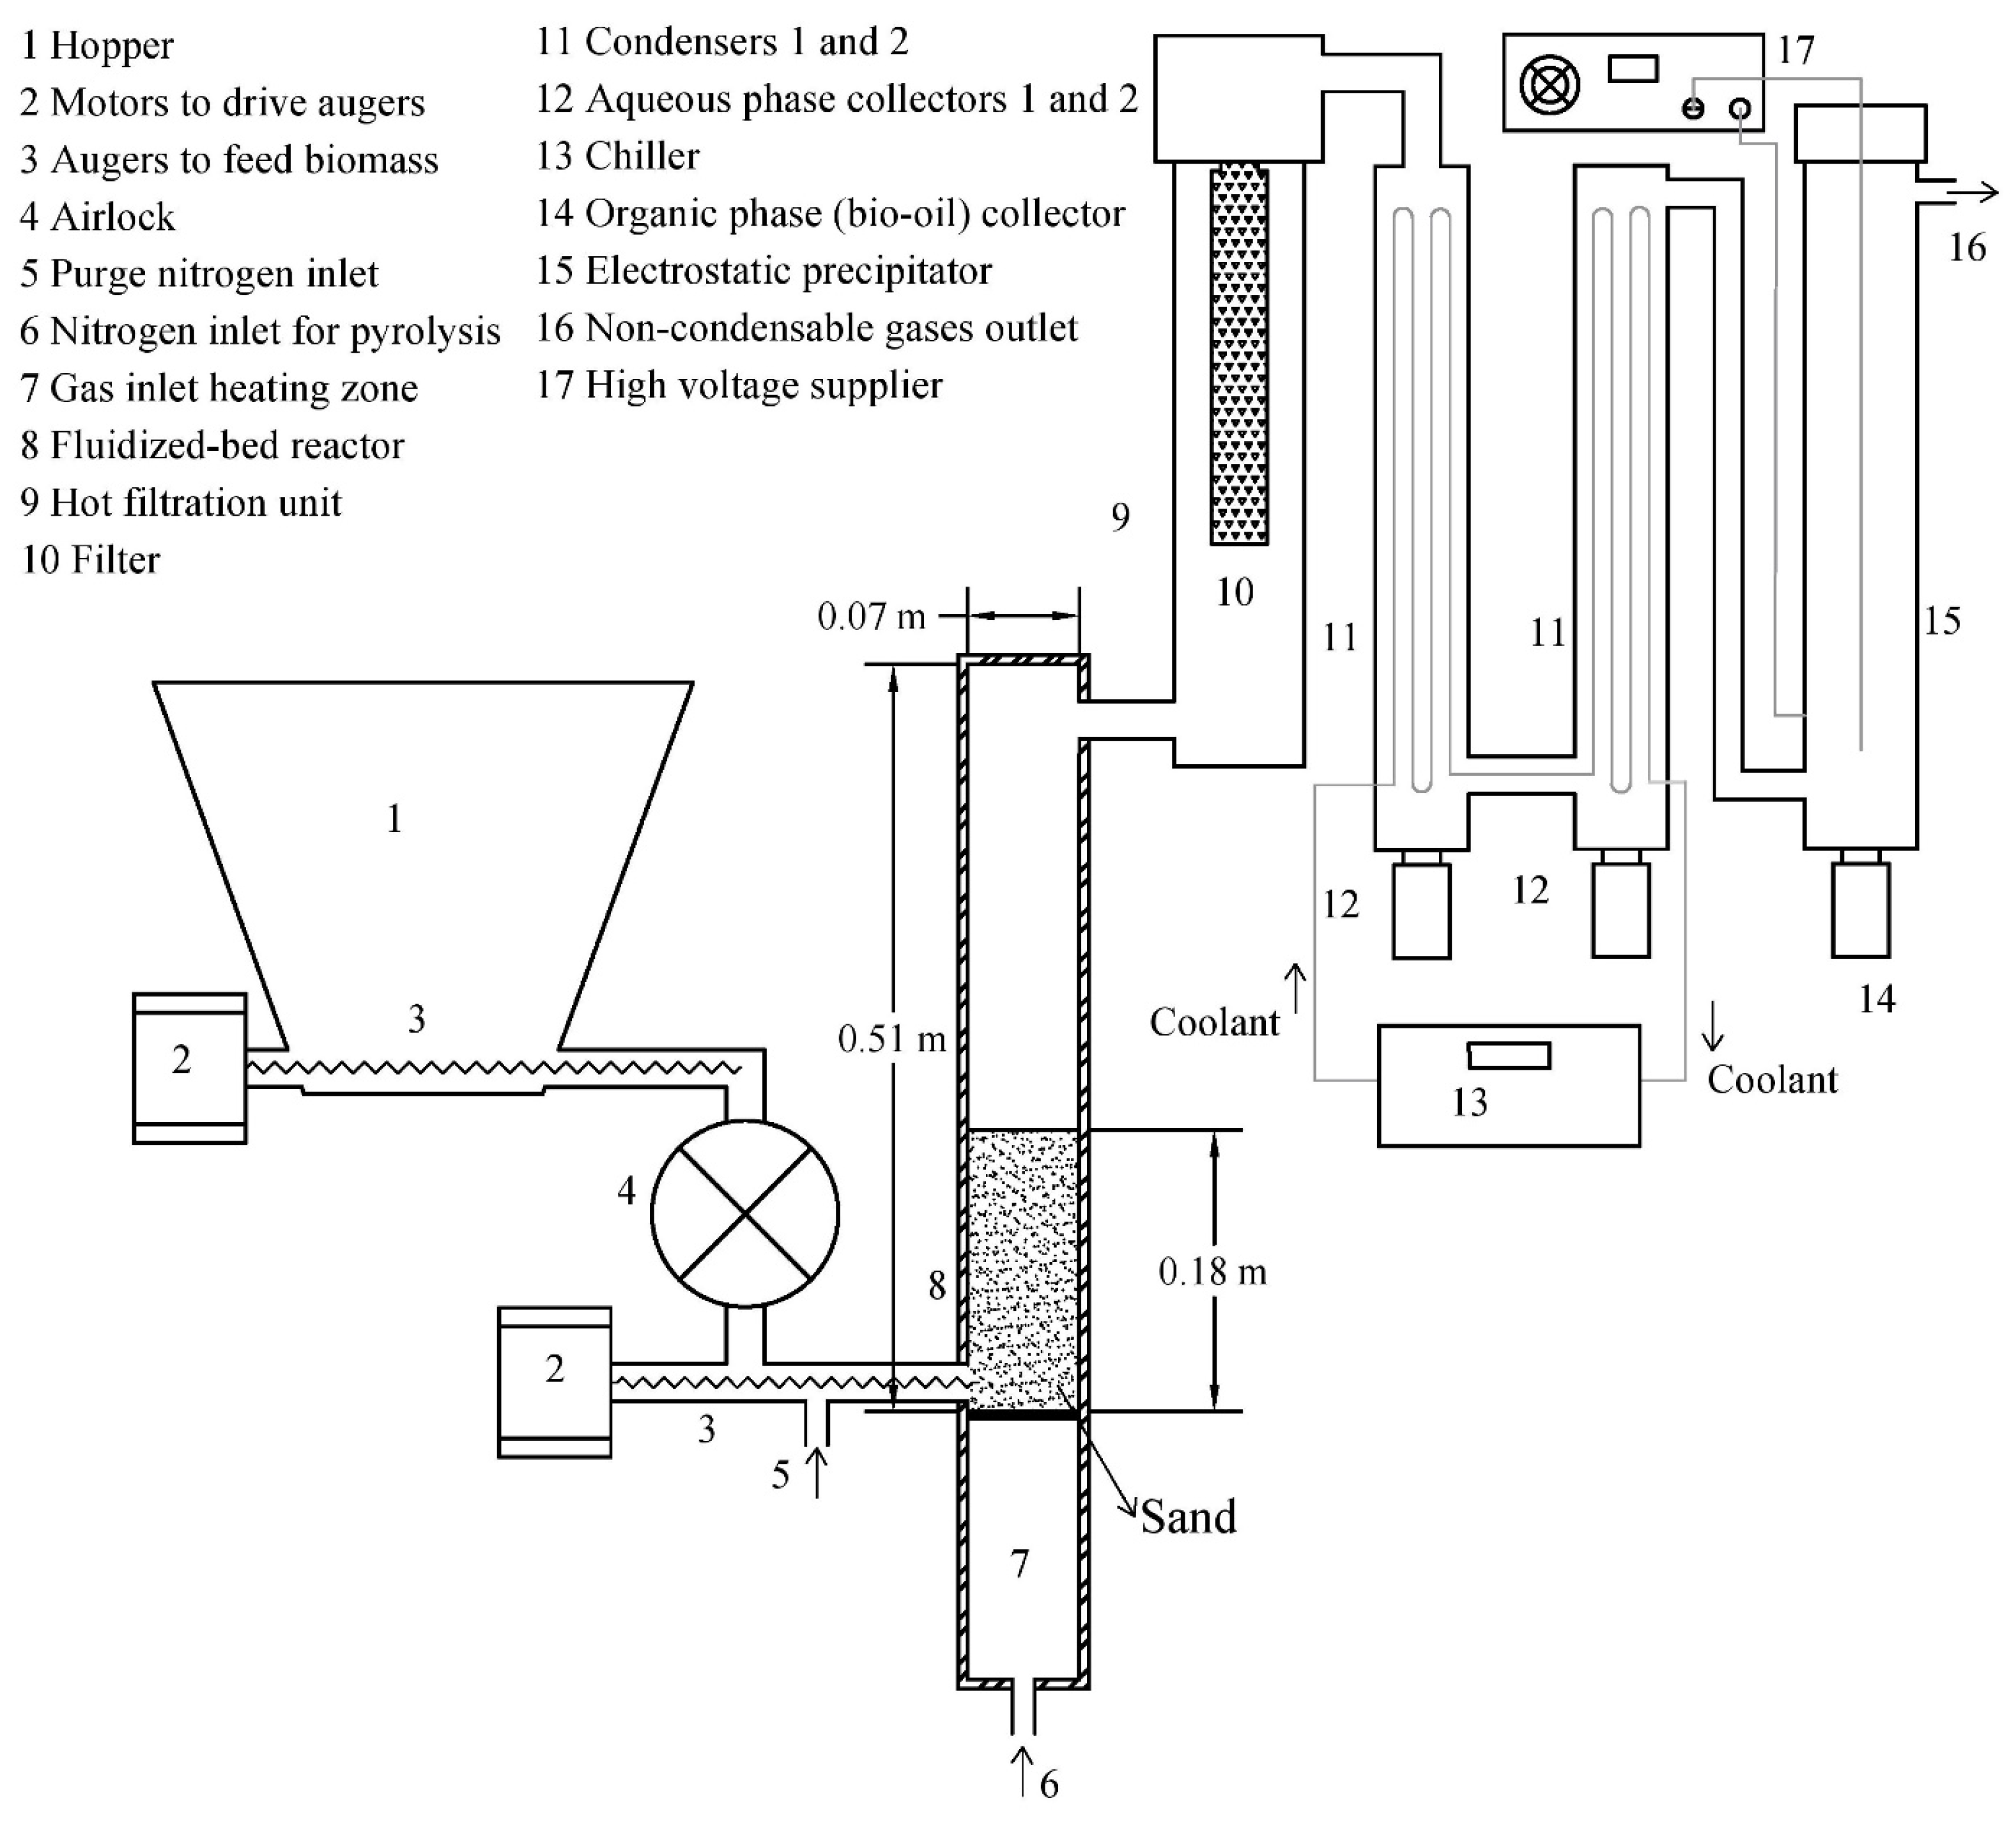
2.3. Pyrolysis Procedure

Pyrolysis of the Douglas fir, eucalyptus, and poplar biomass was carried out in a fluidized bed reactor arrangement, as shown in Figure 1. The pyrolysis experiment for each biomass was carried out only once; however, for reproducibility of the yield results, the experiment was carried out continuously for three hours for each biomass. The bed of the pyrolysis reactor was fluidized using nitrogen gas (N2) at a flow rate of 34 SLPM (standard liters per minute) in sand (average particle size from 210 to 354 µm) bed. To prevent backflow of N2, a purge line with a N2 flow rate of 5 SLPM was integrated into the screw feeder. The reactor was maintained at 500 °C with a continuous flow of N2 for at least 5 min before feeding it the biomass. The biomass from the hopper was fed into the reactor with the help of a screw feeder for three hours at a feed rate of approximately 5 g min−1. The continuous flow of N2 led the pyrolysis products from the reactor to the filter, condenser, and exhaust. The bio-char in the pyrolysis products was separated with the help of a filter. After the removal of the bio-char, the remaining gaseous pyrolysis products were allowed to pass through the usual condensation system (temperature set at 2 °C) before going to the dry ESP setup. As shown in the experimental setup, a normal condensation system condensed lighter molecules (in collectors 1 and 2, 12). The ESP then condensed the heavier molecules present in the remaining stream of gas with the help of electrostatic precipitation and collected the organic phase (in an organic phase collector, 14). The ESP was operated at a high voltage of 25 kV. The aqueous phase of the condensed liquid is referred to as the aqueous phase, whereas the organic phase of the condensed liquid is referred to as bio-oil for characterization purposes.

2.4. Characterization of Pyrolysis Products

The bio-oils, bio-chars, and aqueous phases obtained after pyrolysis were taken for characterization, following the standard methods (Table S1). Proximate (except for the MC for the bio-oils) and ultimate analyses of the bio-oils and bio-chars were performed similarly to the respective analyses of the biomass. Karl Fischer titration was performed to determine the amount of water (aqueous content) present in the bio-oil. The bio-oils’ and bio-chars’ higher heating value (HHV) was measured to find their gross energy content. Total acid number (TAN) was measured to determine the acidity of the bio-oil. A viscometer measured the density and kinematic viscosity (at 40 °C) of the bio-oil. The total organic carbon (TOC) and total nitrogen (TN) contents of the aqueous phases were measured using a TOC/TN analyzer (TOC-L, Shimadzu, Kyoto, Japan). Thermogravimetric analysis (TGA) of the bio-oils was performed to determine their thermal degradation behavior. Fourier infrared transform (FTIR) analysis (using a Thermo Nicolet iS10 [Thermo Scientific, Waltham, MA, USA]) was conducted to observe the chemical composition of the bio-oils.
In addition to FTIR analysis, for the analysis of the chemical composition of the pyrolyzed bio-oils, a gas chromatography (GC) system (Agilent Technologies 7890A) coupled with a mass spectrometer was used. The National Institute of Standards and Technology (NIST) library was used to find the compounds present in the bio-oils. Finally, 31P-NMR was performed to quantify the hydroxyl (-OH) functional groups in the bio-oils.

2.5. Statistical Analysis

The proximate and ultimate analysis experiments were conducted three times, and their results were presented as averages and standard deviations. The 31P-NMR experiments were conducted twice, and their averages were presented. ANOVA tests with a level of significance α = 0.05 were conducted in RStudio to perform the statistical analysis.

3. Results and Discussion

The characterization of Douglas fir, eucalyptus, and poplar and their respective bio-oils and bio-chars is reported and discussed in this section.

3.1. Characterization of Feedstocks

Characterization of the Douglas fir, eucalyptus, and poplar biomass was performed (Table 1), and it was found that for all the biomass, the MC was less than 10%, which is favorable for pyrolysis. A higher MC reduces the reaction rate, as the available heat energy is used to evaporate water during pyrolysis [26]. Similarly, the volatile content was higher than 86% for all of the biomass, resulting in a higher bio-oil yield [14]. The ash content of the biomass was lower (less than 1.2%), which minimizes operational issues and increases the bio-oil yield [27]. Similarly, lower fixed carbon (measured maximum of around 12.1%) is preferred to have a higher bio-oil yield and a lower bio-char yield in pyrolysis [28]. The ultimate analysis showed that the elemental compositions (C, H, N, S, O) were in the range for typical biomass [29]. A higher content of elemental carbon and hydrogen is preferred to produce a bio-oil with better calorific value; however, a lower elemental oxygen content is preferred for better fuel applications, as oxygen reduces the calorific value [29]. In addition, component analysis of the different biomasses showed the cellulose, hemicellulose, and lignin contents were in the range for typical biomass [29,30]. The proximate, ultimate, and component analyses in the study were found to be comparable with those of previous studies: for Douglas fir, with Bok et al. [13]; for eucalyptus, with Heidari et al. [14]; and for poplar, with Kim et al. [17]. For most lignocellulosic biomass, its volatile content ranges from 70% to 86% (wt. %), its ash content can vary from 0.5% to almost 35% (wt. %), its elemental carbon content can vary from 43 to 51% (wt. %), its hydrogen content can be 4–6% (wt. %), and its oxygen can range from 34 to 48% (wt. %), in addition to other elements such as N, Cl, and S in small amounts [29]. The properties of biomass, such as its MC, ash content, and volatile matter content, vary with the harvesting season, but different pretreatments can be performed to reduce this variability. Additionally, operating parameters can be changed to address those effects.
The results from the ANOVA test showed significant differences in the moisture content, volatile content, ash content, and carbon content based on the type of biomass. This suggests that the physiochemical properties of biomass are dependent on the type of biomass used. Hence, it could change the product properties obtained after performing pyrolysis.

3.2. Effects of Biomass on Pyrolysis

Among the three biomass pyrolysis procedures, the highest ESP oil yield (18.52%) was found for poplar and the lowest for Douglas fir (16.78%) (Table 2). The higher bio-oil yield for poplar could be due to the higher number of β-O-4 bonds in poplar [31,32,33]. The overall bio-oil yield was lower than that in previous studies (Bok et al. [13], Heidari et al. [14], and Kim et al. [17]), which can be attributed to the fluidized bed pyrolysis process leading to a high heat transfer, favoring the formation of non-condensable gases (Table 2). The yield of bio-char was found to be the maximum (23.58%) from Douglas fir and the minimum (19.02%) from poplar, which is due to the presence of a higher number of β-O-4 bonds in poplar [31,32,33], resulting in the conversion of a large fraction of lignin into liquid instead of char. The bio-char yield results were comparable to those in previous studies [13,14,17].

3.3. Characterization of Bio-Oils

The effects of different biomasses and the usage of an ESP on the properties of bio-oil are further discussed in this section.

3.3.1. Ultimate and Proximate Analyses

The water content of the bio-oils from Douglas fir, eucalyptus, and poplar was lower than 10% (Table 3). A reduction in the aqueous content of the bio-oils compared to that in previous studies can be ascribed to the application of the ESP for condensation purposes [13,14,17]. Usual condensation units can condense lighter molecules in addition to water. However, they do not condense heavier molecules. An ESP can condense such molecules due to electrostatic precipitation. This results in a lower water content in the bio-oil. In this study, the organic phase and aqueous phase of the bio-oil were not mixed. A higher water content in bio-oil sets back its properties and applications, such as reduced calorific value, difficulty in chemical analysis, and high energy needed to remove water. Thus, the low water content in this study confirms a better final product. Also, the volatile content of the bio-oils was above 95%, which is higher than the values obtained in previous studies [16,34]. This signifies that these bio-oils could be used for bio-fuel applications after further chemical treatment. The ash content of the bio-oils was almost negligible (<0.03%), aligning with the results of Wu et al. [34] and Pienihäkkinen et al. [16]. A negligible ash content indicates bio-oils as the product of purely volatilizing organic matter present in the biomass [14]. In addition, the values of fixed carbon on a dry basis were lower than those obtained by Wu et al. [34] (7.92% for Douglas fir bio-oil) and Pienihäkkinen et al. [16] (24.27% for eucalyptus bio-oil). As fixed carbon is calculated according to the subtraction method, higher volatile and ash content values reduced the fixed carbon content of the bio-oils.
From the ultimate analysis results (Table 3), the carbon content of the bio-oils was found to be more significant than that of their respective biomasses, indicating the effectiveness of pyrolysis in increasing the carbon content. The poplar bio-oil had a significantly higher carbon content (69.16 ± 0.20%, db) as compared to the eucalyptus (63.44 ± 0.05%, db) and Douglas fir (60.98 ± 0.16%, db) oils based on the ANOVA test, with a level of significance = 0.05, which is due to the efficient decomposition of the poplar at 500 °C compared to Douglas fir and eucalyptus. Previous pyrolysis experiments conducted by Bok et al. [13] found a maximum of 59.19% elemental carbon content in bio-oil obtained from Douglas fir. Also, Wan Sulaiman and Lee [11] found 75.21% elemental carbon content in bio-oil resulting from eucalyptus pyrolysis, attributed to waterless solvent extraction. In addition, Kim et al. [17] found the elemental carbon content to be 53.89% for the bio-oil obtained after the pyrolysis of yellow poplar, resulting from its higher water content (25.4%). Also, the hydrogen contents of the bio-oils in this experiment are comparable to the results from previous studies [11,13,17]. There was no significant difference in the hydrogen content of the bio-oils. The oxygen contents in this experiment were lower than 33%. Previous pyrolysis experiments conducted by Bok et al. [13] had a minimum of almost 30.15% elemental oxygen in bio-oil obtained from Douglas fir. Also, Wan Sulaiman and Lee [11] found 10.54% elemental oxygen content in eucalyptus bio-oil, which was attributed to it being a waterless bio-oil obtained from solvent extraction. In addition, Kim et al. [17] found the elemental oxygen content to be 36.46% for bio-oil obtained after the pyrolysis of yellow poplar, resulting from the higher water content (25.4%).

3.3.2. High Heating Value (HHV)

Poplar bio-oil contained the highest HHV of 25.32 MJ kg−1 (Table 3), which is close to that reported in a previous study [17]. This can be attributed to the higher carbon content in the bio-oil. Among the bio-oils, the minimum HHV was found for Douglas fir (22.95 MJ kg−1), however, which is still higher than that of previous studies [13,30]. The lowest HHV can be ascribed to the highest aqueous content of this bio-oil.

3.3.3. Total Acid Number (TAN)

The TAN for Douglas fir bio-oil was the highest, with a value of 56.37 mg KOH g−1 (Table 3), followed by eucalyptus, with a value of 46.91 mg KOH g−1. However, poplar had the lowest TAN value of 35.53 mg KOH g−1. The lowest TAN value for poplar bio-oil suggests that with further treatment of this crude, it could be used for fuel applications. The lowest TAN value for poplar bio-oil is due to the formation of fewer acidic compounds during pyrolysis, which is supported by the GC-MS results. A lower TAN value is preferable, as bio-oil with a lower TAN is more stable and less corrosive. A higher TAN value suggests higher corrosivity. The value of TAN can range from 25 to as high as 200 mg KOH g−1 for lignocellulosic biomass based on the pyrolysis operating conditions and the type and location of the biomass [35,36]. Bio-oils obtained from the pyrolysis of Douglas fir, eucalyptus, and poplar in previous studies had higher TAN values compared to the bio-oils obtained in this study [15,16,37]. The higher TAN values in those studies could be due to the regular condensation system applied in their experimental setup. In this study, an ESP was used in addition to the usual condensation system for the pyrolysis gaseous products, which resulted in bio-oils with lower water contents and larger quantities of phenolic compounds, and hence lower TAN values.

3.3.4. Density and Kinematic Viscosity Analysis

The density of Douglas fir bio-oil was 1.22 g cm−3 (Table 3), similar to the value found in the study by Bok et al. [13]. For both the eucalyptus and poplar bio-oils, it was 1.17 g cm−3, slightly higher than that in the previous research [11]. The kinematic viscosity ranged from 83 to 124 mm2 s−1 for the different bio-oils. Bio-oil obtained in previous experiments had a relatively lower viscosity [11,13,17]. The higher viscosity values compared to their experiments can be attributed to the use of electrostatic precipitation to collect the bio-oil, which reduced the water content in the bio-oils to less than 10%. The lower water content aided the increment in the kinematic viscosity.

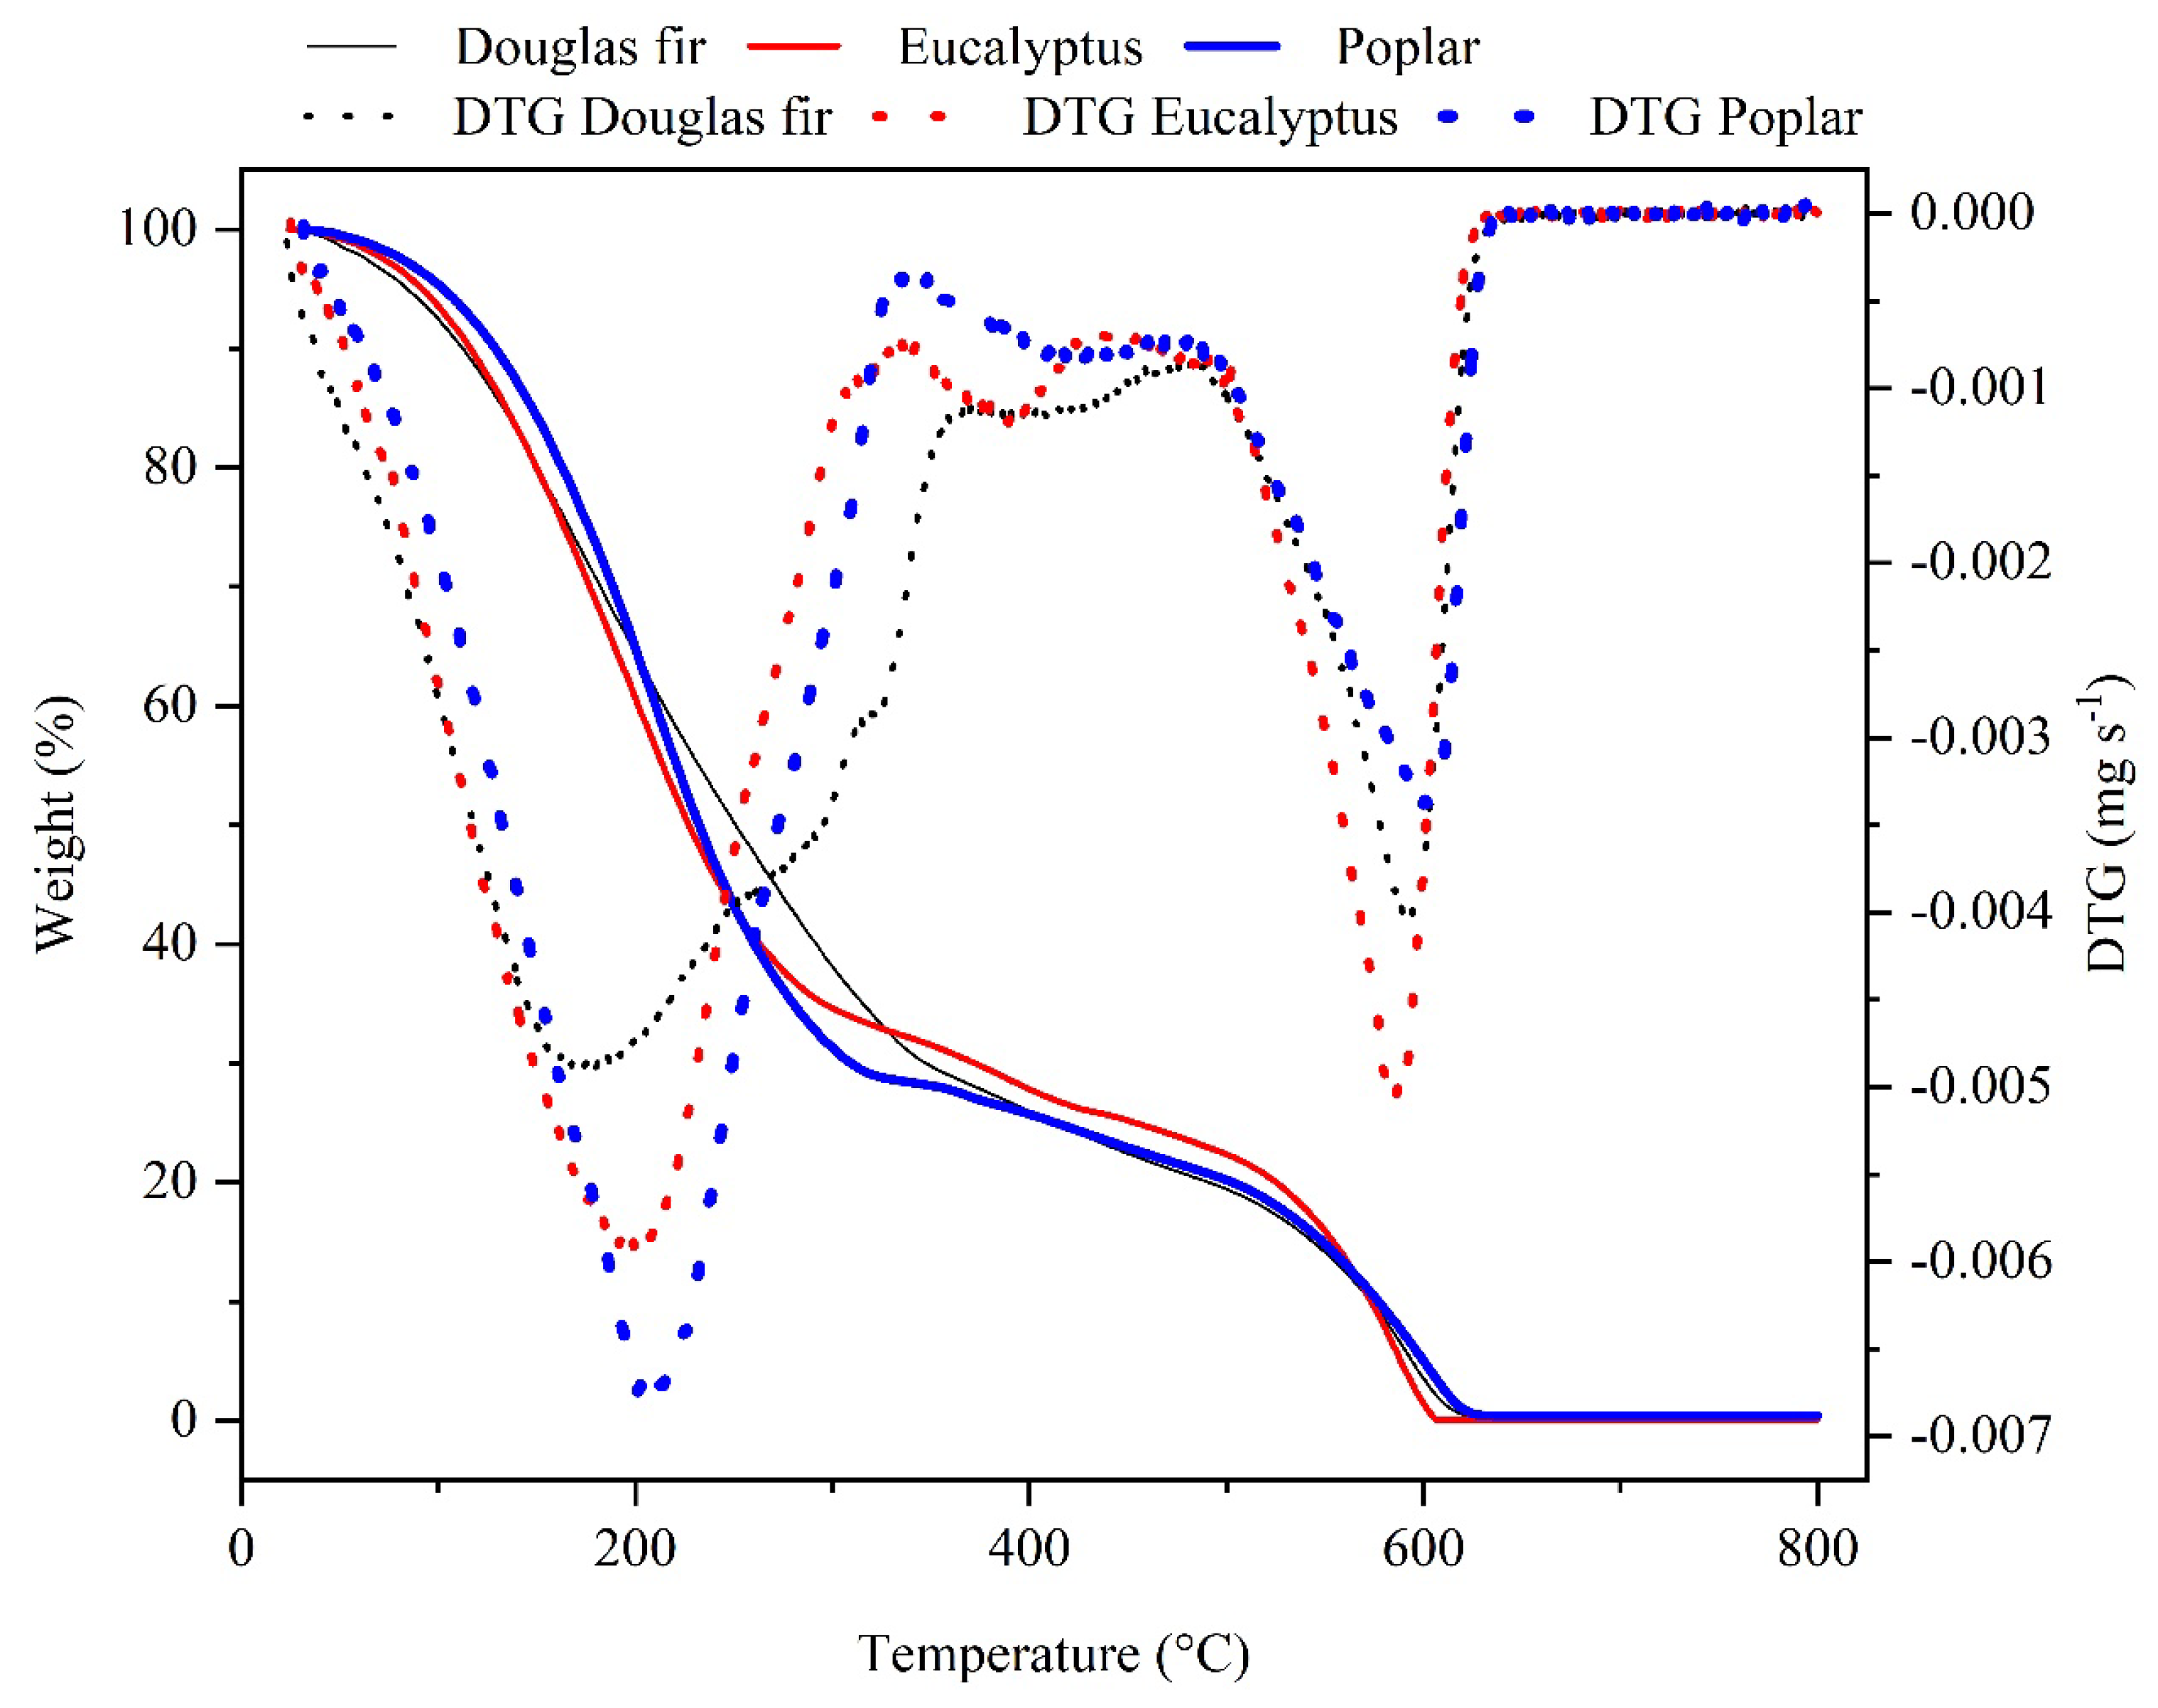
3.3.5. Thermogravimetric Analysis (TGA)

The result of thermogravimetric analysis (TGA) of the bio-oils from different biomasses (Figure 2) showed each bio-oil degraded at temperatures around 200 °C and 600 °C. The degradation of the bio-oils at 200 °C is due to the decomposition and burning of smaller and lighter organic compounds; however, the degradation of bio-oils around 600 °C can be ascribed to the decomposition and burning of heavier organic compounds, as shown from the GC-MS results (Table S2). The derivative of thermal degradation (DTG) curve shows that the bio-oil from Douglas fir had a wider range of degradation, around 150 °C to 350 °C, compared to the bio-oils from other biomasses, which can be attributed to the larger proportion of cellulosic compounds present in it. In contrast, the bio-oil from eucalyptus had a larger area of the DTG, around 500 °C to 625 °C, indicating a higher phenolic proportion.

3.3.6. Fourier Infrared Transform (FTIR) Analysis

The FTIR spectra presenting the functional groups in the bio-oils from Douglas fir, eucalyptus, and poplar are presented in the Supplementary Materials (Figure S1). The same peaks were observed for the bio-oils from different biomasses; however, their intensity was different, which can be ascribed to the presence of the same organic compounds, however, at different concentrations. From the FTIR spectra, it was observed that for each bio-oil, the functional groups present were O–H stretching alcohol (3550–3200 cm−1), C–H stretching alkane (3000–2840 cm−1), carbonyl stretching conjugated aldehyde (1710–1685 cm−1), aromatic O–H (1600–1500 cm−1), and O–H bending carboxylic acid (1440–1395 cm−1). Furthermore, the C–H bending vibration from 850 to 1300 cm−1 confirms the presence of esters and alcohols. The phenolic compounds in the bio-oils can be ascribed to the degradation of lignin present in the lignocellulose biomass [9,14]. In contrast, alkanes, aldehydes, carboxylic acid, alcohols, esters, and their derivatives may arise due to hemicellulose and cellulose degradation. The GC-MS results (Table 4) further corroborate the FTIR results.

3.3.7. Gas Chromatography–Mass Spectroscopy (GC-MS) Analysis

The GC-MS analysis of the bio-oils showed that almost 90 compounds (Table S2) resulted from biomass decomposition. The compounds obtained from the bio-oils were grouped into carbohydrate- and lignin-derived compounds (Table 4). Lignin-derived compounds consist of H-lignin, G-lignin, and S-lignin compounds.
The higher percentage of carbohydrate-derived compounds in the Douglas fir bio-oil (44.48%) can be ascribed to the higher decomposition of cellulose and hemicellulose, as observed by Gronli et al. [38]. Although the lignin content of Douglas fir (Table 1), a softwood [39], was higher than that of poplar, its bio-oil contained the lowest level of lignin-derived compounds (42.29%) compared to that of eucalyptus (60.62%) and poplar (67.04%). The discrepancy in the concentration of the lignin-derived compounds in the bio-oil and the lignin content of the respective biomass can be explained by the number of easily breakable β-O-4 linkages present in the biomass [40,41]. For instance, for the same mass of Douglas fir and poplar, Yoo et al. [31] found 87 β-O-4 linkages in poplar, which was greater than the number of β-O-4 bonds present in Douglas fir (total linkages = 68). The cleavage of the β-O-4 bonds in the hardwood increases the level of lignin-derived compounds. The increase in the lignin-derived compounds enhances the OH concentration. Notably, no S-lignin compounds were present in the Douglas fir bio-oil, as it is a softwood with no syringol-type compounds.

3.3.8. Phosphorous Nuclear Magnetic Resonance (31P-NMR) Analysis

From the 31P-NMR analysis, the total OH concentration was the maximum (6.06 mmol g−1) for poplar bio-oil and the minimum (4.06 mmol g−1) for Douglas fir bio-oil (Table 5). Fewer studies have conducted 31P-NMR tests on bio-oil obtained after the pyrolysis of biomass (other than Douglas fir, eucalyptus, and poplar without bark) and quantified the OH concentration. For example, David et al. [42] pyrolyzed loblolly pine, sweet gum, and lignin and cellulose from loblolly pine and found the OH concentrations for the pyrolyzed bio-oils to be 2.62 mmol g−1, 1.54 mmol g−1, 2.90 mmol g−1, and 2.95 mmol g−1, respectively. The lower OH concentrations in their experiment were because of the higher aqueous content of the bio-oils, as no ESP was used to collect the bio-oils. Similarly, Ben et al. [43] found the total OH concentrations to be 6.50 mmol g−1, 6.30 mmol g−1, and 7.68 mmol g−1 for bio-oils from Douglas fir bark, raw pine bark, and pine bark, respectively. The higher OH concentrations were due to the application of bark as the feedstock material, which yielded higher levels of aliphatic OH. In this study, the aliphatic OH concentration was the maximum (2.02 mmol g−1) for the Douglas fir bio-oil. The increased number of aliphatic OH groups in the Douglas fir bio-oil can be attributed to cellulose decomposition, which yields levoglucosan as the primary product [44]. Levoglucosan (which has three aliphatic OH groups) is formed after the cleavage of cellulosic glycosidic bonds [40]. The GC-MS results also show that Douglas fir bio-oil includes a significant percentage of levoglucosan. After aliphatic OH, catechol, guaiacol, and p-hydroxy-phenyl OH were found to be the dominant OH groups for Douglas fir, while for eucalyptus and poplar bio-oils, these were the predominant OH groups. Furthermore, the presence of these OH groups may be ascribed to the breakage of the β-O-4 bonds present in the lignin [45,46]. The dominance of catechol, guaiacol, and p-hydroxy-phenyl OH over aliphatic OH in the eucalyptus and poplar bio-oils can be ascribed to lignin depolymerization.
The ANOVA test was performed on the OH numbers for the different bio-oils with a level of significance α = 0.05. The p-value obtained was 0.03, which is less than α. Thus, the OH concentration was affected by the type of biomass. Tukey’s test showed that poplar bio-oil had a significantly greater OH concentration than Douglas fir and eucalyptus bio-oils. The higher OH concentration of poplar is due to the presence of a large number of β-O-4 bonds in poplar, which results in a higher number of H-lignin and S-lignin compounds in the bio-oil, as observed from the GC-MS results [31,33,39]. Bio-oil with higher concentrations of OH can be used to replace a higher proportion of synthetic phenols during resin synthesis reactions. Thus, based on the OH concentration, it could be concluded that poplar as a feedstock would be a suitable choice for the synthesis of bio-resins such as phenol-formaldehyde, phenol-acetaldehyde, and epoxy, which could be used in 3D printing of bio-based materials [3,21].

3.4. Characterization of Bio-Chars

3.4.1. Ultimate and Proximate Analyses

As most of the volatile content available in the biomass was converted into bio-oil, the volatile content of the bio-chars was found to be less than 30%. This led to an increase in the fixed carbon content of the bio-chars (Table 3). The bio-chars obtained from the pyrolysis of Douglas fir and poplar had up to 78.12% and 85.74% elemental carbon, similar to the results from Wu et al. [34] and Chen et al. [47], respectively. The elemental hydrogen, nitrogen, and sulfur contents are fairly close to the results obtained in previous studies [34,47].

3.4.2. High Heating Value (HHV)

The HHV of the bio-chars is presented on a dry ash-free basis. The poplar bio-char contained the highest HHV, at 38.23 MJ kg−1 (Table 3), which is close to that of the previous study [17]. This can be attributed to the higher carbon contents in the bio-char. The HHVs for the Douglas fir and eucalyptus bio-chars were 28.43 and 32.66 MJ kg−1, respectively, which are comparable to the HHVs of the bio-chars obtained by Wu et al. [34] and Heidari et al. [14].

3.5. Reaction Mechanism

Lignocellulosic biomass constitutes cellulose, hemicellulose, and lignin. Pyrolysis at elevated temperatures causes the thermal decomposition of these available natural polymers to generate bio-char, non-condensable gases, organic monomeric compounds, dimers, and oligomers (Table S2). Bio-char is formed from biomass carbonization and the repolymerization of monomers, dimers, and oligomers. Under high-temperature fast pyrolysis, cellulose undergoes three distinct processes, dehydration, depolymerization, and decomposition, to yield levoglucosan and other anhydrosugars. Lu et al. [48] explained that the breakage of the glycosidic bonds present in cellulose leads to the formation of reducing sugars; however, during fast pyrolysis, the complete breakage of all glycosidic (β-1-4) bonds becomes impossible, which leads to the formation of levoglucosan, along with various anhydrous disaccharides and oligosaccharides, having multiple degrees of polymerization. However, these dimers and oligomers were not detected from GC. Levoglucosan was each bio-oil’s primary carbohydrate-derived organic compound (Table S2). In addition to levoglucosan, the other primary carbohydrate-derived compounds were 2-hydroxy-2-cyclopenten-1-one, 3-methyl-1,2-cyclopentanedione, D-allose, and furfural, which were formed from thermal degradation, including ring opening, ring cleavage, and rearrangement reactions occurring in the hemicellulose [49]. The breakage of the glycosidic (β-1-4) bonds present in hemicellulose might produce dimers, oligomers, and monomeric compounds.
The pyrolysis of lignin produces oligomers, dimers, and monomeric compounds. The phenolic monomer compounds represented by H-lignin, G-lignin, and S-lignin are made from the cleavage of C-C, C-O, or β-O-4 bonds at a high temperature. The major H-lignin compounds were phenolic monomers like 4-methyl-1,2-benzenediol, 3-methyl-1,2-benzenediol, 4-ethyl-1,3-benzenediol, hydroquinone, and phenol. The production of these monomers is due to the cleavage of the C-C or β-O-4 bonds present in lignin. The separation of β-O-4 of the guaiacol unit led to the formation of G-lignin compounds. Several 2-methoxy phenolic compounds are examples of G-type lignin compounds. 2, 6-dimethoxy phenolic compounds, grouped into S-lignin compounds, were present in the eucalyptus and poplar bio-oils, which can be ascribed to the breakage of β-O-4 bonds, in addition to the Cα and Cβ linkages present in the syringol unit of the lignin. The monomers formed during pyrolysis reactions can undergo repolymerization reactions to form their respective dimers and oligomers. The breakage of β-O-4 bonds leads to an increase in the OH concentration of the bio-oil.
Bio-char formed during the pyrolysis process flows to the filter area (Figure 1), along with pyrolysis vapors. The filter allows only pyrolysis vapors to pass through it, trapping the bio-char in the filtration chamber. The bio-char trapped in the filtration chamber acts as the catalyst, performing catalytic cracking of the pyrolysis vapors. The emergence of cellulosic, hemicellulosic, and lignin-derived monomers can also be attributed to such catalytic cracking of the pyrolysis vapors by the bio-char.

4. Conclusions

The effects of different woody biomasses (Douglas fir, eucalyptus, and poplar) on bio-oil composition were investigated comprehensively. As a novelty, this research includes quantification of the hydroxyl groups (-OH) with the help of 31P-NMR analysis, which is helpful for preparing bio-based resins. The effective pyrolysis of poplar led to the highest carbon content (69.16%) in the poplar bio-oil and a higher OH concentration (6.06 mmol g−1). This can be ascribed to a higher number of β-O-4 bonds, which leads to an increase in lignin-derived compounds (phenolics). Poplar as a feedstock would be a suitable choice for resin synthesis.

Supplementary Materials

The following supporting information can be downloaded at https://www.mdpi.com/article/10.3390/en17122800/s1. Table S1: Characterization methods for feedstocks, bio-oils, bio-chars, and aqueous phases [50,51]; Table S2: Compounds from the GC-MS of bio-oils from pyrolysis of Douglas fir, eucalyptus, and poplar; Table S3: Total organic carbon (TOC) and total nitrogen (TN) contents of the aqueous phases; Figure S1: Fourier infrared transform (FTIR) spectra of bio-oils from Douglas fir, eucalyptus, and poplar.

Author Contributions

Writing—original draft, methodology, investigation, formal analysis, data curation, M.S.; investigation, A.K.; investigation, B.B.; writing—review and editing, visualization, S.K.; conceptualization, funding acquisition, supervision, S.A. All authors have read and agreed to the published version of the manuscript.

Funding

This research was funded by the National Science Foundation (NSF-OIA-2119809) and the United States Department of Agriculture-Agricultural Research Services under a non-assistance cooperative agreement (58-6010-2-005).

Data Availability Statement

The data are contained within the article.

Conflicts of Interest

The authors declare no conflicts of interest.

References

  1. Barreto, R.A. Fossil Fuels, Alternative Energy and Economic Growth. Econ. Model. 2018, 75, 196–220. [Google Scholar] [CrossRef]
  2. Hoang, A.T.; Ong, H.C.; Fattah, I.M.R.; Chong, C.T.; Cheng, C.K.; Sakthivel, R.; Ok, Y.S. Progress on the Lignocellulosic Biomass Pyrolysis for Biofuel Production toward Environmental Sustainability. Fuel Process. Technol. 2021, 223, 106997. [Google Scholar] [CrossRef]
  3. Bansode, A.; Barde, M.; Asafu-Adjaye, O.; Patil, V.; Hinkle, J.; Via, B.K.; Adhikari, S.; Adamczyk, A.J.; Farag, R.; Elder, T.; et al. Synthesis of Biobased Novolac Phenol–Formaldehyde Wood Adhesives from Biorefinery-Derived Lignocellulosic Biomass. ACS Sustain. Chem. Eng. 2021, 9, 10990–11002. [Google Scholar] [CrossRef]
  4. Mu, L.; Dong, Y.; Li, L.; Gu, X.; Shi, Y. Achieving High Value Utilization of Bio-Oil from Lignin Targeting for Advanced Lubrication. ES Mater. Manuf. 2021, 11, 72–80. [Google Scholar] [CrossRef]
  5. Pappa, C.; Feghali, E.; Vanbroekhoven, K.; Triantafyllidis, K.S. Recent Advances in Epoxy Resins and Composites Derived from Lignin and Related Bio-Oils. Curr. Opin. Green Sustain. Chem. 2022, 38, 100687. [Google Scholar] [CrossRef]
  6. Yang, L.; Wang, X.-C.; Dai, M.; Chen, B.; Qiao, Y.; Deng, H.; Zhang, D.; Zhang, Y.; Villas Bôas de Almeida, C.M.; Chiu, A.S.F.; et al. Shifting from Fossil-Based Economy to Bio-Based Economy: Status Quo, Challenges, and Prospects. Energy 2021, 228, 120533. [Google Scholar] [CrossRef]
  7. Bhattarai, A.; Kemp, A.; Jahromi, H.; Kafle, S.; Adhikari, S. Thermochemical Characterization and Kinetics of Biomass, Municipal Plastic Waste, and Coal Blends and Their Potential for Energy Generation via Gasification. ACS Omega 2023, 8, 45985–46001. [Google Scholar] [CrossRef]
  8. Arun, J.; Gopinath, K.P.; SundarRajan, P.; Malolan, R.; AjaySrinivaasan, P. Hydrothermal Liquefaction and Pyrolysis of Amphiroa Fragilissima Biomass: Comparative Study on Oxygen Content and Storage Stability Parameters of Bio-Oil. Bioresour. Technol. Rep. 2020, 11, 100465. [Google Scholar] [CrossRef]
  9. Liaw, S.-S.; Wang, Z.; Ndegwa, P.; Frear, C.; Ha, S.; Li, C.-Z.; Garcia-Perez, M. Effect of Pyrolysis Temperature on the Yield and Properties of Bio-Oils Obtained from the Auger Pyrolysis of Douglas Fir Wood. J. Anal. Appl. Pyrolysis 2012, 93, 52–62. [Google Scholar] [CrossRef]
  10. Wang, G.; Fan, B.; Chen, H.; Li, Y. Understanding the Pyrolysis Behavior of Agriculture, Forest and Aquatic Biomass: Products Distribution and Characterization. J. Energy Inst. 2020, 93, 1892–1900. [Google Scholar] [CrossRef]
  11. Wan Sulaiman, W.R.; Lee, E.S. Pyrolysis of Eucalyptus Wood in a Fluidized-Bed Reactor. Res. Chem. Intermed. 2012, 38, 2025–2039. [Google Scholar] [CrossRef]
  12. Aboelela, D.; Saleh, H.; Attia, A.M.; Elhenawy, Y.; Majozi, T.; Bassyouni, M. Recent Advances in Biomass Pyrolysis Processes for Bioenergy Production: Optimization of Operating Conditions. Sustainability 2023, 15, 11238. [Google Scholar] [CrossRef]
  13. Bok, J.P.; Choi, Y.S.; Choi, S.K.; Jeong, Y.W. Fast Pyrolysis of Douglas Fir by Using Tilted-Slide Reactor and Characteristics of Biocrude-Oil Fractions. Renew. Energy 2014, 65, 7–13. [Google Scholar] [CrossRef]
  14. Heidari, A.; Stahl, R.; Younesi, H.; Rashidi, A.; Troeger, N.; Ghoreyshi, A.A. Effect of Process Conditions on Product Yield and Composition of Fast Pyrolysis of Eucalyptus Grandis in Fluidized Bed Reactor. J. Ind. Eng. Chem. 2014, 20, 2594–2602. [Google Scholar] [CrossRef]
  15. Oh, S.; Seok Choi, H.; Choi, I.-G.; Weon Choi, J. Evaluation of Hydrodeoxygenation Reactivity of Pyrolysis Bio-Oil with Various Ni-Based Catalysts for Improvement of Fuel Properties. RSC Adv. 2017, 7, 15116–15126. [Google Scholar] [CrossRef]
  16. Pienihäkkinen, E.; Leijenhorst, E.J.; Wolters, W.; Lindfors, C.; Lahtinen, J.; Ohra-aho, T.; Oasmaa, A. Valorization of Eucalyptus, Giant Reed Arundo, Fiber Sorghum, and Sugarcane Bagasse via Fast Pyrolysis and Subsequent Bio-Oil Gasification. Energy Fuels 2022, 36, 12021–12030. [Google Scholar] [CrossRef]
  17. Kim, K.H.; Eom, I.Y.; Lee, S.M.; Choi, D.; Yeo, H.; Choi, I.-G.; Choi, J.W. Investigation of Physicochemical Properties of Biooils Produced from Yellow Poplar Wood (Liriodendron Tulipifera) at Various Temperatures and Residence Times. J. Anal. Appl. Pyrolysis 2011, 92, 2–9. [Google Scholar] [CrossRef]
  18. Raza, M.; Inayat, A.; Ahmed, A.; Jamil, F.; Ghenai, C.; Naqvi, S.R.; Shanableh, A.; Ayoub, M.; Waris, A.; Park, Y.-K. Progress of the Pyrolyzer Reactors and Advanced Technologies for Biomass Pyrolysis Processing. Sustainability 2021, 13, 11061. [Google Scholar] [CrossRef]
  19. Hu, S.; Wan, C.; Li, Y. Production and Characterization of Biopolyols and Polyurethane Foams from Crude Glycerol Based Liquefaction of Soybean Straw. Bioresour. Technol. 2012, 103, 227–233. [Google Scholar] [CrossRef]
  20. Uprety, B.K.; Reddy, J.V.; Dalli, S.S.; Rakshit, S.K. Utilization of Microbial Oil Obtained from Crude Glycerol for the Production of Polyol and Its Subsequent Conversion to Polyurethane Foams. Bioresour. Technol. 2017, 235, 309–315. [Google Scholar] [CrossRef]
  21. Xu, J.; Brodu, N.; Mignot, M.; Youssef, B.; Taouk, B. Synthesis and Characterization of Phenolic Resins Based on Pyrolysis Bio-Oil Separated by Fractional Condensation and Water Extraction. Biomass Bioenergy 2022, 159, 106393. [Google Scholar] [CrossRef]
  22. Elkasabi, Y.; Mullen, C.A.; Boateng, A.A.; Brown, A.; Timko, M.T. Flash Distillation of Bio-Oils for Simultaneous Production of Hydrocarbons and Green Coke. Ind. Eng. Chem. Res. 2019, 58, 1794–1802. [Google Scholar] [CrossRef]
  23. Heo, H.S.; Park, H.J.; Park, Y.-K.; Ryu, C.; Suh, D.J.; Suh, Y.-W.; Yim, J.-H.; Kim, S.-S. Bio-Oil Production from Fast Pyrolysis of Waste Furniture Sawdust in a Fluidized Bed. Bioresour. Technol. 2010, 101, S91–S96. [Google Scholar] [CrossRef]
  24. Alaejos, J.; Tapias, R.; López, F.; Romero, D.; Ruiz, F.; Fernández, M. Biomass Production and Quality of Twelve Fast-Growing Tree Taxa in Short Rotation under Mediterranean Climate. Forests 2023, 14, 1156. [Google Scholar] [CrossRef]
  25. Coleman, M.D.; Shaw, T.M.; Kimsey, M.J.; Moore, J.A. Nutrition of Douglas-Fir in the Inland Northwest. Soil Sci. Soc. Am. J. 2014, 78, S11–S22. [Google Scholar] [CrossRef]
  26. Fonseca, F.G.; Funke, A.; Niebel, A.; Soares Dias, A.P.; Dahmen, N. Moisture Content as a Design and Operational Parameter for Fast Pyrolysis. J. Anal. Appl. Pyrolysis 2019, 139, 73–86. [Google Scholar] [CrossRef]
  27. Uzun, B.B.; Pütün, A.E.; Pütün, E. Composition of Products Obtained via Fast Pyrolysis of Olive-Oil Residue: Effect of Pyrolysis Temperature. J. Anal. Appl. Pyrolysis 2007, 79, 147–153. [Google Scholar] [CrossRef]
  28. Mariyam, S.; Alherbawi, M.; Pradhan, S.; Al-Ansari, T.; McKay, G. Biochar Yield Prediction Using Response Surface Methodology: Effect of Fixed Carbon and Pyrolysis Operating Conditions. Biomass Convers. Biorefinery 2023, 1–14. [Google Scholar] [CrossRef]
  29. Li, Y.; Khanal, S.K. Bioenergy: Principles and Applications; John Wiley & Sons: Hoboken, NJ, USA, 2016; ISBN 978-1-118-56831-6. [Google Scholar]
  30. McKendry, P. Energy Production from Biomass (Part 1): Overview of Biomass. Bioresour. Technol. 2002, 83, 37–46. [Google Scholar] [CrossRef]
  31. Yoo, C.G.; Pu, Y.; Li, M.; Ragauskas, A.J. Elucidating Structural Characteristics of Biomass Using Solution-State 2 D NMR with a Mixture of Deuterated Dimethylsulfoxide and Hexamethylphosphoramide. ChemSusChem 2016, 9, 1090–1095. [Google Scholar] [CrossRef] [PubMed]
  32. Sakhakarmy, M.; Kafle, S.; Adhikari, S. Upcycling of Pine and Sodium Silicate Composites through Pyrolysis: Effects of Pyrolysis Temperature and Sodium Silicate Content. Energy Convers. Manag. X 2024, 23, 100615. [Google Scholar] [CrossRef]
  33. Sannigrahi, P.; Ragauskas, A.J.; Tuskan, G.A. Poplar as a Feedstock for Biofuels: A Review of Compositional Characteristics. Biofuels Bioprod. Biorefining 2010, 4, 209–226. [Google Scholar] [CrossRef]
  34. Wu, S.-R.; Chang, C.-C.; Chang, Y.-H.; Wan, H.-P. Comparison of Oil-Tea Shell and Douglas-Fir Sawdust for the Production of Bio-Oils and Chars in a Fluidized-Bed Fast Pyrolysis System. Fuel 2016, 175, 57–63. [Google Scholar] [CrossRef]
  35. Santos, J.; Ouadi, M.; Jahangiri, H.; Hornung, A. Valorisation of Lignocellulosic Biomass Investigating Different Pyrolysis Temperatures. J. Energy Inst. 2020, 93, 1960–1969. [Google Scholar] [CrossRef]
  36. Han-u-domlarpyos, V.; Kuchonthara, P.; Reubroycharoen, P.; Hinchiranan, N. Quality Improvement of Oil Palm Shell-Derived Pyrolysis Oil via Catalytic Deoxygenation over NiMoS/γ-Al2O3. Fuel 2015, 143, 512–518. [Google Scholar] [CrossRef]
  37. Nolte, M.W.; Liberatore, M.W. Viscosity of Biomass Pyrolysis Oils from Various Feedstocks. Energy Fuels 2010, 24, 6601–6608. [Google Scholar] [CrossRef]
  38. Grønli, M.G.; Várhegyi, G.; Di Blasi, C. Thermogravimetric Analysis and Devolatilization Kinetics of Wood. Ind. Eng. Chem. Res. 2002, 41, 4201–4208. [Google Scholar] [CrossRef]
  39. Han, S.; Zhang, X.; Wang, R.; Wang, K.; Jiang, J.; Xu, J. Electrocatalytic Conversion of G-Type and S-Type Phenolic Compounds from Different Tree Species in a Heteropolyacid Fluidized System. Chem. Eng. J. 2023, 452, 139299. [Google Scholar] [CrossRef]
  40. Tang, Z.; Wang, Y.; Chen, M.; Li, H.; Li, L.; Zhou, Z.; Li, C.; Yang, Z.; Wang, J. Lignin Catalytic Depolymerization for Phenolic Monomers: Boosting the Selective Cleavage of β-O-4 Bonds of Lignin by Mo–O and Al(IV)–O–BO2 Interfacial Sites in B–Mo/Sepiolite. ACS Sustain. Chem. Eng. 2023, 11, 16722–16738. [Google Scholar] [CrossRef]
  41. Biswas, B.; Sakhakarmy, M.; Rahman, T.; Jahromi, H.; Adhikari, S.; Krishna, B.B.; Bhaskar, T.; Baltrusaitis, J.; Eisa, M.; Kouzehkanan, S.M.T.; et al. Selective Production of Phenolic Monomer via Catalytic Depolymerization of Lignin over Cobalt-Nickel-Zirconium Dioxide Catalyst. Bioresour. Technol. 2024, 398, 130517. [Google Scholar] [CrossRef]
  42. David, K.; Kosa, M.; Williams, A.; Mayor, R.; Realff, M.; Muzzy, J.; Ragauskas, A. 31P-NMR Analysis of Bio-Oils Obtained from the Pyrolysis of Biomass. Biofuels 2010, 1, 839–845. [Google Scholar] [CrossRef]
  43. Ben, H.; Wu, F.; Wu, Z.; Han, G.; Jiang, W.; Ragauskas, A.J. A Comprehensive Characterization of Pyrolysis Oil from Softwood Barks. Polymers 2019, 11, 1387. [Google Scholar] [CrossRef] [PubMed]
  44. Ben, H.; Ragauskas, A.J. Heteronuclear Single-Quantum Correlation–Nuclear Magnetic Resonance (HSQC–NMR) Fingerprint Analysis of Pyrolysis Oils. Energy Fuels 2011, 25, 5791–5801. [Google Scholar] [CrossRef]
  45. Ben, H.; Ragauskas, A.J. NMR Characterization of Pyrolysis Oils from Kraft Lignin. Energy Fuels 2011, 25, 2322–2332. [Google Scholar] [CrossRef]
  46. Li, C.; Zhao, X.; Wang, A.; Huber, G.W.; Zhang, T. Catalytic Transformation of Lignin for the Production of Chemicals and Fuels. Chem. Rev. 2015, 115, 11559–11624. [Google Scholar] [CrossRef] [PubMed]
  47. Chen, D.; Li, Y.; Cen, K.; Luo, M.; Li, H.; Lu, B. Pyrolysis Polygeneration of Poplar Wood: Effect of Heating Rate and Pyrolysis Temperature. Bioresour. Technol. 2016, 218, 780–788. [Google Scholar] [CrossRef] [PubMed]
  48. Lu, Q.; Yang, X.; Dong, C.; Zhang, Z.; Zhang, X.; Zhu, X. Influence of Pyrolysis Temperature and Time on the Cellulose Fast Pyrolysis Products: Analytical Py-GC/MS Study. J. Anal. Appl. Pyrolysis 2011, 92, 430–438. [Google Scholar] [CrossRef]
  49. Dutta, S.; Bhat, N.S. Catalytic Transformation of Biomass-Derived Furfurals to Cyclopentanones and Their Derivatives: A Review. ACS Omega 2021, 6, 35145–35172. [Google Scholar] [CrossRef] [PubMed]
  50. Soest, P.J.V.; Wine, R.H. Use of Detergents in the Analysis of Fibrous Feeds. IV. Determination of Plant Cell-Wall Constituents. J. Assoc. Off. Anal. Chem. 1967, 50, 50–55. [Google Scholar] [CrossRef]
  51. Celikbag, Y.; Via, B.K.; Adhikari, S.; Buschle-Diller, G.; Auad, M.L. The effect of ethanol on hydroxyl and carbonyl groups in biopolyol produced by hydrothermal liquefaction of loblolly pine: 31P-NMR and 19F-NMR analysis. Bioresour. Technol. 2016, 214, 37–44. [Google Scholar] [CrossRef]
Figure 1. Schematic diagram of the pyrolysis experimental setup.
Energies 17 02800 g001
Figure 2. TGA and derivative thermogravimetry (DTG) curves for bio-oils from Douglas fir, eucalyptus, and poplar.
Energies 17 02800 g002
Table 1. Proximate, ultimate, and component analysis results for Douglas fir, eucalyptus, and poplar.
Analysis TypeFeedstock
Douglas FirEucalyptusPoplar
Proximate (%)
Moisture content (wb) #8.78 ± 0.79 a7.38 ± 0.03 b8.37 ± 0.31 ab
Volatile content (db)90.35 ± 0.19 a86.86 ± 0.82 b88.41 ± 0.38 ab
Ash content (db)0.10 ± 0.06 a1.15 ± 0.19 b0.60 ± 0.17 c
Fixed carbon *9.5512.0710.99
Ultimate (%, db)
C52.61 ± 0.13 a51.00 ± 0.14 b51.53 ± 0.18 c
H7.10 ± 0.34 a7.17 ± 0.15 a7.33 ± 0.05 a
N0.25 ± 0.040.25 ± 0.020.24 ± 0.01
S0.01 ± 0.010.01 ± 0.000.01 ± 0.01
O *40.03 ± 0.20 41.57 ± 0.2240.89± 0.23
Components (%, db, ash free)
Cellulose47.0651.7053.33
Hemicellulose10.7512.3913.34
Lignin27.4323.8018.45
wb = wet basis, db = dry basis. Proximate and ultimate analysis experiments were conducted three times. # Statistical test results at level of significance = 0.05; different letters (a, b, c) denote significant differences among the results, * = calculated by the difference.
Table 2. Yields of the bio-oil, aqueous phase, bio-char, and gaseous products from different biomasses.
Biomass TypeYield (%, Dry Basis)
Condensed LiquidBio-CharGas and Loss
Organic Phase (Bio-Oil)Aqueous PhaseTotal
Douglas Fir16.7821.1537.9323.5838.49
Eucalyptus17.7521.8739.6221.1339.25
Poplar18.5221.5340.0519.0240.93
Table 3. Physiochemical properties of bio-oils and bio-chars obtained from pyrolysis of Douglas fir, eucalyptus, and poplar.
Analysis TypeDouglas FirEucalyptusPoplar
Bio-OilBio-Char +Bio-OilBio-Char +Bio-OilBio-Char +
Proximate (%)
Aqueous/moisture content (wb) *8.36 ± 0.350.72 ± 0.256.46 ± 0.260.60 ± 0.054.05 ± 0.250.64 ± 0.13
Volatile content (db)98.27 ± 0.3025.94 ± 0.1796.07 ± 0.8912.90 ± 1.2295.20 ± 0.2123.97 ± 0.11
Ash content (db)0.02 ± 0.011.09 ± 0.180.02 ± 0.005.56 ± 0.790.01 ± 0.003.00 ± 0.38
Fixed carbon (db) **1.7172.973.9181.554.7973.04
Ultimate (%, db)
C #60.98 ± 0.16 a70.32 ± 0.9063.44 ± 0.05 b95.16 ± 0.7369.16 ± 0.20 c90.35 ± 0.23
H6.66 ± 0.26 a3.06 ± 0.016.44 ± 0.17 a3.56 ± 0.076.64 ± 0.29 a8.66 ± 0.30
N0.00 ± 0.000.01 ± 0.000.17 ± 0.010.41 ± 0.060.16 ± 0.040.18 ± 0.08
S0.04 ± 0.000.03 ± 0.000.06 ± 0.010.03 ± 0.010.05 ± 0.030.08 ± 0.01
O **32.32 ± 0.4226.57 ± 0.6629.89 ± 0.240.84 ± 0.7324.00 ± 0.510.73 ± 0.61
HHV (MJ kg−1)22.95 ± 1.0028.43 ± 1.0924.26 ± 0.1532.66 ± 2.0625.32 ± 1.9238.23 ± 0.23
TAN (mg KOH g−1)56.37 ± 1.41 46.91 ± 1.39NA35.53 ± 0.96NA
Density (g cm−3)1.22 1.17NA1.17NA
Kinematic viscosity (mm2 s−1)123.5 ± 0.71 83.3 ± 0.85NA114 ± 0.71NA
wb = wet basis, db = dry basis; * aqueous content for bio-oil and moisture content for bio-char; ** calculated by the difference; + ultimate and HHV results for bio-chars are on an ash-free basis; proximate and ultimate analysis experiments were conducted three times; # statistical test results at a level of significance = 0.05; different letters denote a significant difference among the results.
Table 4. Organic compounds present in the bio-oils of Douglas fir, eucalyptus, and poplar.
Compound TypeBio-Oil Source (Area%)
Douglas FirEucalyptusPoplar
Carbohydrate-derived44.4826.4218.94
Lignin-derived42.2960.6267.04
H-lignin9.5938.7733.74
G-lignin32.7017.3822.83
S-lignin0.004.4710.47
Table 5. Hydroxyl group contents of pyrolysis oils produced from Douglas fir, eucalyptus, and poplar at 500 °C.
Aliphatic OHC5-Substituted Guaiacol Phenolic OHCatechol, Guaiacol, and p-Hydroxy-Phenyl OHAcid-OHTotal *
Integration region (ppm)150.0–145.0144.7–140.2140.2–137.3136.6–133.6150.0–136.6
Douglas fir2.02 ± 0.320.20 ± 0.041.25 ± 0.160.60 ± 0.034.06 ± 0.18 a
Eucalyptus1.37 ± 0.420.51 ± 0.111.80 ± 0.010.67 ± 0.014.35 ± 0.53 a
Poplar1.69 ± 0.210.70 ± 0.193.24 ± 0.300.43 ± 0.146.06 ± 0.08 b
31P-NMR experiments were conducted twice. * Statistical test results are at a level of significance = 0.05. Different letters (a, b) denote significant differences among the results. Increasing order of the letters indicates an increase in the OH concentration.
Disclaimer/Publisher’s Note: The statements, opinions and data contained in all publications are solely those of the individual author(s) and contributor(s) and not of MDPI and/or the editor(s). MDPI and/or the editor(s) disclaim responsibility for any injury to people or property resulting from any ideas, methods, instructions or products referred to in the content.

