Abstract
Aircraft taxiing emissions are the main source of carbon dioxide and other pollutant gas emissions during airport ground operations. It is crucial to optimize aircraft taxiing from both spatial and temporal perspectives to improve airport operation efficiency and reduce aviation emissions. In this paper, a bilevel spatial and temporal optimization model of aircraft taxiing is constructed. The upper-level model optimizes the aircraft taxiing path, and the lower-level model optimizes the taxiing start time of the aircraft. By the iterative optimization of the upper- and lower-level interactions, the aviation fuel consumption, flight waiting time, and number of taxiing conflicts are reduced. To improve the calculation accuracy, the depth-first search algorithm is utilized to generate the set of available paths for aircraft during the model solution process, and a model solution method based on the genetic algorithm is constructed. Simulation experiments using Tianjin Binhai International Airport as the research object show that adopting the waiting taxiing strategy can effectively avoid taxiing conflicts and reduce aviation fuel consumption by 753.18 kg and 188.84 kg compared to the available path sets generated using Dijkstra’s algorithm and those created manually based on experience, respectively. Conversely, adopting an immediate taxi-out strategy caused 54 taxiing conflicts and increased aviation fuel consumption by 49.44 kg. These results can provide safe and environmentally friendly taxiing strategies for the sustainable development of the air transportation industry.
1. Introduction
With rapid socio-economic development, the issue of climate change is becoming increasingly serious. Various industries have begun to implement emissions reduction measures in response to the “peak carbon” target. The aviation industry is no exception, and the International Air Transport Association (IATA) has announced that the industry will achieve net-zero emissions by 2050. The aviation industry accounts for approximately 2 to 3% of carbon dioxide emissions from human activities [1,2]. Optimizing transportation operations is an important way for the aviation industry to achieve energy savings and emissions reductions in a short period [3,4,5]. Airports, as the origins and destinations of air transportation, have a strong correlation with the ground operation efficiency and greenhouse gas emissions. Aircraft taxiing path optimization is helpful to improve ground operation efficiency [6] and reduce carbon dioxide emissions [7,8,9], which are important for the air transportation industry to achieve energy savings and emissions reductions.
Several studies have been carried out for the aircraft taxi path optimization problem. Weiszer [10] introduced the speed curve to optimize the taxiing speeds of aircraft and constructed a model with taxiing time and fuel consumption as the optimization objective to construct the model. The experimental results showed that this method could further reduce the taxiing cost without increasing the computation time. Mojdeh [11] proposed a hybrid taxiing method where part of the taxiing procedure was performed by an electric trailer to reduce carbon emissions and avoid taxiing conflicts. An economic analysis was performed for the use of electric trailers. Feng [12] analyzed the environmental impacts of different taxiing modes on reducing fuel consumption during the aircraft taxiing process. In addition, the peak carbon potential of each taxiing mode was analyzed by predicting each mode’s carbon emissions. Several aircraft taxi path optimization studies are summarized in Table 1.

Table 1.
Literature review on aircraft taxi path optimization.
Although many studies have designed intelligent optimization algorithms to solve the problem with the taxiing time or the number of conflicts as the objective, the impact of the taxiing path on the climate has not been examined in depth in some papers, and the focus has been primarily on the aviation fuel consumption. To reduce the emissions generated by aircraft taxiing, scholars have mostly optimized the taxiing path or taxiing speed to minimize taxiing conflicts. Few scholars have focused on the impact of the aircraft taxiing start time on the ground operations, which directly affect the taxi path selection and thus airport ground operation safety and efficiency [25,26]. The sets of available paths for aircraft in the existing studies were mostly generated by shortest path search algorithms, such as the Dijkstra algorithm, or manual experience assignment by controllers. Such methods cannot find all feasible paths for flights, which reduces the diversity and possibility of optimal taxi path solutions. Different sets of available paths also directly affect the optimal taxiing scheme. In addition, the shortest path search algorithm only aims at the shortest distance, ignoring the impact of the number of turns on the fuel consumption, but aircraft turns will increase additional aviation fuel consumption [21].
Therefore, in this study, a bilevel spatial–temporal optimization model for aircraft taxiing was constructed considering environmental impacts. The model comprehensively considers environmental, safety, and efficiency factors, such as aviation fuel consumption, the number of turns, the number of taxiing conflicts, and the total aircraft waiting time. An upper-level model optimizes the aircraft taxiing path from the spatial dimension, and a lower-level model optimizes the aircraft taxiing time from the temporal dimension. Aviation fuel consumption, flight waiting times, and the numbers of taxiing conflicts are reduced through the interactive iterative optimization of the upper-level and lower-level models. In this study, the depth-first search (DFS) algorithm was used to generate the set of available paths for aircraft in the model solution process, and a solution method based on a genetic algorithm was designed. Finally, Tianjin Binhai International Airport was taken as the research object for the simulation experiments.
The rest of this paper is organized as follows. In Section 2, an aircraft bilevel spatial–temporal optimization model is constructed, and the relevant formulas and constraints of the model are presented. In Section 3, the use of the DFS method to obtain the set of available paths for flights is discussed, and the genetic algorithm for solving the bilevel model is introduced. In Section 4, an experimental analysis is carried out based on the flight operation schedule of the Tianjin Binhai International Airport. In Section 5, the full paper is summarized, optimization suggestions are presented, and directions for future research are suggested.
2. Bilevel Programing Model
Aircraft taxiing is the primary form of fuel consumption during ground operations, and aviation fuel combustion generates large amounts of CO2, hydrocarbons (HCs), CO, NOX, SO2, and other pollutant gases. In addition, ground taxiing conflicts include intersection conflicts, rear-end conflicts, and head-on conflicts (as shown in Figure 1), which will reduce the efficiency and safety of ground operations, and increase the fuel consumption. Therefore, taxiing conflicts should be avoided as much as possible in the taxiing scheme.
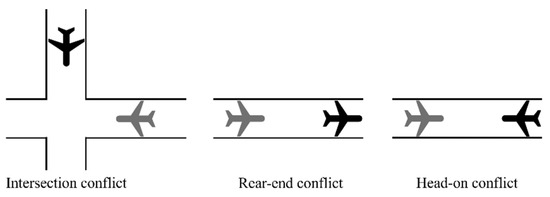
Figure 1.
Taxiing conflicts on the ground.
The bilevel spatial–temporal optimization model constructed in this paper comprehensively considers factors such as the aviation fuel consumption, aircraft waiting time, number of turns, and taxiing conflicts.
The upper-level model optimizes the aircraft taxiing path to reduce fuel consumption from the spatial perspective based on the current optimal aircraft taxiing start time of the lower-level model and passes the optimal taxiing path scheme to the lower-level model. The lower-level model accepts the current optimal aircraft taxiing path scheme of the upper-level model, optimizes the flight taxiing time from the temporal perspective to reduce the flight waiting time, and passes the optimal aircraft waiting time scheme to the upper-level model. The upper- and lower-level models continuously interact and iteratively optimize to finally obtain the optimal solution.
The following assumptions are specified before the model is constructed.
(1) Arriving flights start taxiing later than the scheduled arrival time.
(2) Departing flights finish taxiing earlier than the scheduled departure time.
(3) Departing flights stop check-in and begin boarding 35 min before the scheduled departure time [27].
(4) The time required for the entire boarding process is set to 20 min [28,29], Tboard = 20 min.
(5) Aircraft taxi at the same speed in the taxiway area, v1 = 10 (m·s−1).
(6) Aircraft taxi at the same speed in the apron area, v2 = 15 (km·h−1).
(7) Changes in the speed of the aircraft during starting, braking, and turning are not considered.
2.1. Upper-Level Model Spatial Planning
The upper-level model optimizes the aircraft taxi path from the spatial dimension. Aviation fuel combustion is the main pathway for carbon dioxide and pollutant gas generation during ground operations, which negatively affect the climate environment. The upper-level model integrates the effects of the taxiing time, number of aircraft engines, fuel flow rate [7,9], number of turns [26], and number of taxiing conflicts on the fuel consumption and takes minimizing the total aviation fuel consumption of the arriving and departing aircrafts as the optimization objective, which is denoted as fupper. To reduce the number of taxiing conflicts, a penalty factor M is applied to the number of taxiing conflicts. To reduce the number of aircraft turns, a penalty factor Tturn is applied to the number of turns. The optimization objective of the upper-level model is shown as follows:
where Ti is the total taxiing time of aircraft i; ni is the number of engines of aircraft i; ratei is the fuel flow rate of aircraft i under idle conditions, which is obtained from the International Civil Aviation Organization (ICAO) Engine Emissions Database [30]; Tturn is the turn penalty time of aircraft i; Nturni is the number of turns of aircraft i; and Conf is the total number of taxiing conflicts.
To avoid taxiing conflicts caused by aircrafts during ground operations, the relevant constraints are as follows:
where Ri,p,k is a Boolean variable such that Ri,p,k = 1 if aircraft i passes through node p before node k; otherwise, it equals 0. Ri,j,k is a Boolean variable such that Ri,j,k = 1 if aircraft i passes through node k before aircraft j, and otherwise, it equals 0. Tmin is the safe taxiing interval time. Equation (2) ensures that the taxi path of aircraft i is continuous. Equation (3) ensures that flights passing through the same node successively should be guaranteed the minimum safety interval time, i.e., avoiding intersection conflicts. Equations (4) and (5) ensure that flights passing through the same arc should be guaranteed to be first-in, first-out (FIFO), i.e., avoiding rear-end conflicts. Equations (6) and (7) ensure the avoidance of head-on conflicts. If the taxi path scheme violates Equations (3)–(7), the total number of taxiing conflicts is Conf + 1.
The relevant time definitions of the aircraft during ground taxiing are as follows:
In Equation (8), ti,k,q is the time at which aircraft i passes the arc segment (k, q) in the taxiway region, Lk,q is the distance from node k to node q, and v1 is the taxi speed of the aircraft in the taxiway region. In Equation (9), ti,q is the time at which aircraft i arrives at node q, and si is the taxiing start point of aircraft i in the taxiway region. If q is the taxiing start node, ti,q = ti,si, which is the taxiing start time of aircraft i in the taxiway region. In Equation (10), is the time for arriving aircraft i to taxi from the apron entrance to the gate, is the distance from the apron entrance to the gate for aircraft i, and v2 is the taxiing speed of the aircraft in the apron area. In Equation (11), is the time for departing aircraft i to taxi from the gate to the apron exit, and is the distance from the gate to the apron exit for aircraft i. Equation (12) represents the taxiing start–stop time relationship of aircraft i in the taxiway area, where ei is the taxiing end point of aircraft i in the taxiway area. In Equation (13), Ti is the total taxiing time of aircraft i during ground operations, including the taxiing time in the taxiway area and the taxiing time in the apron area.
Carbon dioxide and other pollutant gas emissions result from fuel consumption during aircraft taxiing. The equations for calculating the gas emissions are as follows:
In Equation (14), fCO2 represents the CO2 emissions; E1 is the conversion coefficient of aviation kerosene to standard coal, which was obtained from the Energy Saving Audit Guidelines for Energy Conservation Projects issued by the National Development and Reform Commission (NDRC); and E2 is the emission coefficient of standard coal converted to carbon. In Equation (15), fgas represents the emissions of various types of pollutant gases, and Ei,gas is the gas emission index of the engine of aircraft i under idle conditions, which was taken from the engine emissions database of the International Civil Aviation Organization (ICAO) [30]. Since the SO2 emission index is not provided in this database, the SO2 emission index was taken from a previous publication [31], and its value was 1 g/kg.
2.2. Lower-Level Model Temporal Planning
The lower-level model optimizes the aircraft taxiing start time from the temporal dimension. To increase the airport runway capacity and improve the ground operation efficiency, the aircraft should not wait too long. Therefore, the lower-level model takes minimizing the waiting times of arriving and departing flights as the optimization objective, which is denoted as flower. To reduce the number of taxiing conflicts, the same penalty factor M is applied to the number of taxiing conflicts Conf. The objective of the lower-level model is as follows:
where Twaiti is the waiting time for flight i, and Conf is the total number of taxi conflicts.
The relevant constraints for the lower-level model are shown as follows:
where is the boarding start time of the departing flight i, is the time required to complete the boarding of all passengers, is the boarding end time of the departing flight i, is the scheduled arrival time of flight i, is the scheduled departure time of flight i, and Tmax is the maximum waiting time of the aircraft.
Equation (17) shows the relationship between the boarding end time and the boarding start time. Equation (18) shows the relationship between the waiting time for arriving and departing flights and the start of the taxiing time in the taxiway area: for arriving flights, the start of the taxiing time = the scheduled arrival time + the waiting time; for departing flights, the start of the taxiing time in the taxiway area = the end of passenger boarding time + the waiting time + the taxiing time in the apron area. Equation (19) indicates that flights should not wait longer than the maximum waiting time. Equation (20) indicates that departing flights should arrive at the end of the runway before their scheduled departure. The relevant parameters of the model are defined in Table 2.
Table 2.
Definition of model-related parameters.
3. Algorithm Design
Based on the constructed bilevel spatial–temporal optimization model of aircraft taxiing, genetic algorithms are designed to solve the upper- and lower-level models. Each aircraft taxiing path in the upper-level programming model was taken from the available path set of the aircraft. In previous studies, the set of available paths for an aircraft was usually generated by shortest path search algorithms, such as the Dijkstra algorithm, or manual experience assignment by controllers. Such methods cannot find all feasible paths for an aircraft, reduce the variety and possibility of optimal taxiing solutions, and ignore the effect of the number of turns on aviation fuel consumption. DFS algorithms can overcome this problem and generate all feasible paths for aircraft [32].
Therefore, all feasible paths for each flight are first generated based on the DFS algorithm according to the flight operation schedule. To comply with the controller scheduling habits and reduce the extra fuel consumption due to turns, the shortest path set and the second shortest path set with the fewest turning paths are filtered as the available path sets. Finally, based on the generated available path sets, aircraft spatial–temporal optimization is carried out based on the genetic algorithm.
3.1. Depth-First Search Algorithm for Available Paths
The network diagram of the airport is represented by the adjacency matrix G. The adjacency matrix G of Tianjin Binhai International Airport is as follows:
To reduce the computational complexity, G is represented as a directed graph in this paper. The matrix element G(i, j) denotes the distance from node i to node j. If it is a constant, it means that node i is connected to node j; otherwise, it means that it is not connected. The start node of the flight taxi path is denoted as Start_Node, and the end node is denoted as End_Node.
The related process of the DFS algorithm is as follows.
1. Initialization: Mark Start_Node as visited and add it to the search path. Set an empty path list to store the searched path.
2. Recursive search: Starting from Start_Node, recursively explore the nodes that are connected to the current node and have not been visited. For each adjacent node, (1) if the node is an End_Node, add the current path to the path list and return the search result; (2) if the node has not been visited, mark it as visited and add it to the search path, and then continue the recursive search.
3. Backtracking: If all adjacent nodes of the current node have been visited or the current node has no adjacent nodes, the current node is removed from the search path, and the search backtracks to the previous node and continues.
4. Stop criterion: When backtracking to Start_Node, it means that the search has been completed and all feasible paths for that flight have been found.
Following the above process, all feasible paths for the flight can be obtained. By substituting the distances between the nodes, all the shortest paths and the second shortest paths of the flight can be obtained. The paths with the lowest number of turns are filtered as the set of usable paths for the subsequent study.
3.2. Genetic Algorithm Design
3.2.1. Genetic Algorithm for the Upper-Level Model
For the upper aircraft taxiing path optimization model, the integer coding method is used. The genes of the chromosome represent all the flights to be assigned taxiing path;, so, the chromosome length is the number of all flights. The value of each gene is the available path number of flight i, which means that the flight will taxi via the ith path in the set of all available paths of the flight. The relevant parameters of the algorithm are set as follows.
(1) Population initialization: Based on the set of available paths for flights generated by the DFS algorithm, the taxi path number is randomly generated for each flight.
(2) Fitness function: Aviation fuel consumption + number of taxiing conflicts × M.
(3) Selection operation: The roulette selection method is used, where the better the fitness value, the higher the probability of being selected.
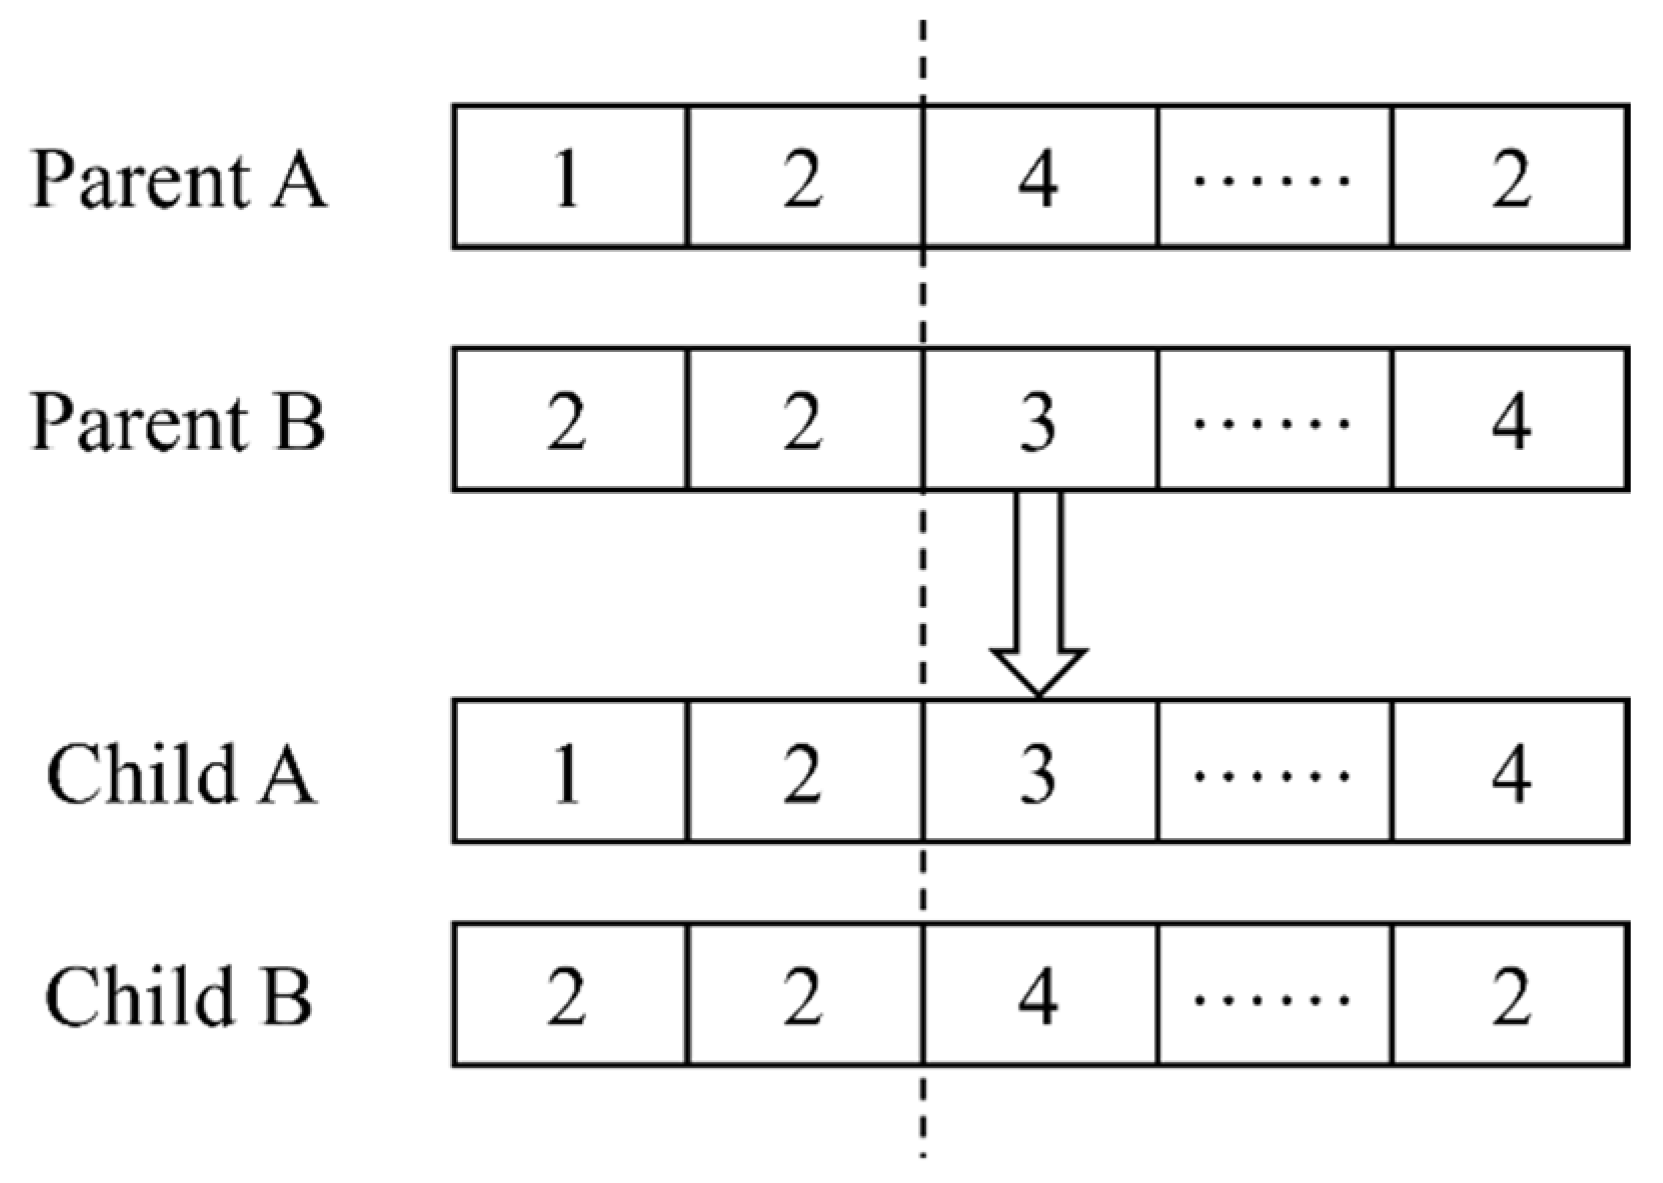
(4) Crossover operation: Segment crossover is adopted, where every two chromosomes have a probability of Pc to generate crossover, and the gene segments of the two chromosomes after the crossover point are exchanged, as shown in Figure 2. Parental chromosomes undergo a crossover operation in flight 2 and exchange taxiing path schemes with each other beyond flight 2.

Figure 2.
Chromosome crossover operation.
(5) Mutation operation: Single-point mutation is adopted. For the mutation probability of each chromosome Pm, one gene value on the chromosome is randomly changed, and the new gene value is another available path number of the flight, as shown in Figure 3. The parental chromosome undergoes a mutation operation on flight 3, which changes from the original taxiing path 4 to taxiing path 3.
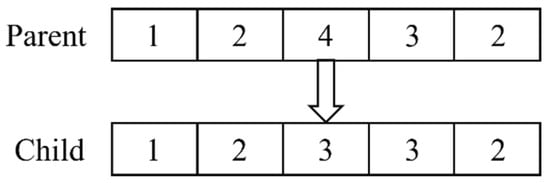
Figure 3.
Chromosome mutation operation.
(6) Elitist preservation: Based on the individual fitness levels, the best parental individual replaces the worst offspring individual.
(7) Stop criterion: The iteration ends when the maximum number of iterations is reached.
3.2.2. Genetic Algorithm for the Lower-Level Model
For the lower level of the aircraft taxiing start time optimization model, integer coding is used. The genes of the chromosome represent all the flights to be assigned waiting times; then, the length of the chromosome is the number of all flights. Each gene value is the flight start taxiing wait time t, indicating that the flight will begin taxiing after scheduled time t. The relevant parameters of the algorithm are as follows.
(1) Population initialization: The waiting time of [0, Tmax] generated randomly for flight i is denoted as Old_Twaiti.
(2) Fitness function: Total waiting time for flights + number of taxiing conflicts × M.
(3) Selection operation: The roulette selection method is used, where the better the fitness value, the higher the probability of being selected.
(4) Crossover operation: Segment crossover is adopted, where every two chromosomes have a probability of Pc to generate crossover, and the gene segments of the two chromosomes after the crossover point are exchanged.
(5) Mutation operation: Single-point mutation is adopted. For each chromosome with mutation probability Pm, one gene value on the chromosome is randomly changed, and the new gene value is the new waiting time of the flight. To speed up the convergence of the population, if the fitness value of the mutated individual is <M, the new gene value range is [0, Old_Twaiti]; otherwise, it is [0, Tmax].
(6) Elitist preservation: Based on the individual fitness levels, the best parental individual replaces the worst offspring individual.
(7) Stop criterion: The iteration ends when the maximum number of iterations is reached.
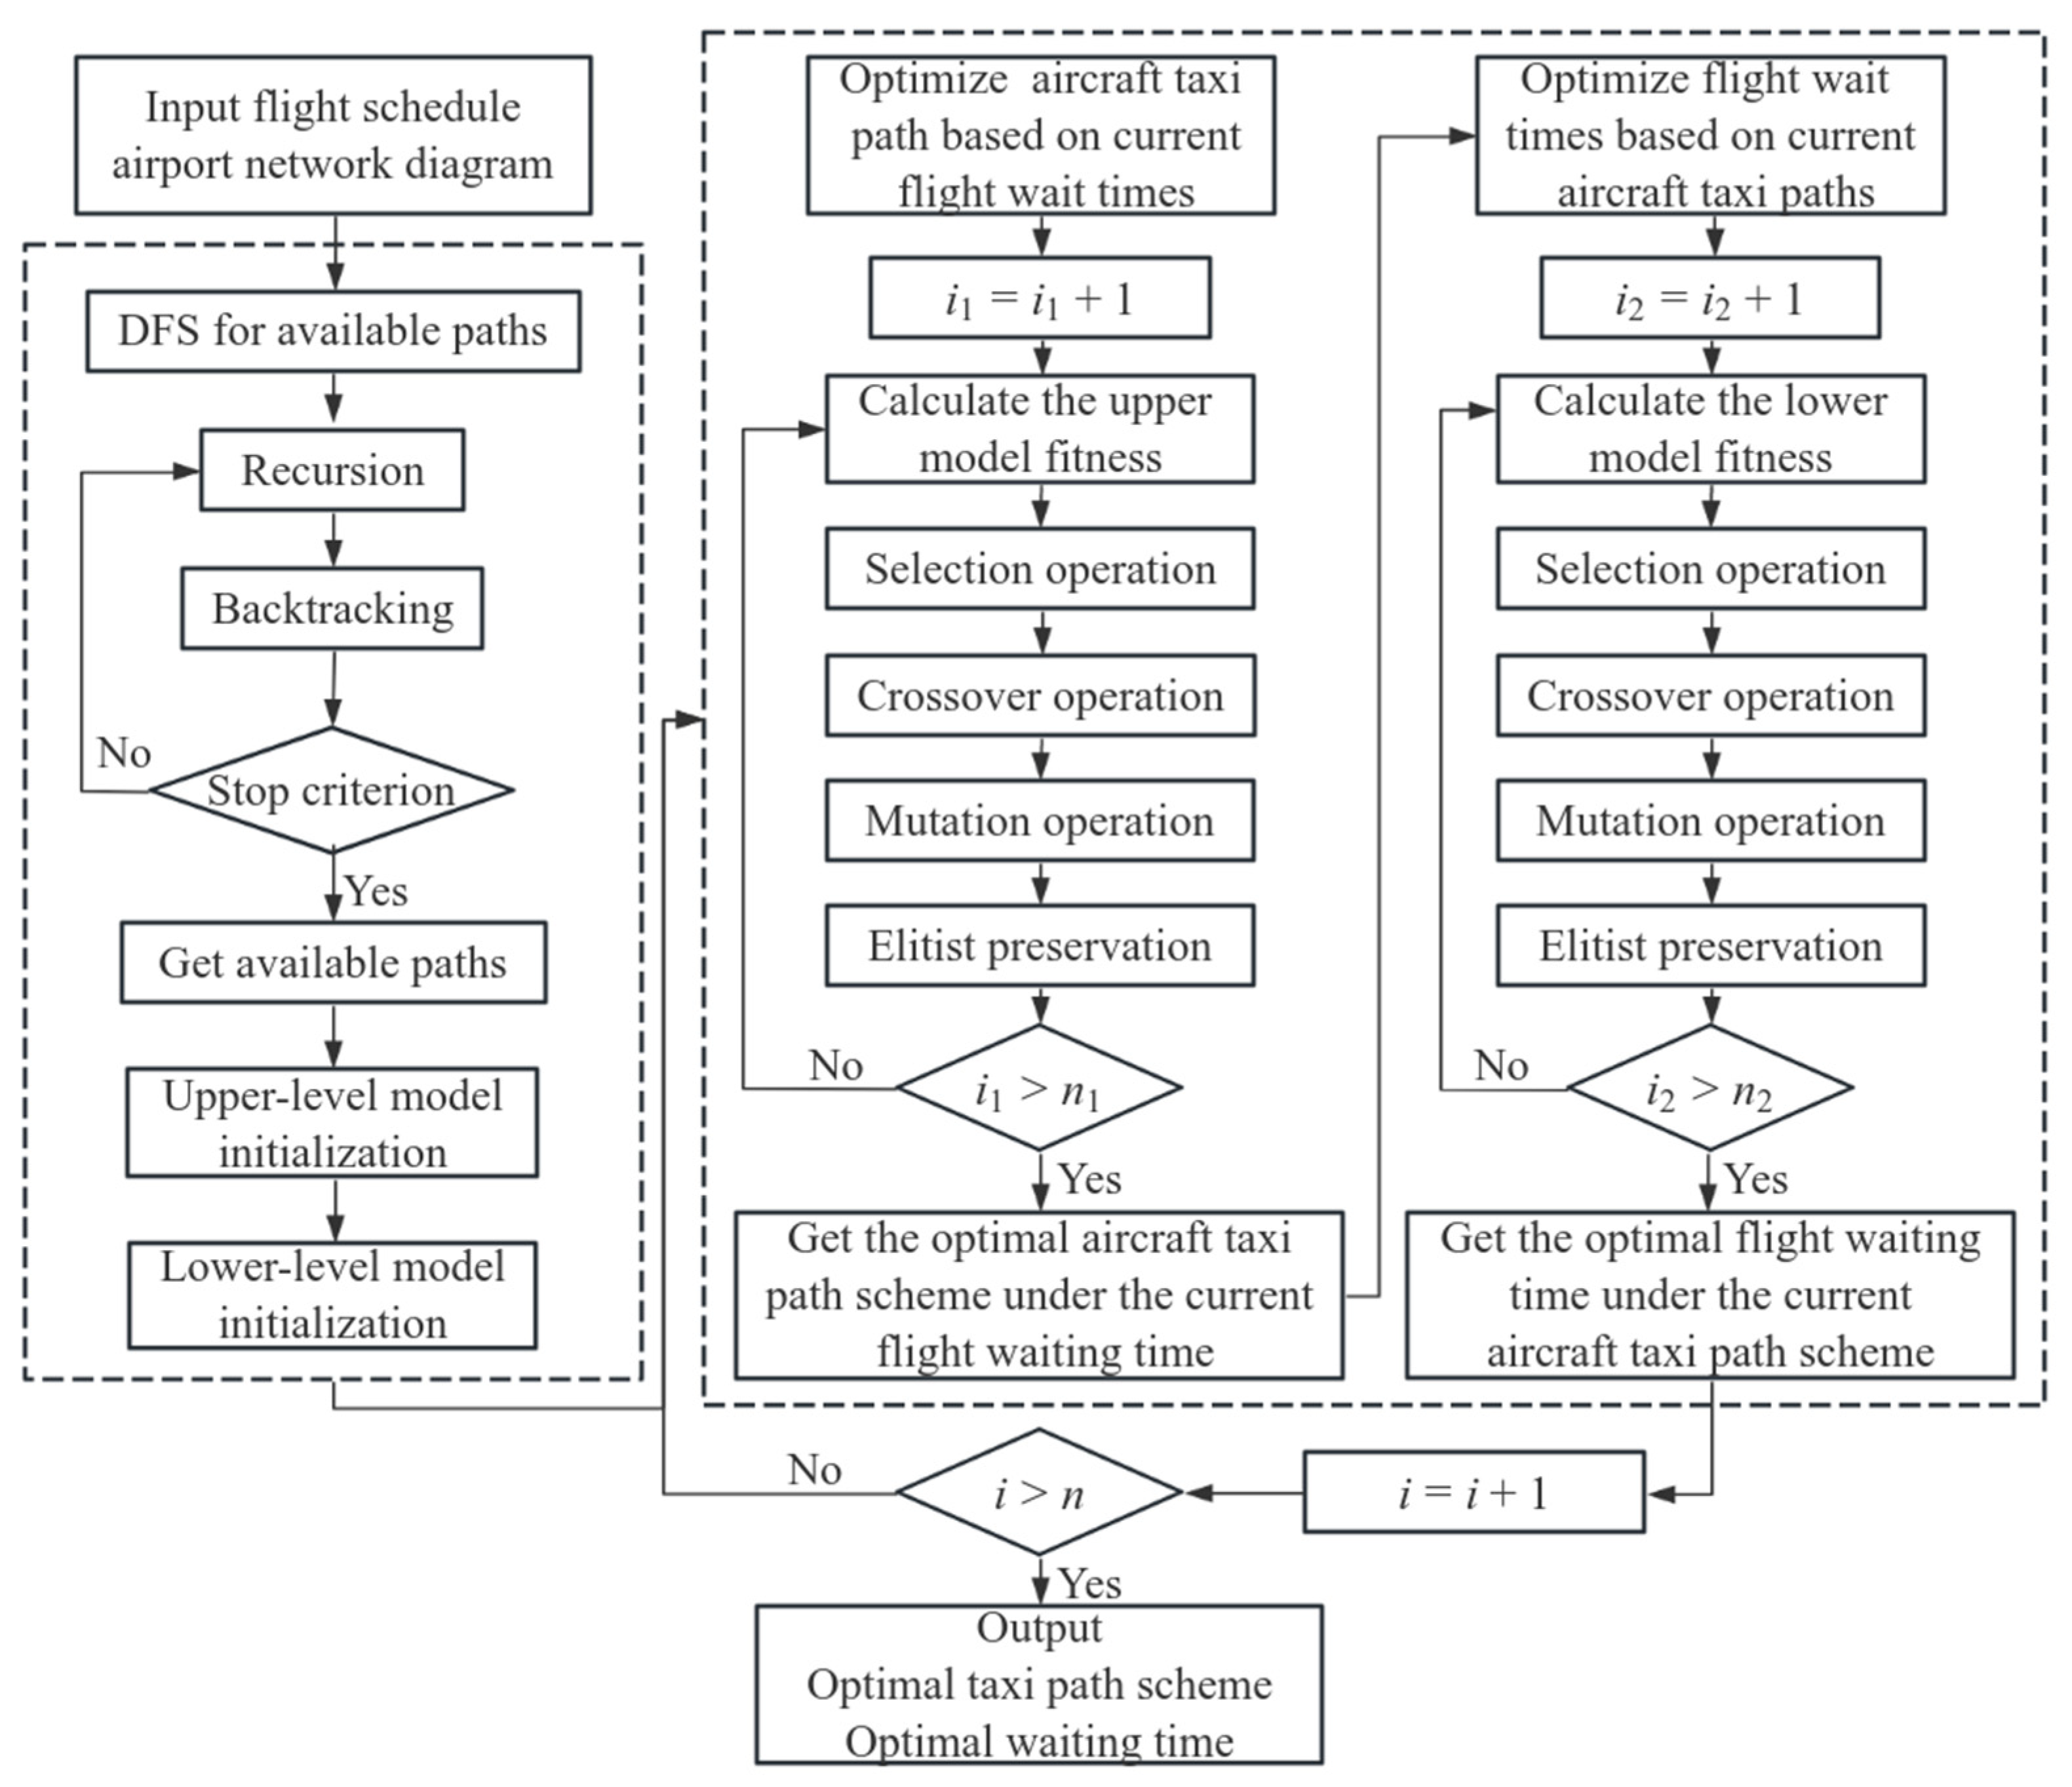
In the genetic algorithm designed in this paper, the iteration indices of the upper- and lower-level models are denoted as i1 and i2, respectively, and the overall iteration index is denoted as i. The upper-level model performs iterative optimization from the spatial perspective based on the current optimal aircraft taxiing start time. For each iteration, one is added to the upper-level model iteration index, i.e., i1 = i1 + 1. After accumulating n1 iterations, the optimal taxiing path scheme is output and passed to the lower-level model. The lower-level model accepts the current optimal taxiing path scheme and performs iterative optimization from a temporal perspective. Similarly, for each iteration, one is added to the lower-level model iteration index, i.e., i2 = i2 + 1. After accumulating n2 iterations, the optimal aircraft waiting time scheme is output and passed to the upper model. Completing the above process once comprises one overall iteration, i.e., i = i + 1. After n overall iterations, the optimal solution is output. The algorithmic flow of the entire model is shown in Figure 4.
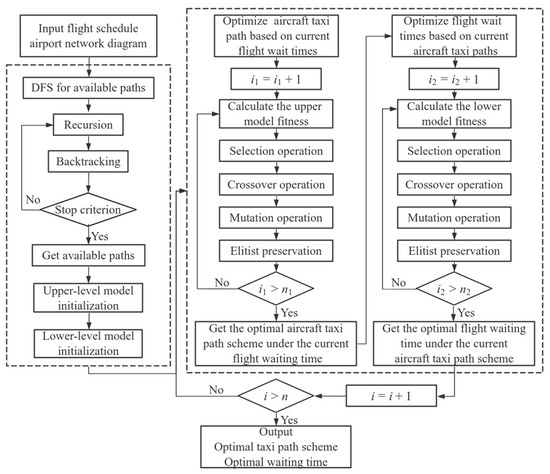
Figure 4.
Flowchart of the algorithm.
4. Experiments and Analysis
Tianjin Binhai International Airport is a 4E civil international airport, which is one of the major aviation logistics centers in China. In 2019, the airport’s passenger throughput reached 20 million passengers, and the cargo and mail throughput reached 220,000 tons [33]. The airport has two parallel runways that are 3600 and 3200 m in length. In total, 27 flight pairs, i.e., 54 take-offs and landings, between 10:00 and 12:30 on a normal weekday at this airport were selected for the experimental analysis. Most flights during the study period landed on runway 16L, and all flights departed from runway 16R. The flight operation schedule is shown in Table 3. According to the ICAO Aircraft Engine Emissions Database, the corresponding fuel flow and gas emission indices for each aircraft type in the engine idle state were screened, as shown in Table 4. The apron taxiing distances are shown in Table 5.
Table 3.
Flight operation schedule.
Table 4.
Aircraft engine fuel rates and emission indices under idle conditions.
Table 5.
Taxiing distances on the apron.
4.1. Analysis of the Experimental Results
The constructed bilevel spatial–temporal optimization model as well as the designed intelligent algorithm were programmed using MATLAB R2021b for experimental analysis and in the analysis. The sets of available paths for each flight generated by the DFS algorithm are shown in Table 6. The parameters of the genetic algorithm for solving the upper- and lower-level models were the same: the number of population N = 30, crossover probability Pc = 0.9, mutation probability Pm = 0.05, number of iterations of the upper-level model = 50, number of iterations of the lower-level model = 50, and overall number of iterations = 100. The optimal taxiing schemes for arriving and departing flights are shown in Table 7 and Table 8, respectively. The numbers in parentheses are the times in seconds at which the aircraft passed through each node. The study period began at 0 s.
Table 6.
Available paths for flights.
Table 7.
Arriving flight optimization scheme.
Table 8.
Departing flight optimization schemes.
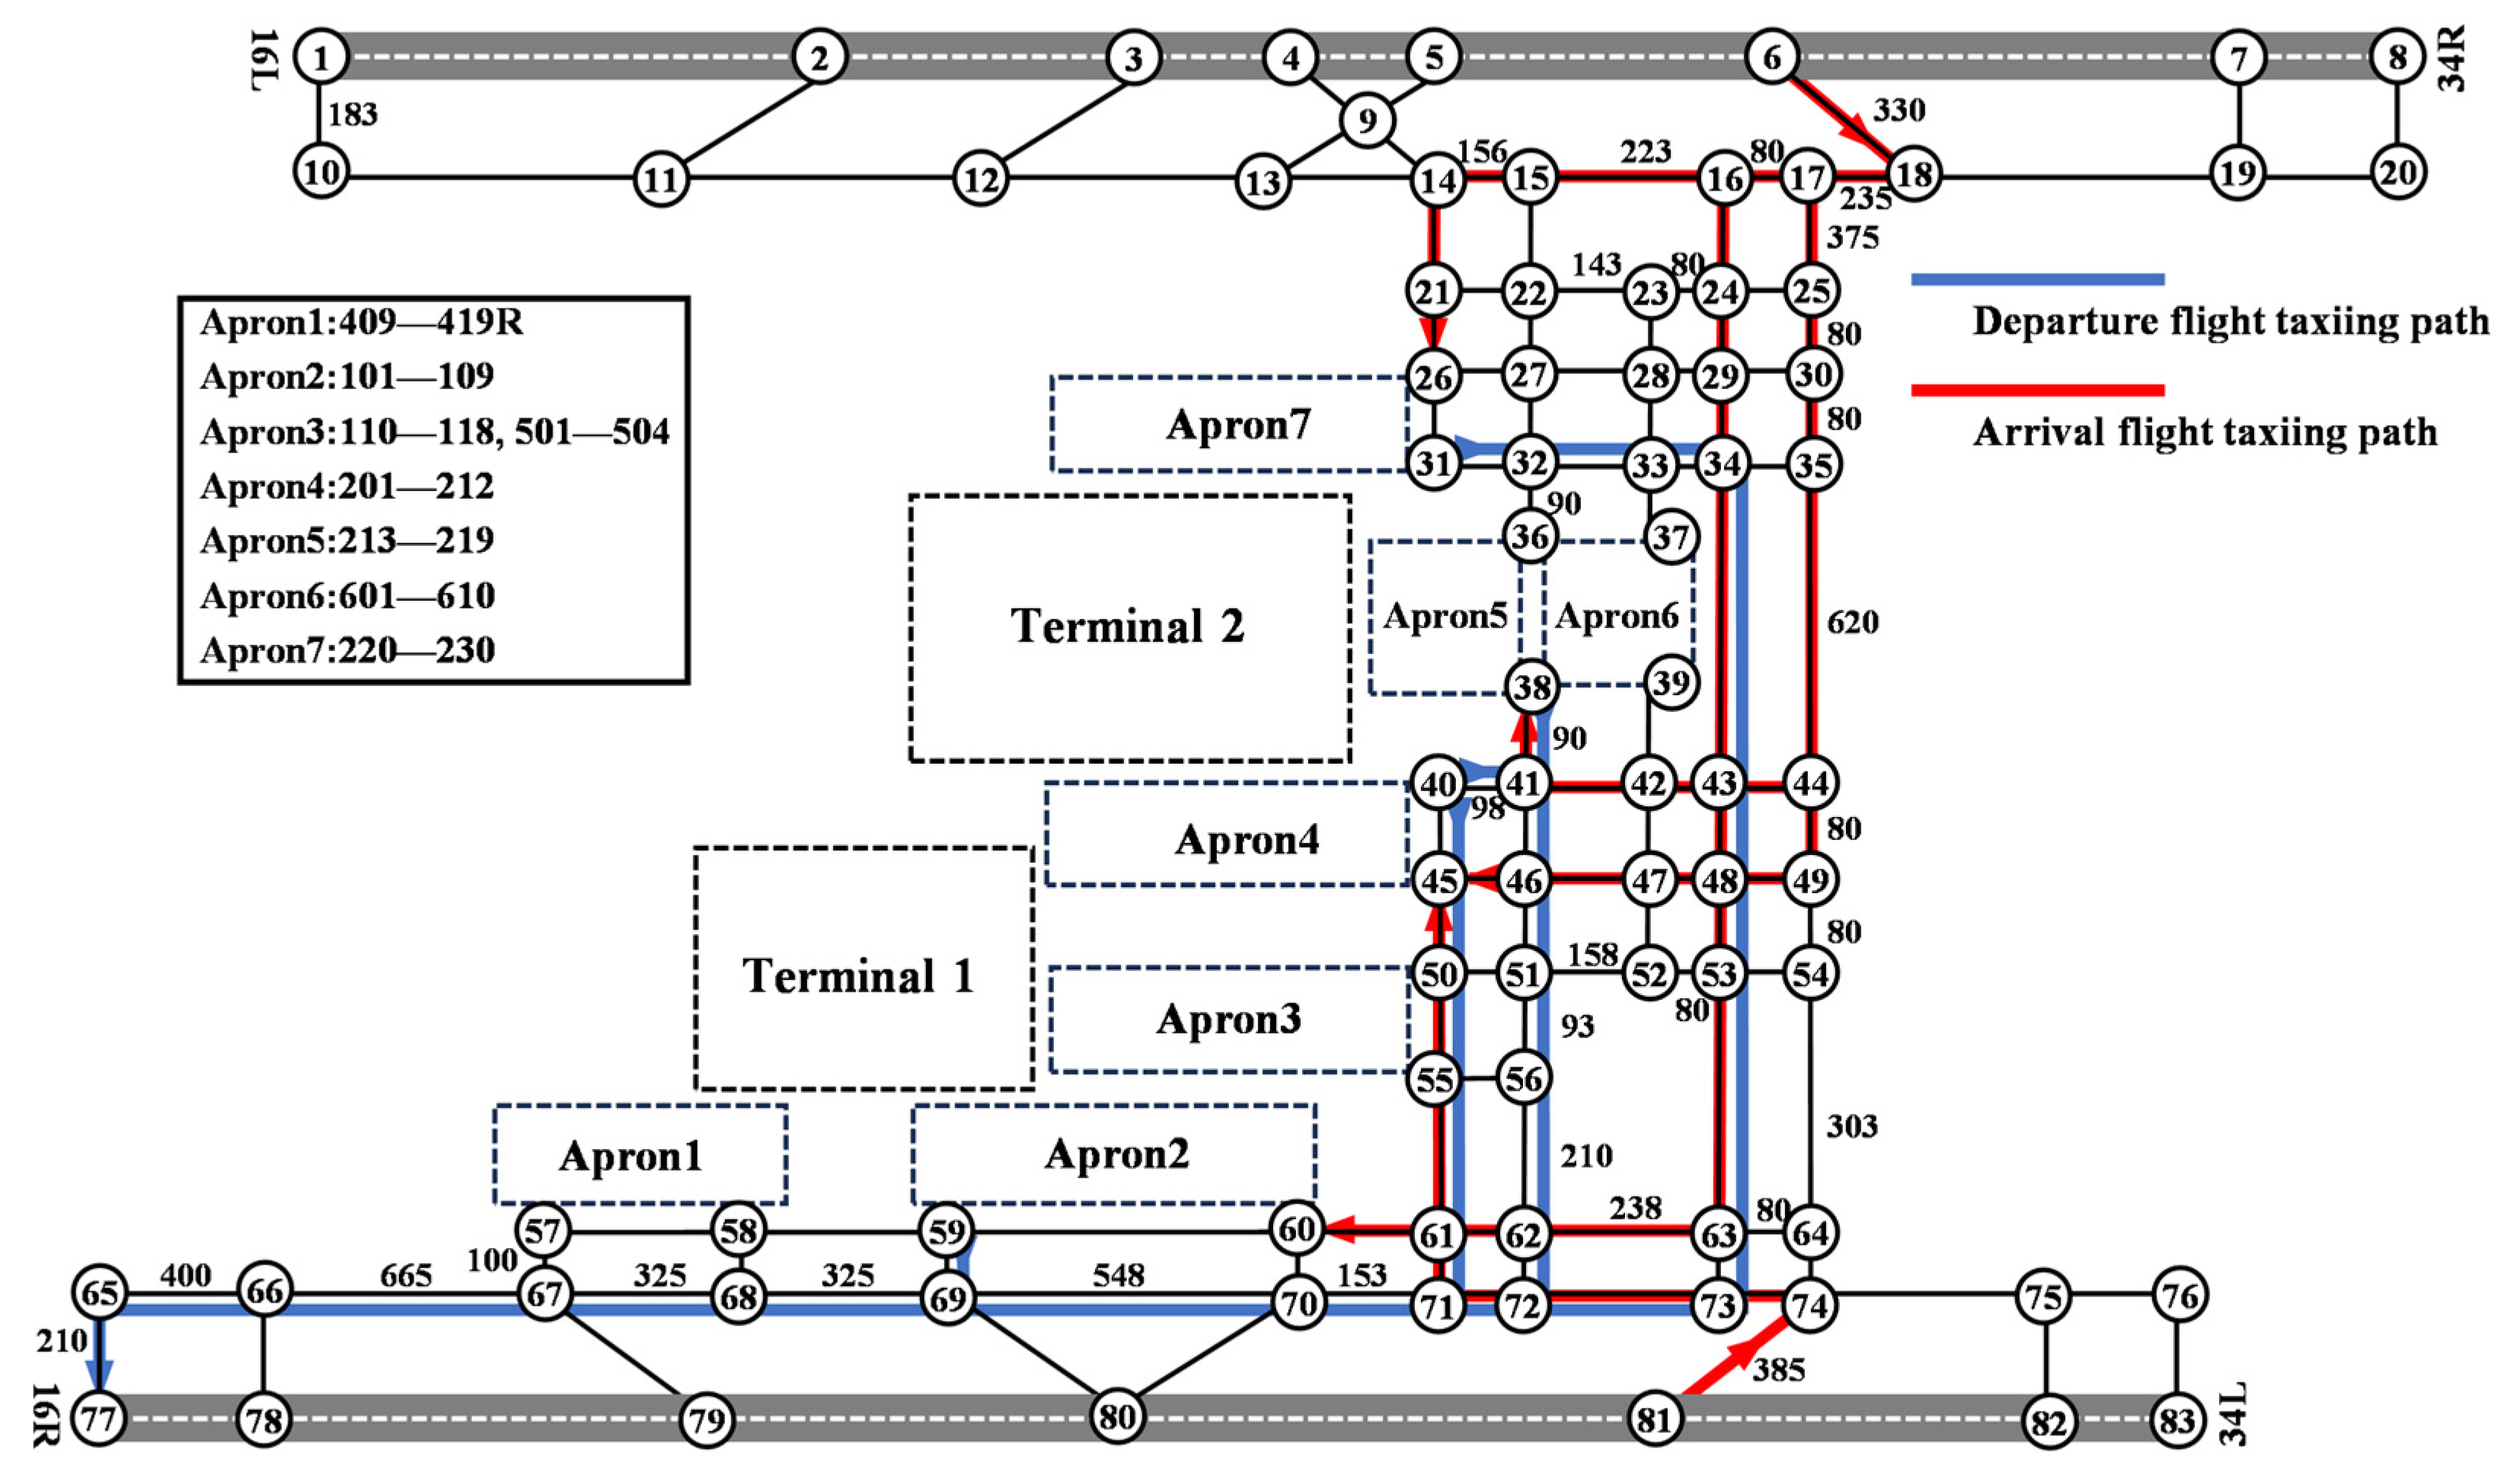
The optimal taxi paths for the arriving and departing flights are shown in Figure 5. The blue lines represent the taxiing paths of the departing flights, and the red lines represent the taxiing paths of the arriving flights. The figure shows that some departing aircraft taxiing from apron 4 chose the second shortest path to avoid taxiing conflicts. This cannot be achieved by shortest path search algorithms, such as the Dijkstra algorithm.
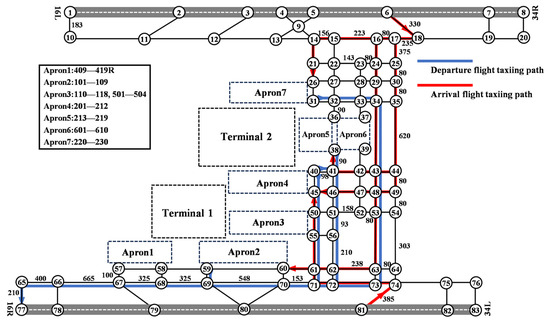
Figure 5.
Optimal taxiing paths for arriving and departing flights.
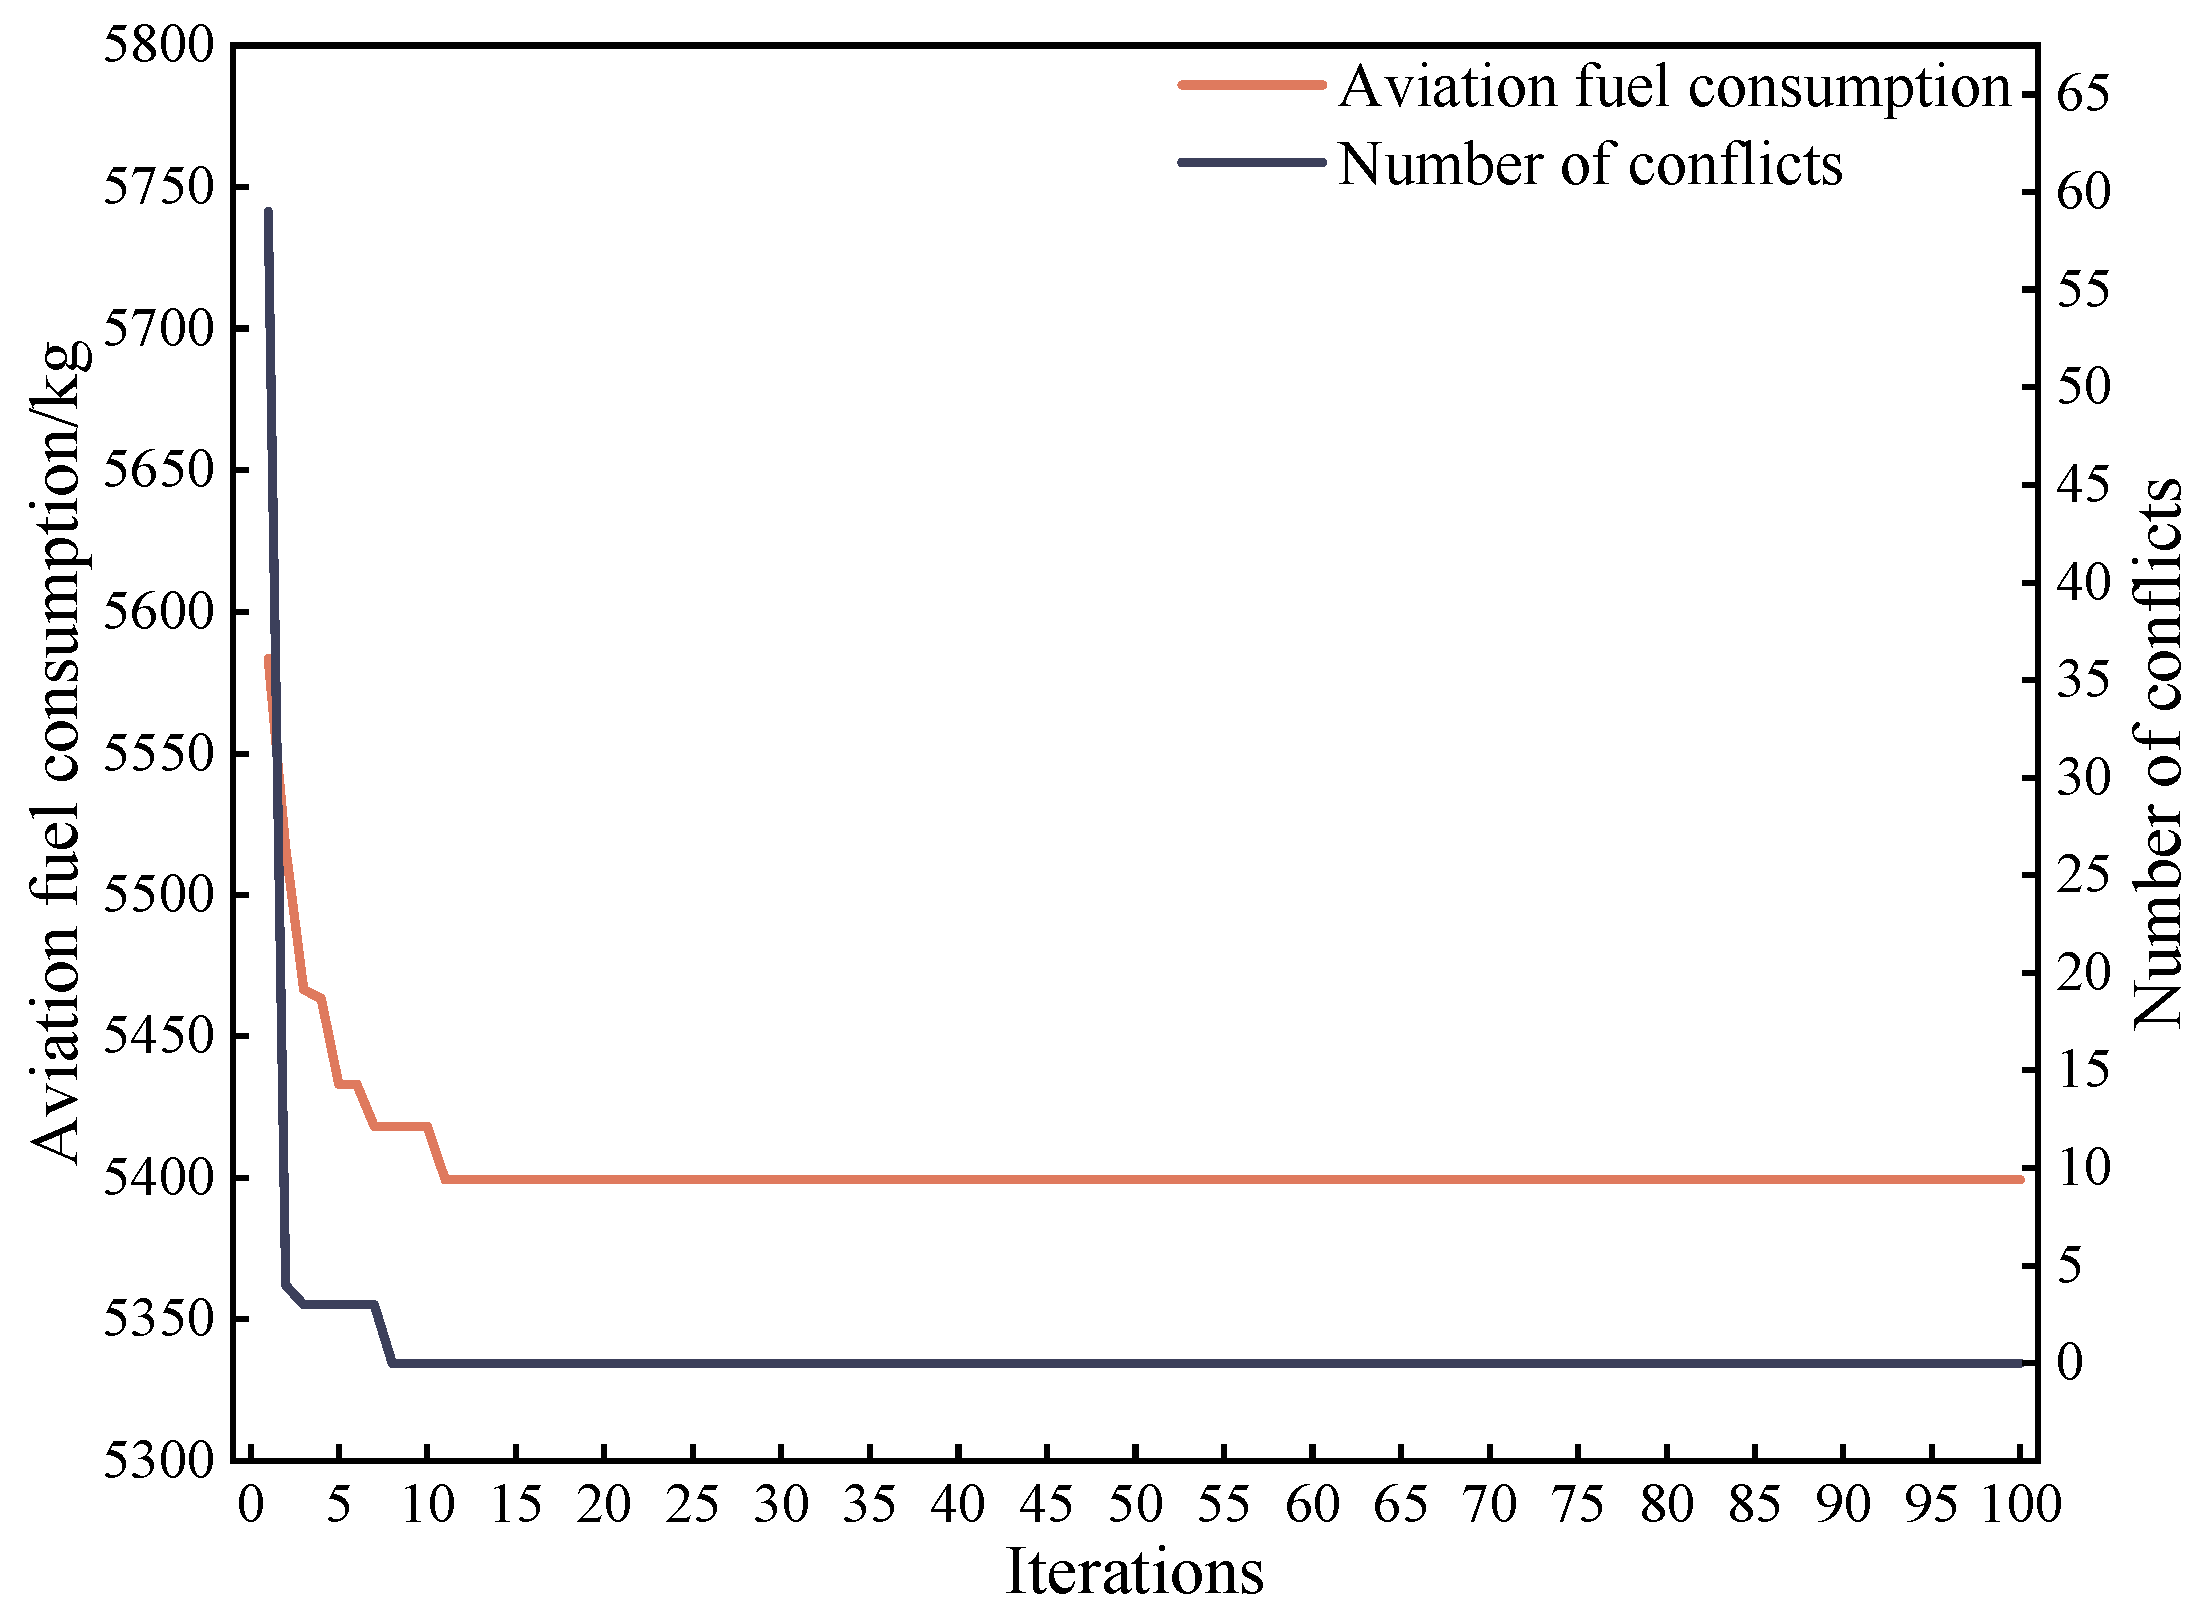
Figure 6 shows the iteration curves of the aviation fuel consumption and the number of taxiing conflicts for the optimal solution of the upper-level model. By transmitting the optimal solution of the bilevel model, the aviation fuel consumption and taxiing conflicts were effectively reduced. The upper-level model accepted the optimized waiting time from the lower-level model and optimized the taxiing path for each flight based on the new taxiing start time. To avoid the occurrence of taxiing conflicts, the upper-level model’s optimization objective function includes a penalty factor for taxiing conflicts that causes the objective function value to decrease rapidly at the beginning of each iteration. After 11 overall iterations, the aviation fuel consumption was minimized and converged. The final aviation fuel consumption was 5399.38 kg. After eight overall iterations, the number of conflicts of the optimal taxiing scheme was reduced to zero and converged, i.e., the taxiing scheme to avoid taxiing conflicts was a feasible solution after the 8th overall iteration.
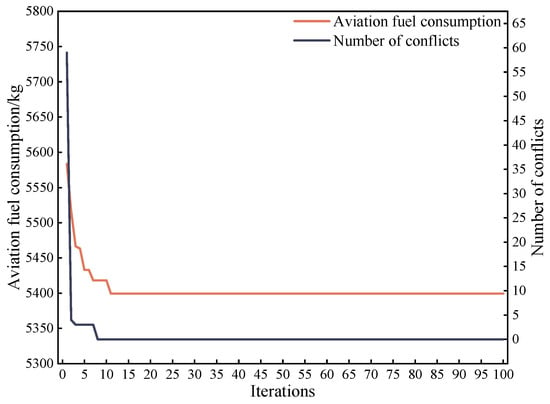
Figure 6.
Iteration curves of the optimal solutions for the upper-level model.
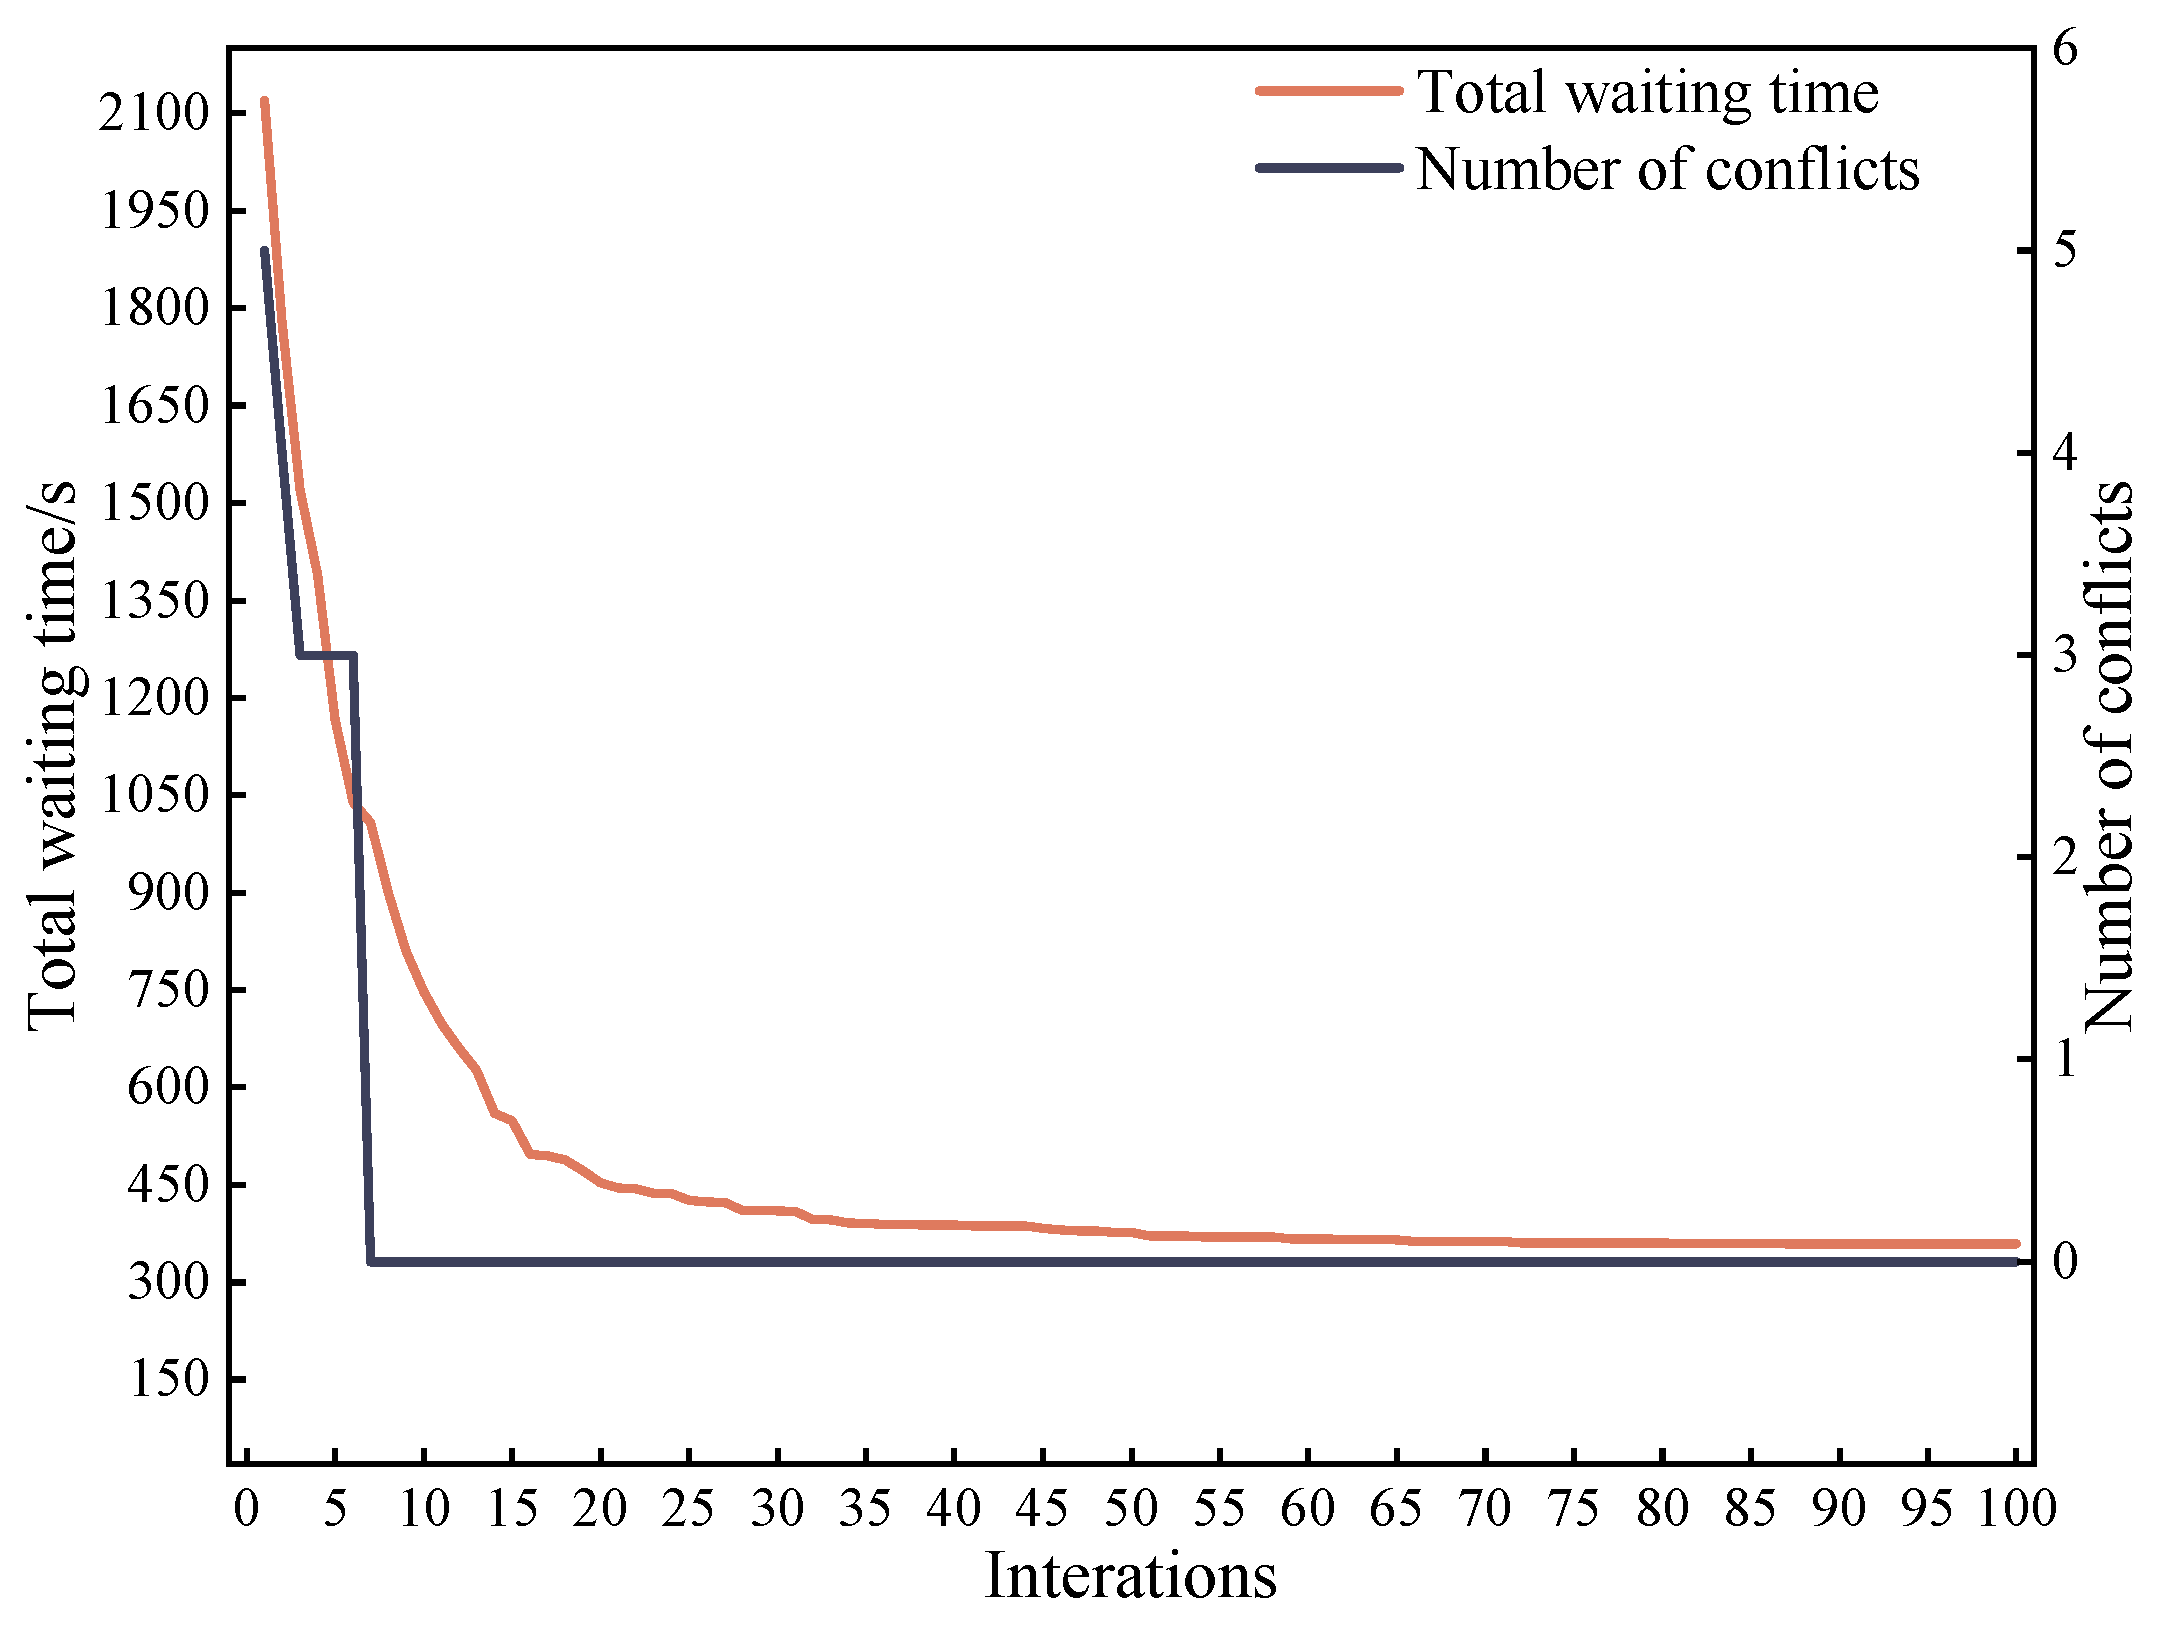
Figure 7 shows the iteration curves of the waiting time and the number of taxiing conflicts for the optimal solution of the lower-level model. By transmitting the optimal solution of the bilevel model, the total waiting time and taxiing conflicts were effectively reduced. The lower-level model accepted the optimized taxiing scheme from the upper-level model and optimized the taxiing start time of each flight based on the current optimal taxiing scheme. To avoid the occurrence of taxiing conflicts, the lower-level model’s optimization objective function also includes a taxiing conflict penalty factor that causes the objective function value to decrease rapidly at the beginning of each iteration. After seven overall iterations, the number of conflicts for the optimal taxiing scheme was reduced to 0 and converged. After 87 overall iterations, the waiting time was minimized and converged. The final total waiting time was 359 s.
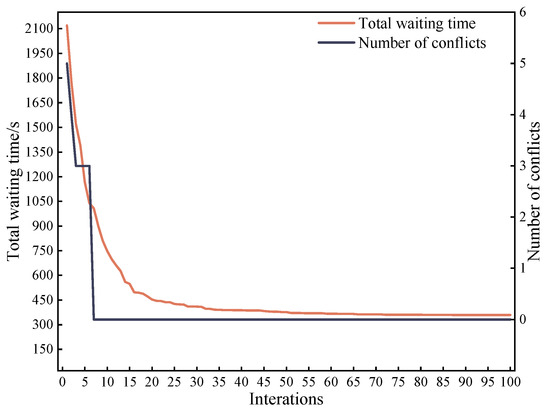
Figure 7.
Iterative curves of the optimal solutions for the lower-level model.
Figure 8 shows the Gantt chart of the optimal taxiing scheme for arriving and departing flights. It includes the ground operations processes of the flights from landing to takeoff: waiting times for arriving and departing flights, taxiing times on the apron and taxiway areas, and service times. To avoid taxiing conflicts and improve the operation efficiency of the surface, some arriving and departing flights adopted the waiting taxiing strategy. The total waiting time for the arriving flights was 342 s, and the total waiting time for the departing flights was 17 s.
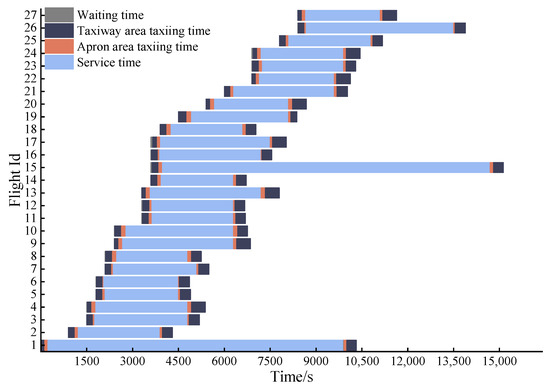
Figure 8.
Gantt chart of the taxiing schemes for arriving and departing flights.
4.2. Comparative Analysis
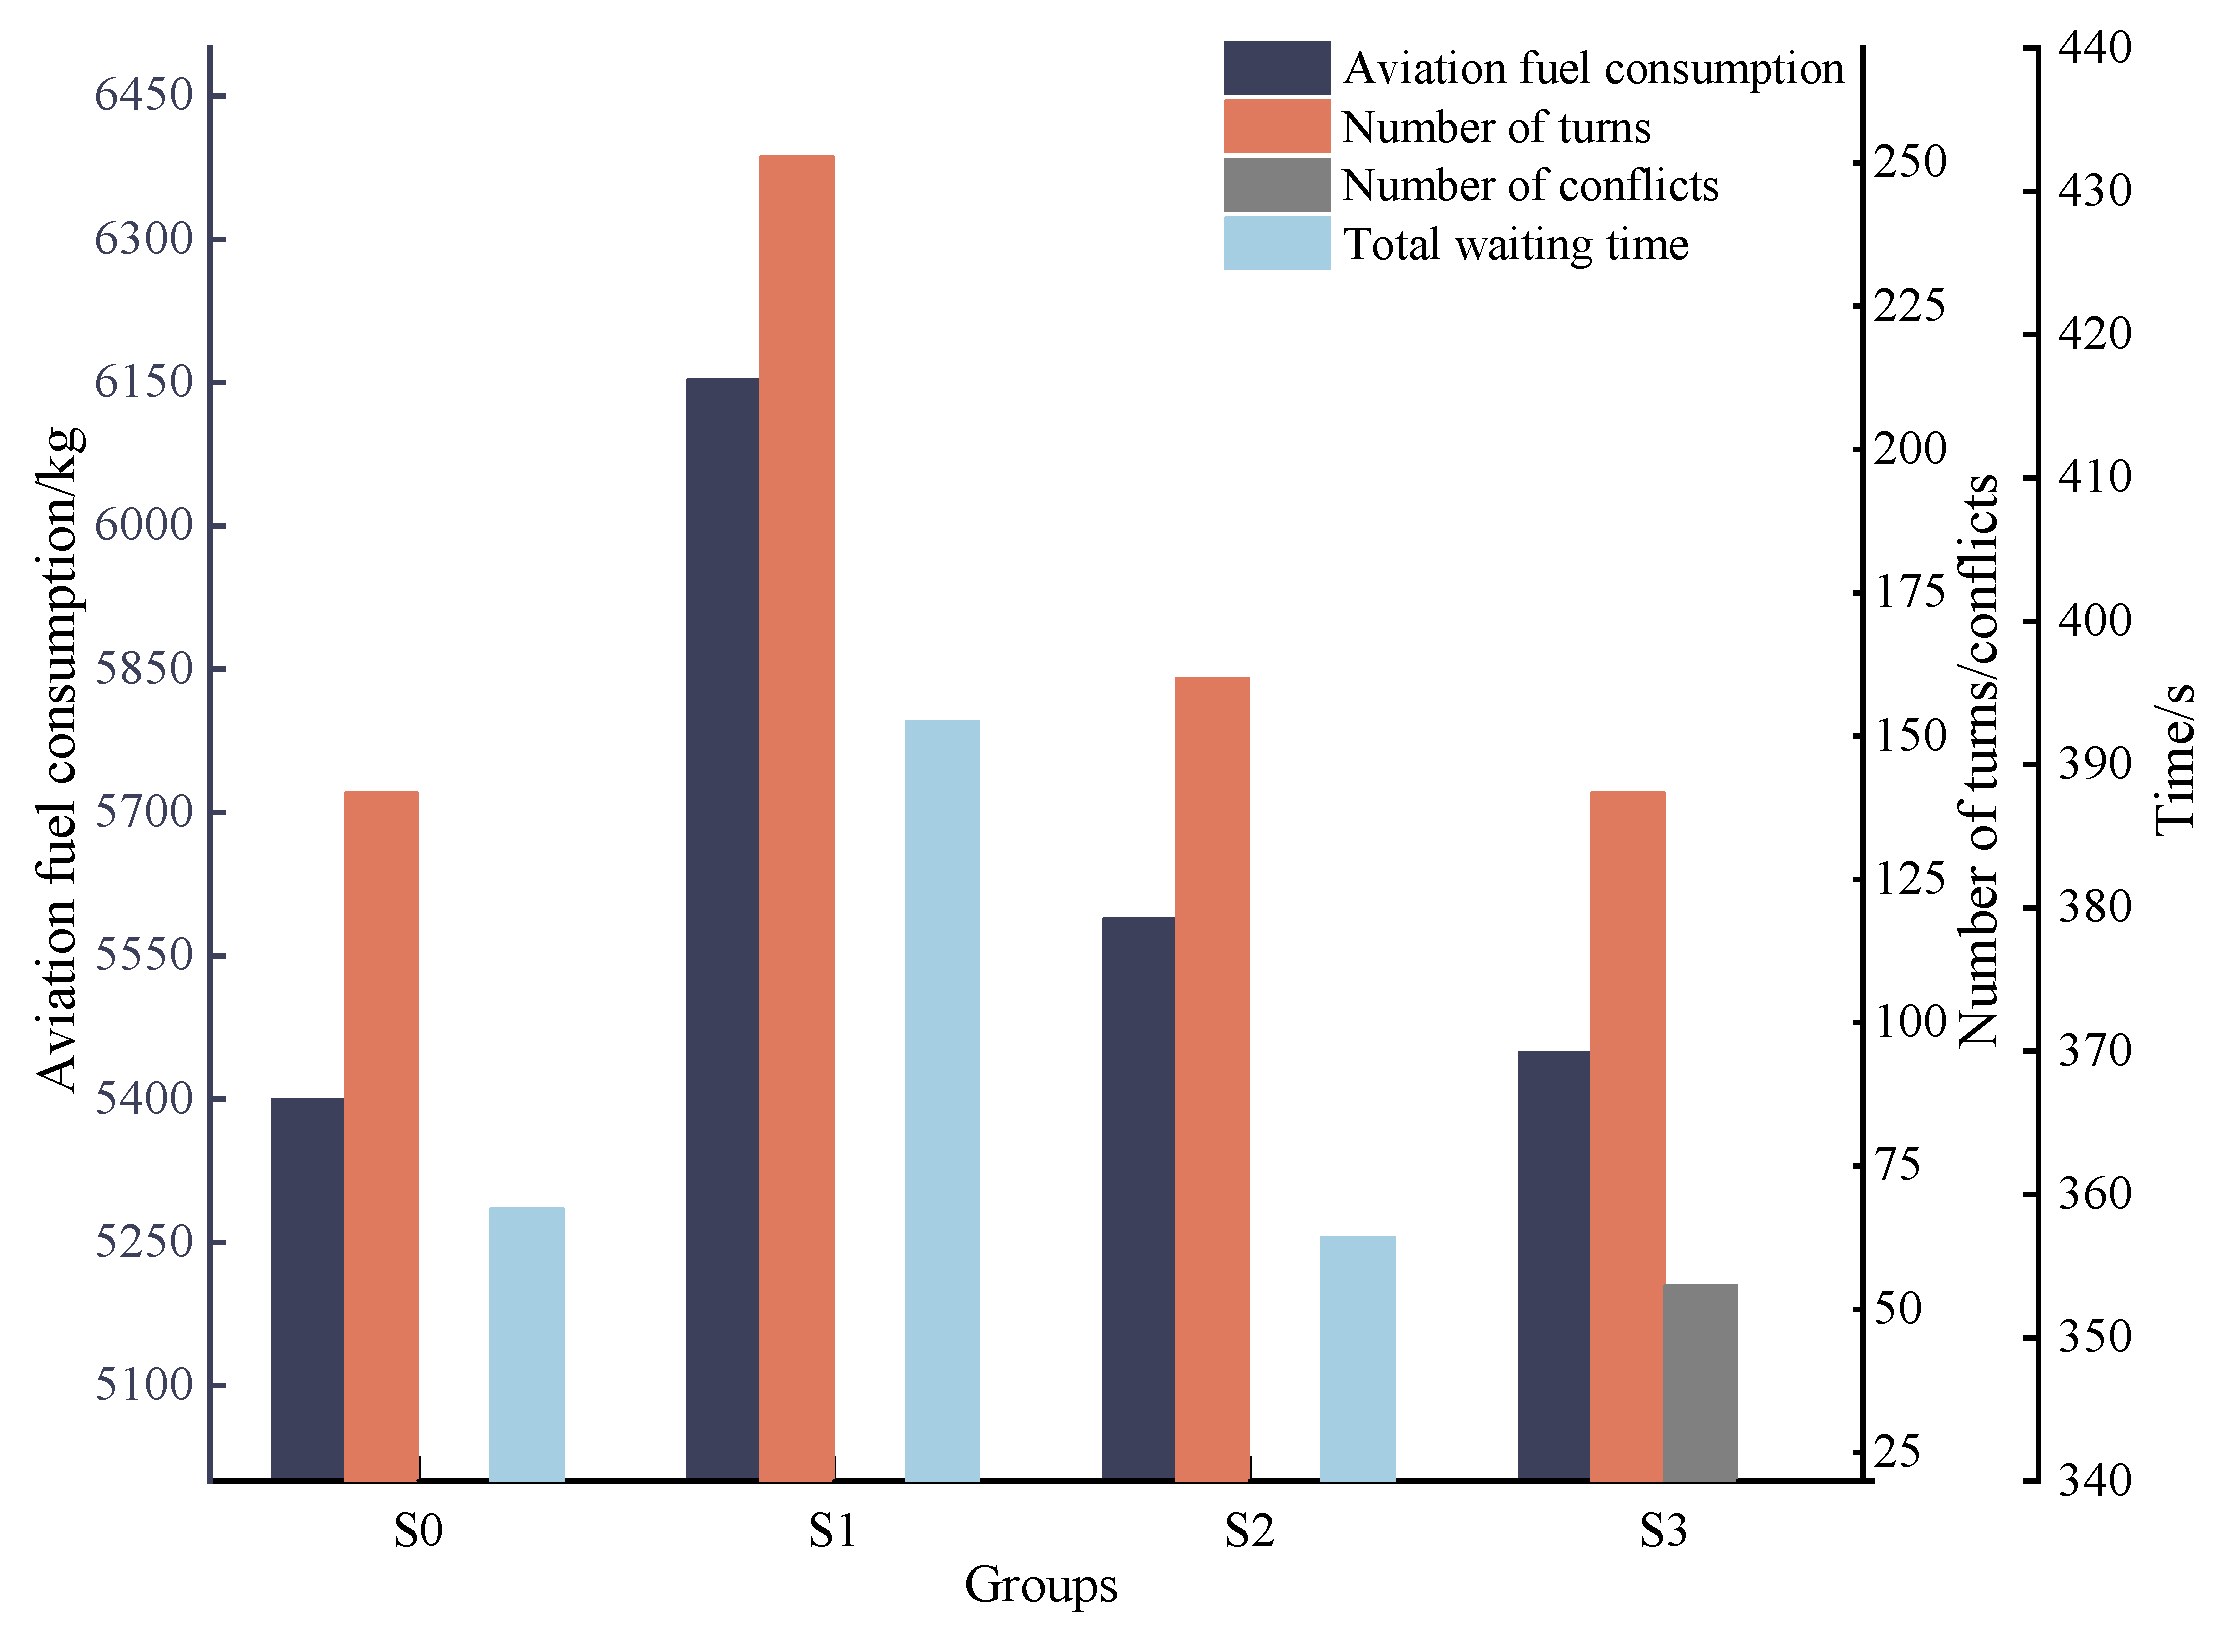
To verify the model’s efficacy, this paper established three control groups for comparative experiments by referencing the existing studies, and the relevant definitions are shown in Table 9. The final optimization results are shown in Figure 9. Adopting the waiting taxiing strategy reduced the aviation fuel consumption by 753.18 kg (12.2% reduction), the total waiting time by 34 s (8.7% reduction), and the number of aircraft turns by 111 (44.4% reduction) compared to those of the available path set generated using the Dijkstra algorithm. Compared to the manual empirically assigned path set, the fuel consumption was reduced by 188.84 kg (3.4% reduction), the number of aircraft turns was reduced by 20 (12.5% reduction), and the total wait time was only increased by only 2 s.
Table 9.
Definition of the experimental and control groups.
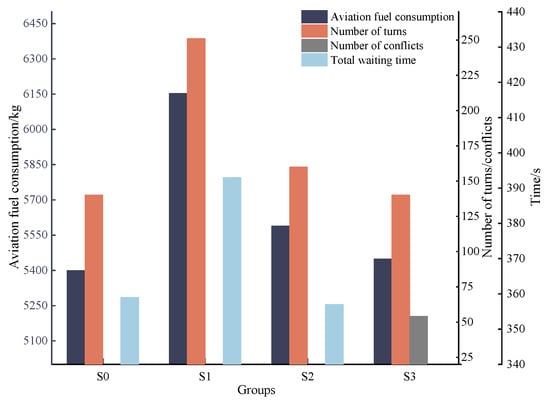
Figure 9.
Objective function values for the different groups.
Adopting an immediate taxiing strategy caused severe taxiing conflicts. It caused 54 taxiing conflicts and increased the fuel consumption by 49.44 kg. The experimental results show that adopting the waiting taxiing strategy could effectively reduce the fuel consumption and taxiing conflicts by optimizing both the taxiing start time and the set of available taxiing paths, thereby improving the ground operational efficiency.
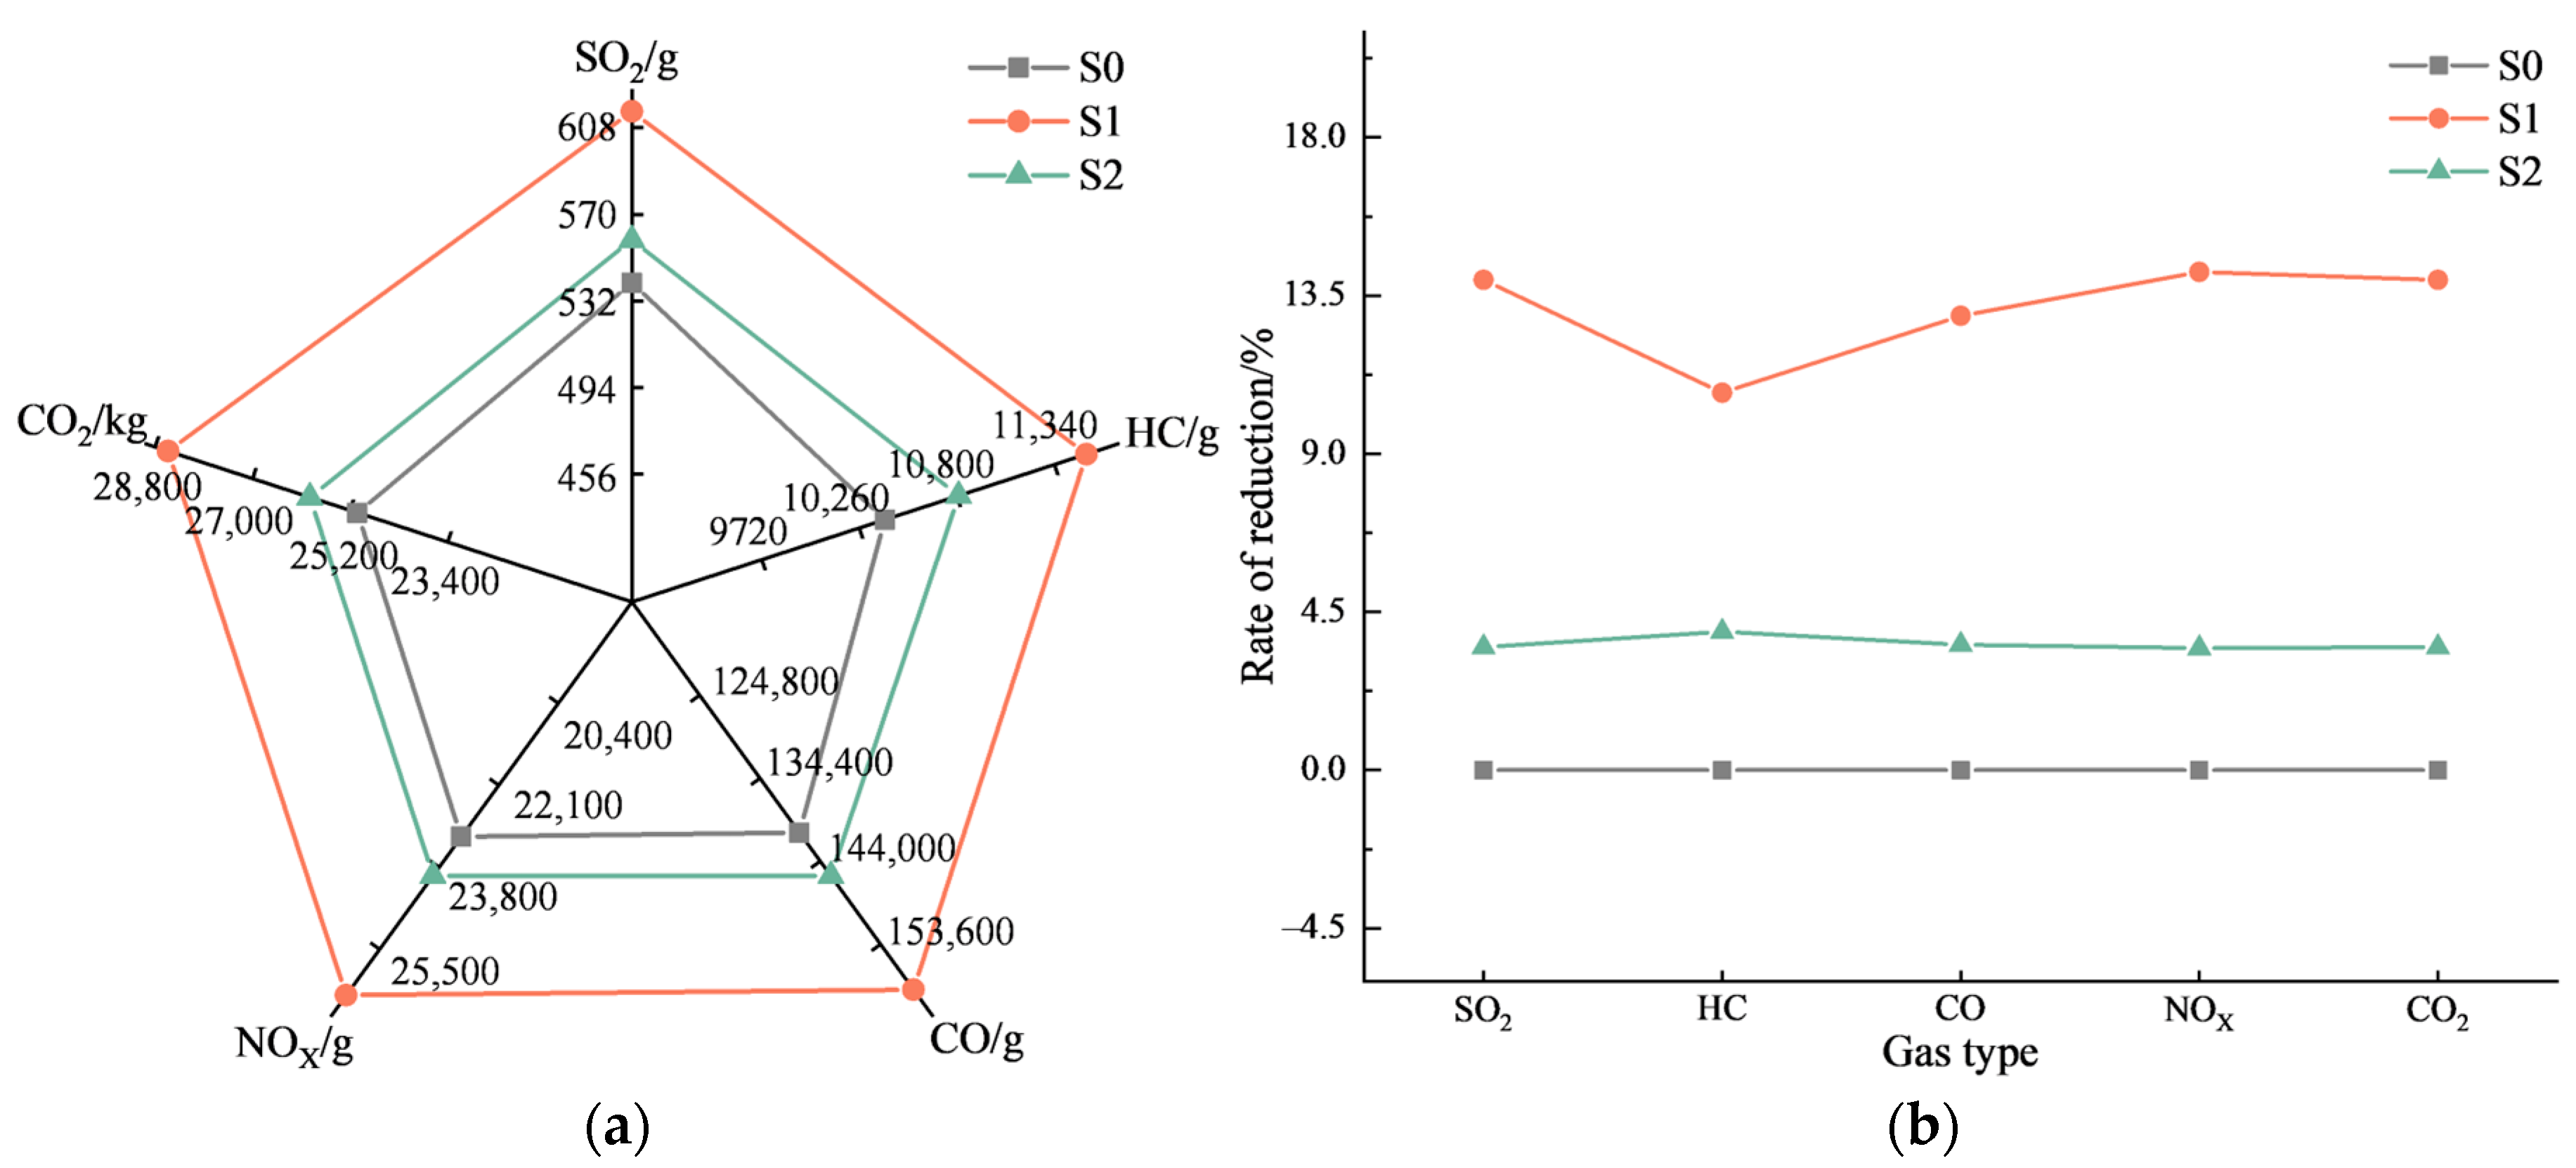
Equations (14) and (15) can be used to obtain various gas emissions of the optimal taxiing scheme under each group. Since it is not possible to quantitatively analyze the relationship between the number of taxiing conflicts and aviation fuel consumption, gas emissions were calculated without considering the S3 control group. The results are shown in Figure 10, where (a) is the gas emissions of each group and (b) is the reduction rate of the experimental group compared to the control group.
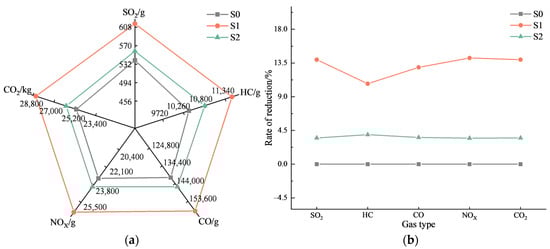
Figure 10.
(a) Gas emissions under the different groups; (b) gas emission reduction rates under the different groups.
Compared to the available path set generated by the Dijkstra algorithm, the waiting taxiing strategy reduced emissions by the following amounts: 75.32 g SO2 (13.9% reduction), 1116.69 g HC (10.7% reduction), 18,182.60 g CO (12.9% reduction), 3283.68 g NOX (14.1% reduction), and 3496.46 kg CO2 (13.9% reduction). Compared to manual experience scheduling, it reduced emissions by the following amounts: 18.88 g SO2 (3.4% reduction), 409.69 g HC (3.9% reduction), 5018.50 g CO (3.5% reduction), 804.42 g NOX (3.4% reduction), and 876.63 kg CO2 (3.4% reduction).
5. Conclusions and Discussion
5.1. Conclusions
In this study, a bilevel spatial–temporal optimization model—which is green, yields low-carbon emissions, and considers the number of turns, taxiing conflicts, and other factors—for aircraft taxiing is established. The upper-level model optimizes the taxiing path from a spatial perspective based on the start time of the current flight, thereby reducing the aviation fuel consumption and various types of pollutant gas emissions, and it passes the current optimal taxiing path scheme to the lower-level model. The lower-level model accepts the optimal taxiing path scheme of the upper-level model, optimizes the flight waiting time from a temporal perspective, thereby reducing the total waiting time and the number of taxiing conflicts, and passes the current optimal waiting time to the upper-level model. The upper- and lower-level models interact and optimize iteratively to generate the optimal solution.
In terms of the available path set generation method, we adopted the DFS algorithm. This method can find all the shortest paths and second shortest paths of each flight, based on which the path with the smallest number of turns is filtered as the available path set. The disadvantages of traditional shortest path search algorithms and manual experience assignment were overcome. The effect of aircraft turning was considered in the calculation of aviation fuel consumption. In terms of the model optimization method, genetic algorithms were designed for the upper-level and lower-level models. In the upper-level model, the taxiing paths assigned to each flight were derived from the set of available paths generated by the DFS algorithm.
Finally, Tianjin Binhai International Airport was selected as the research object, and experimental analysis was conducted. The experimental results show that the constructed bilevel spatial–temporal optimization model could effectively avoid taxiing conflicts, reduce the number of taxiing turns of aircraft, and reduce the consumption of aviation fuel and various types of pollutant gas emissions by optimizing the taxiing path of the aircraft as well as the taxiing start time. The feasibility of the model and algorithm was verified. In addition, a control group was established for comparative analysis. Compared to the available path set generated by the Dijkstra algorithm, the waiting taxiing strategy reduced the aviation fuel consumption by 753.18 kg, reduced the total waiting time by 34 s, and reduced the number of aircraft turns by 111. Compared to the available path set generated by manual empirical assignment, the waiting taxiing strategy reduced the fuel consumption by 188.84 kg, reduced the number of aircraft turns by 20, and increased the total waiting time by only 2 s. When the waiting taxiing strategy was not adopted to taxi immediately, it caused 54 taxi conflicts and increased the fuel consumption by 49.44 kg.
This study showed that different sets of available taxiing paths for aircrafts affect the optimal taxiing scheme. Optimizing the available path set of aircraft can effectively reduce aviation fuel consumption and various types of pollutant gas emissions while avoiding taxiing conflicts; different taxiing start times of aircraft will also affect the optimal taxiing scheme. Adopting appropriate waiting strategies for aircrafts can not only avoid taxiing conflicts and ensure the safety and efficiency of airport ground operations but can also reduce aviation fuel consumption and various types of pollutant gas emissions.
5.2. Discussion
Aircraft taxi path optimization requires a high degree of rationality, real-time performance, and reliability. Although the research in this paper can provide a taxi path scheme without taxiing conflicts and with the lowest total aviation fuel consumption, there are still some limitations. In an actual operation process, due to many uncertainties, such as weather changes, the aircraft cannot strictly follow the specified path and speed. This contradicts the assumptions made in this paper regarding aircraft taxiing speeds. In addition, due to the frequent occurrence of flight delays, some aircrafts may not be able to arrive or depart from the airport at the estimated time. These factors may render the originally planned taxiing path scheme inapplicable, potentially indicating that taxiing conflicts may occur, thereby resulting in increased aviation fuel consumption. Therefore, controllers are required to dynamically adjust plans according to the real-time ground conditions, continually re-evaluating and re-planning taxiing path schemes.
In addition, the airport ground is a complex system that contains multiple resource systems, such as gates, taxiways, and runways. Gates and runways serve as the start and end points for aircraft ground taxiing, and taxiing schemes are closely intertwined with their allocation. The research in this paper only considered the taxiway system. As smart airports continue to evolve, optimizing scheduling across multiple resource systems on airport grounds will draw increasing attention. Future research should comprehensively consider these factors to enhance airport operational efficiency and promote the sustainable development of the air transportation industry.
Author Contributions
Conceptualization, Y.C. and L.Q.; Data curation, L.Q.; Formal analysis, L.Q.; Investigation, L.Q.; Methodology, L.Q.; Resources, L.Q.; Software, L.Q.; Supervision, Y.C. and J.Y.; Validation, L.Q.; Visualization, L.Q.; Writing—original draft, L.Q.; Writing—review and editing, Y.C. and J.Y. All authors have read and agreed to the published version of the manuscript.
Funding
This research described in this paper was fully supported by a grant from the Safety Capacity Building Program of Civil Aviation Administration of China (14002500000020J074).
Data Availability Statement
The data that support the findings of this study are available from the corresponding author upon reasonable request.
Conflicts of Interest
There are no conflicts of interest.
References
- Air Transport Action Group. Facts & Figures [EB/OL]. (2023-04). Available online: https://www.atag.org/facts-figures (accessed on 20 March 2024).
- International Energy Agency. Aviation [EB/OL]. (11 July 2023). Available online: https://www.iea.org/reports/aviation (accessed on 9 April 2024).
- Air Transport Action Group. Waypoint 2050; Air Transport Action Group: Geneva, Switzerland, 2021. [Google Scholar]
- European Environment Agency. European Aviation Environmental Report; EASA: Cologne, Germany, 2022. [Google Scholar]
- van der Sman, E.; Peerlings, B.; Kos, J.; Lieshout, R.; Boonekamp, T. Destination 2050—A Route to Net Zero European Aviation; NLR-Royal Netherlands Aerospace Centre & SEO Amsterdam Economics: Amsterdam, The Netherlands, 2021. [Google Scholar]
- Jiang, Y.; Liu, Z.-Y.; Hu, Z.-T.; Wu, W.-W.; Wang, Z. Coordinated scheduling model of arriving aircraft at large airport. J. Traffic Transp. Eng. 2022, 22, 205–215. [Google Scholar]
- Wang, C.; Ren, Y.-H. A Model of Gate Allocation for Parallel Multi-runway Hybrid Operation from the Perspective of Fuel-saving and Carbon Emission Reduction. J. Transp. Inf. Saf. 2021, 39, 144–152. [Google Scholar]
- Sun, R.-F.; Li, J.; Wan, L.-L.; Yang, H.-T. Optimization of aircraft green taxi based on speed allocation. Sci. Technol. Eng. 2022, 22, 6752–6758. [Google Scholar]
- Shan, Y.; Shao, Y.; Yuan, Q.; Jiang, Y. Multiobjective Gate Assignment Model Considering Carbon Emissions. Int. J. Environ. Res. Public Health 2023, 20, 3952. [Google Scholar] [CrossRef]
- Weiszer, M.; Chen, J.; Stewart, P. A real-time Active Routing approach via a database for airport surface movement. Transp. Res. Part C Emerg. Technol. 2015, 58, 127–145. [Google Scholar] [CrossRef]
- Soltani, M.; Ahmadi, S.; Akgunduz, A.; Bhuiyan, N. An eco-friendly aircraft taxiing approach with collision and conflict avoidance. Transp. Res. Part C 2020, 121, 102872. [Google Scholar] [CrossRef]
- Cao, F.; Tang, T.-Q.; Gao, Y.-Q.; You, F.; Zhang, J. Calculation and analysis of new taxiing methods on aircraft fuel consumption and pollutant emissions. Energy 2023, 277, 127618. [Google Scholar] [CrossRef]
- Li, N.; Zhao, Q.; Xu, X.-H. Research on Taxing Optimization for Aircraft Based on Improved A*Algorithm. Comput. Simul. 2012, 29, 88–92. [Google Scholar]
- Rosa, L.P.; Ferreira, D.M.; Cruciol, L.L.B.V.; Li, W.-G.; Deng, X.-J. Genetic algorithms for management of taxi scheduling. In Proceedings of the 2013 International Conference on Artificial Intelligence, Beijing, China, 3–9 August 2013. [Google Scholar]
- Benlic, U.; Brownlee, A.E.I.; Burke, E.K. Heuristic search for the coupled runway sequencing and taxiway routing problem. Transp. Res. Part C Emerg. Technol. 2016, 71, 333–355. [Google Scholar] [CrossRef]
- Zhang, Z.-N.; Wang, T. Taxing path optimization of airport at the aircraft end-around taxiway. Sci. Technol. Eng. 2019, 19, 241–248. [Google Scholar]
- Jiang, Y.; Wang, H.; Fan, W.-G.; Chen, L.; Cai, M.-T. Spatio-temporal cooperative optimization model of surface aircraft taxiing. J. Traffic Transp. Eng. 2019, 19, 127–135. [Google Scholar]
- He, S.; Lu, C.-Y.; Wang, Y.-Y.; Wang, D.-S. Lateral runway airport based on improved genetic algorithm Glide path optimization. Sci. Technol. Eng. 2021, 21, 8695–8701. [Google Scholar]
- Li, N.; Sun, Y.; Yu, J.; Li, J.-C.; Zhang, H.-F.; Tsai, S.-B. An Empirical Study on Low Emission Taxiing Path Optimization of Aircrafts on Airport Surfaces from the Perspective of Reducing Carbon Emissions. Energies 2019, 12, 1649. [Google Scholar] [CrossRef]
- Sun, R.; Li, J.; Niu, K.-X.; Tian, Y.; Xu, C. Research on Joint Ground Movement Optimization Based on Bilevel Programming. Aerospace 2022, 9, 502. [Google Scholar] [CrossRef]
- Jiang, Y.; Wang, Y.-S.; Liu, M.-M.; Xue, Q.-W.; Zhang, H.-H.; Zhang, H. Bilevel spatial–temporal aircraft taxiing optimization considering carbon emissions. Sustain. Energy Technol. Assess. 2023, 58, 103358. [Google Scholar] [CrossRef]
- Obajemu, O.; Mahfouf, M.; Maiyar, L.M.; Al-Hindi, A.; Weiszer, M.; Chen, J. Real-Time Four-Dimensional Trajectory Generation Based on Gain-Scheduling Control and a High-Fidelity Aircraft Model. Engineering 2021, 7, 495–506. [Google Scholar] [CrossRef]
- Zhang, T.; Ding, M.; Zuo, H.; Chen, J.; Weiszer, M.; Qian, X.-Y.; Burke, E.K. An online speed profile generation approach for efficient airport ground movement. Transp. Res. Part C 2018, 93, 256–272. [Google Scholar] [CrossRef]
- Zhang, M.; Huang, Q.-W.; Liu, S.-H.; Li, H.-Y. Multi-Objective Optimization of Aircraft Taxiing on the Airport Surface with Consideration to Taxiing Conflicts and the Airport Environment. Sustainability 2019, 11, 6728. [Google Scholar] [CrossRef]
- Jiang, Y.; Hu, Z.-T.; Liu, Z.-Y.; Zhang, H.-Y.; Wang, Z. A Bilevel Programming Approach for Optimization of Airport Ground Movement. Trans. Nanjing Univ. Aeronaut. Astronaut. 2021, 38, 829–839. [Google Scholar] [CrossRef]
- Jiang, Y.; Wang, Y.-S.; Xue, Q.-W.; Wu, W.-W. Research on Space-Time Taxiing Optimization of Aircraft Based on Carbon Emission. J. S. China Univ. Technol. (Nat. Sci. Ed.) 2023, 51, 152–159. [Google Scholar]
- Air China. Check-in Deadlines for Air China Flights at All Airports in China [EB/OL]. Available online: https://www.airchina.com.cn/cn/info/airport-guide/counter-check-in/domestic-deadline/domestic_deadlines_c3.shtml (accessed on 22 March 2024).
- Air China. Gate Closure Schedule for Air China Flights at Airports in China [EB/OL]. Available online: https://et.airchina.com.cn/cn/info/gate_closing_time/domestic.shtml (accessed on 22 March 2024).
- Ren, X.-H.; Jiao, Y.; Zhao, Y.-F. Multi grid cellular automata boarding model considering carried baggages. J. Traffic Transp. Eng. 2017, 17, 122–129. [Google Scholar]
- International Civil Aviation Organization (ICAO). ICAO engine exhaust emissions databank [DB/OL]. (2019-05). Available online: https://www.easa.europa.eu/domains/environment/icaoaircraft-engine-emissions-databank (accessed on 21 March 2024).
- Li, J.; Zhao, Z.-Q.; Liu, X.-G.; Zhou, X.-N.; Wang, K.; Zhang, P. Study an analysis of aircraft emission inventory for Beijing Capital International Airport. China Environ. Sci. 2018, 38, 4469–4475. [Google Scholar] [CrossRef]
- Wang, Z.-J.; Liu, S.-J.; Zhou, J.-Y.; Sun, J. Multimodal public transportation route planning considering personalized travel demand. J. Southwest Jiaotong Univ. 2022, 57, 1319–1325, 1333. [Google Scholar]
- Department of Development Planning, Civil Aviation Administration of China. Statistical Data on Civil Aviation of China 2020; China Civil Aviation Publishing House: Beijing, China, 2020. [Google Scholar]
- Wang, X.; Zuo, Q.-H. Aircraft taxiing route planning based on airport hotspots. In AIP Conference Proceedings, Proceedings of the1st International Conference on Materials Science, Energy Technology, Power Engineering (MEP 2017), Hangzhou, China, 15–16 April 2017; AIP Publishing: Long Island, NY, USA, 2017; p. 1839. [Google Scholar]
- Jiang, Y.; Liu, Z.; Hu, Z.; Zhang, H.-H. A Priority-Based Conflict Resolution Strategy for Airport Surface Traffic Considering Suboptimal Alternative Paths. IEEE Access 2021, 9, 606–617. [Google Scholar] [CrossRef]


Disclaimer/Publisher’s Note: The statements, opinions and data contained in all publications are solely those of the individual author(s) and contributor(s) and not of MDPI and/or the editor(s). MDPI and/or the editor(s) disclaim responsibility for any injury to people or property resulting from any ideas, methods, instructions or products referred to in the content. |
© 2024 by the authors. Licensee MDPI, Basel, Switzerland. This article is an open access article distributed under the terms and conditions of the Creative Commons Attribution (CC BY) license (https://creativecommons.org/licenses/by/4.0/).