Abstract
Oxygenated compounds such as acids in bio-oils (BO) have been related to the corrosion of metals and their storage instability when applied as fuels. Therefore, upgrading BO by removing acids (deacidification) can be a valuable technique to reduce corrosivity using specific separation processes. Therefore, the objective of this paper was to evaluate the effect of the water content in the solvent (aqueous methanol), the carboxylic acid content in the BO and extraction temperature on the deacidification process by liquid–liquid extraction (LLE), as well as the effect of the same parameters on the quality of the deacidified BO through physical–chemical and GC-MS analyses. The results show that an increase in the water content (5 to 25%) in the solvent and an increase in the carboxylic acids content (24.38 to 51.56 mg KOH/g) in the BO reduce the solvent’s capacity to extract carboxylic acids while increasing the temperature (25 to 35 °C) of the deacidification process promoted an increase in its capacity to remove them. Consequently, the highest deacidification efficiency (72.65%) is achieved with 5% water in methanol at 25 °C for BO1 (TAN = 24.38 mg KOH/g). Therefore, the deacidification process through LLE using aqueous methanol contributed significantly to BO upgrading.
1. Introduction
With increasing environmental concerns and, unlike other renewable energy sources that generate only heat and power, biomass has a promising potential to be converted into heat, energy and value-added chemicals due to its abundant chemical composition and resources worldwide [1]. Sources of biomass (material consisting mainly of carbon, hydrogen, oxygen and nitrogen, although sulfur is also present in smaller proportions) encompass various natural materials and their derivatives. In such a way, it is possible to divide them into two main groups to produce liquid biofuels: lignocellulose (LC) and triacylglycerol (TAG) sources. One of the technologies that can convert lignocellulose-based or triacylglycerol-based biomass into biofuels and other chemicals is pyrolysis. The liquid fraction obtained from the pyrolysis of both biomasses is called bio-oil, but the products have differences in their physical properties and chemical composition [2]. For this reason, this study focused on bio-oils from TAG-based biomass pyrolysis.
Pyrolysis (thermal cracking) is a process of thermochemical conversion of biomass, which works at 350–650 °C in the absence of oxygen and, in some cases, in the presence of a catalyst (catalytic cracking) to produce solid, liquid (bio-oil) and gaseous biofuels [2,3,4]. Bio-oils, also known as biomass pyrolysis oil, pyrolysis oil, or bio-crude, have been considered promising candidates to replace petroleum-derived products regarding power generation, heat and the extraction of valuable chemicals [1,2,5].
Bio-oil is a complex mixture consisting of hydrocarbons (linear and cyclic paraffin, olefins) and oxygenated compounds (aldehydes, ketones and carboxylic acids) [2,4,6], which, in general, presents an almost black, dark reddish brown or dark green color [7]. However, there is an impediment to the direct substitution of petroleum-derived fuels and chemical products by bio-oil due mainly to its low calorific value and high oxygen content, resulting in its instability, high corrosiveness [1,2,3,8] and high acid value (with an average of 82.03 mg KOH/g), as the breakdown of triglycerides generates free carboxylic acids [2]. Therefore, bio-oil must be processed, refined, or upgraded to usable transportation fuels and value-added chemicals [1,3,8,9,10,11,12,13], aiming to improve some of their properties or comply with the standards established for such products, mainly in terms of olefin content and acid value [2]. Although the complexity of bio-oil composition hinders such procedures [2,10], bio-oil refining/upgrading is possible due to the employment of specific customized separation technologies and processes [1].
Several studies in the form of reviews on upgrading bio-oil address the various technologies developed for this purpose [7,10,11,14,15]. Among the technologies that have been addressed are catalytic cracking, hydrotreatment, esterification and stabilization of physical–chemical properties of bio-oil [16,17,18]. However, there is a gap regarding the fractionation/extraction of bio-oil via separation techniques such as supercritical fluid extraction, adsorption, membrane, electrosorption and ionic liquid extraction [1], column chromatography, distillation, solvent extraction and, in particular, liquid–liquid extraction (organic solvent extraction, water extraction) [1,8,19], which can also provide efficient separation of bio-oil, laying a solid foundation for its improvement [8].
Regarding LLE, few researchers have used organic solvents to extract bio-oil components [1,3,20,21,22,23,24,25], much less for bio-oil from TAG biomass, aiming at its upgrading. In addition, the few studies that use LLE with organic solvents to separate oxygenated compounds use it to purify the aqueous phase, not the crude bio-oil itself.
LLE separates the components of a liquid (the feed) by contact with a second liquid phase (the solvent). The separation process is based on differences in the chemical properties of the feed components, such as polarity differences and hydrophobic/hydrophilic character. To be more precise, a deviation from thermodynamic equilibrium drives the transfer of components from one phase to the other, and the state of equilibrium depends on the nature of the interactions between the components of the feed and the solvent phase. Differences in these interactions determine the potential for the separation of feed components. In this way, an LLE process produces a solvent-rich stream called an “extract” that contains a portion of the feed and a feed stream without the extracted components called a “raffinate” [26]. Therefore, in bio-oil extraction using organic solvent, it is essential to understand the compatibility and solubility of bio-oil species or compounds in such a solvent. In parallel, the solubility of bio-oil compounds in the organic solvent is strongly influenced by the polarity of solutes and solvents. The complex chemical composition of bio-oil is another factor that affects the distribution of solutes in the bio-oil (raffinate) and organic solvent (extract) phase due to concentration gradients [1].
The extraction and fractionation of bio-oil through LLE has been widely studied and reported using water [27,28,29,30] and organic solvents [31,32,33,34,35,36,37,38], aiming mainly to study the feasibility of extraction regarding the solvent used and the optimization of extraction conditions [1]. Thus, research that applies LLE as a process of separation of different classes of chemical compounds, such as oxygenated compounds, investigates the efficiency of extraction and recovery through parameters such as (1) bio-oil/solvent ratio [35]; (2) addition of co-solvent or modifier [32]; (3) extraction temperatures [32,34]; and (4) reaction time [32].
Oxygenated compounds such as organic acids in bio-oils have been related to the corrosion of metals and instability in their storage when applied as fuels. In such a way, bio-oil’s corrosiveness is more severe when the water content is high and when used at high temperatures. Therefore, removing the acids can be a valuable technique to reduce corrosiveness [38]. LLE is the most widely used and effective process to eliminate naphthenic acids from petroleum, especially when using ammonia or alkaline alcohol solutions. However, these systems usually form stable emulsions [39]. Therefore, several proposals for LLE use different solvent systems [40,41,42,43,44]. In the oils and fats industry, one of the deacidification methods for oils with high acidity is LLE, which is based on the different solubilities of free fatty acids (FFA) and triglycerides in various organic solvents. The deacidification of oils by LLE has been evaluated by several researchers, and ethanol, methanol and acetone have been emphasized as solvents for FFA extraction. Even though many organic solvents are consumed during the LLE process, by selecting appropriate solvents for the extraction of the desired products, a good separation of the components present in the bio-oil can be achieved [8].
In this context, the main objective of this work was to investigate the deacidification of bio-oil from triglyceride-based biomass by applying LLE as a separation process using aqueous methanol as a solvent. The evaluation process was meticulous, considering the effect of water content in methanol on the deacidification process and the quality of raffinate streams (deacidified BO). The effect of the carboxylic acid content in feed (BO) on the deacidification process and the quality of raffinate streams was also rigorously evaluated. Finally, the effect of temperature (25–35 °C) on the deacidification process and the quality of the raffinate streams was evaluated.
2. Materials and Methods
2.1. Materials
In order to carry out the deacidification experiments of crude biofuels by LLE, four bio-oils with a high content of carboxylic acids (free fatty acids), i.e., high acidity, were selected, as shown in Table 1. These free fatty acids were the target components for extraction in the present study. All bio-oils were obtained via triglyceride cracking under different operating conditions in a pilot cracking unit, as described in detail by Mota et al. [45]. The aqueous methanol (5%, 10%, 15%, 20% and 25% by mass of water) used as a solvent for LLE was prepared by mixing absolute alcohol with different masses of deionized water to obtain the desired water content. The pre-established amount of water was added to the methanol to increase their specific gravity and, thus, favor the formation of phases, which is fundamental in LLE.

Table 1.
Physical–chemical properties of the bio-oils used in the present study to evaluate deacidification by LLE.
2.2. Preliminary Tests
The study of any LLE process only becomes relevant if the systems have limited solubility, or, in other words, if, at some point, the formation of at least two liquid phases occurs [53]. Therefore, preliminary tests were carried out with five different water contents in methanol to define the water contents that should compose the aqueous methanol solutions, and the feed/solvent ratio of 1/1 remained constant.
Preliminary tests were carried out using approximately 5 g of bio-oil and 5 g of methanol with 5% by weight of water. Once weighed, the bio-oil and aqueous methanol were added to a 20 mL test tube, and the system (bio-oil/aqueous methanol) was shaken manually for thirty seconds and remained at rest for 24 h. After the rest period, at least two phases were formed. The same procedure was performed for methanol with 10%, 15%, 20% and 25% by weight of water.
From the results of the preliminary tests, it was determined which water contents should be used in the preparation of the aqueous methanol solutions. However, in larger quantities, to carry out the experiments themselves, aliquots of extract and, mainly, raffinate, should be removed to perform various physical–chemical and composition analyses, as described in the following sections. As the five water contents in methanol allowed the formation of at least two phases, it was established that these contents would be part of the list of variables investigated in deacidifying bio-oils via LLE.
2.3. Experimental Procedure
In this step, the deacidification of bio-oil by LLE was investigated through the following variables: (1) water content in methanol (5%, 10%, 15%, 20% and 25% by water mass); (2) carboxylic acid (FFA) content in the feed, indicated by the acid value of the bio-oil, as shown in Table 1; and (3) extraction temperature (25 and 35 °C). At the same time, the effect of the deacidification of bio-oils by LLE on the quality of the raffinate streams, i.e., of the deacidified bio-oil, was investigated, evaluating the following physical–chemical properties: specific gravity at 20 °C, kinematic viscosity at 40 °C, corrosiveness to copper, saponification value, ester value and refractive index. The following two sections describe the experimental procedure for conducting such an investigation.
2.3.1. Deacidification of BOs by LLE (Group of Experiments I)
The Group of Experiments I is characterized by a set of experiments developed to investigate the effect of the water content in the methanol and the effect of the content of free fatty acids present in the feed on the deacidification of bio-oil by LLE through the following experimental procedure: approximately 100 g of BO1 and approximately 100 g of solvent (aqueous methanol with 5% by mass of water) were weighed to maintain the feed/solvent mass ratio constant and equal to 1/1 in all experiments. In a separation funnel with a capacity of 500 mL, the bio-oil was first added, and then the solvent was added. Then, the materials added to the separation funnel were vigorously stirred for 30 s at room temperature (±25 °C) so that the solvent had adequate contact with the feed. After the end of the stirring, the mixture rested for 24 h at room temperature to ensure total separation of the phases. After the resting period and with the two phases formed, the raffinate phase (organic phase) at the top of the funnels was carefully separated from the extract phase (aqueous phase), in which the extract phase is characterized by the presence of solvent and acidic compounds extracted from the bio-oil and the raffinate phase consists of deacidified bio-oil. Then, both phases were collected (Figure 1) and weighed. Finally, this group of experiments’ raffinate stream was subjected to a series of physical–chemical and spectroscopic analyses with Fourier Transform Infrared (FTIR), as described in Section 2.4.
Figure 1.
Extract phase and raffinate phase obtained in the bio-oil deacidification process by LLE.
As described above, the LLE process was repeated for the deacidification of BO1, adding methanol with 10%, 15%, 20% and 25% by mass of water. The same experimental procedure was used to deacidify BO2 and BO4, totaling 15 experiments for Group I.
2.3.2. Deacidification of BOs by LLE (Group of Experiments II)
Group of Experiments II is characterized by a set of experiments developed to investigate the effect of temperature on the deacidification of bio-oils by LLE through the following experimental procedure: approximately 100 g of BO3 and approximately 100 g of solvent (aqueous methanol with 5% by mass of water) were weighed to keep the feed/solvent mass ratio constant and equal to 1/1 in all experiments. In parallel, a 1 L capacity stainless steel stirred and jacketed vessel coupled to a temperature-controlled ultra-thermostatic bath was programmed to operate at 25 °C. Once the established temperature was reached, the bio-oil and solvent were added. Then, the materials added to the vessel were vigorously stirred for 60 min so that the solvent had adequate contact with the feed. After the stirring, the mixture was transferred to a separation hopper, resting for 24 h at room temperature to ensure total separation of the phases. After the resting period and with the two phases formed, the raffinate phase (organic phase) at the top of the funnels was carefully separated from the extract phase (aqueous phase). Both phases were collected, weighed and analyzed, as described in Section 2.3.1.
The time the two phases are in contact with each other can affect the extraction efficiency, so a longer contact time can allow for a more complete extraction [54]. Therefore, it is essential to highlight that although the present study did not evaluate the effect of contact time on the bio-oil deacidification process through LLE, the extraction system used to carry out Group of Experiments II allowed increasing the contact time (60 min) when compared to that (30 s) used for Group of Experiments I.
As described above, the extraction process was repeated to deacidify BO3 with added methanol of 10%, 15%, 20% and 25% by mass of water. In addition, the same experimental procedure described for the deacidification of BO3 at 25 °C was used for the deacidification of BO3 at 35 °C, totaling ten experiments for Group of Experiments II.
2.4. Analytical Methods
2.4.1. Physical–Chemical Analysis
The physical–chemical properties of the BOs and their respective raffinate phases were determined following the AOCS and ASTM Standard Methods: specific gravity at 20 °C (AOCS Cc 10c-95), kinematic viscosity at 40 °C (ASTM D445), corrosiveness to copper (ASTM D130), total acid number (TAN) or acid value (ASTM D974), saponification value (AOCS Cd 3-25), refractive index (AOCS Cc 7-25) and ester value, which is the difference between the saponification value and the acid value, as described by Paquot [51].
2.4.2. FTIR Analysis
Spectroscopic analyses of bio-oils using Fourier Transform Infrared were performed using an FTIR spectrometer (Model Prestige 21, Shimadzu, Tokyo, Japan) to identify functional groups present in bio-oils and raffinate and extract streams. The absorbance spectra were obtained within the interval 4000–400 cm−1 and a resolution of 16 cm−1 with the aid of a KBr Window. Thus, the bio-oil samples were placed on the KBr surfaces using micropipettes to spread the liquid, producing a uniform layer.
2.4.3. Chemical Derivatization
Before carrying out the analysis of gas chromatography coupled to mass spectrometry (GC-MS), the samples of BO3, raffinate streams and extract streams were pre-treated through chemical derivatization, aiming to identify and correctly quantify the polar organic compounds, mainly carboxylic acids in the form of free fatty acids. This way, an aliquot of 20.0 μL of BO3 was transferred to a vial, and 100 μL of N-methyl (trimethylsilyl) trifluoroacetamide (MSTFA) was added. The mixture was homogenized and heated at 60 °C for 30 min using an orbital shaker. After dilution in 880 μL of CH2Cl2 solvent, the homogeneous liquid phase was ready to be injected into the GC–MS apparatus, as described by Mancio et al. [55]. The same procedure was performed for the raffinate and extract streams.
2.4.4. GC-MS Analysis
Derivatized samples were subjected to GC-MS analysis as described in the literature [55]. Thus, a gas chromatograph coupled to a mass spectrometer (Shimadzu, Model: GCMS-2010) and QP2010 interface was used for that analysis. The column was an RTX-5MS with a length of 30 m and a diameter of 0.25 mm. Helium was used as a carrier gas with a 1 mL/min flow rate and a split ratio of 1/100. The following temperature schedule was used: the oven temperature was increased by 15 °C/min to 150 °C, and then by 8 °C/min to 200 °C and 2 °C/min to 240 °C. This temperature was maintained for 4 min before heating the oven at 15 °C/min to 300 °C. The injector and detector temperature were 280 °C. The chemical compounds in BO3, raffinate and extract streams were identified by comparison with the NIST05s.LIB library, considering those that showed a high similarity index.
2.5. Determination of LLE Process Parameters
The distribution coefficient and extraction efficiency were used to evaluate the three variables in the deacidification of BO3 via LLE with aqueous methanol. The distribution coefficient can be determined directly by measuring the solute concentration in the extract and the raffinate. When an adequate analytical method is available only for the feed phase, as is the case in the present study, the distribution coefficient can be determined by measuring the solute concentration in the feed (BO3) and raffinate (BO3 deacidified after application of LLE with aqueous methanol) and calculating the distribution coefficient from the material balance. When the initial solute concentration in the extraction solvent is equal to zero (before extraction), the distribution coefficient expressed in terms of mass fractions is given by
where K″ is the mass fraction of the solute in the extract divided by the mass fraction of the solute in the raffinate, is the total mass of feed added to the vial, is the total mass of extraction solvent before extraction, is the mass of raffinate after extraction, is the mass of extract after extraction, is the mass fraction of solute in the feed before extraction, is the mass fraction of solute in the raffinate, in equilibrium, and is the mass fraction of solute in the extract, in equilibrium.
The efficiency of deacidification of bio-oils by LLE using aqueous methanol as solvent was evaluated as a function of the percentage of removal of carboxylic acids, mainly free fatty acids, calculated by the following equation:
where ηFFA is the efficiency of deacidification of bio-oils by LLE, CFFA0 is the free fatty acid content of the bio-oil before extraction, and CFFAR is the free fatty acid content of the bio-oil after extraction, i.e., it is the free fatty acid content of the raffinate. As the acidic components of bio-oils, in particular, carboxylic acids in the form of free fatty acids are related to the total acid number (TAN), which indicates the acid value of the samples [56,57], this physical–chemical property was used to calculate the deacidification efficiency through the following equation:
where TAN0 is the total acid number of the bio-oil before extraction, and TANR is the total acid number of the raffinate.
3. Results and Discussion
3.1. Deacidification of BOs by LLE (Experiment Group I)
3.1.1. Effect of BO Deacidification by LLE on the Quality of Raffinates
In order to evaluate the effect of BO deacidification by LLE using aqueous methanol as extraction solvent on the quality of raffinate streams (deacidified BO), the effect of water content in methanol and carboxylic acid content in feed (original bio-oil) on the following physical–chemical properties was investigated: specific gravity at 20 °C, kinematic viscosity at 40 °C, saponification value, ester value, refractive index and corrosiveness to copper. The results of this investigation are presented in Figure 2. The results for corrosiveness to copper are available in Table S1 of the Supplementary Materials.
According to Figure 2, BO deacidification by LLE using aqueous methanol significantly affects the quality of deacidified bio-oils. Both the water content in the methanol and the content of carboxylic acids present in the original bio-oil significantly modify most of the physical–chemical properties, indicating that the LLE process changed the chemical composition of the bio-oil. Such a result is expected once the objective of this study is to remove carboxylic acids. According to Santos et al. [58] and Buzetzki et al. [59], the physical–chemical properties strongly depend on the bio-oil composition, which justifies the results obtained in the present study. In addition, the results show a non-linear trend, either of decrease or increase, of the physical–chemical properties of deacidified bio-oils, as there is an increase in the water content in methanol.
Figure 2a shows a significant change in the specific gravity values of the raffinate streams when LLE is performed with methanol containing 5% water. As the amount of water in methanol increased from 10% to 25%, there was a slight variation in the specific gravity values, which remained in the range of 834 to 844 kg/m3, regardless of the content of carboxylic acids in the feed. BO1 showed an increase in specific gravity values (5% of water), which remained practically constant (around 836 kg/m3) from 10% water. BO2 showed a reduction from 826 to 812 kg/m3 when using 5% water in methanol and then increased specific gravity values, remaining essentially constant (around 841 kg/m3) from 10% of water. BO4 showed a decrease in specific gravity values, remaining almost constant (values around 842 kg/m3) from 10% of water. This result can be attributed to the effect of deacidification by LLE on the levels of hydrocarbons (reduction or increase in light or heavy fractions) and oxygenated compounds, which can be confirmed by GC-MS analysis.
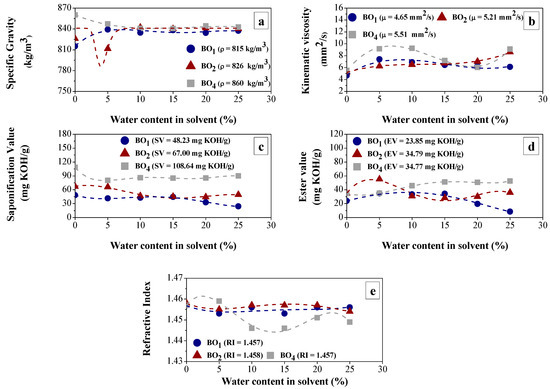
Figure 2.
Effect of water content in methanol and different starting bio-oils on the physical–chemical properties values of raffinate streams (deacidified BOs): (a) Specific gravity; (b) Kinematic viscosity; (c) Saponification value; (d) Ester value; and (e) Refractive index.
Figure 2.
Effect of water content in methanol and different starting bio-oils on the physical–chemical properties values of raffinate streams (deacidified BOs): (a) Specific gravity; (b) Kinematic viscosity; (c) Saponification value; (d) Ester value; and (e) Refractive index.
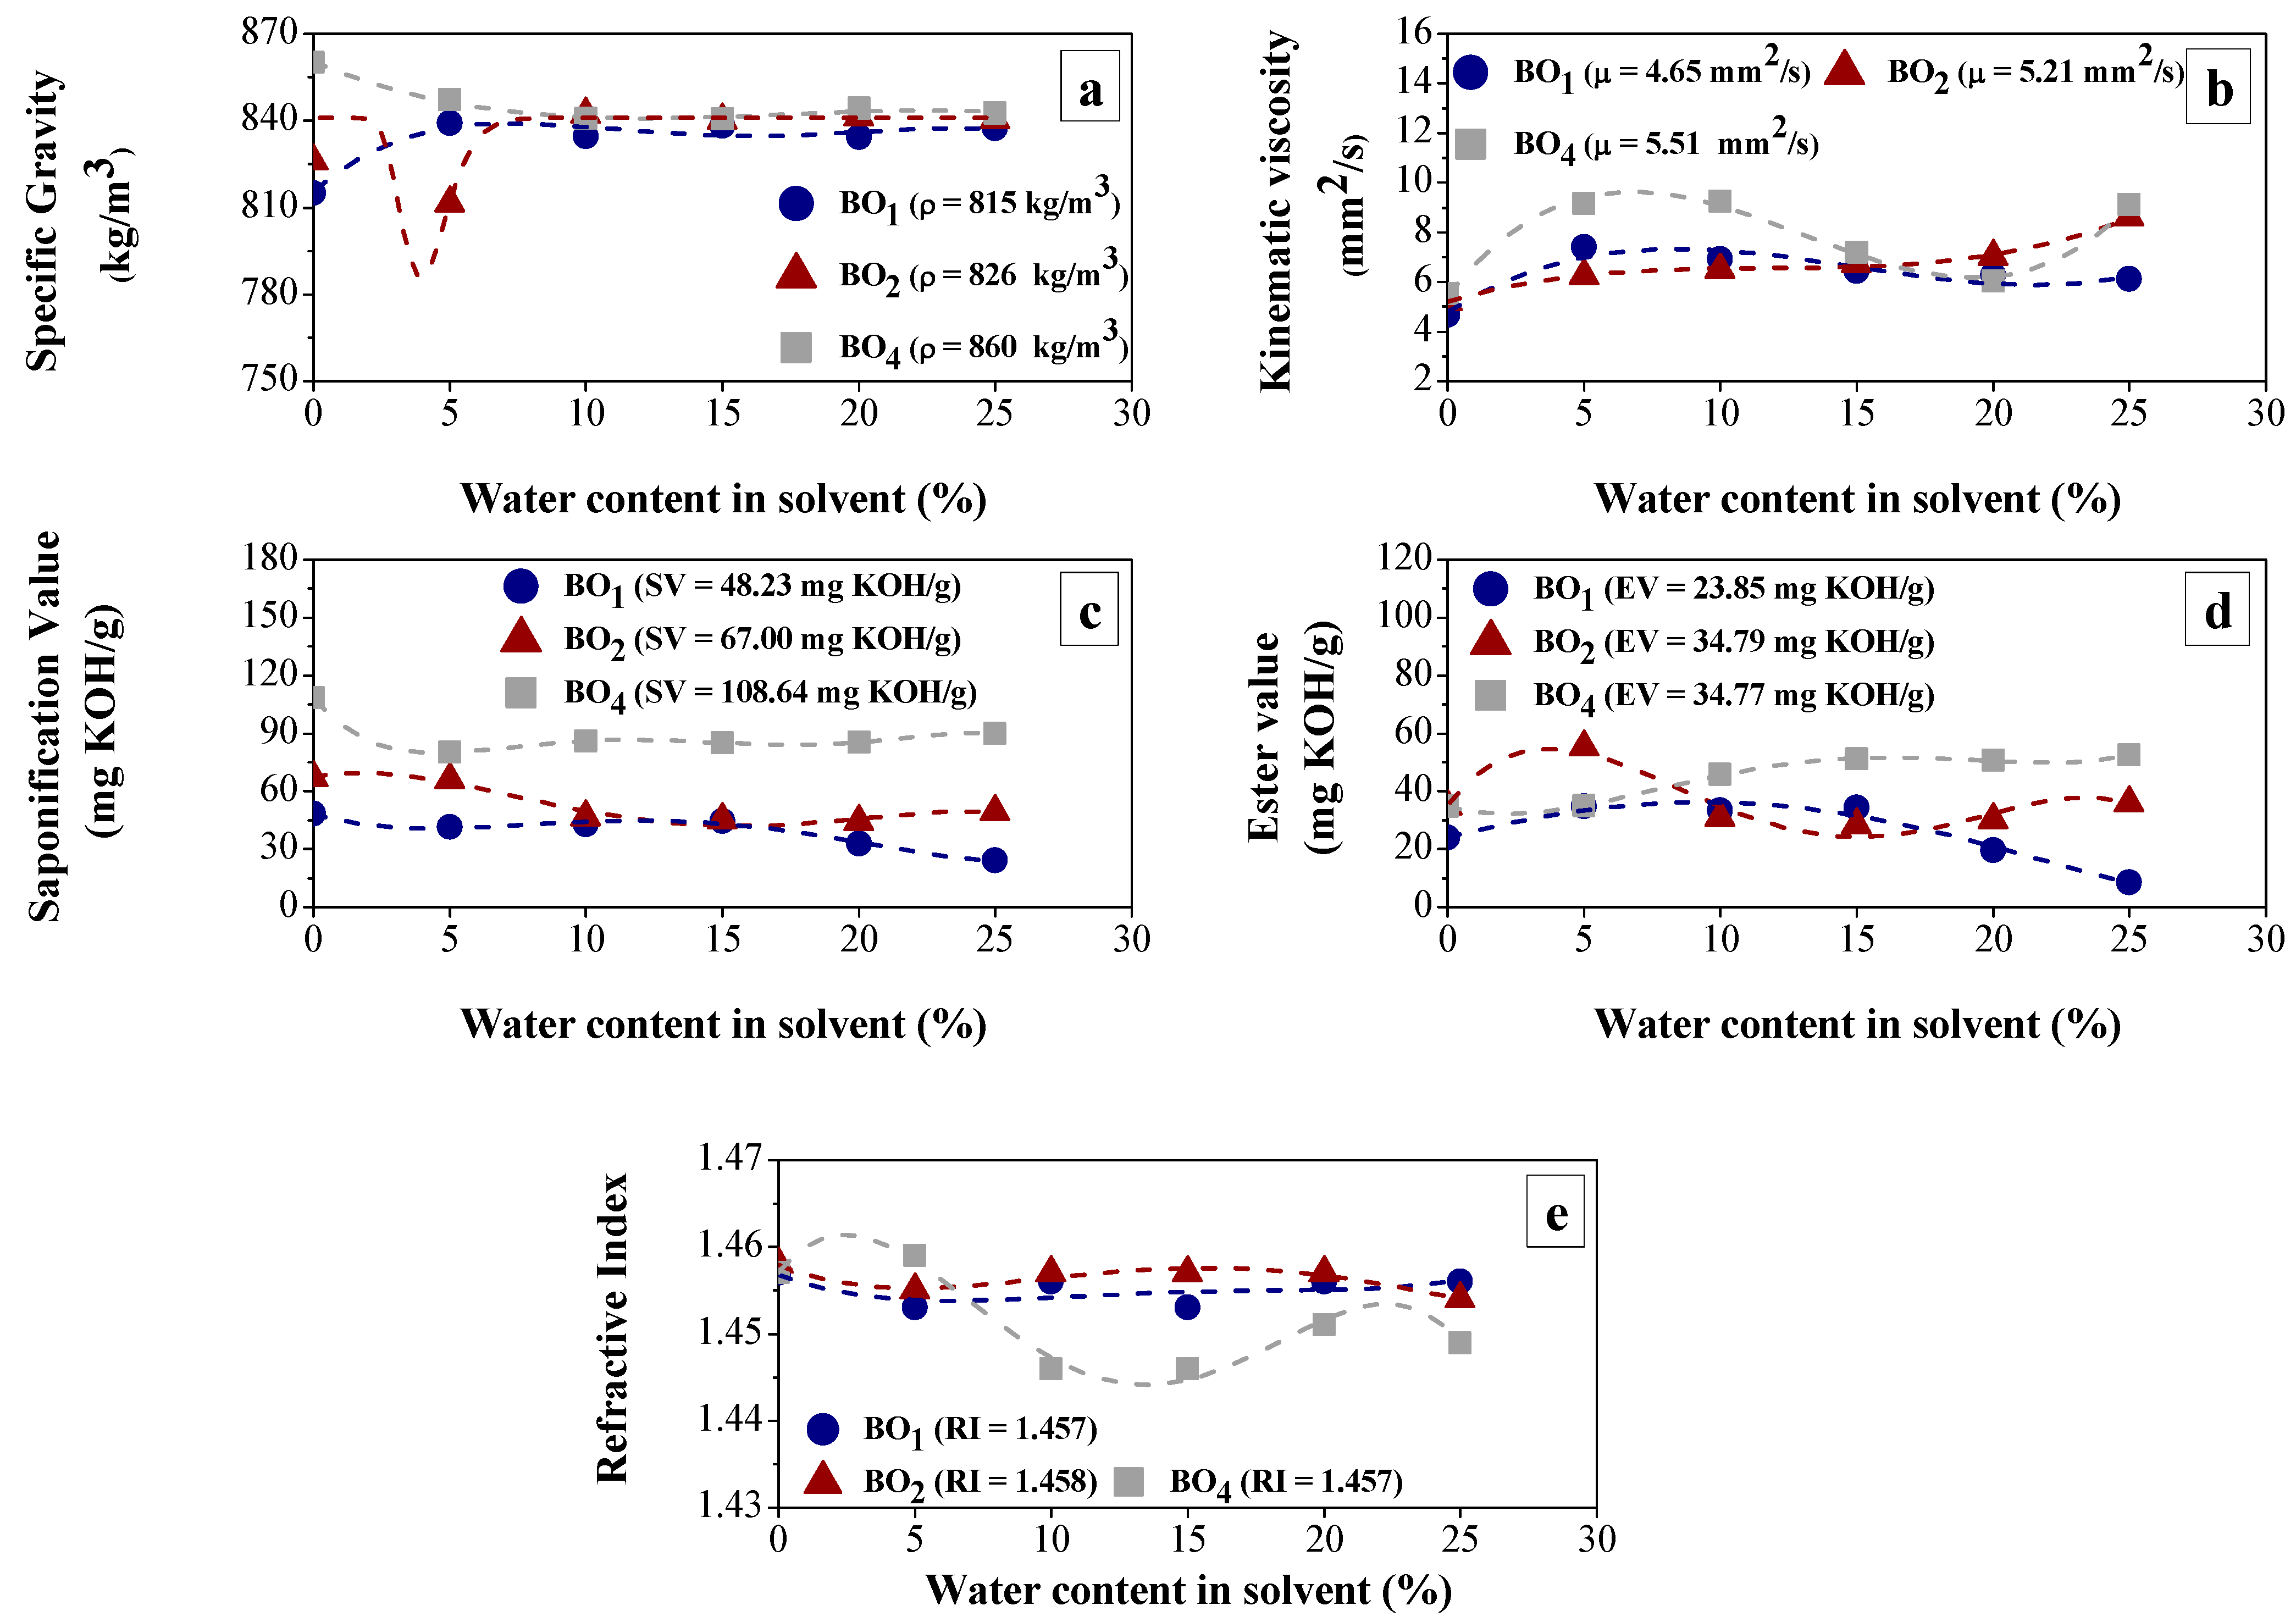
Figure 2b shows that the kinematic viscosity values of all raffinate streams are higher than those obtained for the original bio-oils. Secondly, the values referring to this property are significantly altered with the addition of water to methanol and with the content of carboxylic acids in the feed, varying from 6.11 to 7.40 mm2/s for BO1, from 6.26 at 8.61 mm2/s for BO2 and from 6.04 to 9.2655 mm2/s for BO4. The results after deacidification indicate a higher concentration of hydrocarbons with long chains in bio-oils. Santos et al. [58] reported in their study that BOs containing long-chain hydrocarbons result in higher viscosity values.
Figure 2c shows that the raffinate streams’ saponification values are lower than those of the original bio-oils. This fact is directly linked to removing carboxylic acids by the LLE process, which is indicated by the TAN values. Therefore, the saponification value is another parameter that confirms the removal of oxygenated compounds, especially carboxylic acids, characterizing the deacidification process. Secondly, Figure 2c shows that saponification values are changed as the water content in methanol and the carboxylic acid content in original bio-oils increase in such a way that ranges from 24.2 to 44.43 mg KOH/g for BO1, from 44.06 to 66.11 mg KOH/g for BO2 and 80.02 to 89.77 mg KOH/g for BO4, as indicated by their respective trend curves. However, none of the three trend curves show similar behavior for the data obtained. This result can be expected since, although the study was conducted with real BO from triglyceride-based biomass, they all have different compositions in both hydrocarbons and oxygenated compounds. Consequently, this characteristic will affect the physical–chemical properties investigated in the present study to a lesser or greater degree. According to Haas [60] and Gunstone [61], the higher the saponification value, the shorter the chain length of carboxylic acids. Therefore, knowing that BOs have different levels of oxygenated compounds and chain sizes, it is possible to have diverse behaviors for the saponification values of different BOs, which justifies the results.
According to Figure 2d, the ester values of the raffinate streams (deacidified BOs) are changed in different ways as the water content in methanol and the carboxylic acid content in the original bio-oils increase, as indicated by their respective trend curves. The ester values of deacidified BOs range from 8.47 to 34.81 mg KOH/g for BO1, from 28.35 to 55.25 mg KOH/g for BO2 and 34.95 to 52.47 mg KOH/g for BO4 according to the behavior shown by their respective trend curves. Furthermore, Figure 2d also shows that, for some water contents in methanol, the ester index values of the raffinate streams are higher than those obtained for BO1, BO2 and BO4. These results indicate that part of the carboxylic acids in the original bio-oil was esterified during deacidification. This fact is corroborated by the GC-MS analysis results presented in Section 3.2.3, where a possible solution for such behavior was also presented since, just like carboxylic acids in the form of free fatty acids, the presence of esters is an undesirable situation when it comes to bio-oils that will be used to produce biofuels.
Figure 2e shows small changes in the refractive index (RI) values of the deacidified BOs from BO1 and BO2 and significant changes in the RI values of the deacidified BOs from BO4, as the water content in methanol and the content of carboxylic acids in the original bio-oils increases. Such changes occur in such a way that the RI values of deacidified BOs from BO1 and BO2 increase smoothly with the increase in water to methanol, while those from BO4 first reduce with an increase of 5% to 10% and then increase with an increment of 15% to 20%. This behavior is due to a reduction in the solvent’s ability to extract carboxylic acids, as explained in Section 3.2.3. Furthermore, the RI values of the deacidified BOs ranged from 1.453 to 1.456 for BO1, from 1.454 to 1.457 for BO2 and 1.446 to 1.459 for BO4. Therefore, the deacidified BOs generally presented lower RI values than the original BO. This behavior is due to the removal of carboxylic acids themselves, especially those with a long chain, in such a way that the deacidified BOs become more concentrated in smaller molecules compared to the size of the original BO molecules, resulting in the reduction of RI values of deacidified BOs. According to Canapi [62] and Swern [63], there is a general relationship between the RI and the composition of hydrocarbon-based products, in which the RI increases as the length of the carbon chain increases.
3.1.2. Efficiency of LLE Deacidification
Effect of Water Content on Deacidification
According to Figure 3a, an increase in the water content in methanol promoted a significant increase in the acid values of BO1 and BO2, indicated by the increase in their TAN values after LLE, 6.67–15.73 mg KOH/g and 10.86–18.53 mg KOH/g, respectively. In practice, as the water content in methanol increases, these results indicate a significant reduction in the efficiency of deacidification by LLE of BO1 and BO2, 72.65–35.46% and 67.31–44.19%, respectively, as indicated by Figure 3b. These results agree with the results obtained by Wu et al. [64], who found that in a system of free fatty acids and triglycerides, the deacidification capacity of methanol decreases with the increase in the concentration of water present in the alcohol. On the other hand, an increase in the water content in the methanol promoted an increase in the efficiency of BO4 deacidification, reaching its maximum capacity (53.5%) when methanol with 25% water was used.

Figure 3.
Effect of water content in methanol and carboxylic acid content in original bio-oils on the efficiency of deacidification by LLE: (a) TAN values for different BO; and (b) Percentage of carboxylic acids removed for different BO.
Figure 4 shows that the distribution coefficient decreases from 2.45 to 0.55 for BO1 and from 2.28 to 0.808 for BO2 as the water content increases, which are the two BOs that have the lowest carboxylic acid content, as indicated by the TAN values (Table S2 of the Supplementary Materials). On the other hand, the opposite behavior was observed for BO4, which has an acid value of 73.77 mg KOH/g, showing an increase in the distribution coefficient values from 0.63 to 1.17. In addition, the distribution coefficient values for all water contents reported in Figure 4 are relatively low. According to Green et al. [26], distribution coefficients equal to or greater than ten are desired for a cost-effective process, as they allow operation with minimal amounts of solvent and produce higher solute concentrations in the extract. The mass balance performed to obtain the results in Figure 4 is in Table S2 of the Supplementary Materials.
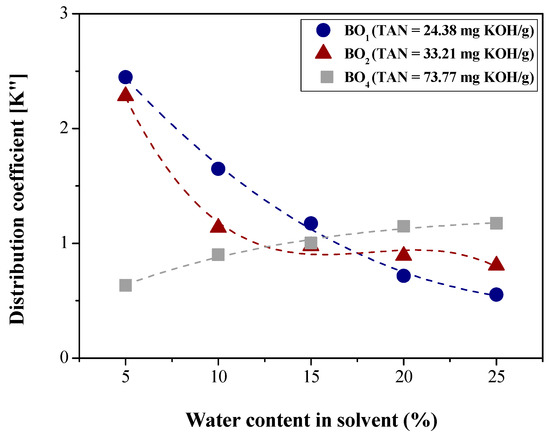
Figure 4.
Effect of water content in methanol and carboxylic acid content in original bio-oils on distribution coefficient.
Effect of Acid Content in the Feedstock on Deacidification
Figure 3 also shows that the content of carboxylic acids in the feed, indicated here by the TAN, significantly influences the efficiency of the solvent. The best results concerning the deacidification of the BOs are obtained for the feed that has the lowest acid content and the lowest water content in methanol at room temperature, i.e., 24.38 mg KOH/g and 5% water, respectively, resulting in 72.65% of the acids removed. Therefore, the acid content in the feed negatively affects the deacidification process, as was already expected due to the limited capacity of the solvent caused by its saturation at high solute concentrations [65]. Gandhi et al. [66] conducted a study to determine the effectiveness of extracting fatty acids from bio-oil (obtained by thermal cracking of canola oil) using neutral and basic aqueous solutions. The results of this study show that the most outstanding efficiency was achieved when employing single-stage extraction with an aqueous NaOH solution at 80 °C, promoting a reduction in the acid value of 101.6 mg KOH/g (bio-oil before extraction) to 29.1 mg KOH/g (bio-oil after extraction). Consequently, this result provides a fatty acid removal efficiency equivalent to 71.36%. Therefore, comparison with similar studies shows that under milder operating conditions, especially in extraction temperature, aqueous methanol is a promising organic solvent for upgrading bio-oils.
3.1.3. FTIR Analysis of Original Bio-Oils and Raffinate Streams
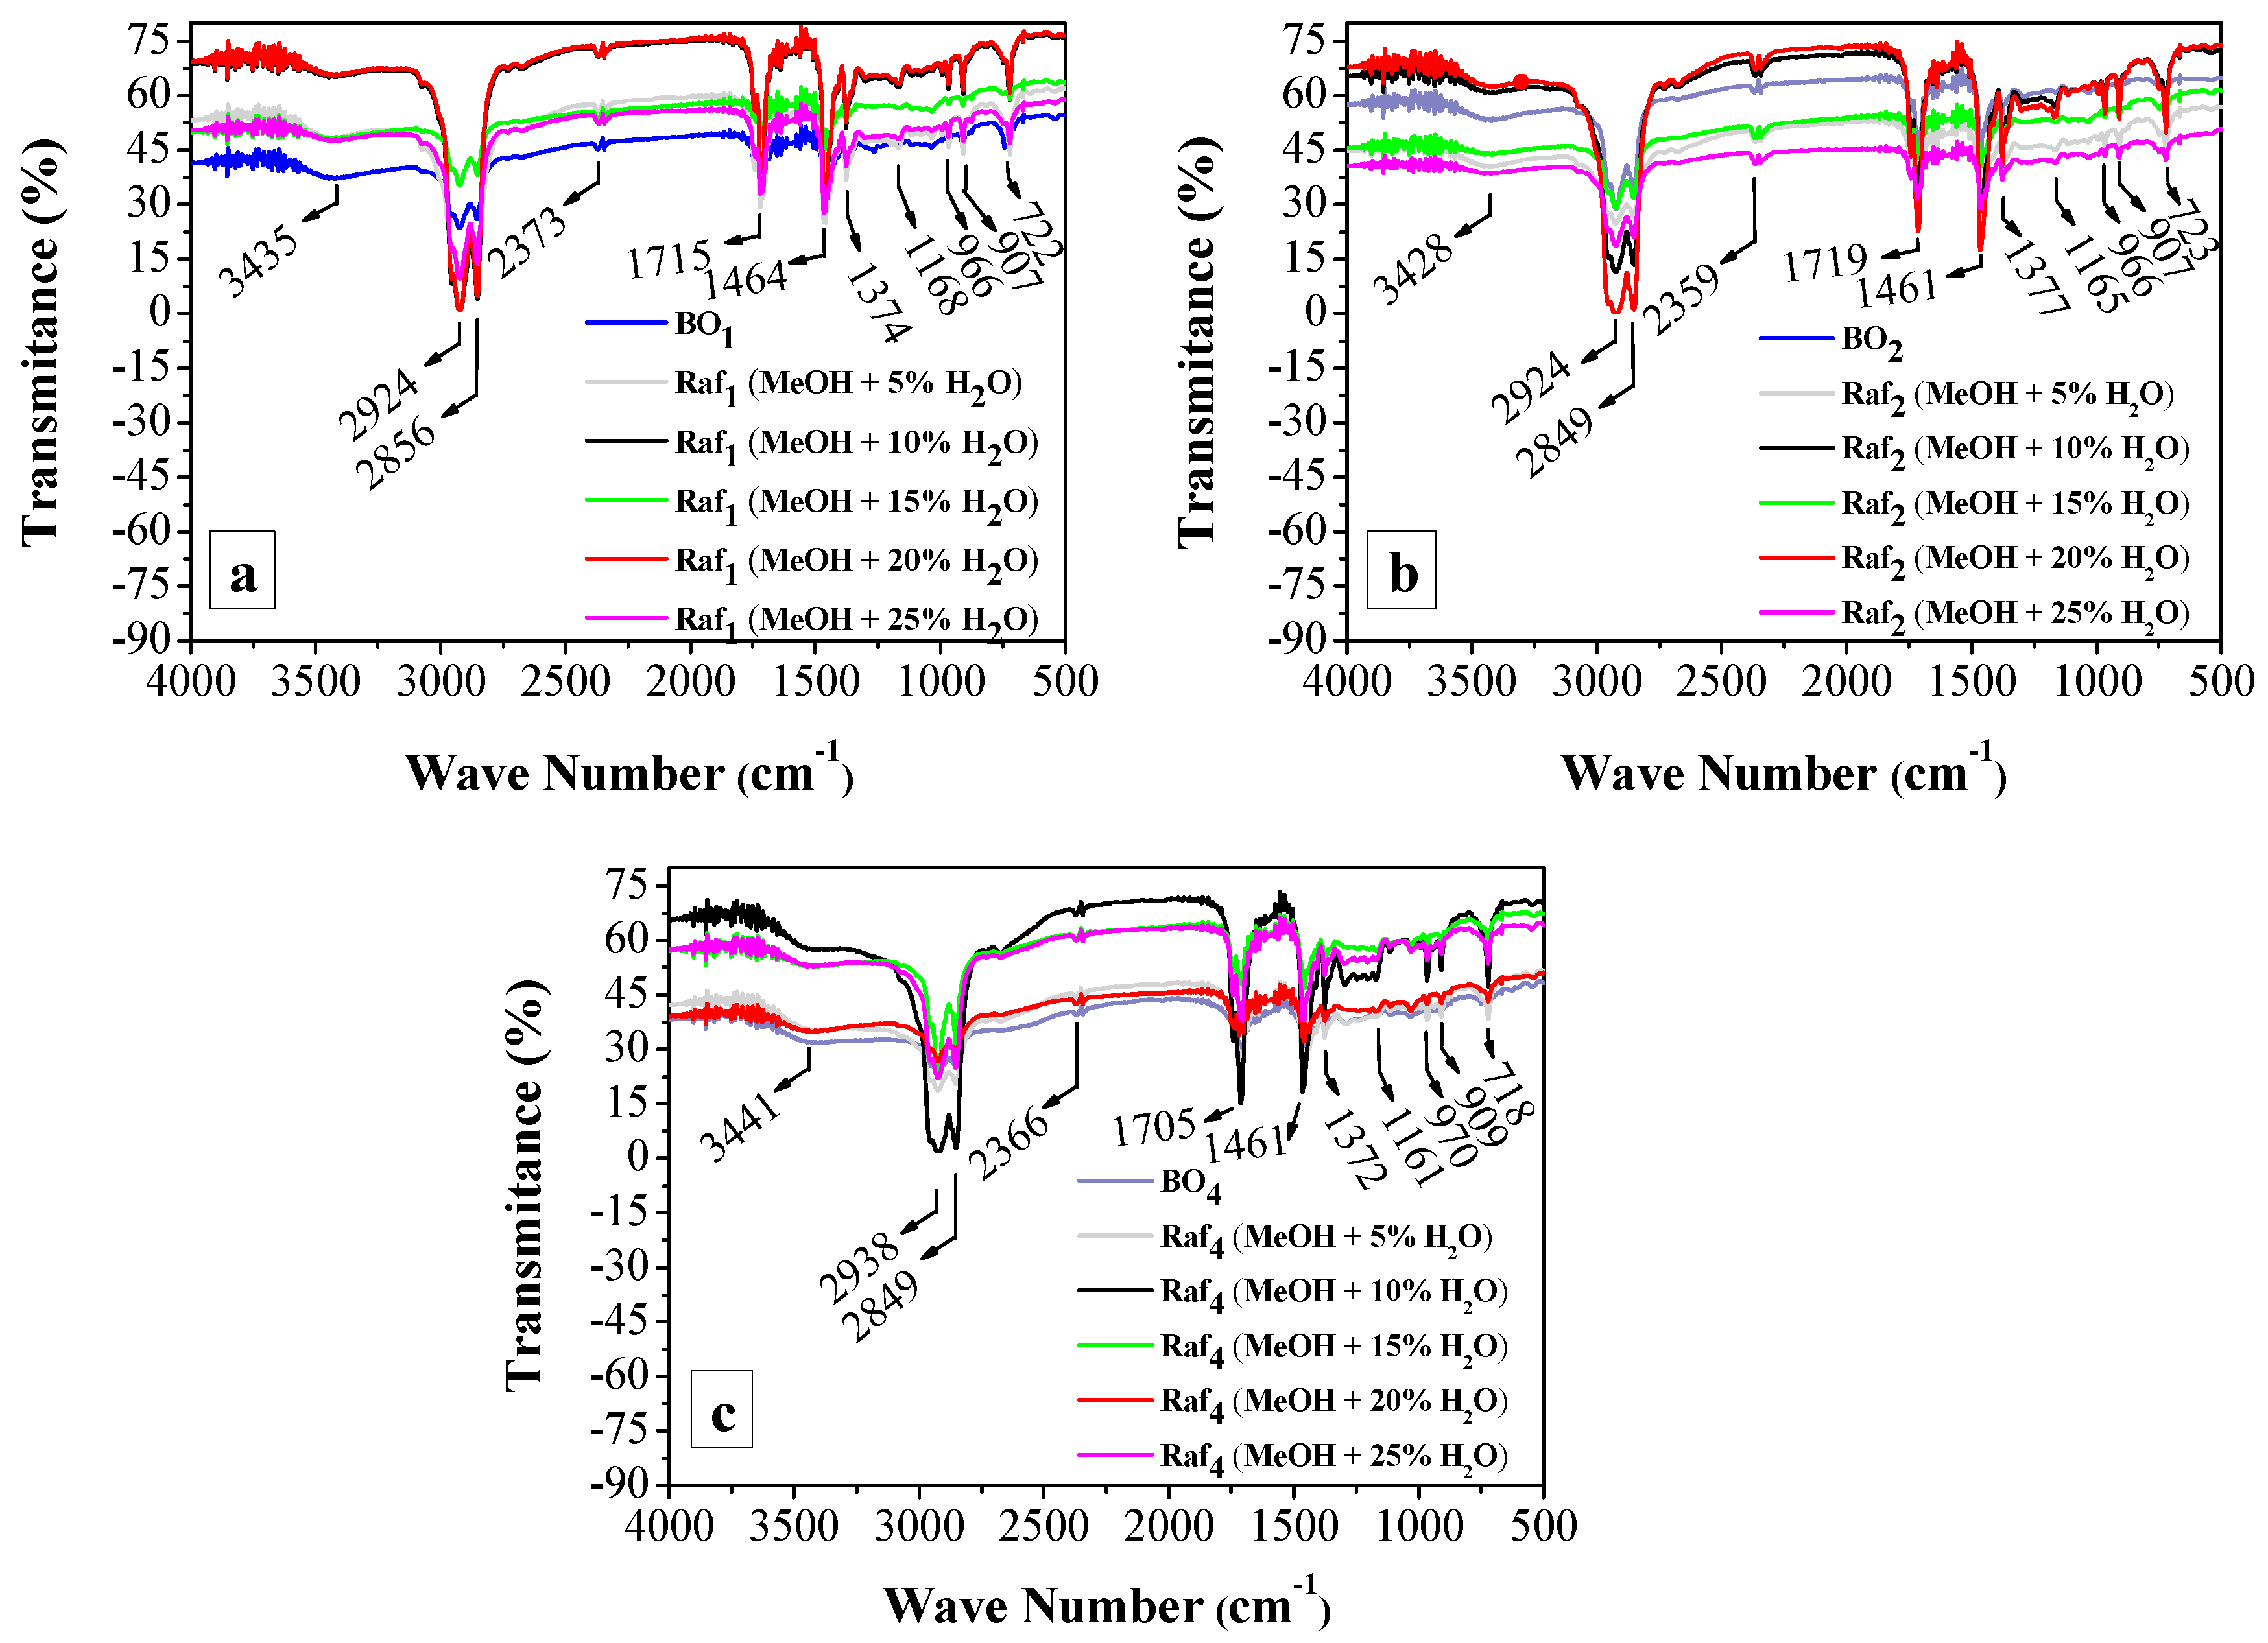
From Figure 5, it was observed that the FTIR spectra of BO1, BO2 and BO4 and their respective raffinate streams indicate the presence of bands between 3000 and 2840 cm−1, which correspond to alkanes-type hydrocarbons that, associated with the presence of absorption bands close to 1375 cm−1, a band related to the deformation vibration of the methyl groups (CH3) [45,67,68], confirm the presence of the saturated alkanes in the original bio-oils and their raffinate streams. In addition, it is possible to infer that these saturated alkanes are long-chain due to absorption bands at about 720 cm−1, associated with four or more CH2 groups in an open chain, according to the specific literature [67,68]. The presence of absorption bands in 1715, 1719 and 1705 cm−1 was also verified [67,68], as illustrated by Figure 5, respectively. According to Mota et al. [45], Pavia et al. [67] and Silverstein et al. [68], these bands correspond to the carbonyl group, which, associated with the wide absorption band of 3151–2650 cm−1, indicate the presence of carboxylic acids in the original bio-oils and their raffinate streams after the LLE process. Therefore, the analysis of Figure 5 shows that the FTIR spectrum of BO1, BO2 and BO4 and their respective raffinate streams are very similar, indicating the presence of the same functional groups.
The results of the FTIR analysis for the extract streams are available in Figures S1–S3 of the Supplementary Materials.
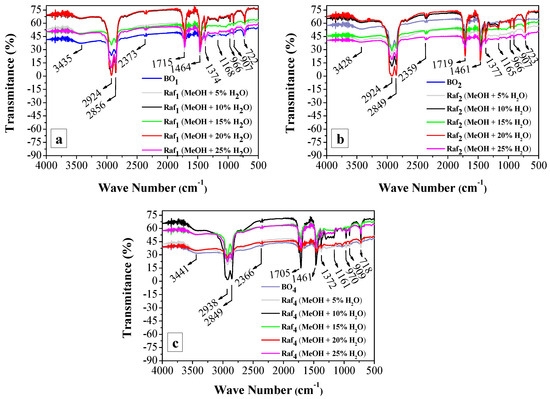
Figure 5.
FTIR spectrum of the raffinate streams from the deacidification of BO using different water contents in the methanol: (a) BO1, (b) BO2, and (c) BO4.
Figure 5.
FTIR spectrum of the raffinate streams from the deacidification of BO using different water contents in the methanol: (a) BO1, (b) BO2, and (c) BO4.
3.2. Deacidification of BOs by LLE (Experiment Group II)
3.2.1. Effect of BO Deacidification on the Quality of Raffinates
In order to evaluate the effect of BO3 deacidification by LLE using aqueous methanol as extraction solvent on the quality of raffinate streams (deacidified BO3), the effect of water content in methanol, the carboxylic acid content in feed (BO3) and, mainly, temperature (25 and 35 °C) on the specific gravity at 20 °C, kinematic viscosity at 40 °C, saponification value, ester value, refractive index and corrosiveness to copper was investigated. The results of this sequence of experiments are presented in Figure 6. Results for corrosiveness to copper using different water contents in methanol at 25 °C and 35 °C are available in Table S3 of the Supplementary Materials.
According to Figure 6, a behavior similar to that observed for Experiment Group I was observed, in which there is a significant effect of BO3 deacidification by LLE using aqueous methanol on the quality of the deacidified bio-oil. Therefore, Figure 6 shows that the water content present in the methanol, the content of carboxylic acids present in the original bio-oil and the operating temperature of the LLE significantly modify most of the physical–chemical properties, indicating that the LLE process changed the chemical composition of the bio-oils. As reported in Section 3.1.1, this result was expected, as the main objective of this study is to remove carboxylic acids (FFA). According to Santos et al. [58] and Buzetzki et al. [59], the physical–chemical properties of bio-oils are profoundly dependent on their composition, justifying the results obtained in the present study.
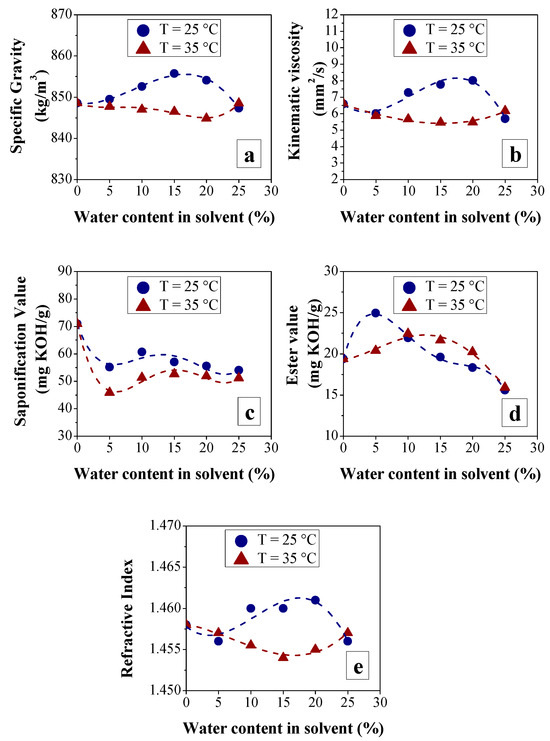
Figure 6.
Physical–chemical properties values of the raffinate streams (deacidified BO3) for different water contents in methanol at 25 °C and 35 °C: (a) Specific gravity; (b) Kinematic viscosity; (c) Saponification value; (d) Ester value; and (e) Refractive index.
Figure 6.
Physical–chemical properties values of the raffinate streams (deacidified BO3) for different water contents in methanol at 25 °C and 35 °C: (a) Specific gravity; (b) Kinematic viscosity; (c) Saponification value; (d) Ester value; and (e) Refractive index.
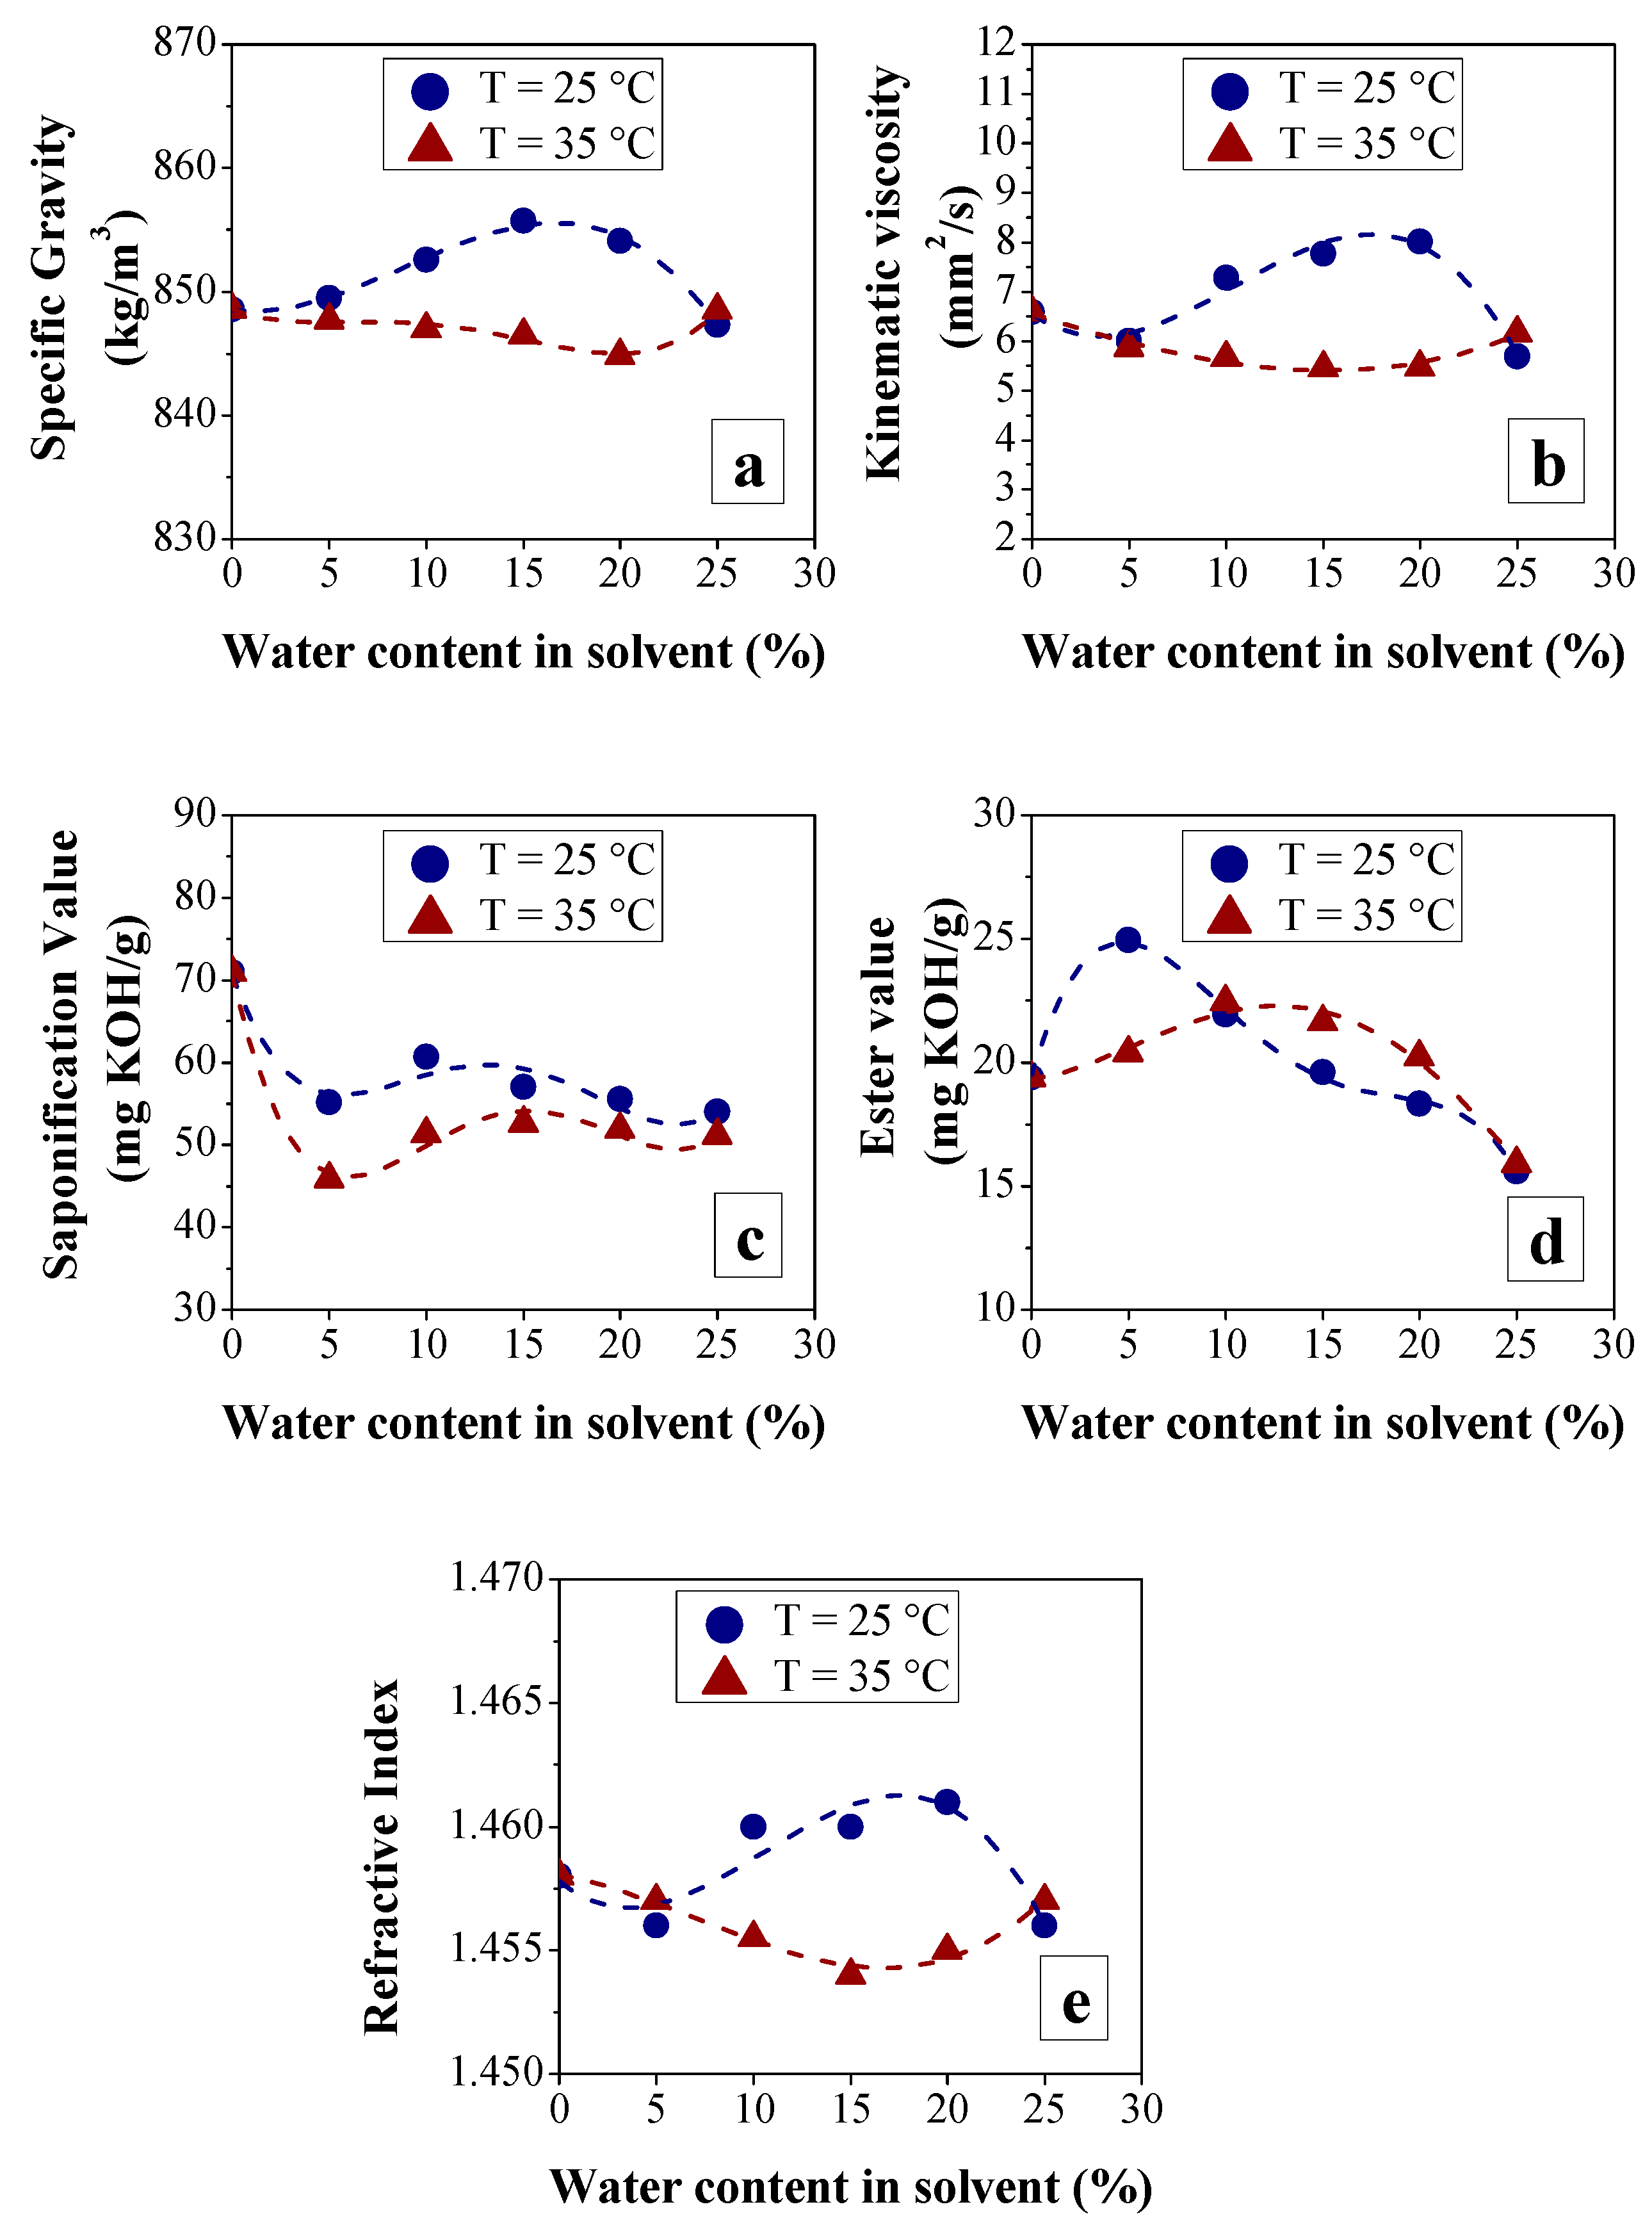
Another point that should be highlighted is that the results shown in Figure 6 show that there is a non-linear trend, either of decrease or increase, of the physical–chemical properties of the deacidified bio-oils as there is an increase in the water content in the methanol for both operating temperatures. This result is because of deacidification, particularly the solubility of the solvent used, on the levels of hydrocarbons (reduction or increase in light or heavy fractions) and oxygenated compounds, which can be confirmed by GC-MS analysis (Section 2.3.2). Figure 6a also shows a significant increase in the specific gravity values of the raffinate streams when LLE is performed at 25 °C and with methanol containing 10%, 15% and 20% water. This behavior is repeated for kinematic viscosity and refractive index. Therefore, there was a similarity regarding the behavior of the results obtained for the properties of specific gravity, kinematic viscosity and refractive index, as illustrated in Figure 6a,b,e, indicating that there is a direct correlation between these properties, as reported by Santos et al. [58].
Figure 6c shows that an increase in the extraction temperature causes a reduction in the values of the BO saponification value. This result is consistent with the literature because, according to Haas [60] and Gunstone [61], the lower the saponification value, the longer the carboxylic acid chain. In this study, it was found that the carboxylic acids (palmitic acid and oleic acid) that have a relatively long chain are the acids that are extracted from BO3 (see Section 3.2.3.), mainly at 35 °C, resulting in lower levels of this chemical group when compared to those obtained at 25 °C. Therefore, this fact results in a reduction in the saponification values when there is an increase in the extraction temperature.
Figure 6d shows that adding water to methanol and the extraction temperature change the ester values. In addition, it was found that the ester value when 5% of water was added to methanol was higher than that obtained for the original bio-oil. This result is due to converting a portion of carboxylic acids into methyl esters, mainly when 5% water is used in the solvent; the highest deacidification efficiency is obtained under the conditions used in the present study. Then, it was found that there is a tendency of the ester values to reduce from 10% of water and 15% of water to the extraction temperatures of 25 °C and 35 °C, respectively, due to the reduction of the solubility of the binary solvent before the esters, as there is an increase in water to the solvent, as shown in Section 3.2.3.
3.2.2. Efficiency of LLE Deacidification
Effect of Temperature on Deacidification
According to Figure 7a, an increase in temperature from 25 °C to 35 °C promoted a significant reduction in the acid values of BO3, indicated by the reduction in its TAN values after LLE. While the TAN values of deacidified BOs ranged from 30.16 to 38.44 mg KOH/g when deacidification occurred at 25 °C, those values ranged from 25.46 to 35.21 mg KOH/g when deacidification occurred at 35 °C. Consequently, for any water content used in the present study, increasing the temperature from 25 °C to 35 °C promoted an increase in the efficiency of BO deacidification by LLE, reaching a maximum value of 50.61% with the addition of 5% water to methanol at 35 °C, as shown in Figure 7b. These results indicate that the temperature increase promoted the solubility of free fatty acids in aqueous methanol. Therefore, among the two temperatures investigated, 35 °C is the best condition to promote the most significant removal of FFA when aqueous methanol is applied as an extraction solvent.
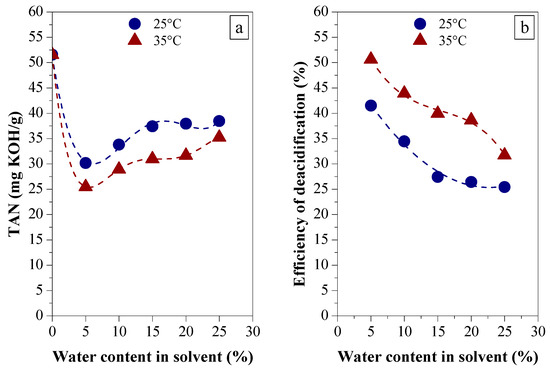
Figure 7.
The effect of methanol’s water content at different temperatures on the efficiency of deacidification of the BO3 by LLE: (a) TAN values at 25 °C and 35 °C; and (b) Percentage of carboxylic acids removed at 25 °C and 35 °C.
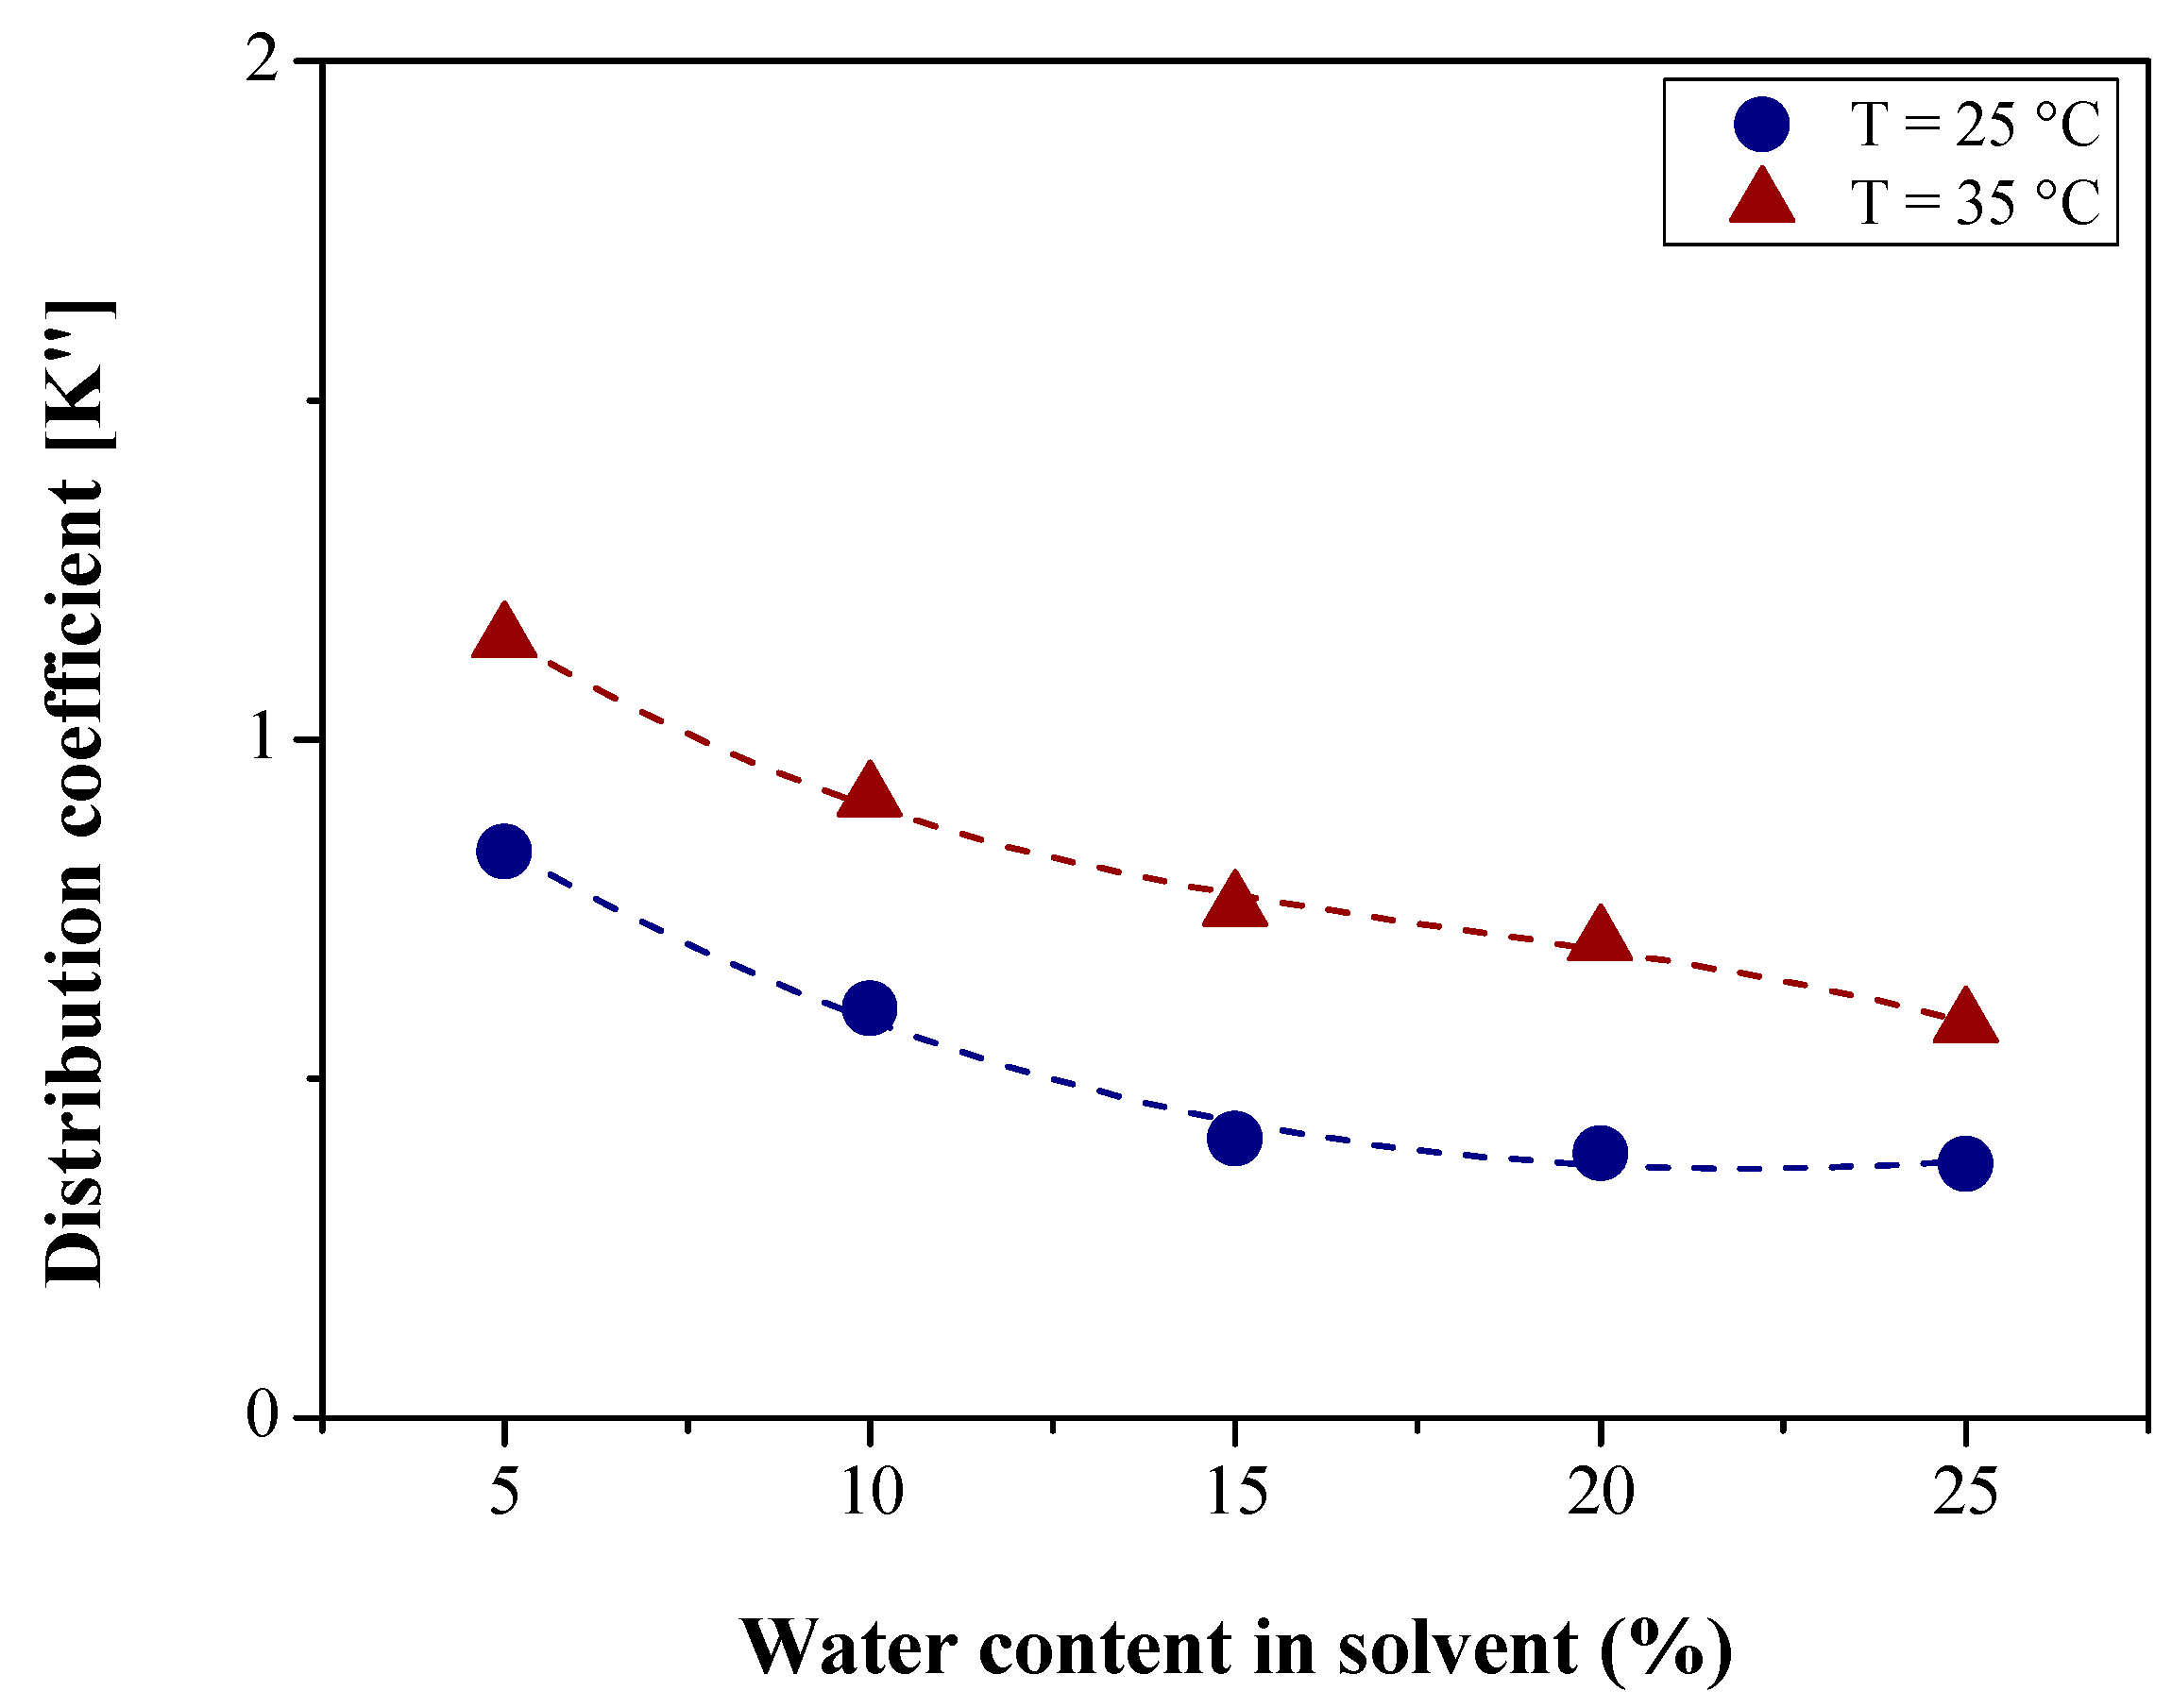
Figure 8 shows that the distribution coefficient values decrease as the water content increases in the solvent. However, its value increases when there is an increase in the extraction temperature from 25 to 35 °C for any of the five water contents used in this study. In addition, it is possible to observe that the distribution coefficient values for all the water contents reported in Figure 8 are relatively low. According to Green et al. [26], distribution coefficients equal to or greater than ten are desired for an economical process, as they allow operation with minimal amounts of solvent and the production of higher solute concentrations in the extract. Ren et al. [69] studied the separation of chemical groups of the aqueous extract of the bio-oil using sequential extractions with four organic solvents (hexane, petroleum ether, chloroform and ethyl acetate) with different polarities. The results of this study show that ethyl acetate showed a high efficiency of organic acid extraction. The maximum efficiency (55%) was achieved by using a solvent/feed ratio of 2:1, resulting in a distribution coefficient for the acids equivalent to 0.67. Therefore, considering that in the present study, a simple extraction was performed using a solvent/feed ratio of 1/1, aqueous methanol is an excellent solvent to altogether remove the carboxylic acids present in the bio-oil, as it promotes a deacidification process with relatively high efficiency (50.61% at 35 °C) and distribution coefficient (K″ = 1.15 at 35 °C) when compared to those values available in the literature. Considering deacidification by LLE at room temperature of a bio-oil with a TAN value lower than BO3 (TAN = 51.60 mg KOH/g), as is the case of BO1 (TAN = 24.38 mg KOH/g), the potential of aqueous methanol as an extractor solvent increases considerably, since the deacidification efficiency and distribution coefficient reach 72%, 65% and 2.45%, respectively, as shown in Figure 3 and Figure 4.
The mass balance performed to obtain the results in Figure 8 is in Table S4 of the Supplementary Materials.
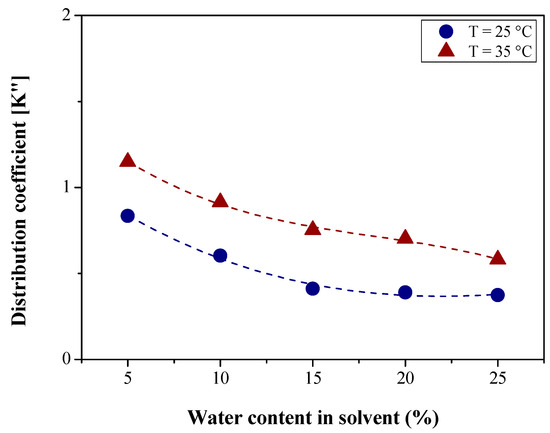
Figure 8.
The effect of methanol’s water content at different temperatures on the distribution coefficient.
Figure 8.
The effect of methanol’s water content at different temperatures on the distribution coefficient.
3.2.3. Chemical Composition
In the Supplementary Materials, Figures S4–S7 present the chromatograms and Tables S5–S25 present the retention times, relative contents and identification (Molecular Formula and Compound Name) of the prominent peaks obtained by GC-MS analysis of BO3, which was taken as feed, and from the streams of raffinate and extract obtained after deacidification by LLE of BO3 at 25 °C and 35 °C, using methanol with different water contents as solvent.
The results in Figures S4–S7 and Tables S5–S25 of the Supplementary Materials show that 30 to 70 components with a high similarity index were detected in BO3 and the extract and raffinate streams. These components were classified into two major groups: hydrocarbons (normal paraffinic, branched paraffinic, olefinic, naphthenic and aromatic) and oxygenated compounds (carboxylic acids, alcohols, aldehydes, ketones, esters and others). Therefore, the results presented in Figure 9, Figure 10, Figure 11 and Figure 12 represent the sum of the areas of GC-MS peaks of the total number of compounds of various chemical classes detected in the respective BO3 and extract and raffinate streams from the LLE. The values are presented as percentages and show the relative content of aqueous methanol with these classes.
Based on the analysis of Figure 9a,b, it was found that BO3 consists of 50.55% hydrocarbons and 49.45% oxygenated compounds. In the hydrocarbon group, it was possible to identify three distinct classes: normal paraffinic (19.15%), olefinic (25.58%) and naphthenic (5.82%), as shown in Table S5 and Figure 10a,b. The oxygenated compounds consisted of carboxylic acids (42.35%), alcohols (2.21%), ketones (3.73%) and esters (1.16%). The analysis of the chromatograms referring to the five raffinate streams obtained after the LLE of BO3 showed the presence of the same substances, although with different contents concerning hydrocarbons and oxygenated compounds. The levels of oxygenated compounds of all raffinate streams, obtained from the LLE process at 25 °C and 35 °C, are lower than the content of oxygenated compounds of BO3, indicating that the aqueous methanol can remove the oxygenated compounds present in the original bio-oil, reflecting in the reduction of TAN and, consequently, in the efficiency of deacidification, as noted in the section titled Effect of Temperature on Deacidification.
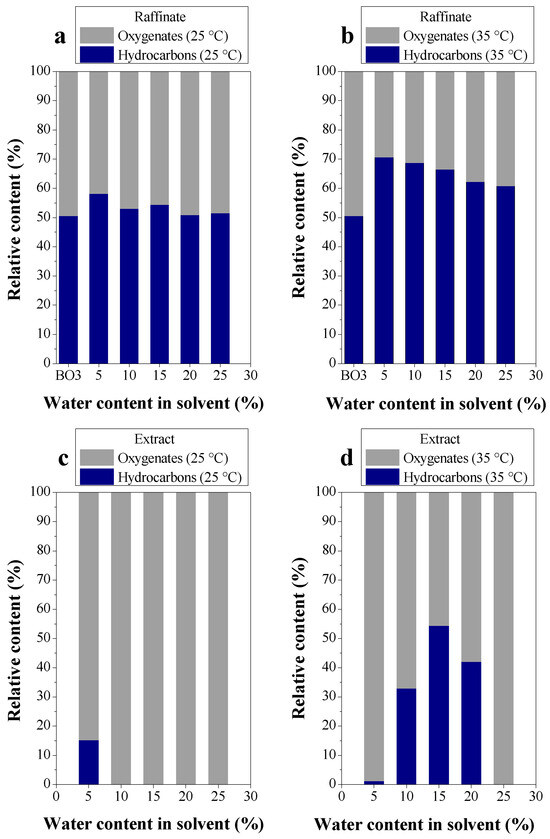
Figure 9.
The effect of methanol’s water content and temperature on the distribution of hydrocarbons and oxygenated compounds in raffinate streams (deacidified BO3) and extract streams: (a) raffinate streams at 25 °C; (b) raffinate streams at 35 °C; (c) extract streams at 25 °C; and (d) extract streams at 35 °C.

Therefore, it was confirmed that deacidification by LLE with aqueous methanol, in addition to extracting oxygenated compounds, especially carboxylic acids, also promotes an increase in the concentration of hydrocarbons, mainly when extraction occurs at 35 °C, as shown in Figure 9b. Thus, some water contents had a relatively small loss of hydrocarbons (basically normal paraffin) to the extract streams. In other water contents, the absence of hydrocarbons was verified, indicating no losses to the extract stream, as illustrated in Figure 9c,d and Figure 10c,d. The absence or low content of hydrocarbons in the extract indicates its slight solubility in aqueous methanol, probably due to hydrophobic interactions, especially at low temperatures. Kanaujia et al. [31] describe similar behavior when reporting a low concentration of hydrocarbons in the aqueous phase compared to the content of hydrocarbons found in the organic phase (bio-oil).
Figure 9a,b also show that the water content hurt the deacidification process by LLE with aqueous methanol because while the hydrocarbon content decreases as there is an increase in the water content, the content of oxygenated compounds increases, confirming the findings made about the efficiency of deacidification from the results of TAN values presented in the previous sections. According to Kanaujia et al. [31], most of the solvent–analyte interactions in LLE are based mainly on polar–polar and hydrophobic interactions, which justifies the results obtained in the present study, as there is an increase in water content.
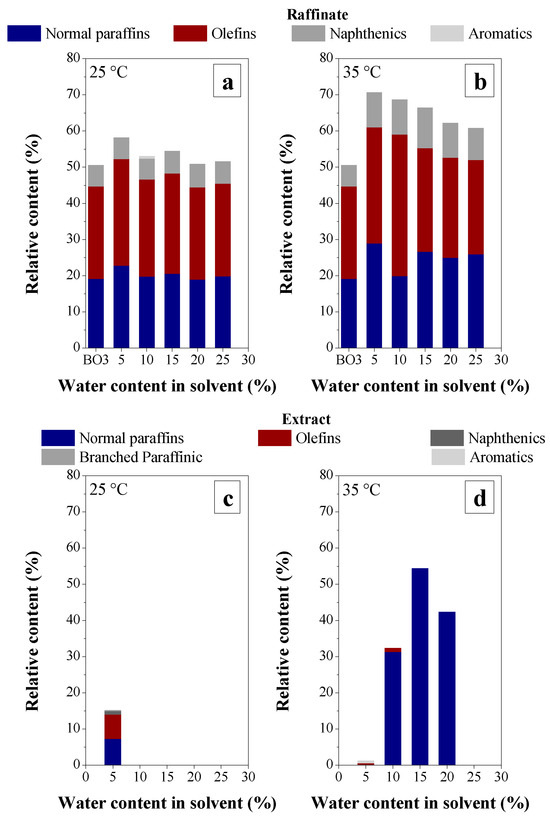
Figure 10.
The effect of methanol’s water content and temperature on the distribution of hydrocarbon classes in raffinate streams (deacidified BO3) and extract streams: (a) raffinate streams at 25 °C; (b) raffinate streams at 35 °C; (c) extract streams at 25 °C; and (d) extract streams at 35 °C.
Figure 10.
The effect of methanol’s water content and temperature on the distribution of hydrocarbon classes in raffinate streams (deacidified BO3) and extract streams: (a) raffinate streams at 25 °C; (b) raffinate streams at 35 °C; (c) extract streams at 25 °C; and (d) extract streams at 35 °C.
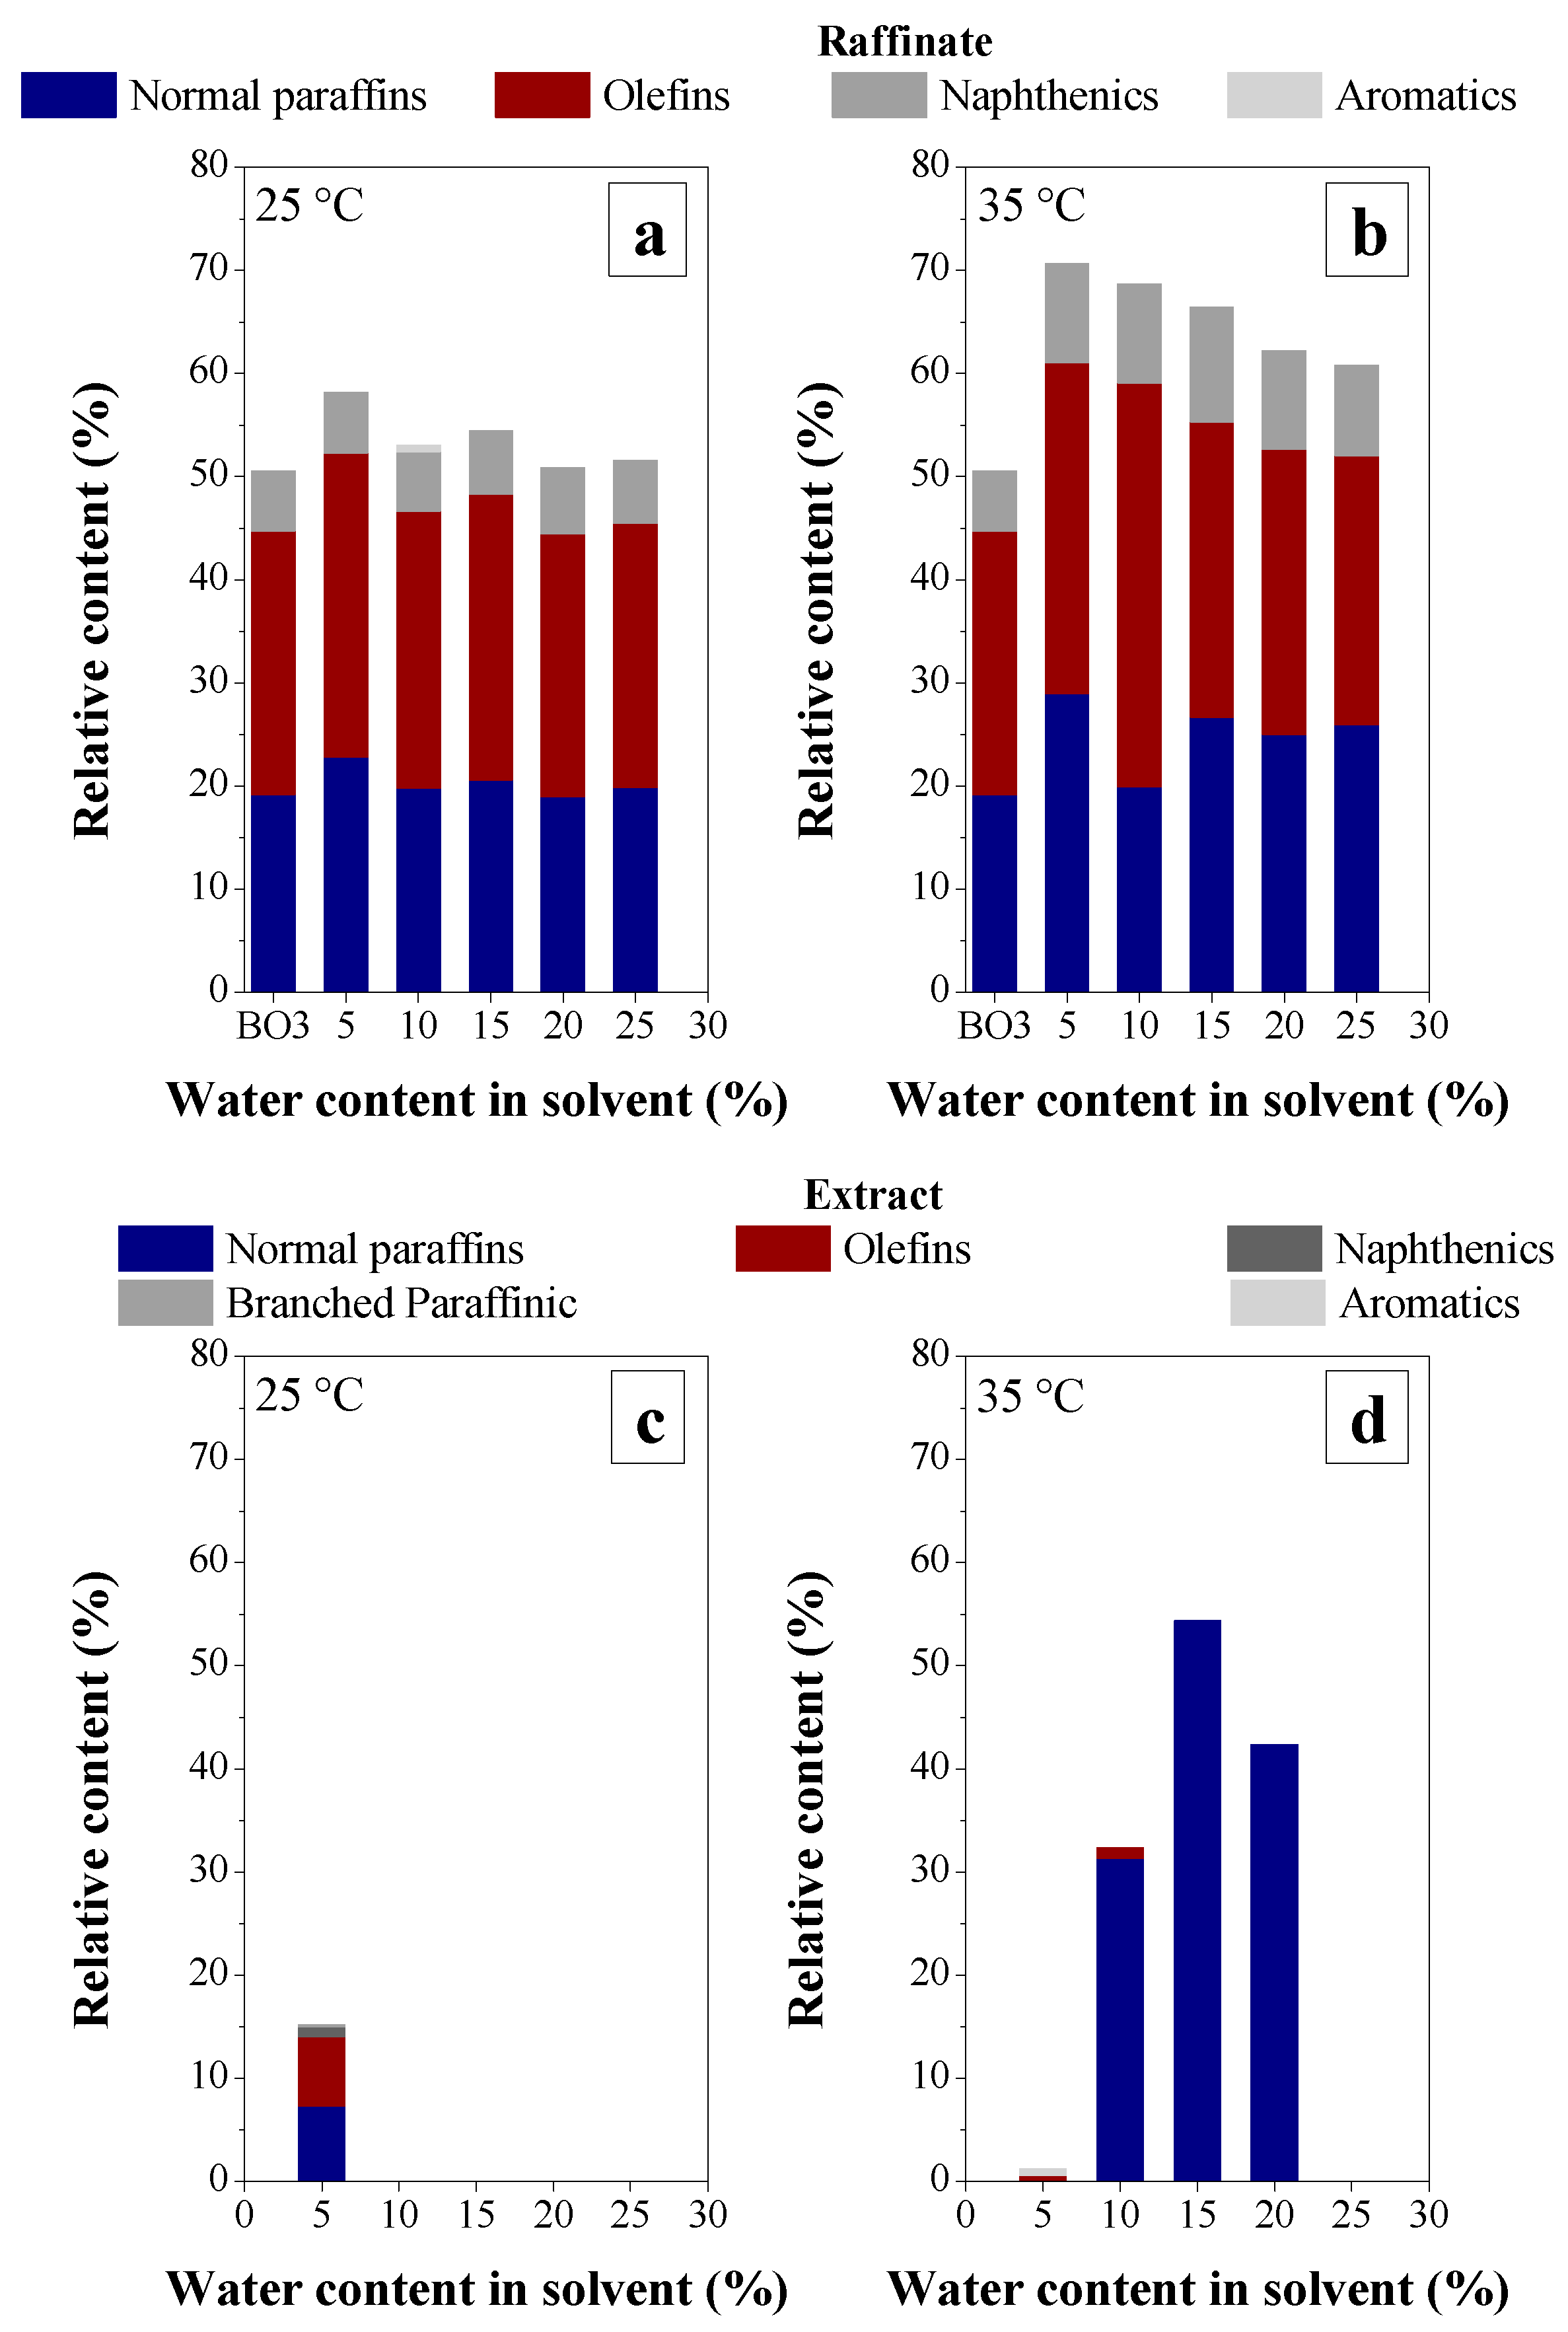
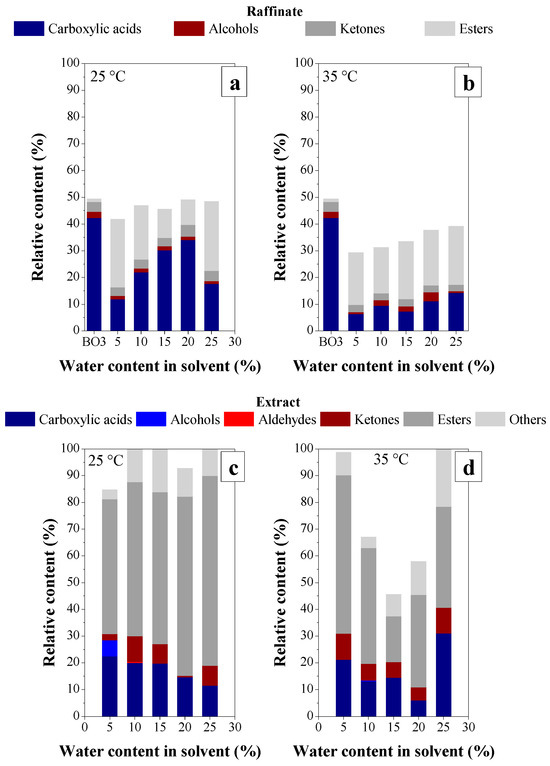
Figure 11.
The effect of methanol’s water content and temperature on the distribution of classes of oxygenated compounds in raffinate streams (deacidified BO3) and extract streams: (a) raffinate streams at 25 °C; (b) raffinate streams at 35 °C; (c) extract streams at 25 °C; and (d) extract streams at 35 °C.

In this context, the results presented in Figure 9 and Figure 10 demonstrate that an increase in the temperature of the extraction process allows a more significant removal of oxygenated compounds compared to the results obtained for the same water content. This result makes it clear that water content is detrimental, while the temperature favors reducing the oxygenated compound content.
In order to evaluate the effect of the water content on the distribution of the classes of oxygenated compounds in the raffinate streams, the graphs presented in Figure 11a,b were plotted, which show that as the water content increases, there is a tendency to increase in the concentration of carboxylic acids from 11.91% to 34.04% at 25 °C and from 6.33% to 14.24% at 35 °C. Therefore, although the contents of oxygenated compounds as a whole and, specifically, of carboxylic acids, are lower than those of BO3 for all water contents and for both extraction temperatures, it was observed that an increase in the water content causes a reduction in the ability of the solvent to extract carboxylic acids. Furthermore, it was possible to observe that the concentration of oxygenated compounds such as alcohols and ketones changes very little with increasing water content. This result indicates that the solvent has better selectivity for the compounds of interest (carboxylic acids) in the present work. Oliveira et al. [65] investigated the liquid–liquid equilibrium of systems composed of rice bran oil, free fatty acids, ethanol and water at temperatures ranging from 10 to 60 °C. The study conducted by Oliveira et al. [65] indicated that the mutual solubility of compounds, including carboxylic acids (FFA), decreased with an increase in the solvent’s water content and a decrease in the extraction temperature. Therefore, the results obtained in the present study are consistent with those reported in the literature.
Figure 11a,b also show that the ester content in the raffinate streams is higher than that found in BO3 for all water contents and both extraction temperatures, varying from 9.39% to 25.89% at 25 °C and from 17.18% to 21.79% at 35 °C. Such results indicate that part of the carboxylic acids present in the original bio-oil was esterified when subjected to deacidification by LLE. This fact, in principle, is not a problem, since it can be seen from Figure 11c,d that esters are the class of oxygenated compounds that are in the highest concentration in the extract streams, followed by carboxylic acids, indicating that they are extracted by aqueous methanol, however, not in its entirety. This result suggests that more than one extraction step is required to remove oxygenated compounds, especially carboxylic acids and esters formed during deacidification.
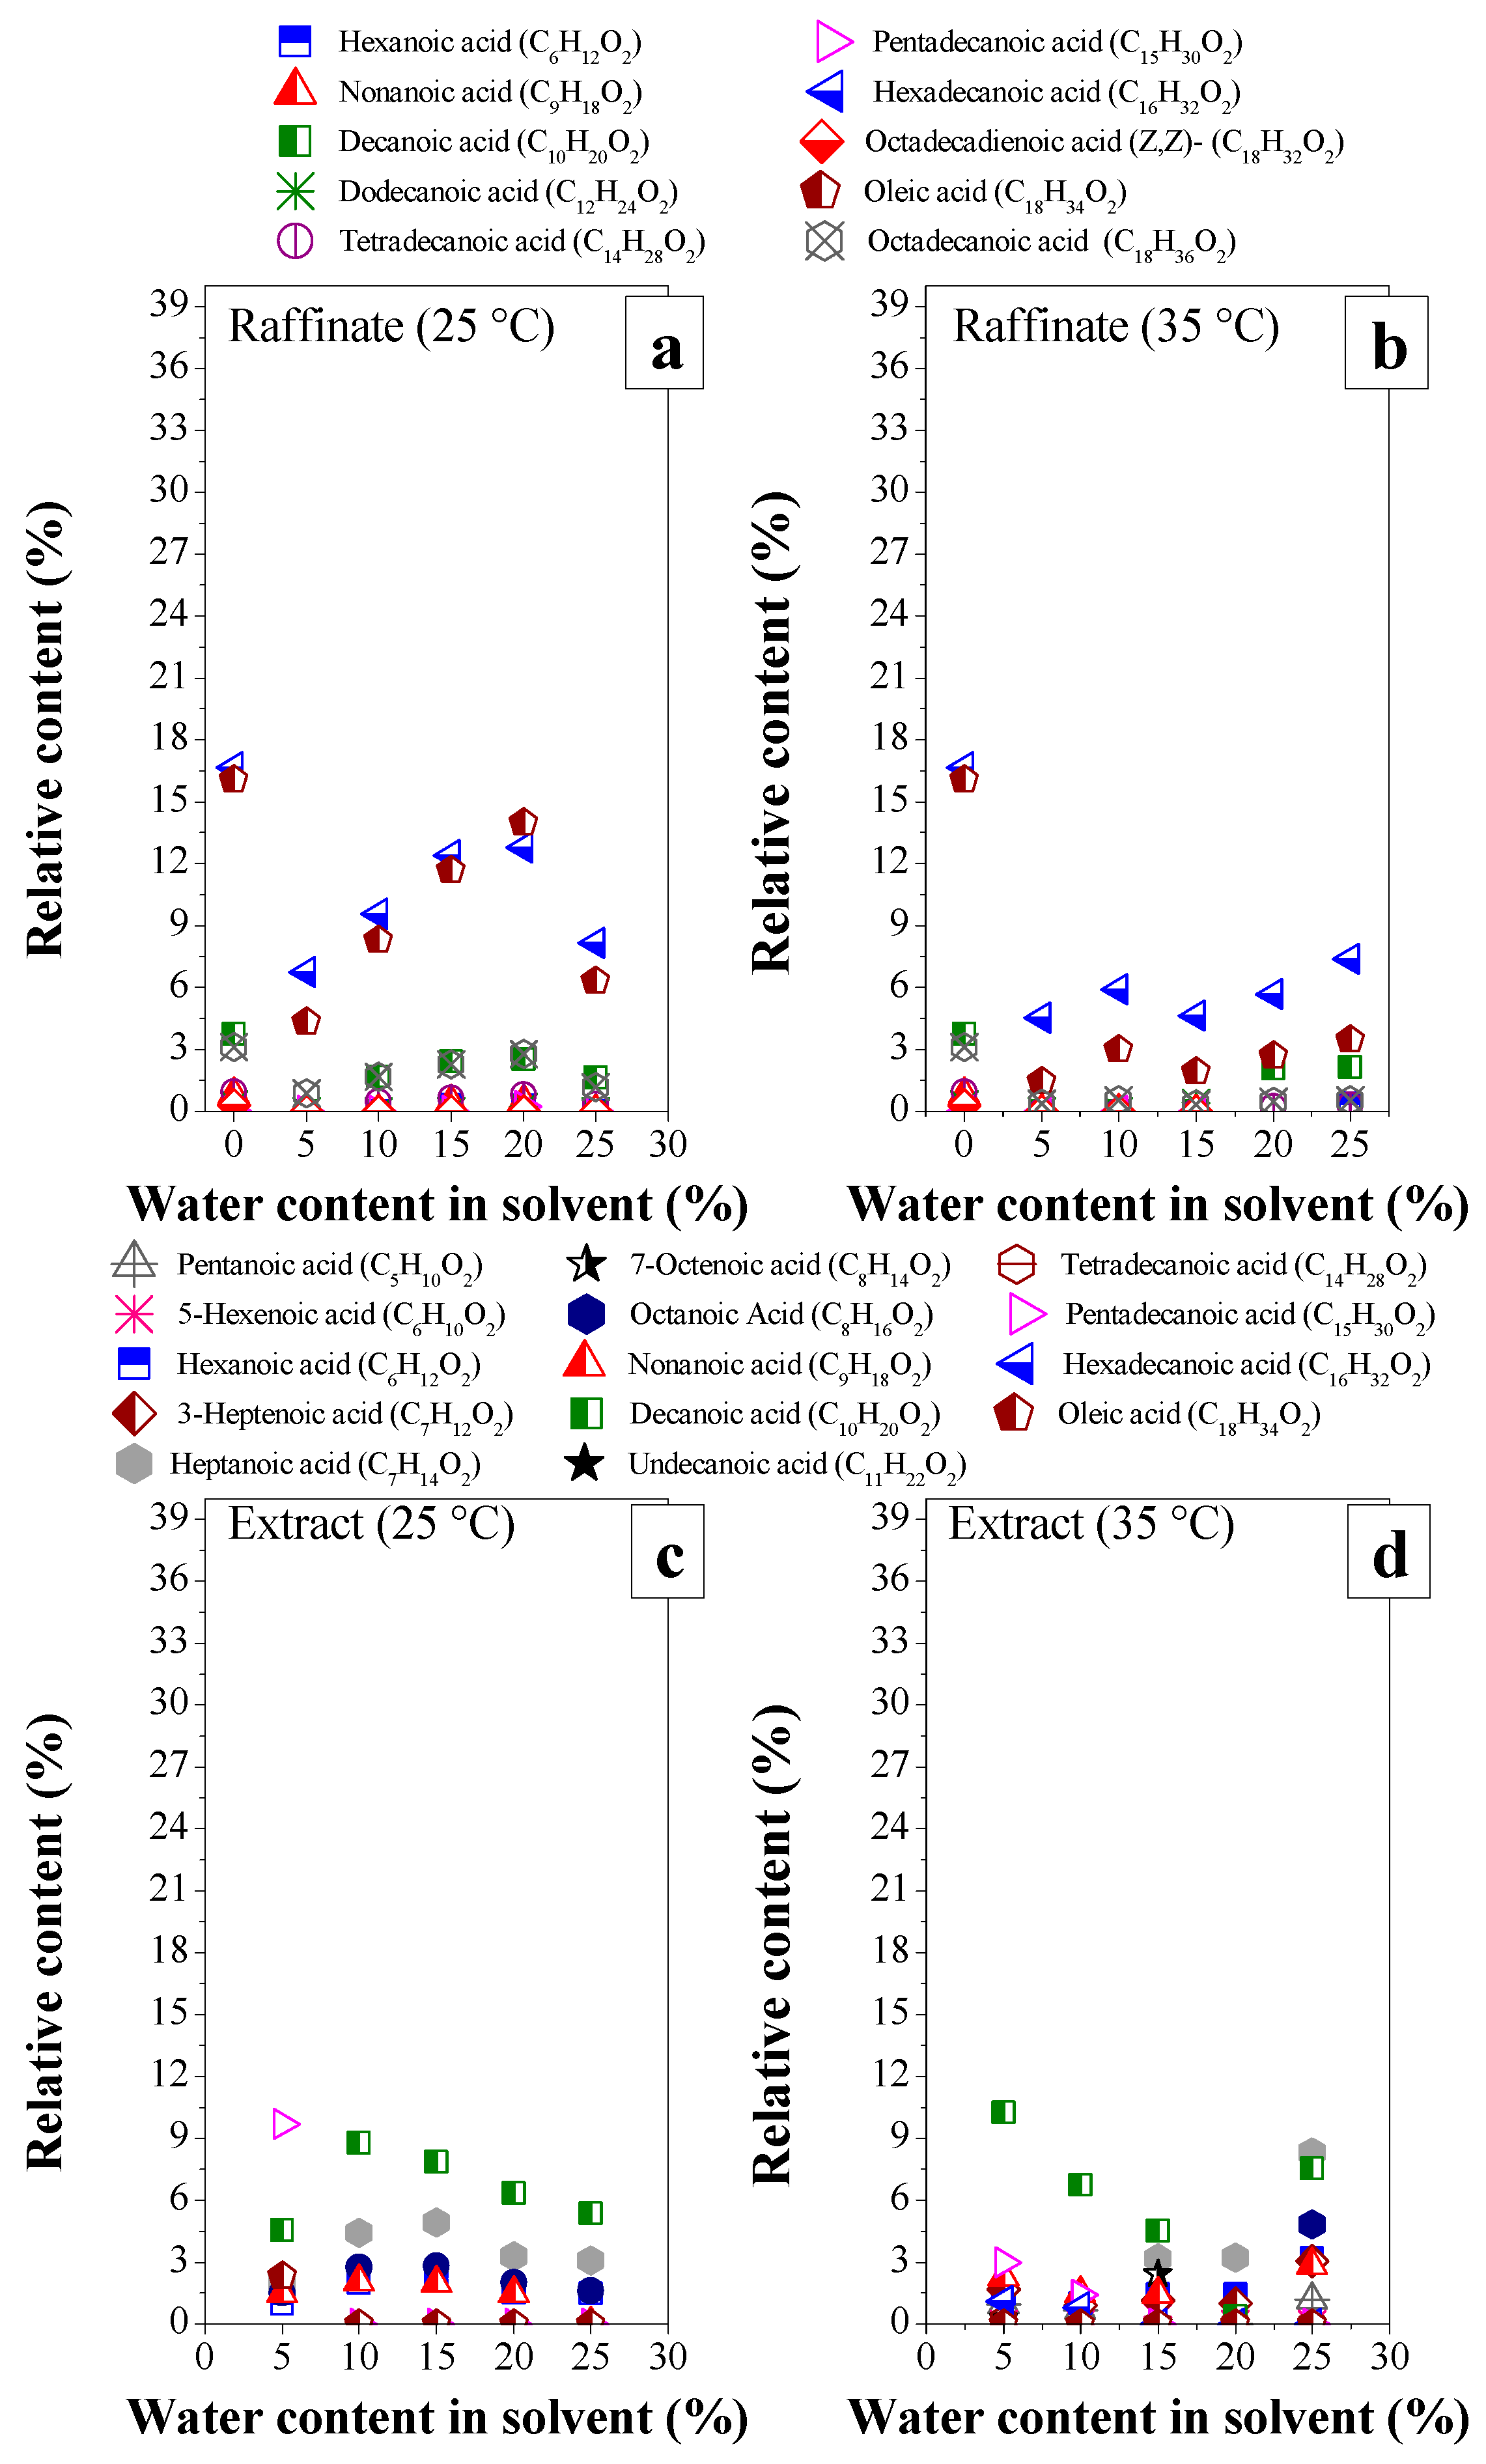
Carboxylic acids and esters are the two main chemical groups extracted from BO3 by aqueous methanol. Palmitic acid, oleic acid and decanoic acid were detected in higher relative content, totaling 8–24% and 5–13% when extraction is performed at 25 °C and 35 °C, respectively, as shown in Figure 12a,b. In addition, the analysis of Figure 12a,b also indicates that carboxylic acids such as hexadecanoic acid (palmitic acid), oleic acid and decanoic acid are the ones that are in higher concentration in BO3 and that, after the LLE process, these acids are the ones that are extracted due to a significant reduction in their contents, mainly when methanol is used with 5% water, promoting the reduction of TAN values for the raffinate streams, as observed in the section titled Effect of Temperature on Deacidification. Figure 12a,b also show that the water content and extraction temperature have a significant effect on the contents of hexadecanoic acid (palmitic acid), oleic acid and decanoic acid in such a way that there was little change in the levels of the other FFAs present in the original bio-oil, remaining practically constant.
It was expected that hexadecanoic acid, oleic acid and decanoic acid would present relatively high levels in the extract streams compared to the other FFAs. However, this result was obtained only for decanoic acid, which varied from 4.57% to 8.79% at 25 °C and from 0.37% to 10.27% at 35 °C, as illustrated in Figure 12c,d. The explanation for this result is that most of the hexadecanoic acid and oleic acid are esterified during the LLE process, being removed in the form of esters such as hexadecanoic acid, methyl ester and 9-octadecenoic acid (Z) and methyl ester, respectively. This result can be seen in Tables S11–S15 and S21–S25 of the Supplementary Materials, confirming what was previously reported regarding converting a large part of the carboxylic acids into fatty acid methyl esters during the deacidification process by LLE. According to Lee et al. [70], adding methanol increases the selectivity of esters because the acidic compounds in the bio-oil, such as carboxylic acids, can engage in an esterification reaction with methanol. Therefore, the results obtained are consistent with the literature.
Bio-oil produced from the thermochemical route of triglyceride-based biomass is increasingly recognized as a potentially abundant source of renewable fuels and chemicals. Carboxylic acids, mainly free fatty acids, are significant constituent groups in bio-oil and end products or intermediate substances. Therefore, upgrading bio-oil through deacidification by LLE is a relatively new proposition that can be employed to provide renewable chemistries.
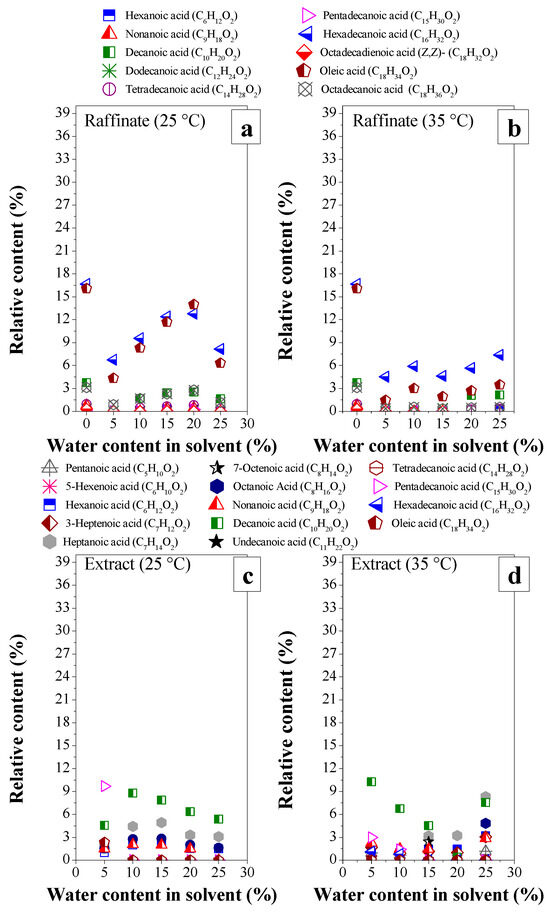
Figure 12.
The effect of methanol’s water content and temperature on the distribution of carboxylic acids (free fatty acids) present in raffinate streams (deacidified BO3) and extract streams: (a) raffinate streams at 25 °C; (b) raffinate streams at 35 °C; (c) extract streams at 25 °C; and (d) extract streams at 35 °C.
4. Conclusions
This study investigated upgrading bio-oils by removing carboxylic acids (deacidification) and applying LLE as a separation process. For this purpose, the effect of process parameters such as water content (5–25%) in the solvent (aqueous methanol), carboxylic acid content (24.38 mg KOH/g; 33.21 mg KOH/g; 51.56 mg KOH/g; 73.77 mg KOH/g), in this case, free fatty acids, in the BO and extraction temperature (25 and 35 °C) on the deacidification process was evaluated through the efficiency of the ELL and the distribution coefficient, as well as the effect of the same parameters on the quality of the deacidified BO through physical–chemical and GC-MS analyses.
Thus, it was concluded that the increase in the water content in the solvent and the increase in the content of carboxylic acids in the BO (up to a certain level) negatively affect the efficiency of the deacidification process by LLE, which reduces the values of the coefficient of distribution. In parallel, the increase in temperature positively affects the efficiency of the deacidification process, increasing the values of the distribution coefficient. Furthermore, the water content in methanol, the carboxylic acid content in BO and the deacidification temperature significantly modify most of the physical–chemical properties (specific gravity, viscosity, corrosiveness to copper, total acid number, saponification value, ester content and refractive index) due to the change in chemical composition (mainly, the removal of oxygenated compounds) of the deacidified BOs.
In more detail, an increase in the water content (5–25%) in the solvent and an increase in the carboxylic acid content (24.38–51.56 mg KOH/g) in the BOs reduce the deacidification efficiency from 72.65 to 35.46% for BO1 and from 67.31 to 44.19% for BO2, as well as reducing the distribution coefficient values from 2.45 to 0.55 for BO1 and 2.28 to 0.81 for BO2. In parallel, an increase in the temperature (25 to 35 °C) of the deacidification process promoted an increase in the deacidification efficiency and distribution coefficient values for all water contents in methanol. Thus, the deacidification efficiency values varied from 41.5% to 25.44% at 25 °C and from 50.61% to 31.72% at 35 °C, while the distribution coefficient values varied from 0. 83 to 0.37 at 25 °C and from 1.15 to 0.58 at 35 °C. On the other hand, for BOs with an acid value greater than 51.56 mg KOH/g, as is the case with BO4 (TAN = 73.77 mg KOH/g), an increase in the water content in the solvent increased the values deacidification efficiency from 38.90 to 53.50% and increased distribution coefficient values from 0.63 to 1.17. Consequently, in this study, the highest deacidification efficiency (72.65%), as well as the highest distribution coefficient (2.45), is achieved with 5% water in methanol at 25 °C for BO1 (TAN = 24.38 mg KOH/g).
Finally, from the GC-MS analysis, it was concluded that deacidification with aqueous methanol was not selective only for carboxylic acids (palmitic acid, oleic acid and decanoic acid, the most representative in terms of quantity in BO3). Such a deacidification process can also promote the deacidification of BO by removing esters since these compounds are also responsible for the acidity of BO. Therefore, the deacidification process by LLE using aqueous methanol as an extractor solvent is shown to be a promising alternative for the removal of carboxylic acids and other oxygenated compounds, contributing significantly to the upgrading or improvement of BOs produced by catalytic thermal cracking of triglycerides.
Supplementary Materials
The following supporting information can be downloaded at: https://www.mdpi.com/article/10.3390/en17112713/s1, Figure S1: FTIR spectrum of extract streams referring to BO1 deacidification using different water contents in methanol; Figure S2: FTIR spectrum of extract streams referring to BO2 deacidification using different water contents in methanol; Figure S3: FTIR spectrum of extract streams referring to BO4 deacidification using different water contents in methanol; Figure S4: Chromatograms of the raffinate streams obtained after liquid-liquid extraction at 25 °C and with different water contents in methanol: ▬▬ BO3; ▬▬ Raffinate 3 (MeOH with 5% water); ▬▬ Raffinate 3 (MeOH with 10% water); ▬▬ Raffinate 3 (MeOH with 15% water); ▬▬ Raffinate 3 (MeOH with 20% water); ▬▬ Raffinate 3 (MeOH with 25% water); Figure S5: Chromatograms of the extract streams obtained after liquid-liquid extraction at 25 °C and with different water contents in methanol: ▬▬ Extract 3 (MeOH with 5% water); ▬▬ Extract 3 (MeOH with 10% water); ▬▬ Extract 3 (MeOH with 15% water); ▬▬ Extract 3 (MeOH with 20% water); ▬▬ Extract 3 (MeOH with 25% water); Figure S6:Chromatograms of the raffinate streams obtained after liquid-liquid extraction at 35 °C and with different water contents in methanol: ▬▬ BO3; ▬▬ Raffinate 3 (MeOH with 5% water); ▬▬ Raffinate 3 (MeOH with 10% water); ▬▬ Raffinate 3 (MeOH with 15% water); ▬▬ Raffinate 3 (MeOH with 20% water); ▬▬ Raffinate 3 (MeOH with 25% water); Figure S7: Chromatograms of the extract streams obtained after liquid-liquid extraction at 35 °C and with different water contents in methanol: ▬▬ Extract 3 (MeOH with 5% water); ▬▬ Extract 3 (MeOH with 10% water); ▬▬ Extract 3 (MeOH with 15% water); ▬▬ Extract 3 (MeOH with 20% water); ▬▬ Extract 3 (MeOH with 25% water); Table S1: Copper corrosivity values of raffinate streams for different water contents in methanol; Table S2: Mass balance and the respective distribution coefficient values for BO1, BO2, and BO4 deacidification using different water contents in methanol; Table S3: Copper corrosivity values of raffinate streams referring to BO3 deacidification using different water contents in methanol at 25 °C and 35 °C; Table S4: Mass balance and the respective distribution coefficient values for BO3 deacidification using different water contents in methanol at 25 °C and 35 °C; Table S5: Retention times, relative contents and identification of the prominent peaks obtained by GC-MS analysis of BO3; Table S6: Retention times, relative contents and identification of the prominent peaks obtained by GC-MS analysis of Raffinate 3 (MeOH with 5% water) obtained at 25 °C; Table S7: Retention times, relative contents and identification of the prominent peaks obtained by GC-MS analysis of Raffinate 3 (MeOH with 10% water) obtained at 25 °C; Table S8: Retention times, relative contents and identification of the prominent peaks obtained by GC-MS analysis of Raffinate 3 (MeOH with 15% water) obtained at 25 °C; Table S9: Retention times, relative contents and identification of the prominent peaks obtained by GC-MS analysis of Raffinate 3 (MeOH with 20% water) obtained at 25 °C; Table S10: Retention times, relative contents and identification of the prominent peaks obtained by GC-MS analysis of Raffinate 3 (MeOH with 25% water) obtained at 25 °C; Table S11: Retention times, relative contents and identification of the prominent peaks obtained by GC-MS analysis of Extract 3 (MeOH with 5% water) obtained at 25 °C; Table S12: Retention times, relative contents and identification of the prominent peaks obtained by GC-MS analysis of Extract 3 (MeOH with 10% water) obtained at 25 °C; Table S13: Retention times, relative contents and identification of the prominent peaks obtained by GC-MS analysis of Extract 3 (MeOH with 15% water) obtained at 25 °C; Table S14: Retention times, relative contents and identification of the prominent peaks obtained by GC-MS analysis of Extract 3 (MeOH with 20% water) obtained at 25 °C; Table S15: Retention times, relative contents and identification of the prominent peaks obtained by GC-MS analysis of Extract 3 (MeOH with 25% water) obtained at 25 °C; Table S16: Retention times, relative contents and identification of the prominent peaks obtained by GC-MS analysis of Raffinate 3 (MeOH with 5% water) obtained at 35 °C; Table S17: Retention times, relative contents and identification of the prominent peaks obtained by GC-MS analysis of Raffinate 3 (MeOH with 10% water) obtained at 35 °C; Table S18: Retention times, relative contents and identification of the prominent peaks obtained by GC-MS analysis of Raffinate 3 (MeOH with 15% water) obtained at 35 °C; Table S19: Retention times, relative contents and identification of the prominent peaks obtained by GC-MS analysis of Raffinate 3 (MeOH with 20% water) obtained at 35 °C; Table S20: Retention times, relative contents and identification of the prominent peaks obtained by GC-MS analysis of Raffinate 3 (MeOH with 25% water) obtained at 35 °C; Table S21: Retention times, relative contents and identification of the prominent peaks obtained by GC-MS analysis of Extract 3 (MeOH with 5% water) obtained at 35 °C; Table S22: Retention times, relative contents and identification of the prominent peaks obtained by GC-MS analysis of Extract 3 (MeOH with 10% water) obtained at 35 °C; Table S23: Retention times, relative contents and identification of the prominent peaks obtained by GC-MS analysis of Extract 3 (MeOH with 15% water) obtained at 35 °C; Table S24: Retention times, relative contents and identification of the prominent peaks obtained by GC-MS analysis of Extract 3 (MeOH with 20% water) obtained at 35 °C; Table S25: Retention times, relative contents and identification of the prominent peaks obtained by GC-MS analysis of Extract 3 (MeOH with 25% water) obtained at 35 °C.
Author Contributions
The individual contributions of all the co-authors are provided as follows: N.T.M. contributed with supervision and conceptualization; S.A.P.d.M. contributed with investigation and writing—review and editing; R.A.C.L. contributed with methodology; R.O.M.A.d.S. contributed with methodology; S.D.J. contributed with chemical analysis and resources, L.E.P.B. contributed with methodology; and A.d.A.M.d.M. contributed with conceptualization, methodology, formal analysis, investigation, writing—original draft preparation and writing—review and editing. All authors have read and agreed to the published version of the manuscript.
Funding
This work was financially supported by the Brazilian governmental agencies (CAPES and Eletrobrás).
Data Availability Statement
The original contributions presented in the study are included in the article, further inquiries can be directed to the corresponding author.
Conflicts of Interest
The authors declare no conflicts of interest.
References
- Chan, Y.H.; Loh, S.K.; Chin, B.L.F.; Yiin, C.L.; How, B.S.; Cheah, K.W.; Wong, M.K.; Loy, A.C.M.; Gwee, Y.L.; Lo, S.L.Y.; et al. Fractionation and Extraction of Bio-Oil for Production of Greener Fuel and Value-Added Chemicals: Recent Advances and Future Prospects. Chem. Eng. J. 2020, 397, 125406. [Google Scholar] [CrossRef]
- Stedile, T.; Ender, L.; Meier, H.F.; Simionatto, E.L.; Wiggers, V.R. Comparison between Physical Properties and Chemical Composition of Bio-Oils Derived from Lignocellulose and Triglyceride Sources. Renew. Sustain. Energy Rev. 2015, 50, 92–108. [Google Scholar] [CrossRef]
- Wei, Y.; Lei, H.; Wang, L.; Zhu, L.; Zhang, X.; Liu, Y.; Chen, S.; Ahring, B. Liquid–Liquid Extraction of Biomass Pyrolysis Bio-Oil. Energy Fuels 2014, 28, 1207–1212. [Google Scholar] [CrossRef]
- Naji, S.Z.; Tye, C.T.; Abd, A.A. State of the Art of Vegetable Oil Transformation into Biofuels Using Catalytic Cracking Technology: Recent Trends and Future Perspectives. Process Biochem. 2021, 109, 148–168. [Google Scholar] [CrossRef]
- Maher, K.D.; Bressler, D.C. Pyrolysis of Triglyceride Materials for the Production of Renewable Fuels and Chemicals. Bioresour. Technol. 2007, 98, 2351–2368. [Google Scholar] [CrossRef] [PubMed]
- Lima, D.G.; Soares, V.C.D.; Ribeiro, E.B.; Carvalho, D.A.; Cardoso, É.C.V.; Rassi, F.C.; Mundim, K.C.; Rubim, J.C.; Suarez, P.A.Z. Diesel-like Fuel Obtained by Pyrolysis of Vegetable Oils. J. Anal. Appl. Pyrolysis 2004, 71, 987–996. [Google Scholar] [CrossRef]
- Bridgwater, A. V Review of Fast Pyrolysis of Biomass and Product Upgrading. Biomass Bioenergy 2012, 38, 68–94. [Google Scholar] [CrossRef]
- Wang, S. High-Efficiency Separation of Bio-Oil. In Biomass Now—Sustainable Growth and Use; Matovic, M.D., Ed.; InTech: Houston, TX, USA, 2013; pp. 401–418. [Google Scholar]
- Huber, G.W.; Iborra, S.; Corma, A. Synthesis of Transportation Fuels from Biomass: Chemistry, Catalysts, and Engineering. Chem. Rev. 2006, 106, 4044–4098. [Google Scholar] [CrossRef] [PubMed]
- Zhang, L.; Liu, R.H.; Yin, R.Z.; Mei, Y.F. Upgrading of Bio-Oil from Biomass Fast Pyrolysis in China: A Review. Renew. Sustain. Energy Rev. 2013, 24, 66–72. [Google Scholar] [CrossRef]
- Xiu, S.N.; Shahbazi, A. Bio-Oil Production and Upgrading Research: A Review. Renew. Sustain. Energy Rev. 2012, 16, 4406–4414. [Google Scholar] [CrossRef]
- Shamsul, N.S.; Kamarudin, S.K.; Rahman, N.A. Conversion of Bio-Oil to Bio Gasoline via Pyrolysis and Hydrothermal: A Review. Renew. Sustain. Energy Rev. 2017, 80, 538–549. [Google Scholar] [CrossRef]
- Baloch, H.A.; Nizamuddin, S.; Siddiqui, M.T.H.; Riaz, S.; Jatoi, A.S.; Dumbre, D.K.; Mubarak, N.M.; Srinivasan, M.P.; Griffin, G.J. Recent Advances in Production and Upgrading of Bio-Oil from Biomass: A Critical Overview. J. Environ. Chem. Eng. 2018, 6, 5101–5118. [Google Scholar] [CrossRef]
- Wisniewski, A.; Wosniak, L.; Scharf, D.R.; Wiggers, V.R.; Meier, H.F.; Simionatto, E.L. Upgrade of Biofuels Obtained from Waste Fish Oil Pyrolysis by Reactive Distillation. J. Braz. Chem. Soc. 2015, 26, 224–232. [Google Scholar] [CrossRef]
- Drugkar, K.; Rathod, W.; Sharma, T.; Sharma, A.; Joshi, J.; Pareek, V.K.; Ledwani, L.; Diwekar, U. Advanced Separation Strategies for Up-Gradation of Bio-Oil into Value-Added Chemicals: A Comprehensive Review. Sep. Purif. Technol. 2022, 283, 120149. [Google Scholar] [CrossRef]
- Jacobson, K.; Maheria, K.C.; Dalai, A.K. Bio-Oil Valorization: A Review. Renew. Sustain. Energy Rev. 2013, 23, 91–106. [Google Scholar] [CrossRef]
- Hu, X.; Gunawan, R.; Mourant, D.; Hasan, M.D.M.; Wu, L.; Song, Y.; Lievens, C.; Li, C.-Z. Upgrading of Bio-Oil via Acid-Catalyzed Reactions in Alcohols—A Mini Review. Fuel Process. Technol. 2017, 155, 2–19. [Google Scholar] [CrossRef]
- Leng, L.; Li, H.; Yuan, X.; Zhou, W.; Huang, H. Bio-Oil Upgrading by Emulsification/Microemulsification: A Review. Energy 2018, 161, 214–232. [Google Scholar] [CrossRef]
- Gharib, J.; Pang, S.; Holland, D. Synthesis and Characterisation of Polyurethane Made from Pyrolysis Bio-Oil of Pine Wood. Eur. Polym. J. 2020, 133, 109725. [Google Scholar] [CrossRef]
- Wang, S.R.; Wang, Y.R.; Cai, Q.J.; Wang, X.Y.; Jin, H.; Luo, Z.Y. Multi-Step Separation of Monophenols and Pyrolytic Lignins from the Water-Insoluble Phase of Bio-Oil. Sep. Purif. Technol. 2014, 122, 248–255. [Google Scholar] [CrossRef]
- Park, L.K.E.; Ren, S.; Yiacoumi, S.; Ye, X.P.; Borole, A.P.; Tsouris, C. Separation of Switchgrass Bio-Oil by Water/Organic Solvent Addition and PH Adjustment. Energy Fuels 2016, 30, 2164–2173. [Google Scholar] [CrossRef]
- Valdebenito, F.; Ramírez-Álvarez, R.; Alexandra Muñoz, M.; Pecchi, G.; Canales, R.; Ormazabal, S.; Muñoz, R.; Alejandro-Martín, S.; Quero, F.; Adam, R.; et al. Biomass Characterization and Solvent Extraction as Tools to Promote Phenol Production from Urban Pruning. Fuel 2024, 362, 130830. [Google Scholar] [CrossRef]
- Osmanbegovic, N.; Bhatnagar, A.; Konttinen, J.; Louhi-Kultanen, M. Freeze Concentration of Aqueous Pyrolysis Oil Extract and Levoglucosan Recovery by Cooling Crystallization. Powder Technol. 2023, 427, 118700. [Google Scholar] [CrossRef]
- Arroyo-Avirama, A.F.; Ormazábal-Latorre, S.; Jogi, R.; Gajardo-Parra, N.F.; Pazo-Carballo, C.; Ascani, M.; Virtanen, P.; Garrido, J.M.; Held, C.; Mäki-Arvela, P.; et al. Improving the Separation of Guaiacol from N-Hexane by Adding Choline Chloride to Glycol Extracting Agents. J. Mol. Liq. 2022, 355, 118936. [Google Scholar] [CrossRef]
- Fardhyanti, D.S.; Kadarwati, S.; Fatriasari, W.; Prasetiawan, H. Mass Transfer Study of Phenolic Compound Liquid-Liquid Extraction Process from Bio-Oil of Coffee Shell Pyrolysis Product. Mater. Today Proc. 2023, in press. [Google Scholar] [CrossRef]
- Green, D.W.; Perry, R.H. Perry’s Chemical Engineers’ Handbook, Eighth Edition, 8th ed.; McGraw-Hill Education: New York, NY, USA, 2008; ISBN 9780071422949. [Google Scholar]
- Li, Q.; Steele, P.H.; Mitchell, B.; Ingram, L.L.; Yu, F. The Addition of Water to Extract Maximum Levoglucosan from the Bio-Oil Produced via Fast Pyrolysis of Pretreated Loblolly Pinewood. Bioresources 2013, 8, 1868–1880. [Google Scholar] [CrossRef]
- Zhang, X.; Ma, H.; Wu, S.; Jiang, W.; Wei, W.; Lei, M. Fractionation of Pyrolysis Oil Derived from Lignin through a Simple Water Extraction Method. Fuel 2019, 242, 587–595. [Google Scholar] [CrossRef]
- Bennett, N.M.; Helle, S.S.; Duff, S.J.B. Extraction and Hydrolysis of Levoglucosan from Pyrolysis Oil. Bioresour. Technol. 2009, 100, 6059–6063. [Google Scholar] [CrossRef] [PubMed]
- Vitasari, C.R.; Meindersma, G.W.; de Haan, A.B. Water Extraction of Pyrolysis Oil: The First Step for the Recovery of Renewable Chemicals. Bioresour. Technol. 2011, 102, 7204–7210. [Google Scholar] [CrossRef] [PubMed]
- Kanaujia, P.K.; Naik, D.V.; Tripathi, D.; Singh, R.; Poddar, M.K.; Konathala, L.N.S.K.; Sharma, Y.K. Pyrolysis of Jatropha Curcas Seed Cake Followed by Optimization of Liquid-Liquid Extraction Procedure for the Obtained Bio-Oil. J. Anal. Appl. Pyrolysis 2016, 118, 202–224. [Google Scholar] [CrossRef]
- Wang, D.; Li, D.B.; Liu, Y.Q.; Lv, D.C.; Ye, Y.Y.; Zhu, S.J.; Zhang, B.B. Study of a New Complex Method for Extraction of Phenolic Compounds from Bio-Oils. Sep. Purif. Technol. 2014, 134, 132–138. [Google Scholar] [CrossRef]
- Fu, D.; Farag, S.; Chaouki, J.; Jessop, P.G. Extraction of Phenols from Lignin Microwave-Pyrolysis Oil Using a Switchable Hydrophilicity Solvent. Bioresour. Technol. 2014, 154, 101–108. [Google Scholar] [CrossRef] [PubMed]
- Kumar, S.; Lange, J.-P.; Van Rossum, G.; Kersten, S.R.A. Bio-Oil Fractionation by Temperature-Swing Extraction: Principle and Application. Biomass Bioenergy 2015, 83, 96–104. [Google Scholar] [CrossRef]
- Li, H.; Xia, S.; Ma, P. Upgrading Fast Pyrolysis Oil: Solvent–Anti-Solvent Extraction and Blending with Diesel. Energy Convers. Manag. 2016, 110, 378–385. [Google Scholar] [CrossRef]
- Hu, H.-S.; Wu, Y.-L.; Yang, M.-D. Fractionation of Bio-Oil Produced from Hydrothermal Liquefaction of Microalgae by Liquid-Liquid Extraction. Biomass Bioenergy 2018, 108, 487–500. [Google Scholar] [CrossRef]
- Yang, X.; Lyu, H.; Chen, K.; Zhu, X.; Zhang, S.; Chen, J. Selective Extraction of Bio-Oil from Hydrothermal Liquefaction of Salix Psammophila by Organic Solvents with Different Polarities through Multistep Extraction Separation. Bioresources 2014, 9, 5219–5233. [Google Scholar] [CrossRef]
- Sukhbaatar, B.; Steele, P.H.; Ingram, L.L.; Kim, M.G. An Exploratory Study on the Removal of Acetic and Formic Acids from Bio-Oil. Bioresources 2009, 4, 1319–1329. [Google Scholar] [CrossRef]
- Lewis, K.R.; Daane, M.L.; Schelling, R. Processing Corrosive Crude Oils. In Proceedings of the CORROSION 99, San Antonio, TX, USA, 25–30 April 1999. [Google Scholar]
- de Bruyn, H.J. Naphthenic Acid Corrosion in Synthetic Fuels Production. In Proceedings of the CORROSION 98, San Diego, CA, USA, 22–27 March 1998. [Google Scholar]
- Qu, D.R.; Zheng, Y.G.; Jing, H.M.; Yao, Z.M.; Ke, W. High Temperature Naphthenic Acid Corrosion and Sulphidic Corrosion of Q235 and 5Cr1/2Mo Steels in Synthetic Refining Media. Corros. Sci. 2006, 48, 1960–1985. [Google Scholar] [CrossRef]
- Qu, D.R.; Zheng, Y.G.; Jiang, X.; Ke, W. Correlation between the Corrosivity of Naphthenic Acids and Their Chemical Structures. Anti-Corros. Methods Mater. 2007, 54, 211–218. [Google Scholar] [CrossRef]
- Yépez, O. On the Chemical Reaction between Carboxylic Acids and Iron, Including the Special Case of Naphthenic Acid. Fuel 2007, 86, 1162–1168. [Google Scholar] [CrossRef]
- Yu, J.; Jiang, L.; Gan, F. High Temperature Naphthenic Acid Corrosion of Steel in High TAN Refining Media. Anti-Corros. Methods Mater. 2008, 55, 257–263. [Google Scholar] [CrossRef]
- Da Mota, S.D.P.; Mancio, A.A.; Lhamas, D.E.L.; De Abreu, D.H.; Da Silva, M.S.; Dos Santos, W.G.; De Castro, D.A.R.; De Oliveira, R.M.; Arajo, M.E.; Borges, L.E.P.; et al. Production of Green Diesel by Thermal Catalytic Cracking of Crude Palm Oil (Elaeis guineensis Jacq) in a Pilot Plant. J. Anal. Appl. Pyrolysis 2014, 110, 1–11. [Google Scholar] [CrossRef]
- ASTM D4052; Standard Test Method for Density, Relative Density, and API Gravity of Liquids by Digital Density Meter. ASTM International: West Conshohocken, PA, USA, 2022.
- ASTM D445; Standard Test Method for Kinematic Viscosity of Transparent and Opaque Liquids (and Calculation of Dynamic Viscosity). ASTM International: West Conshohocken, PA, USA, 2024.
- ASTM D130; Standard Test Method for Corrosiveness to Copper from Petroleum Products by Copper Strip Test. ASTM International: West Conshohocken, PA, USA, 2019.
- ASTM D974; Standard Test Method for Acid and Base Number by Color-Indicator Titration. ASTM International: West Conshohocken, PA, USA, 2022.
- AOCS Cd 3-25; AOCS Official Method Cd 3-25, Saponification Value of Fats and Oils. Official Methods and Recommended Practices of the American Oil Chemists’ Society. AOCS Press: Champaign, IL, USA, 2017.
- Paquot, C. Standard Methods for the Analysis of Oils, Fats and Derivatives, 6th ed.; Pergamon: Bergama, Turkey, 1979; p. 60. ISBN 978-0-08-022379-7. [Google Scholar]
- AOCS Cc 7-25; AOCS Official Method Cc 7-25, Refractive Index of Fats and Oils. Official Methods and Recommended Practices of the American Oil Chemists’ Society. AOCS Press: Champaign, IL, USA, 2017.
- Treybal, R. Liquid Extraction; McGraw-Hill Book Company, Inc.: New York, NY, USA, 1951. [Google Scholar]
- Kumar, A.; Nirmal, P.; Kumar, M.; Jose, A.; Tomer, V.; Oz, E.; Proestos, C.; Zeng, M.; Elobeid, T.; Sneha, V.; et al. Major Phytochemicals: Recent Advances in Health Benefits and Extraction Method. Molecules 2023, 28, 887. [Google Scholar] [CrossRef] [PubMed]
- Mancio, A.A.; da Costa, K.M.B.; Ferreira, C.C.; Santos, M.C.; Lhamas, D.E.L.; da Mota, S.A.P.; Leão, R.A.C.; de Souza, R.O.M.A.; Araújo, M.E.; Borges, L.E.P.; et al. Thermal Catalytic Cracking of Crude Palm Oil at Pilot Scale: Effect of the Percentage of Na2CO3 on the Quality of Biofuels. Ind. Crops Prod. 2016, 91, 32–43. [Google Scholar] [CrossRef]
- Park, L.K.E.; Liu, J.; Yiacoumi, S.; Borole, A.P.; Tsouris, C. Contribution of Acidic Components to the Total Acid Number (TAN) of Bio-Oil. Fuel 2017, 200, 171–181. [Google Scholar] [CrossRef]
- Oasmaa, A.; Elliott, D.C.; Korhonen, J. Acidity of Biomass Fast Pyrolysis Bio-Oils. Energy Fuels 2010, 24, 6548–6554. [Google Scholar] [CrossRef]
- Santos, A.L.; Martins, D.U.; Iha, O.K.; Ribeiro, R.A.; Quirino, R.L.; Suarez, P.A. Agro-Industrial Residues as Low-Price Feedstock for Diesel-like Fuel Production by Thermal Cracking. Bioresour. Technol. 2010, 101, 6157–6162. [Google Scholar] [CrossRef] [PubMed]
- Buzetzki, E.; Sidorová, K.; Cvengrošová, Z.; Kaszonyi, A.; Cvengroš, J. The Influence of Zeolite Catalysts on the Products of Rapeseed Oil Cracking. Fuel Process. Technol. 2011, 92, 1623–1631. [Google Scholar] [CrossRef]
- Haas, M.J. Animal Fats. In Bailey’s Industrial Oil and Fat Products; Shahidi, F., Ed.; John Wiley & Sons, Inc.: Hoboken, NJ, USA, 2005; pp. 267–284. [Google Scholar]
- Gunstone, F.D. The Chemistry of Oils and Fats: Sources, Composition, Properties and Uses; Blackwell Publishing Ltd: Oxford, UK, 2004. [Google Scholar]
- Canapi, E.C.; Agustin, Y.T.V.; Moro, E.A.; Pedrosa, E., Jr.; Bendaño, M.L.J. Coconut Oil. In Bailey’s Industrial Oil and Fat Products; Shahidi, F., Ed.; John Wiley & Sons, Inc.: Hoboken, NJ, USA, 2005. [Google Scholar]
- Swern, D. Bailey’s Industrial Oils and Fat Products; Swern, D., Ed.; Interscience Publishers: New York, NY, USA, 1964; pp. 128–131. [Google Scholar]
- Wu, W.-L.; Tan, Z.-Q.; Wu, G.-J.; Yuan, L.; Zhu, W.-L.; Bao, Y.-L.; Pan, L.-Y.; Yang, Y.-J.; Zheng, J.-X. Deacidification of Crude Low-Calorie Cocoa Butter with Liquid–Liquid Extraction and Strong-Base Anion Exchange Resin. Sep. Purif. Technol. 2013, 102, 163–172. [Google Scholar] [CrossRef]
- Oliveira, C.M.; Garavazo, B.R.; Rodrigues, C.E.C. Liquid-Liquid Equilibria for Systems Composed of Rice Bran Oil and Alcohol-Rich Solvents: Application to Extraction and Deacidification of Oil. J. Food Eng. 2012, 110, 418–427. [Google Scholar] [CrossRef]
- Gandhi, S.; Kadrmas, J.; Št’ávová, J.; Kubátová, A.; Muggli, D.; Seames, W.S.; Sadrameli, S.M.; Tande, B.M. Extraction of Fatty Acids from Noncatalytically Cracked Triacylglycerides with Water and Aqueous Sodium Hydroxide. Sep. Sci. Technol. 2012, 47, 66–72. [Google Scholar] [CrossRef]
- Pavia, D.L.; Lampman, G.M.; Kriz, G.S.; Vyvyan, J.R. Introduction to Spectroscopy, 4th ed.; Cengage Learning: Belmont, CA, USA, 2009. [Google Scholar]
- Silverstein, R.M.; Webster, F.X.; Kiemle, D.J. Spectrometric Identification of Organic Compounds, 7th ed.; John Wiley & Sons, Inc.: Hoboken, NJ, USA, 2005. [Google Scholar]
- Ren, S.; Ye, X.P.; Borole, A.P. Separation of Chemical Groups from Bio-Oil Water-Extract via Sequential Organic Solvent Extraction. J. Anal. Appl. Pyrolysis 2017, 123, 30–39. [Google Scholar] [CrossRef]
- Lee, Y.; Shafaghat, H.; Kim, J.K.; Jeon, J.K.; Jung, S.C.; Lee, I.G.; Park, Y.K. Upgrading of Pyrolysis Bio-Oil Using WO3/ZrO2 and Amberlyst Catalysts: Evaluation of Acid Number and Viscosity. Korean J. Chem. Eng. 2017, 34, 2180–2187. [Google Scholar] [CrossRef]
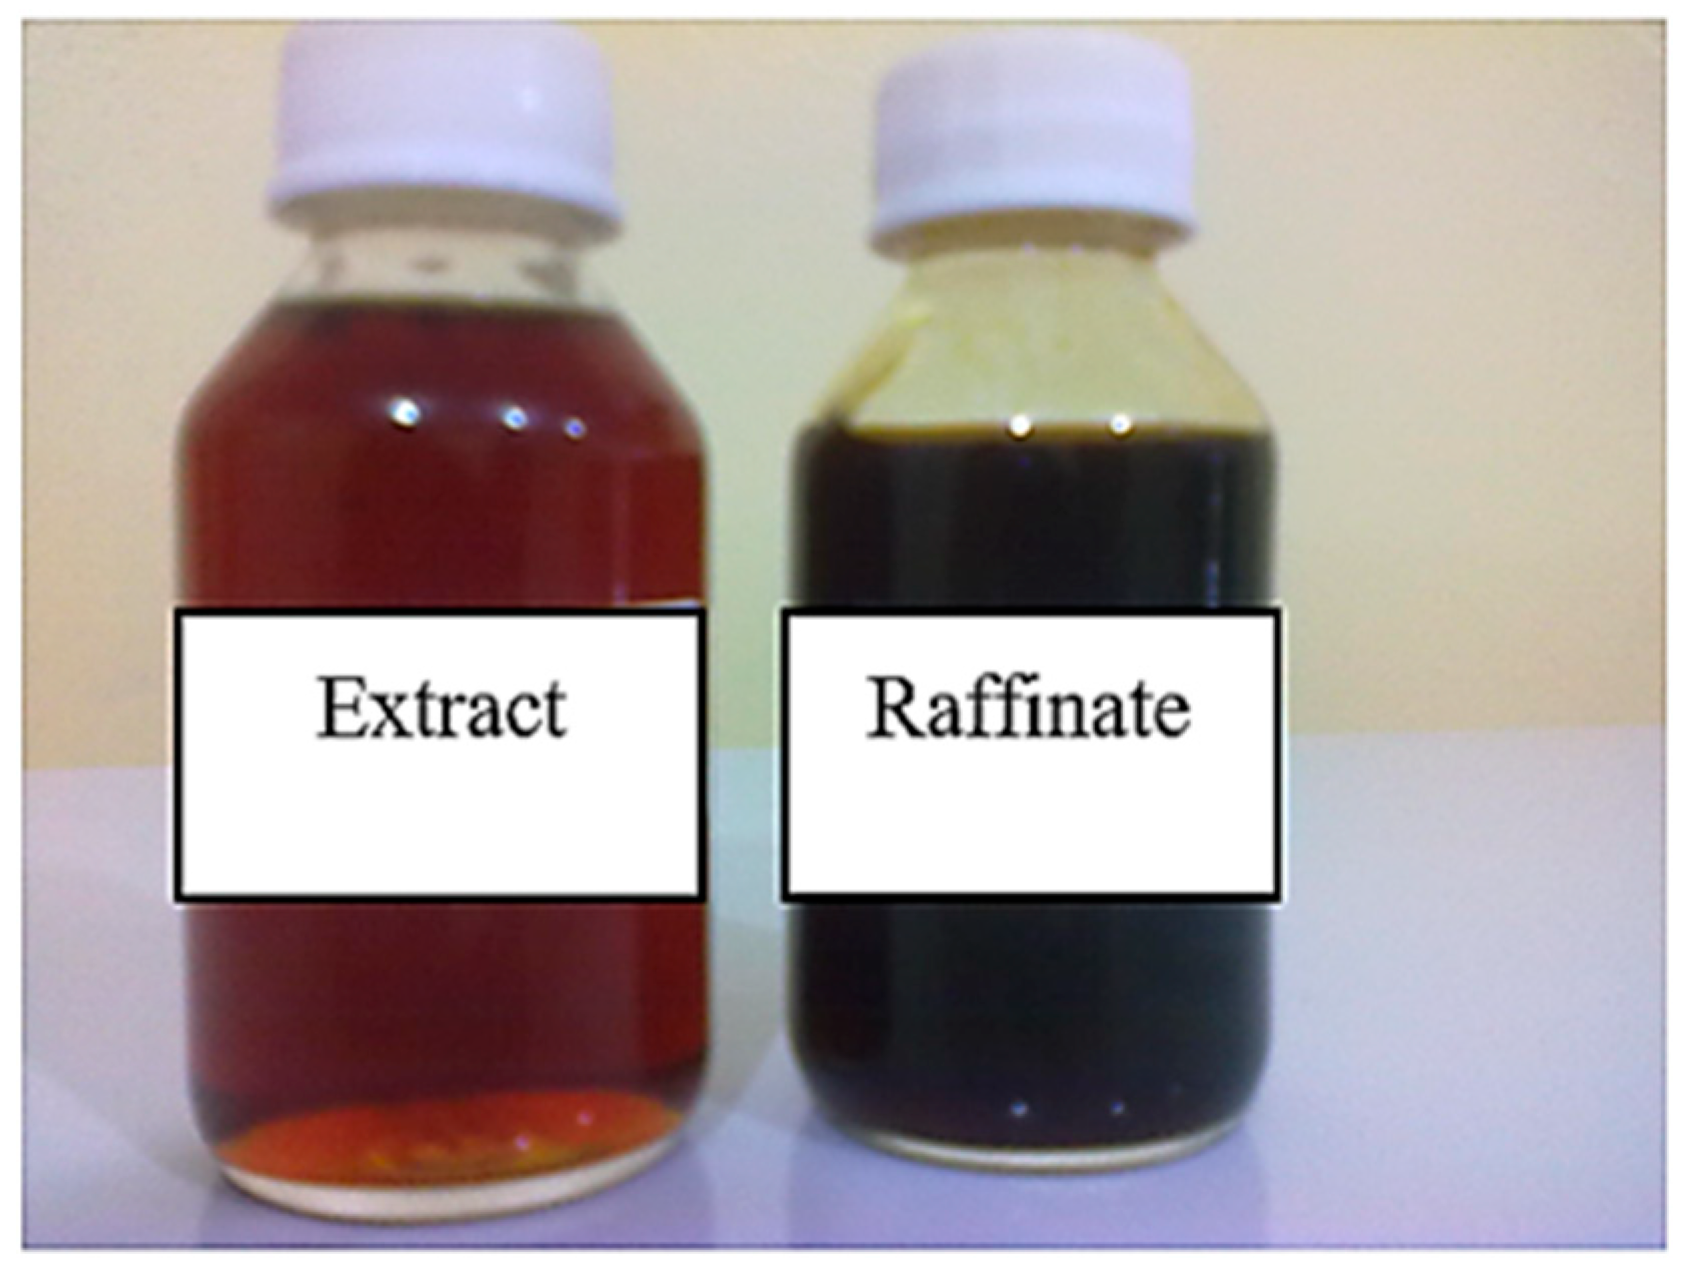
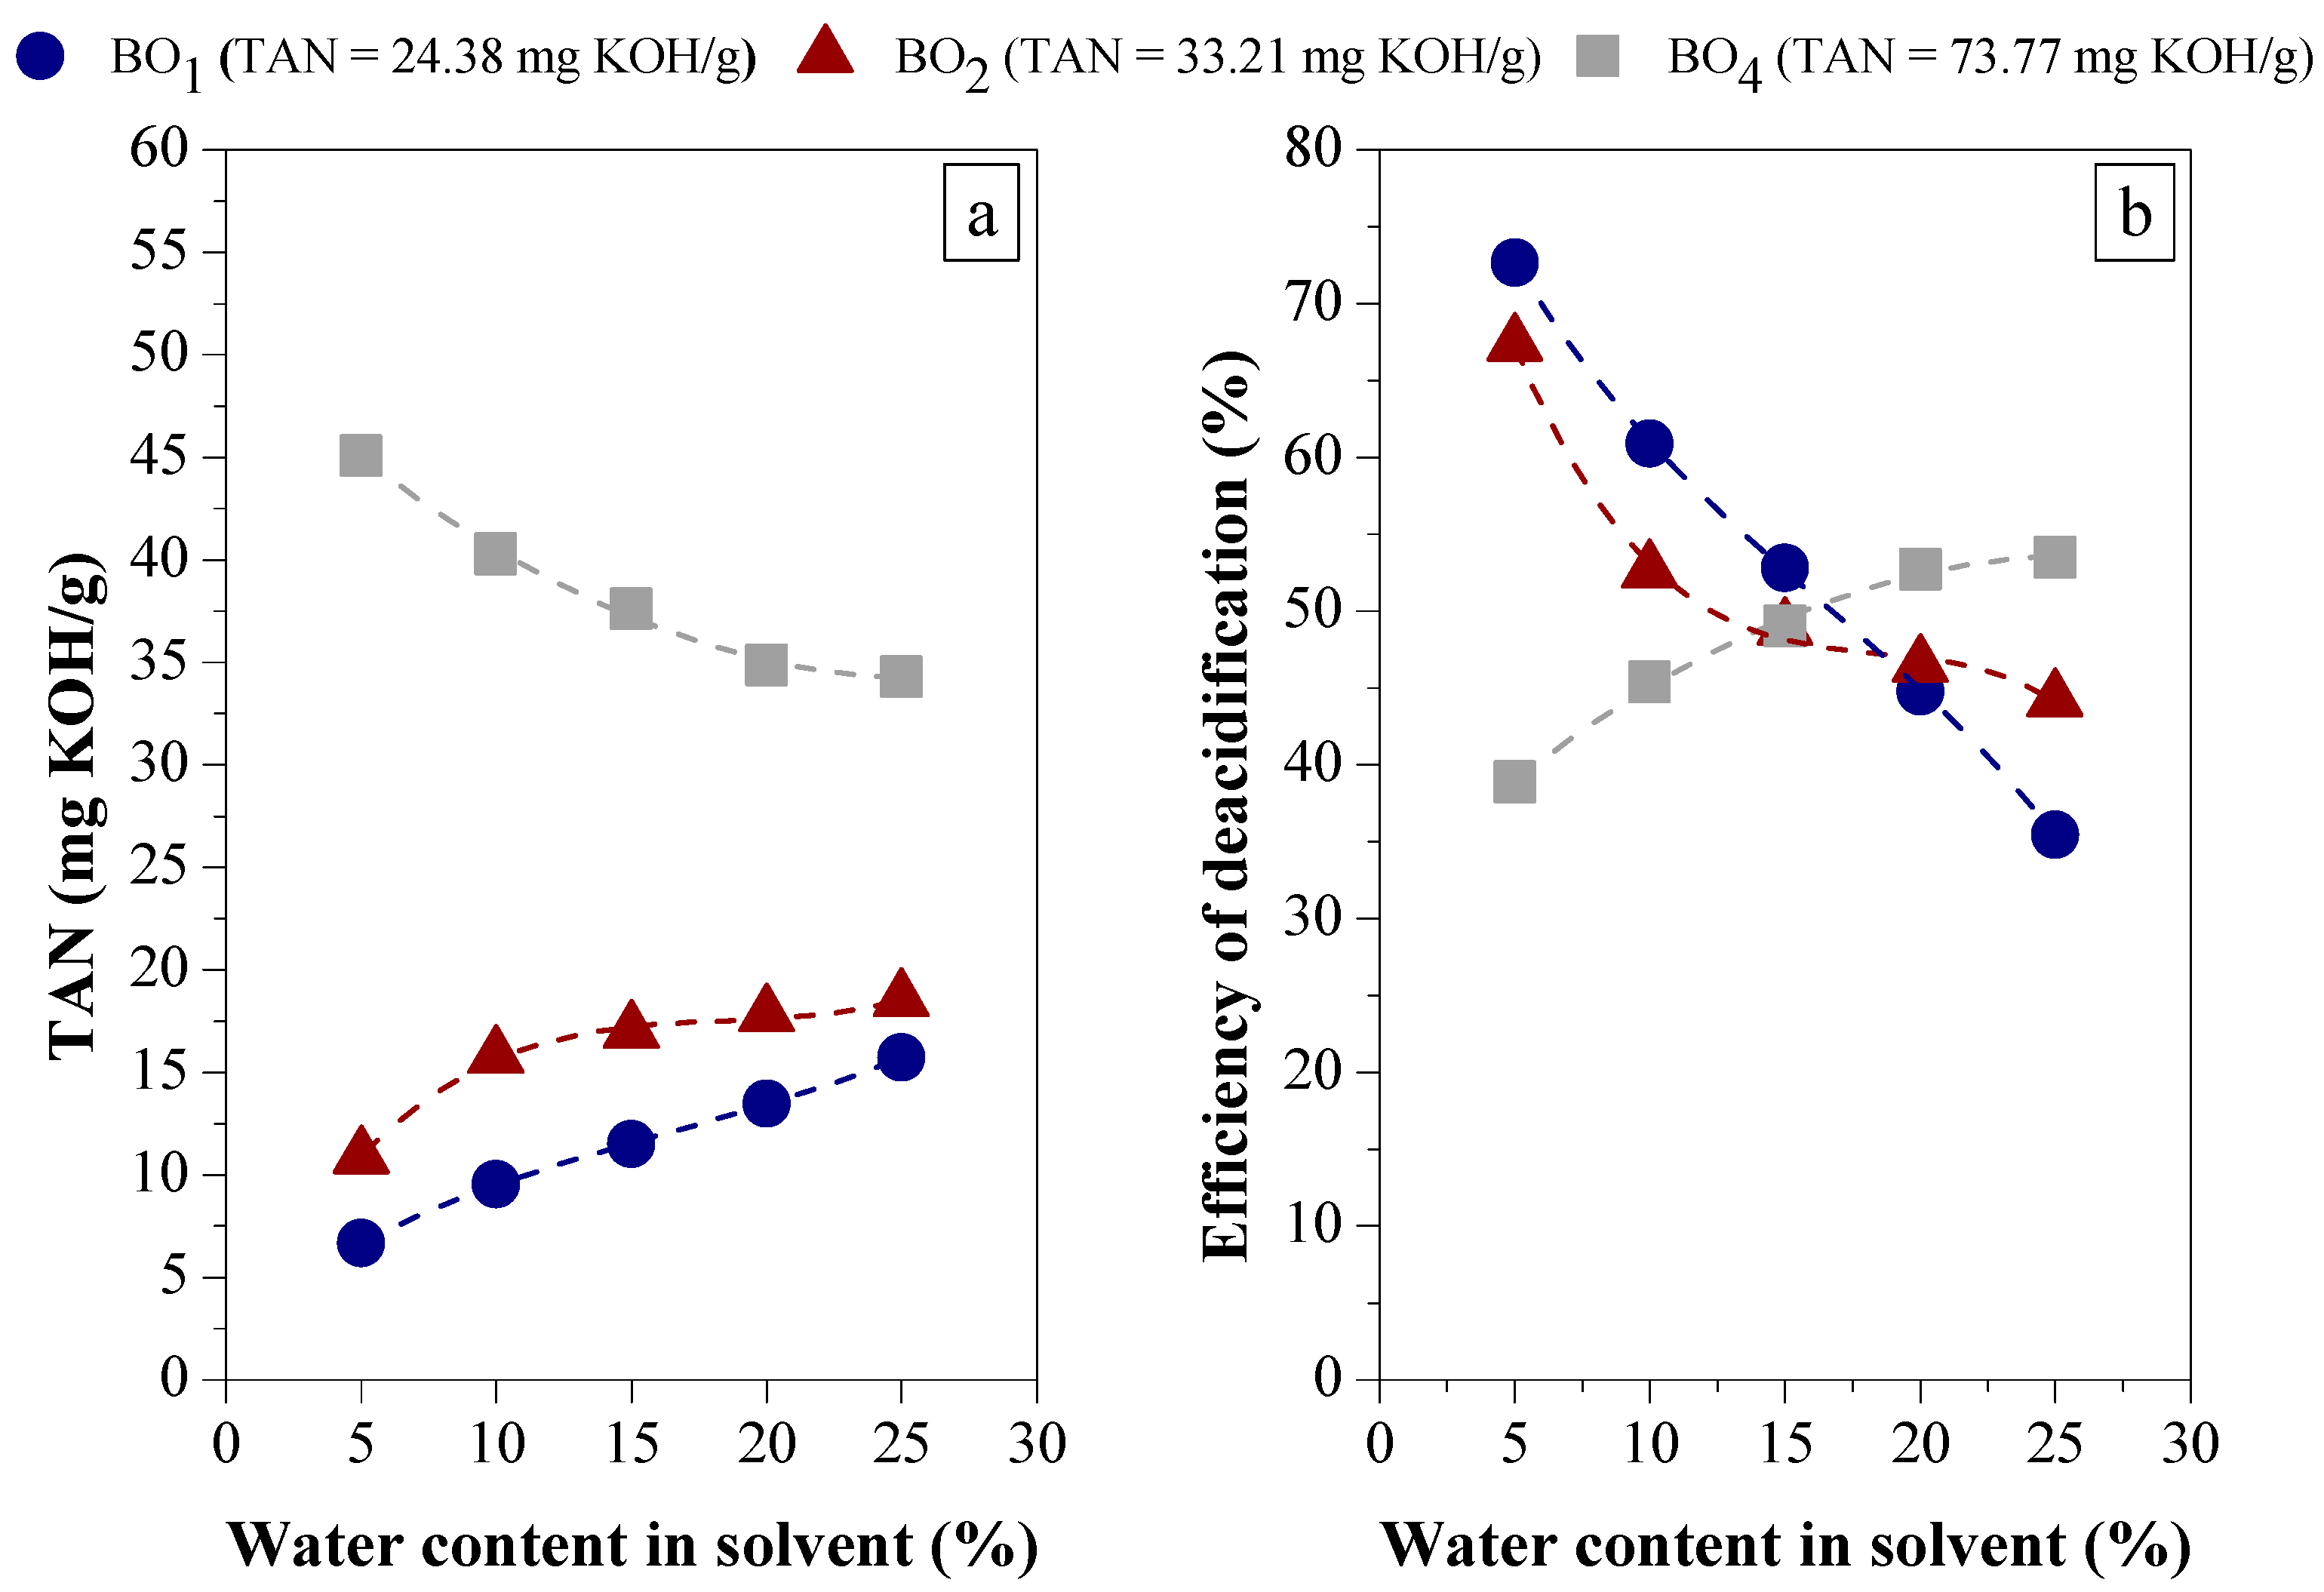
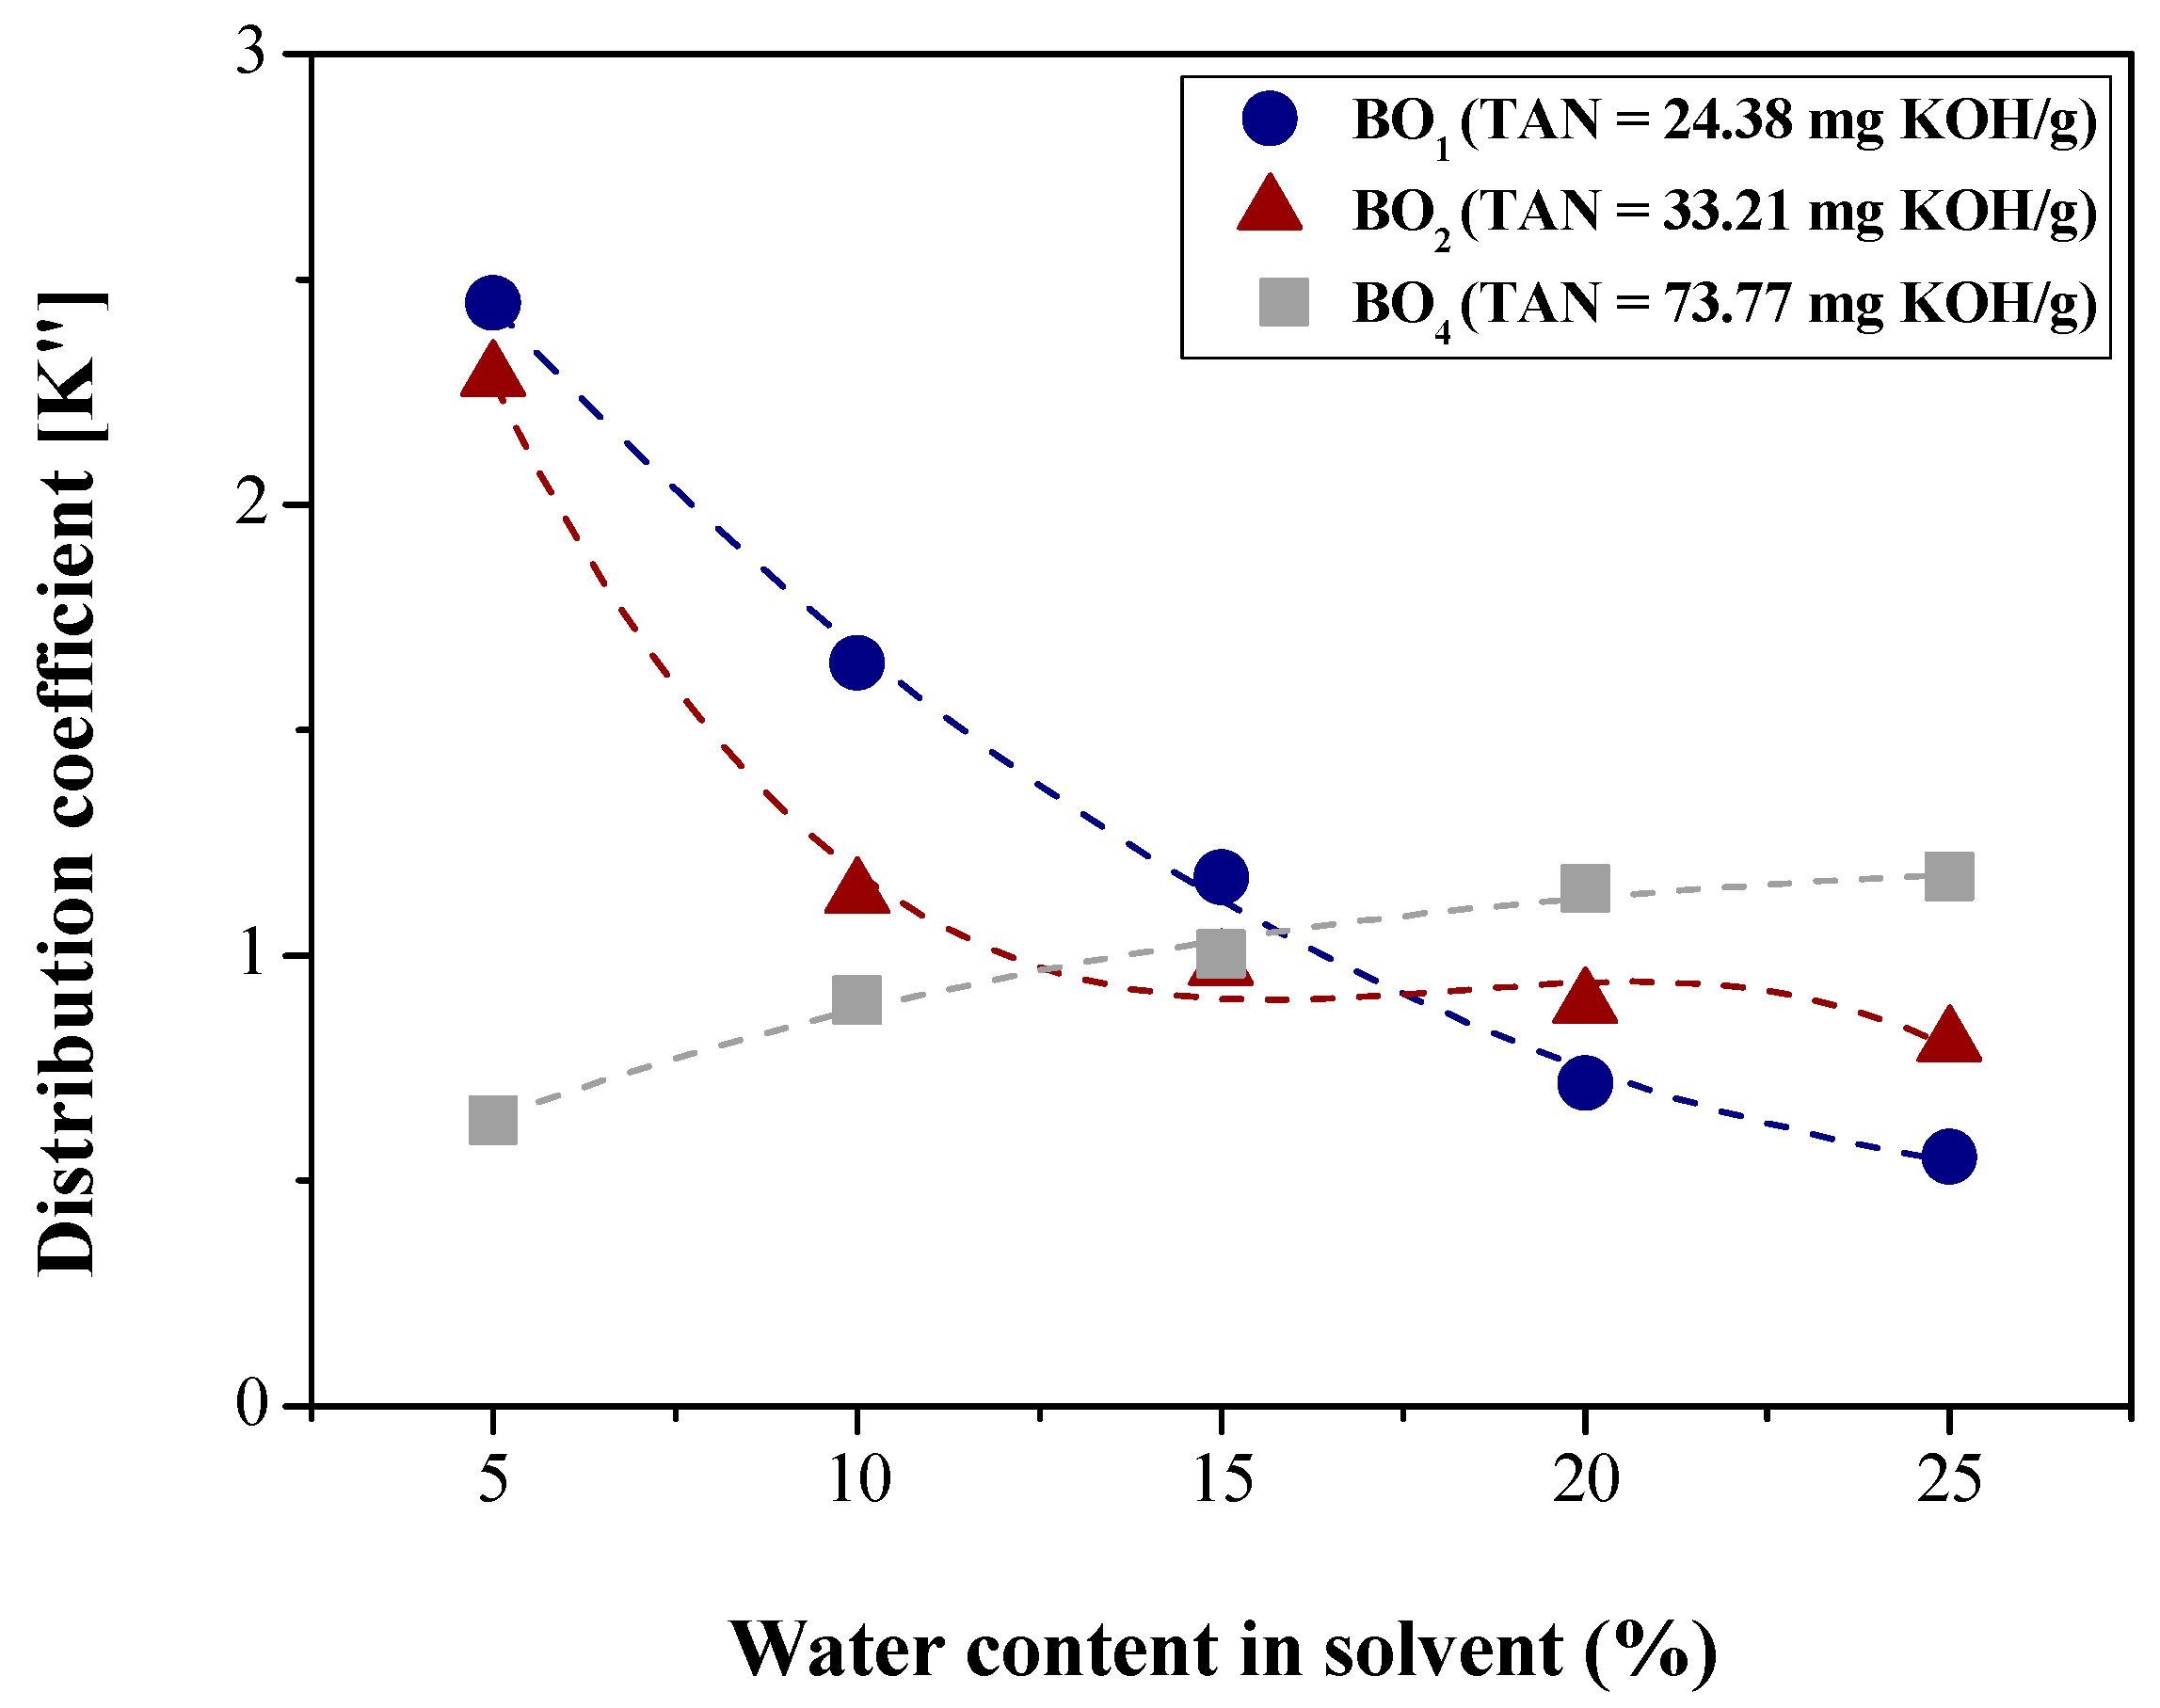
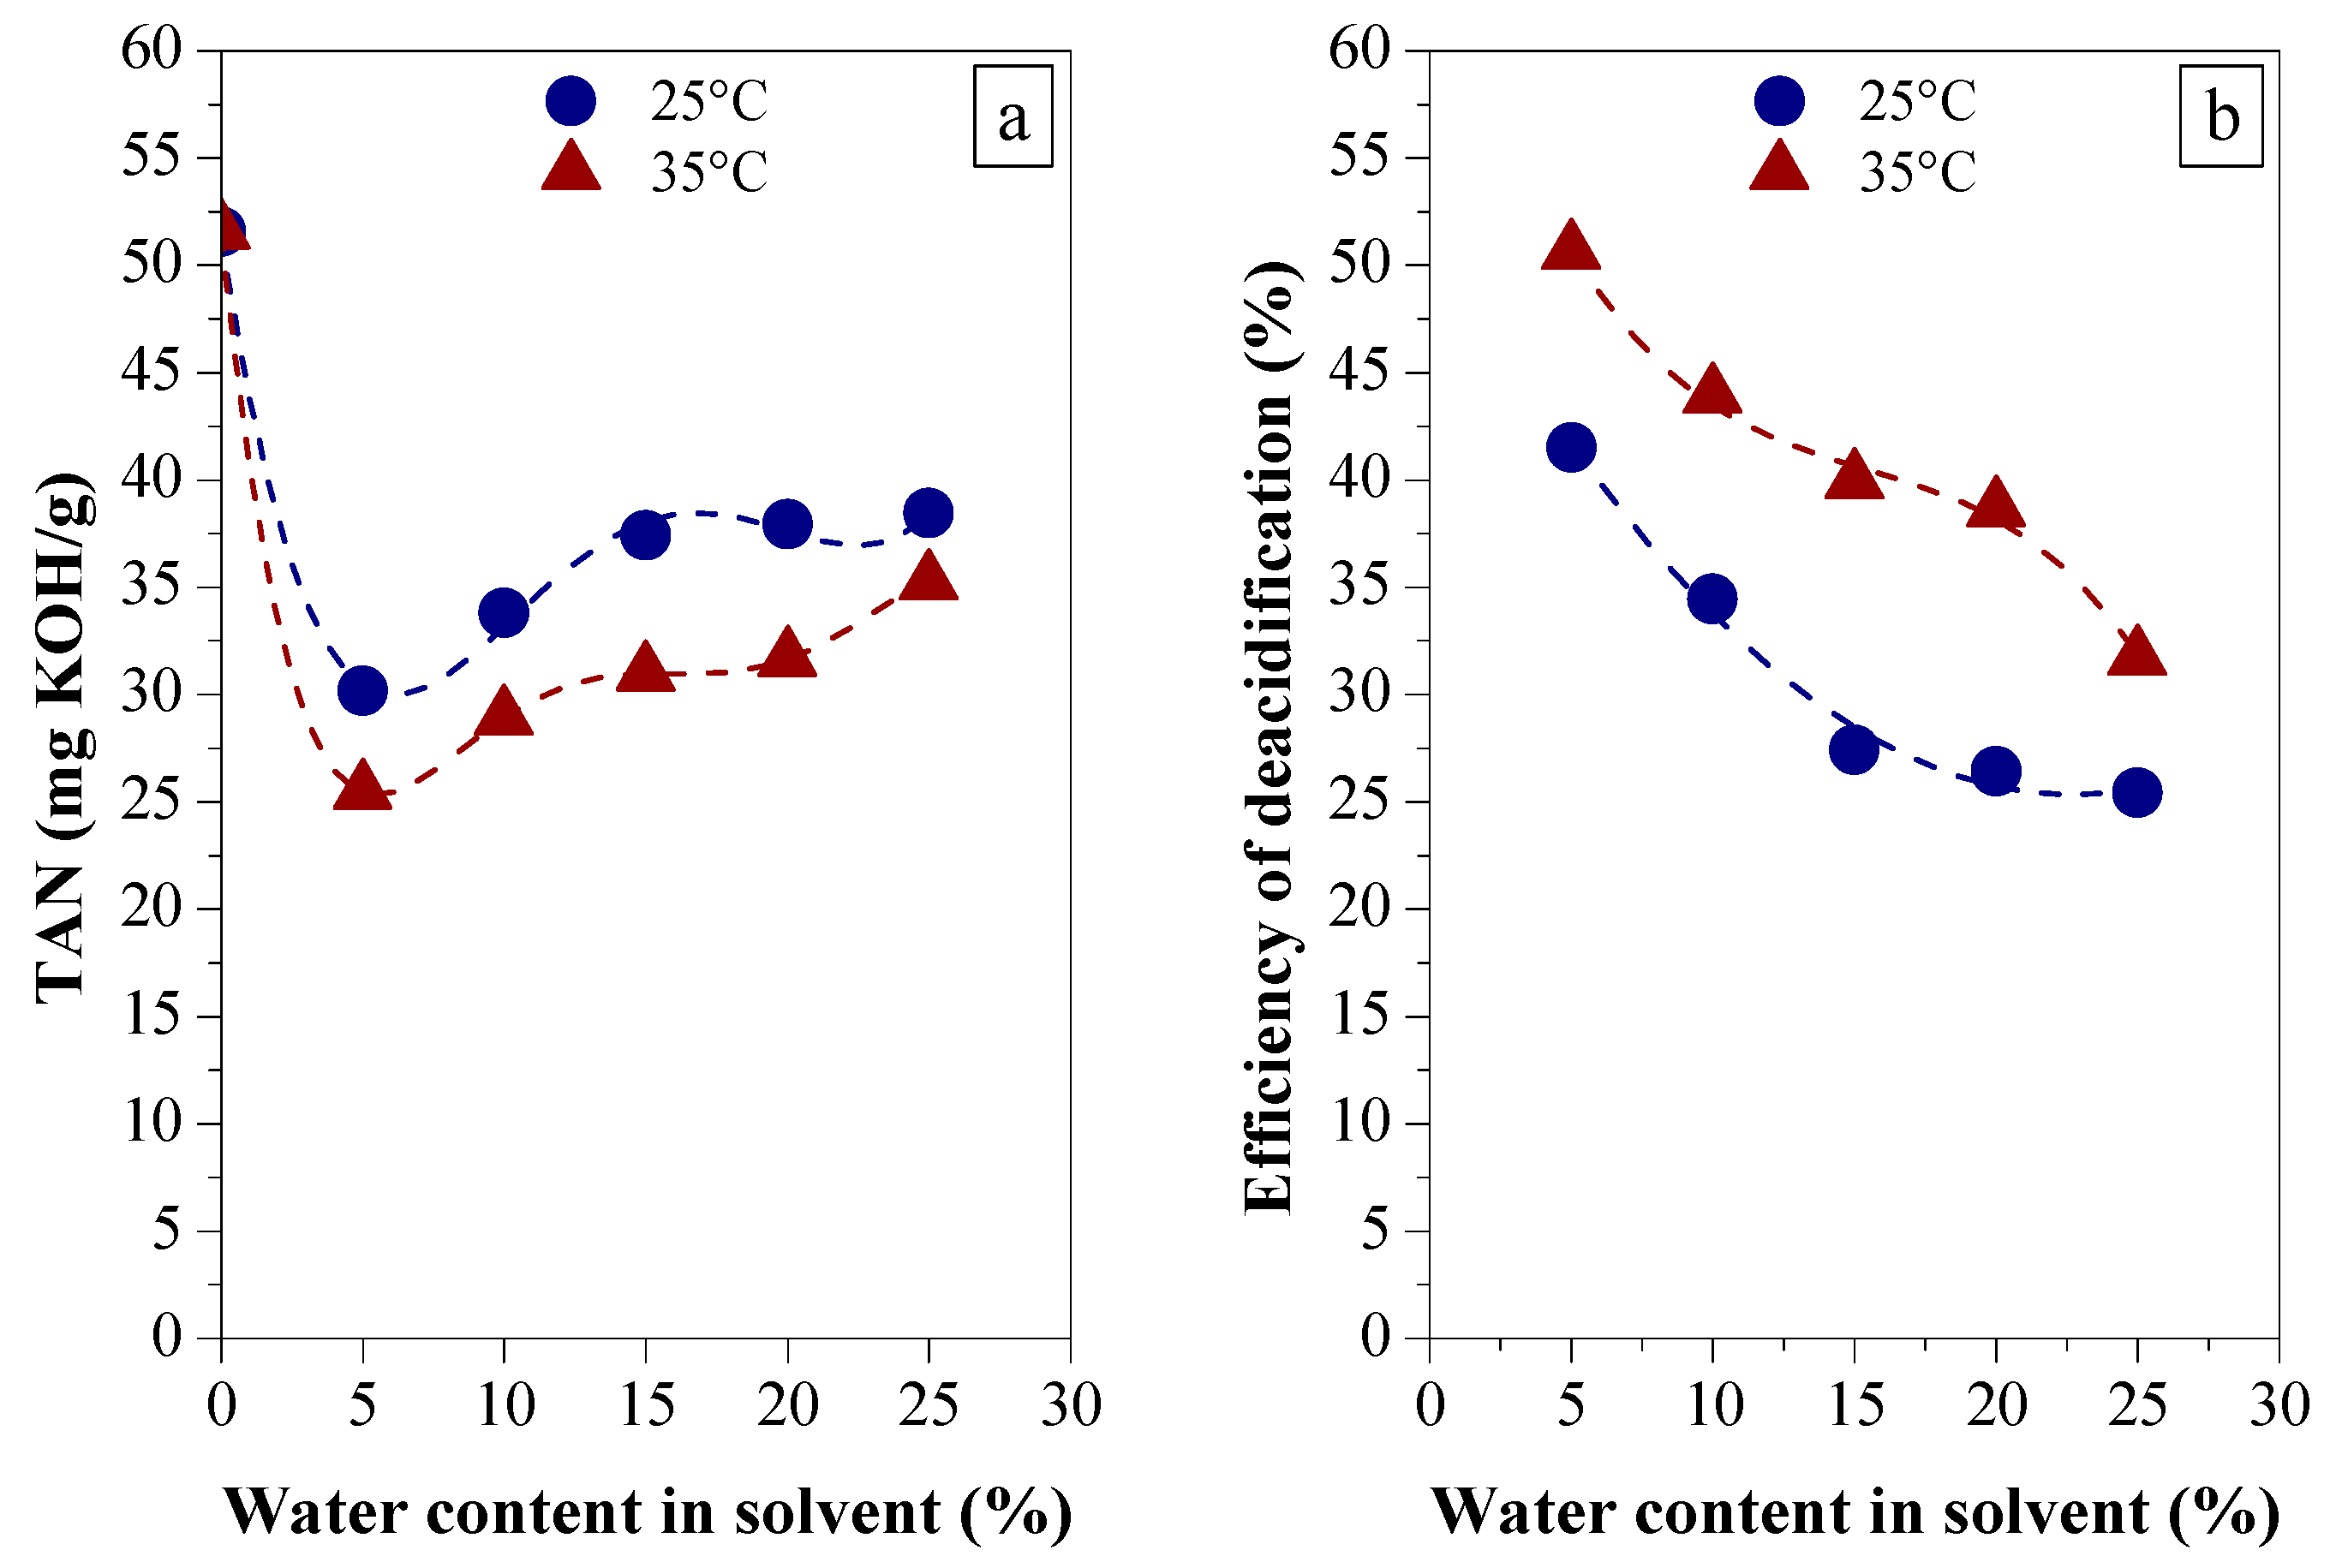
Disclaimer/Publisher’s Note: The statements, opinions and data contained in all publications are solely those of the individual author(s) and contributor(s) and not of MDPI and/or the editor(s). MDPI and/or the editor(s) disclaim responsibility for any injury to people or property resulting from any ideas, methods, instructions or products referred to in the content. |
© 2024 by the authors. Licensee MDPI, Basel, Switzerland. This article is an open access article distributed under the terms and conditions of the Creative Commons Attribution (CC BY) license (https://creativecommons.org/licenses/by/4.0/).