Article

Evaluation of Recoverable Hydrocarbon Reserves and Area Selection Methods for In Situ Conversion of Shale

Research Institute of Petroleum Exploration & Development, PetroChina, Beijing 100083, China
*
Authors to whom correspondence should be addressed.
Energies 2024, 17(11), 2717; https://doi.org/10.3390/en17112717
Submission received: 28 April 2024 / Revised: 20 May 2024 / Accepted: 29 May 2024 / Published: 3 June 2024
(This article belongs to the Special Issue Development of Unconventional Oil and Gas Fields)

Abstract

:
It is well known that the existing horizontal-well-drilling and hydraulic fracturing technology used to achieve large-scale, cost-effective production from immature to low–moderate-maturity continental shale in China, where the organic matter mainly exists in solid form, is fairly ineffective. To overcome the obstacles, in situ conversion technology seems feasible, while implementing it in the target layer along with estimating the amount of expected recoverable hydrocarbon in such shale formations seems difficult. This is because there are no guidelines for choosing the most appropriate method and selecting relevant key parameters for this purpose. Hence, based on thermal simulation experiments during the in situ conversion of crude oil from the Triassic Chang 73 Formation in the Ordos Basin and the Cretaceous Nenjiang Formation in the Songliao Basin, this deficiency in knowledge was addressed. First, relationships between the in situ-converted total organic carbon (TOC) content and the vitrinite reflectance (Ro) of the shales and between the residual oil volume and the hydrocarbon yield were established. Second, the yields of residual oil and in situ-converted hydrocarbon were measured, revealing their sensitivity to fluid pressure and crude oil density. In addition, a model was proposed to estimate the amount of in situ-converted hydrocarbon based on TOC, hydrocarbon generation potential, Ro, residual oil volume, fluid pressure, and crude oil density. Finally, a method was established to determine key parameters of the final hydrocarbon yield from immature to low–moderate-maturity organic material during in situ conversion in shales. Following the procedure outlined in this paper, the estimated recoverable in situ-converted oil in the shales of the Nenjiang Formation in the Songliao Basin was estimated to be approximately 292 × 108 tons, along with 18.5 × 10¹² cubic meters of natural gas, in an area of approximately 8 × 10⁴ square kilometers. Collectively, the method developed in this study is independent of the organic matter type and other geological and/or petrophysical properties of the formation and can be applied to other areas globally where there are no available in situ conversion thermal simulation experimental data.

1. Introduction

Shale oil has become an important source of energy in the exploitation of global hydrocarbon reserves [1,2,3,4]. The most developed continental shale in China is mainly distributed in northern areas, such as the Ordos, Songliao, Bohai Bay, and Junggar Basins, which cover an area of approximately 400,000 square kilometers, with 200,000 square kilometers of it comprising layers containing ultra-rich organic matter (TOC > 4 wt.%) and having Ro values less than 1.0% [5,6,7,8]. China has focused geological studies on shale oil since 2010, especially on key technological breakthroughs and exploration dimensions [9,10,11,12]. Moreover, in 2023, there were over 2500 horizontal wells, and the shale oil yield reached 342 × 104 t. However, global shale oil exploration and development practices have revealed that the existing horizontal well and hydraulic fracturing techniques are not able to achieve the cost-effective development of immature to low–moderate-maturity shale hydrocarbon reserves [13,14,15,16,17]. The main reasons for this are the low maturity of the organic matter in such shale layers, the low hydrocarbon conversion rate of the convertible organic matter, undeveloped organic pores, poor reservoir connectivity, and a low gas–oil ratio (GOR). Therefore, new technologies should be developed for the extraction of hydrocarbons, particularly from immature to low–moderate-maturity shales.
Hubbert proposed a peak oil production theory in 1956, which led many countries and companies to target immature to low–moderate-maturity shale oil to increase hydrocarbon production [18]. In this respect, a number of international oil companies, such as Shell, ExxonMobil, and Total, have initiated research on the in situ conversion of shale oil and have conducted field experiments on various in situ conversion techniques [14,15,19,20]. In addition, the in situ electrical heating conversion technology proposed by Shell in the 1960s is the most prominent technique to date. They believe that in situ electrical heating conversion technology is the preferable method based on a number of field trials that were successfully conducted [8,9,10]. Moreover, in comparison to other existing technologies for this purpose, this technology has been confirmed to be the most feasible option for hydrocarbon extraction from immature to low–moderate-maturity shales.
In situ conversion can be considered a physicochemical process in which the underground heating of shale facilitates the rapid conversion of convertible solid organic matter and residual oil into light oil and natural gas, leaving the coke and other remaining residues underground. In situ conversion technology has four main advantages: a nearly 100% conversion rate of convertible organic matter into hydrocarbons, a hydrocarbon recovery rate of greater than 60%, light oil production (crude oil gravity of 35–49° API), and the ability to achieve clean extraction and minimize damage to the environment [10].
The basis of the cost-effective development of such technology can be considered the accurate estimation of the recoverable hydrocarbon reserves through the in situ conversion of shale and the selection of suitable areas [17]. Based on the results of thermal simulation experiments on the 73 shale in the Triassic Yanchang Formation in the Ordos Basin, in this study, we established an evaluation and area selection method for the in situ conversion of the hydrocarbon yield based on the total organic carbon (TOC) content and vitrinite reflectance (Ro) and assessed the recoverable hydrocarbon reserves in the study area. However, the yield and oil–gas ratios from converted organic material could vary due to differences in the types of organic matter and the hydrocarbon generation potential in different basins, regions, and strata. In addition, existing methods for the evaluation of recoverable hydrocarbons do not consider these factors, so they are only applicable to areas where thermal simulation experiments have been conducted and relevant models have been established. The uncertainties in the evaluation of recoverable resources can be significant if existing methods are used in areas where thermal simulation experiments have not been conducted or where there are significant variations in the organic matter types in the shale samples that have been used to conduct such simulations. Therefore, these models might not necessarily be universal and applicable to all areas.
In order to establish a model that is universal for assessing recoverable hydrocarbons through the in situ conversion of immature to low–moderate-maturity shales, in situ conversion thermal simulation experimental results for the 73 shales in the Triassic Yanchang Formation in the Ordos Basin and the Cretaceous Nenjiang Formation in the Songliao Basin were utilized. This model is based on the TOC content, vitrinite reflectance (Ro), hydrocarbon generation potential, residual hydrocarbon volume, and fluid pressure; thus, it can be applied to most areas and provides a reliable guideline for estimating recoverable hydrocarbons through the in situ conversion of immature to low–moderate-maturity shales. According to the shale distribution on the global scale and related parameters, the estimated global recoverable oil reserves through the in situ conversion of immature to low–moderate-maturity shale should be approximately 1.4 × 10¹² t, and the estimated global recoverable natural gas resources amount to approximately 1.1 × 10¹⁵ cubic meters. The estimated recoverable oil resources in China exceed 7 × 10¹⁰ t, and the estimated recoverable natural gas resources are more than 6.5 × 10¹³ cubic meters. Finally, a criterion is proposed based on the results from the Nenjiang Formation in the Songliao Basin as an example for the selection of the best target layer.

2. Samples and Experimental Methods

The recoverable hydrocarbons from the in situ conversion of immature to low–moderate-maturity shale include hydrocarbons generated via the thermal decomposition of convertible organic matter, hydrocarbons generated via the thermal decomposition of the residual oil in the shale, and the natural gas retained in the shale. In this study, we established a method for evaluating the amount of recoverable hydrocarbons based on the in situ thermal simulation and conversion of material experiments.

2.1. Samples

The samples used in the in situ conversion thermal simulation experiments conducted in this study are both bulk shale and crude oil.

2.1.1. Shale Samples

The shale samples were collected from the Triassic Yanchang Formation 73 in the Ordos Basin and the Cretaceous Nenjiang Formation in the Songliao Basin. Detailed information about the samples is presented in Table 1, and details regarding the procedures for measuring these values can be found in our previous paper [21]. The shale samples from the Nenjiang Formation were collected near the Nongan area, which is in the southern part of the Songliao Basin (Figure 1). The burial depths of the samples were 233 to 246 m, and five shale samples with different TOC contents were selected for the experiments. The samples were crushed to 40 to 60 mesh, and then the selected samples were mixed thoroughly and were separated into several portions. Detailed information about the crushed samples is summarized in Table 2, following the methods previously used on samples in Table 1.

2.1.2. Crude Oil Samples

The crude oil samples used in the in situ conversion thermal simulation experiments conducted in this study were collected from five different locations, including the Bohai Bay Basin, Ordos Basin, and Junggar Basin in China. The densities of the liquid oil were 0.85 g/cm3, 0.87 g/cm3, 0.92 g/cm3, 0.95 g/cm3, and 1.06 g/cm3.

2.2. Experimental Setup and Procedure

In this study, the experimental setup and procedure used for the thermal simulation experiments on the crude oil and the Nenjiang Formation shale samples were the same as those for the Yanchang Formation 73 shale samples, which are fully explained in our previous study [21].

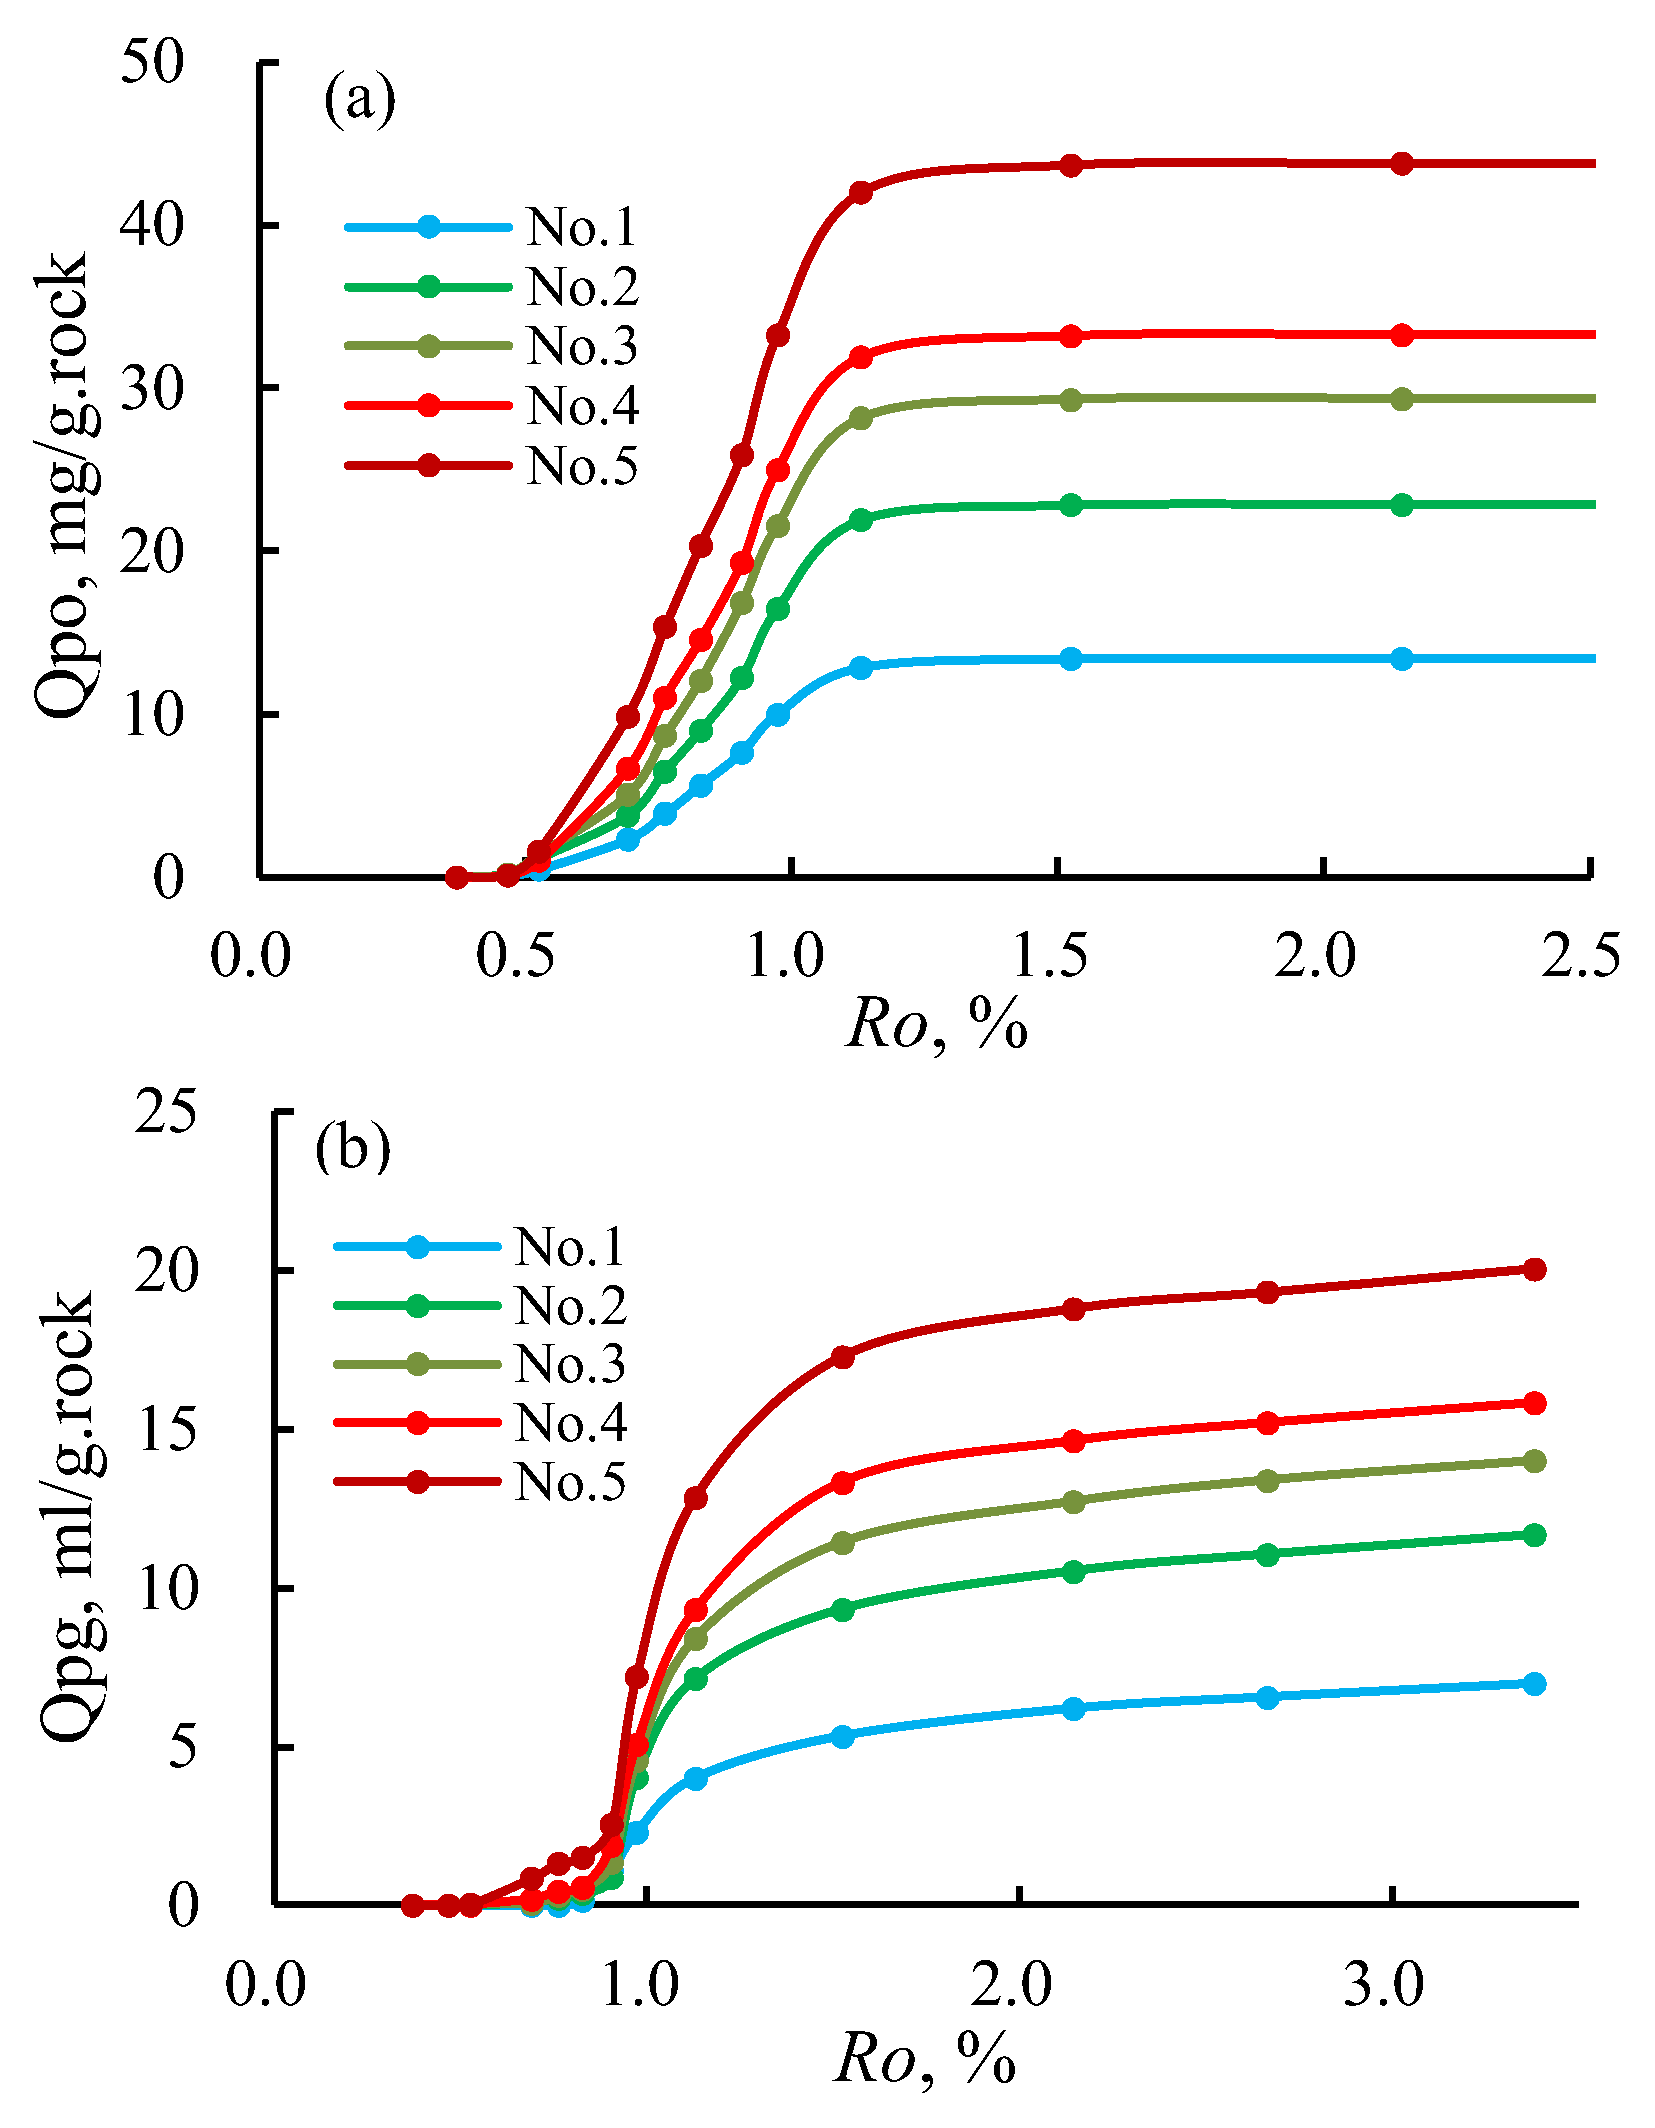
2.2.1. Temperature and Thermal Simulation Experiment for Hydrocarbon Production

During the thermal simulation experiments, the fluid pressure was set to 5 MPa (725 Psi), and the hydrocarbon venting pressure was set to 7 MPa (1025 Psi). The temperature was increased at a rate of 20 °C/d until each preset temperature was reached (first temperature point set to 200 °C), and the samples were heated to the preset temperature at a rate of 5 °C/d. Then, a constant temperature was maintained for 10 h. The thermal simulation experiments were conducted on the five shale samples from the Nenjiang Formation in the Songliao Basin. The residual TOC, RO, and hydrocarbon yield are reported in Table 3.

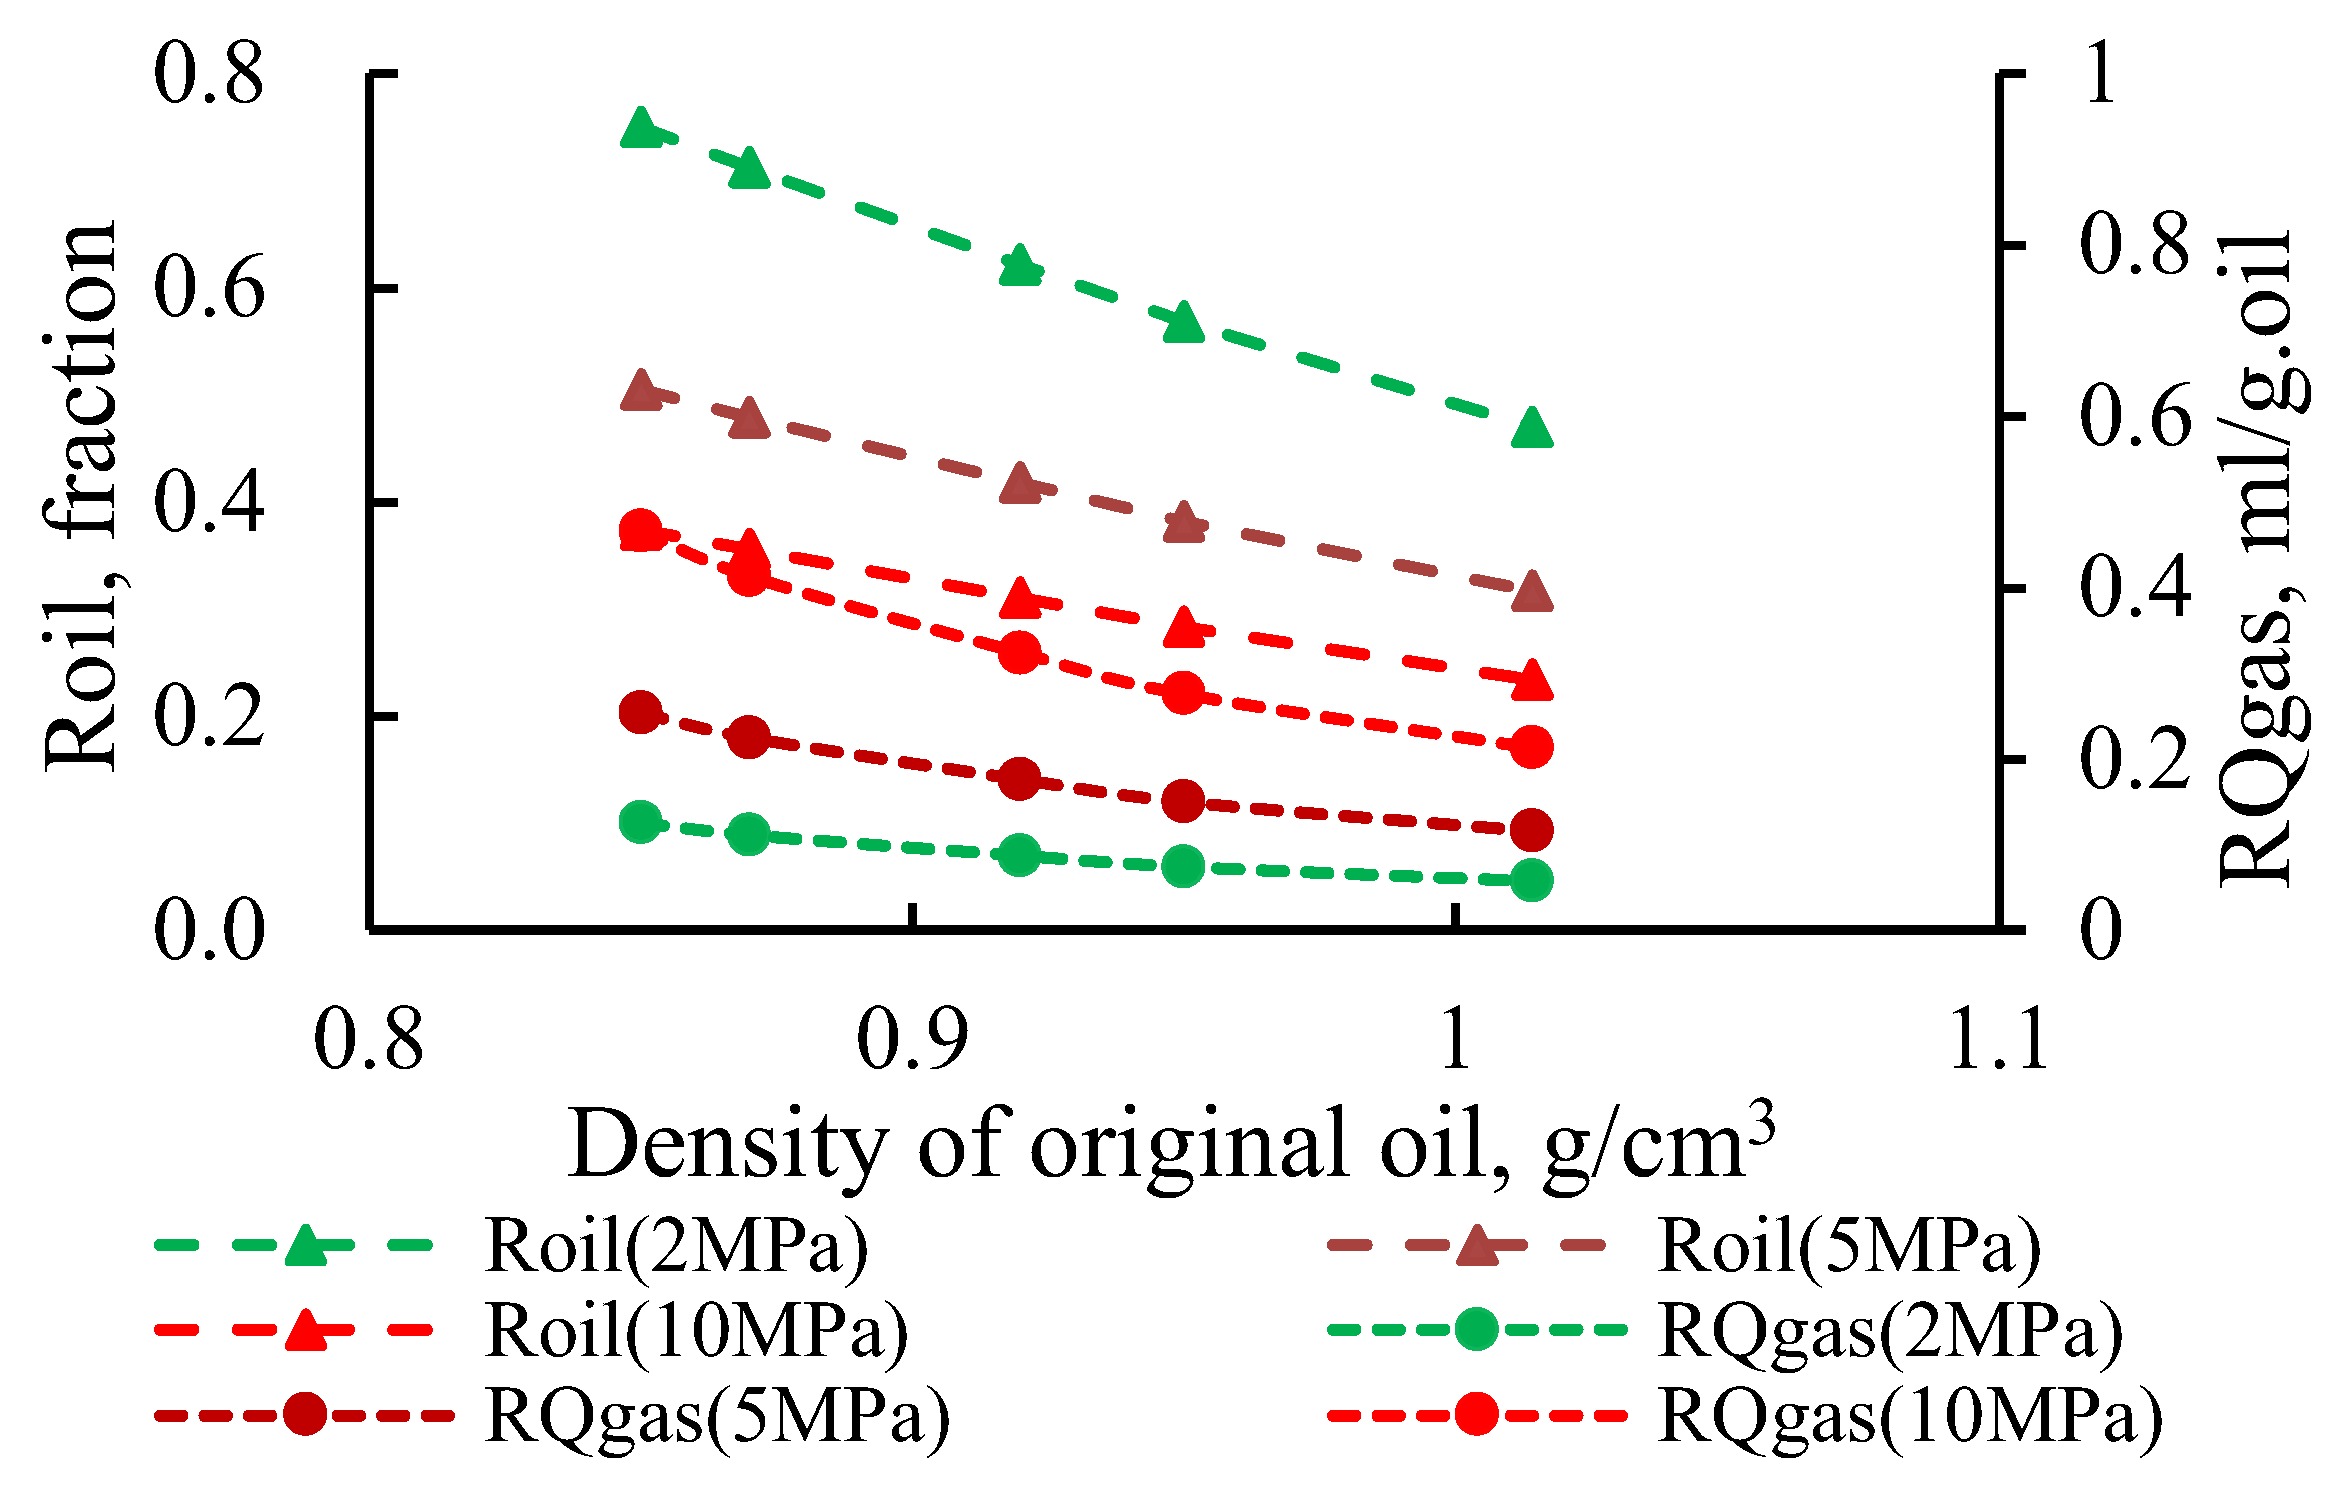
2.2.2. Fluid Pressure and Thermal Simulation Experiment for Hydrocarbon Production

Five fluid pressure levels were set during the experiments: 0 MPa (0 Psi), 0.7 MPa (100 Psi), 1.7 MPa (250 Psi), 3.5 MPa (500 Psi), and 5 MPa (725 Psi). The temperature was increased at a rate of 20 °C/d until it reached 200 °C, and the samples were heated to the preset temperature of 425 °C at a rate of 5 °C/d. Then, the samples were kept at a constant temperature for 10 h. The original geochemical parameters of the shale samples and the hydrocarbon production from the experiments under different fluid pressure conditions are summarized in Table 4.

2.2.3. In Situ Crude Oil Conversion Thermal Simulation Experiment for Hydrocarbon Production

In order to determine the contribution of the residual oil to the hydrocarbons produced during in situ conversion, first, we heated the shale samples to 800 °C and maintained this temperature for 48 h. Second, the cooled sample residues were extracted using dichloromethane, and the extracted residue was heated at 80 °C for 48 h. Finally, the crude oil was mixed with the residues at a mass of 5 wt.%, and then the temperature was increased at a rate of 5 °C/d while the fluid pressure was set to 2 MPa (290 Psi), 5 MPa (725 Psi), and 10 MPa (1450 Psi).

3. Results and Discussion

3.1. Relationship between Temperature and Ro in Thermal Simulation Experiment

The Ro values of the shale samples at different thermal simulation temperatures were measured for all samples from the Nenjiang Formation following each step of the thermal simulation experiments. It was found that there is a strong positive exponential correlation between Ro and the thermal simulation temperature (Figure 1). In addition, a relationship between Ro and the temperature (Equation (1)) was established, which is necessary for defining the hydrocarbon generation model.
R o = a 1 × e a 2 T ,
where Ro is vitrinite reflectance (%); T is the thermal simulation temperature (°C); and a1 and a2 are empirical coefficients with values of 0.1356 and 5.692 × 10⁻³, respectively.

3.2. Method of Evaluating Hydrocarbon Production via In Situ Conversion of Solid Organic Matter in Shale

The extraction target of in situ conversion is shale with a certain burial depth and thermal maturity. The organic matter in shale consists of solid organic matter that can be converted into hydrocarbons and retained hydrocarbons, which are transformed into light oil and natural gas and can be extracted during the conversion processes. The amount of extracted light oil and natural gas can be defined as the recoverable hydrocarbons and can also be considered the hydrocarbon yield in thermal simulation experiments. Therefore, the hydrocarbons produced via the in situ conversion of immature to low–moderate-maturity shale include both solid organic matter and retained hydrocarbons.

3.2.1. Basic Model for Evaluating Hydrocarbon Production via In Situ Conversion of Solid Organic Matter

The shale samples used in the thermal simulation experiments should have been influenced by the storage period and the crushing method. Due to the complete loss of the retained hydrocarbons in the shale, the hydrocarbon yield obtained in the thermal simulation experiments was considered to be mainly from solid organic matter. The results of the thermal simulation experiments conducted in this study indicate that the hydrocarbon yields from the in situ conversion of solid organic matter in different types of shale were consistent with the variations in Ro; that is, the hydrocarbon yield decreased as Ro increased. The relationship between Ro and the hydrocarbon yield via the in situ conversion of the shale of the Nenjiang Formation is shown in Figure 2, and the relationship between the hydrocarbon produced and Ro is shown in Figure 3. For the same Ro value, there are differences in the hydrocarbon yield and gas–oil ratio of the shale samples with different TOC contents and organic matter types.
Based on the experimental results obtained from 99 different groups from nine shale samples retrieved from the 73 shale of the Yanchang Formation in the Ordos Basin, a model for estimating the hydrocarbon yield via the in situ conversion of solid organic matter based on the TOC and Ro was established. Equations (2) and (3) represent the cumulative oil and gas produced, respectively:
Q p o = b 1 × b 2 R o 2 + b 3 R o + b 4 T O C + b 5 R o 2 + b 6 R o + b 7 ,
where Q p o is cumulative oil production via the in situ conversion of solid organic matter (mg/g rock); Ro is the vitrinite reflectance (%); TOC is total organic carbon content (wt.%); and b1, b2, b3, b4, b5, b6, and b7 are empirical coefficients with values of 2.319, 18.872, −22.784, 6.904, −6.507, 4.303, and −0.632, respectively.
The proposed model for gas production via the in situ conversion of solid organic matter is as follows:
Q p g = b 8 × b 9 R o 2 + b 10 R o + b 11 T O C + b 12 l n R o + b 13 ,
where Q p g is cumulative gas production via the in situ conversion of solid organic matter (mL/g rock); Ro is the vitrinite reflectance (%); TOC is the total organic carbon content (wt.%); and b8, b9, b10, b11, b12, and b13 are empirical coefficients with values of 1.59231, 1.6821, −1.9765, 0.5819, −0.7199, and −0.3481, respectively.

3.2.2. Method for Correcting Influence of Fluid Pressure on Hydrocarbon Production via In Situ Conversion

The results of the thermal simulation experiments from solid organic matter under different fluid pressure conditions suggest that the fluid pressure can control the final hydrocarbon production. Under the same conditions, oil production decreased and gas production increased as the fluid pressure increased (Figure 4); therefore, the impact of fluid pressure has to be considered when evaluating hydrocarbon production via the in situ conversion of solid organic matter. Based on the results, a model for correcting the impact of fluid pressure on hydrocarbon production was developed (Equations (4) and (5)). This model provides a theoretical basis for controlling the bottom-hole pressure of the heating wells, increasing oil production, decreasing gas production, and improving the efficiency of the operation as a whole.
The model for correcting the influence of the fluid pressure on oil production from solid organic matter can be expressed as follows:
P R o i l = c 1 e c 2 P .
The model for correcting the influence of the fluid pressure on gas production from solid organic matter can be expressed as follows:
P R g a s = c 3 P + c 4 .
In these equations, P R o i l represents the fluid pressure correction coefficient for oil production; P R g a s is the fluid pressure correction coefficient for gas production; P is the fluid pressure (MPa); and c1, c2, c3, and c4 are empirical coefficients with values of 3.1524, −0.2445, 0.1144, and 0.428, respectively.

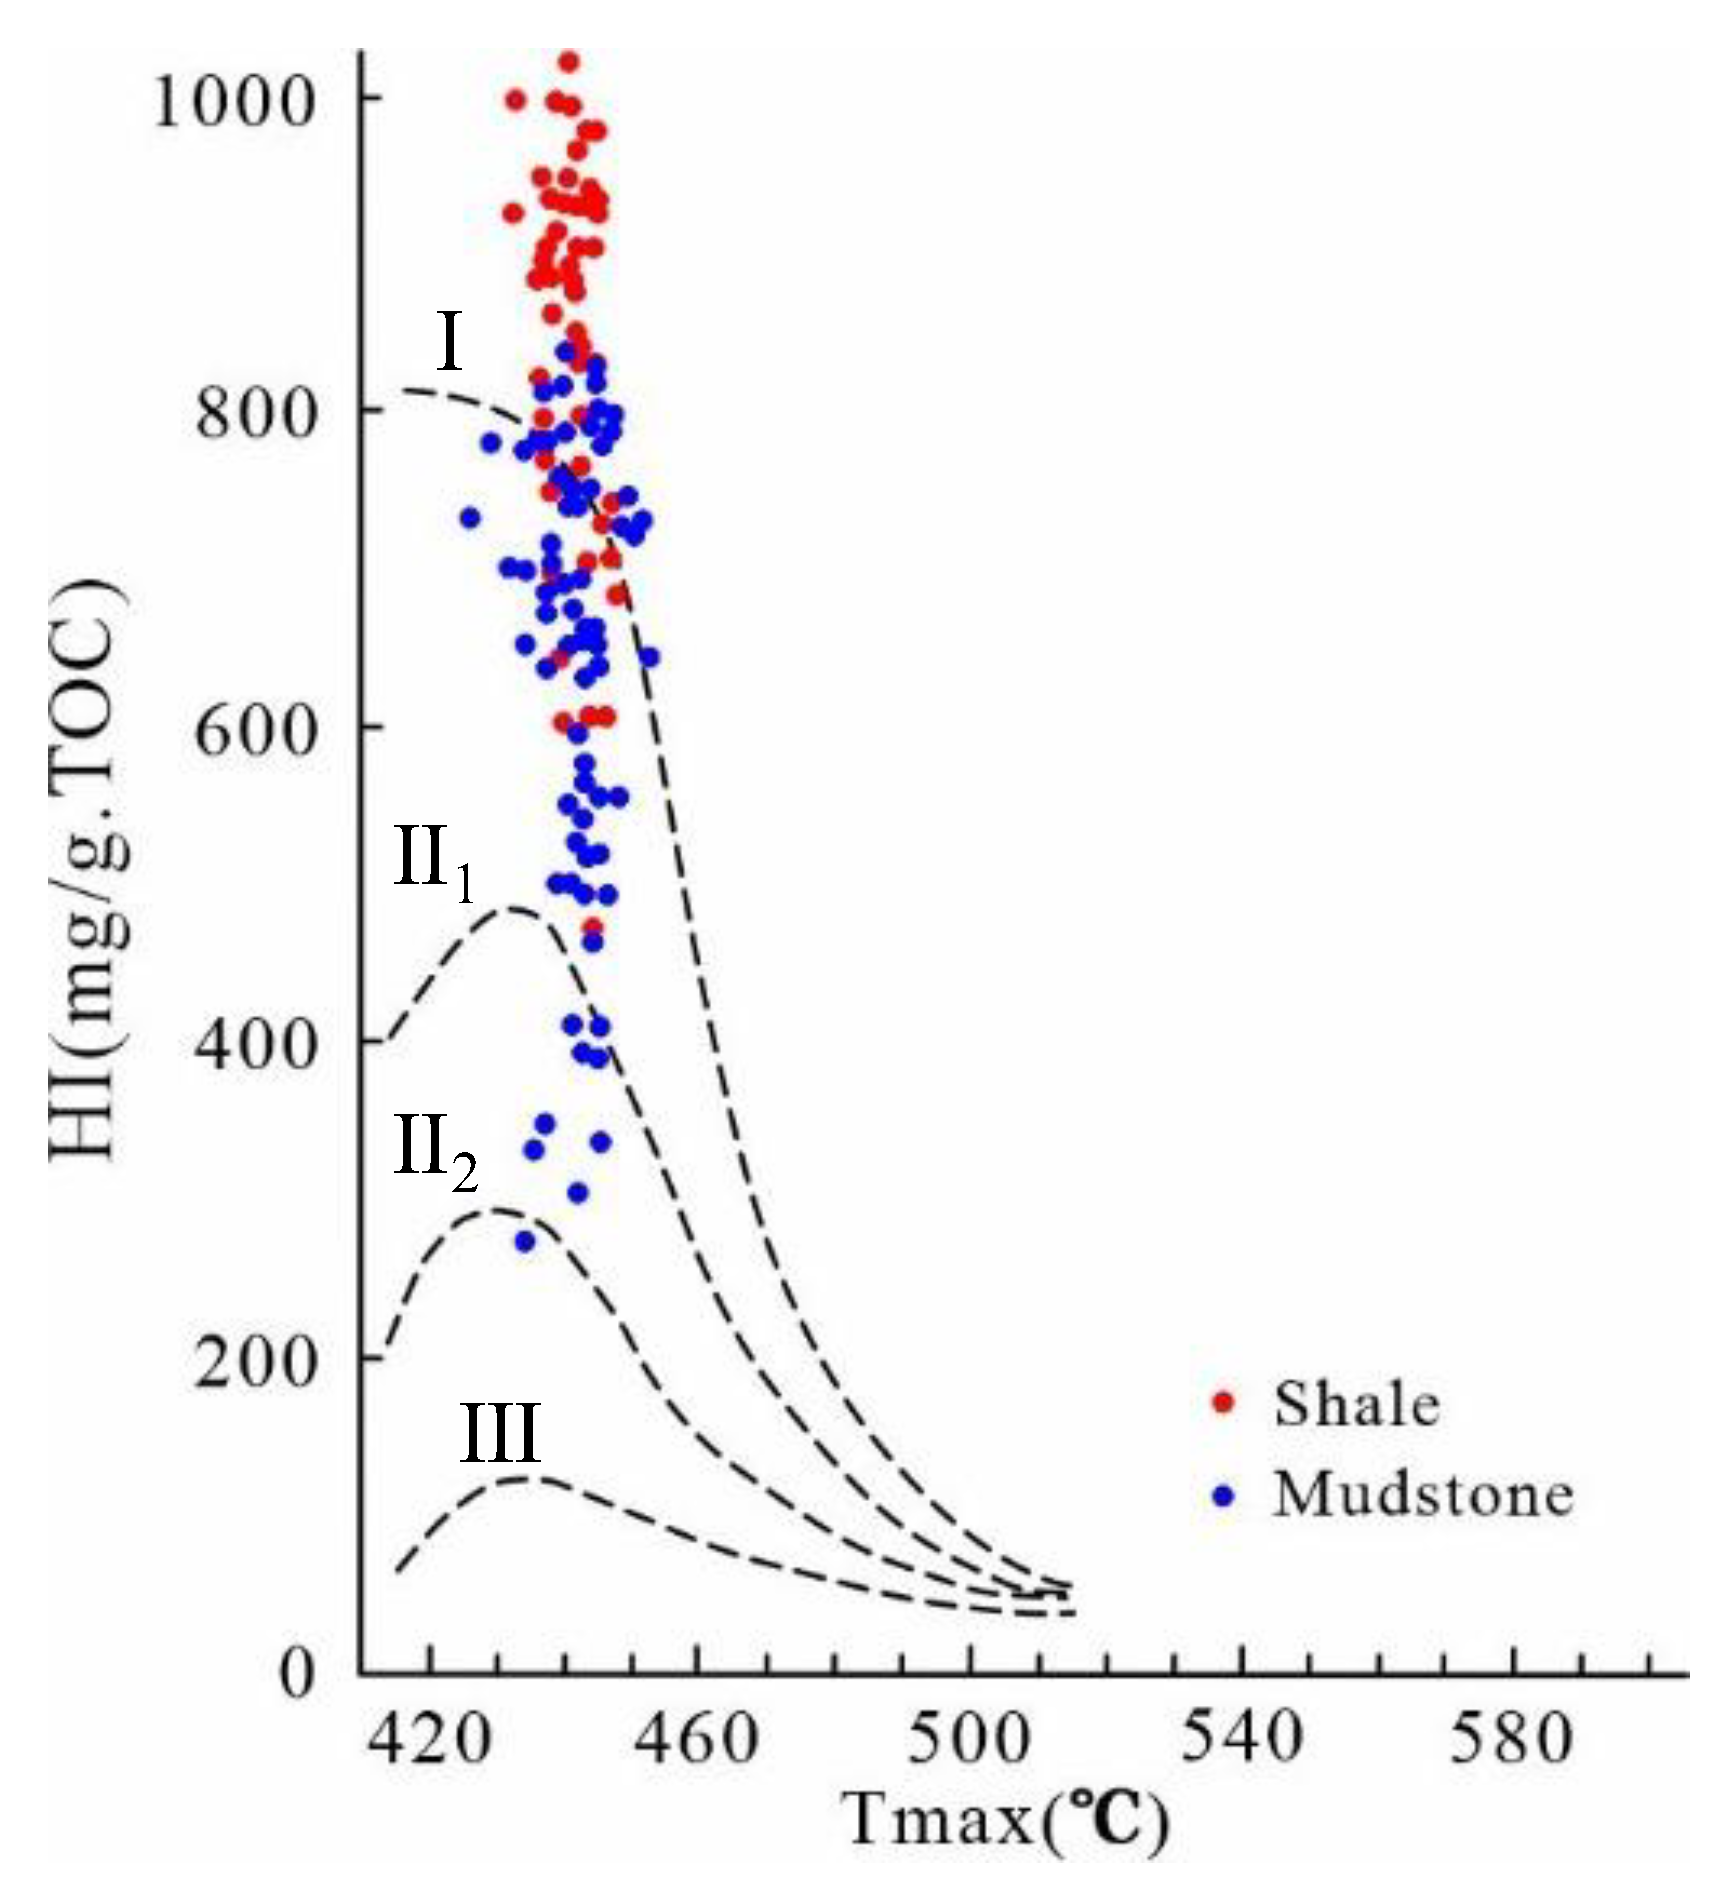
3.2.3. Method for Correcting Hydrocarbon Generation Potential of Shale

Due to differences in the hydrocarbon generation potentials of shale samples containing different types of organic matter under the same thermal simulation conditions, discrepancies in the hydrocarbon yield during the in situ conversion process should be expected. Therefore, it is necessary to consider the effect of the variability in organic material on the results. Based on the Fischer assay run on the samples, the hydrocarbon yield from the shale samples with varying thermal maturities and the hydrocarbon yield per unit mass of the total organic carbon content were obtained. This notion is presented in relationships for the amount of oil (Equation (6)) and the amount of gas (Equation (7)) as follows:
Q F A O T = d 1 R o 2 + d 2 R o + d 3 ,
where Q F A O T represents oil production per unit mass of total organic carbon content (mg/g TOC); Ro is the vitrinite reflectance (%); and d1, d2, and d3 are empirical coefficients with values of −11.932, 9.891, and 6.181, respectively.
Q F A G T = d 4 R o 2 + d 5 R o + d 6 ,
where Q F A G T is gas production per unit volume of total organic carbon content (mL/g TOC); Ro is the vitrinite reflectance (%); and d4, d5, and d6 are empirical coefficients with values of −4.039, 4.641, and 0.707, respectively.

3.2.4. Corrected Model for Evaluating Hydrocarbon Production via In Situ Conversion of Solid Organic Matter

The model for hydrocarbon production via the in situ conversion of solid organic matter can be applied in most areas by considering the effects of fluid pressure and different types of organic matter (Equations (8) and (9)) as follows:
Q p o c = P R o i l × Q F A O T o Q F A O T o a × Q p o ,
where Q p o is the uncorrected cumulative oil yield obtained via the in situ conversion of organic matter (mg/g rock); Q p o c is the corrected cumulative oil yield obtained via the in situ conversion of organic matter (mg/g rock); P R o i l is a fluid pressure correction coefficient for oil production; Q F A O T o is oil production per unit mass of total organic carbon content in the target layer of shale (mg/g TOC); and Q F A O T o a is oil production per unit mass of total organic carbon content for the shale sample used in the thermal simulation experiments used to establish the in situ conversion oil production evaluation model (mg/g TOC). A similar approach can be followed to generate an equation for gas yield as follows:
Q p g c = P R g a s × Q F A G T o Q F A G T o a Q p g ,
where Q p g is the uncorrected cumulative gas production via the in situ conversion of organic matter (mL/g rock); Q p g c is corrected cumulative gas production via the in situ conversion of organic matter (mL/g rock); P R g a s is a fluid pressure correction coefficient for gas production; Q F A G T o is the oil production per unit mass of total organic carbon content in the target shale layer (mg/g TOC); Q F A G T o a is the oil production per unit mass of total organic carbon content of the shale sample used in the thermal simulation experiments used to establish the in situ conversion model (mg/g TOC).

3.3. Method for Evaluating Contribution of Residual Hydrocarbons to Hydrocarbon Production via In Situ Conversion

Residual hydrocarbons exist in immature to low–moderate-maturity shales, which contribute to hydrocarbon production via in situ conversion. In order to evaluate the contribution of residual hydrocarbons to the final output, it is necessary to determine the amount of residual hydrocarbons.

3.3.1. Method for Evaluating Residual Hydrocarbon Reserves

The basic principle of evaluating the contribution of residual hydrocarbons to the final product of in situ conversion is accurately determining its amount. It is difficult to establish a reliable model for evaluating residual hydrocarbons using those that naturally evolved in shale samples due to the effects of measurement errors and limitations of Ro on the distribution of residual hydrocarbons in the samples. In this study, a model was established using the residual hydrocarbon amounts obtained from the thermal simulation experiments on the shale samples. Moreover, the obtained residual hydrocarbon amounts indicate that the residual oil initially increased and then decreased, and the residual gas increased with increasing Ro (Figure 5). This model is based on the relationships between the residual hydrocarbon amounts and the TOC and Ro (Equations (10) and (11)). In addition, in this study, the target shale layer for in situ conversion is immature to low–moderate-maturity shale, and the Ro values for samples exposed to thermal simulation are less than 0.9%.
The model for assessing the residual oil amount is
Q r o = V s V f × f 1 e f 2 T O C R o 2 + f 3 e f 4 T O C R o + f 5 e f 6 T O C TOC ,
where Q r o is the residual oil amount (mg/g rock); TOC is the total organic carbon content (wt.%); Ro is the vitrinite reflectance (%); V s is the volume of residual oil per unit mass under the pressure and temperature conditions of the thermal simulation experiment (m3); V f is the volume of the residual oil per unit mass under the reservoir pressure and temperature conditions (m3); and f1, f2, f3, f4, f5, and f6 are empirical parameters with values of −54.832, 0.2306, 98.205, 0.2265, −36.58, and 0.2192, respectively.
The model for obtaining the residual gas amount is
Q r g = V s V f × f 7 e f 8 T O C T O C R o f 9 + f 10 T O C ,
where Q r g is the residual gas amount (mL/g rock); TOC is the total organic carbon content (wt.%); Ro is the vitrinite reflectance (%); V s is the volume of residual gas per unit mass under the pressure and temperature conditions of the thermal simulation experiment (m3); V f is the volume of residual gas per unit mass under the reservoir pressure and temperature conditions (m3); and f7, f8, f9, and f10 are empirical parameters with values of 2.7565, 0.2312, 6.586, and 2.4555, respectively.

3.3.2. Method for Evaluating Contribution of Residual Hydrocarbons to Hydrocarbon Production via In Situ Conversion

Due to variations in the properties of residual oil in shales with different thermal maturity levels, the results of thermal simulation experiments on shales with different crude oil densities were also analyzed in this study. The results confirmed the contribution of residual oil with different properties to the overall hydrocarbons produced during in situ conversion. Moreover, the thermal simulation experiments conducted in this study revealed that the hydrocarbon yield is related to the crude oil density and fluid pressure (Figure 6), while the heating rate has a relatively small impact on the total hydrocarbons produced.
In this study, five crude oil samples were used in the thermal simulation experiments. In addition, a model for obtaining the ratio of oil produced to the original oil consumption during thermal simulation, as well as the amount of produced gas per unit mass of the original oil consumption, was established.
The model for assessing the ratio of oil produced to the original oil consumed is
R o i l = g 1 × P g 2 × ρ o g 3 .
The model for obtaining the amount of produced gas per unit mass of the original oil consumed is defined as
R Q g a s = g 4 × P × ρ o g 5 + g 6 .
In these equations, R o i l is the ratio of oil production to the original oil consumption (mL/g oil); R Q g a s is gas production per unit mass of the original oil consumption (mL/g gas); ρ o is the oil density during the thermal simulation (g/cm3); P is the fluid pressure (MPa); and g1, g2, g3, g4, g5, and g6 are empirical coefficients with values of 0.6645, −0.432, −2.643, 0.02045, −4.44, and 0.0193, respectively.
The amount of residual gas can be considered the gas produced since there will not be any further cracking of gas during the in situ conversion process.
This study involved conducting thermal simulation experiments with different densities of crude oil under varying fluid pressure conditions. Based on the experimental results, a method was established to evaluate the proportion of retained oil produced and the volume of retained gas produced during the shale in situ conversion process. Using the established models, the output of retained oil and gas in shale during in situ conversion can be evaluated based on the density of the retained oil and the fluid pressure. The method is applicable for evaluating the output of retained oil and gas during in situ shale conversion under conditions where the density of retained oil in shale ranges from 0.85 to 1.06 g/cm3 and fluid pressure ranges from 2 to 10 MPa.

3.4. Method for Evaluating Recoverable Hydrocarbon Reserves via In Situ Conversion of Immature to Low–Moderate-Maturity Shale

3.4.1. Model for Evaluating In Situ-Converted Recoverable Hydrocarbons Per Unit Mass of Shale

The final product from the in situ conversion of immature to low–moderate-maturity shale samples consists of three components: hydrocarbons generated via the thermal decomposition of solid convertible organic matter in the shale, hydrocarbons generated via the thermal decomposition of residual oil in the shale, and natural gas generated via heating of residual gas in the shale.
The model for measuring the amount of oil produced per unit mass during the in situ conversion of shale is
Q o i l = Q p o c + Q r o × R o i l ,
where Q o i l is the recoverable oil per unit mass of shale (mg/g rock); Q p o c is the corrected cumulative oil produced via the in situ conversion of solid organic matter in the shale (mg/g rock); Q r o is the amount of residual oil per unit mass (mg/g rock); and R o i l is the proportion of oil produced via in situ conversion per unit mass of residual oil.
The model for obtaining the amount of recoverable gas per unit mass via the in situ conversion of shale is
Q g a s = Q p g c + Q r o × R Q g a s + Q r g ,
where Q g a s is the recoverable gas amount per unit mass of shale (mL/g rock); Q p g c is the corrected cumulative gas produced as a result of the in situ conversion of solid organic matter in the shale (mL/g rock); Q r g is the residual gas per unit volume (mL/g rock); Q r o is the residual oil per unit mass (mg/g rock); and R Q g a s is the in situ-converted gas per unit volume of residual oil (mL/g oil).

3.4.2. Model for Evaluating the Abundance of In Situ-Converted Recoverable Hydrocarbons

The abundance (quantity in the area under operation) of recoverable hydrocarbons per square kilometer area can be calculated as follows:
A O R = 10 7 Q o i l × H s h a l e × ρ s h a l e ,
A G R = 10 8 Q g a s × H s h a l e × ρ s h a l e ,
where A O R is the abundance of recoverable oil (104 t/km2); A G R is the abundance of recoverable gas (108 m3/km2); Q o i l is the recoverable oil per unit mass of the in situ-converted shale (mg/g rock); Q g a s is the recoverable gas per unit volume of the in situ-converted shale (mL/g rock); ρ s h a l e is the density of the shale (g/cm3); and Hshale is the thickness of the in situ-converted shale layer (m).

3.4.3. Method for Determining Lower Limits of Recoverable Oil Reserves for In Situ Conversion

(1)
The method for determining the lower limit of recoverable oil reserves
The minimum rate of return on investment (IRRcut_off) can be determined using the investment return affordability, which infers what return level is affordable or feasible for the investor or operator to fulfill this operation. According to the average values of the fixed investment, operating costs, taxes, reclamation costs, abandonment costs, sunk costs, hydrocarbon sale prices, and commodity rates for a production cycle, the lower limit for the amount of recoverable oil reserves (EUR_BOEcut_off) to make the operation economically feasible can be obtained as follows:
E U R _ B O E c u t _ o f f = i n 1 + I R R c u t _ o f f i C a p e x i + O p e x i + D c t i + S C i + R f i C R o i l i P o i l _ i T a x o i l _ i + C R g a s _ i P g a s _ i T a x g a s _ i ,
where EUR_BOEcut_off is the economic lower limit of the amount of recoverable oil (104 t); Capexi represents the average fixed investment for year i (USD); Opexi represents the average operating costs for year i (USD); Dcti represents the average abandonment costs for year i (USD); SCi represents the average sunk costs for year i (USD); Rfi represents the average reclamation costs for year i (USD); CRoil_i represents the average commodity rate for oil production for year i; CRgas_i represents the average commodity rate for gas production for year i; Poil_i is the average oil sales price for year i (USD/104 t); Pgas_i is the average gas sales price for year i (USD/104 t); Taxoil_i is the average tax per unit oil production for year i (USD/104 t); Taxgas_i is the average tax per unit gas production for year i (USD/104 t); n is the production period (year); and IRRcut_off is the lower limit value of the rate of return on investment.
(2)
The method for determining the lower limit of recoverable oil reserves per unit mass of rock
The lower limit of the amount of recoverable oil per unit mass of rock can be determined using Equation (19), which is based on the effective heated rock volume, the rock density, and the economic lower limit of the amount of recoverable oil:
Q B O E _ c u t _ o f f = 10 7 E U R _ B O E c u t _ o f f V r o c k × ρ r o c k ,
where Q B O E _ c u t _ o f f is the lower limit of recoverable oil per unit mass of rock (mg/g rock); E U R _ B O E c u t o f f is the economic lower limit of recoverable oil for a well group (104 t); V r o c k is the effective rock volume heated by a well group (m3); and ρ r o c k is the density of the effective heated rock (g/cm3).

3.4.4. Method for Determining Favorable Layers for In Situ Conversion

When heating favorable layers during the in situ conversion process, the average recoverable oil per unit mass of rock must exceed the economic lower limit in order to achieve efficient extraction. This basis can be used to determine the favorable layers for in situ conversion.

3.4.5. Method for Determining Favorable Areas for In Situ Conversion

The lower limit for carrying out in situ conversion in shale layers containing immature to low–moderate-maturity organic matter can be determined based on developed equations and costs associated with the process. Moreover, areas where the amount of recoverable oil is not less than the lower limit threshold can be defined as favorable areas.

3.5. Evaluation of Recoverable Hydrocarbon Reserves in the Nenjiang Formation in the Songliao Basin

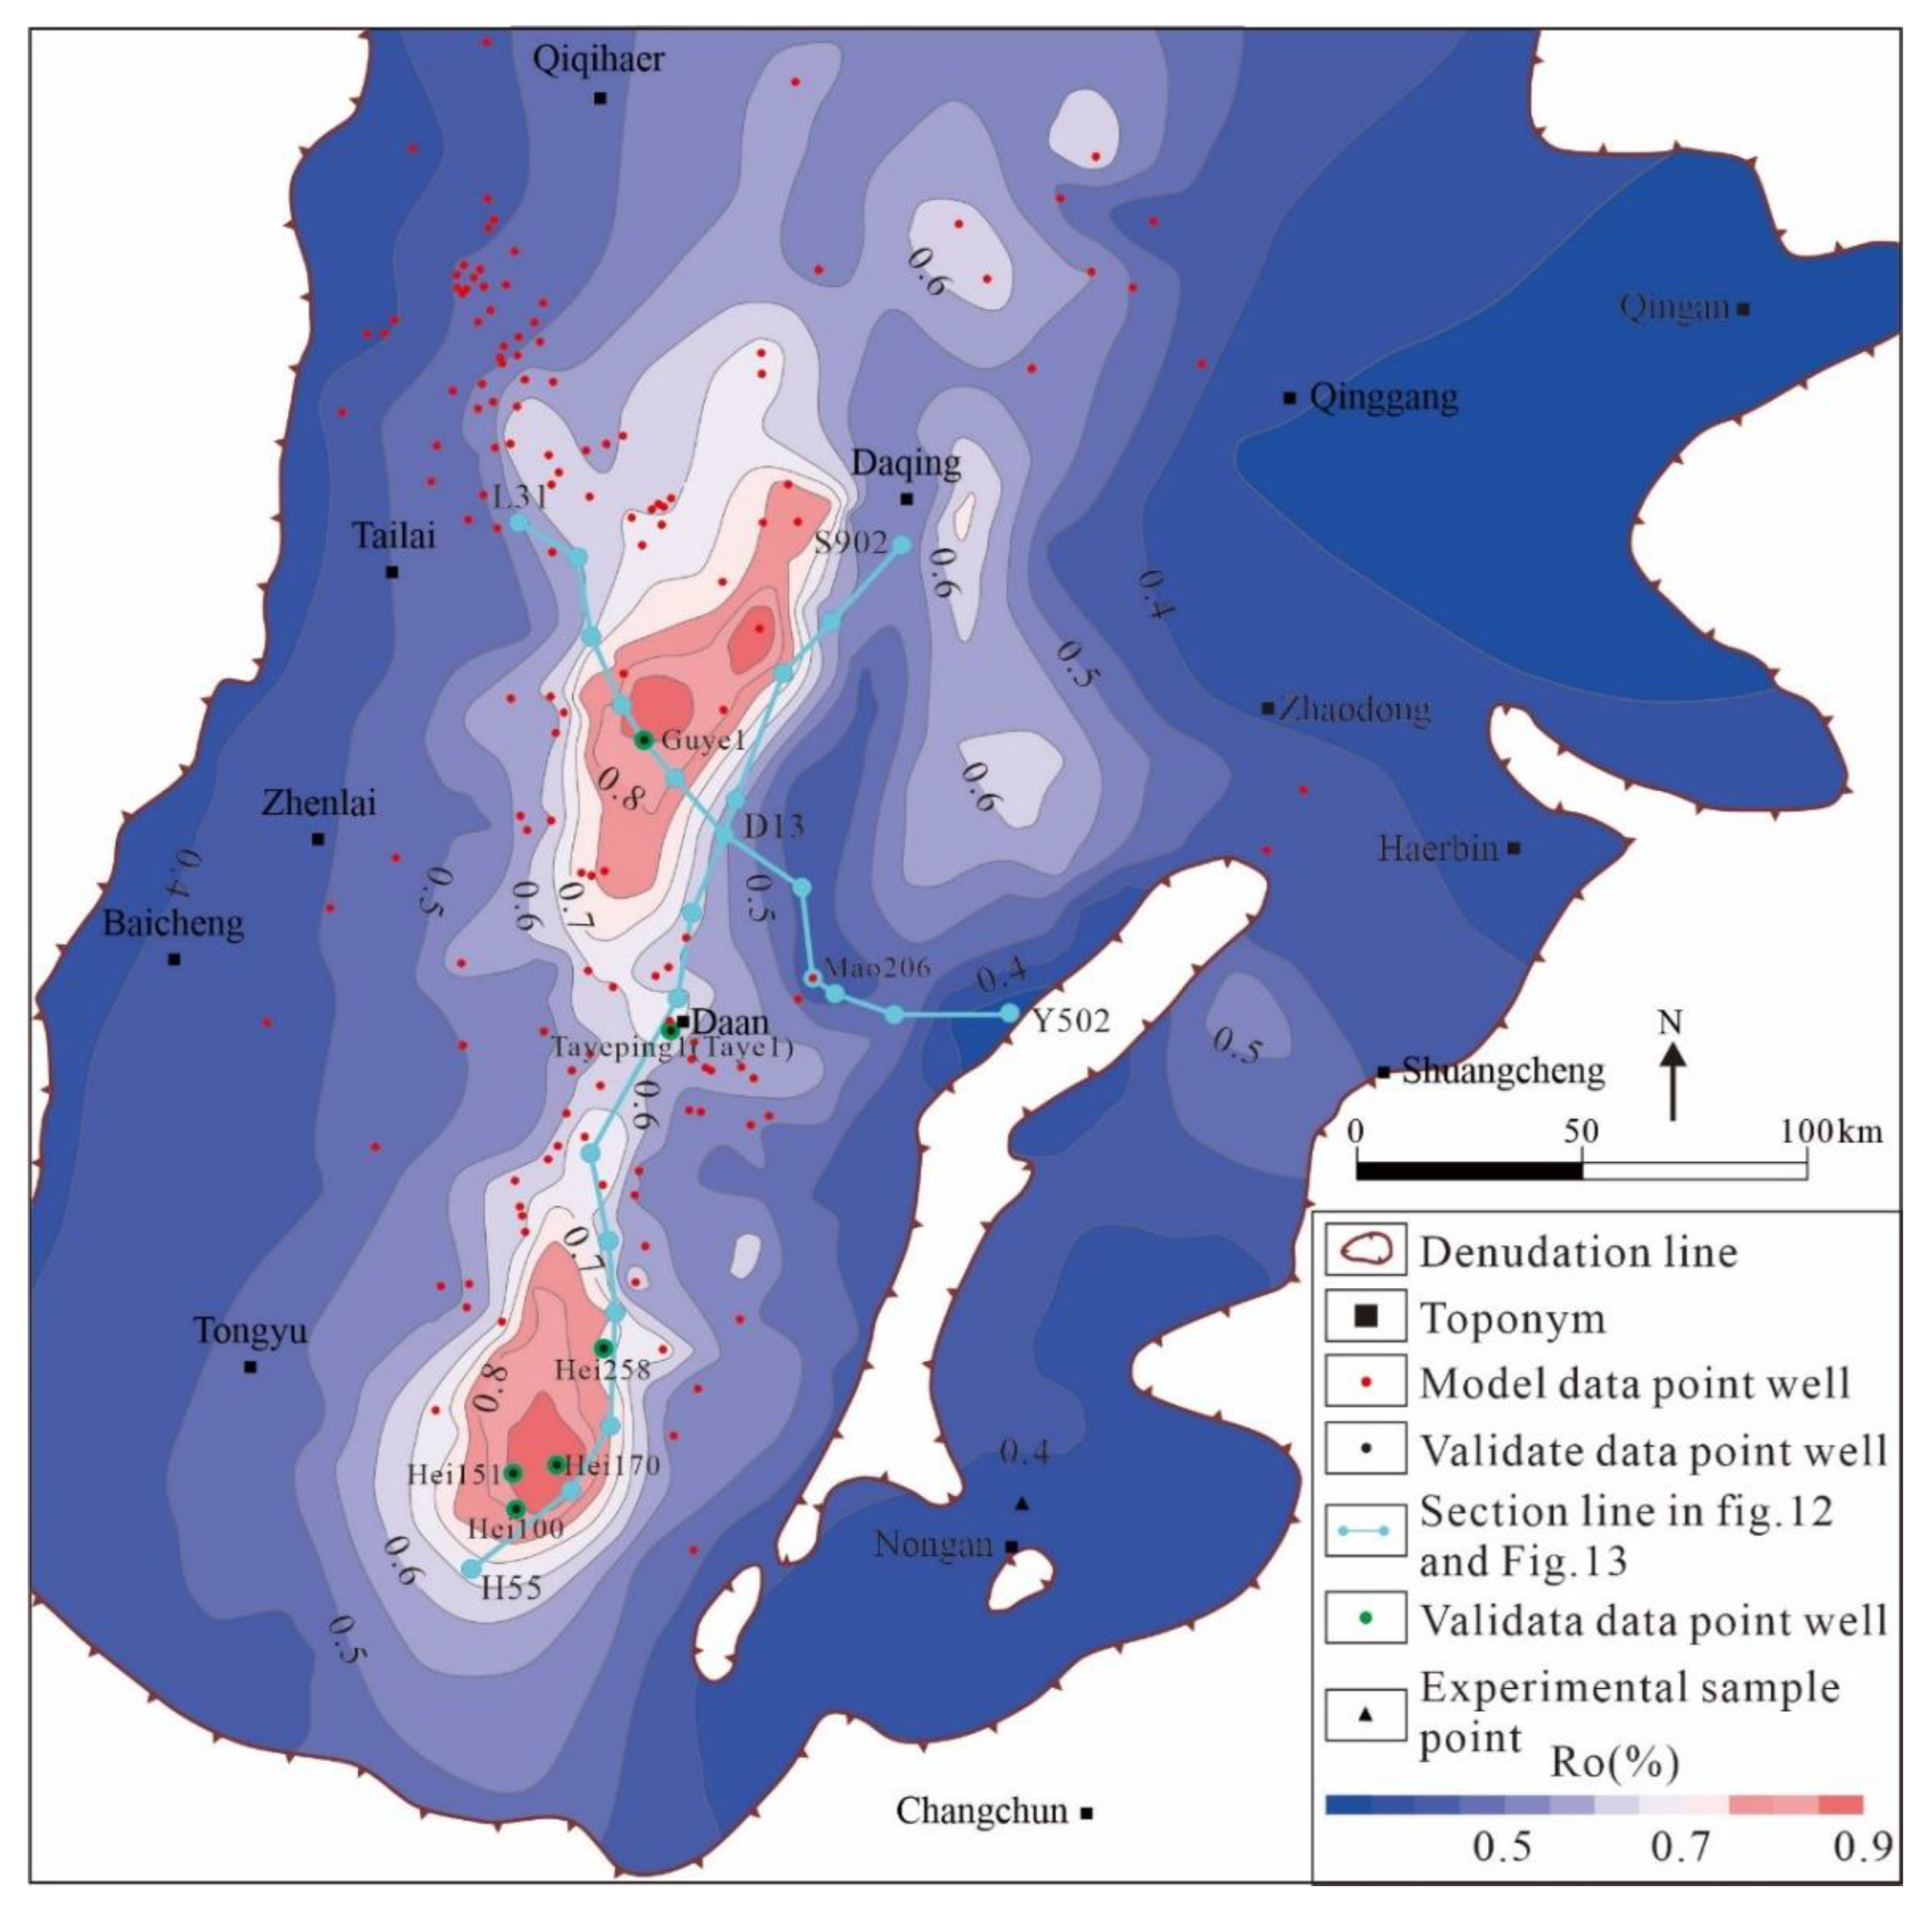
3.5.1. Geologic Background

The Songliao Basin is located in the northeastern part of China. It is bounded by the Greater Hinggan Mountains to the west, the Lesser Hinggan Mountains to the northeast, and the Changbai Mountains to the east [22,23,24]. Moreover, it is rhomboid-shaped, trends north–northeast, covers an area of 26 × 104 km2, has a length of 750 km from north to south, and has a width of 350 km from west to east. In addition, it is a large-scale continental rift basin that developed in the Cenozoic [23,24]. The basin is divided into six first-order structural units: the Northern Plunge Zone, Central Downwarp Zone, Northeastern Uplift Zone, Southeastern Uplift Zone, Southwestern Uplift Zone, and Western Slope Zone [22,23,24]. The basin evolution can be subdivided into pre-rift doming, syn-rift subsidence, post-rift thermal subsidence, and structural inversion stages [23,24,25]. The Cretaceous Nenjiang Formation can be divided into five sections [25,26], which were deposited in a large-scale lacustrine environment characterized by semi-deep to deep lakes with a subtropical semi-humid climate. Furthermore, the first section was developed in a reducing sedimentary environment in a brackish–slightly brackish lake, and the second section was developed in a reducing depositional environment in a slightly brackish–freshwater lake [27,28,29,30]. The organic matter consists of type I-II1 kerogen and is predominantly type I kerogen (Figure 7).

3.5.2. Key Parameters for In Situ Conversion
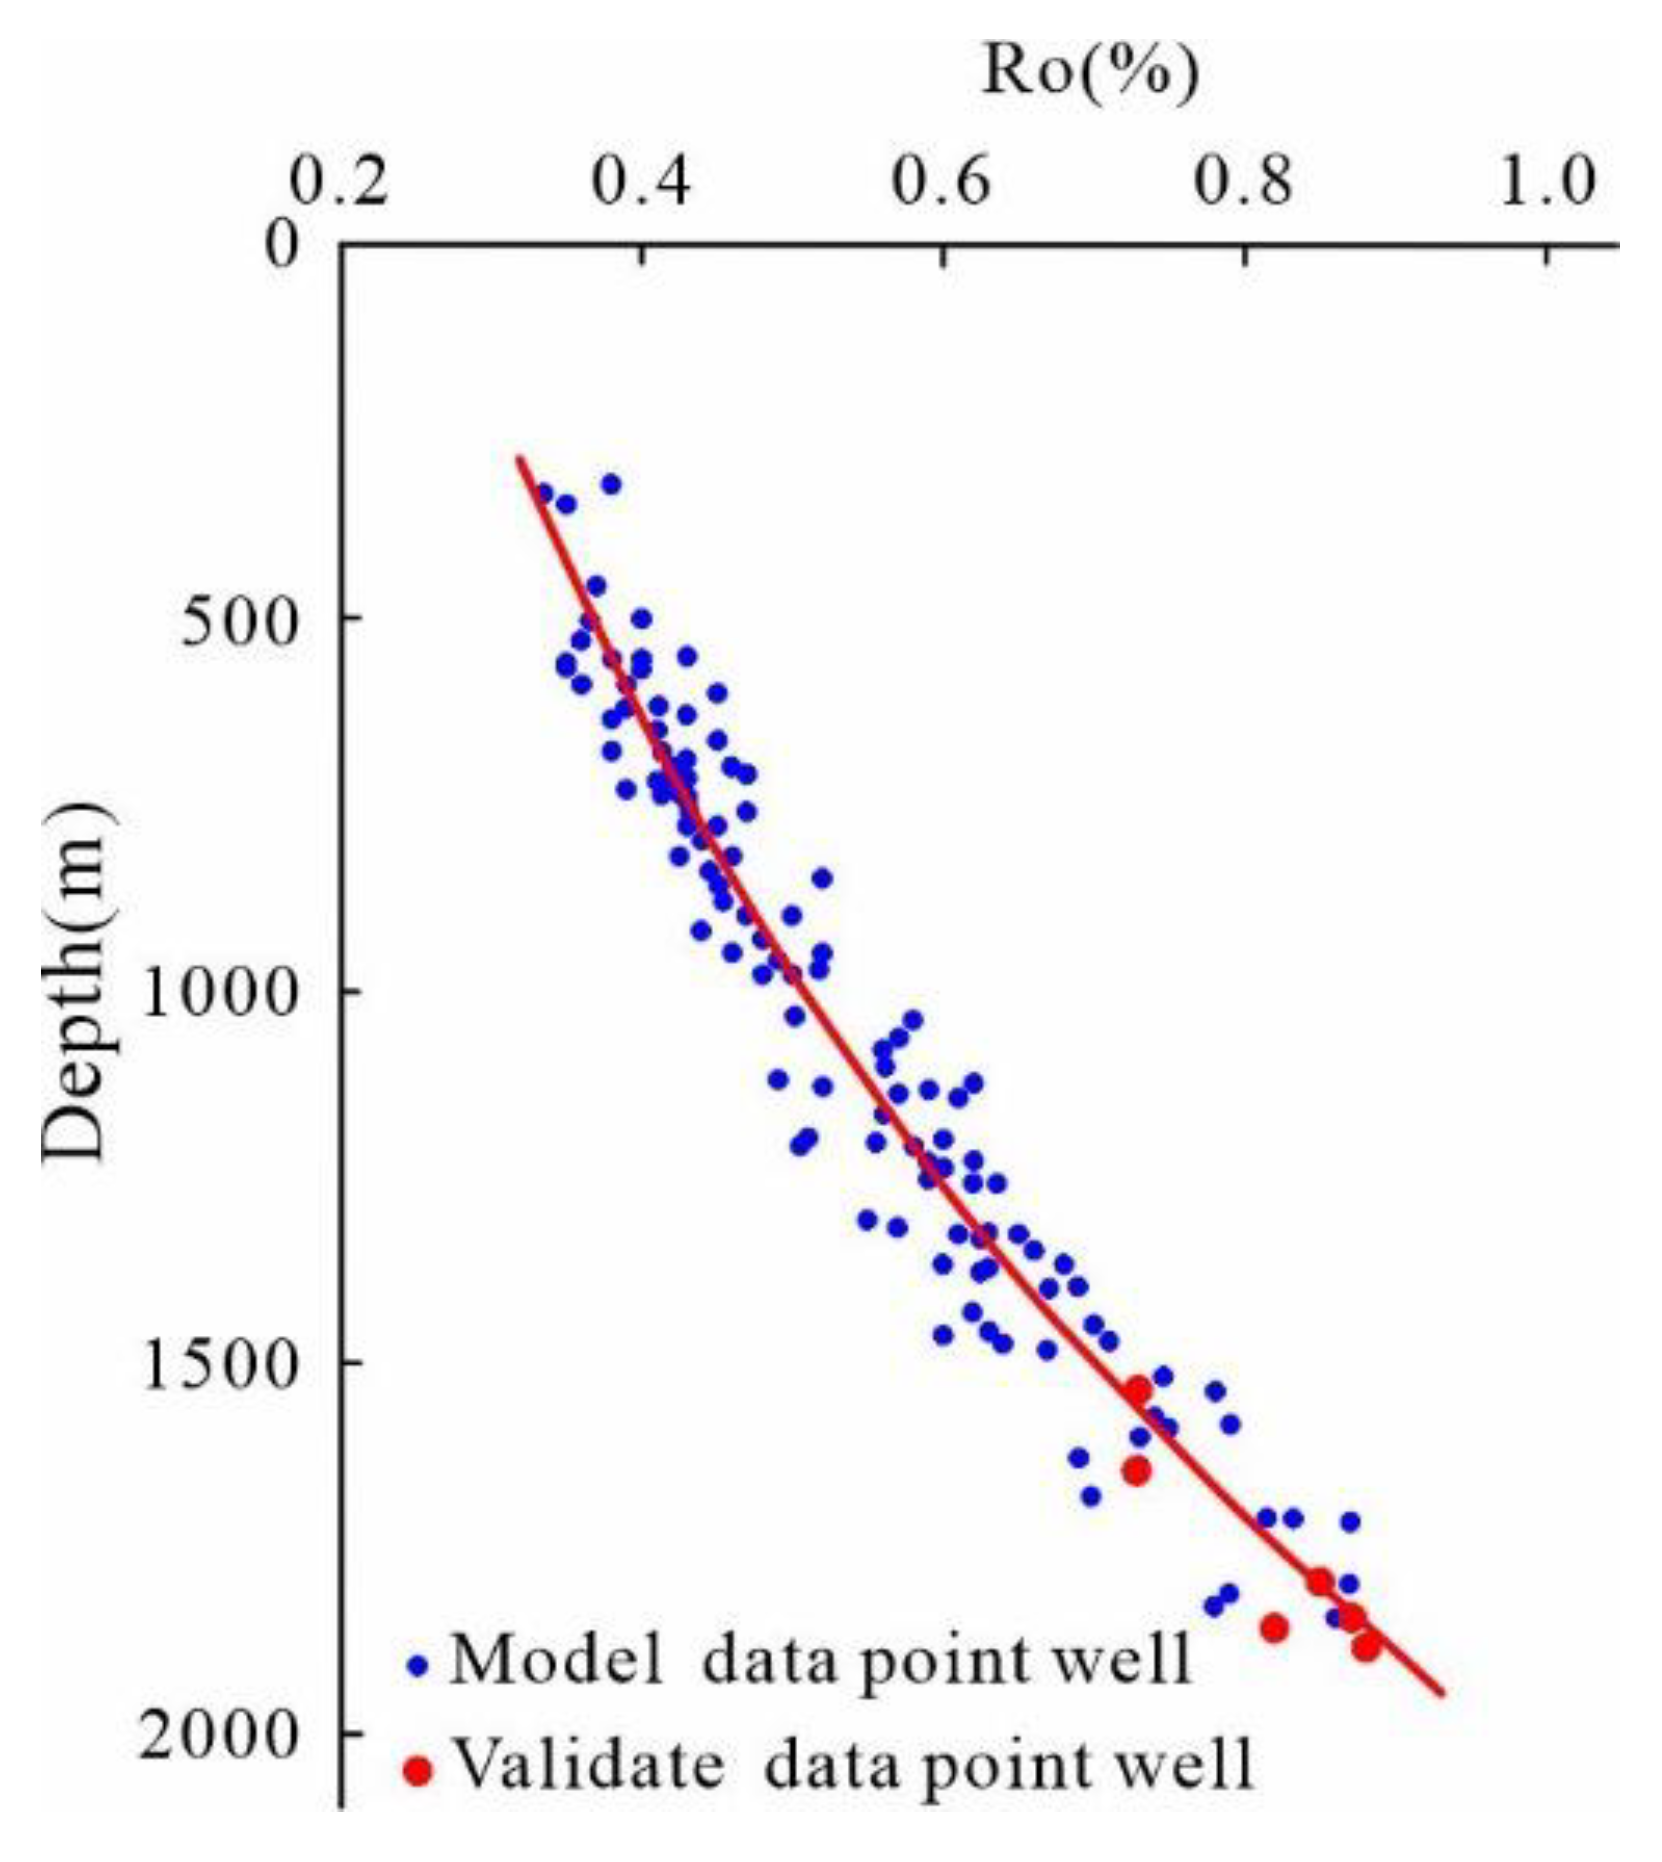
The TOC, Ro, hydrogen index (HI), and shale thickness are key parameters for evaluating the recoverable hydrocarbon reserves via the in situ conversion of immature to low–moderate-maturity shale. TOC and shale thickness determine the content of solid organic matter in shale, with higher values of TOC and shale thickness indicating more solid organic matter available for in situ conversion. HI determines the amount of oil and gas that can be generated from a unit of organic matter, with higher HI values resulting in more oil and gas produced from the in situ conversion of shale. Ro determines the amount of retained oil and gas in shale, with higher Ro values indicating more retained oil and gas available for the in situ conversion of immature to low–moderate-maturity shales (Ro < 1.0%).
In this study, the key parameters for evaluating the in situ conversion of hydrocarbon resources and further selecting the area were calculated based on core analysis data from 151 wells and logging data from 526 wells in the Nenjiang Formation. This is the recommended method for determining key parameters, such as the TOC, Ro, HI, and shale thickness.
(1)
Maturity of organic matter
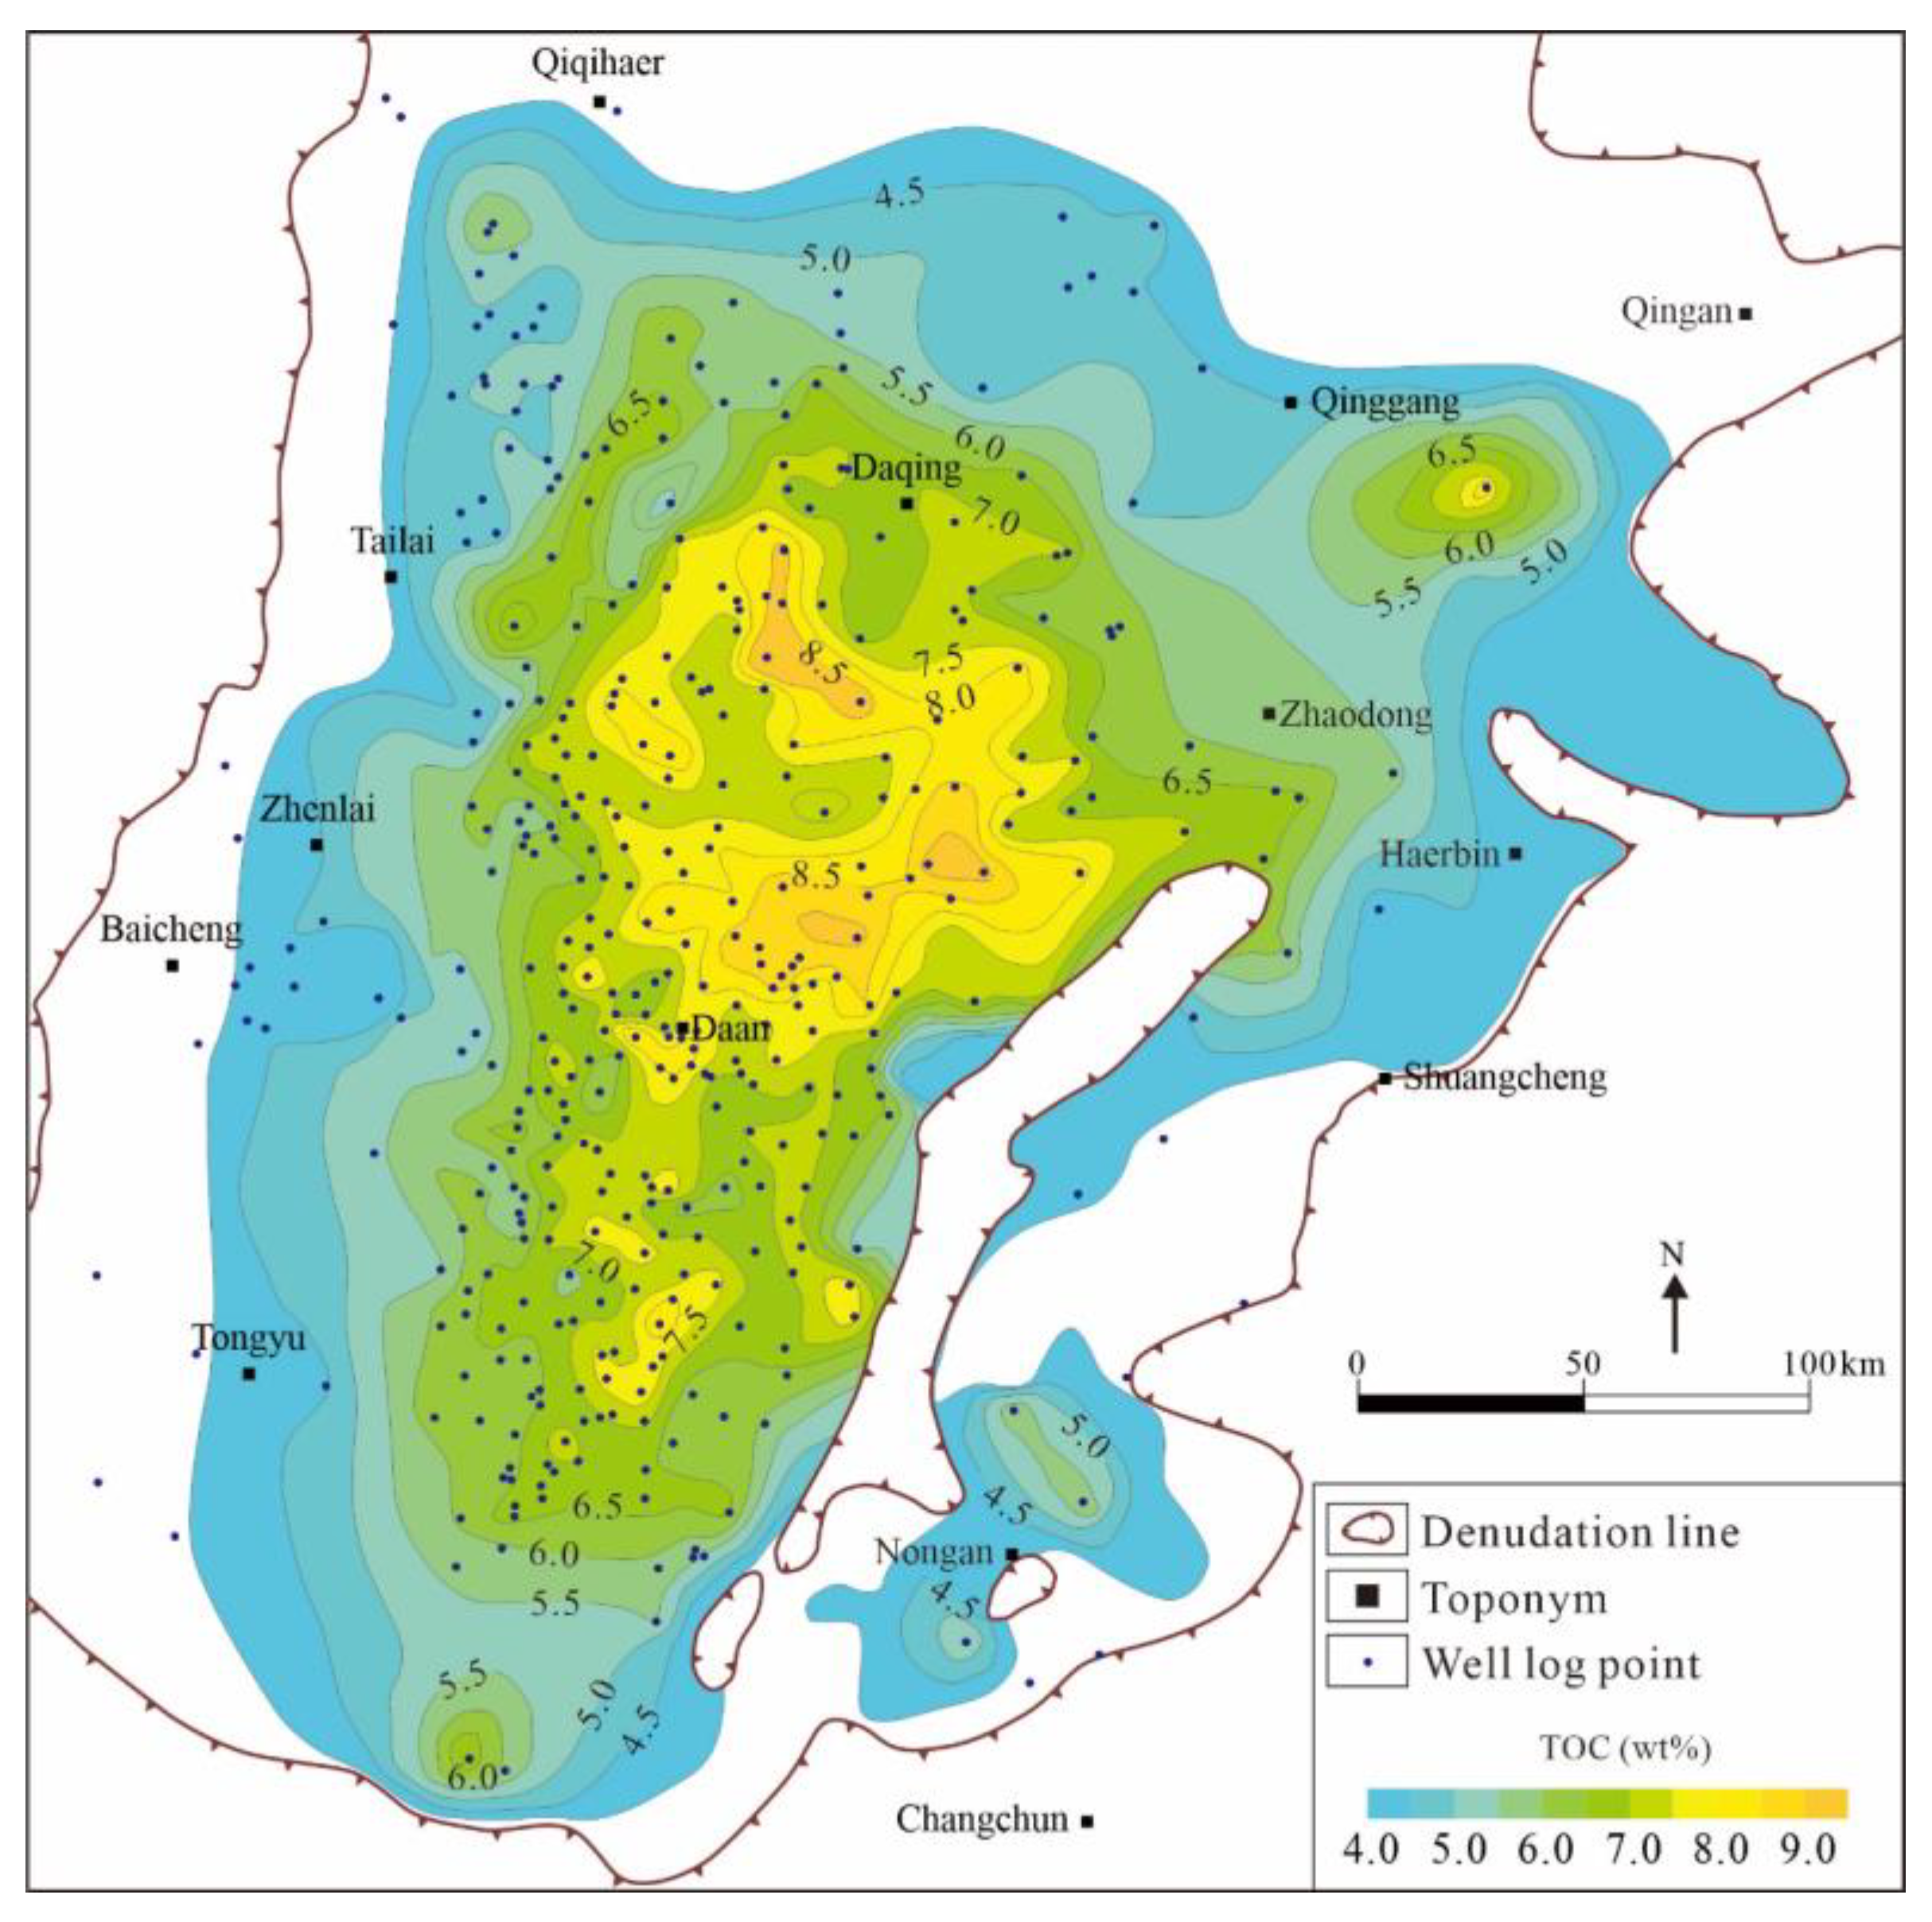
The maturity of organic matter in the Nenjiang Formation ranges from immature to low–moderate maturity and, thus, makes a relatively small contribution to the conventional hydrocarbon accumulation in the Songliao Basin [31]. Moreover, the hydrocarbons generated from the shales of the Nenjiang Formation have mainly accumulated in the Heidimiao oil reservoir, which has proven petroleum reserves of less than 8000 × 104 t. The distribution of the Ro values determined via core analysis of the Nenjiang Formation samples is limited, and previous studies have focused on local depressions and limited areas, which makes it difficult to meet the requirements for the detailed evaluation of Ro across the entire basin [31,32,33]. The measured core Ro data from 151 wells in the Nenjiang Formation (Figure 8) were utilized in this study. It was found that Ro is positively correlated with the burial depth (Figure 9); hence, a Ro prediction model was developed (Equation (20)). In order to verify the reliability of this model, the Ro values of shale samples from cores retrieved from six different wells located outside the experimental area were employed (Figure 8 and Figure 9), and it was found that the relative error between the newly measured Ro data and the Ro data from the model is less than 9%. This result indicates that our Ro prediction model can meet the requirements for the overall evaluation of the Nenjiang Formation. In addition, logging data from 526 wells were used to calculate Ro in order to obtain its spatial/areal distribution. It was revealed that the main range of Ro is 0.3–0.9%, and the best in situ conversion occurs when Ro is less than 0.9% (Figure 8).
R o = k 1 e k 2 D ,
where Ro is the vitrinite reflectance (%); D is the burial depth (m); and k1 and k2 are empirical coefficients with values of 0.2753 and 6.124 × 10⁻⁴, respectively.
(2)
Total organic carbon content
TOC can be considered the material input for in situ conversion and is an important parameter for evaluating the potential of having economically recoverable hydrocarbon amounts. Based on the analysis of cores from 151 wells and logging data from 526 wells in the Nenjiang Formation, first, the measured core data were used to calibrate the logging data, and the overlapping resistivity–sonic method was then employed for the prediction of TOC in the entire section [34]. It was observed that the calculated TOC values correspond well with the core measurement results (Figure 10), and the relative error between the calculated TOC values and the measured core analysis values is less than 8%, which is in an acceptable range for the overall estimation of TOC where measurements are missing.
(3)
Hydrocarbon generation potential of shale
The potential production of residual hydrocarbons in shale is an important parameter for assessing the overall hydrocarbon yield during in situ conversion, which can be characterized by the hydrogen index or generated hydrocarbon amounts in the Fischer assay. The experimentally measured hydrogen index and the Fischer assay-generated hydrocarbon amounts from the immature shale samples from the Nenjiang Formation exhibit a relatively good linear relationship. Because the Fischer assay is generally a more complicated procedure than pyrolysis, of which the former provides us with the hydrogen index, models defining the relationship between these two parameters were established (Equations (22) and (23)) to correct the in situ-converted hydrocarbon amounts using the Fischer assay.
Q F A O T = l 1 H I + l 2 ,
where Q F A G T is the amount of oil generated per unit mass of TOC content (mg/g TOC); HI is the hydrogen index (mg/g TOC); and l1 and l2 are empirical coefficients with values of 0.00232 and 6.15581, respectively.
Q F A G T = l 3 H I + l 4 ,
where Q F A O T is the amount of gas generated per unit volume of TOC content (mL/g TOC); HI is the hydrogen index (mg/g TOC); and l3 and l4 are empirical coefficients with values of 0.00232 and −0.02419, respectively.
Furthermore, based on the relationship between the hydrogen index and Ro from 151 wells, it was observed that the hydrogen index is positively correlated with Ro (Figure 11), and a model was defined to estimate the HI (Equation (24)). In addition, the HI results were calculated using the Ro data for 526 wells in the Nenjiang Formation in order to study the spatial/areal distribution of the HI values in the region.
H I = j 1 ln R o + j 2 ,
where HI is the hydrogen index (mg/g TOC); Ro is the vitrinite reflectance (%); and j1 and j2 are empirical coefficients with values of −335.498 and 492.571, respectively.
(4)
In situ conversion of shale layer and thickness
Based on operational constraints and the costs associated with in situ conversion, we can apply the models proposed in this paper to estimate the amount of recoverable hydrocarbons as well as the lower limit value per unit mass of the in situ-converted shale in order to determine the suitability of this operation with the Nenjiang Formation as the target layer based on its TOC, HI, and Ro values. The Nenjiang Formation satisfies the conditions for in situ conversion, including three separate zones: the bottom of Nenjiang Formation II, the middle of Nenjiang Formation I, and the bottom of Nenjiang Formation I (Figure 10).
The thicknesses of these three sections vary considerably in the region. In the east–west direction (Figure 12), the bottom of Nenjiang Formation I has a relatively limited presence and the smallest thickness, while the middle of Nenjiang Formation I is relatively abundant in the area, with a maximum overall thickness and significant variation in the thickness from east to west. Finally, the bottom of Nenjiang Formation II is similar to that of the middle of Nenjiang Formation I, but its overall thickness is slightly greater than that of the bottom of Nenjiang Formation I and is notably smaller than that of the middle of Nenjiang Formation I, with a relatively small overall variation in thickness in the east–west direction. In the north–south direction (Figure 13), the bottom of Nenjiang Formation I has the smallest thickness and the smallest distribution, which is similar to that in the east–west direction. In contrast, the other two sections exhibit a significantly different areal distribution in the east–west direction, and the variation in the thickness of the bottom of Nenjiang Formation II is the most significant. In terms of the overall thickness, the bottom of Nenjiang Formation II is close to the middle of the Nenjiang Formation.
In the target layer, the thickness of the bottom of Nenjiang Formation II ranges from 6 m to 22 m, and the area where the thickness exceeds 15 m is approximately 5661 km2 (Figure 14). The TOC values are from 5.5 wt.% to 9.0 wt.%, and the area where the TOC exceeds 6.0 wt.% is approximately 30,154 km2 (Figure 15). Moreover, the thickness of the bottom of Nenjiang Formation I varies from 2 to 10 m, while the average TOC value is 5.0–7.5 wt.%, and the area where the TOC exceeds 6.0 wt.% is approximately 6150 km2. In addition, considering the middle of Nenjiang Formation I, the thickness ranges from 8 to 34 m, and the area where the thickness is more than 15 m is approximately 12,506 km2. The average TOC value in this zone varies from 4.5 wt.% to 6.5 wt.%, with TOC more than 6.0 wt.% covering approximately 2264 km2.

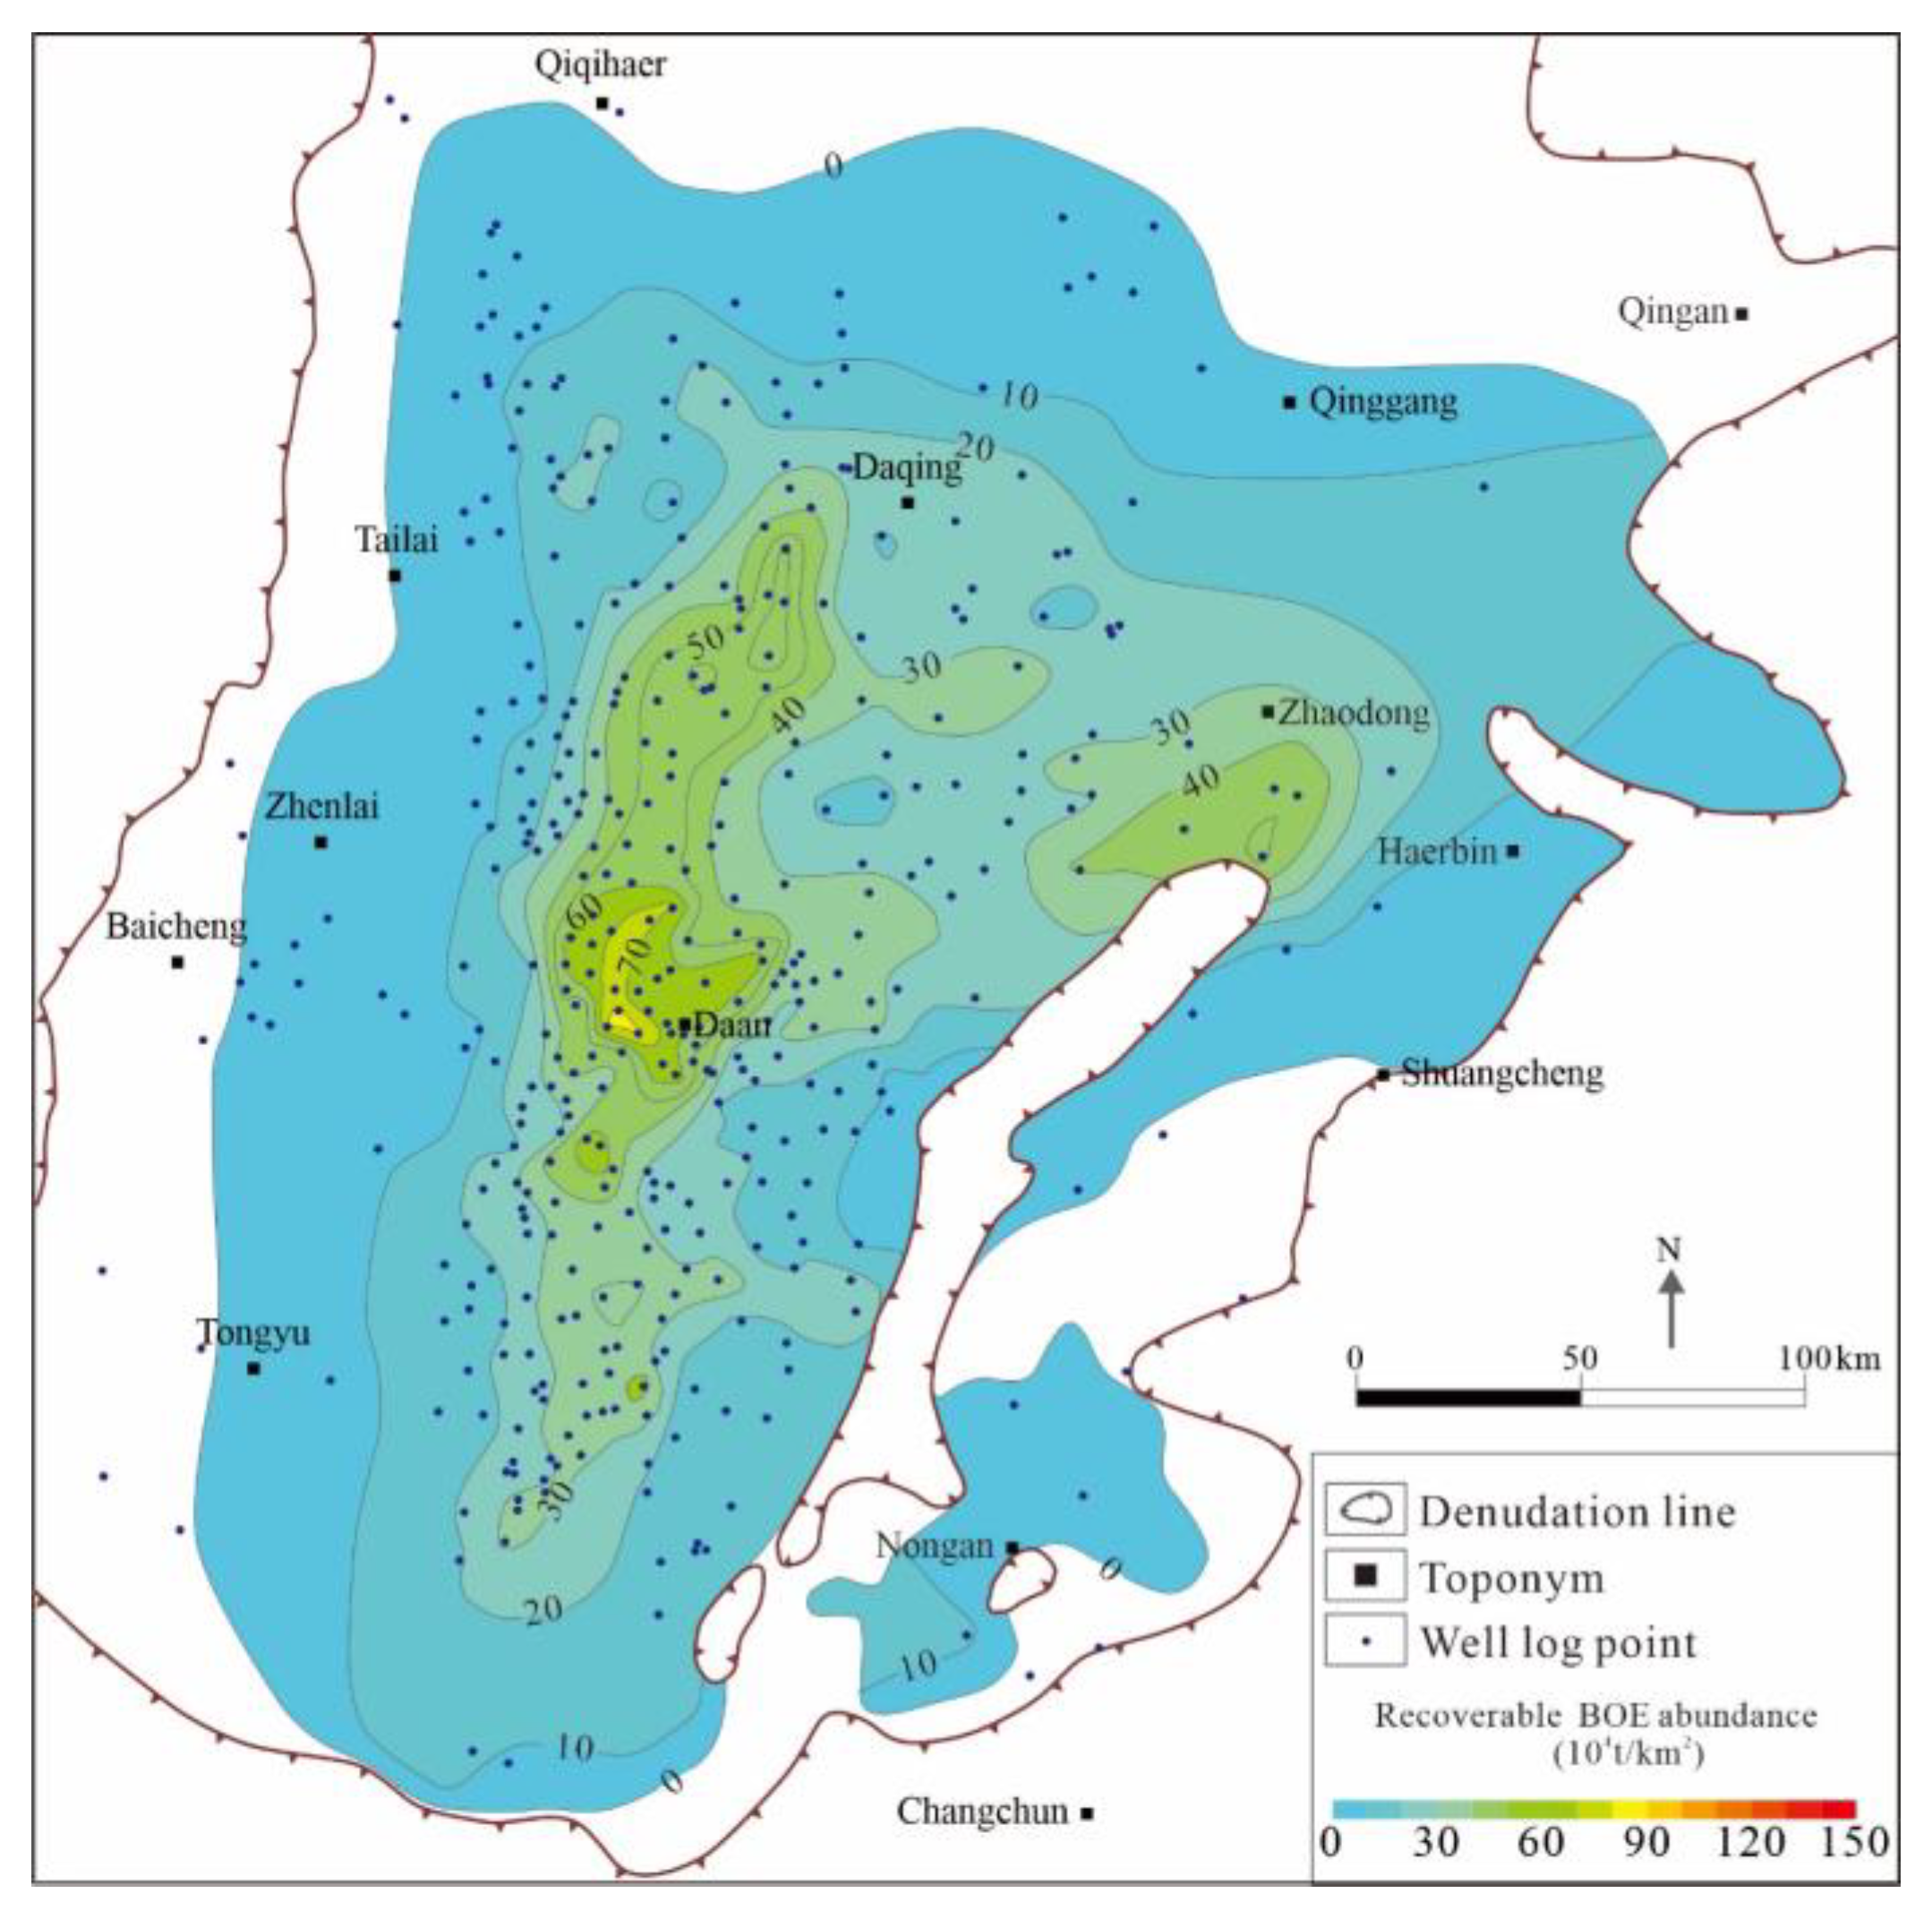
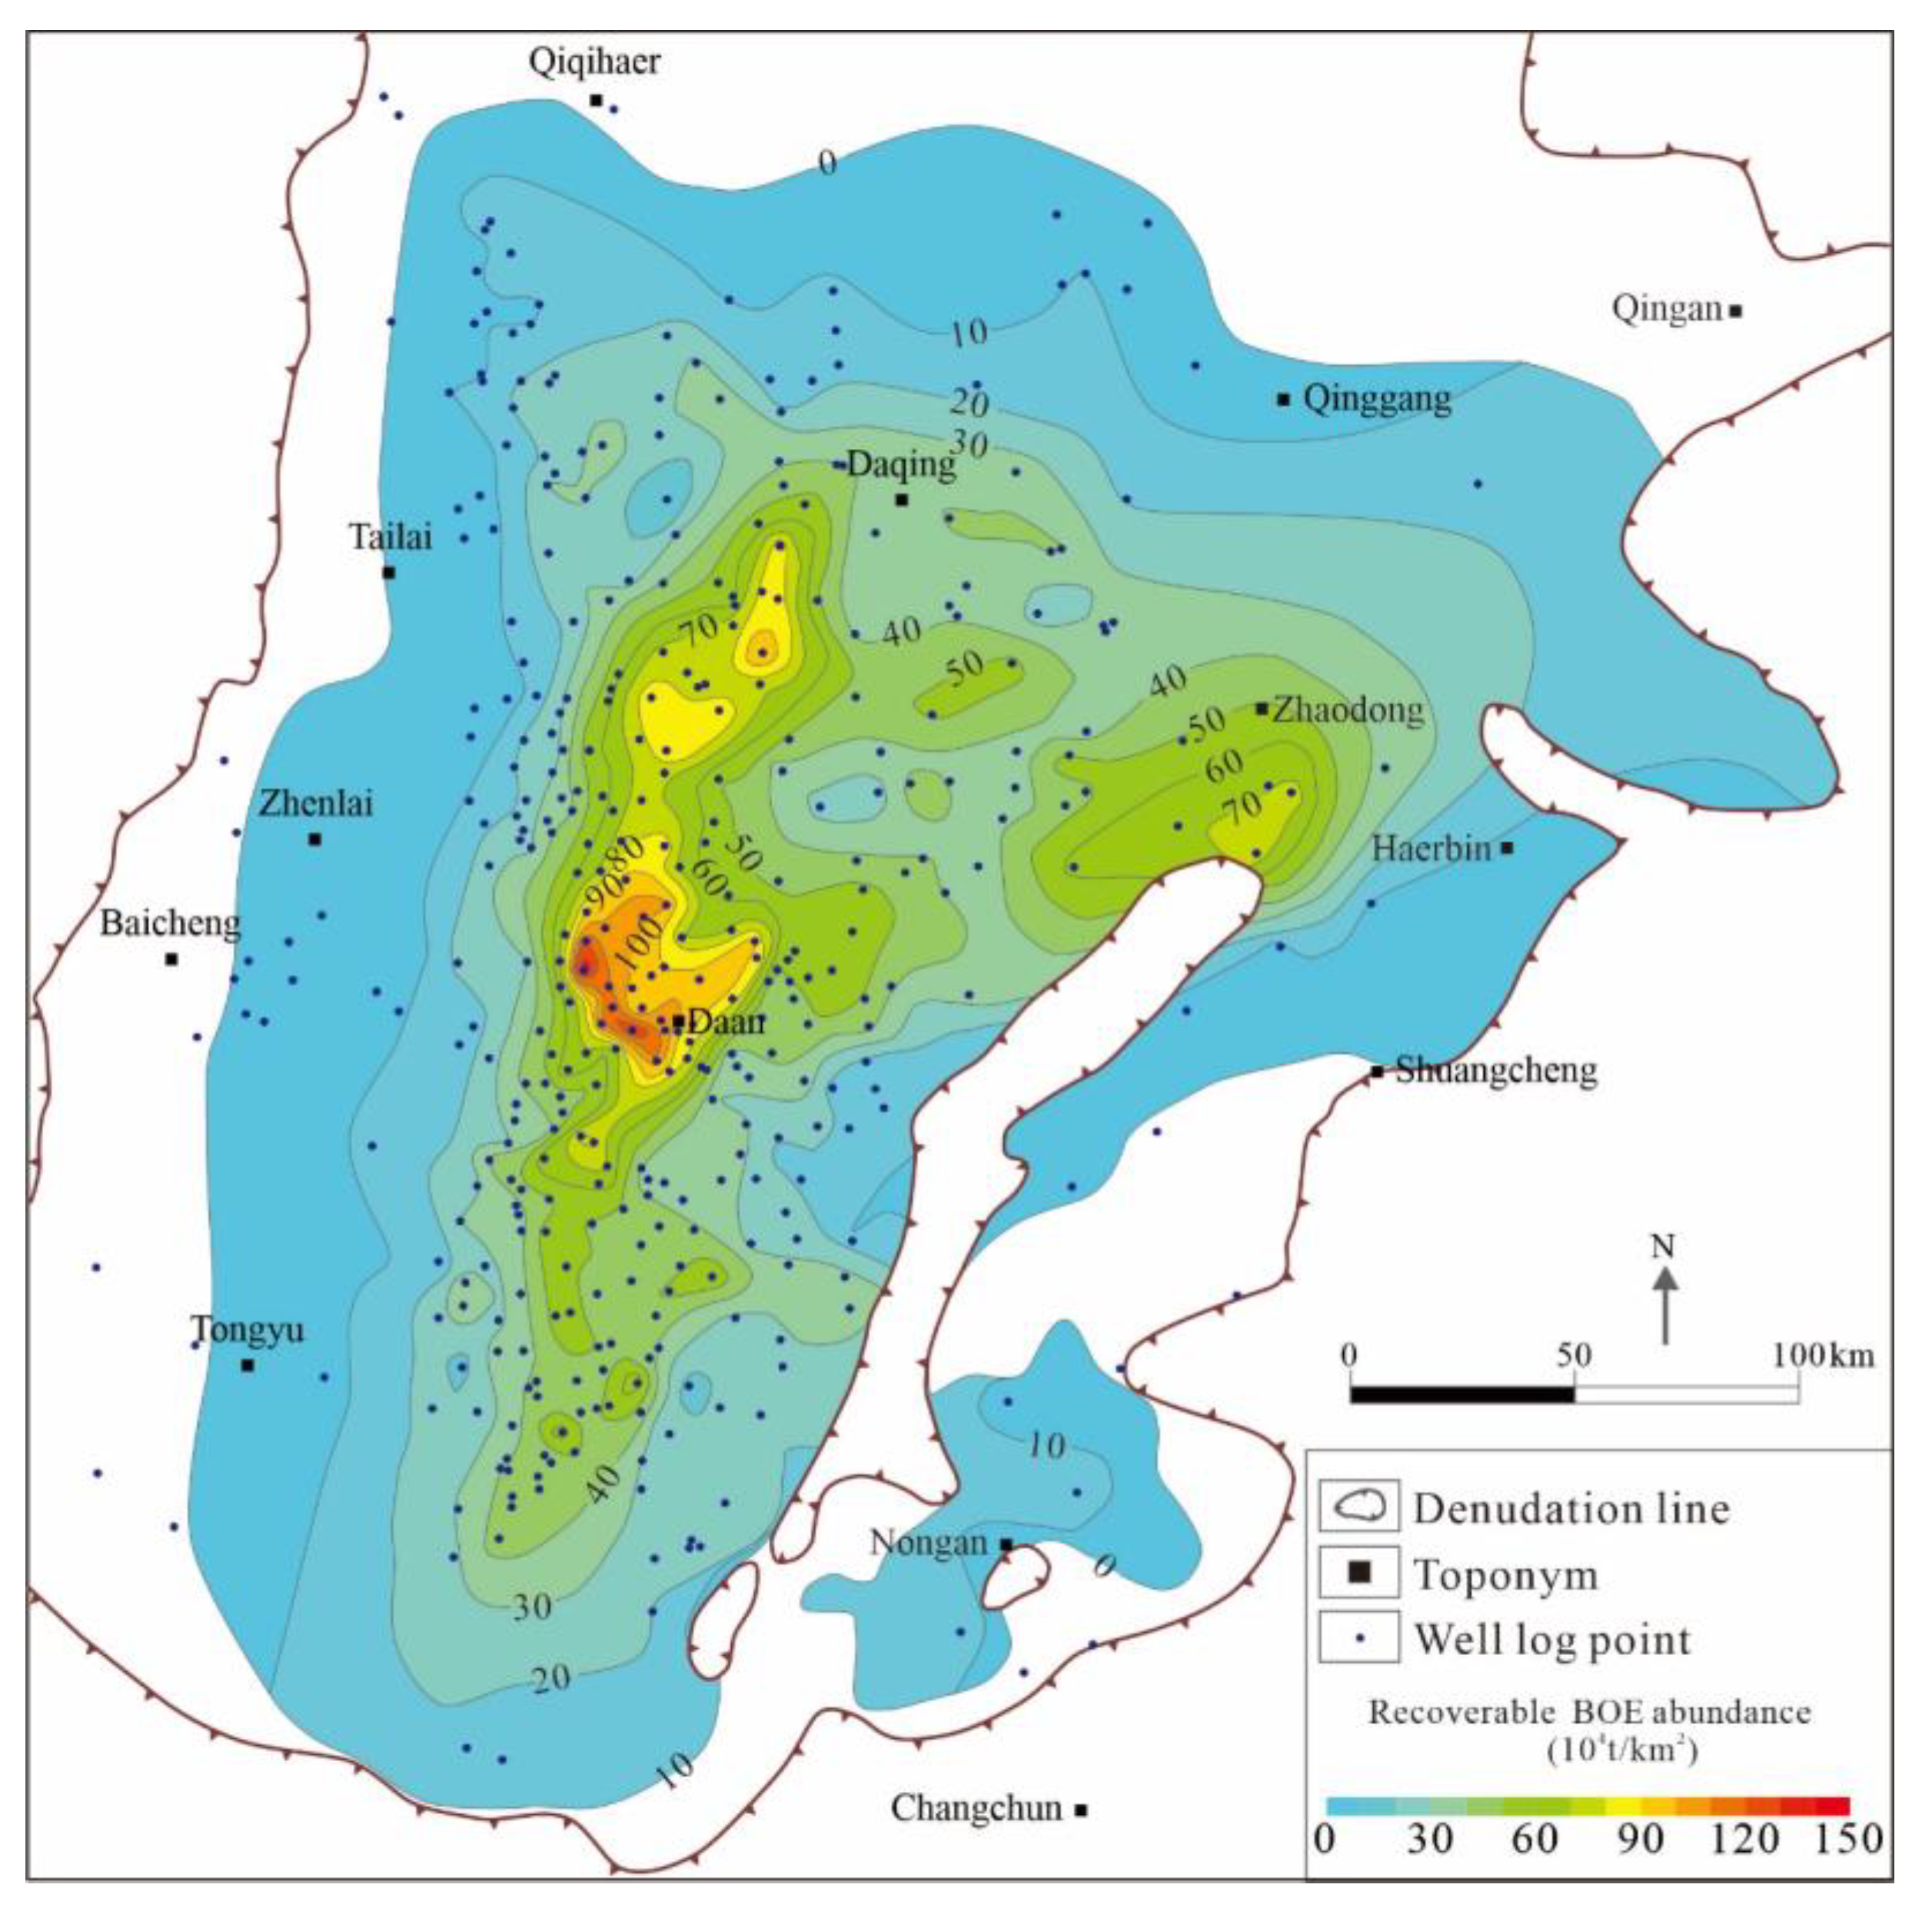
3.5.3. Evaluation of Recoverable Hydrocarbon Reserves

Based on the key parameters of the target layer in the study area, the estimation of the amount of recoverable hydrocarbons following in situ conversion in these three sections was carried out using the methods and steps proposed here.
The results suggest that the amount of recoverable hydrocarbons following in situ conversion in these three sections would be significant, with approximately 292.02 × 10⁸ t of oil and about 18.58 × 10¹² m3 of natural gas. In particular, the bottom of Nenjiang Formation II showed approximately 140.85 × 10⁸ t of recoverable oil and approximately 9.22 × 10¹² m3 of recoverable natural gas, and it covers an area of approximately 8.2 × 10⁴ km2. In addition, the middle of Nenjiang Formation I showed approximately 123.82 × 10⁸ t of recoverable oil and about 7.60 × 10¹² m3 of recoverable natural gas in an area of approximately 7.7 × 10⁴ km2. The bottom of Nenjiang Formation I would produce 27.35 × 10⁸ t of recoverable oil and 1.76 × 10¹² m3 of recoverable natural gas in an area of approximately 4.4 × 10⁴ km2 (Table 5).
The abundance (per unit area) of recoverable oil in the bottom of Nenjiang Formation II ranges from 20 × 104 t/km2 to 80 × 104 t/km2 (Figure 16), with the abundance of recoverable natural gas ranging from 1.5 × 10⁸ m3/km2 to 4.5 × 10⁸ m3/km2 (Figure 17) and the oil equivalent from 30 × 104 t/km2 to 130 × 104 t/km2 (Figure 18). The abundance of recoverable oil in the middle of Nenjiang Formation I ranges from 10 × 104 t/km2 to 80 × 104 t/km2, with the abundance of recoverable natural gas ranging from 1.0 × 10⁸ m3/km2 to 4.5 × 10⁸ m3/km2 and an oil equivalent that is around 30 × 104 t/km2 to 120 × 104 t/km2. The abundance of recoverable oil at the bottom of Nenjiang Formation I was estimated to be 10 × 104 t/km2 to 20 × 104 t/km2, while the abundance of recoverable natural gas would vary from 0.5 × 10⁸ m3/km2 to 1.5 × 10⁸ m3/km2, and finally, the recoverable equivalent oil would be 20 × 104 t/km2 to 40 × 104 t/km2.

4. Conclusions

First, based on thermal simulation experiments on shale and crude oil samples for the purpose of the in situ conversion of organic matter in mature layers, it was found that the TOC, Ro, hydrocarbon generation potential, and fluid pressure would influence the hydrocarbon yield during the in situ conversion of the shale. Herein, the impact of the liquid pressure and the crude oil density on the final hydrocarbon yield per unit mass of residual oil can be considered a foundation for establishing a model for hydrocarbon production via the in situ conversion of shale.
Second, following in situ conversion thermal simulation experiments, a model for the prediction of the amount of hydrocarbons produced from solid organic matter in shale based on the TOC, Ro, fluid pressure, and hydrocarbon generation potential was established. Another model to estimate the amount of hydrocarbon production via in situ conversion when residual hydrocarbons exist in the system, liquid pressure, and crude oil density was proposed. Moreover, in this study, we developed a method for determining key parameters for assessing the amount of recoverable hydrocarbons, which can be used to select favorable layers, especially in regions where in situ conversion thermal simulation experiments have not been conducted.
Finally, based on the developed method, the amount of recoverable hydrocarbons via in situ conversion was estimated in three zones of the Nenjiang Formation in the Songliao Basin to be approximately 292.02 × 10⁸ t of oil and 18.58 × 10¹² m3 of natural gas. These results can provide a practical and theoretical basis for the implementation of in situ conversion operations in immature to low-maturity shale in the Nenjiang Formation and can serve as a guideline for the entire Songliao Basin, as well as universally around the globe on other shale formations where thermal simulation experiments have not been conducted.

Author Contributions

Conceptualization, L.H. and Z.Z.; Methodology, L.H., X.L. and L.Z.; Validation, L.Z.; Investigation, J.M. and Z.P.; Writing—original draft, L.H., Z.Z. and X.L.; Writing—review & editing, Z.P. and S.L. All authors have read and agreed to the published version of the manuscript.

Funding

This study is financially supported by the National Natural Science Foundation of China (Grant No. 42172170) and the Prospective Fundamental Technology Research and Development Project of China National Petroleum Corporation (CNPC) (Grant No. 2021DJ52).

Data Availability Statement

The original contributions presented in the study are included in the article, further inquiries can be directed to the corresponding authors.

Acknowledgments

We sincerely thank the Daqing Oilfield for data collection.

Conflicts of Interest

Authors Lianhua Hou, Zhongying Zhao, Xia Luo, Jingkui Mi, Zhenglian Pang, Lijun Zhang and Senhu Lin were employed by the company PetroChina.

References

  1. US Energy Information Administration. Short-Term Energy Outlook; US Energy Information Administration: Washington, DC, USA, 2023.
  2. Wang, X.; Zhang, G.; Tang, W.; Wang, D.; Wang, K.; Liu, J.; Du, D. A review of commercial development of continental shale oil in China. Energy Geosci. 2022, 3, 282–289. [Google Scholar] [CrossRef]
  3. Hu, T.; Pang, X.; Xu, T.; Li, C.; Jiang, S.; Wang, Q.; Chen, Y.; Zhang, H.; Huang, C.; Gong, S.; et al. Identifying the key source rocks in heterogeneous saline lacustrine shales: Paleogene shales in the Dongpu depression, Bohai Bay Basin, eastern China. AAPG Bull. 2022, 106, 1325–1356. [Google Scholar] [CrossRef]
  4. Hou, L.; Luo, X.; Mi, J.; Zhang, Y.; Lin, S.; Liao, F.; Pang, Z. Characteristics of Oil and Gas Produced by In Situ Heating of Shale: A Case Study of the Chang 7 Member, Ordos Basin, China. Energy Fuels 2022, 36, 1429–1440. [Google Scholar] [CrossRef]
  5. Zhao, W.; Hu, S.; Hou, L.; Yang, T.; Li, X.; Guo, B.; Yang, Z. Types and resource potential of continental shale oil in China and its boundary with tight oil. Pet. Explor. Dev. 2020, 47, 1–11. [Google Scholar] [CrossRef]
  6. Han, Z.; Wang, G.; Wu, H.; Feng, Z.; Tian, H.; Xie, Y.; Wu, H. Lithofacies Characteristics of Gulong Shale and Its Influence on Reservoir Physical Properties. Energies 2024, 17, 779. [Google Scholar] [CrossRef]
  7. Hu, T.; Pang, X.; Jiang, S.; Wang, Q.; Zheng, X.; Ding, X.; Zhao, Y.; Zhu, C.; Li, H. Oil content evaluation of lacustrine organic-rich shale with strong heterogeneity: A case study of the Middle Permian Lucaogou Formation in Jimusaer Sag, Junggar Basin, NW China. Fuel 2018, 221, 196–205. [Google Scholar] [CrossRef]
  8. Hou, L.; He, K.; Zhai, J.; Mi, J.; Weng, N. Compositional kinetics for hydrocarbon evolution in the pyrolysis of the Chang 7 organic matter: Implications for in-situ conversion of oil shale. J. Anal. Appl. Pyrolysis 2022, 162, 105434. [Google Scholar] [CrossRef]
  9. Liu, S.; Gai, H.; Cheng, P. Technical Scheme and Application Prospects of Oil Shale In Situ Conversion: A Review of Current Status. Energies 2023, 16, 4386. [Google Scholar] [CrossRef]
  10. Hou, L.; Ma, W.; Luo, X.; Liu, J. Characteristics and quantitative models for hydrocarbon generation-retention-production of shale under ICP conditions: Example from the Chang 7 member in the Ordos Basin. Fuel 2020, 279, 118497. [Google Scholar] [CrossRef]
  11. Hu, T.; Liu, Y.; Jiang, F.; Pang, X.; Wang, Q.; Zhou, K.; Wu, G.; Jiang, Z.; Huang, L.; Jiang, S.; et al. A novel method for quantifying hydrocarbon micromigration in heterogeneous shale and the controlling mechanism. Energy 2024, 288, 129712. [Google Scholar] [CrossRef]
  12. Hou, L.; Luo, X.; Zhao, Z.; Zhang, L. Identification of Oil Produced from Shale and Tight Reservoirs in the Permian Lucaogou Shale Sequence, Jimsar Sag, Junggar Basin, NW China. ACS Omega 2021, 6, 2127–2142. [Google Scholar] [CrossRef] [PubMed]
  13. Ma, S.; Li, S.; Zhang, Z.; Xu, T.; Zheng, B.; Hu, Y.; Li, G.; Li, X. The Feasibility Study of In Situ Conversion of Oil Shale Based on Calcium-Oxide-Based Composite Materia Hydration Exothermic Reaction. Energies 2024, 17, 1798. [Google Scholar] [CrossRef]
  14. Zhao, Z.; Hou, L.; Luo, X.; Chi, Y.; Pang, Z.; Lin, S.; Zhang, L.; Liu, B. Heat-Induced Pore Structure Evolution in the Triassic Chang 7 Shale, Ordos Basin, China: Experimental Simulation of In Situ Conversion Process. J. Mar. Sci. Eng. 2023, 11, 1363. [Google Scholar] [CrossRef]
  15. Kang, Z.; Zhao, Y.; Yang, D. Review of oil shale in-situ conversion technology. Appl. Energy 2020, 269, 115121. [Google Scholar] [CrossRef]
  16. Ma, W.; Hou, L.; Luo, X.; Liu, J.; Tao, S.; Guan, P.; Cai, Y. Generation and expulsion process of the Chang 7 oil shale in the Ordos Basin based on temperature-based semi-open pyrolysis: Implications for in-situ conversion process. J. Pet. Sci. Eng. 2020, 190, 107035. [Google Scholar] [CrossRef]
  17. Hou, L.; Cui, J.; Zhang, Y. Evolution mechanism of dynamic thermal parameters of shale. Mar. Pet. Geol. 2022, 138, 105423. [Google Scholar] [CrossRef]
  18. Hubbert, M.K. Degree of advancement of petroleum exploration in the United States. AAPG Bull. 1967, 51, 2207–2227. [Google Scholar]
  19. Burnham, A.K.; Mcconaghy, J.R. Comparison of the acceptability of various oil shale processes. In Proceedings of the 26th Oil Shale Symposium, Golden, CO, USA, 16–18 October 2006. [Google Scholar]
  20. Fowler, T.D.; Vinegar, H.J. Oil shale ICP-Colorado Field Pilots. In Proceedings of the SPE Western Regional Meeting, San Jose, CA, USA, 24–26 March 2009; pp. 1–15. [Google Scholar]
  21. Hou, L.; Luo, X.; Lin, S.; Li, Y.; Zhang, L.; Ma, W. Assessment of recoverable oil and gas resources by in-situ conversion of shale--Case study of extracting the Chang 73 shale in the Ordos Basin. Pet. Sci. 2022, 19, 441–458. [Google Scholar] [CrossRef]
  22. Shen, Z.; Yu, Z.; Ye, H.; Deng, C.; He, H. Magnetostratigraphy of the Upper Cretaceous Nenjiang Formation in the Songliao Basin, northeast China: Implications for age constraints on terminating the Cretaceous Normal Superchron. Cretac. Res. 2022, 135, 105213. [Google Scholar] [CrossRef]
  23. Liu, B.; Wang, Y.; Tian, S.; Guo, Y.; Wang, L.; Yasin, Q.; Yang, J. Impact of thermal maturity on the diagenesis and porosity of lacustrine oil-prone shales: Insights from natural shale samples with thermal maturation in the oil generation window. Int. J. Coal Geol. 2022, 261, 104079. [Google Scholar] [CrossRef]
  24. Wang, M.; Yang, J.; Wang, Z.; Lu, S. Nanometer-Scale Pore Characteristics of Lacustrine Shale, Songliao Basin, NE China. PLoS ONE 2015, 10, e0135252. [Google Scholar] [CrossRef]
  25. Wang, L.; Song, Z.; Yin, Q.; George, S.C. Paleosalinity significance of occurrence and distribution of methyltrimethyltridecyl chromans in the Upper Cretaceous Nenjiang Formation, Songliao Basin, China. Org. Geochem. 2011, 42, 1411–1419. [Google Scholar] [CrossRef]
  26. Xu, J.; Liu, Z.; Bechtel, A.; Sachsenhofer, R.F.; Jia, J.; Meng, Q.; Sun, P. Organic matter accumulation in the Upper Cretaceous Qingshankou and Nenjiang Formations, Songliao Basin (NE China): Implications from high-resolution geochemical analysis. Mar. Pet. Geol. 2019, 102, 187–201. [Google Scholar] [CrossRef]
  27. Xu, Y.; Li, D.; Gao, Y.; Li, M.; Sun, L.; Zhang, X.; Wang, C.; Shen, Y. Multiple S-isotopic evidence for seawater incursions during the deposition of the upper Cretaceous source rocks in the Songliao Basin, northeastern China. Chem. Geol. 2023, 642, 121790. [Google Scholar] [CrossRef]
  28. Chen, R.; Shang, F.; Cao, Y.; Song, L.; Li, Z. A comparative study of oil shale deposition in the Upper Cretaceous Nenjiang Formation, NE China: Evidence from petrographic and geochemical analyses. J. Pet. Sci. Eng. 2022, 219, 111130. [Google Scholar] [CrossRef]
  29. He, W.; Wang, M.; Wang, X.; Meng, Q.; Wu, Y.; Lin, T.; Li, J.; Zhang, J. Pore Structure Characteristics and Affecting Factors of Shale in the First Member of the Qingshankou Formation in the Gulong Sag, Songliao Basin. ACS Omega 2022, 7, 35755–35773. [Google Scholar] [CrossRef]
  30. Jia, J.; Bechtel, A.; Liu, Z.; Strobl, S.A.; Sun, P.; Sachsenhofer, R.F. Oil shale formation in the Upper Cretaceous Nenjiang Formation of the Songliao Basin (NE China): Implications from organic and inorganic geochemical analyses. Int. J. Coal Geol. 2013, 113, 11–26. [Google Scholar] [CrossRef]
  31. Liu, B.; Liu, L.; Fu, J.; Lin, T.; He, J.; Liu, X.; Liu, Y.; Fu, X. The Songliao Super Basin in northeastern China. AAPG Bull. 2023, 107, 1257–1297. [Google Scholar] [CrossRef]
  32. He, W.; Meng, Q.; Lin, T.; Wang, R.; Liu, X.; Ma, S.; Li, X.; Yang, F.; Sun, G. Evolution features of in-situ permeability of low-maturity shale with the increasing temperature, Cretaceous Nenjiang Formation, northern Songliao Basin, NE China. Pet. Explor. Dev. 2022, 49, 516–529. [Google Scholar] [CrossRef]
  33. Liu, W.; Liu, M.; Yang, T.; Liu, X.; Them, T.R.; Wang, K.; Bian, C.; Meng, Q.; Li, Y.; Zeng, X.; et al. Organic matter accumulations in the Santonian-Campanian (Upper Cretaceous) lacustrine Nenjiang shale (K2n) in the Songliao Basin, NE China: Terrestrial responses to OAE3? Int. J. Coal Geol. 2022, 260, 104069. [Google Scholar] [CrossRef]
  34. Zhang, M.; Xie, R.; Yin, S.; Deng, M.; Chen, J.; Feng, S.; Luo, Z.; Chen, J. Logging identification of complex lithology of the Lower Jurassic Da’anzhai Member in the eastern slope of the western Sichuan Depression. Unconv. Resour. 2023, 3, 7–19. [Google Scholar] [CrossRef]
Figure 1. Correlation between pyrolysis temperature and Ro.
Energies 17 02717 g001
Figure 2. Yield of remaining hydrocarbons with increasing Ro. (a) Remaining yield of oil, (b) remaining yield of gas.
Energies 17 02717 g002
Figure 3. Yields of oil and gas with increasing Ro. (a) Yield of oil, (b) yield of gas.
Energies 17 02717 g003
Figure 4. Correlation between oil and gas yield and pressure.
Energies 17 02717 g004
Figure 5. Retained oil and gas with increasing Ro. (a) Retained oil, (b) retained gas.
Energies 17 02717 g005
Figure 6. Yields of oil and gas with increasing density of original oil and pressure.
Energies 17 02717 g006
Figure 7. The relationship between HI and Tmax in the shale of the Nenjiang Formation.
Energies 17 02717 g007
Figure 8. The distribution of Ro in the shale of the Nenjiang Formation in the Songliao Basin.
Energies 17 02717 g008
Figure 9. Plot of Ro versus burial depth.
Energies 17 02717 g009
Figure 10. Well log interpretation of TOC in Well M206.
Energies 17 02717 g010
Figure 11. Plot of HI versus Ro.
Energies 17 02717 g011
Figure 12. East–west distribution of in situ-converted shale section of Nenjiang Formation. Dotted lines represent the boundary of K2n1.
Energies 17 02717 g012
Figure 13. North–south distribution of in situ-converted shale section of Nenjiang Formation. Dotted lines represent the boundary of K2n1.
Energies 17 02717 g013
Figure 14. Thickness distribution at the bottom of Nenjiang Formation II.
Energies 17 02717 g014
Figure 15. TOC distribution at the bottom of Nenjiang Formation II.
Energies 17 02717 g015
Figure 16. Abundance distribution of recoverable petroleum reserves at bottom of Nenjiang Formation II.
Energies 17 02717 g016
Figure 17. Abundance distribution of recoverable natural gas reserves at bottom of Nenjiang Formation II.
Energies 17 02717 g017
Figure 18. Abundance distribution of recoverable oil equivalent at bottom of Nenjiang Formation II.
Energies 17 02717 g018
Table 1. Basic geochemical data of original unheated shale samples from Chang 73 Formation in Ordos Basin.
Sample NumberNo. 1No. 2No. 3No. 4No. 5No. 6No. 7No. 8No. 9
TOC, wt.%0.51 2.03 3.50 5.03 6.44 8.51 13.34 20.67 25.99
S2, mg/g rock1.99 8.60 17.28 24.53 32.06 42.42 67.17 111.95 138.20
Tmax, °C435433429432431433429428427
HI, mg/g TOC388.1 423.0 494.5 487.9 498.2 498.6 503.5 541.5 531.8
Ro, %0.43 0.46 0.47 0.47 0.47 0.47 0.48 0.47 0.48
QFAOT, mg/g TOC1.3982.023.343.083.423.543.684.224.15
QFAGT, mL/g TOC0.921.191.781.771.811.851.912.082.07
QFAOT—oil production per unit mass of total organic carbon content, mg/g TOC; QFAGT—gas production per unit volume of total organic carbon content, mL/g TOC.
Table 2. Basic geochemical data of original unheated shale samples from Nenjiang Formation in Songliao Basin.
Samples NumberNo. 1No. 2No. 3No. 4No. 5
TOC, wt.%3.576.037.698.7611.41
S2, mg/g rock30.04 51.16 65.68 74.39 97.95
Tmax, °C426426425425424
HI, mg/g TOC841.34 848.39 854.15 849.25 858.45
Ro, %0.370.370.370.380.38
QFAOT, mg/g TOC8.118.13 8.14 8.13 8.15
QFAGT, mL/g TOC1.93 1.95 1.96 1.95 1.97
QFAOT—oil production per unit mass of total organic carbon content, mg/g TOC; QFAGT—Gas production per unit volume of total organic carbon content, mL/g TOC.
Table 3. Oil and gas yields, temperature, and Ro characteristics of samples from Nenjiang Formation in Songliao Basin after pyrolysis experiments.
Pyrolysis Temperature, °CSample NumberAverage T, °CAverage Ro, %
No. 1No. 2No. 3No. 4No. 5
T, °CRo, %QoilQgasT, °CRo, %QoilQgasT, °CRo, %QoilQgasT, °CRo, %QoilQgasT, °CRo, %QoilQgas
2525.060.37 0.00 0.00 24.80.37 0.00 0.00 25.60.37 0.00 0.01 24.60.38 0.00 0.01 25.50.38 0.00 0.02 25.1 0.37
215214.30.47 0.08 0.00 214.90.48 0.19 0.00 216.40.44 0.18 0.01 214.80.46 0.11 0.01 213.90.46 0.13 0.02 214.9 0.46
235234.50.52 0.45 0.01 235.50.50 1.15 0.00 234.30.55 1.41 0.06 235.80.53 1.02 0.03 234.60.55 1.61 0.04 234.9 0.53
285286.40.70 2.30 0.01 284.30.63 3.76 0.11 285.70.65 5.05 0.07 284.50.61 6.66 0.20 286.20.71 9.87 0.86 285.4 0.66
305304.80.74 3.88 0.01 304.10.82 6.49 0.23 305.60.71 8.66 0.33 304.80.78 11.02 0.45 306.10.76 15.34 1.34 305.1 0.76
320319.70.85 5.63 0.18 321.20.85 8.98 0.39 320.30.81 12.08 0.52 319.70.84 14.55 0.59 320.80.84 20.35 1.53 320.3 0.84
335335.50.89 7.66 1.11 334.70.92 12.23 0.88 335.70.94 16.82 1.36 335.80.89 19.29 1.91 334.70.92 25.91 2.56 335.3 0.91
345345.21.09 10.00 2.30 345.81.03 16.45 4.06 346.60.99 21.57 4.58 346.20.96 24.97 5.08 345.30.99 33.23 7.23 345.8 1.01
375374.91.15 12.86 4.02 375.41.14 21.91 7.15 375.41.10 28.16 8.42 374.61.16 31.89 9.32 375.61.14 42.01 12.87 375.2 1.14
385384.81.23 13.40 5.34 385.31.15 22.82 9.34 385.81.20 29.31 11.45 384.31.24 33.19 13.34 386.41.27 43.70 17.31 385.3 1.22
485485.62.13 13.43 6.20 485.22.14 22.87 10.54 485.92.12 29.36 12.74 486.52.19 33.26 14.64 485.32.09 43.79 18.81 485.7 2.13
525524.72.70 13.43 6.56 526.12.67 22.87 11.06 525.62.63 29.36 13.40 524.22.68 33.26 15.21 525.62.76 43.79 19.33 525.2 2.69
565565.33.52 13.43 6.99 566.43.42 22.87 11.68 564.33.32 29.36 14.02 563.33.48 33.26 15.84 565.73.28 43.79 20.07 565.0 3.40
T—pyrolysis temperature, °C; Qoil—cumulative yield of oil, mg/g rock; Qgas—cumulative yield of gas, mL/g rock; Ro—vitrinite reflectance of shale organic matter, %.
Table 4. Basic geochemical data of the original unheated shale samples and oil and gas yields.
Basic GeochemicalPressure, Psi/MPaOil Yield, mg/g RockGas Yield, mL/g Rock
TOC, wt.%7.820/0108.346.30
S2, mg/g rock66.77100/0.791.978.40
Tmax, °C425250/1.764.1610.34
HI, mg/g TOC853.78500/3.541.5212.77
Ro, %0.37725/533.1815.87
Table 5. Recoverable oil and gas resources of in situ-converted shale section of Nenjiang Formation in Songliao Basin.
FormationOil, 108 tGas, 1012 m3Area, km2
Bottom of Nenjiang Formation II140.859.2282,214
Middle of Nenjiang Formation I123.827.6077,407
Bottom of Nenjiang Formation I27.351.7644,781
Total292.0218.58
Overlap area 82,214
Disclaimer/Publisher’s Note: The statements, opinions and data contained in all publications are solely those of the individual author(s) and contributor(s) and not of MDPI and/or the editor(s). MDPI and/or the editor(s) disclaim responsibility for any injury to people or property resulting from any ideas, methods, instructions or products referred to in the content.

