Article

Evaluation of Biogas Production from Swine Manure Using a UASB Reactor (Upflow Anaerobic Sludge Blanket) with Long-Term Operation

by
Ana Marcela Mosquera
*,
Juan Martín Delgado
,
Aura Alexandra Ramón
,
Juan Esteban Vásquez
and
Mariana Peñuela
Grupo de Investigación Bioprocesos, Departamento de Ingeniería Química, Facultad de Ingeniería, Universidad de Antioquia, Calle 70 No 52-21, Medellín 050010, Colombia
*
Author to whom correspondence should be addressed.
Energies 2024, 17(11), 2723; https://doi.org/10.3390/en17112723
Submission received: 3 April 2024 / Revised: 30 April 2024 / Accepted: 2 May 2024 / Published: 3 June 2024
(This article belongs to the Topic Biomass for Energy, Chemicals and Materials)

Abstract

:
To meet Colombia’s energy needs by 2050, a total installed capacity of 42 MW across its power generation infrastructure is required. To achieve this, transitioning to cleaner energy sources, such as biomass—a non-conventional renewable energy—is necessary. Biomass is a promising renewable source for thermal and electrical energy production. This study researched the production of biogas from swine manure using a UASB reactor to valorize this waste. Swine manure was collected every 20 days from a pig farm with a capacity of 200 sows, located in Santa Rosa de Osos, Antioquia. The flow rate was increased three times (1.30 L d−1, 1.62 L d−1, and 2.08 L d−1) to reduce the hydraulic retention time (HRT) and enhance biogas production. The volatile and total solids, chemical oxygen demand (COD), alkalinity, and biogas composition were measured over one year. The proposed system achieved 87.40% COD remotion from the feed stream and generated a yield of 507 mLCH4 gVS−1, with an HRT of 19 days and an OLR of 4.27 gCOD L−1 d−1. The reactor produced biogas with a CH4 content of 67.7%, CO2 content of 18.1%, and H2S content of 1413 ppm. This study highlights the effectiveness of the UASB reactor for biogas production using swine manure as a substrate.

1. Introduction

The worldwide installed renewable energy capacity has increased by 37% over the past 12 years, reaching 3.37 TW in 2022, and it is projected to reach 7.30 TW by 2028. This growth is attributed to the implementation of renewable energy policies in some countries and the decreasing costs of solar and wind technologies for electricity production. Countries like Colombia, which have abundant water resources, have historically relied heavily on hydropower, which has met over 70% of Colombia’s energy demand in the last ten years [1,2]. Nevertheless, the contribution of non-conventional renewable energy sources (NCRES) to the country’s energy generation remains limited. In 2022, solar photovoltaic and wind power accounted for 0.6% and 0.1%, respectively, of the total energy generated [3]. This suggests a high reliance on hydroelectric power plants for the supply of electricity in the country.
According to the Mining-Energy Planning Unit (UPME, its acronym in Spanish), NCRES have the potential to fulfill up to 46% of Colombia’s energy needs. Biomass, small hydroelectric power plants, geothermal power, solar power, and wind power plants are classified by the UPME as NCRES in Colombia [4]. To expand and diversify its energy matrix, the Colombian Government has set ambitious goals in the National Energy Plan 2020–2050 (PEN, its acronym in Spanish). The PEN proposes that by 2050, Colombia will reach an installed capacity of 42,709 MW, distributed as follows: 43.2% from NCRES, 37.4% from hydroelectric plants, and 19.2% from thermoelectric plants [3]. This is to prevent energy rationing due to the reduced water storage in reservoirs during droughts (e.g., the El Niño phenomenon) and to avoid increases in energy costs.
The use of biomass to generate biogas for energy purposes has been steadily increasing worldwide. Biogas is generated through anaerobic digestion (AD), which relies on a consortium of bacteria (hydrolytic, acidogenic, acetogenic, and methanogenic) that decompose the organic matter of biomasses under anaerobic conditions to generate biogas. Biogas is a gaseous mixture composed mainly of methane, carbon dioxide, nitrogen, and traces of hydrogen sulfide, ammonia, and oxygen, among other components [5]. In addition, a by-product of the process called digestate that can be used as a biofertilizer on agricultural crops, given its nitrogen, phosphorus, and magnesium content, is generated [6]. China leads among the IEA Bioenergy Task 37 member countries, with over 100,000 biogas plants generating 72,000 TWh per year, followed by Germany, with more than 10,000 plants that generate 120 TWh per year. The primary uses of these biogas plants are for heat and electricity generation [7]. In the South American context, Brazil leads in the implementation of biogas technologies, with 755 plants in operation and generating 12TWh per year, corresponding to a biogas generation of 2.82 billion Nm3 year−1 [8].
In Colombia, an increasing number of studies are being conducted to produce biogas from biomass sources. A study conducted by the Colombian National University (UNAL) in 2018, established that the theoretical potential for biogas production from biomass was 149,436 TJ year−1 and the estimated technical potential was 53,554 TJ year−1, which is equivalent to approximately 25% of the demand for natural gas in 2016 in Colombia [9].
The pig sector is important in the Colombian livestock development. According to reports from the Colombian Association of Pig Producers (Porkcolombia), a growth rate of 7.1% was seen during the last decade, with production reaching 5.2 million pigs per year. The department of Antioquia represents 43% of the national pig production, becoming one of the most important suppliers of this sector [10]. According to research conducted by Pessuto et al. [11], a pig produces approximately 3.13 kg of manure per day. This is equivalent to 2.7 million tons of excrement annually, based on the country’s current production. The considerable amount of waste produced has become an environmental problem due to the challenges associated with its disposal. This includes the production of greenhouse gases (GHGs), such as carbon dioxide (CO2) and methane (CH4), from the degradation of organic matter in the open air [12]. On the other hand, the unregulated irrigation of feces on soils, as a form of biofertilization, due to its nitrogen, phosphorus, and potassium content [13], can cause an over-accumulation of nutrients in soils, resulting in the contamination of groundwater [14].
In Colombia, biogas production using swine manure has been studied mostly in systems with high HRTs and high solid load capacities, such as Taiwan-type biodigesters or stirred tanks and the choice between them depends on the farm’s size [15,16]. On the other hand, there are other anaerobic reactors with more efficient designs, such as the UASB. This reactor offers several advantages: simple design, small space requirement, low operating costs, minimal sludge production, and a high COD removal efficiency suited to short hydraulic retention times and low levels of total solids [17]. They should be tested for this kind of process in local conditions to assess their applicability in the pork industry and to improve their biogas productivity.
Lee et al. [18] conducted a study to determine the theoretical production of biogas from the elemental composition of pig feed in Korean specialized farms; they reported 0.39 Sm3 CH4 kgVS−1 and 30.96 Sm3 CH4 ton−1 of swine manure (sm3 refers to the volume of gases at standard conditions, at a pressure and temperature of 1 atm and 0 °C, respectively). In 2021, Porkcolombia also carried out a study to establish the potential for biogas generation from swine manure; they evaluated four specialized farms located in different regions of the country and established, through theoretical models based on the elemental composition of the feed, that the maximum methane production or theoretical methane biochemical potential (TMBP) in the anaerobic fermentation process of Colombian pigs ranges between 0.58 and 0.45 m3 CH4 kgSV−1 [16]. Additionally, they found, through experimental methods under laboratory conditions, that methane production was in a range between 0.16 m3 CH4 kgSV−1 and 0.38 m3 CH4 kgSV−1, values that were close to those reported by the Korean study. A Brazilian study reported that swine manure from a nursery house presented the highest biogas and methane yield capacity, at 0.97 Nm3 kgVS−1, followed by the farrowing sows at 0.86 Nm3 kgVS−1, finishing pigs at 0.47 Nm3 kgVS−1, and gestation sows at 0.32 Nm3 kgVS−1 [19]. Swine manure can exhibit a wide range of organic matter content due to variations in feed composition, which are influenced by factors such as pig age and the feeding practices employed throughout the pig farming cycle [20,21].
In this study, an Upflow Anaerobic Sludge Blanket (UASB) reactor was monitored for 360 days using swine manure as a substrate to evaluate the process of biogas production. This study did not maintain a fixed organic loading rate (OLR), but instead aimed to simulate the fluctuating conditions that occur in a pig farm. The feed flow was increased three times, seeking to reduce the HRTs, and various parameters were monitored for subsequent evaluation. The long-term operation was conducted to observe the impact of parameter changes on biogas production, with the aim of applying this knowledge to scale up the project to a pilot plant in the future.

2. Materials and Methods

2.1. Collecting and Handling Substrate

The pig feces used in this study were kindly donated by a pig farm located at coordinates 6°45′37″ N, 75°30′10″ W, owned by Agrofranpabel SAS, Colombia. Approximately 40 kg of fresh feces were collected from gestation crates every two weeks, after the first feeding of the day (around 9:00 a.m.). The samples were transported in sealed containers for three hours to the University of Antioquia facilities and stored at 4 °C. A portion of feces was used every five days to prepare the feeding solution, following the proportions described later in Section 2.3.

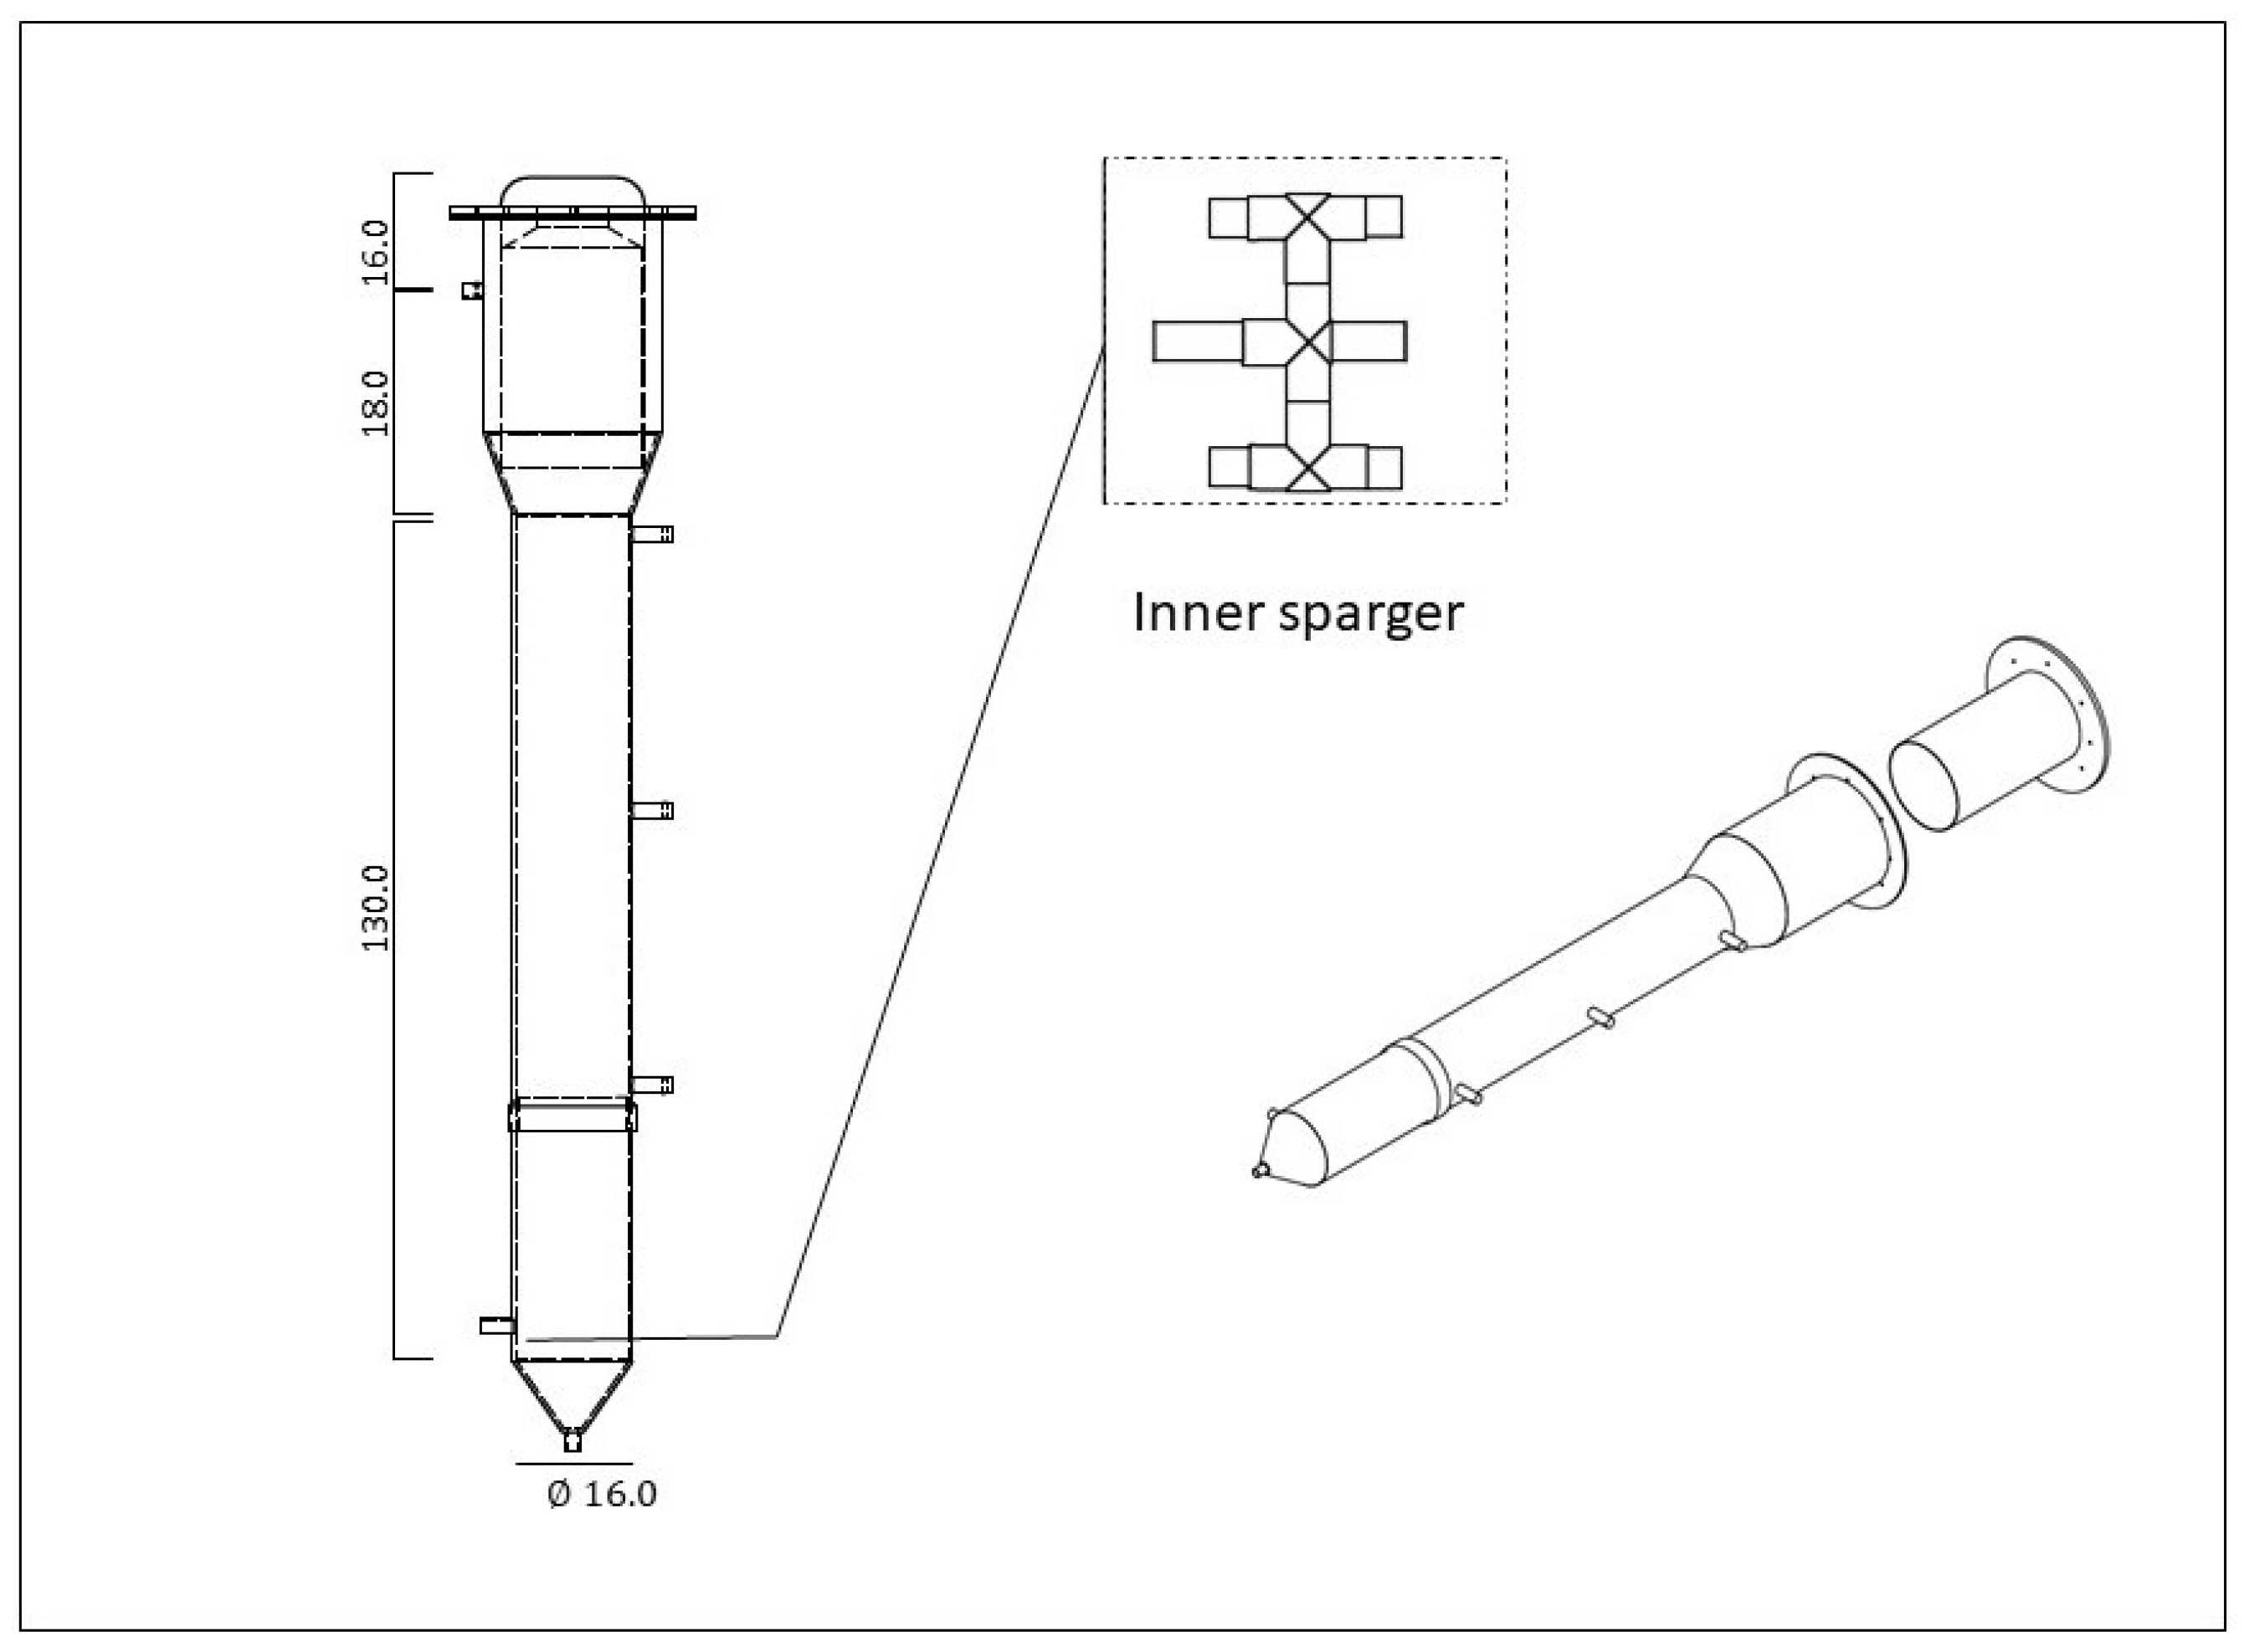
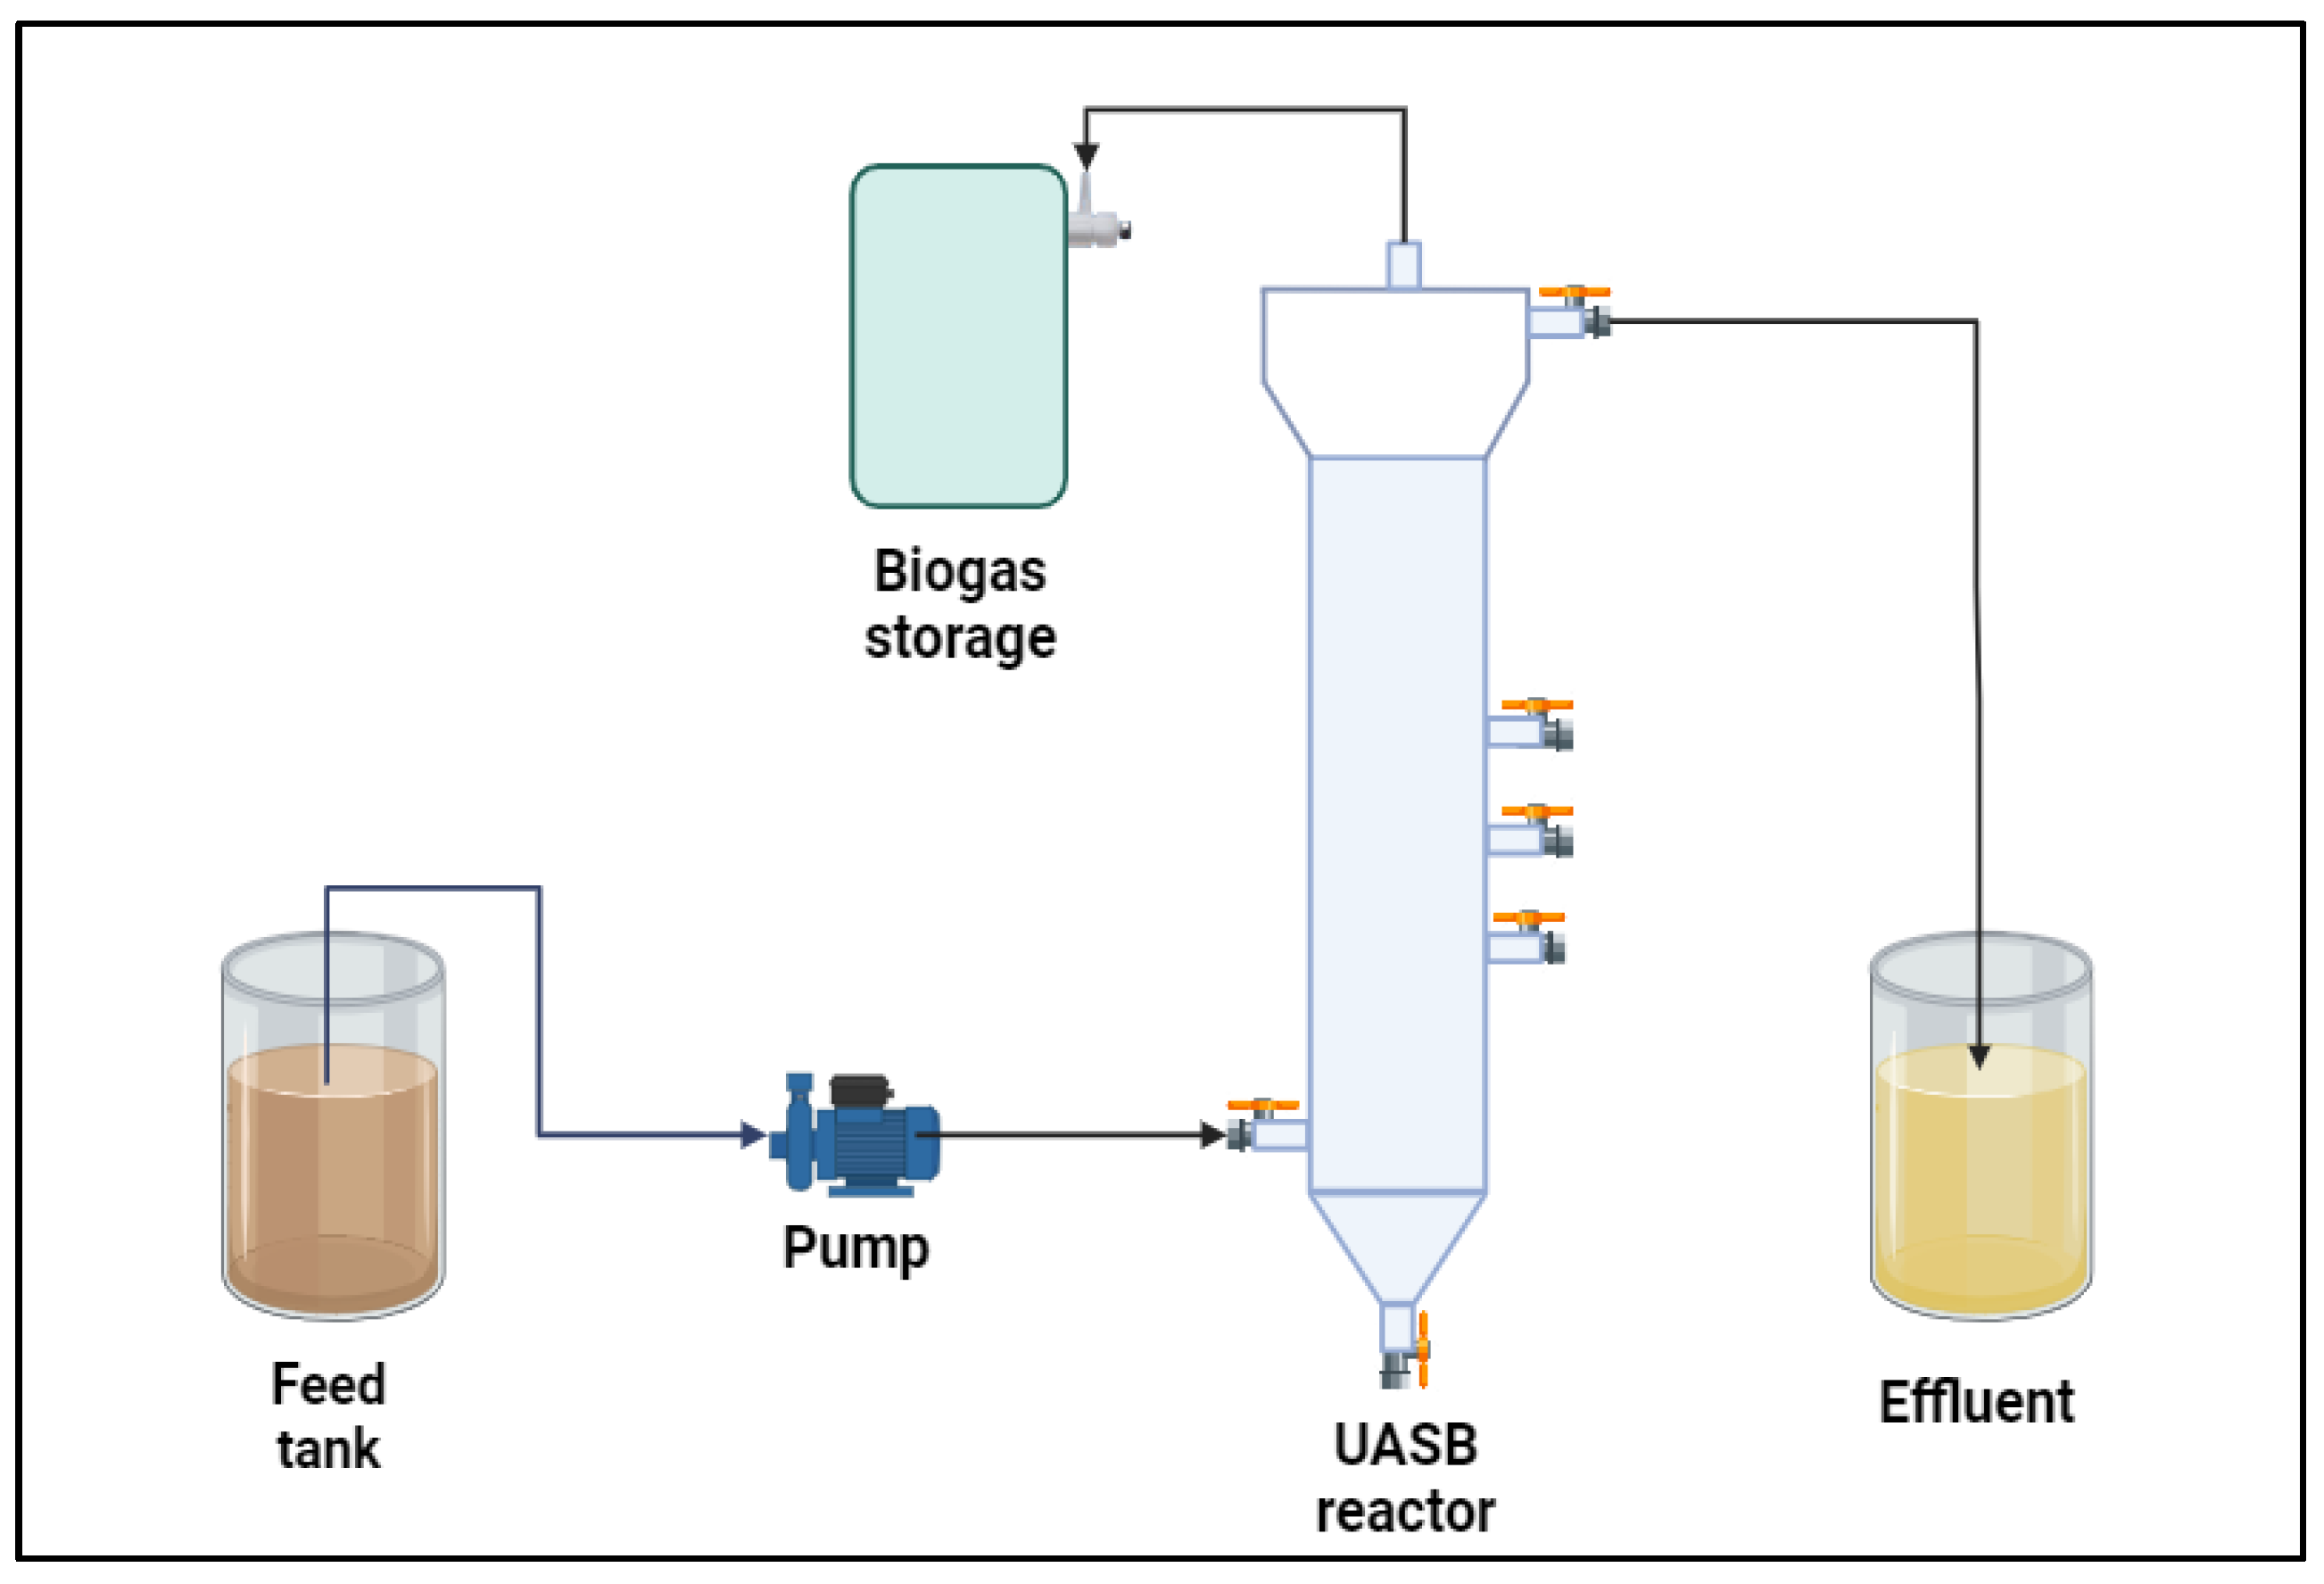
2.2. Upflow Anaerobic Sludge Blanket (UASB) Reactor for Biogas Production

The reactor type was selected for its capacity to support COD levels in the range of 30–80 gO2 L−1 and OLR up to 15 gCOD L−1 day−1 [22], which is crucial for this study given that pig manure typically exhibits COD values within this range. Furthermore, biogas production of 8.7 L day−1 has been reported, accompanied by high organic matter remotion due to the granular sludge formed [17]. A UASB reactor requires less space per cubic meter of waste treated and has higher biogas productivity compared to the anaerobic digestion systems commonly used in swine farming. This technology is interesting for our study as it serves as an alternative for the generation of energy and waste treatment from an environmental perspective, particularly in future works.
The reactor was manufactured in the Bioprocess laboratory located at Universidad de Antioquia, using glass fiber and polyvinyl chloride (PVC) pipe accessories. The reactor had a total height of 174 cm, a wall thickness of 0.4 cm, and a volumetric capacity of 40 L. The reactor consisted of 2 sections: 1 reaction column and 1 liquid gas separator, with 26 L and 14 L capacity, respectively. The reaction column featured a cylindrical geometry with an internal diameter of 0.17 m and a height of 1.3 m, equipped with 3 sampling ports. The liquid gas separation section consisted of an internal bell with a height of 0.34 m and an internal diameter of 0.2 m (Figure 1). All inlets and outputs of the UASB reactor have an internal diameter of 0.02 m and are coupled to a PVC ball valve.

2.3. Performance Evaluation of UASB Reactor for Biogas Production Using Swine Manure

The swine manure solution used as a feeding substrate was prepared by mixing 1 part of fresh swine manure with 4 parts of tap water based on preliminary results. The mixture was prepared every 5 days using a propeller agitator (IKA RW20, Staufen, Germany) equipped with a Rushton-type impeller. It was stirred for 10 min, left for 20 min for solids sedimentation, and only the aqueous phase was moved to the feed tank to prevent hose obstruction by solids present in the swine manure. To evaluate the biogas production process, anaerobic sludge, kindly donated by Planta de Tratamiento de Aguas Residuales San Fernando, a wastewater treatment plant in Medellin, was used. For the inoculation process, 20 L of clean water, 9.6 L of sludge, and 2.4 L of swine manure were used. The mixture was then pumped using a peristaltic pump (Stenner PUMPs 45MHP10, Jacksonville, FL, USA) through a neoprene hose of 77 mm gauge with high chemical resistance. After this, the reactor remained static for two weeks to allow for an adaptation period to the substrate.
To increase biogas yield, a strategy of gradually increasing the feed flow rate was implemented each time a stable trend was reached in the reactor (quasi steady state). As a result, the flow rate was increased three times (1.3 L d−1, 1.6 L d−1, and 2.1 L d−1), obtaining an HRT of 31, 25, and 19 days, respectively. Figure 2 depicts the process diagram. The average local atmospheric pressure was 100.7 kPa and the ambient temperature was 24 °C.
Throughout 360 days of monitoring, samples were collected weekly from affluent and effluent, and biogas. During the monitoring process, each stream underwent characterization including the measurement of various parameters, detailed in Section 2.3 and Section 2.4. During experimental development, the organic load rate (OLR) was not controlled, as the aim was to simulate the daily activity of a pig farm where parameters are constantly changing.

2.4. Swine Manure Characterization

2.4.1. Determination of Total Solids

Total solids (TS) were measured according to method 2540B from Standard Methods for Examination [23]. Briefly, samples were collected in triplicate, with each sample having a volume of 15 mL. Briefly, 15 mL of swine manure was dried in porcelain capsules for 24 h at 105 °C in a convection oven (Binder FD-115, Tuttlingen, Germany). Following this, the samples were placed in a desiccator until they reached room temperature. The calculation for quantifying the total solids in the sample is described below in Equation (1). An analytical balance (Shimadzu ATX-224, Kyoto, Japan) was used for weighing the samples.
g   total   solids / g   sample = A B C
where A is the weight of the dried sample in the capsule, B is the weight of the empty capsule and C is the weight of the sample.

2.4.2. Determination of Volatile Solids

Volatile solids (VS) were measured according to method 2540E from the Standard Methods for Examination [23]. Samples were analyzed in triplicate and initially dried to remove moisture content. After the drying process, the samples were heated to 550 °C for 2 h using a muffle furnace (Thermo Scientific FB1410M, Waltham, MA, USA). Following this, the samples were placed in a desiccator until they reached room temperature. The calculation for quantifying the volatile solids in the sample is described below in Equation (2) and is based on the change in weight, measured with an analytical balance (Shimadzu ATX-224, Kyoto, Japan).
g   volatile   solids / g   sample = A D C
where D is the weight of capsule, A residue after leaving the muffle and C is the weight of the sample.

2.4.3. Determination of Volatile Fatty Acids (VFAs) and Alkalinity (ALK)

Volatile fatty acids (VFAs) and alkalinity (ALK) were measured using the Kapp Method (1984), developed for mesophilic anaerobic digesters. To implement this method, the effluent samples were collected in triplicate, with each sample having a volume of 40 mL, then these were centrifuged at 5000 rpm for 10 min using a centrifuge (Sigma 2-16PK, Osterode am Harz, Germany) to avoid any solid particles and then, the liquid supernatant was titrated using sulfuric acid 0.1 N (ITW reagents, Milan, Italy), at three final pH points: 5.0, 4.3, and 4.0. Titration was conducted using an automatic titrator (SI Analytics TL-7000, Mainz, Germany), ensuring precise and accurate measurements of the VFA and ALK levels in the samples.

2.4.4. Quantification of Chemical Oxygen Demand (COD)

Chemical oxygen demand (COD) was measured using the 8000 method from Hach instruments, employing COD TNTPLUS Vials Test by Hach (Product Number: TNT82206). For this process, 200 µL of homogenized sample was introduced into a vial and placed in a thermoreactor (Hach DRB-200, Ames, IA, USA) at 150 °C for 2 h for the reaction to take place. After completing the reaction time, the samples were allowed to cool. Then, their concentration of COD was measured using a colorimeter (HACH DR-900, Ames, IA, USA).

2.4.5. Calculation of Organic Load Remotion Using COD as a Parameter

The calculation of organic load remotion can be performed using a variety of reference parameters, including COD and VS. It indicates the efficiency of a treatment process in removing organic pollutants from the influent. In this study, COD is employed as the reference parameter, and the remotion is calculated in accordance with Equation (3).
% COD   remotion = C O D i n C O D o u t C O D i n × 100
where CODin and CODout are the values of the chemical oxygen demand (gO2 L−1) corresponding to the feed and effluent streams of the reactor.

2.5. Determination of Performance of Reactor UASB fed with Swine Manure

2.5.1. Measurement of Biogas Production

A High-Density Polyethylene (HDPE) bag with a capacity of 150 L and a thickness of 0.5 mm was used to collect the biogas produced by the UASB reactor. Biogas production was measured using a conventional gas meter of the diaphragm type (Koreabi Shin Han Precision G-1.6, Seoul, South Korea). Biogas production in each period was calculated using Equations (4) and (5).
V biogas = V f V i
Biogas   production = V biogas   time
where Vbiogas is the volume of biogas measured in liters, Vf and Vi are the final and initial reading of the gas meter in liters, respectively, and time is the period in which the biogas sample was collected in days.

2.5.2. Biogas Composition Analysis

The composition of biogas was determined using a biogas analyzer (MRU AIR Optima7, Rostock, Germany) attached to the biogas HDPE bag. The analyzer quantified the content of methane, carbon dioxide, nitrogen, and oxygen in volumetric percentage (%V/v). Hydrogen sulfide content was quantified in volumetric parts per million (ppm).

3. Results

3.1. Swine Manure Characterization

In Table 1, the characterization of the swine manure solution used for this study is presented. Despite the swine manure collected always being from breeding females, the standard deviation values were high, likely due to uncontrolled factors such as changes in feeding, weather conditions, and the natural degradation of the organic matter present in the swine manure due to environmental conditions.
The swine manure solution presented a COD value of 39.154 ± 13.992 g O2 L−1, a TS value of 3.35 ± 1.33%, and a VS value of 2.39 ± 0.98% (Table 1). The high variation in these parameters (35–40%) indicates that, although the ratio of pig feces/water used in the feed was constant, this parameter varied significantly due to the productive conditions of the pig farm. High temperature is one of the most important climatic factors influencing pig performance [24]; in a meta-analysis, Renaudeau et al. [25] showed that high temperatures have an undesirable effect on the voluntary feed intake and body weight gain, with this effect being more pronounced in heavier pigs. Collin et al. [26] found a significant decrease in the voluntary feed intake (45 g d−1) and body weight gain (37 g d−1) in group-housed young pigs between temperatures of 23 and 33 °C. Climatic variations resulting from current weather conditions cause irregular feeding patterns, which are reflected in the composition of swine manure. In addition, the growth of fungi and other microorganisms, which reduce the available organic matter prior to entering the reactor, is often caused by the sub-optimal storage conditions of agro-industrial waste. However, this reflects the genuine state of a pig farm and any system seeking to harness the benefits of pig waste must exhibit tolerance for such substrate variability. This is why we designed the experiment to simulate laboratory conditions closely resembling the actual operational environment of the proposed system by intentionally avoiding initial organic load control. Despite this variation, the VS/TS ratio tends to remain stable, with a variation of less than 4.7% with an average value of 0.72. The variability in the composition is permanent and difficult to control, since it is also strongly affected by humans, who carry out cleaning tasks and perform the final disposal of the pig manure. These situations never interrupted the biogas generation process, providing evidence of the adaptation capacity of microorganisms within the UASB reactor.
Wu et al. [27] reported that the pig manure they used for biogas production had a TS value of 23.1%, a VS value of 18.0%, and a COD value 243 gO2 L−1. These values were higher than those reported in this study because it was not filtrated or diluted with water; however, the VS/TS ratio of 0.78 is very close to ours, showing that despite the differences in the production processes of the pig farming cycle and the proportion of water in the swine manure, the VS/TS ratio is only slightly affected by these changes. Lansing et al. [28] reported that swine manure diluted with wash water in a 4:1 ratio had a pH of 7.5, a COD of 20 gO2 L−1 and a VS value of 1.37%. This characterization shows that pig manure has a pH that tends to be alkaline and is consistent with the values reported in this study. On the other hand, due to its dilution with water, the values of the VS and COD were lower compared to those reported by Wu et al. [27] and closer to those reported in this study.

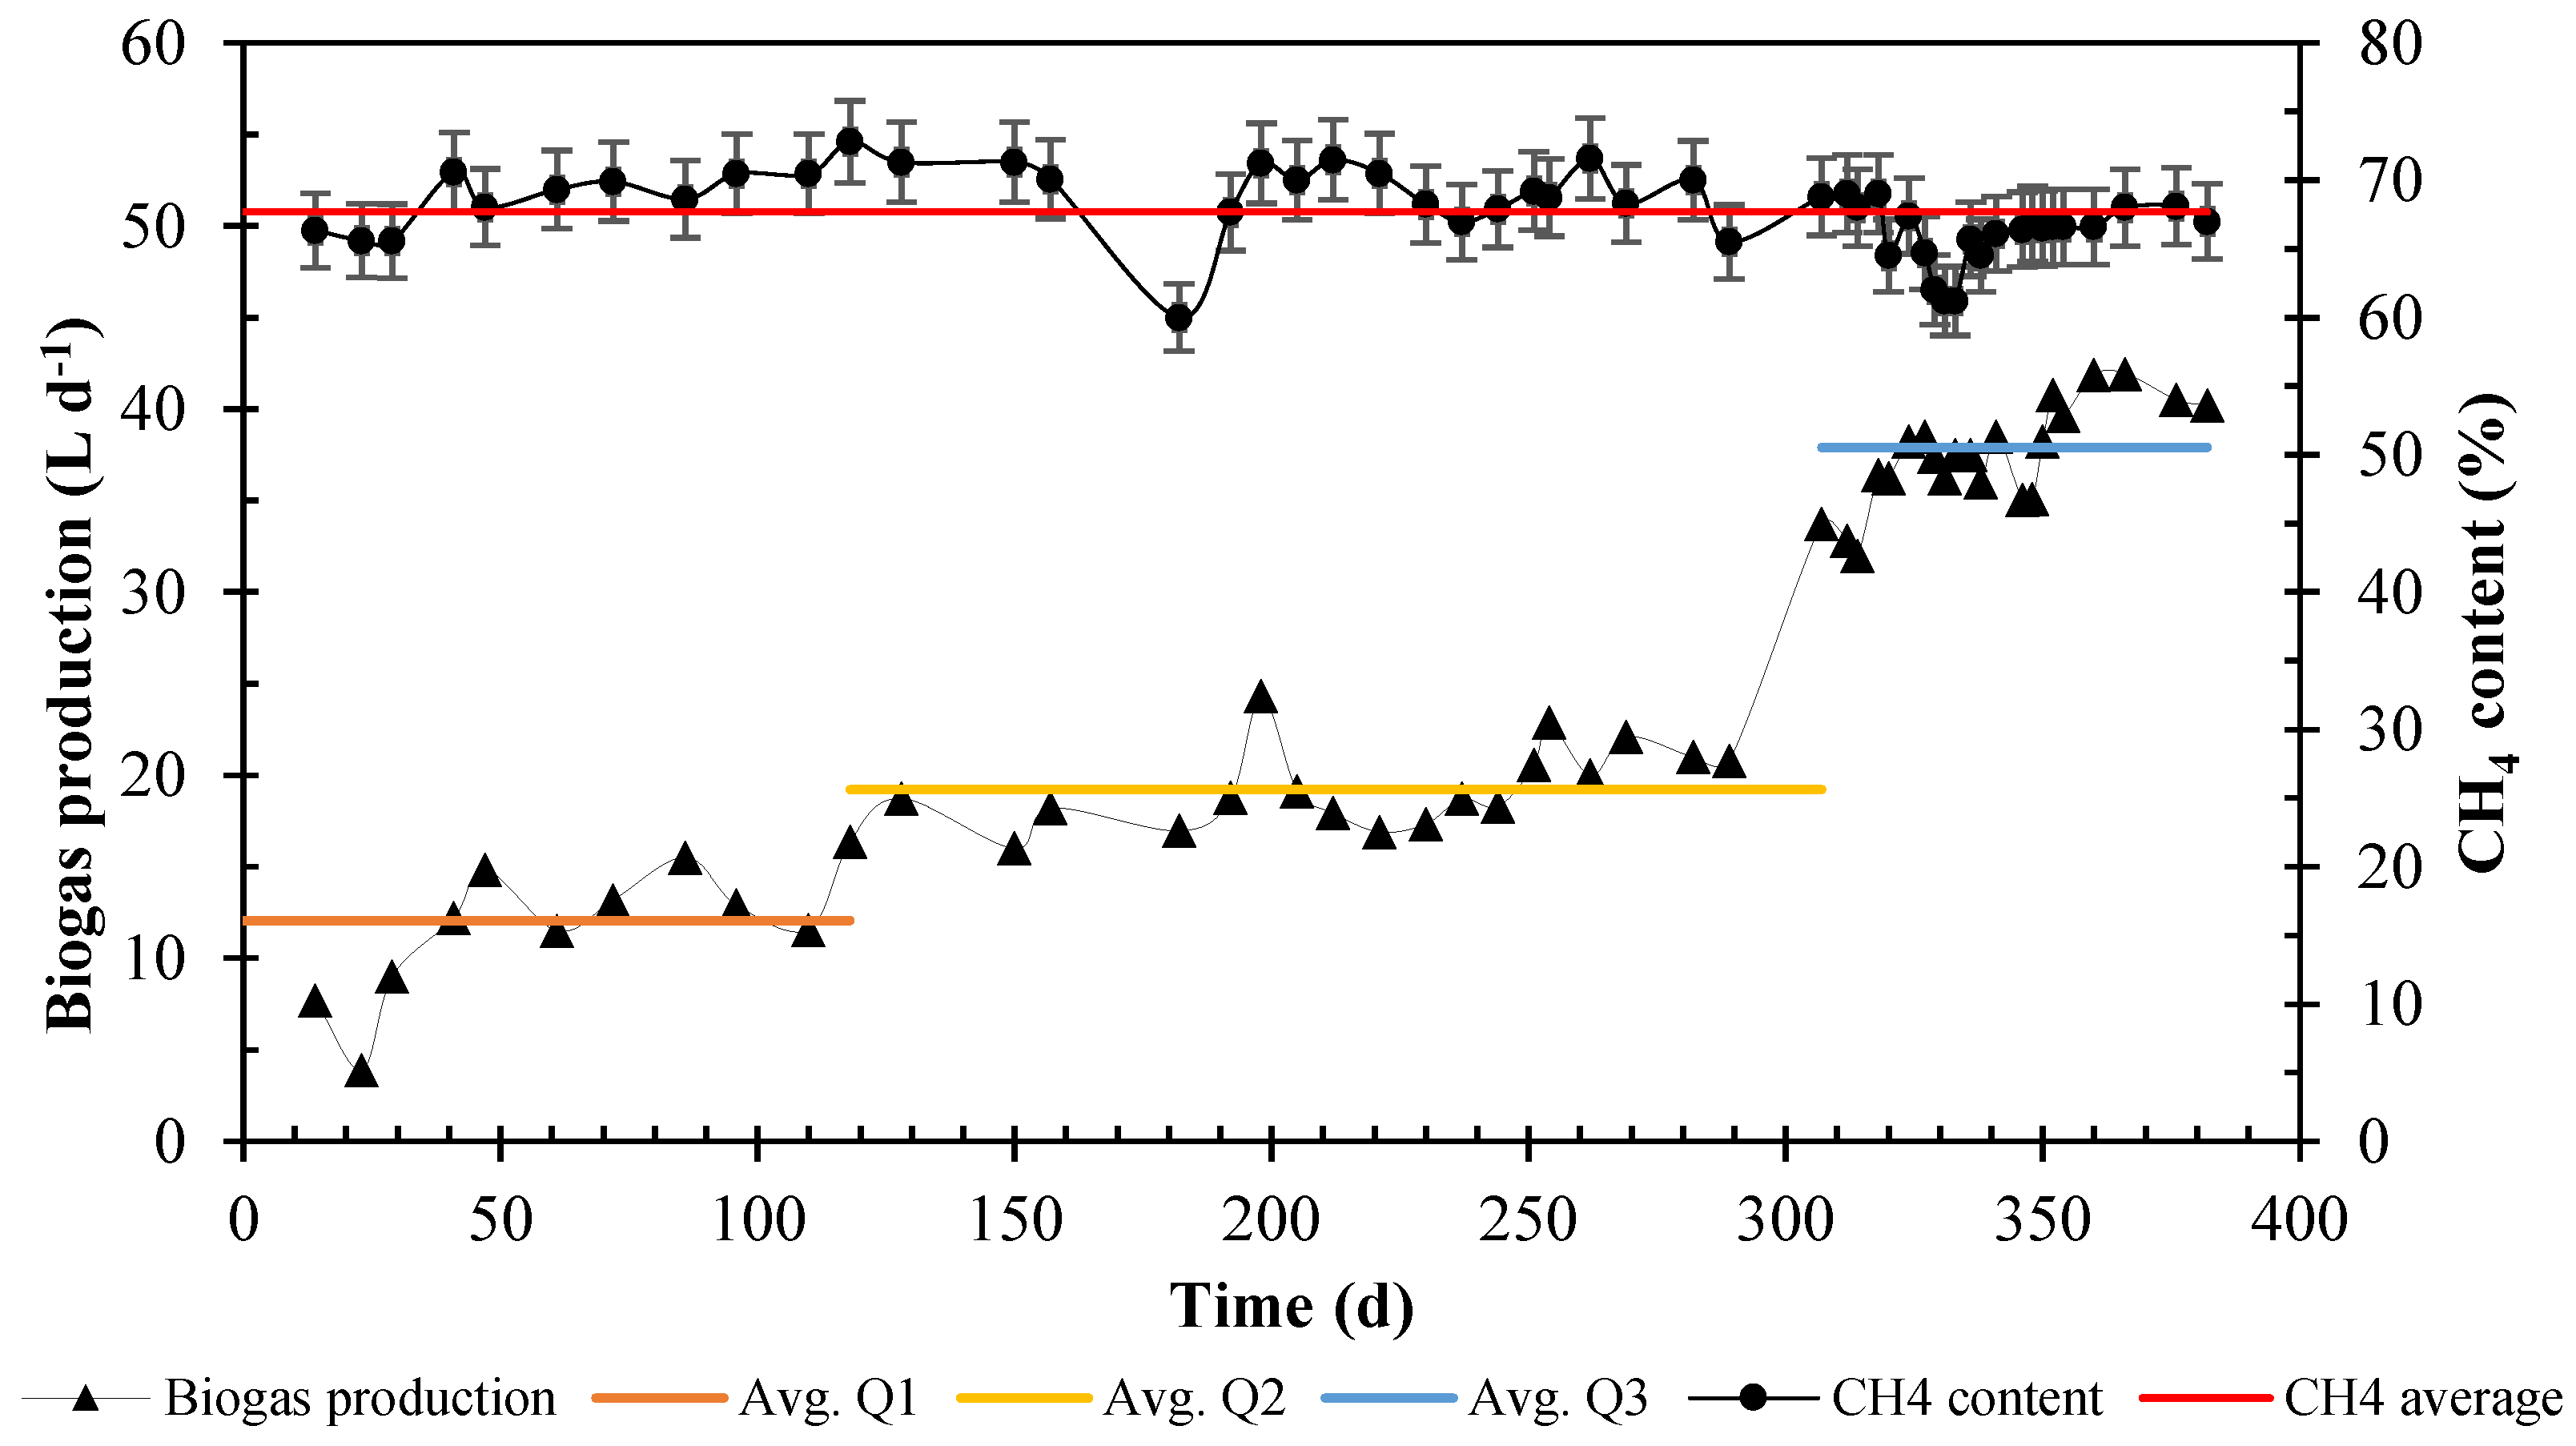
3.2. Reactor UASB Performance for Biogas Production

The stability trend was identified twice over the course of a year of monitoring and evaluation. The proposed feeding system allowed the established flow values to be met; however, it is not the most suitable for this substrate. A monthly cleaning and maintenance routine was necessary for the neoprene hoses to prevent clogging and breakage. In addition, undigested grain was detected, which did not settle in the feed tank and entered the hoses. To address this issue, starting from the second month of operation, the aqueous phase of the substrate was filtered through a stainless steel strainer with a pore size of 1 mm2. The presence of numerous unusual elements, such as stones, wires, packing fibers, and even nuts, which are often found in the substrate, can eventually cause interruption in the pumping of the substrate. These elements are a consequence of cleaning procedures used in pig fattening pens. This factor must be considered when designing pumping systems for mixtures of pig manure or other animal feces. We suggest using a slurry pump that is non-clogging and can tolerate particles bigger than 7 mm.
For the swine manure solution feed flows of 1.3 L d−1 (Q1), 1.6 L d−1 (Q2), and 2.1 L d−1 (Q3), the average biogas productions were 12.1 L d−1, 19.2 L d−1, and 37.9 L d−1, respectively (Figure 3). Likewise, the methane content has an average volume percentage of 67.69% with a standard deviation of 2.81%. This suggests that despite fluctuating flow and increasing the biogas production, the content remained stable within a reasonable range (standard deviation of 4.10%).
On the other hand, the rest of the components in the biogas were CO2, O2, N2, and H2S at 18.06%, 8.99%, 3.91%, and 1413 ppm, respectively, and according to the results obtained, the mean methane production yield was 507 mL CH4 gVS−1 when the reactor operated with an HRT of 19 days and an OLR of 2.68 gVS L−1 d−1.
The H2S concentration in raw biogas ranges from 50 to 10,000 ppm, depending upon the feedstocks [29]. H2S is formed during the microbiological reduction of compounds that contain sulfur, and it can lead to corrosion problems, damage to biogas equipment, generators, combustion engines, and other metal components [30,31]. A concentration higher than 500 ppm of H2S can cause unconsciousness and death in people; H2S content can be almost fully removed by several methods [32]. Wang et al. [29] evaluated the addition of biochar (BC), steam-treated wood, and untreated poplar wood chips as additives to reduce the H2S content in dairy manure; they found that adding 3 g of biochar per 500 g of manure during AD in a plug flow reactor can remove up to 90% of the H2S during the first week of treatment, without impacting CH4 production, thus making it a viable option for various end-use technologies.
On the other hand, biological methods can also be employed to reduce the H2S content in biogas. Kumdhitiahutsawakul et al. [32] investigated the efficiency of vertical and horizontal pilot-scale biofilters for H2S remotion in swine waste biogas, utilizing bacterial community analysis in both laboratory and pilot-scale biofiltration systems. This study revealed that a porous glass (PG) biofilter immobilized with Paracoccus versutus bacteria eliminated H2S when inlet concentrations ranged from 2005 to 3644 ppm H2S. The system operated consistently with a remotion efficiency of 99–100%, showing no fluctuations throughout the experiments. On the other hand, Agudelo et al. [33] evaluated H2S reduction using three materials: steel wool, iron rods, and compost (biofilter) in biogas produced from Palm Oil Mill Effluent (POME). The results showed that steel wool had a high potential for H2S remotion compared to the other materials, achieving a 99.7% remotion of H2S in a biogas with 1327 ppm H2S.

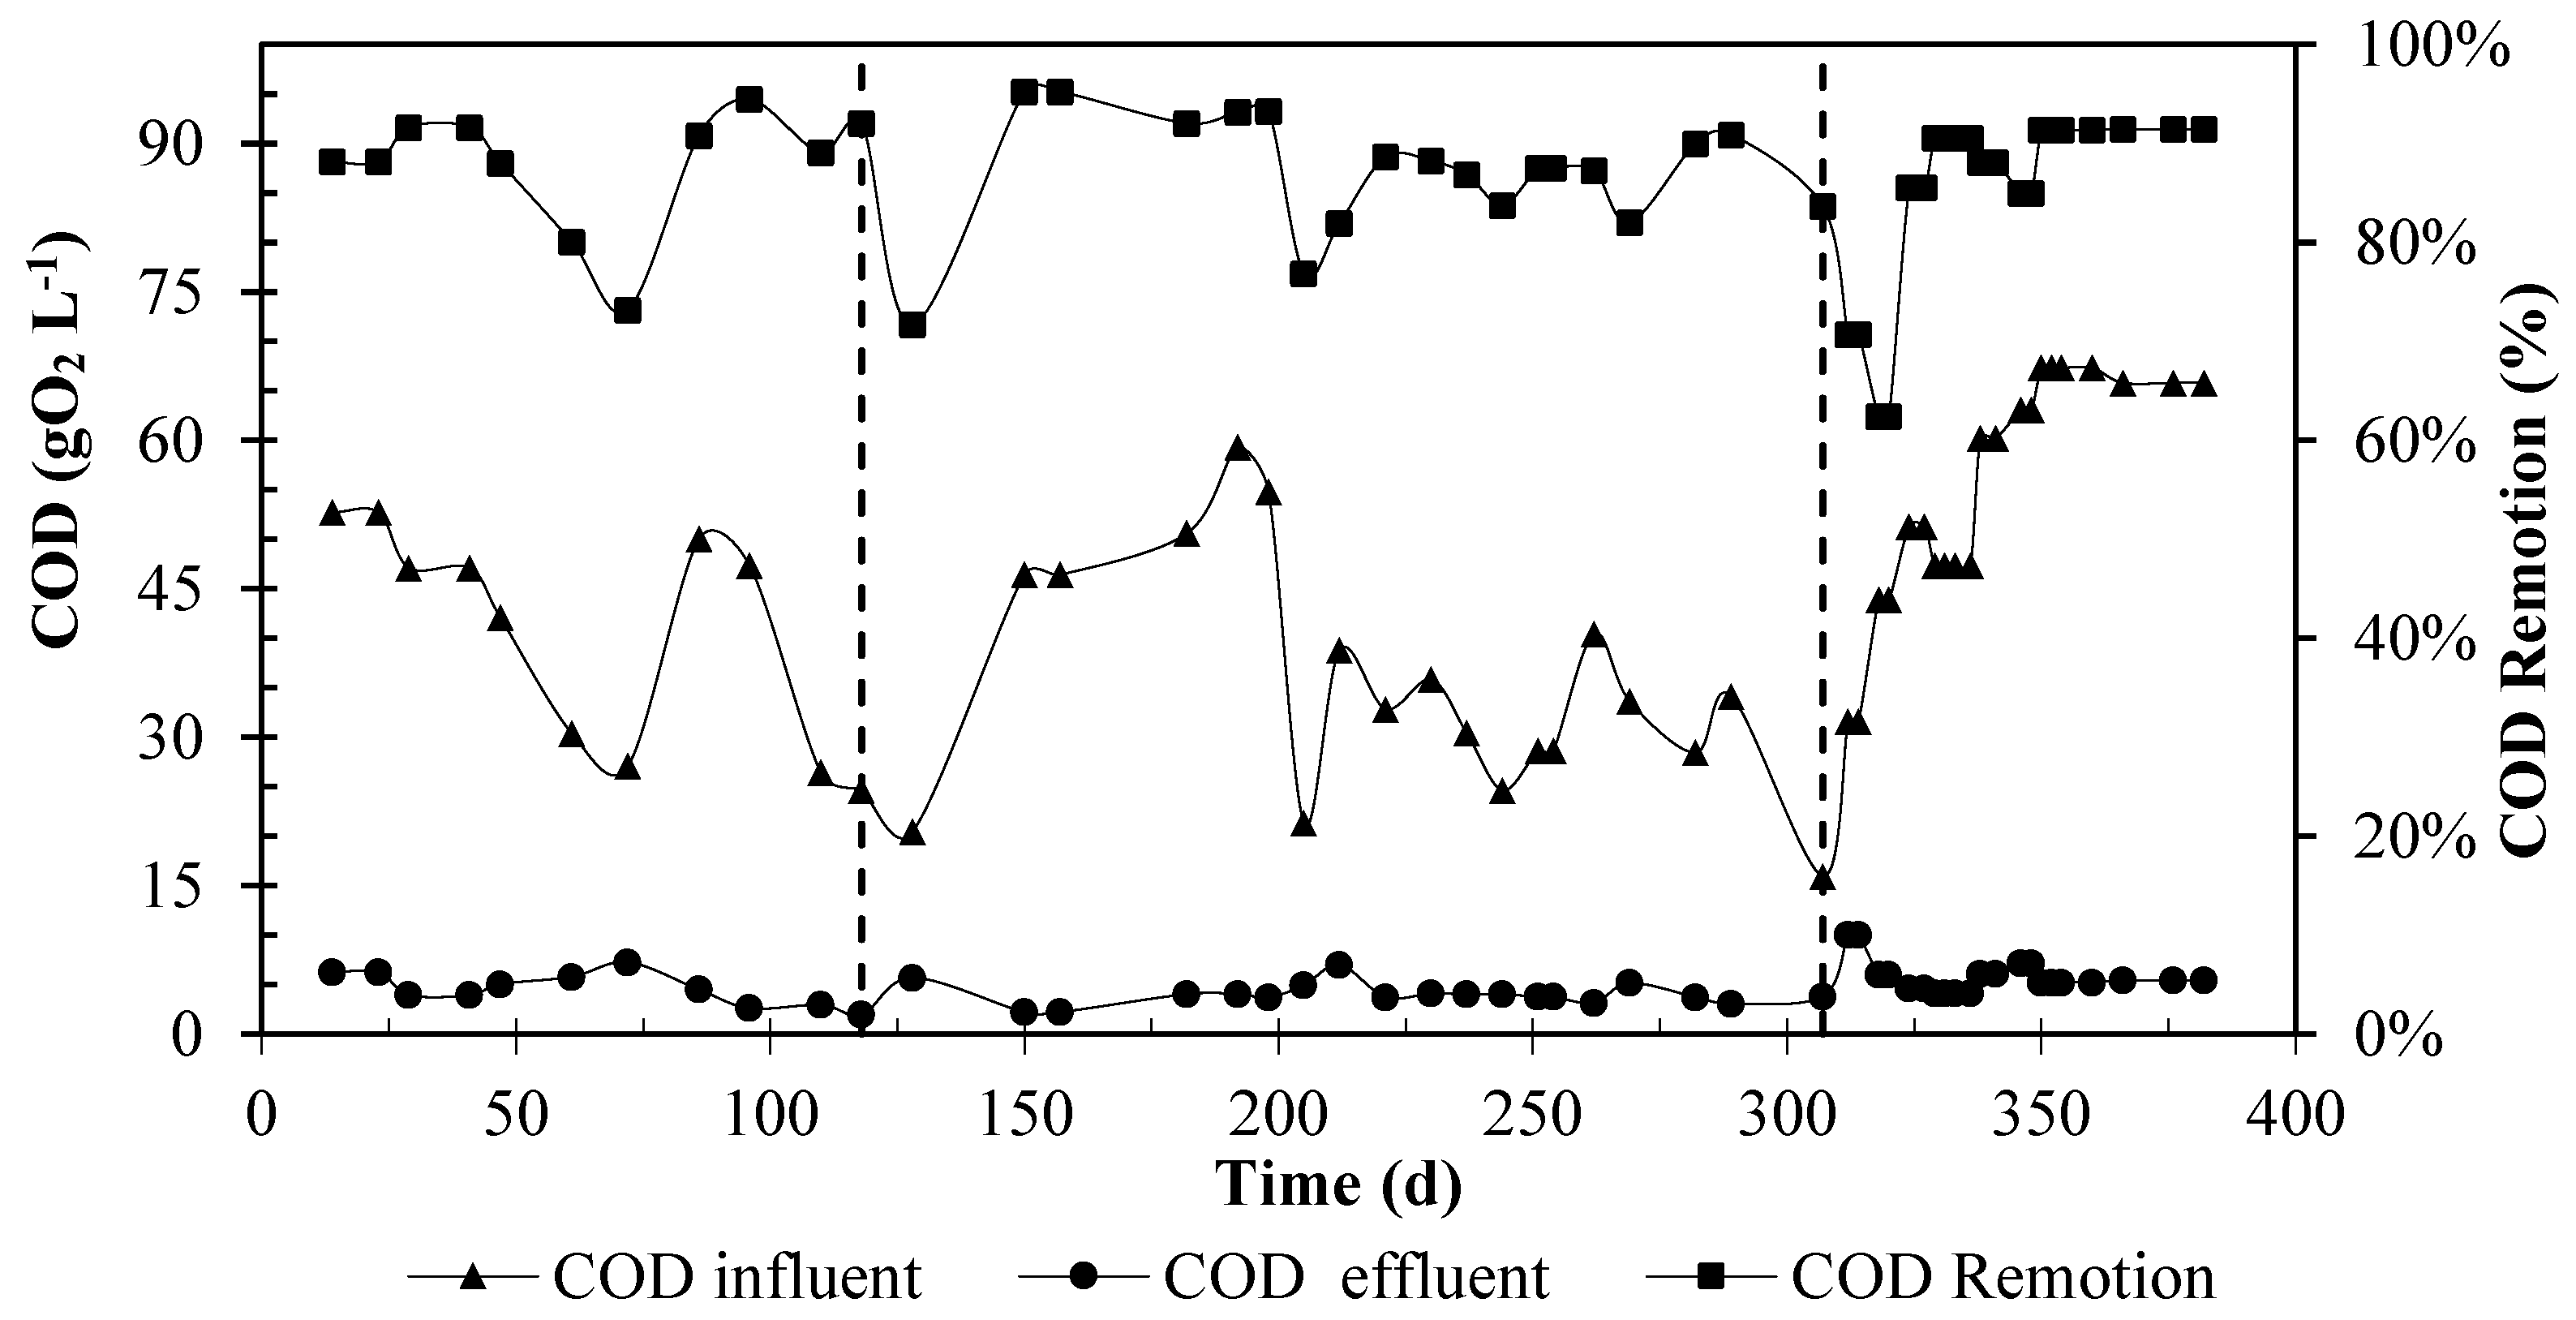
3.3. COD, VS, Organic Load Rate (OLR), and Hydraulic Retention Time (HRT) Results

The feed stream showed significant variations in the COD values, ranging from 15.95 g O2 L-1 to 67.30 g O2 L-1 (Figure 4). This variability is attributed to the fact that the COD is a parameter dependent on the organic load of the swine manure, and as previously explained, the composition of this substrate is influenced by factors such as pig metabolism and pig feed composition and its natural degradation.
Despite high variations in the feed stream, the biomass of the reactor responded well and showed stability, which is reflected in the fact that the COD of the effluent has a more constant behavior with an average value of 4.86 ± 1.66 g O2 L−1 and a remotion percentage of about 87.38%. Figure 4 shows two notable decreases in the percentage of COD remotion (days 128 and 320), which occurred immediately after the increase in the feed flow that was made in the system. These decreases are due to the adaptation time of the microorganisms to process more organic matter, which saturates their processing capacity and is reflected in the decrease of this parameter in the process. However, the remotion rate increases after a few days, indicating that the system can stabilize with increases in the OLR.
Considering these values (Figure 4) and the biogas production presented in Section 3.2. (Figure 3), it is evident that an increase in the feed flow leads to a rise in biogas production; this is due to the direct correlation between the OLR and the flow rate. On the other hand, the HRT of the process decreases as the feed flow rate increases while the working volume remains constant. The HRT values for Q1, Q2, and Q3 were 31 days, 25 days, and 19 days, respectively, which enabled the system to digest a greater amount of organic matter in less time, enhancing its efficiency, reducing the HRT by 38%, and maintaining high remotion efficiencies in the VS and COD, with values of 85.12% and 87.38%, respectively. These values exceed those reported by Duan et al. [34], who achieved remotion efficiencies in the VS and COD of 66.22% and 76.18%, respectively, while operating a CSTR with an OLR of 1.89 gVS L−1 d−1. Table 2 shows a summary of the different measured parameters and calculations for the three feed flows used.
The values for the COD reduction ranged from 61% to 90% (Figure 4). Comparing the higher or lower OLR, the stage with the highest OLR exhibited the higher average biogas production and an organic matter reduction of around 89%. Although a heightened OLR denotes an increased treatment capacity and methane yield, it may also precipitate overloading, thereby engendering process instability and even system failure [34], emphasizing the need for exercising caution with OLR increases. Table 3 presents additional findings on methane production from various authors, as reported in the literature.
The results presented in Table 3 show that the production of biogas from swine manure in a continuous reactor-type UASB is superior to those reported by other authors and shows great potential for its implementation in pig farms for the energy use of this type of waste. It is important to note that the results are comparable despite the operation temperatures being different, as this can be justified by the fact that the production of biogas in anaerobic digestion is enhanced when the system operates at higher temperatures in the mesophilic range (24–40°C) [37]. Therefore, in the context of the experiment, it could be stated that there is no advantage in operating at a lower temperature over the mentioned studies.

3.4. Alkalinity (ALK), Volatile Fatty Acids (VFAs), and ALK/VFA Ratio

Monitoring alkalinity (ALK) and volatile fatty acids (VFAs) in the process effluent stream is important because the stability of an anaerobic digestion process can be qualified by the VFA/ALK ratio. A study reported that a favorable VFA/ALK ratio to prevent acidification of the system is in the range of 0.1–0.25 and showed that if it is in the range of 0.3–0.4, there may be disturbances in the reactor, requiring corrective measures [38]. On the other hand, it shows that the optimum pH range to avoid inhibition processes of methanogenic bacteria is 6.8–8.0. Finally, Kim et al. [39] researched the condition of lag-phase reduction during AD and they found that to reduce the lag phase to achieve a good performance, the VFA/ALK ratio should be less than 0.4.
Figure 5 shows the average pH and VFA/ALK ratio of the effluent stream were 7.67 ± 0.35 and 0.08 ± 0.01, respectively. Likewise, the average alkalinity and VFA values were 3660 ± 657 mg CaCO3 L−1 and 327 ± 194 mg CH3COOH L−1, respectively.
From Figure 5, it is noted that at the beginning of the operation (until day 29), the value of the VFA/ALK ratio is approximately 0.49 and the pH is 6.68. This deviation from the values observed during the rest of the monitoring period is attributed to the inability of microorganisms to digest all the organic matter, resulting in an accumulation of VFAs and temporary acidification during the start-up and adaptation of the process. However, in the following days, it exhibited remarkable stability, with the ratio consistently staying below the maximum limit and the pH within the recommended range.

4. Conclusions

To meet Colombia’s 2050 energy goals of 42 MW, transitioning to cleaner energy sources, specifically biomass, is imperative. This study, which researched biogas production from swine manure using a UASB reactor with long-term operation (360 days), demonstrated the viability of converting pig waste into a valuable energy resource. The UASB reactor effectively achieved remotion efficiency with VS and COD values of 85.12% and 87.38%, respectively, and a methane production yield of 507 mLCH4 gVS−1 with an HRT of 25 days and an OLR of 4.27 gCOD L−1 d−1. The produced biogas has a composition of 67.69% CH4 and 18.06% CO2. However, to ensure good stability in the process, pumping systems with tolerance to suspended solids are required. These findings underscore the potential of swine manure as a sustainable substrate for biogas production, with the UASB reactor proving to be efficient technology.
The utilization of biogas technology in the Colombian agricultural sector, particularly that which harnesses swine manure as an energy source, has the potential to significantly enhance the profitability of agribusinesses. This sustainable approach not only addresses environmental concerns but also offers a promising avenue for diversifying income streams and reducing waste-related costs within the agricultural landscape. Future research endeavors should focus on further enhancing biogas composition for electricity generation.

Author Contributions

Conceptualization, A.M.M., J.M.D., A.A.R. and J.E.V.; methodology, A.M.M. and J.M.D.; formal analysis, A.M.M. and J.M.D.; investigation, A.M.M. and J.M.D.; resources, M.P.; writing—original draft preparation, A.M.M. and J.M.D.; writing—review and editing, A.M.M. and J.M.D.; visualization, A.M.M. and J.M.D.; supervision, M.P.; project administration, M.P. All authors have read and agreed to the published version of the manuscript.

Funding

This research was funded by the Colombia Scientific Program within the framework of the Ecosistema Científico (Contract No. FP44842-218-2018).

Data Availability Statement

The datasets presented in this article are not readily available because we do not have a trusted repository to load the data into. Requests for access to the datasets should be directed to the main author’s e-mail.

Acknowledgments

The authors gratefully acknowledge the financial support provided by the Colombia Scientific Program and Luis C. Beltrán for comments on the manuscript.

Conflicts of Interest

The authors declare no conflict of interest.

References

  1. IEA. Renewables 2023; IEA: Paris, France, 2024. [Google Scholar]
  2. Statista Cumulative Renewable Energy Capacity Worldwide from 2010 to 2022. Available online: https://www.statista.com/statistics/1094331/global-renewable-capacity-cumulative/ (accessed on 31 March 2024).
  3. Figueroa Castro, A.C.; Mojica, J.L. Informe Perspectiva Sectorial de Energía. Actualidad del Sector Energético Colombiano; Corficolombiana: Bogotá, Colombia, 2023. [Google Scholar]
  4. UPME. Plan Energético Nacional Colombia: Ideario Energético 2050; UPME: Bogotá, Colombia, 2015. [Google Scholar]
  5. Deublein, D.; Steinhauser, A. Biogas from Waste and Renewable Resources; Wiley: Hoboken, NJ, USA, 2008; ISBN 978-3-527-31841-4. [Google Scholar]
  6. Pinto, J.A.; Barros, R.M.; dos Santos, I.F.S.; Filho, G.L.T.; de Oliveira Botan, M.C.; Bôas, T.F.V.; de Cássia Crispim, A.M. Study of the Anaerobic Co-Digestion of Bovine and Swine Manure: Technical and Economic Feasibility Analysis. Clean. Waste Syst. 2023, 5, 100097. [Google Scholar] [CrossRef]
  7. IEA. IEA Bioenergy Task 37—A Perspective on the State of the Biogas Industry from Selected Member Countries; IEA: Paris, France, 2022. [Google Scholar]
  8. CIbiogás. Panorama Do Biogás No Brasil; CIbiogás: Foz do Iguaçu, Brasil, 2021. [Google Scholar]
  9. Duarte, S.; Loaiza, B.; Majano, A.M. De la Práctica a la Política: Análisis de las Barreras a la Inversión en Biogás en Colombia y las Medidas Para Abordarlas, a Partir de la Experiencia de los Desarrolladores y Otros Actores Relevantes; LEDS LAC: Bogotá, Colombia, 2021. [Google Scholar]
  10. Porkcolombia. Economía Porcícola 2020; Porkcolombia: Bogotá, Colombia, 2020; Volume 257. [Google Scholar]
  11. Pessuto, J.; Scopel, B.S.; Perondi, D.; Godinho, M.; Dettmer, A. Enhancement of Biogas and Methane Production by Anaerobic Digestion of Swine Manure with Addition of Microorganisms Isolated from Sewage Sludge. Process Saf. Environ. Prot. 2016, 104, 233–239. [Google Scholar] [CrossRef]
  12. Bao, M.; Cui, H.; Lv, Y.; Wang, L.; Ou, Y.; Hussain, N. Greenhouse Gas Emission during Swine Manure Aerobic Composting: Insight from the Dissolved Organic Matter Associated Microbial Community Succession. Bioresour. Technol. 2023, 373, 128729. [Google Scholar] [CrossRef]
  13. Tang, Y.; Wen, G.; Li, P.; Dai, C.; Han, J. Effects of Biogas Slurry Application on Crop Production and Soil Properties in a Rice–Wheat Rotation on Coastal Reclaimed Farmland. Water Air Soil Pollut. 2019, 230, 7–10. [Google Scholar] [CrossRef]
  14. He, Z.L.; Yang, X.E.; Stoffella, P.J. Trace Elements in Agroecosystems and Impacts on the Environment. J. Trace Elem. Med. Biol. 2005, 19, 125–140. [Google Scholar] [CrossRef]
  15. Lora, E.S.; Andrade, R.V. Biomass as Energy Source in Brazil. Renew. Sustain. Energy Rev. 2009, 13, 777–788. [Google Scholar] [CrossRef]
  16. Porkcolombia. Revista de Porkcolombia; Universidad Jorge Tadeo Lozano: Bogotá, Colombia, 2021. [Google Scholar]
  17. Rico, C.; Montes, J.A.; Rico, J.L. Evaluation of Different Types of Anaerobic Seed Sludge for the High Rate Anaerobic Digestion of Pig Slurry in UASB Reactors. Bioresour. Technol. 2017, 238, 147–156. [Google Scholar] [CrossRef]
  18. Lee, D.J.; Bae, J.S.; Seo, D.C. Potential of Biogas Production from Swine Manure in South Korea. Appl. Biol. Chem. 2018, 61, 557–565. [Google Scholar] [CrossRef]
  19. Amaral, A.C.; Kunz, A.; Steinmetz, R.L.; Scussiato, L.A.; Tápparo, D.C. Anaerobic Digestion of Swine Manure: Stratified Production Units and Its Biogas Potential. In Proceedings of the IV International Symposium on Agricultural and Agroindustrial Waste Management, Rio de Janeiro, Brazil, 5–7 May 2015. [Google Scholar] [CrossRef]
  20. Pomar, C.; Remus, A. Precision Pig Feeding: A Breakthrough toward Sustainability. Anim. Front. 2019, 9, 52–59. [Google Scholar] [CrossRef]
  21. Sefeedpari, P.; Pishgar-Komleh, S.H.; Aarnink, A.J.A. Model Adaptation and Validation for Estimating Methane and Ammonia Emissions from Fattening Pig Houses: Effect of Manure Management System. Animals 2024, 14, 964. [Google Scholar] [CrossRef]
  22. Evren, M.; Ozgun, H.; Kaan, R.; Ozturk, I. Anaerobic Treatment of Industrial Effluents: An Overview of Applications. In Waste Water—Treatment and Reutilization; InTech: Rijeka, Croatia, 2011. [Google Scholar]
  23. American Public Health Association; American Water Works Association; Water Environment Federation. Standard Methods for the Examination of Water and Wastewater; Bridgewater, L., Ed.; American Public Health Association: Washington, DC, USA, 2017; Volume 23. [Google Scholar]
  24. Rauw, W.M.; de Mercado de la Peña, E.; Gomez-Raya, L.; García Cortés, L.A.; Ciruelos, J.J.; Gómez Izquierdo, E. Impact of Environmental Temperature on Production Traits in Pigs. Sci. Rep. 2020, 10, 2106. [Google Scholar] [CrossRef] [PubMed]
  25. Renaudeau, D.; Gourdine, J.L.; St-Pierre, N.R. Meta-Analysis of the Effects of High Ambient Temperature on Growth Performance of Growing-Finishing Pigs. J. Anim. Sci. 2011, 89, 2220–2230. [Google Scholar] [CrossRef] [PubMed]
  26. Collin, A.; van Milgen, J.; Dubois, S.; Noblet, J. Effect of High Temperature on Feeding Behaviour and Heat Production in Group-Housed Young Pigs. Br. J. Nutr. 2001, 86, 63–70. [Google Scholar] [CrossRef]
  27. Wu, J.; Hu, Y.Y.; Wang, S.F.; Cao, Z.P.; Li, H.Z.; Fu, X.M.; Wang, K.J.; Zuo, J.E. Effects of Thermal Treatment on High Solid Anaerobic Digestion of Swine Manure: Enhancement Assessment and Kinetic Analysis. Waste Manag. 2017, 62, 69–75. [Google Scholar] [CrossRef] [PubMed]
  28. Lansing, S.; Martin, J.F.; Botero, R.B.; da Silva, T.N.; da Silva, E.D. Methane Production in Low-Cost, Unheated, Plug-Flow Digesters Treating Swine Manure and Used Cooking Grease. Bioresour. Technol. 2010, 101, 4362–4370. [Google Scholar] [CrossRef] [PubMed]
  29. Wang, H.; Larson, R.A.; Runge, T. Impacts to Hydrogen Sulfide Concentrations in Biogas When Poplar Wood Chips, Steam Treated Wood Chips, and Biochar Are Added to Manure-Based Anaerobic Digestion Systems. Bioresour. Technol. Rep. 2019, 7, 100232. [Google Scholar] [CrossRef]
  30. Francisco López, A.; Lago Rodríguez, T.; Faraji Abdolmaleki, S.; Galera Martínez, M.; Bello Bugallo, P.M. From Biogas to Biomethane: An In-Depth Review of Upgrading Technologies That Enhance Sustainability and Reduce Greenhouse Gas Emissions. Appl. Sci. 2024, 14, 2342. [Google Scholar] [CrossRef]
  31. Ro, K.S.; Woodbury, B.; Spiehs, M.; Szogi, A.A.; Silva, P.J.; Hwang, O.; Cho, S. Pilot-Scale H2S and Swine Odor Removal System Using Commercially Available Biochar. Agronomy 2021, 11, 1611. [Google Scholar] [CrossRef]
  32. Kumdhitiahutsawakul, L.; Jirachaisakdeacha, D.; Kantha, U.; Pholchan, P.; Sattayawat, P.; Chitov, T.; Tragoolpua, Y.; Bovonsombut, S. Removal of Hydrogen Sulfide from Swine-Waste Biogas on a Pilot Scale Using Immobilized Paracoccus Versutus CM1. Microorganisms 2022, 10, 2148. [Google Scholar] [CrossRef]
  33. Agudelo, G.A.; Mosquera, A.M.; Peñuela, M.; Molina, F.J. Remoción de Sulfuro de Hidrógeno Del Biogás: Comparación Entre Un Sistema de Biofiltro y de Adsorción Química. Inf. Tecnológica 2023, 34, 37–46. [Google Scholar] [CrossRef]
  34. Duan, N.; Zhang, D.; Lin, C.; Zhang, Y.; Zhao, L.; Liu, H.; Liu, Z. Effect of Organic Loading Rate on Anaerobic Digestion of Pig Manure: Methane Production, Mass Flow, Reactor Scale and Heating Scenarios. J. Environ. Manag. 2019, 231, 646–652. [Google Scholar] [CrossRef] [PubMed]
  35. Møller, H.B.; Sommer, S.G.; Ahring, B.K. Methane Productivity of Manure, Straw and Solid Fractions of Manure. Biomass Bioenergy 2004, 26, 485–495. [Google Scholar] [CrossRef]
  36. Shih, M.F.; Lay, C.H.; Lin, C.Y.; Chang, S.H. Exploring the Environmental and Economic Potential for Biogas Production from Swine Manure Wastewater by Life Cycle Assessment. Clean Technol. Environ. Policy 2023, 25, 451–464. [Google Scholar] [CrossRef]
  37. Bramstedt, S. Temperature Optimization of Anaerobic Digestion at the Käppala Waste Water Treatment Plant. Master’s Thesis, KTH Royal Institute of Technology, Stockholm, Sweden, 2015. [Google Scholar]
  38. Khanal, S.K. Anaerobic Biotechnology for Bioenergy Production: Principles and Applications; Wiley-Blackwell: Hoboken, NJ, USA, 2008; ISBN 9780813823461. [Google Scholar]
  39. Kim, M.-J.; Kim, S.-H. Conditions of Lag-Phase Reduction during Anaerobic Digestion of Protein for High-Efficiency Biogas Production. Biomass Bioenergy 2020, 143, 105813. [Google Scholar] [CrossRef]
Figure 1. Diagram of the UASB reactor used in this study.
Energies 17 02723 g001
Figure 2. Process diagram for biogas production using anaerobic digestion on UASB reactor fed with swine manure solution.
Energies 17 02723 g002
Figure 3. Biogas production and methane composition over time. “Avg. Q1” represents the average for feed flow rate 1 (1.3 L d-1), “Avg. Q2” represents the average for feed flow rate 2 (1.6 L d-1), and “Avg. Q3” represents the average for feed flow rate 3 (2.1 L d-1).
Energies 17 02723 g003
Figure 4. COD in influent and effluent streams and its remotion in the system. The dashed lines represent the points where the system’s feed flow was increased.
Energies 17 02723 g004
Figure 5. Monitoring of the VFA/ALK ratio and pH during the study period. The dashed red line represents the maximum value of the VFA/ALK ratio necessary for good performance without the need for corrective action, according to the literature.
Energies 17 02723 g005
Table 1. Characterization of aqueous phase of swine manure–water mixture used for this study. COD: chemical oxygen demand; TS: total solids; VS: volatile solids; ALK: alkalinity.
ParametersUnitsValueStandard
Deviation (σ)
CODg O2 L−139.15413.99
TS%w/w3.351.33
VS%w/w2.390.98
VS/TS-0.713.37
Alkmg CaCO3 L−1251040.0
pH-7.710.33
Table 2. Average of VS, COD, OLR, and HRT for each flow rate.
Flow
(L/d)
VS
(%)
OLR
(gVS L−1 d−1)
CODFeed
(gO2 L−1)
OLR
(gCOD L−1 d−1)
HRT
(d)
1.32.181.0842.282.1131
1.62.091.3035.812.2425
2.13.362.6853.274.2719
Table 3. Comparison of methane yield (mL CH4 gVS−1) obtained from swine manure in standard conditions.
DescriptionMethane Yield
(mLCH4 gVS−1)
COD Remotion Efficiency (%)CharacteristicsSource
Biogas production from swine manure in Korean livestock farms.400100 *Values estimated using elemental analysis.Lee et al. [18]
The study explored how varying OLR impacted the efficiency of AD of pig manure on a CSTR system.43867.4–76.2OLR: 1.1–3.0 gVS L−1 d−1;
HRT: 22 days;
Temperature: 35 ± 1 °C;
CSTRs of 20 L.
Duan et al. [34]
In this paper, the methane productivity of manure in terms of volatile solids (VS), volume, and livestock production were determined.350-Dry matter (DM): 223.4 g L−1;
VS: 848.66 g kgDM−1;
Temperature: 35 ± 0.5 °C;
Infussion bottles of 1.1 L.
Moller et al. [35]
This study employs a life cycle assessment and cost–benefit analysis to assess and contrast the environmental impacts and cost benefits associated with the implementation of a wastewater treatment system on a swine farm.12571.5 ± 5.5OLR: 0.084 gVS L−1 d−1;
HRT: 20 days;
Temperature: 35 °C;
Anaerobic fermentation tank of 60 m3.
Shih et al. [36]
This study.50787.4HRT: 19 days;
Temperature: 24 °C;
OLR: 2.68 gvs L−1 d−1;
UASB reactor of 40 L.
-
* Theoretical remotion efficiency value assumed by authors.
Disclaimer/Publisher’s Note: The statements, opinions and data contained in all publications are solely those of the individual author(s) and contributor(s) and not of MDPI and/or the editor(s). MDPI and/or the editor(s) disclaim responsibility for any injury to people or property resulting from any ideas, methods, instructions or products referred to in the content.

