
Review of Fault Diagnosis Methods for Induction Machines in Railway Traction Applications

Abstract
:1. Introduction
- Corrective maintenance, which consists of unplanned maintenance operations that take place when an unexpected fault occurs. In the case of minor faults, corrective maintenance has the advantage of being low-cost and effective. Nevertheless, it cannot fully prevent catastrophic events from happening if the fault is more serious than expected.
- Preventive maintenance, which involves planned interventions with the purpose of reducing fault occurrence. Contrary to corrective maintenance, preventive maintenance can be costly, as some interventions may not be necessary, but on the other hand, many catastrophic events can be avoided.
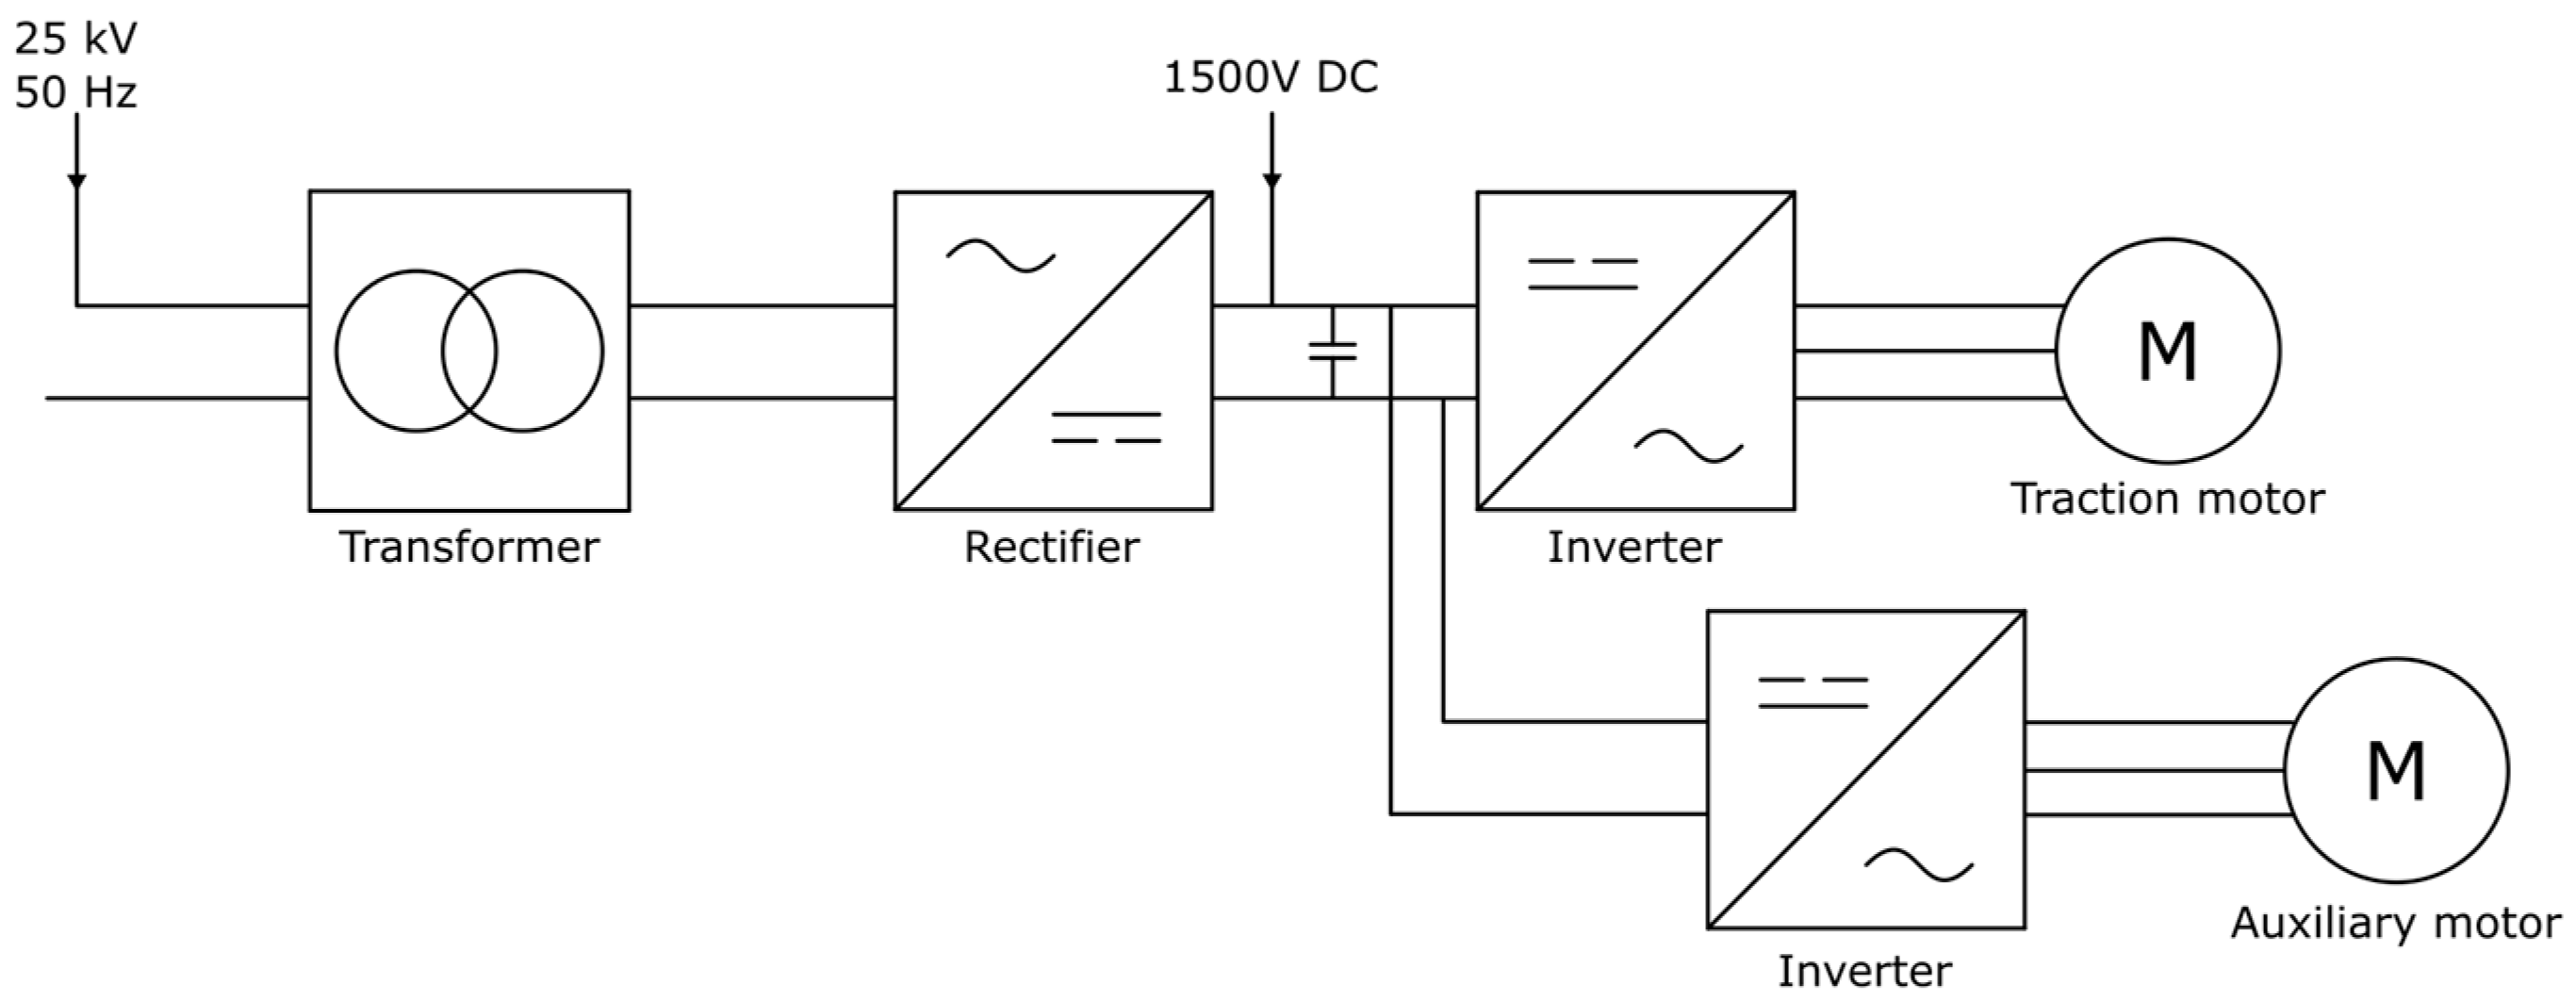
- Traction motors operate under low load, as they are sized for extreme conditions (i.e., to produce enough torque to climb a hill with a full payload) but rarely remain for an extended period at this full-load operating point. Thus, the motors spend most of their time below the full rated power or slip.
- They also operate under non-steady state conditions that generate difficult-to-process signals.
2. Induction Motor Faults
2.1. Stator Faults
2.2. Rotor Faults
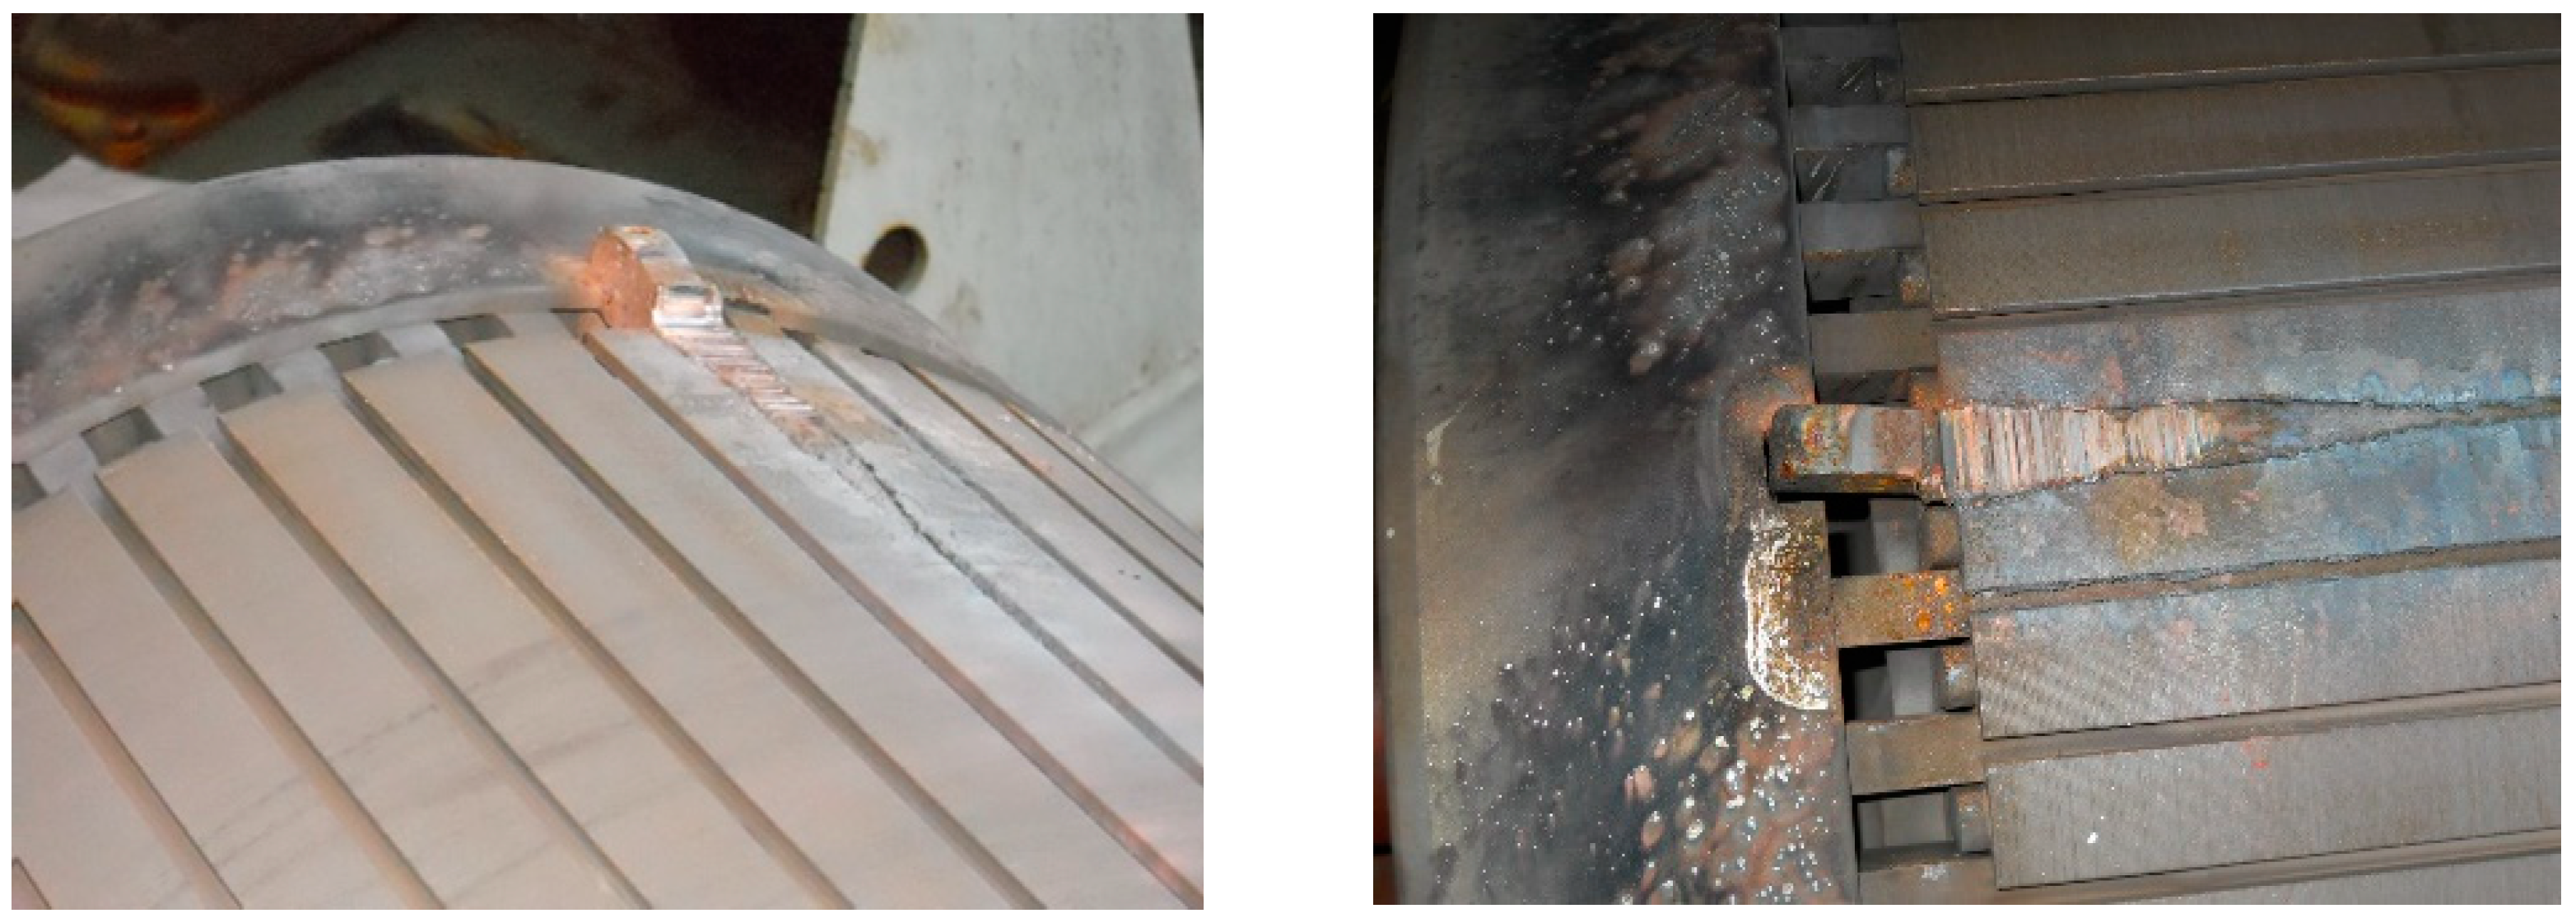
2.2.1. Broken Rotor Bars
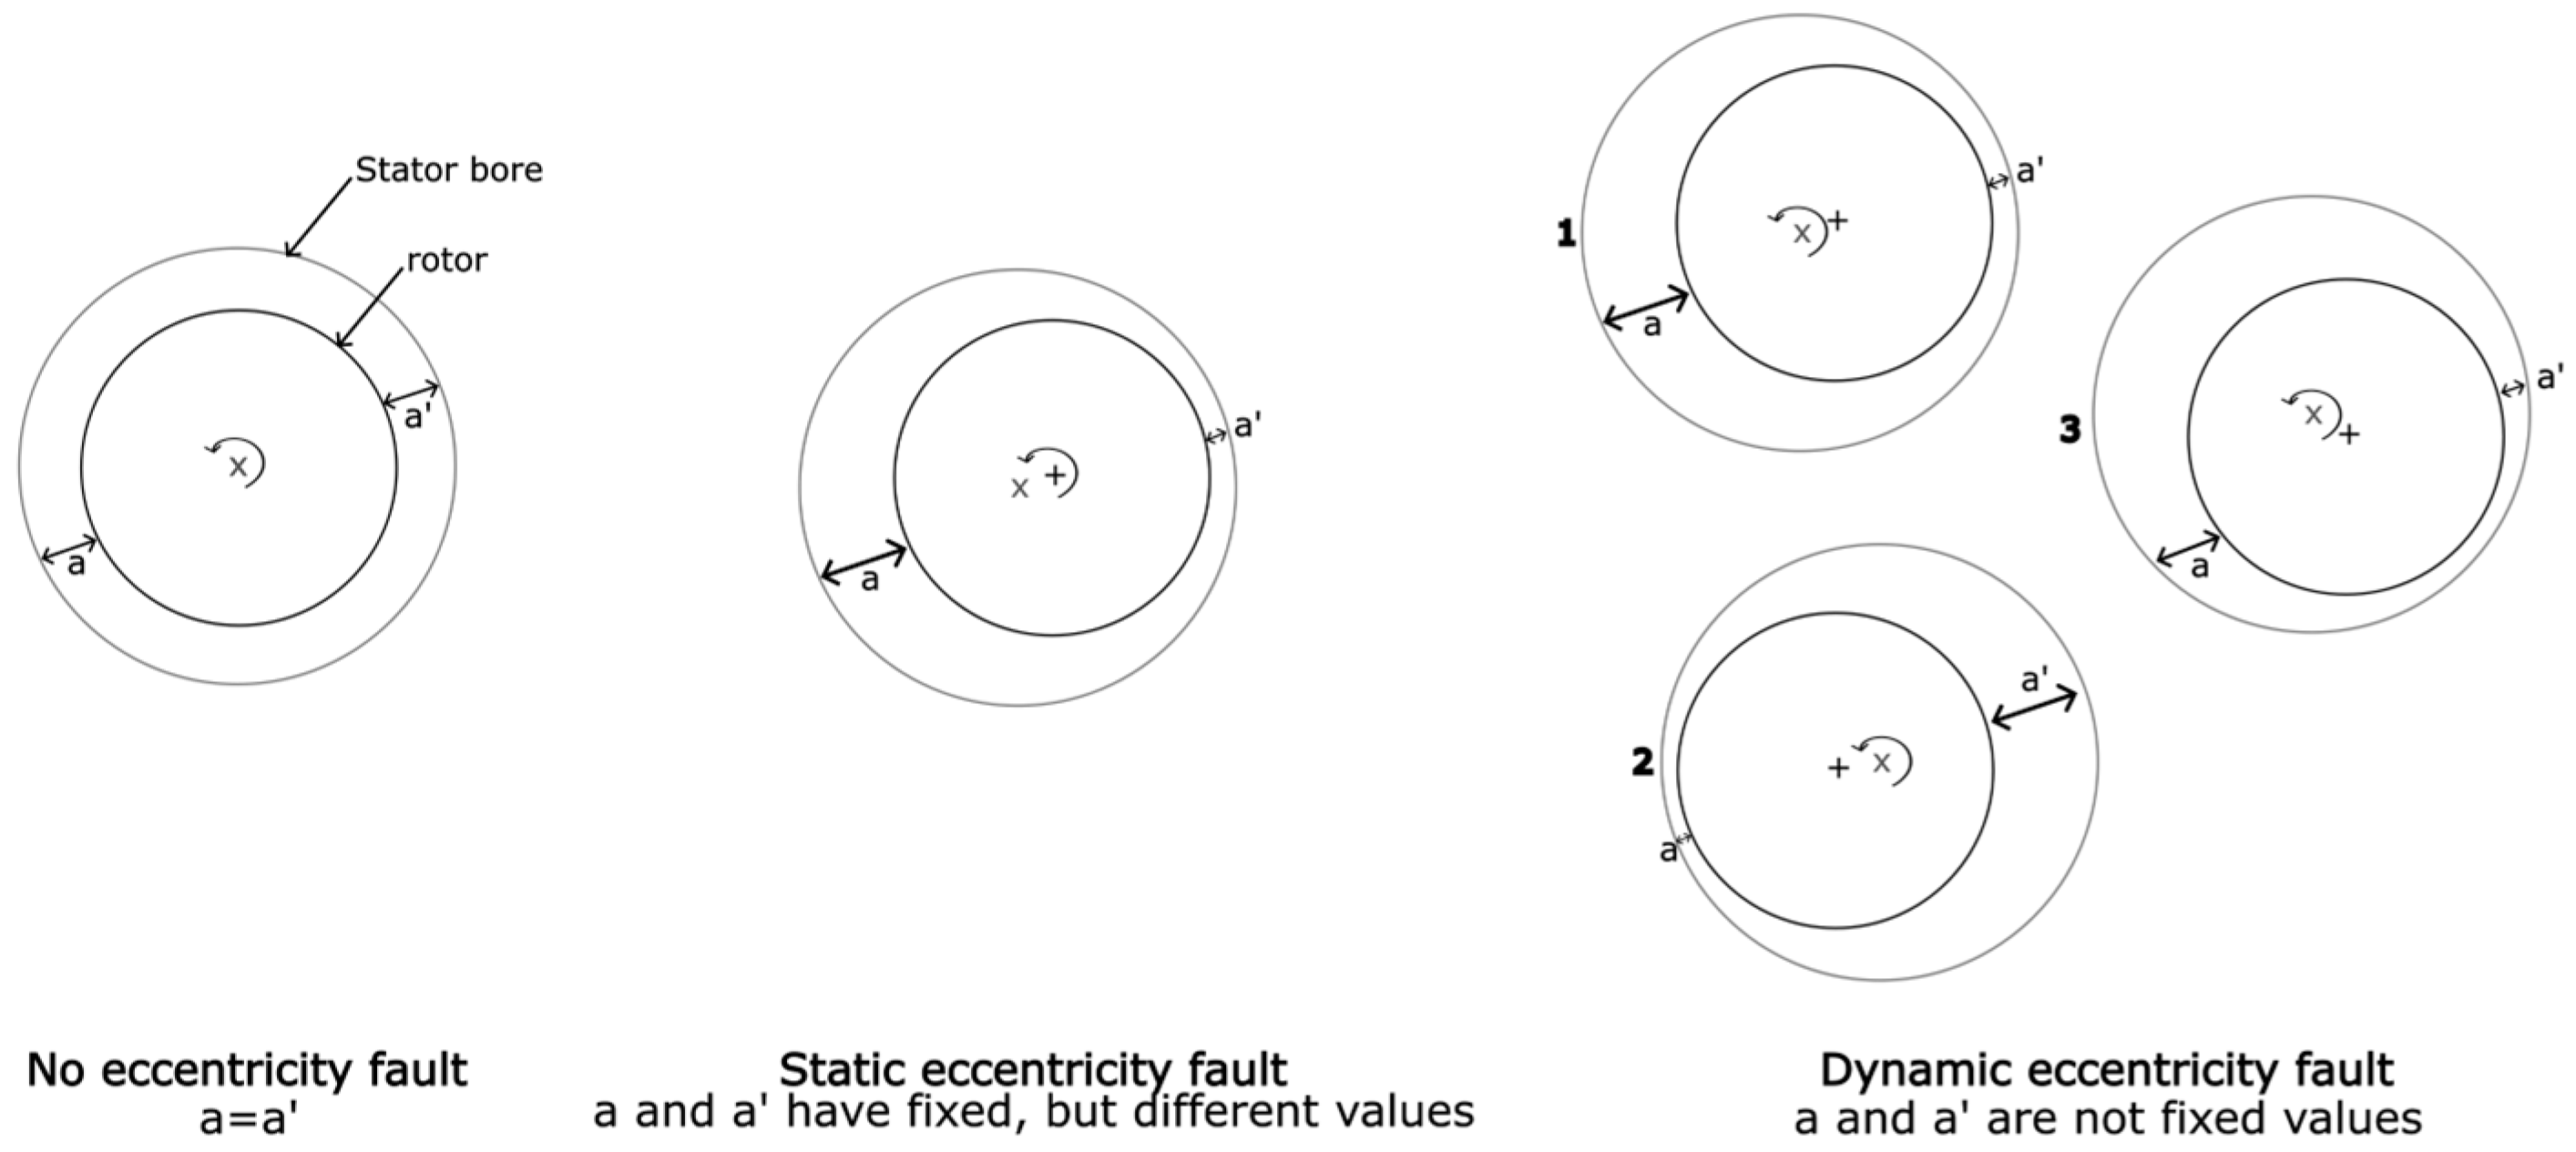
2.2.2. Eccentricity Faults
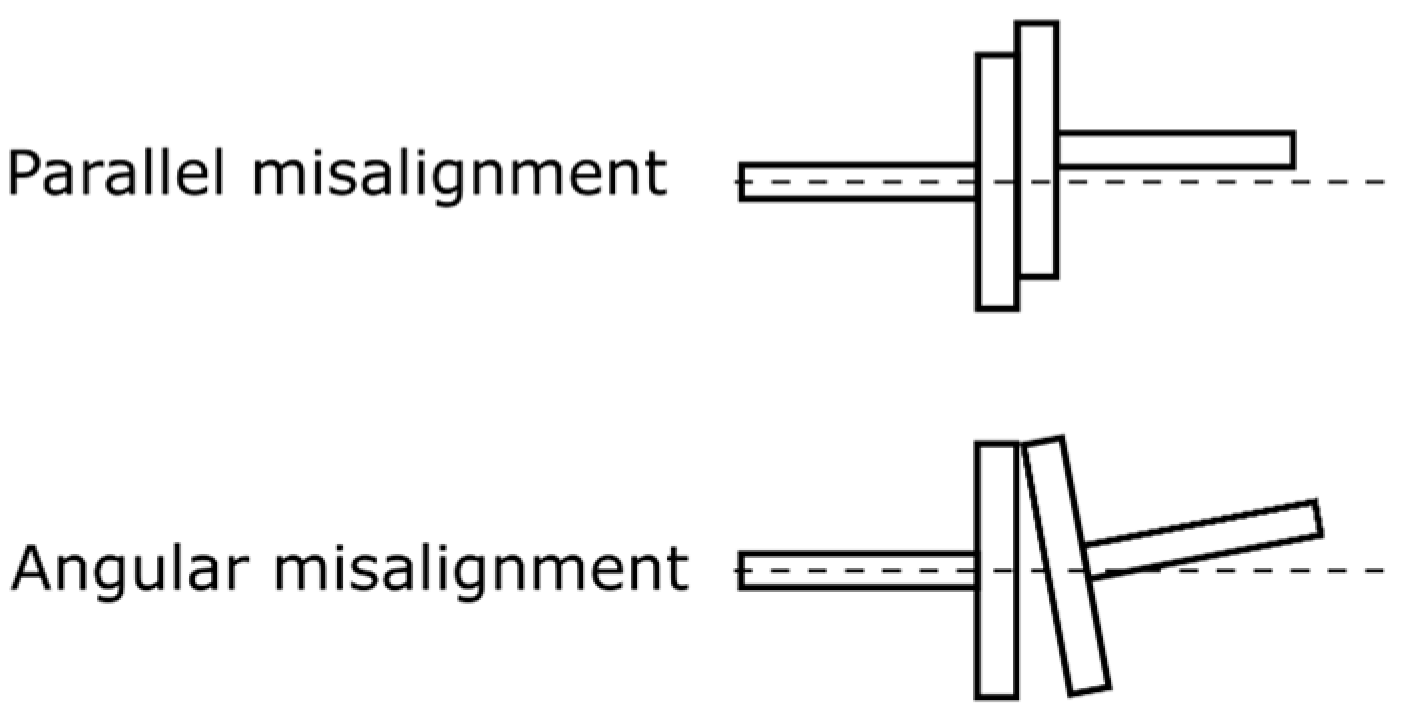
2.2.3. Misalignment Faults
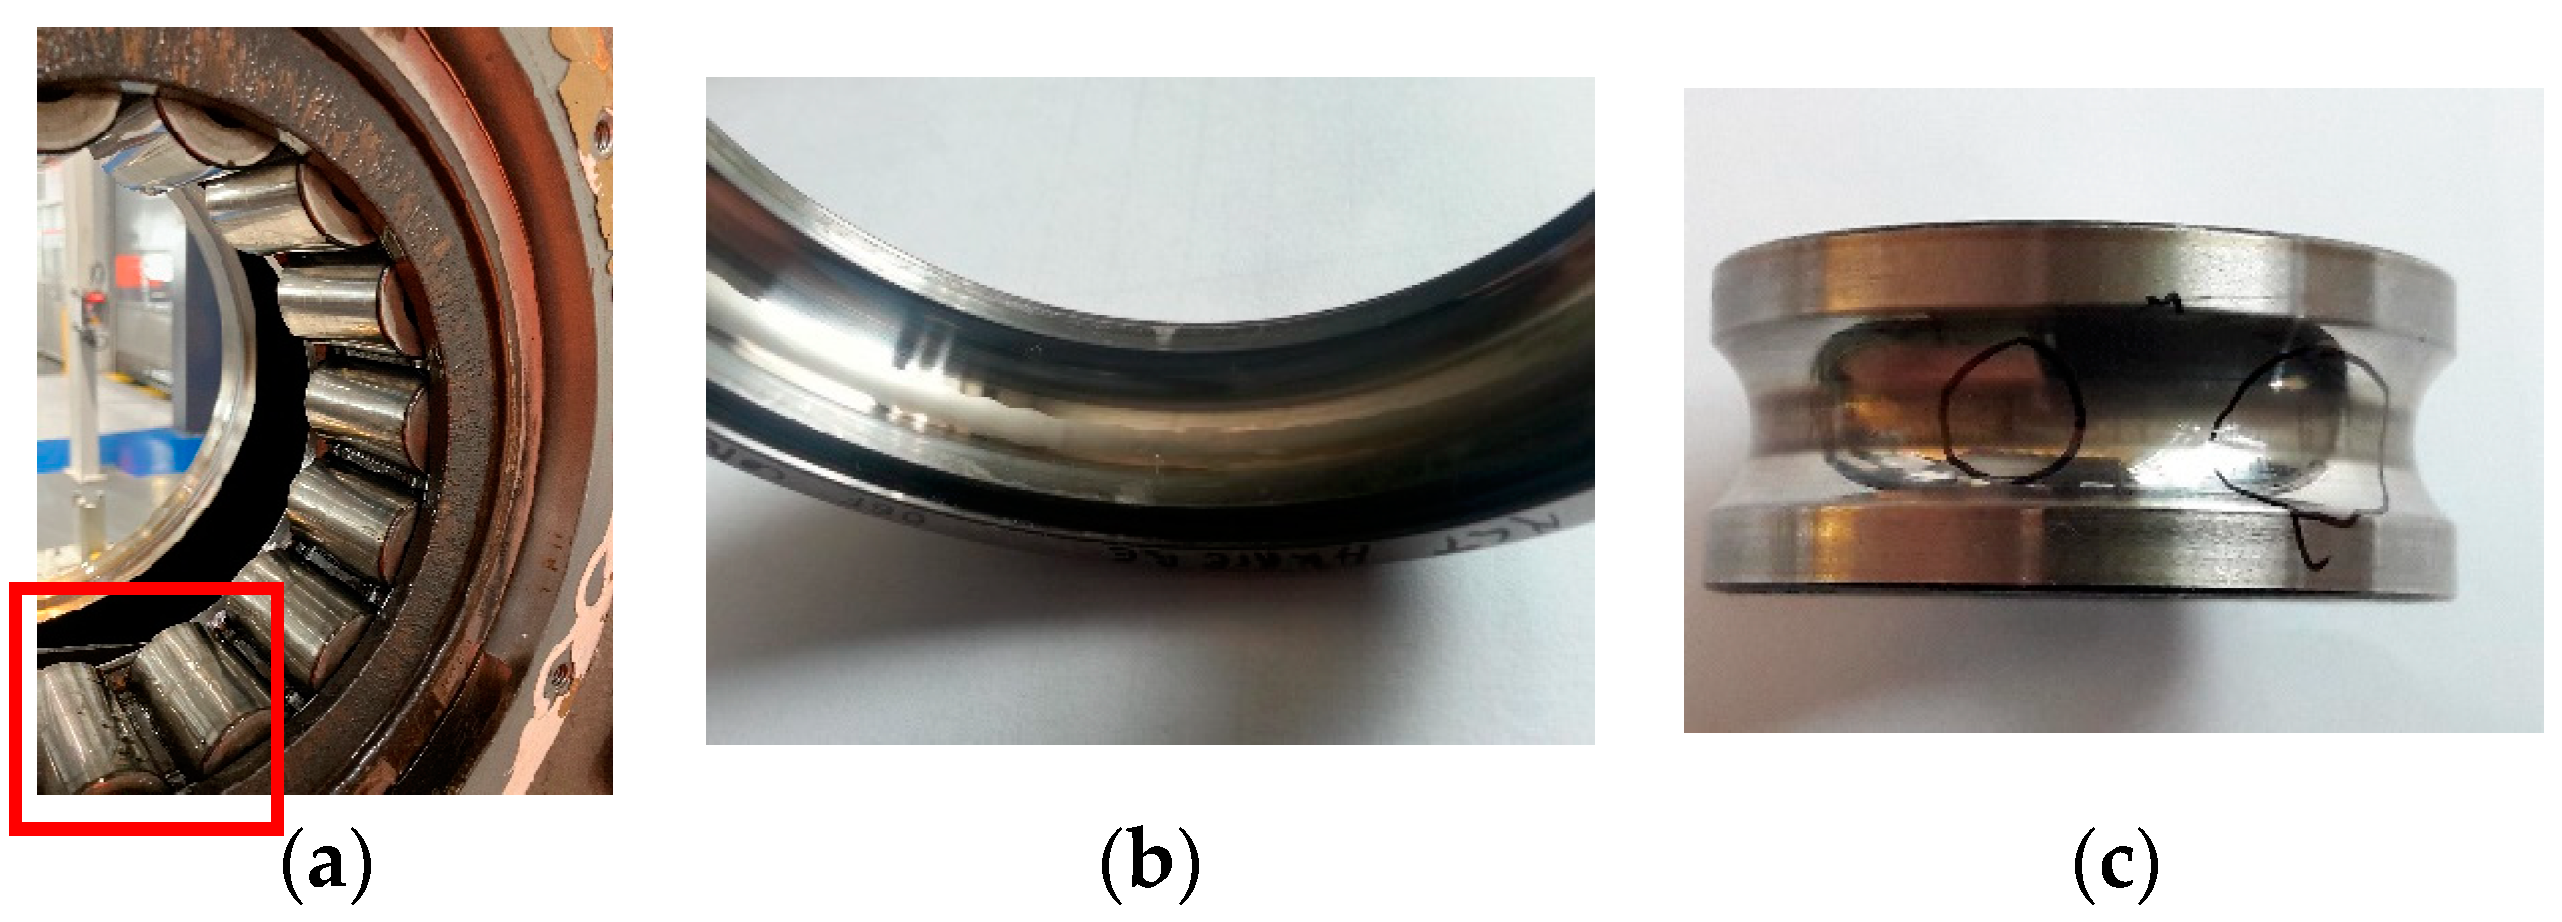
2.3. Bearing Faults
2.4. Other Faults
3. Overall Description of a Fault Detection System for Induction Machines
3.1. Data Acquisition
3.2. Signature Extraction
3.2.1. Time Domain Methods
3.2.2. Frequency Domain Methods
3.2.3. Time-Frequency Domain Methods
3.2.4. Wavelet Transform
3.2.5. Impedance Monitoring
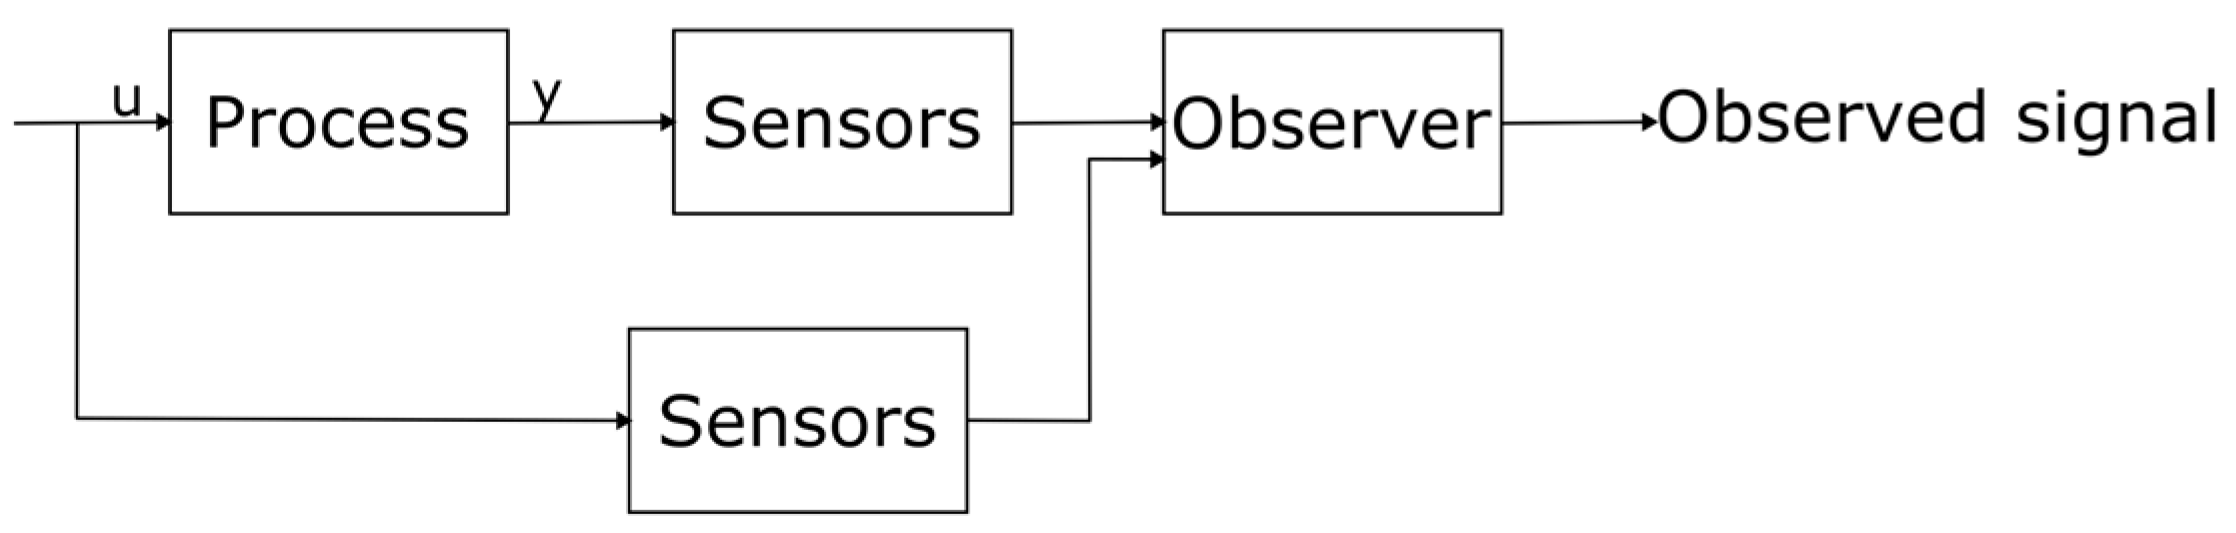
3.2.6. Model-Based Feature Extraction
- Observing some parameters of the model that could help determine the presence of faults;
- Calculating a “residue”: the difference between a theoretical model of the machine’s parameters or estimated signals and the actual signals and parameters measured on the machine.
3.3. Feature Reduction
3.4. Fault Classification
3.4.1. Supervised Classification
Logistic Regression
K-Nearest Neighbour
Support Vector Machines
Neural Networks
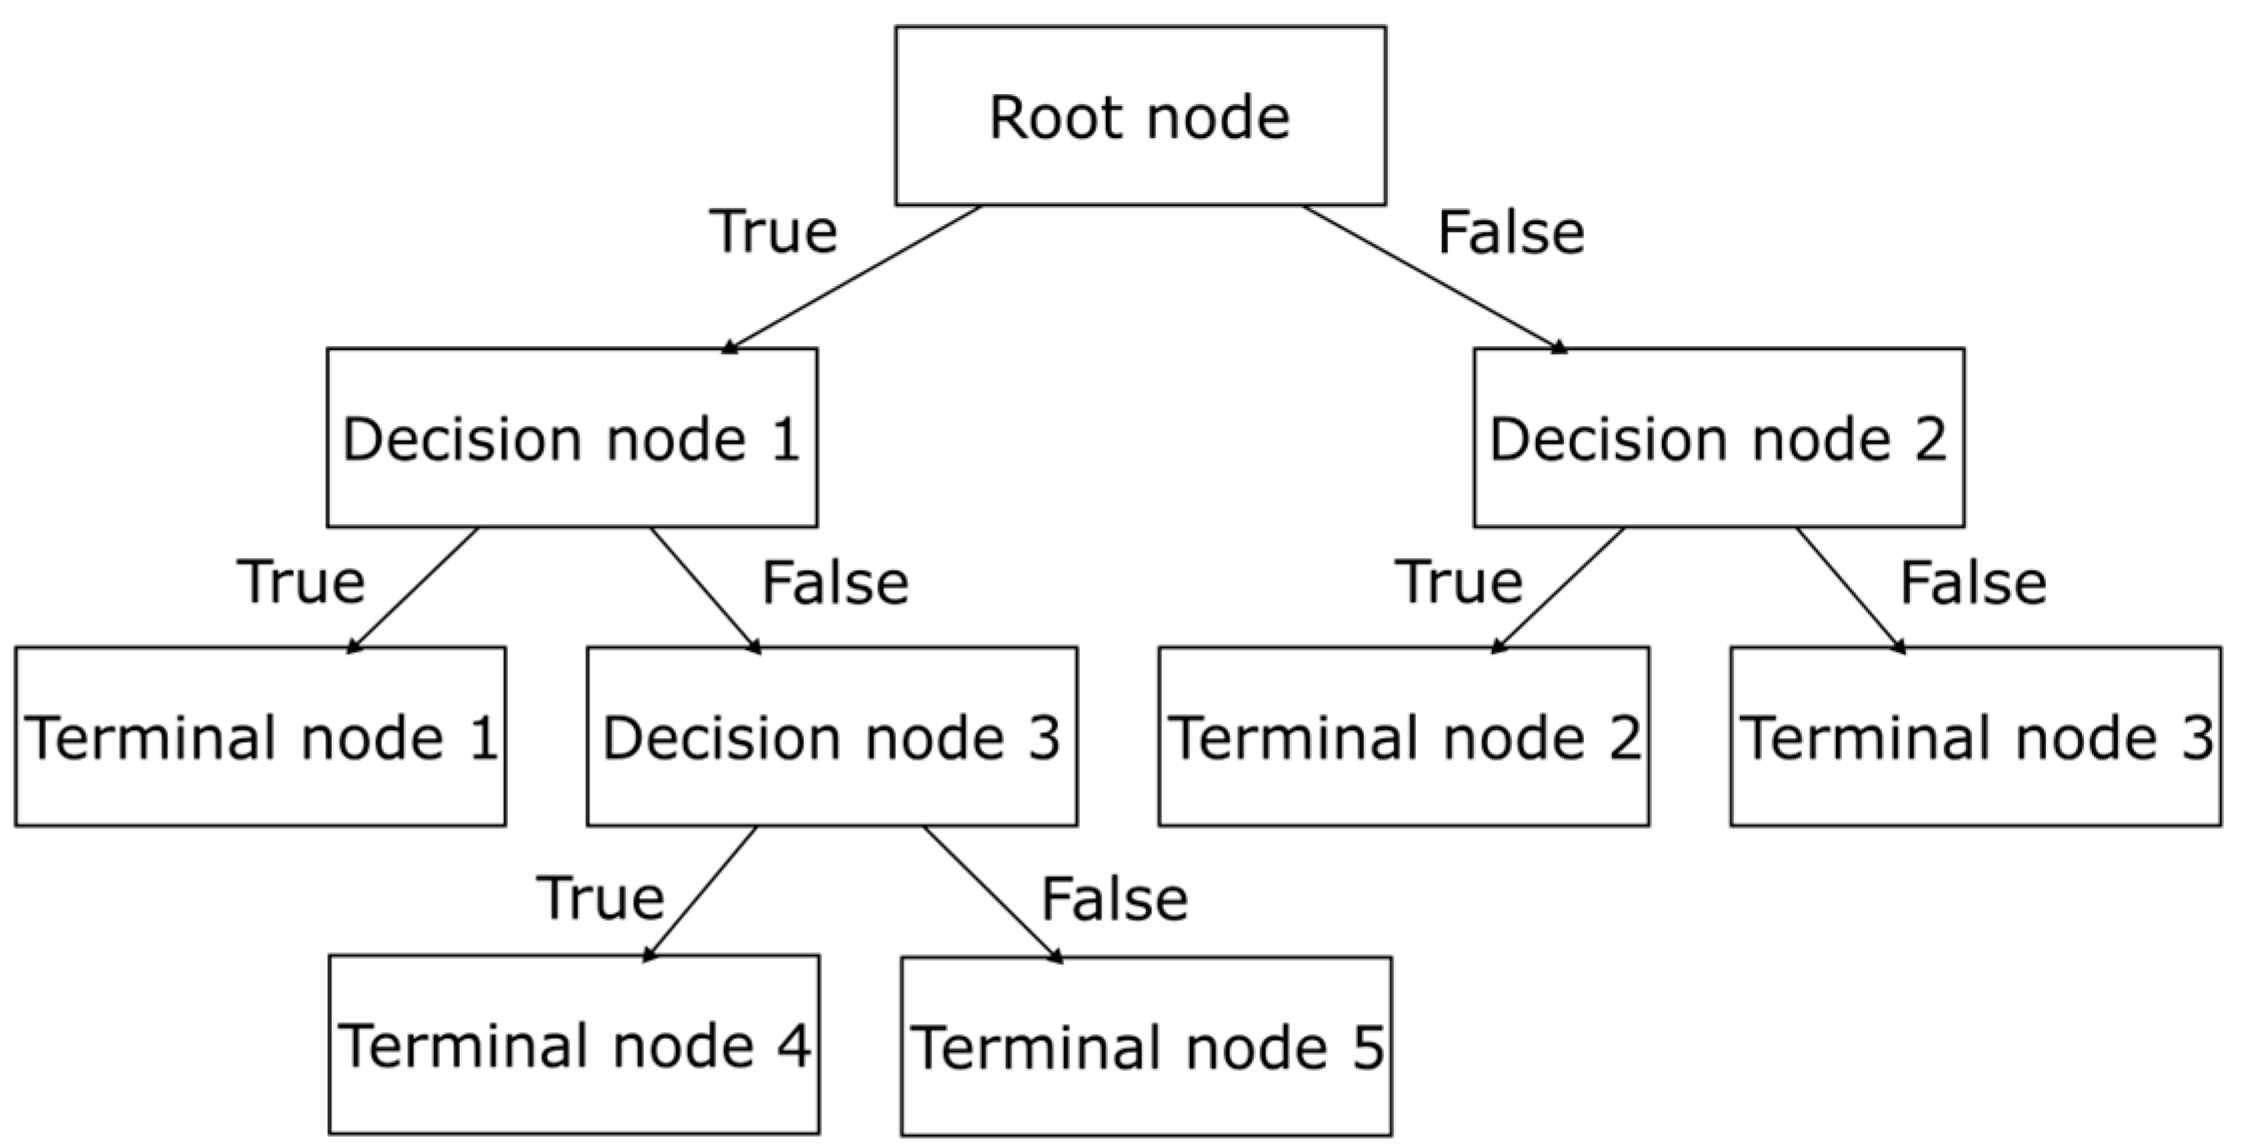
Decision Trees
Random Forest
3.4.2. Unsupervised Classification
Centroid-Based Clustering: K-Means
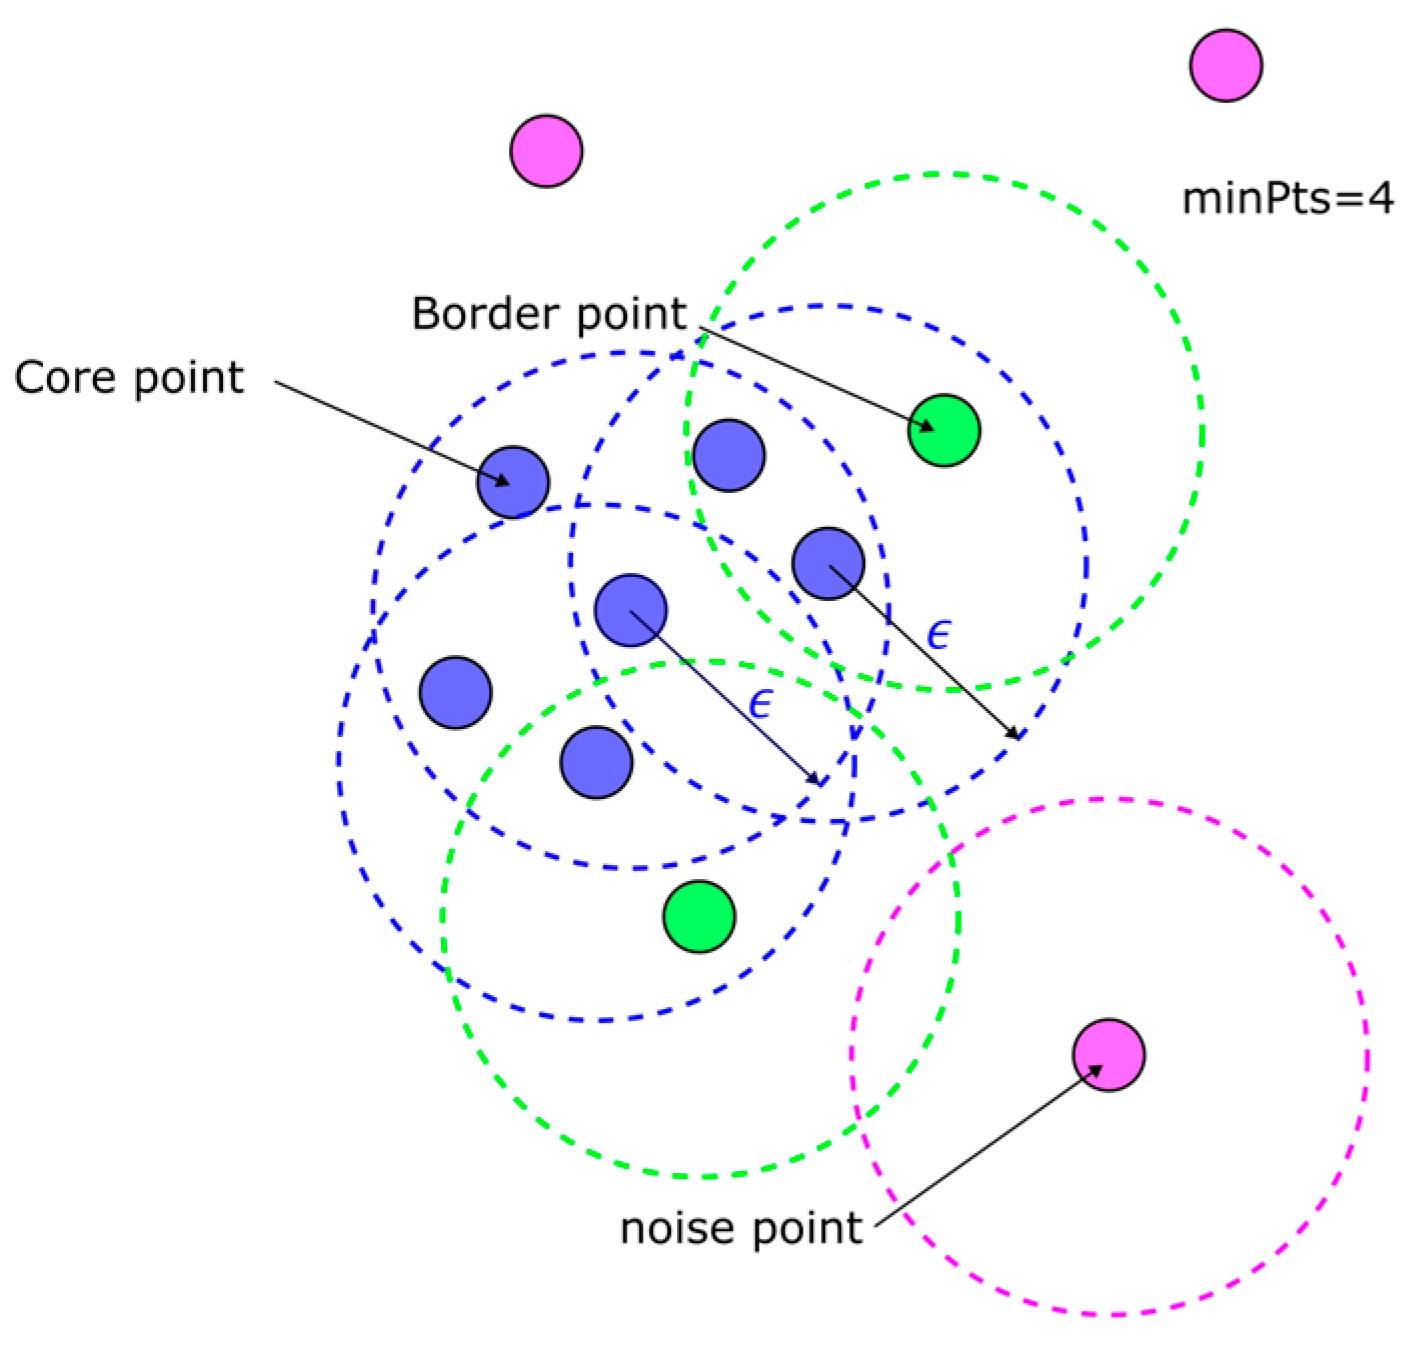
Density-Based Clustering
Hierarchical Clustering
4. Conclusions
- The purpose of the algorithm should be known in advance: is the algorithm supposed to detect an anomaly in the behaviour of the machine? Should it find the origin of the fault that has already occurred, or the behaviour that might lead to an eventual defect?
- Is the algorithm elaborated for online use, when the machine is running, or offline, when it has already been sent into maintenance?
Author Contributions
Funding
Data Availability Statement
Conflicts of Interest
References
- Gubarevych, O.; Duer, S.; Melkonova, I.; Woźniak, M.; Paś, J.; Stawowy, M.; Rokosz, K.; Zajkowski, K.; Bernatowicz, D. Research on and Assessment of the Reliability of Railway Transport Systems with Induction Motors. Energies 2023, 16, 6888. [Google Scholar] [CrossRef]
- Puzyr, V.; Datsun, Y.; Obozny, O.; Pyvo, V. Development of a repair technology for locomotive units on the basis of the theory of decision. IOP Conf. Ser. Mater. Sci. Eng. 2019, 664, 012029. [Google Scholar] [CrossRef]
- Sardar, M.U.; Vaimann, T.; Kütt, L.; Kallaste, A.; Asad, B.; Akbar, S.; Kudelina, K. Inverter-Fed Motor Drive System: A Systematic Analysis of Condition Monitoring and Practical Diagnostic Techniques. Energies 2023, 16, 5628. [Google Scholar] [CrossRef]
- Polater, N.; Tricoli, P. Technical Review of Traction Drive Systems for Light Railways. Energies 2022, 15, 3187. [Google Scholar] [CrossRef]
- Puche-Panadero, R.; Martinez-Roman, J.; Sapena-Bano, A.; Burriel-Valencia, J.; Pineda-Sanchez, M.; Perez-Cruz, J.; Riera-Guasp, M. New Method for Spectral Leakage Reduction in the FFT of Stator Currents: Application to the Diagnosis of Bar Breakages in Cage Motors Working at Very Low Slip. IEEE Trans. Instrum. Meas. 2021, 70, 1–11. [Google Scholar] [CrossRef]
- Niu, G.; Dong, X.; Chen, Y. Motor Fault Diagnostics Based on Current Signatures: A Review. IEEE Trans. Instrum. Meas. 2023, 72, 1–19. [Google Scholar] [CrossRef]
- Liu, Z.; Song, Y.; Gao, S.; Hui, W. Review of Perspectives on Pantograph-Catenary Interaction Research for High-Speed Railways Operating at 400 km/h and Above. IEEE Trans. Transp. Electrif. 2024. [Google Scholar] [CrossRef]
- Filippetti, F.; Bellini, A.; Capolino, G.-A. Condition monitoring and diagnosis of rotor faults in induction machines: State of art and future perspectives. In Proceedings of the 2013 IEEE Workshop on Electrical Machines Design, Control and Diagnosis (WEMDCD), Paris, France, 11–12 March 2013; pp. 196–209. [Google Scholar] [CrossRef]
- Strangas, E.G.; Clerc, G.; Razik, H.; Soualhi, A. Basic Methods and Tools. In Fault Diagnosis, Prognosis, and Reliability for Electrical Machines and Drives; Wiley-IEEE Press: Hoboken, NJ, USA, 2021; Available online: https://hal.science/hal-03319428 (accessed on 6 March 2024).
- Magsi, H.; Sodhro, A.H.; Chachar, F.A.; Abro, S.A.K. Analysis of Signal Noise Reduction by Using Filters. In Proceedings of the 2018 International Conference on Computing, Mathematics and Engineering Technologies (iCoMET), Sukkur, Pakistan, 3–4 March 2018. [Google Scholar] [CrossRef]
- Reyes-Malanche, J.A.; Villalobos-Pina, F.J.; Ramırez-Velasco, E.; Cabal-Yepez, E.; Hernandez-Gomez, G.; Lopez-Ramirez, M. Short-Circuit Fault Diagnosis on Induction Motors through Electric Current Phasor Analysis and Fuzzy Logic. Energies 2023, 16, 516. [Google Scholar] [CrossRef]
- Misra, S.; Kumar, S.; Sayyad, S.; Bongale, A.; Jadhav, P.; Kotecha, K.; Abraham, A.; Gabralla, L.A. Fault Detection in Induction Motor Using Time Domain and Spectral Imaging-Based Transfer Learning Approach on Vibration Data. Sensors 2022, 22, 8210. [Google Scholar] [CrossRef]
- Iglesias-Martínez, M.E.; Antonino-Daviu, J.A.; de Córdoba, P.F.; Conejero, J.A. Rotor Fault Detection in Induction Motors Based on Time-Frequency Analysis Using the Bispectrum and the Autocovariance of Stray Flux Signals. Energies 2019, 12, 597. [Google Scholar] [CrossRef]
- Sreejith, B.; Verma, A.K.; Srividya, A. Fault diagnosis of rolling element bearing using time-domain features and neural networks. In Proceedings of the 2008 IEEE Region 10 and the Third international Conference on Industrial and Information Systems, Kharagpur, India, 8–10 December 2008; pp. 1–6. [Google Scholar] [CrossRef]
- Chen, L.; Shen, J.; Xu, G.; Chi, C.; Feng, Q.; Zhou, Y.; Deng, Y.; Wen, H. Induction Motor Stator Winding Inter-Tern Short Circuit Fault Detection Based on Start-Up Current Envelope Energy. Sensors 2023, 23, 8581. [Google Scholar] [CrossRef] [PubMed]
- Akima, H. A New Method of Interpolation and Smooth Curve Fitting Based on Local Procedures. J. ACM 1970, 17, 589–602. [Google Scholar] [CrossRef]
- Messaoudi, M.; Flah, A.; Alotaibi, A.A.; Althobaiti, A.; Sbita, L.; El-Bayeh, C.Z. Diagnosis and Fault Detection of Rotor Bars in Squirrel Cage Induction Motors Using Combined Park’s Vector and Extended Park’s Vector Approaches. Electronics 2022, 11, 380. [Google Scholar] [CrossRef]
- ‘Inter-Turn Stator Winding Fault Diagnosis in Three-Phase Induction Motors, by Park’s Vector Approach | IEEE Journals & Magazine | IEEE Xplore’. Available online: https://ieeexplore.ieee.org/abstract/document/790920/authors#authors (accessed on 8 March 2024).
- Rajamany, G.; Srinivasan, S.; Rajamany, K.; Natarajan, R.K. Induction Motor Stator Interturn Short Circuit Fault Detection in Accordance with Line Current Sequence Components Using Artificial Neural Network. J. Electr. Comput. Eng. 2019, 2019, e4825787. [Google Scholar] [CrossRef]
- Cabanas, M.F.; Norniella, J.G.; Melero, M.G.; Rojas, C.H.; Cano, J.M.; Pedrayes, F.; Orcajo, G.A. Detection of stator winding insulation failures: On-line and off-line tests. In Proceedings of the 2013 IEEE Workshop on Electrical Machines Design, Control and Diagnosis (WEMDCD), Paris, France, 11–12 March 2013; pp. 210–219. [Google Scholar] [CrossRef]
- Bouzid, M.B.K.; Champenois, G. New Expressions of Symmetrical Components of the Induction Motor Under Stator Faults. IEEE Trans. Ind. Electron. 2013, 60, 4093–4102. [Google Scholar] [CrossRef]
- Supangat, R. On-Line Condition Monitoring and Detection of Stator and Rotor Faults in Induction Motors. Ph.D. Thesis, University of Adelaide, School of Electrical and Electronic Engineering, Adelaide, Australia, 2008. Available online: https://digital.library.adelaide.edu.au/dspace/handle/2440/50741 (accessed on 24 March 2024).
- Stack, J.R.; Habetler, T.G.; Harley, R.G. Fault classification and fault signature production for rolling element bearings in electric machines. In Proceedings of the 4th IEEE International Symposium on Diagnostics for Electric Machines, Power Electronics and Drives, 2003; SDEMPED 2003, Atlanta, GA, USA, 24–26 August 2003; pp. 172–176. [Google Scholar] [CrossRef]
- Gandhi, A.; Corrigan, T.; Parsa, L. Recent Advances in Modeling and Online Detection of Stator Interturn Faults in Electrical Motors. IEEE Trans. Ind. Electron. 2011, 58, 1564–1575. [Google Scholar] [CrossRef]
- Bruzzese, C.; Honorati, O.; Santini, E. Rotor bars breakage in railway traction squirrel cage induction motors and diagnosis by MCSA technique Part I: Accurate fault simulations and spectral analyses. In Proceedings of the 2005 5th IEEE International Symposium on Diagnostics for Electric Machines, Power Electronics and Drives, Vienna, Austria, 7–9 September 2005; pp. 1–6. [Google Scholar] [CrossRef]
- Xu, B.; Sun, L.; Xu, L.; Xu, G. Improvement of the Hilbert Method via ESPRIT for Detecting Rotor Fault in Induction Motors at Low Slip. IEEE Trans. Energy Convers. 2013, 28, 225–233. [Google Scholar] [CrossRef]
- Romero-Troncoso, R.J.; Garcia-Perez, A.; Morinigo-Sotelo, D.; Duque-Perez, O.; Osornio-Rios, R.A.; Ibarra-Manzano, M.A. Rotor unbalance and broken rotor bar detection in inverter-fed induction motors at start-up and steady-state regimes by high-resolution spectral analysis. Electr. Power Syst. Res. 2016, 133, 142–148. [Google Scholar] [CrossRef]
- Bracale, A.; Carpinelli, G.; Piegari, L.; Tricoli, P. A High Resolution Method for On Line Diagnosis of Induction Motors Faults. In Proceedings of the 2007 IEEE Lausanne Power Tech, Lausanne, Switzerland, 1–5 July 2007; pp. 994–998. [Google Scholar] [CrossRef]
- Garcia-Calva, T.A.; Morinigo-Sotelo, D.; Garcia-Perez, A.; Camarena-Martinez, D.; de Jesus Romero-Troncoso, R. Demodulation Technique for Broken Rotor Bar Detection in Inverter-Fed Induction Motor Under Non-Stationary Conditions. IEEE Trans. Energy Convers. 2019, 34, 1496–1503. [Google Scholar] [CrossRef]
- Puche-Panadero, R.; Martinez-Roman, J.; Sapena-Bano, A.; Burriel-Valencia, J. Diagnosis of Rotor Asymmetries Faults in Induction Machines Using the Rectified Stator Current. IEEE Trans. Energy Convers. 2020, 35, 213–221. [Google Scholar] [CrossRef]
- Sakaidani, Y.; Kondo, M. Bearing Fault Detection for Railway Traction Motors through Leakage Current. In Proceedings of the 2018 XIII International Conference on Electrical Machines (ICEM), Alexandroupoli, Greece, 3–6 September 2018; pp. 1768–1774. [Google Scholar] [CrossRef]
- Du, Y.; Wang, A.; Wang, S.; He, B.; Meng, G. Fault Diagnosis under Variable Working Conditions Based on STFT and Transfer Deep Residual Network. Shock. Vib. 2020, 2020, e1274380. [Google Scholar] [CrossRef]
- Mustafa, D.; Yicheng, Z.; Minjie, G.; Jonas, H.; Jürgen, F. Motor Current Based Misalignment Diagnosis on Linear Axes with Short-Time Fourier Transform (STFT). Proc. CIRP 2022, 106, 239–243. [Google Scholar] [CrossRef]
- Aimer, F. Induction motor’s rotor faults diagnosis at variable speed using an STFT-MLA combination. Int. J. Electron. Electr. Eng. Syst. 2018, 1, 1–5. [Google Scholar]
- Blodt, M.; Bonacci, D.; Regnier, J.; Chabert, M.; Faucher, J. On-Line Monitoring of Mechanical Faults in Variable-Speed Induction Motor Drives Using the Wigner Distribution. IEEE Trans. Ind. Electron. 2008, 55, 522–533. [Google Scholar] [CrossRef]
- Climente-Alarcon, V.; Antonino-Daviu, J.A.; Riera-Guasp, M.; Puche-Panadero, R.; Escobar, L. Application of the Wigner–Ville distribution for the detection of rotor asymmetries and eccentricity through high-order harmonics. Electr. Power Syst. Res. 2012, 91, 28–36. [Google Scholar] [CrossRef]
- Trajin, B.; Chabert, M.; Regnier, J.; Faucher, J. Wigner distribution for the diagnosis of high frequency amplitude and phase modulations on stator currents of induction machine. In Proceedings of the 2009 IEEE International Symposium on Diagnostics for Electric Machines, Power Electronics and Drives, Cargese, France, 31 August–3 September 2009; pp. 1–6. [Google Scholar] [CrossRef]
- Elbouchikhi, E.; Choqueuse, V.; Amirat, Y.; Benbouzid, M.E.H.; Turri, S. An Efficient Hilbert–Huang Transform-Based Bearing Faults Detection in Induction Machines. IEEE Trans. Energy Convers. 2017, 32, 401–413. [Google Scholar] [CrossRef]
- Antonino-Daviu, J.A.; Climente-Alarcón, V.; Pons-Llinares, J.; Pineda-Sánchez, M.; Jover-Rodriguez, P.; Arkkio, A. Application of TFD tools for the tracing of eccentricity-related components in induction machines. In Proceedings of the 2009 35th Annual Conference of IEEE Industrial Electronics, Porto, Portugal, 3–5 November 2009; pp. 1039–1044. [Google Scholar] [CrossRef]
- Siddiqui, K.M.; Giri, V.K. Broken rotor bar fault detection in induction motors using Wavelet Transform. In Proceedings of the 2012 International Conference on Computing, Electronics and Electrical Technologies (ICCEET), Nagercoil, India, 21–22 March 2012; pp. 1–6. [Google Scholar] [CrossRef]
- Bouzida, A.; Touhami, O.; Ibtiouen, R.; Belouchrani, A.; Fadel, M.; Rezzoug, A. Fault Diagnosis in Industrial Induction Machines Through Discrete Wavelet Transform. IEEE Trans. Ind. Electron. 2011, 58, 4385–4395. [Google Scholar] [CrossRef]
- Abid, F.B.; Braham, A. Advanced Signal Processing Techniques for Bearing Fault Detection in Induction Motors. In Proceedings of the 2018 15th International Multi-Conference on Systems, Signals & Devices (SSD), Hammamet, Tunisia, 19–22 March 2018; pp. 882–887. [Google Scholar] [CrossRef]
- Zarei, J.; Yousefizadeh, S. Fault detection in induction motors using Park’s vector approach and wavelet analysis. In Proceedings of the 2014 International Conference on Mechatronics and Control (ICMC), Jinzhou, China, 3–5 July 2014; pp. 1064–1068. [Google Scholar] [CrossRef]
- Kechida, R.; Menacer, A.; Talhaoui, H.; Cherif, H. Discrete wavelet transform for stator fault detection in induction motors. In Proceedings of the 2015 IEEE 10th International Symposium on Diagnostics for Electrical Machines, Power Electronics and Drives (SDEMPED), Guarda, Portugal, 1–4 September 2015; pp. 104–109. [Google Scholar] [CrossRef]
- Dawed, H.; Jaafari, K.; Beig, A. Stator Inter-Turn Short Circuit Fault Diagnosis using Wavelet Scattering Network Feature Extraction. In Proceedings of the 2023 IEEE International Electric Machines & Drives Conference (IEMDC), San Francisco, CA, USA, 15–18 May 2023; p. 6. [Google Scholar] [CrossRef]
- Cherif, H.; Menacer, A.; Bessam, B.; Kechida, R. Stator inter turns fault detection using discrete wavelet transform. In Proceedings of the 2015 IEEE 10th International Symposium on Diagnostics for Electrical Machines, Power Electronics and Drives (SDEMPED), Guarda, Portugal, 1–4 September 2015; pp. 138–142. [Google Scholar] [CrossRef]
- Maliuk, A.S.; Ahmad, Z.; Kim, J.-M. A Technique for Bearing Fault Diagnosis Using Novel Wavelet Packet Transform-Based Signal Representation and Informative Factor LDA. Machines 2023, 11, 1080. [Google Scholar] [CrossRef]
- Hmida, M.A.; Braham, A. Fault Detection of VFD-Fed Induction Motor under Transient Conditions Using Harmonic Wavelet Transform. IEEE Trans. Instrum. Meas. 2020, 69, 8207–8215. [Google Scholar] [CrossRef]
- Lee, S.B.; Tallam, R.M.; Habetler, T.G. A robust, on-line turn-fault detection technique for induction machines based on monitoring the sequence component impedance matrix. IEEE Trans. Power Electron. 2003, 18, 865–872. [Google Scholar] [CrossRef]
- Zhao, Z.; Fan, F.; Wang, W.; Liu, Y.; See, K.Y. Detection of Stator Interturn Short-Circuit Faults in Inverter-Fed Induction Motors by Online Common-Mode Impedance Monitoring | IEEE Journals & Magazine | IEEE Xplore’. Available online: https://ieeexplore.ieee.org/document/9380558 (accessed on 17 May 2024).
- Fan, F.; Zhao, Z.; Jie, H.; Sun, Q.; Tu, P.; Shu, Z.; Wang, W.; See, K.Y. Impact of Motor Stator Winding Faults on Motor Differential-mode Impedance and Mode Transformation. Chin. J. Electr. Eng. 2022, 8, 12–21. [Google Scholar] [CrossRef]
- Vinayak, B.A.; Alam, M.F.; Jagadanand, G.; Anand, K.A. Stator Inter Turn fault diagnosis by High-Frequency Modeling of Inverter Fed Induction Motor. In Proceedings of the 2020 IEEE International Conference on Power Electronics, Smart Grid and Renewable Energy (PESGRE2020), Cochin, India, 2–4 January 2020; pp. 1–5. [Google Scholar] [CrossRef]
- Gu, B.-G. Offline Interturn Fault Diagnosis Method for Induction Motors by Impedance Analysis. IEEE Trans. Ind. Electron. 2018, 65, 5913–5920. [Google Scholar] [CrossRef]
- Ralikalakala, L.; Barendse, P. Impact of Inverter Switching Harmonics in Detecting Changes in Impedance Due to Broken Rotor Bars. In Proceedings of the 2022 IEEE Energy Conversion Congress and Exposition (ECCE), Detroit, MI, USA, 9–13 October 2022; pp. 1–6. [Google Scholar] [CrossRef]
- Jie, H.; Gao, S.-P.; Zhao, Z.; Fan, F.; Sasongko, F.; Gupta, A.K.; See, K.Y. VNA-Based Fixture Adapters for Wideband Accurate Impedance Extraction of Single-Phase EMI Filtering Chokes. IEEE Trans. Ind. Electron. 2023, 70, 7821–7831. [Google Scholar] [CrossRef]
- Huamin, J.; See, K.Y.; Chang, Y.; Gao, X.-K.; Fan, F.; Zhao, Z. Enhancing motor impedance measurements: Broadening the spectrum from low to high frequencies. Meas. Sci. Technol. 2024, 35, 086008. [Google Scholar] [CrossRef]
- Duvvuri; Sarathbabu; Detroja, K. Model-Based Broken Rotor Bars Fault Detection and Diagnosis in Squirrel-Cage Induction Motors. In Proceedings of the 2016 3rd Conference on Control and Fault-Tolerant Systems (SysTol), Barcelona, Spain, 7–9 September 2016; pp. 537–539. [Google Scholar] [CrossRef]
- Duvvuri, S.S.S.R.S.; Detroja, K. Model-based stator interturn short-circuit fault detection and diagnosis in induction motors. In Proceedings of the 2015 7th International Conference on Information Technology and Electrical Engineering (ICITEE), Chiang Mai, Thailand, 29–30 October 2015; pp. 167–172. [Google Scholar] [CrossRef]
- Trajin, B.; Regnier, J.; Faucher, J. Detection of bearing faults in asynchronous motors using Luenberger speed observer. In Proceedings of the 2008 34th Annual Conference of IEEE Industrial Electronics, Orlando, FL, USA, 10–13 November 2008; pp. 3073–3078. [Google Scholar] [CrossRef]
- Zhang, K.; Jiang, B.; Yan, X.-G.; Mao, Z. Incipient Fault Detection for Traction Motors of High-Speed Railways Using an Interval Sliding Mode Observer. IEEE Trans. Intell. Transp. Syst. 2019, 20, 2703–2714. [Google Scholar] [CrossRef]
- Cruz, S.M.A.; Stefani, A.; Filippetti, F.; Cardoso, A.J.M. Diagnosis of rotor faults in traction drives for railway applications. In Proceedings of the 2008 18th International Conference on Electrical Machines, Vilamoura, Portugal, 6–9 September 2008; pp. 1–6. [Google Scholar] [CrossRef]
- Namdar, A. A robust principal component analysis-based approach for detection of a stator inter-turn fault in induction motors. Prot. Control. Mod. Power Syst. 2022, 7, 48. [Google Scholar] [CrossRef]
- Choudhary, A.; Goyal, D.; Letha, S.S. Infrared Thermography-Based Fault Diagnosis of Induction Motor Bearings Using Machine Learning. IEEE Sens. J. 2021, 21, 1727–1734. [Google Scholar] [CrossRef]
- Stief, A.; Ottewill, J.R.; Baranowski, J.; Orkisz, M. A PCA and Two-Stage Bayesian Sensor Fusion Approach for Diagnosing Electrical and Mechanical Faults in Induction Motors. IEEE Trans. Ind. Electron. 2019, 66, 9510–9520. [Google Scholar] [CrossRef]
- Pramesti, W.; Damayanti, I.; Asfani, D.A. Stator fault identification analysis in induction motor using multinomial logistic regression. In Proceedings of the 2016 International Seminar on Intelligent Technology and Its Applications (ISITIA), Lombok, Indonesia, 28–30 July 2016; pp. 439–442. [Google Scholar] [CrossRef]
- Gonzalez-Jimenez, D.; del-Olmo, J.; Poza, J.; Garramiola, F.; Sarasola, I. Machine Learning-Based Fault Detection and Diagnosis of Faulty Power Connections of Induction Machines. Energies 2021, 14, 4886. [Google Scholar] [CrossRef]
- Samanta, S.; Bera, J.N.; Sarkar, G. KNN based fault diagnosis system for induction motor. In Proceedings of the 2016 2nd International Conference on Control, Instrumentation, Energy & Communication (CIEC), Kolkata, India, 28–30 January 2016; pp. 304–308. [Google Scholar] [CrossRef]
- Ali, M.Z.; Shabbir, M.N.S.K.; Liang, X.; Zhang, Y.; Hu, T. Machine Learning-Based Fault Diagnosis for Single- and Multi-Faults in Induction Motors Using Measured Stator Currents and Vibration Signals. IEEE Trans. Ind. Appl. 2019, 55, 2378–2391. [Google Scholar] [CrossRef]
- Surti, K.V.; Naik, C.A. Bearing Condition Monitoring of Induction Motor Based on Discrete Wavelet Transform & K-nearest Neighbor. In Proceedings of the 2018 3rd International Conference for Convergence in Technology (I2CT), Pune, India, 6–8 April 2018; pp. 1–5. [Google Scholar] [CrossRef]
- Hamdani, S.; Mezerreg, H.; Boutikar, B.; Lahcene, N.; Touhami, O.; Ibtiouen, R. Rotor fault diagnosis in a Squirrel-Cage Induction Machine using support vector. In Proceedings of the 2012 XXth International Conference on Electrical Machines, Marseille, France, 2–5 September 2012; pp. 1817–1822. [Google Scholar] [CrossRef]
- Aydin, I.; Karakose, M.; Akin, E. Artificial Immune Based Support Vector Machine Algorithm for Fault Diagnosis of Induction Motors. In Proceedings of the 2007 International Aegean Conference on Electrical Machines and Power Electronics, Bodrum, Turkey, 10–12 September 2007; pp. 217–221. [Google Scholar] [CrossRef]
- Gunasekaran, S.; Pandarakone, S.E.; Asano, K.; Mizuno, Y.; Nakamura, H. Condition Monitoring and Diagnosis of Outer Raceway Bearing Fault using Support Vector Machine. In Proceedings of the 2018 Condition Monitoring and Diagnosis (CMD), Perth, WA, Australia, 23–26 September 2018; pp. 1–6. [Google Scholar] [CrossRef]
- Abid, F.B.; Zgarni, S.; Braham, A. Bearing fault detection of induction motor using SWPT and DAG support vector machines. In Proceedings of the IECON 2016—42nd Annual Conference of the IEEE Industrial Electronics Society, Florence, Italy, 23–26 October 2016; pp. 1476–1481. [Google Scholar] [CrossRef]
- Yagami, Y.; Araki, C.; Mizuno, Y.; Nakamura, H. Turn-to-turn insulation failure diagnosis of stator winding of low voltage induction motor with the aid of support vector machine. IEEE Trans. Dielectr. Electr. Insul. 2015, 22, 3099–3106. [Google Scholar] [CrossRef]
- Lazar, A.E.N.; Bendali, A.; Ferdjouni, A. ANN-approach for ITSC Fault Diagnosis of Induction Motor. In Proceedings of the 2021 IEEE Workshop on Electrical Machines Design, Control and Diagnosis (WEMDCD), Modena, Italy, 8–9 April 2021; pp. 231–236. [Google Scholar] [CrossRef]
- Mohamed, M.; Mohamed, E.; Mohamed, A.-A.; Abdel-Nasser, M.; Hassan, M.M. Detection of Inter Turn Short Circuit Faults in Induction Motor using Artificial Neural Network. In Proceedings of the 2020 26th Conference of Open Innovations Association (FRUCT), Yaroslavl, Russia, 20–24 April 2020; pp. 297–304. [Google Scholar] [CrossRef]
- Sameh, M.; Tarek, A.; Yassine, K. Bearing and Rotor Faults detection and diagnosis of Induction Motors using Statistical Neural Networks. In Proceedings of the 2020 20th International Conference on Sciences and Techniques of Automatic Control and Computer Engineering (STA), Monastir, Tunisia, 20–22 December 2020; pp. 77–81. [Google Scholar] [CrossRef]
- Pandarakone, S.E.; Masuko, M.; Mizuno, Y.; Nakamura, H. Deep Neural Network Based Bearing Fault Diagnosis of Induction Motor Using Fast Fourier Transform Analysis. In Proceedings of the 2018 IEEE Energy Conversion Congress and Exposition (ECCE), Portland, OR, USA, 23–27 September 2018; pp. 3214–3221. [Google Scholar] [CrossRef]
- Afrasiabi, S.; Afrasiabi, M.; Parang, B.; Mohammadi, M. Real-Time Bearing Fault Diagnosis of Induction Motors with Accelerated Deep Learning Approach. In Proceedings of the 2019 10th International Power Electronics, Drive Systems and Technologies Conference (PEDSTC), Shiraz, Iran, 12–14 February 2019; pp. 155–159. [Google Scholar] [CrossRef]
- Jiménez-Guarneros, M.; Morales-Perez, C.; de Rangel-Magdaleno, J.J. Diagnostic of Combined Mechanical and Electrical Faults in ASD-Powered Induction Motor Using MODWT and a Lightweight 1-D CNN. IEEE Trans. Ind. Inform. 2022, 18, 4688–4697. [Google Scholar] [CrossRef]
- Chen, X.; Yang, Z.; Lou, W. Fault Diagnosis of Rolling Bearing Based on the Permutation Entropy of VMD and Decision Tree. In Proceedings of the 2019 3rd International Conference on Electronic Information Technology and Computer Engineering (EITCE), Xiamen, China, 18–20 October 2019; pp. 1911–1915. [Google Scholar] [CrossRef]
- Mao, J.; Chen, F.; Jiang, B.; Wang, L. Composite Fault Diagnosis of Rotor Broken Bar and Air Gap Eccentricity Based on Park Vector Module and Decision Tree Algorithm. In Proceedings of the 2019 CAA Symposium on Fault Detection, Supervision and Safety for Technical Processes (SAFEPROCESS), Xiamen, China, 5–7 July 2019; pp. 701–706. [Google Scholar] [CrossRef]
- Tran, M.-Q.; Elsisi, M.; Mahmoud, K.; Liu, M.-K.; Lehtonen, M.; Darwish, M.M.F. Experimental Setup for Online Fault Diagnosis of Induction Machines via Promising IoT and Machine Learning: Towards Industry 4.0 Empowerment. IEEE Access 2021, 9, 115429–115441. [Google Scholar] [CrossRef]
- Roy, S.S.; Dey, S.; Chatterjee, S. Autocorrelation Aided Random Forest Classifier-Based Bearing Fault Detection Framework. IEEE Sens. J. 2020, 20, 10792–10800. [Google Scholar] [CrossRef]
- Tastimur, C.; Karakose, M.; Aydin, I.; Akin, E. A New Bearing Fault Diagnosis Method using Envelope based Feature Extraction. In Proceedings of the 2021 Innovations in Intelligent Systems and Applications Conference (ASYU), Elazig, Turkey, 6–8 October 2021; pp. 1–6. [Google Scholar] [CrossRef]
- Lo, N.G.; Soualhi, A.; Frinì, M.; Razik, H. Gear and bearings fault detection using motor current signature analysis. In Proceedings of the 2018 13th IEEE Conference on Industrial Electronics and Applications (ICIEA), Wuhan, China, 31 May–2 June 2018; pp. 900–905. [Google Scholar] [CrossRef]
- Ouachtouk, I.; El Hani, S.; Guedira, S.; Dahi, K. Detection and classification of broken rotor bars faults in induction machine using K-means classifier. In Proceedings of the 2016 International Conference on Electrical and Information Technologies (ICEIT), Tangiers, Morocco, 4–7 May 2016; pp. 180–185. [Google Scholar] [CrossRef]
- Soualhi, A.; Clerc, G.; Razik, H.; Ondel, O. Detection of induction motor faults by an improved artificial ant clustering. In Proceedings of the IECON 2011—37th Annual Conference of the IEEE Industrial Electronics Society, Melbourne, VIC, Australia, 7–10 November 2011; pp. 3446–3451. [Google Scholar] [CrossRef]
- Nagaraju, S.; Manish, K.; Bhattacharya, M. An Effective Density Based Approach to Detect Complex Data Clusters Using Notion of Neighborhood. Int. J. Autom. Comput. 2017, 14, 57–67. [Google Scholar] [CrossRef]
- Li, H.; Wang, W.; Huang, P.; Li, Q. Fault diagnosis of rolling bearing using symmetrized dot pattern and density-based clustering. Measurement 2020, 152, 107293. [Google Scholar] [CrossRef]
- Fernandes, M.; Corchado, J.M.; Marreiros, G. Machine learning techniques applied to mechanical fault diagnosis and fault prognosis in the context of real industrial manufacturing use-cases: A systematic literature review. Appl. Intell. 2022, 52, 14246–14280. [Google Scholar] [CrossRef]
- Campello, R.J.G.B.; Moulavi, D.; Sander, J. Density-Based Clustering Based on Hierarchical Density Estimates. In Advances in Knowledge Discovery and Data Mining; Pei, J., Tseng, V.S., Cao, L., Motoda, H., Xu, G., Eds.; Springer: Berlin/Heidelberg, Germany, 2013; pp. 160–172. [Google Scholar] [CrossRef]
- Malzer, C.; Baum, M. A Hybrid Approach to Hierarchical Density-based Cluster Selection. In Proceedings of the 2020 IEEE International Conference on Multisensor Fusion and Integration for Intelligent Systems (MFI), Karlsruhe, Germany, 14–16 September 2020; pp. 223–228. [Google Scholar] [CrossRef]
- Wang, C.; Yang, J.; Zhang, B. A fault diagnosis method using improved prototypical network and weighting similarity-Manhattan distance with insufficient noisy data. Measurement 2024, 226, 114171. [Google Scholar] [CrossRef]


| Induction motor faults | Stator faults | Insulation defects Open circuit faults Short-circuit faults |
| Rotor faults | Broken rotor bar faults Eccentricity faults Misalignment faults | |
| Bearing faults | In the rolling element In the inner raceway In the outer raceway In the cage | |
| Other faults | Faults in the ventilation system Faults in the power supply Faults in the gears … |
| Time Domain Indicator | Equations |
|---|---|
| Mean | |
| RMS | |
| Standard deviation | |
| Variance | |
| Max | |
| Min | |
| Kurtosis | |
| Skewness |
| Signal | Time-Domain Method | Detected Fault | References |
|---|---|---|---|
| Line currents | Arithmetic differences using RMS values | Stator short circuits | [11] |
| Mechanical vibrations | Mean + σ + RMS + Peak to peak + Skewness + Kurtosis | BRBs | [12] |
| Stray flux | Indicator based on the autocovariance function | BRBs | [13] |
| Mechanical vibrations | Kurtosis + negative log-likelihood value | Rolling element in the bearings | [14] |
| Start-up current | Akima interpolation | Inter-turn short circuit | [15] |
| Three-phase currents | Extended Park’s vector approach | BRBs | [17] |
| Stator current | Park’s vector approach | Inter-turn short circuit | [18] |
| Line current | Symmetrical components analysis | Inter-turn short circuit | [19] |
| Line current | Symmetrical components analysis | Inter-turn short circuit, phase-to-phase, and single-phase-to-ground faults | [21] |
| Detected Fault | Signal | Characteristic Frequency | |
|---|---|---|---|
| Stator faults | Stator current and axial leakage flux | : supply frequency : order of the stator time harmonics : number of pole pairs : slip : an integer | |
| Motor vibrations | |||
| BRB | Stator current and axial leakage flux | ||
| Static eccentricity | Stator current and axial leakage flux | number of rotor bars | |
| Dynamic eccentricity | Stator current and axial leakage flux | 1, 2, 3 … | |
| Motor vibrations | |||
| Bearing fault: rolling element | Motor vibrations | : number of rolling elements : diameter of the rolling element : average diameter of the bearing : contact angle | |
| Bearing fault: cage | Motor vibrations | ||
| Bearing fault: inner raceway | Motor vibrations | ||
| Bearing fault: outer raceway | Motor vibrations |
| Signal | TF Method | Detected Fault | References |
|---|---|---|---|
| Vibration | STFT | BRBs | [12] |
| Vibration | STFT | Bearing faults | [32] |
| Stator current | STFT | Axial misalignment | [33] |
| Stator currents | STFT + MLA | BRBs | [34] |
| Stator current | WVD | Mechanical load faults | [35] |
| Stator current | WVD | Eccentricity | [36] |
| Stator currents | WVD + Concordia + HHT | Eccentricity | [37] |
| Stator currents | HHT | Bearing faults in the rolling element | [38] |
| Stator current | WVD | Mixed eccentricity | [39] |
| Signal | WT Method | Detected Fault | References |
|---|---|---|---|
| Stator current | WT | BRB, broken end-rings, loss of a stator phase | [40,41] |
| Stator currents | WT | Bearing faults | [42] |
| Stator currents | Park vector approach + WT | Bearing faults | [43] |
| Stator currents | WT | Stator inter-turn faults | [44,45,46] |
| Stator current | WPT | Bearing faults | [47] |
| Stator current | MWHWPT | BRB | [48] |
| Signature Extraction Method | Advantages | Disadvantages |
|---|---|---|
| Time domain | Easy to implement, can be used in transient regimes. | Can be hard to identify the type of fault. Information in frequency domain is lost. |
| Frequency domain | Characteristic frequencies are mostly known in advance. | Low resolution in transient regime, some frequency components are hard to detect with low slip. Information in time domain is lost. |
| Time-frequency domain | Capable of providing information in both time and frequency domains. Can be used with non-steady state signals. | Some TF methods can show limited time and frequency resolutions or generate cross terms. |
| Wavelet transform | Can be used with transient, non-periodic features. | Shift sensitivity, lack of phase information and poor directionality. |
| Model-based | Allows a physical representation of the model. | Model must be knowledge-based. By approximating the behaviour of the system, some information may be lost. |
| Classification Method | Advantages | Disadvantages |
|---|---|---|
| Logistic Regression | Easy to understand and train. | Needs a big dataset. Considers a linear relationship between variables. |
| K-Nearest Neighbour | Simple to implement and understand. Low calculation time. | Needs high memory as it stores all training data. Sensitive to outliers. |
| Support Vector Machines | Suitable with high-dimensional data. Works well with small datasets. Robust to noise. | Not intuitive, difficult to interpret. Sensitive to the choice of the kernel function. |
| Neural Networks | Can handle complex data. Suitable with high-dimensional data. | Difficult to interpret due to its black box nature. Sensitive to pre-processing. |
| Decision Trees | Intuitive and easy to understand. Nonparametric method. | Prone to overfitting. The structure of the DT can change drastically if the training data are modified. |
| Random Forest | Reduces overfitting seen in decision trees. Highly accurate. | High computational complexity. Sensitive to noise. |
| K-means | Simple to implement and understand. Low complexity. | Sensitive to outliers. Number of clusters must be given in advance. |
| DBSCAN | Robust to noise and outliers. | Sensitive to the choice of its parameters. |
| HDBSCAN | Can compute varying density clusters. Visualization is possible through dendrograms. | Cubic time complexity. |
Disclaimer/Publisher’s Note: The statements, opinions and data contained in all publications are solely those of the individual author(s) and contributor(s) and not of MDPI and/or the editor(s). MDPI and/or the editor(s) disclaim responsibility for any injury to people or property resulting from any ideas, methods, instructions or products referred to in the content. |
© 2024 by the authors. Licensee MDPI, Basel, Switzerland. This article is an open access article distributed under the terms and conditions of the Creative Commons Attribution (CC BY) license (https://creativecommons.org/licenses/by/4.0/).
Share and Cite
Issa, R.; Clerc, G.; Hologne-Carpentier, M.; Michaud, R.; Lorca, E.; Magnette, C.; Messadi, A. Review of Fault Diagnosis Methods for Induction Machines in Railway Traction Applications. Energies 2024, 17, 2728. https://doi.org/10.3390/en17112728
Issa R, Clerc G, Hologne-Carpentier M, Michaud R, Lorca E, Magnette C, Messadi A. Review of Fault Diagnosis Methods for Induction Machines in Railway Traction Applications. Energies. 2024; 17(11):2728. https://doi.org/10.3390/en17112728
Chicago/Turabian StyleIssa, Razan, Guy Clerc, Malorie Hologne-Carpentier, Ryan Michaud, Eric Lorca, Christophe Magnette, and Anes Messadi. 2024. "Review of Fault Diagnosis Methods for Induction Machines in Railway Traction Applications" Energies 17, no. 11: 2728. https://doi.org/10.3390/en17112728