Article

Comparative Life Cycle Assessment of Electric and Internal Combustion Engine Vehicles

1
Department of Applied Mathematics, Nizhny Novgorod State Technical University n.a. R.E. Alekseev, 603155 Nizhny Novgorod, Russia
2
Department of Electric Power Engineering, Power Supply and Power Electronics, Nizhny Novgorod State Technical University n.a. R.E. Alekseev, 603155 Nizhny Novgorod, Russia
3
Department of Industrial Safety, Ecology and Chemistry, Nizhny Novgorod State Technical University n.a. R.E. Alekseev, 603155 Nizhny Novgorod, Russia
*
Author to whom correspondence should be addressed.
Energies 2024, 17(11), 2747; https://doi.org/10.3390/en17112747
Submission received: 17 April 2024 / Revised: 29 May 2024 / Accepted: 1 June 2024 / Published: 4 June 2024

Abstract

:
This article is devoted to the ecological comparison of electric and internal combustion engine vehicles throughout their entire life cycle, from mining to recycling. A scientifically based approach to a comprehensive environmental assessment of the impact of vehicles on the environment has been developed. To analyze the impact on the environmental situation, aspects such as the consumption of natural resources, waste generation, electricity consumption, emission of harmful substances into the atmosphere, water consumption, and greenhouse gas emissions are taken into consideration. As a result of comparing the environmental impacts of vehicles, it was found that natural resources consumption and production of industrial waste from electric vehicles (EV) is 6 times higher than from internal combustion engine vehicles (ICEV). Harmful substance emissions and greenhouse gas emissions from EV production are 1.65 and 1.5 times higher, respectively. The EV total electricity consumption is 1.4 times higher than that of ICEVs. At the same time, it was revealed that during operation, EVs have higher energy consumption and emit more harmful substances into the atmosphere, but EVs produce less greenhouse gas emissions. It means that at different life cycle stages, EVs have a much higher negative impact on the environment compared to gasoline engine vehicles.

1. Introduction

Every year, there is a rapid increase in the demand for natural resources, and the global community faces serious environmental challenges such as climate change, increased land use, and excessive environmental pollution. One way to reduce the negative environmental impact of transportation is to switch from internal combustion engine vehicles (ICEVs) to electric vehicles (EVs). Electric vehicles have a significant environmental benefit, as they emit much less pollution than traditional vehicles [1].
EV usage can help solve a wide range of environmental issues. However, at present, the environmental impact of EVs in the production of electricity and the EV itself has not been fully understood [2].
Nowadays, there is an increasing trend towards the widespread use of electric motor vehicles worldwide. Many European countries are currently abandoning ICEVs in favor of EVs. This is due to the implementation of the “Fit for 55” climate initiative, which aims to reduce carbon dioxide emissions from new cars by 55% by 2030 and to completely eliminate cars with gasoline and diesel engines by 2035 [3]. This initiative makes it possible to transition to zero-emission vehicles, which will improve air quality, enhance the health and well-being of citizens, and reduce the importation of raw materials required for fuel and lubricant production.
In 2021, the Russian government approved the “Concept for the development of production and use of electric vehicles in the country for the period up to 2030”. The purpose of this document is to create the necessary engineering and transport infrastructure in Russia, including the development of an electric charging station network. There are also plans to stimulate demand for EVs among the population [4].
A large number of studies are devoted to the technical, economic, and environmental analysis of vehicles with various types of engines.
Most of the existing global studies are dedicated to the assessment of greenhouse gas emissions during the transition from traditional gasoline vehicles to EVs. However, it is important to consider the effects of other environmental contaminants in a comprehensive manner. At the moment, there have been studies that consider the environmental impact of electric vehicles (EVs) for small groups of specific environmental factors. However, a comprehensive assessment of the overall environmental impact has not yet been carried out. There are various approaches to assessing the environmental impact of vehicles, which depend on the study goals and the assumptions made during analysis.
There are a significant number of studies that have assessed the greenhouse gas emissions levels from gasoline and electric vehicles. The amount of CO2 emissions from EVs and ICEVs during the entire life cycle of the vehicles is discussed in [5,6,7,8,9,10,11,12,13,14,15]. The authors note that the environmental efficiency in the operation of electric transport depends on the electric energy source type. The use of renewable energy sources can significantly reduce CO2 emissions, which makes EVs more environmentally friendly than ICEVs. As the authors note, it is necessary to jointly consider the development of electric transport and power plants based on renewable energy sources in order to achieve high rates of reduction in environmental pollution.
There are several studies that address the issue of using the life cycle assessment as a method for analyzing the environmental impact. In [16,17], the main aspects that should be taken into account when carrying out a more accurate analysis of the impact of EVs on the environment are discussed. In [16], the authors divided EVs into subsystems and began carrying out a life cycle assessment. A case study on the analysis of a synchronous motor with permanent magnets for electric vehicles has also been launched.
A number of studies have also been conducted, which focus on a literature review of various aspects of research into electric vehicles. The work [18] focuses on a review of scientific papers that aim to assess the consumption of natural resources in the production and use of vehicles. Most studies have found that electric vehicles use more mineral resources and metals than vehicles with internal combustion engines. The work [19] provides a review of the literature on the traction batteries’ life cycle assessment, as the battery is a key component of an electric vehicle.
There are also scientific groups that study the impact of EVs on the environment in various areas. In [20], the authors carried out a comprehensive analysis of the EV, hybrid car, and ICEV life cycles. The assessment was carried out on energy flow, greenhouse gas emissions, and financial flow. Primary energy requirements, greenhouse gas emissions, and mileage costs for various types of electric vehicles were calculated and compared. Vehicle operation is the most important stage in terms of energy and greenhouse gas emissions by all vehicles (except for EVs, for which electric energy is generated by wind farms), but not in terms of economic costs. Economic analyses show that EV costs are lower during operation than the ICEV, but the EV purchasing cost is higher due to the traction battery’s high cost. There is a high correlation between primary energy and greenhouse gas emissions, but not with economic costs. In [21,22,23,24,25,26,27,28,29], the authors carried out a comparative analysis of the ICEV’s and EV’s environmental impacts at various life cycle stages. The authors carried out an analysis of such aspects as the use of natural resources, water pollution, the impact of global warming, etc. The authors found that the EV has a lower negative impact on the environment compared to other types of cars. In [30,31,32], the authors considered the effect of EVs with different types of batteries on the environmental situation. It has been found that increasing battery capacity, power supply system optimization, and other factors have a positive effect on the EV’s environmental impact. In the article [33], the authors discuss the environmental impact of the transition from gasoline vehicles to electric vehicles, considering various environmental factors. The main focus of the study is on assessing the electricity consumption from renewable energy sources, greenhouse gas emissions, the use of natural resources for producing traction batteries, and the human impact. This study is the most similar to the one presented, as it considers a relatively large number of factors.
Despite the numerous studies conducted on analyzing the environmental benefits and drawbacks of EVs, the main challenge that remains is the absence of a comprehensive life cycle assessment of EVs from an environmental perspective. All studies consider the environmental impact of EVs by individual eco-factors or small groups rather than conducting a comprehensive analysis of the entire life cycle of the vehicle. First of all, this study novelty consists of comprehensive EV and ICEV life cycle assessments, including the mining, vehicle production, and operational and disposal processes.
The goal of this article is to develop a scientifically based approach to a comprehensive environmental assessment of the impact of EVs and ICEVs on the environment at all life cycle stages with a subsequent interpretation of the results. The results of the research provide an opportunity to assess the environmental impact during the transition from internal combustion engine vehicles (ICEVs) to electric vehicles (EVs) and to study as much as possible the impact of these vehicles on the environment throughout their life cycle.

2. Methodology of Vehicles Integrated Environmental Assessment

The methodology of the EV- and ICEV-integrated environmental assessment was developed by the authors to achieve this goal [34,35]. This methodology is based on the life cycle assessment method.
The life cycle assessment (LCA) is one of the environmental management components that allows for carrying out a comparative environmental assessment of various industries and technologies. The LCA advantages are a systematic approach, environmental impact indicators application, as well as transparency in the process of collecting the initial data and processing the results. The LCA applies to environmental aspects and potential environmental impacts at all life cycle stages as follows: mining, production, and disposal. The LCA allows an evaluation of each cycle stage, making it possible to determine the changes in directions that can reduce natural resource consumption and reduce the environmental impact.
An EV and ICEV LCA conducting algorithm was developed to carry out a comprehensive comparison.

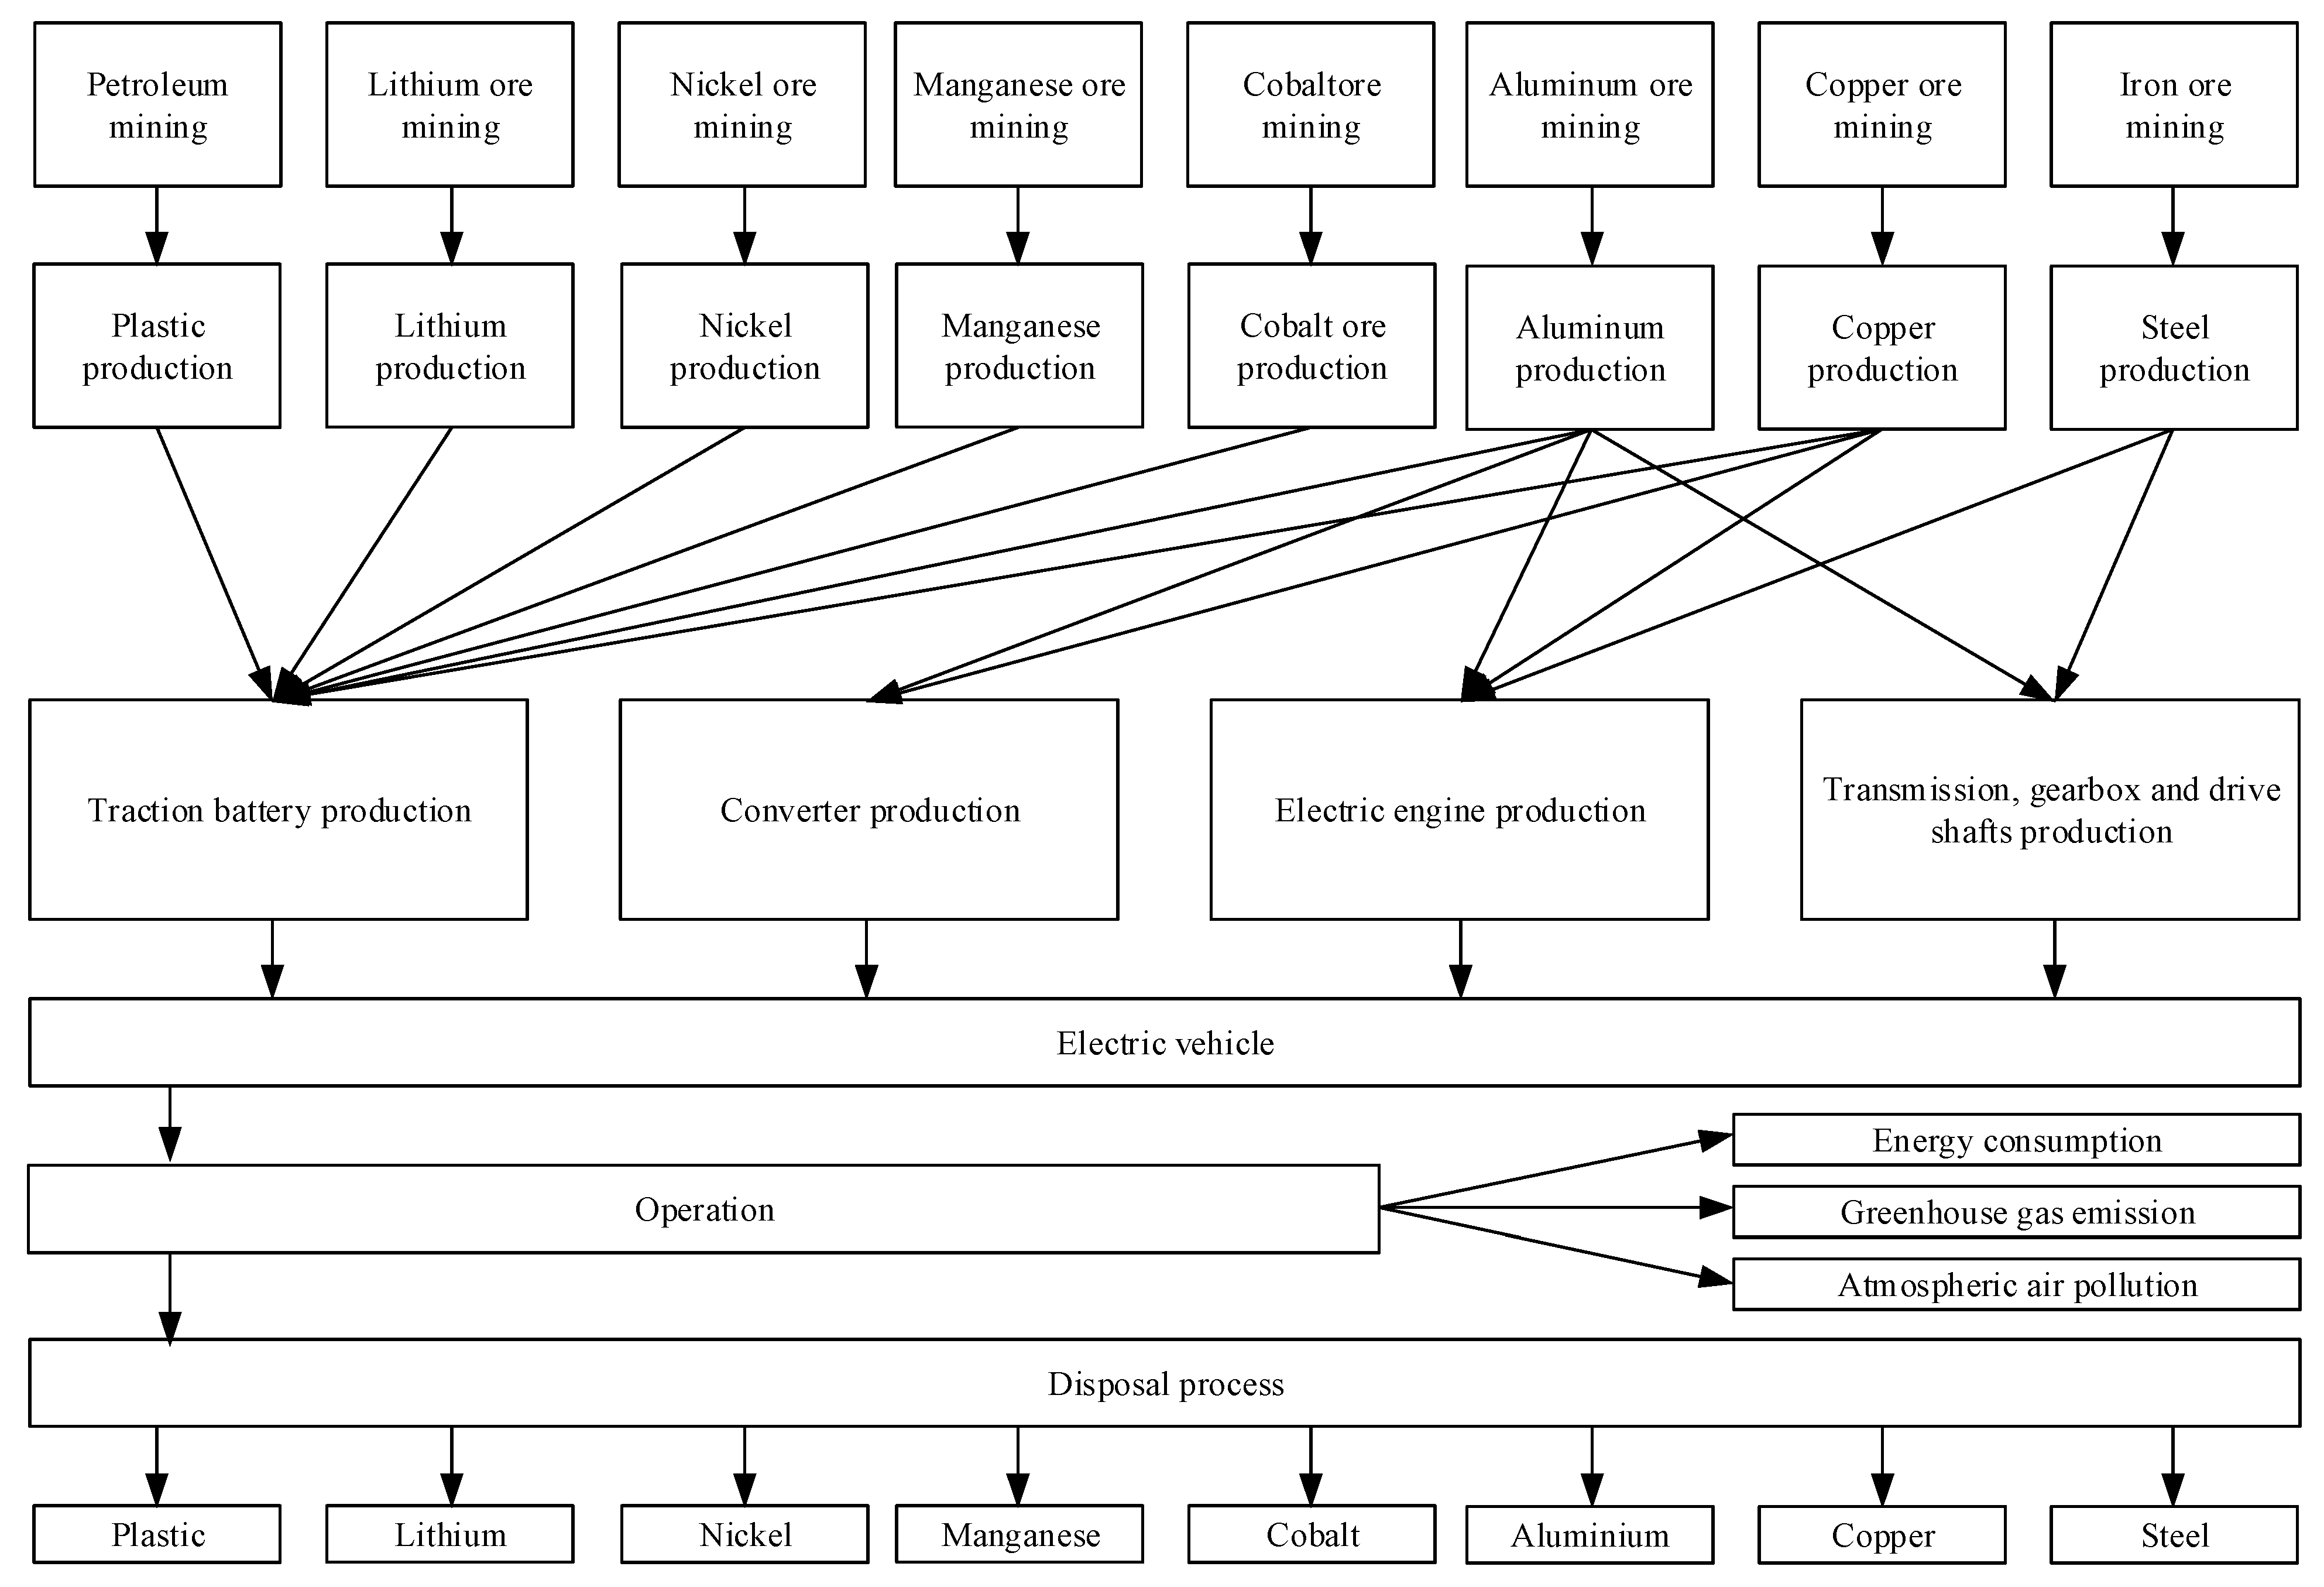
2.1. Life Cycle Diagram Compilation

The life cycle diagram is compiled at the LCA’s first stage. This scheme takes into account the processes of mining, production of details and assemblies, as well as disposal. The EV life cycle diagram is presented in Figure 1. The ICEV life cycle diagram is presented in Figure 2.

2.2. Defining the System Boundaries and Dividing It into Single Processes

In the second stage, the system boundaries are established, and the division into single processes is carried out. The upper system boundary is the extraction of minerals, and the lower boundary is the disposal of decommissioned power facilities.
The initial data for the assessment is the list of materials and their mass. The EV and ICEV detailed masses are determined based on the manufacturer’s characteristics.
The detailing of the processes at an industrial level to limit the amount of investigated information is chosen based on the applied materials. Individual processes are selected based on the industry types as follows: mining (mining), ferrous and non-ferrous metallurgy, petrochemistry (components production), and mechanical engineering (vehicle production).
The vehicle life cycle consists of the following single processes:
  • Minerals mining (ores of non-ferrous and ferrous metals, oil, and coal);
  • Materials production (non-ferrous and ferrous metals, plastics, graphite, and fuel);
  • Vehicles production (with gasoline and electric engines);
  • Disposal process.
Mass and energy assessments are used as cut-off criteria when selecting single processes. Materials with a mass of at least 5% are taken into account according to the mass criterion.
For each single LCA process, the following data were selected for analysis:
  • Input streams of raw materials and other input streams;
  • Products, related products, and waste products;
  • Input electric energy flows;
  • Emissions into the air; discharges into water and soil.
The following criteria were used to decide which input streams should be investigated:
  • Mass;
  • Energy;
  • Environmental significance.
Other important flows may be overlooked when using mass as the only criterion for identifying the input flows. Therefore, it is also necessary to use energy and environmental significance as additional criteria in this process:
  • Mass—during mass criterion application, it is necessary to include all flows, the share of which in the total mass of the system does not exceed a certain percentage in the research;
  • Energy—during energy criterion application, it is necessary to include all energy flows in the research, the share of which in the total energy flow of the system does not exceed a certain percentage;
Environmental significance—during environmental significance criterion application, it is necessary to include flows that contribute a certain percentage to the amount of data for each category in the research.

2.3. Inventory Analysis Carrying Out

The inventory analysis of the system is carried out in the third stage. This is the collection of qualitative and quantitative information about the input and output material and energy flows for each single process. This stage is the most time-consuming, based on the huge amount of information used. An example of a single process for steel production is shown in Figure 3.
For the ferrous metallurgy single process, an environmental analysis of the data showed:
In ferrous metallurgy, waste products consist of the following:
-
During cast iron production—from blast furnace slag, grate dust, sludge from blast furnace gas cleaners, and sludge from bunker rooms;
-
During steel production—from steelmaking slags to sludge from gas cleaners of steelmaking furnaces.
Polluted waters are formed from bunker rooms, granulation of blast furnace slag, and filling machines in the blast furnace plant. During transportation, screening, and dosing of the charge, dust is released in the under-bunker trestles, and a certain amount of material spills onto the floor, which is cleaned with water. In blast furnace production, the wastewater contains particles of ore, coke, limestone, sulfates, chlorides, fragments of solidified cast iron, scale, graphite, and unfinished lime.
Wastewater in steelmaking is formed during gas purification in open-hearth furnaces, converters, and electric melting furnaces, as well as the cooling and hydrotreating of mills, continuous steel-casting plants, and the washing of waste boilers.
All stages of the technological processes in ferrous metallurgy are accompanied by the formation of dust and gases. The amount of formed dust depends on the metallurgical process, its intensity, the unit construction, the physico-chemical characteristics of the charge, etc. The formed gases differ in chemical composition (CO, CO2, NOx, SOx, and H2S). The formed dust differs in chemical composition (oxides of iron, silicon, manganese, magnesium, aluminum, and calcium) and dispersed composition. Dust is formed during mechanical grinding, transportation, and in the furnace shaft. Blast furnace gas is a mixture of fine particles of ore, coke, agglomerate, limestone, and other materials loaded into the furnace.
A standard form for collecting information on the material and energy flows for a single process is shown in Table 1. Such a form is filled in for each single process.
Table 2 is an example of an environmental data collection form for ferrous metallurgy.
Similarly, the data for copper, aluminum, and oil were determined according to the reference data.
The method of material balances is used to assess the natural resources consumption. This method provides for accounting for the input flow of the substance (at the entrance to the technological process or to the enterprise) and the output flow of the substance (materials or equipment) and the formed waste products in this case.
Priority environmental issues (human toxicity and global warming) were taken into account when assessing the impact on the natural environment. The following areas were chosen: pollution of atmospheric air, water resources, and soil.
It is advisable to apply the method based on the emission factor (specific emissions per ton of products) to assess the environmental impact. These coefficients are used under the assumption that all industrial plants producing similar products through the same technological processes have similar emission and discharge characteristics.
The following factors were selected for the impact analysis:
  • Natural resources consumption;
  • Waste product formation;
  • Water consumption;
  • Wastewater discharge;
  • Harmful substance emissions into the atmospheric air;
  • Greenhouse gas emissions;
  • Electric energy consumption.
Standard data sources (Russian regulatory documents, statistical data, and reference books) were used to quantify the impacts.
Specific indicators of the material and energy flows and environmental impacts during steel production are given as an example in Table 3. The value of the specific consumption of natural resources for steel is 4.5 kg per 1 kg of products.

2.4. Determination of the Environmental Impact Degree

It is necessary to assess the significance of the EV and ICEV’s potential environmental impacts. All the values of the potential impacts are quantified to do this.
A comprehensive environmental assessment includes the following components:
  • Natural resources consumption;
  • Electric energy consumption;
  • Summary environmental assessment.

2.5. Results Interpretation

In the fifth stage, the results of a comprehensive environmental assessment are analyzed, specifying the used resources and energy consumption.

3. LCA Mathematical Apparatus

The mathematical apparatus describes the interrelationships of the material, energy, and environmental flows in a comprehensive assessment of the level of EV environmental friendliness. Numerical calculations, performed using the developed device, make it possible to determine the efficiency of the resource usage, as well as to assess the environmental impact throughout the vehicle’s entire life cycle.
The performed calculations make it possible to analyze the processes associated with the extraction, production, and utilization of natural resources, taking into account electric energy consumption, waste product disposal, greenhouse gas emissions, and other aspects affecting the environmental friendliness of transport.
The LCA procedure calculation is shown in Figure 4.
  • In the first stage, it is determined which materials and in what quantity are used in the vehicle production process;
  • In the second stage, specific indicators (soil pollution, water pollution, atmospheric emissions, and electric energy consumption) per unit mass of products are determined according to the Russian reference data;
  • In the third stage, the material masses at each production level are calculated based on specific parameters and the material mass at the previous level;
  • In the fourth stage, the formed waste products’ environmental impacts, emissions of harmful substances, etc., are calculated (using existing and developed formulas);
  • In the fifth stage, the total environmental impact on the environment at all stages is determined;
  • In the sixth stage, the received data analysis is carried out, and conclusions are drawn about the degree of environmental impact of the production process on the environment on its basis.

3.1. Atmospheric Pollution-Specific Indicators

The toxicity of emissions into the atmosphere is determined based on the values of the reduced specific mass of harmful substance emissions. The reduced specific mass of harmful substance emissions into the atmospheric air is calculated based on the reference data of specific emissions for each harmful substance by the type of industry and their toxicity, which is calculated taking into account the maximum permissible concentration (MPC).
The value of the reduced specific gravity of the harmful substance emissions into the atmosphere (Mr_sp_atm) for each stage of the life cycle and each material is determined by the following formula:
M r _ s p _ atm = i = 1 n A i · m i
The value of Ai is determined by the following formula:
A i = a i · α i · δ i
In some cases, two additional multipliers are introduced into Formula (2) to determine the value of Ai:
  • Correction λi is for the probability of a secondary injection of impurities into the atmosphere after they settle on surfaces;
  • Correction βi is for the probability of formation, with the participation of initial impurities released into the atmosphere, of other pollutants more dangerous than the initial ones.
The numerical value of the ai indicator is determined by the following formula:
a i = MPC d . a . C M · MPC w . a . CM MPC d . a . i · MPC w . a . i
The MPC values are determined from the sanitary standards; the remaining coefficients are from literary sources.
The reduced mass (Mr_atm) of the emission of all harmful substances for each material and stage of the life cycle is determined by the following formula:
M r _ atm = M r _ s p _ atm · M

3.2. Water Pollution-Specific Indicators

The volume of water consumption and wastewater disposal is calculated based on the values of the specific consumption of fresh water and the specific discharge of wastewater, taking into account the type of industry and materials.
The consumption (Q) of fresh water and wastewater for each stage of the life cycle and each material is determined by the following formula:
Q   =   M · q s p
The toxicity of wastewater is determined by taking into account the volume and indicators of the relative danger of harmful substances in wastewater for each type of industry and material.
The reduced specific mass (Mr_sp_water) of the discharge of impurities by this source is determined by the following formula:
M r _ sp _ water = i = 1 n A i · m i
The Ai numerical value for each pollutant is determined by the following formula:
A i = 1 MPC f . i
The reduced mass (Mr_wastewater) of all harmful substances in wastewater for each material and stage of the life cycle is determined by the following formula:
M r _ w a s t e w a t e r = M r _ sp _ water · M

3.3. Soil Pollution-Specific Indicators

The mass of the formed waste products for each type of material and type of industry is calculated based on the values of specific indicators of production-formed waste products per unit of output or processed raw materials based on the reference data.
The mass of the formed waste products (M_wp) is determined by the following formula:
M wp = M sp _ wp · M
The regulatory documents provide a method for calculating the reduced mass of waste, taking into account the specific indicators of waste generation and the hazard coefficients of the waste components for each material used in production.
The reduced mass (Mr_wp) of waste for each material and stage of the life cycle is determined by the following formula:
M r _ wp = M w p · K
The calculation of the hazard coefficient of waste components is based on a mathematical and statistical model based on the use of a set of primary hazard indicators of the waste component, which is formed on the basis of ecological, toxicological, and physico-chemical parameters according to the hazard indicators of the component, taking into account the impact on the soil.
The composition of the waste generated is determined from literature and reference data based on the study of the composition of raw materials and production processes for the used materials and types of industry.

3.4. Electric Energy Consumption

Electric energy is needed at all stages of the life cycle: mining, ferrous and non-ferrous metallurgy, as well as mechanical engineering and waste disposal.
The electric energy consumption (W) is determined based on the mass of each material at the stages of the product life cycle (M) and specific energy consumption rates (Wsp_ee) as follows:
W = M · W sp _ ee

4. Initial Data for Analysis

The developed LCA methodology was applied to evaluate EVs and ICEVs. The Chinese model, A60 of DongFeng, was chosen as a car with an internal combustion engine since an electric car, the E70, was designed on the basis of this transport, which is produced in Russia (Nizhny Novgorod) under the brand name EVOLUTE i-Pro.
Since the ICEV and EV differ only in powertrains, the common components of the structure did not participate in the environmental analysis. These include the body, chassis, electrical equipment, brake system, onboard 12 V battery, car tires, and other interior elements.
Table 4 shows the main technical characteristics of the different ICEVs and EVs. These parameters were determined based on the technical specifications of the manufacturer.
In the analysis, the materials that made up EVs and ICEVs were considered. Table 5 shows the masses of materials for the production of the main components of cars.
It is also worth noting that the EV’s total mass exceeds the ICEV’s mass by 287 kg, which is explained by the presence of a traction battery.

5. Results and Discussion

Based on the initial mass of the car materials and the specific indicators of waste product formation, the masses of materials and waste products of the life cycle at each stage and the mass of natural resources were calculated. These indicators are shown in Table 6.

5.1. Natural Resources Consumption

The natural resources mass was calculated for each type of material, including iron, copper, nickel, manganese, ore, etc.
The consumption of various natural resources for the production of materials for EVs and ICEVs is shown in Table 7.
The mass of the consumed natural resources for EV production is 6 times greater than for the ICEV due to the use of ores (nickel, manganese, and cobalt) with a low metal content, which leads to an increase in the anthropogenic impact on the environment.

5.2. Waste Products Formation

The total mass of the formed waste products in the EV’s and ICEV’s life cycle is shown in Figure 5.
To account for the formed waste products’ toxicity, the reduced waste products’ mass was calculated, taking into account the hazard index of the waste components for each material and stage of the life cycle.
Since the calculation table for all the materials and life cycle stages is very large, this article presents part of the table for two materials as an example. The calculation of the conditional mass of waste for the EV is given in Table 8. Figure 6 shows the conditional mass of the EV and ICEV life cycle waste products.
The waste products bulk is formed at the mining stage for both types of vehicles. The waste products mass during EV production is 6 times greater due to the use of ores with a low metal content and, accordingly, a large mass of formed waste products. The total reduced mass of the waste products is significantly higher during EV production due to the more toxic components of nickel, cobalt, and manganese.

5.3. Water Consumption and Wastewater Discharge

The required volume of water for vehicle production was calculated based on the mass of the constituent materials (Table 6) and specific water consumption by industry at all stages of the life cycle. The results of calculating the water consumption for the two materials included in the EV are shown in Table 9.
The calculation of the volume of wastewater discharged into reservoirs was performed based on the mass of materials and taking into account the specific discharge of water at all stages of the life cycle. The calculation of the reduced mass of harmful substances in wastewater was performed, taking into account the mass of the constituent materials and the reduced specific mass of harmful substances in wastewater, which is based on the concentration of harmful substances and their maximum permissible concentration (MPC). Wastewater discharge and the reduced mass of harmful substances in the water are shown in Table 10.
The total water consumption, wastewater discharge, and harmful substances in water by the EV’s and ICEV’s life cycle stages are shown in Figure 7.
The freshwater consumption volume during EV production is 4.5 times higher due to the more water-intensive production processes.
The EV wastewater volume is 2 times greater than the ICEV wastewater volume. The wastewater discharge volume is much less than the consumption due to large losses in the process of its use.
The harmful substance emissions mass during EV production is 2.5 times greater than that of the ICEV.
The harmful substances’ bulk in water are formed at the vehicle’s production stage due to a higher wastewater pollution level.

5.4. Harmful Substance Emissions into the Atmospheric Air

The calculation of the reduced mass of pollutants released into the atmospheric air is based on the mass of the vehicle materials constituent (Table 6) and the reduced specific emissions, taking into account the gas toxicity and dust for various types of industry.
The calculation results of the pollutants’ reduced mass for the two materials included in the EV are shown in Table 11.
The harmful substances’ reduced mass regarding the EV and ICEV life cycle stages are shown in Figure 8.
The mass of the harmful substance emissions into the atmospheric air for EV production is 1.5 times greater than for the ICEV due to the use of more non-ferrous metals (nickel, manganese, and cobalt).
The largest volume of emissions occurs at the stage of production of non-ferrous metals, which have a high relative aggressiveness indicator.

5.5. Greenhouse Gas Emissions

Greenhouse gas emissions were calculated based on the mass of the vehicle’s constituent materials (Table 6) and specific greenhouse gas emissions for various industries.
The greenhouse gas emissions calculation results for the two materials included in the EV are presented in Table 12.
Greenhouse gas emissions by EV and ICEV life cycle stages are shown in Figure 9.
The greenhouse gases’ main source is the aluminum production process (perfluorocarbon emissions as a result of the electrolysis process’s anodic effects).
A large number of non-ferrous metals are used in EVs. As a result, EV CO2 emissions are 1.65 times higher than those of the ICEV.

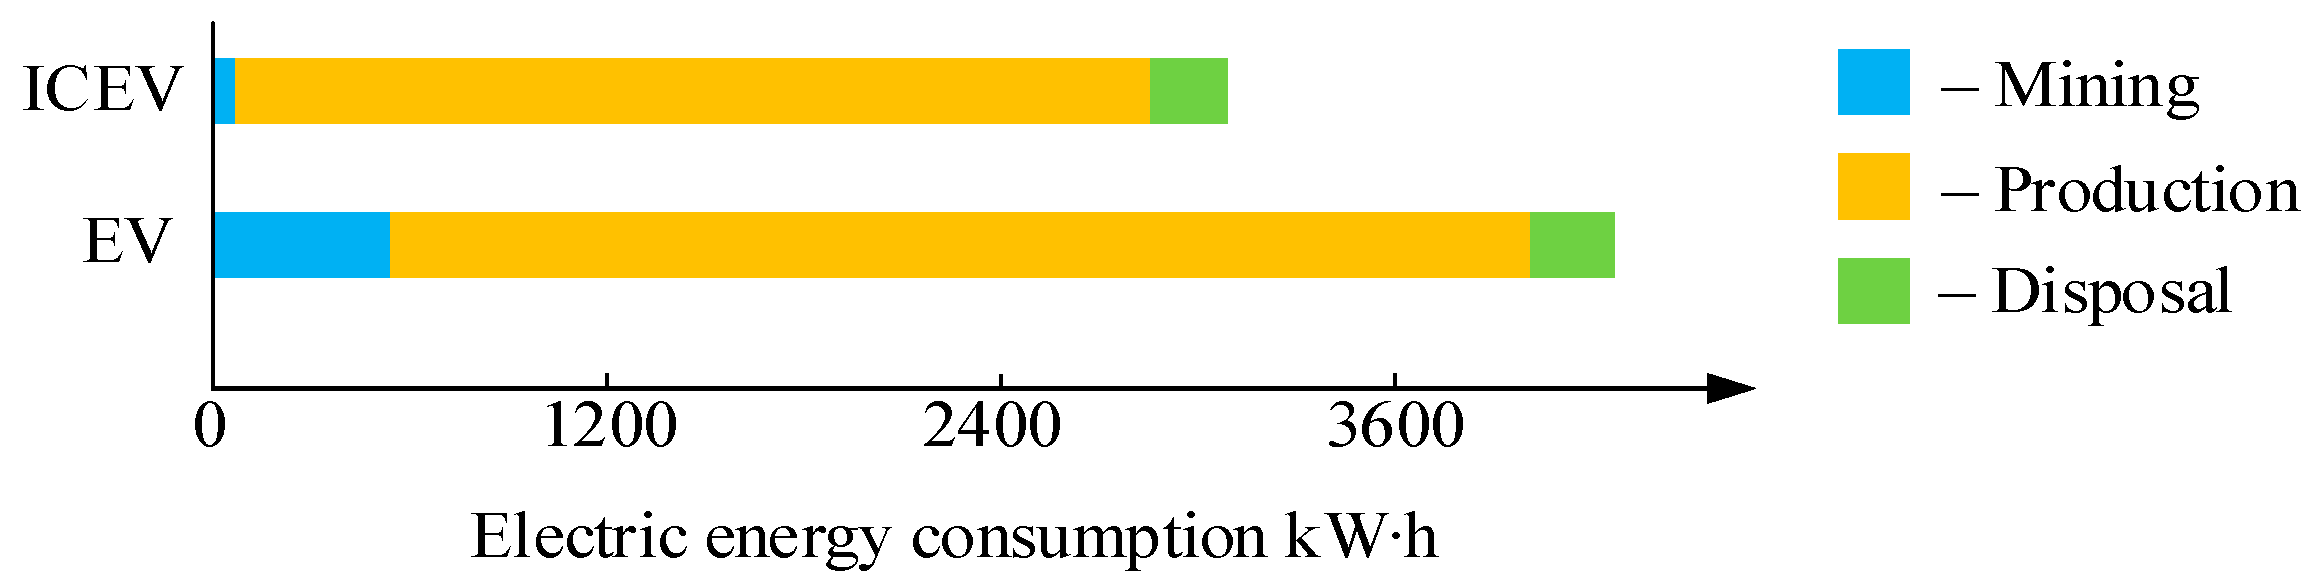
5.6. Electric Energy Consumtion

The electric energy consumption was calculated based on the mass of the vehicle’s constituent materials (Table 6) and the specific electric energy consumption norms for various industry types. The study took into account the production of electricity only from thermal power plants, as these are the dominant type of power plants in the Russian Federation, generating more than 70% of the total electricity.
The calculation results of electric energy consumption for the two materials included in the EV are presented in Table 13.
The total electric energy consumption by the EV and ICEV life cycle stages is shown in Figure 10.
The electrical energy consumption during EV production is higher than that of the ICEV. The most energy-intensive processes are nickel ore mining and aluminum production.

5.7. Exploitation Process

The assessment of environmental compatibility during the vehicle’s operation was carried out according to the energy and environmental (atmospheric air pollution and greenhouse gas emissions) flows for one year. The main harmful substances found in flue gases from power plants and exhaust gases from vehicles are taken into consideration.
The electric energy consumption during EV operation is 4676 kW∙h/year with a mileage of 16,700 km/year. Electric energy production will amount to 7160 kW∙h/year, taking into account charging losses of 15%, losses in networks of 9.6% (according to statistics), and a power plant auxiliary supply of 15%. The efficiency of thermal power plants was also taken into account, which is 35%.
We will convert the amount of EV electric energy consumption and ICEV fuel into Joules. A comparison of energy consumption (in GJ) by vehicles during operation is shown in Table 14.
It can be seen that EVs consume more energy due to low power plant efficiency, losses during transmission, and electric energy production.
Harmful substance emissions during EV and ICEV operations are presented in Table 15. Harmful substance-specific emissions from electric energy generation and ICEV mileage emissions, indicators of the relative aggressiveness of these substances, were taken into account.
Harmful substance emissions during EV operation are 3 times higher than those of the ICEV due to the more primary energy combustion (lower efficiency) in power plants.
Greenhouse gas emissions are calculated based on specific indicators for electric energy generation and fuel combustion. The results of the greenhouse gas emissions calculation during operation are presented in Table 16.
ICEV’s greenhouse gas emissions during operation are higher due to higher greenhouse gas generation during fuel combustion for internal combustion engines.

5.8. Comprehensive Environmental Assessment

The EV and ICEV total environmental assessment for all impact indicators is shown in Table 17.
The performed environmental calculations show the following:
  • A transition from ICEVs to EVs will lead to an increase in the environmental burden at all life cycle stages due to the use of additional materials such as nickel, manganese, and cobalt;
  • The mass of extracted natural resources and formed waste products for EV production is 6 times greater than for the ICEV due to the use of ores with a low metal content;
  • Reduced masses of harmful substances in waste products, wastewater, and atmospheric air are significantly higher for EV production due to the use of technological processes with more toxic emissions;
  • The freshwater consumption volume and wastewater volume for EVs are higher due to production processes with high water capacity;
  • Electric energy consumption during EV production is higher than that of the ICEV due to the energy-intensive processes of materials extraction and production.
The vehicles’ total environmental impact during operation is presented in Table 18.
Harmful substance emissions during EV operation are 3 times higher than those of the ICEV due to more primary energy combustion (lower efficiency) in power plants.

6. Conclusions

We developed a methodology that allows us to carry out a quantitative assessment of the environmental factors that affect the environment at all vehicles’ life cycle stages. This methodology makes it possible to consistently and accurately link inventory data to specific potential environmental impacts.
An EV and ICEV comparative assessment was carried out according to the developed methodology. The conducted comprehensive environmental assessment makes it possible to fully consider the environmental impact of vehicles at all life cycle stages, from mining to disposal, and it can be used to compare different types of vehicles, taking into account the environmental factors’ influence. This technique is universal. And it allows us to carry out analyses, regardless of the car type.
A comparison of the environmental impact carried out according to the developed methodology made it possible to identify and clarify the environmental EV using advantages and disadvantages over traditional cars and outline solutions. It was found that EV production requires 6 times more natural resources and produces 6 times the amount of waste compared to ICEVs. EVs consume 4.5 times more fresh water and emit 1.65 times more harmful substances and 1.5 times more greenhouse gases, respectively. The EV’s total electric energy consumption is 1.4 times greater compared to the ICEV. The vehicle’s operation analysis has shown that an EV has higher energy consumption and releases more harmful substances into the atmosphere, but it also produces less greenhouse gas emissions.
The scientific work basis is the creation of a new systematic approach to an assessment of possible environmental consequences from EVs. The created method provides a comprehensive performance of the negative environmental impact of EV materials production on the environment and also allows us to take into account possible environmental risks when developing environmental marketing strategies, EV technology development programs, and resource and energy conservation programs.
The main significance of this work is the identification of possible measures to adjust existing strategies and form new ones for EV production technologies development, taking into account possible environmental risks.
Reducing the EV’s negative impact on the environment can be achieved through several methods:
  • Batteries’ environmental characteristics increased by the lithium-ion batteries’ technical specifications, improving and developing alternative battery technologies based on other materials such as sodium and calcium;
  • EV design improvement can be achieved by enhancing the structural elements’ technical characteristics, increasing the electric motor efficiency, and reducing losses in the energy transmission to the movement of the wheels;
  • Reducing the environmental impact of electric energy generation by increasing the use of renewable energy sources and improving fuel combustion technology in coal-fired thermal power plants. Improving energy efficiency by transitioning from non-ecological fuels like coal to natural gas at thermal power plants, using modern gas turbine and combined-cycle designs.
The developed methodology can be used in making decisions on the following:
  • Improving the life quality and health of the population;
  • Environmental situation improvement;
  • Natural resources consumption reduction;
  • Electric energy consumption reduction;
  • Organic fuel consumption reduction.
The results can be applied to the following:
  • Selection of materials and technological processes in the power plant design;
  • Choice of methods for cleaning emissions before they enter into the atmospheric air and wastewater, and a method of formed waste products disposal;
  • Environmental situation strategic planning;
  • Implementation of a state program on resource and energy conservation;
  • Marketing environmental research.

Author Contributions

Conceptualization, O.M. and E.K.; methodology, A.K. and O.M.; investigation, O.M., A.K., Y.P., D.G. and E.K.; validation, E.K.; formal analysis, E.K.; data curation, Y.P. and D.G.; writing—original draft preparation, A.K., O.M. and Y.P.; writing—review and editing, A.K. and E.K.; visualization, Y.P. and D.G.; supervision, A.K. and E.K.; project administration, E.K.; funding acquisition, E.K. All authors have read and agreed to the published version of the manuscript.

Funding

This research was funded by the Ministry of Science and Higher Education of the Russian Federation (state task No. FSWE-2022-0005).

Data Availability Statement

Data are contained within the article.

Conflicts of Interest

The authors declare no conflict of interest.

Nomenclature

miemission mass of the i-th impurity
Airelative aggressiveness indicator of the i-th substance
nnumber of impurities emitted by the source
aian indicator of the relative danger of the presence of an impurity in the air inhaled by humans
αian amendment that takes into account the probability of accumulation of initial impurities or secondary pollutants in environmental components and in food chains, as well as the ingress of impurities into the human body through non-inhalation pathways
δiamendment that takes into account the effect on various recipients other than a person
Msp_wpspecific indicator of production waste formation
Kwaste product danger degree indicator
Mmass of material at each life cycle stage
qspspecific requirement of consumption of water or wastewater per unit of production
MPCf.imaximum permissible concentration of the i-th substance of water bodies in the water for fisheries purposes
MPCd.a.i“daily average” maximum permissible concentration of the i-th impurity in the atmospheric air
MPCw.a.imaximum permissible concentration of the i-th impurity in the air of the working area
MPCd.a.CM“daily average” maximum permissible concentration of carbon monoxide (CM) in the atmospheric air of populated areas
MPCw.a.CMCM maximum permissible concentration in the air of the working area

References

  1. Meydani, A.; Meidani, A.; Shahablavasani, S. The Performance of Electric and Hybrid Cars and the Effect of Their Use in the Environmental Cycle. In Proceedings of the 2023 8th International Conference on Technology and Energy Management (ICTEM), Babol, Mazandaran, Iran, 8–9 February 2023; pp. 1–7. [Google Scholar] [CrossRef]
  2. Tintelecan, A.; Dobra, A.C.; Marțiș, C. Literature Review—Electric Vehicles Life Cycle Assessment. In Proceedings of the 2020 ELEKTRO, Taormina, Italy, 9 September 2020; pp. 1–6. [Google Scholar] [CrossRef]
  3. European Commission. “Fit for 55”: Delivering the EU’s 2030 Climate Target on the way to climate neutrality. In Communication from the Commission to the European Parliament, the Council, the European Economic and Social Committee and the Committee of the Regions; COM (2021) 550 Final; European Commission: Brussels, Belgium, 2021. [Google Scholar]
  4. Concept for the Development of Production and Use of Electric Vehicles in the Country for the Period up to 2030. Order of the Russian Federation No. 2290-r dated 08/23/2021. Available online: https://legalacts.ru/doc/rasporjazhenie-pravitelstva-rf-ot-23082021-n-2290-r-ob-utverzhdenii/ (accessed on 16 April 2024).
  5. Tang, B.; Xu, Y.; Wang, M. Life Cycle Assessment of Battery Electric and Internal Combustion Engine Vehicles Considering the Impact of Electricity Generation Mix: A Case Study in China. Atmosphere 2022, 13, 252. [Google Scholar] [CrossRef]
  6. Franzò, S.; Nasca, A. The environmental impact of electric vehicles: A comparative LCA-based evaluation framework and its application to the Italian context. In Proceedings of the 15th International Conference on Ecological Vehicles and Renewable Energies (EVER), Monte-Carlo, Monaco, 10–12 September 2020; pp. 1–4. [Google Scholar] [CrossRef]
  7. Rapa, M.; Gobbi, L.; Ruggieri, R. Environmental and Economic Sustainability of Electric Vehicles: Life Cycle Assessment and Life Cycle Costing Evaluation of Electricity Sources. Energies 2020, 13, 6292. [Google Scholar] [CrossRef]
  8. Raugei, M. Update on the Life-Cycle GHG Emissions of Passenger Vehicles: Literature Review and Harmonization. Energies 2022, 15, 7163. [Google Scholar] [CrossRef]
  9. Jursova, S.; Burchart-Korol, D.; Pustejovska, P. Carbon Footprint and Water Footprint of Electric Vehicles and Batteries Charging in View of Various Sources of Power Supply in the Czech Republic. Environments 2019, 6, 38. [Google Scholar] [CrossRef]
  10. Markowska, K.; Flizikowski, J.; Bieliński, K.; Tomporowski, A.; Kruszelnicka, W.; Kasner, R.; Bałdowska-Witos, P.; Mazur, Ł. The Comparative Assessment of Effects on the Power System and Environment of Selected Electric Transport Means in Poland. Materials 2021, 14, 4556. [Google Scholar] [CrossRef] [PubMed]
  11. Kawamoto, R.; Mochizuki, H.; Moriguchi, Y.; Nakano, T.; Motohashi, M.; Sakai, Y.; Inaba, A. Estimation of CO2 Emissions of Internal Combustion Engine Vehicle and Battery Electric Vehicle Using LCA. Sustainability 2019, 11, 2690. [Google Scholar] [CrossRef]
  12. Petrauskienė, K.; Galinis, A.; Kliaugaitė, D.; Dvarionienė, J. Comparative Environmental Life Cycle and Cost Assessment of Electric, Hybrid, and Conventional Vehicles in Lithuania. Sustainability 2021, 13, 957. [Google Scholar] [CrossRef]
  13. Smit, R.; Kennedy, D.W. Greenhouse Gas Emissions Performance of Electric and Fossil-Fueled Passenger Vehicles with Uncertainty Estimates Using a Probabilistic Life-Cycle Assessment. Sustainability 2022, 14, 3444. [Google Scholar] [CrossRef]
  14. Kosai, S.; Zakaria, S.; Che, H.S.; Hasanuzzaman, M.; Rahim, N.A.; Tan, C.; Ahmad, R.D.R.; Abbas, A.R.; Nakano, K.; Yamasue, E. Estimation of Greenhouse Gas Emissions of Petrol, Biodiesel and Battery Electric Vehicles in Malaysia Based on Life Cycle Approach. Sustainability 2022, 14, 5783. [Google Scholar] [CrossRef]
  15. Hirz, M.; Nguyen, T.T. Life-Cycle CO2-Equivalent Emissions of Cars Driven by Conventional and Electric Propulsion Systems. World Electr. Veh. J. 2022, 13, 61. [Google Scholar] [CrossRef]
  16. Tintelecan, A.; Dobra, A.C.; Marţiş, C. LCA Indicators in Electric Vehicles Environmental Impact Assessment. In Proceedings of the 2019 Electric Vehicles International Conference (EV), Bucharest, Romania, 3–4 October 2019; pp. 1–5. [Google Scholar] [CrossRef]
  17. Madhu, K.; Pauliuk, S. Integrating Life Cycle Assessment into the Framework of Environmental Impact Assessment for Urban Systems: Framework and Case Study of Masdar City, Abu Dhabi. Environments 2019, 6, 105. [Google Scholar] [CrossRef]
  18. Dolganova, I.; Rödl, A.; Bach, V.; Kaltschmitt, M.; Finkbeiner, M. A Review of Life Cycle Assessment Studies of Electric Vehicles with a Focus on Resource Use. Resources 2020, 9, 32. [Google Scholar] [CrossRef]
  19. Temporelli, A.; Carvalho, M.L.; Girardi, P. Life Cycle Assessment of Electric Vehicle Batteries: An Overview of Recent Literature. Energies 2020, 13, 2864. [Google Scholar] [CrossRef]
  20. Freire, F.; Marques, P. Electric vehicles in Portugal: An integrated energy, greenhouse gas and cost life-cycle analysis. In Proceedings of the 2012 IEEE International Symposium on Sustainable Systems and Technology (ISSST), Boston, MA, USA, 16–18 May 2012; pp. 1–6. [Google Scholar] [CrossRef]
  21. Hawkins, T.R.; Singh, B.; Majeau-Bettez, G.; Strømman, A.H. Comparative Environmental Life Cycle Assessment of Conventional and Electric Vehicles. J. Ind. Ecol. 2012, 17, 53–64. [Google Scholar] [CrossRef]
  22. Accardo, A.; Dotelli, G.; Miretti, F.; Spessa, E. End-of-Life Impact on the Cradle-to-Grave LCA of Light-Duty Commercial Vehicles in Europe. Appl. Sci. 2023, 13, 1494. [Google Scholar] [CrossRef]
  23. Yang, X. Research on Evaluation of New Energy Vehicles Based on Life Cycle and Efficiency Assessments. In Proceedings of the 2022 International Conference on Computation, Big-Data and Engineering (ICCBE), Yunlin, Taiwan, 27–29 May 2022; pp. 264–266. [Google Scholar] [CrossRef]
  24. Xiong, S.; Ji, J.; Ma, X. Comparative Life Cycle Energy and GHG Emission Analysis for BEVs and PhEVs: A Case Study in China. Energies 2019, 12, 834. [Google Scholar] [CrossRef]
  25. Wang, R.; Song, Y.; Xu, H.; Li, Y.; Liu, J. Life Cycle Assessment of Energy Consumption and CO2 Emission from HEV, PHEV and BEV for China in the Past, Present and Future. Energies 2022, 15, 6853. [Google Scholar] [CrossRef]
  26. Wu, Q.; Sun, S. Energy and Environmental Impact of the Promotion of Battery Electric Vehicles in the Context of Banning Gasoline Vehicle Sales. Energies 2022, 15, 8388. [Google Scholar] [CrossRef]
  27. Oliveri, L.M.; D’Urso, D.; Trapani, N.; Chiacchio, F. Electrifying Green Logistics: A Comparative Life Cycle Assessment of Electric and Internal Combustion Engine Vehicles. Energies 2023, 16, 7688. [Google Scholar] [CrossRef]
  28. Pipitone, E.; Caltabellotta, S.; Occhipinti, L. A Life Cycle Environmental Impact Comparison between Traditional, Hybrid, and Electric Vehicles in the European Context. Sustainability 2021, 13, 10992. [Google Scholar] [CrossRef]
  29. Wang, N.; Tang, G. A Review on Environmental Efficiency Evaluation of New Energy Vehicles Using Life Cycle Analysis. Sustainability 2022, 14, 3371. [Google Scholar] [CrossRef]
  30. Yang, Y.; Lan, L.; Hao, Z.; Zhao, J.; Luo, G.; Fu, P.; Chen, Y. Life Cycle Prediction Assessment of Battery Electrical Vehicles with Special Focus on Different Lithium-Ion Power Batteries in China. Energies 2022, 15, 5321. [Google Scholar] [CrossRef]
  31. Almeida, A.; Sousa, N.; Coutinho-Rodrigues, J. Quest for Sustainability: Life-Cycle Emissions Assessment of Electric Vehicles Considering Newer Li-Ion Batteries. Sustainability 2019, 11, 2366. [Google Scholar] [CrossRef]
  32. Zhang, H.; Xue, B.; Li, S.; Yu, Y.; Li, X.; Chang, Z.; Wu, H.; Hu, Y.; Huang, K.; Liu, L.; et al. Life cycle environmental impact assessment for battery-powered electric vehicles at the global and regional levels. Sci. Rep. 2023, 13, 7952. [Google Scholar] [CrossRef]
  33. Raugei, M.; Kamran, M.; Hutchinson, A. Environmental implications of the ongoing electrification of the UK light duty vehicle fleet. Resources 2021, 174, 105818. [Google Scholar] [CrossRef]
  34. Sosnina, E.N.; Masleeva, O.V.; Kryukov, E.V. Comparative environmental assessment of unconventional power installations. Therm. Eng. 2015, 62, 539–546. [Google Scholar] [CrossRef]
  35. Sosnina, E.; Masleeva, O.; Kryukov, E.; Erdili, N. Methodology of the Renewable Energy Sources Life Cycle Environmental Assessment. In Proceedings of the 2021 IEEE PES Innovative Smart Grid Technologies Europe (ISGT Europe), Espoo, Finland, 18–21 October 2021; pp. 1–5. [Google Scholar] [CrossRef]
Figure 1. EV life cycle diagram.
Energies 17 02747 g001
Figure 2. ICEV life cycle diagram.
Energies 17 02747 g002
Figure 3. Single steel production process within a production system.
Energies 17 02747 g003
Figure 4. LCA calculation procedure.
Energies 17 02747 g004
Figure 5. Total mass of waste products.
Energies 17 02747 g005
Figure 6. Waste products total conditional mass.
Energies 17 02747 g006
Figure 7. Total water consumption, wastewater discharge, and harmful substances in the water.
Energies 17 02747 g007
Figure 8. Total reported emissions of harmful substances.
Energies 17 02747 g008
Figure 9. Greenhouse gas emissions.
Energies 17 02747 g009
Figure 10. Total electric energy consumption.
Energies 17 02747 g010
Table 1. Single processes form.
Flow NameResource NameMeasurement Units
Material input flowsRaw materialt
Water consumptionm3
Energy input flowsElectric energy consumptionkW∙h
Output material flowProductst
Waste productst
Wastewaterm3
Table 2. Environmental data collection form for ferrous metallurgy.
PollutionMeasurement Units
Emissions into the atmosphereGases—carbon monoxide, nitrogen oxides, sulfur dioxide, hydrogen sulfide
Dust—oxides of iron, silicon, manganese, magnesium, aluminum, calcium
kg/t
Greenhouse gasesCarbon dioxidekg/t
Discharges into the waterSuspended solids, chlorides, sulfates, nitrites, ammonium, calciummg/L
Soil pollution
(waste products composition)
Silicon dioxide, aluminum oxides, iron, calcium, magnesium, manganese, sulfides, sulfateskg/t
Table 3. Specific indicators of material and energy flows and environmental impact in steel production.
IndicatorMiningMetallurgyMechanical EngineeringDisposal
Values of specific indicators of waste products formation and coefficient K K
Waste products’ specific indicators, t/t0.50.7580.290.25
Waste products’ danger degree indicator, K1116.81116.8
Water consumption, wastewater discharge, and harmful substances in water
Specific consumption of fresh water from the source m3/t2.82334314.1
Wastewater-specific discharge, m3/t0.174135.5
Harmful substances’ reduced specific mass, g/t69.0220,0002606.07167.2
Relative aggressiveness indicator
Reduced specific emissions, kg/t3.9211844
CO2 emissions
Specific emissions, t CO2/t1.060.08
Specific norms of elec energy consumption in industry
Specific electric energy consumption, kW∙h/t68547300219
Table 4. Technical characteristics of vehicles.
ICEVEV
Tank volume, l: 52Traction battery capacity, kW∙h: 53
Engine type: gasolineTraction battery type: Li-NMC
Engine volume, cm3: 1997Engine type: synchronous motor with permanent magnets
Power, h.p./kW/at rpm: 143/105/5200Power, h.p./kW: 150/110
Torque moment/at rpm.: 190/4400Torque moment, newton-meters 210
Maximum speed, km/h: 190Maximum speed, km/h: 145
Overspeed to 100 km/h, s: 10.7Overspeed to 100 km/h, s: 9.5
ICEVEV
Transmission torque moment, Nm: up to 250Gear ratio in the gearbox: 10
Ecological class: IV
Fuel consumption, l/100 km
(city/combined/track): 9.9/6.5/7.7
Table 5. The mass of the EV’s and ICEV’s main components.
Weight of Components and Materials, kg
ICEVEV
Internal combustion engineElectric motor
Aluminum: 100Steel: 108
Cast iron: 13Copper: 27
Steel: 7Aluminum: 15
Engine cooling systemTransmissions, reduction gear, drive shafts
Aluminum: 5Aluminum: 10
Rubber hoses: 2Steel: 20
Starter, ignition systemConverter
Steel: 3Copper: 0.6
Copper: 2Aluminum: 8.4
Exhaust system
Steel: 20
Traction battery
Aluminum: 43
Copper: 130
Plastic: 10
Lithium: 8
Nickel: 35
Manganese: 20
Cobalt: 14
Gas tank
Plastic: 5
Transmission, connecting shaft, gearbox
Aluminum: 10
Steel: 20
Total mass: 1290Total mass: 1577
Table 6. The mass of materials and waste products of EV and ICEV life cycle stages.
EV
SteelCopperAluminumNickelManganese
MiningInput58169022409.77040.7107.6
Waste products29063492216.96477.449.1
Output290552192.8563.358.5
MetallurgyInput290552192.8563.358.5
Waste products12544272.3512.129.3
Output165.1110120.551.229.3
Mechanical engineeringInput165.1110120.551.229.3
Waste products37.122527.116.29.3
Output12885.693.43520
DisposalInput12885.693.4
Waste products32.514.315.6
Output95.571.377.8
CobaltPlasticCopper foilAluminum foilGraphite
MiningInput1280.115.31828.75292.634.3
Waste products1177.70.151682.45269.23.1
Output102.415.1146.323.431.2
MetallurgyInput102.415.1146.323.431.2
Waste products81.90.11117.048.85.2
Output20.51529.2614.626
Mechanical engineeringInput20.529.2614.626
Waste products6.509.264.66
Output1415201020
DisposalInput15
Waste products1.4
Output13.6
ICEV
SteelCast ironCopperAluminumPlastic
MiningInput2275216129675.09
Waste products1132614827300.05
Output11326132375.035
MetallurgyInput11326132375.035
Waste products49910890.035
Output651731485
Mechanical engineeringInput65173148
Waste products154133
Output501321155
DisposalInput501321155
Waste products130.500.33319.170.5
Output3712.51.66795.84.5
Table 7. Natural resources consumption.
Natural ResourcesNatural Resources Mass, kg
EVICEV
Iron ore (steel, cast iron)581279
Copper ore6902161
Aluminum2409.72967
Nickel ore7040.7
Manganese ore107.6
Cobalt ore1280.1
Natural gas (plastic)15.35
Coal (graphite)34.3
Total20,4913412
Table 8. The conditional mass of waste products at all EV life cycle stages.
MaterialStageWaste Products Mass, kgWaste Products Danger Degree IndicatorWaste Products Conditional Mass, kg
SteelMining2901290
Metallurgy125116.814,625
Mechanical engineering37137
Disposal32116.83795
CopperMining634916349
Metallurgy44256.524,956
Mechanical engineering25888.922,066
Disposal1456.5806
Table 9. Water consumption at all EV life cycle stages.
MaterialStageOutput Mass, tSpecific Consumption of Fresh Water from the Source, m3/tFresh Water, m3
SteelMining0.5812.8202
Metallurgy0.165335
Mechanical engineering0.128436
Disposal0.09614.11
CopperMining6.9023.2322.3
Metallurgy0.11012.11.3
Mechanical engineering0.086433.7
Disposal0.0710.9500.1
Table 10. Wastewater discharge and the reduced mass of harmful substances in the water at all EV life cycle stages.
MaterialStageOutput Mass, tWastewater-Specific Discharge, m3/tHarmful Substances Reduced Specific Mass, g/tWastewater Consumption, m3The Harmful Substances Reduced Mass, g
SteelMining0.5810.1769.020.140
Metallurgy0.165420,00013302
Mechanical engineering0.128132606.072334
Disposal0.0965.5167.2116
CopperMining6.9020.155359.641.036,990
Metallurgy0.1101.45364.200.1559,234
Mechanical engineering0.086132606.071223
Disposal0.0710.512.50.040.9
Table 11. Harmful substance emissions at all EV life cycle stages.
MaterialStageOutput Mass, tReduced Specific Emissions, kg/tPollution Emissions Reduced Mass, kg
SteelMining5813.922.3
Production12811815.1
Recycling95.5444.2
CopperMining69023.9227.1
Production85.62717232.6
Recycling71122287.2
Table 12. CO2 emissions at all EV life cycle stages.
MaterialStageOutput Mass, kgSpecific Emissions, t CO2/tReduced Emissions, kg CO2
SteelProduction1651.06175
Disposal1280.0810
CopperProduction1101110
Table 13. Electric energy consumption at all EV life cycle stages.
MaterialStageOutput Mass, kgSpecific Electric
Energy Consumption, kW∙h/t
Electric Energy Consumption, kW∙h
SteelMining5816839.5
Metallurgy165.1254790.3
Mechanical engineering12830038.4
Disposal12821928.0
CopperMining690215103.5
Metallurgy11040044.2
Mechanical engineering85.630025.7
Disposal85.640034.2
Table 14. Energy consumption by vehicles during operation.
EVICEV
Electric energy consumption/fuel4676 kW∙h1260 kg
Energy consumption, GJ73.655.4
Table 15. Harmful substance emissions by vehicles during operation.
Harmful Substances Specific Reduced EmissionsAnnual Electric Energy Consumption/MileageReduced Emissions, kg
EV96.28 g/kW·h7160 kW·h689
ICEV14.38 g/km16,700 km240
Table 16. Greenhouse gas emissions during operation.
Specific Greenhouse Gas EmissionsAnnual Electric Energy Consumption/MileageGreenhouse Gas Emission, t CO2
EV0.449 kg CO2/kW·h7160 kW·h3.21
ICEV0.228 kg/km16,700 km3.75
Table 17. EV and ICEV total environmental assessment.
ParameterEVICEV
Natural resources mass, t20.53.4
Waste products mass, t203.3
Reduced waste mass, t18830.5
Water consumption, m311225
Wastewater volume, m3125.6
Conditional mass of harmful substances in wastewater, kg13255
Reduced mass of harmful substances released into the atmospheric air, kg1526957
Greenhouse gas emissions, t CO21.40.8
Electric energy consumption, MW∙h4.23.1
Table 18. Vehicles’ total environmental impact during operation.
Environmental FactorEVICEV
Reduced mass of harmful substances released into the atmospheric air, kg689240
Greenhouse gas emissions, t CO23.213.75
Energy, GJ73.655.4
Disclaimer/Publisher’s Note: The statements, opinions and data contained in all publications are solely those of the individual author(s) and contributor(s) and not of MDPI and/or the editor(s). MDPI and/or the editor(s) disclaim responsibility for any injury to people or property resulting from any ideas, methods, instructions or products referred to in the content.

