Article

A Novel Method to Calculate Water Influx Parameters and Geologic Reserves for Fractured-Vuggy Reservoirs with Bottom/Edge Water

1
Tarim Oilfield Company, PetroChina, Korla 841000, China
2
State Key Laboratory of Oil and Gas Resources and Engineering, China University of Petroleum (Beijing), Beijing 102249, China
3
Research Institute of Petroleum Exploration and Development, Beijing 100083, China
*
Author to whom correspondence should be addressed.
Energies 2024, 17(12), 2822; https://doi.org/10.3390/en17122822
Submission received: 24 March 2024 / Revised: 31 May 2024 / Accepted: 5 June 2024 / Published: 8 June 2024
(This article belongs to the Section H: Geo-Energy)

Abstract

:
In practical oilfield production, the phenomenon of water influx typically shortens the water-free recovery period of wells, leading to water flooding and causing a sharp decline in the production well yields, bringing great harm to production. Water invasion usually occurs as a result of the elastic expansion of the water as well as the compaction of the aquifer pore space. However, it can be due to the special characteristics of fractured-vuggy reservoirs such as non-homogeneity and the discrete distribution of the pore spaces. It is challenging to use traditional seepage flow theories to analyze the characteristics of water influx. Also, reservoir numerical simulation methods require numerous parameters which are difficult to obtain, which significantly reduces the accuracy of the results. In this study, considering the driving energy for water influx, a water influx characteristic model was obtained by fitting a graph plate. Subsequently, an iterative calculation method was used to simultaneously obtain water influx volume and OOIP. The aquifer to hydrocarbon ratio was determined by fitting the water influx curve with the graphic plate. Results show that the calculation method is sensitive to the values of reservoir pressure and the crude oil formation volume factor. After applying the method to one field case, it was discovered that water influx performance can be characterized into two types, i.e., linear water influx and logarithmic water influx. In the early stages, the water influx rate of logarithmic water influx is greater compared to linear water influx. However, the volume and energy of waterbody are limited, and the water invasion phenomenon occurs almost exclusively within a short period after the invasion. On the other hand, the volume of waterbody invaded by linear water influx is larger, and it can maintain a stable rate of water influx. The results of the study can provide theoretical support for the waterbody energy evaluation and dynamic analysis of water influx, as well as the control and management of water in these types of reservoirs.

1. Introduction

More than half of the global oil and gas resources are stored in carbonate reservoirs, which, therefore, has become one of the most important research targets in the oil and gas industry [1,2,3,4]. Among these carbonate reservoirs, fractured-vuggy carbonates are one of the most significant types, and they are widely distributed worldwide [5,6,7]. For example, fractured-vuggy carbonate reservoirs with large reserves have been discovered in China’s Tarim Basin, such as the Harahatang area, Fumang oil field, and Shunbei oil field [8,9,10,11].
However, the production of fractured-vuggy carbonate reservoirs is quite different from the conventional sandstone reservoirs. Moreover, two fractured-vuggy carbonate reservoirs in the same block can behave differently [12,13]. For some fractured-vuggy carbonate reservoirs, they are connected to a waterbody. During the production process, water invasion readily occurs, which obviously will influence the production [14,15]. Therefore, it is of significance to master the dynamics of water influx.
To date, studies on water invasion have focused on homogeneous reservoirs [16,17,18,19]. However, due to the random distribution of the pore space, fractured-vuggy carbonate reservoirs are quite different from homogeneous reservoirs [20]. This renders some conventional methods inapplicable.
In the past, the calculation of water influx in oil and gas reservoirs often relied on analytical methods. Based on whether the water influx rate changes with time, the seepage characteristics and conditions of water invading the reservoir, and the different data required for calculation, methods for calculating water influx can be divided into steady-state models [21,22], unsteady-state models [23,24], and pseudo-steady-state models [25]. The abovementioned methods require static geological parameters of the reservoir and water to select appropriate models for calculation. However, these parameters are often difficult to obtain, leading to challenges in implementing the calculation methods mentioned above. Additionally, using analytical methods to calculate water influx also presents issues such as complex formulas, tedious processes, and large computational requirements.
Numerical simulation methods require obtaining a detailed geological model and introducing numerous difficult-to-determine parameters. Normal geological exploration methods are similarly difficult to apply [26,27]. This is particularly challenging for fractured-vuggy carbonate reservoirs with highly heterogeneous and spatially discrete distributions.
Therefore, employing material balance methods eliminates the need to consider the geometric shape of the reservoir and does not require the physical parameters of the reservoir rock. It relies solely on dynamic production data, measured static pressure data, and necessary fluid analysis information to estimate OOIP and predict water influx [28,29,30]. Some scholars have studied the phenomenon of water invasion in oil and gas reservoirs through material balance equations. Chen Jun et al. [31] use the difference between the P/Z of a water-driven gas reservoir and a closed gas reservoir to calculate water influx and OGIP. Yue Shijun et al. [32] combined the principles of material balance with fluid percolation theory to calculate the water influx and dynamic reserves of sandstone gas reservoirs. However, the strong heterogeneity and random spatial distribution of fissure-type reservoirs make traditional percolation theories difficult to apply. Tan Xiaohua et al. [33] established a material balance method, considering water influx phenomena and obtained characteristic diagrams for water-influenced gas reservoirs. Based on the existing research, Xiong Yu et al. [34] proposed a new material balance equation which is applicable to condensate gas reservoirs. They considered the differences of composition between produced and injected fluids and the effect of water influx. Additionally, Yong Li et al. [35] have conducted identification and prediction of water invasion phenomena in fractured-vuggy carbonate reservoir.
However, there is relatively limited application of the characteristics of fractured-vuggy carbonate reservoirs with bottom/edge water in material balance equations. Making the material balance method applicable to oil reservoirs, computing water influx characteristic parameters without percolation theory, and determining specific parameters such as water influx rate, OOIP, and aquifer to hydrocarbon ratio using only dynamic production data and readily available parameters remain challenging issues in current research.
This paper applies the equations of material balance based on the mechanism of water invasion due to pressure drop in the waterbody caused by pressure drop in the reservoir, compaction of the pore space, and elastic expansion of water in the waterbody. Unlike analytical methods that require many parameters that are difficult to obtain, involve cumbersome processes, and demand extensive calculations, the new calculation method that combines the theory of water invasion elasticity with the material balance equation is not only applicable to fractured-vuggy reservoirs but also requires only readily available production data. By using a simple iterative calculation method, one can accurately obtain key parameters such as water influx rate, OOIP, and aquifer to hydrocarbon ratio simultaneously. Through this method, we derive a graphical representation to illustrate how water influx volume varies with cumulative oil production across different aquifer to hydrocarbon ratios, grounded in the mechanisms of water influx and considering factors such as pore space reduction and water expansion in a waterbody. Afterwards, water influx characteristic models of the target reservoir were obtained. Subsequently, based the material balance equation, we established an iterative calculation method to calculate the water influx rate and OOIP, fitting the water influx curve with the graph plate to solve the aquifer to hydrocarbon ratio. Finally, a set of novel computational methods has been developed to simultaneously solve multiple water influx characteristic parameters. This efficient and straightforward calculation method offers feasible applications for actual oilfield operations. And our results provide theoretical support for the water influx dynamic analysis and waterbody energy evaluation, as well as water control and management of fractured-vuggy carbonate oil reservoirs with active bottom/edge water.

2. Establishment of Water Influx Characteristic Model

If there are bottom or edge waters connected to a fractured-vuggy carbonate reservoir, the water invasion could be caused by the reduction of pore space and the water expansion in the waterbody, when the fluid pressure declines as production proceeds (as shown in Figure 1). The combined effects of the contraction of rock pores and the elastic expansion of the water in the waterbody cause the occurrence of water invasion.
In this section, based on the fundamental principles of water invasion described above, the relationship between net water influx and the cumulative oil production under various aquifer water/hydrocarbon rations will be derived. In addition, by fitting the curves in a graph plate, the relationship between the water influx and the cumulative oil production is obtained. From this, the water influx characteristic model is also established.

2.1. Calculation of Pore Space Reduction Volume and Water Expansion Volume in Waterbody

The isothermal water compressibility coefficient is defined as relative volume change as response to pressure changes.
C w = 1 V w Δ V w Δ p ,
where Cw is isothermal compression factor of water, MPa−1; Vw is water volume in the waterbody, Δp is stratigraphic pressure change, MPa; and ΔVw is the volume change of water in the waterbody when the stratigraphic pressure changes by Δp.
The differential form of the above equation is
C w = d V w V w d p .
At the initial condition, the formation pressure p is represented by pi; water volume in the waterbody Vw is represented by Vwi. By integrating both sides of the equation, the following equation is obtained:
p p i C w d p = V w V w i 1 V w d V w .
The integral is obtained by taking the logarithm of both sides;
V w = V w i e C w ( p i p )
When pressure declines from initial pressure pi to p, the water volume changes in the waterbody due to expansion can be derived, as shown in the following equation:
Δ V w = V w V w i = V w i [ e C w ( p i p ) 1 ] .
Similarly, the rock pore compressibility coefficient is defined below.
C p = 1 V p Δ V p Δ p ,
where Cp is pore compression factor, MPa−1; Vp is pore volume in the waterbody, Δp is stratigraphic pressure change, MPa; and ΔVp is the volume change of the pore in the waterbody when the stratigraphic pressure changes by Δp.
The differential form of the above equation is
C p = 1 V p d V p d p .
Same as above, pi and Vpi used here indicate the formation pressure and waterbody pore volume at the initial condition. Integrating both sides of the above equation give rise to
p p i C p d p = V p V p i 1 V p d V p .
Taking the logarithm of the above equation, the waterbody pore volume at the current Vp is derived as
V p = V p i e C p ( p i p ) .
The reduced waterbody pore volume ΔVp can be calculated using the following equation:
Δ V p = V p V p i = V p i [ 1 e C p ( p i p ) ] .
As is well known, as production proceeds, the formation pressure declines from pi to p; subsequently, water in the waterbody invades into the reservoir. And the water influx comprises two components, i.e., the water volume caused by the waterbody volume expansion ΔVwe and the water volume caused by the waterbody pore volume reduction ΔVwe. Here, it is assumed that the waterbody pore space is fully saturated with water, and the volume is represented by Ve. Then, the following two equations are derived:
Δ V w e = V e [ e C w ( p i p ) 1 ]
Δ V p e = V e [ 1 e C p ( p i p ) ] .

2.2. Derivation of the Relationship between the Net Water Influx and Cumulative Oil Production

As stated previously, the total water influx We can be written as
W e = Δ V w e + Δ V p e = V e [ e C w ( p i p ) e C p ( p i p ) ] .
By combining the mechanism of water influx with elasticity theory, a relationship has been established between the water influx rate and the pressure drop in fractured-vuggy oil reservoirs. However, since waterbody pore space Ve is difficult to obtain, the concept of aquifer to hydrocarbon ratio has been introduced.
The aquifer–hydrocarbon ratio n is defined as the ratio of waterbody pore volume to hydrocarbon pore volume,
n = V e V a .
Substituting Equation (14) into Equation (13) gives rise to
W e = n V a [ e C w ( p i p ) e C p ( p i p ) ] .
Consequently, a relationship has been established between the water influx rate and the pressure drop in fractured-vuggy reservoirs under different aquifer to hydrocarbon ratios. Furthermore, initial pore volume Va can be calculated from the OOIP (original-oil-in-place) N as shown below:
V a = N B o i 1 S w i ,
where N is OOIP, m3; Boi is the crude oil volume factor at the initial state; and Swi is the initial water saturation.
Substituting Equation (16) into Equation (15) gives the following relationship:
W e = n N B o i 1 S w i [ e C w ( p i p ) e C p ( p i p ) ] .
Subtract the produced water volume from above, and then the net water influx is derived.
W e W p B w = n N B o i 1 S w i [ e C w ( p i p ) e C p ( p i p ) ] W p B w ,
where Wp is the produced volume at the surface condition, and Bw is the water formation volume factor.
Equation (18) can also be written as
W e W p B w N B o i = n 1 S w i [ e C w ( p i p ) e C p ( p i p ) ] W p B w N B o i .
Here, aquifer to hydrocarbon ratio n, initial water saturation Swi, OOIP N, and initial oil formation volume factor Boi are constants., Therefore, net water influx volume is a function of the well production. In this way, Equation (19) can be represented by the following equation:
W e W p B w = f ( N p ) ,
where Np is the cumulative oil production.
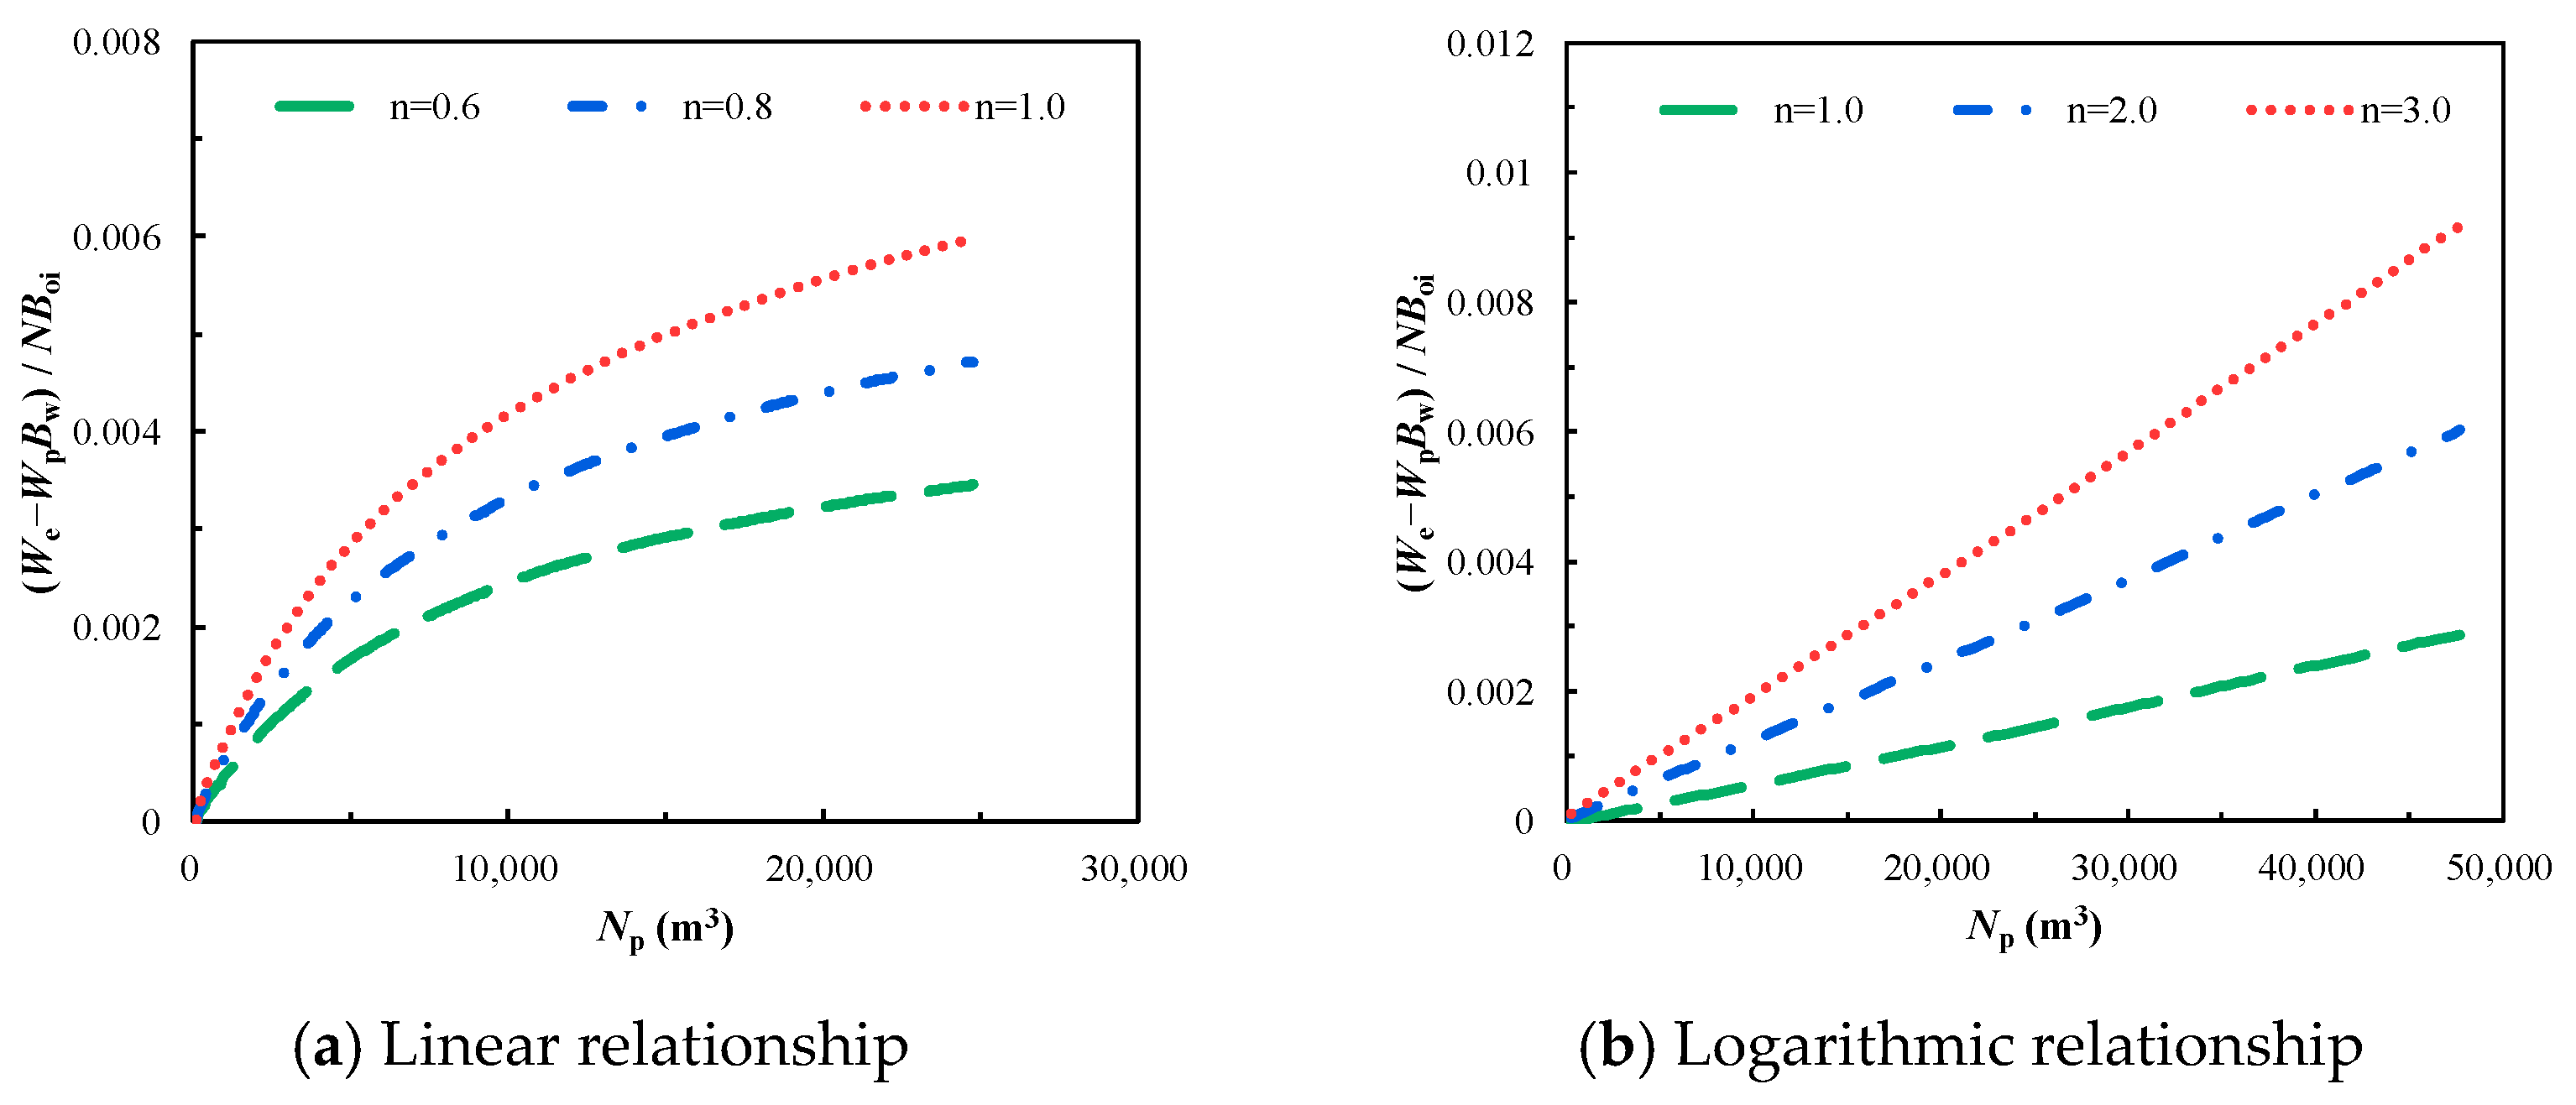
Thereby, curve fitting was performed between the net water influx and cumulative oil production data. It was found that the relationship falls into the following two categories (represented by Equations (21) and (22)):
We W p B w = f ( N p ) = a N p
We W p B w = f ( N p ) = a l n N p + b ,
where a and b are both constants.
In addition, the curve fitting results are shown in Figure 2, and the correlation coefficient R2 are above 0.9.

3. Calculation of Water Influx and OOIP

3.1. Establishment of Material Balance Equation

For fractured-vuggy carbonate reservoirs with an active waterbody, natural energies that drive oil production not only come from oil expansion and elastic drive of bottom/edge water but also from the expansion of the original water in the pore space and the energy released by the deformation of the reservoir rock. This is especially true for ultra-deep fractured-vuggy carbonate reservoirs with high reservoir pressure. Therefore, the material balance equation of fractured-vuggy carbonate with edge/bottom water is written as [30,36,37]
N p B o = N ( B o B o i ) + W e W p B w + N B o i C w S w i + C f 1 S w i ( p i p ) ,
where Np represents the cumulative oil production, m3; Bo represents oil formation volume factor, m3/m3; N represents original oil in place, m3; Boi represents initial oil formation volume factor, m3/m3; We represents cumulative water influx, m3; Wp represents cumulative water production, m3; Bw represents water formation volume factor, m3/m3; Cw represents isothermal compression factor of water, MPa−1; Swi represents irreducible water saturation, dimensionless; Cf represents formation rock compressibility, MPa−1; pi represents initial reservoir pressure, MPa; and p represents average reservoir pressure, MPa.
Dividing both sides of the equation by (N·Boi) gives the following equation:
1 C w S w i + C f 1 S w i ( p i p ) W e W p B w N B o i = B o B o i ( 1 N p N ) .
As per the definition of the oil formation volume factor, it refers to the ratio of the volume of crude oil at reservoir conditions to the volume of oil at standard conditions.
B o = V o V s ,
where Vo represents the volume of oil at reservoir conditions, and Vs represents the volume of oil at standard conditions.
Equation (25) can be rewritten as
V o V o i V o i V s = V o V d V d V o i B o i ,
where Voi represents the oil volume at the initial reservoir pressure, Vd represents the oil volume at the bubble point pressure, and Boi is the oil formation volume factor at initial conditions. And the following relationship is derived:
B o = V o V d V d V o i B o i .
By conducting laboratory PVT analysis, the initial oil formation volume factor Boi and the relationship between pressure and oil volume can be determined. Therefore, the oil formation volume factor can be expressed as a function of the reservoir pressure.
B o B o i = g ( p ) .
Substituting Equation (28) into Equation (24) yields
1 C w S w i + C f 1 S w i ( p i p ) W e W p B w N B o i = g ( p ) ( 1 N p N ) .
Dividing both sides of the equation by (pip) gives the following equation:
1 p i p N p N g ( p ) W e W p B w N B o i 1 p i p C w S w i + C f 1 S w i = 1 p i p g ( p ) 1 p i p
Combined with the relationship between net water influx and cumulative oil production obtained in the previous section, it can be derived that
1 p i p [ g ( p ) 1 ] = 1 N [ g ( p ) N p f ( N p ) B o i ] 1 p i p C w S w i + C f 1 S w i .
The above equation can be regarded as a linear equation in the form of
y = m X b ,
if assuming
Y = 1 p i p [ g ( p ) 1 ]
m = 1 N
X = [ g ( p ) N p f ( N p ) B o i ] 1 p i p .
Thereby, the OOIP N can be calculated from the slope m as shown in Equation (34).
Furthermore, by analyzing a large body of actual field data, researchers have found that there is a correlation between the sum of the effective compressibility and the net water influx and the cumulative oil production [37]. Here, we use λ to represent the correlation coefficient λ, and then it gives the following equation:
C w S w i + C f 1 S w i ( p i p ) + W e W p B w N B o i = λ N p .
Substituting Equation (36) into Equation (29) yields
1 λ N p = g ( p ) ( 1 N p N ) .
The above equation can also be written as
λ = 1 N p g ( p ) ( 1 N p 1 N ) .
Substituting actual pressure and production data into Equation (38) yields a series of λ. According to Lajda’s criterion, the outliers are eliminated. Then the mean and the standard deviation of λ are calculated as
σ = ( x i x ¯ ) 2 n .
To guarantee the accuracy of our calculation, the λ with the values outside the range of [λσ, λ + σ] are eliminated. The remaining λ are used to calculate the average λ*, and then Equation (36) becomes
C w S w i + C f 1 S w i ( p i p ) + W e W p B w N B o i = λ * N p .
Combining Equations (20) and (40) gives the following equation:
C w S w i + C f 1 S w i ( p i p ) + f ( N p ) N B o i = λ * N p .
Equation (41) can also be rewritten as
f ( N p ) = [ λ * N p C w S w i + C f 1 S w i ( p i p ) ] N B o i .

3.2. Equation Solving

As described in Section 2.2, the relationship between the net water influx and cumulative oil production falls into two categories, i.e., linear and logarithmic relationships. For these two types, the equation solving methods are similar. Here, we use a logarithmic type as an example.
Substituting Equation (22) into Equation (42) gives the following equation:
a l n N p + { b [ λ * N p C w S w i + C f 1 S w i ( p i p ) ] N B o i } = 0
Regression with the well production data is performed to obtain the coefficients a and b. Then the net water influx is calculated using Equation (22).
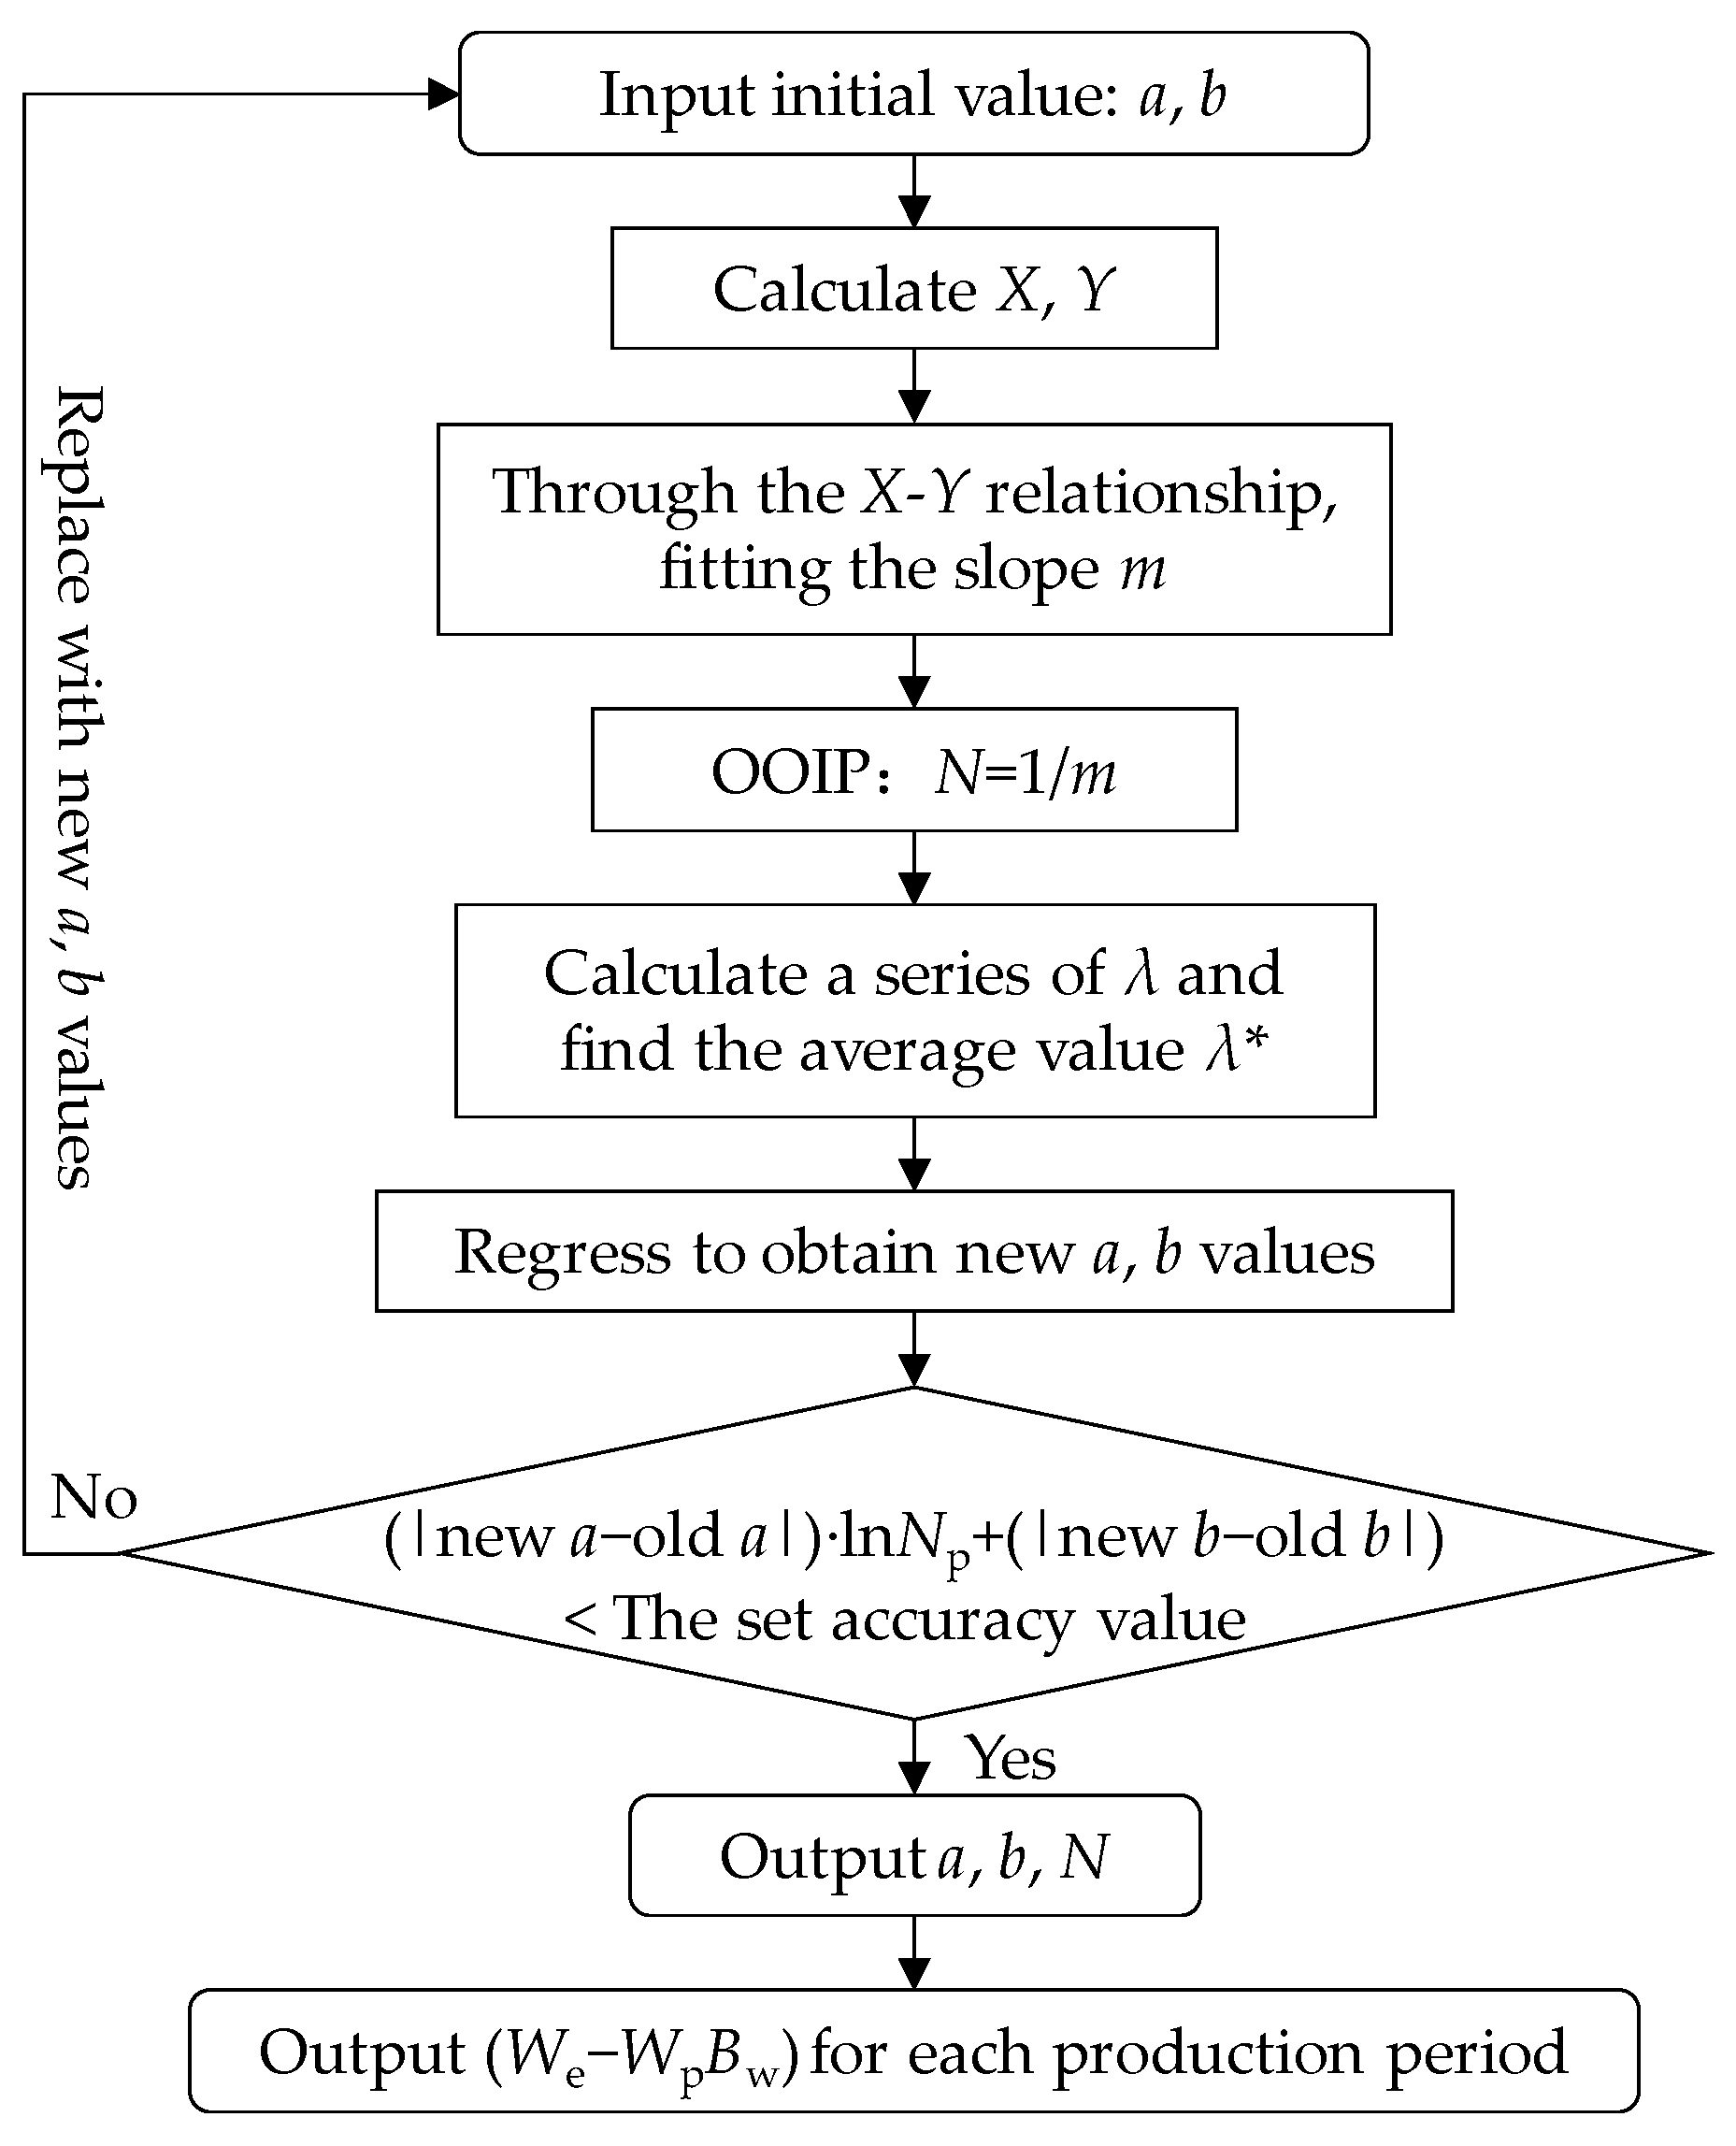
In summary, more detailed steps employed in this study to calculate the OOIP N and net water influx volume (WeWpBw) are described below (also illustrated in Figure 3):
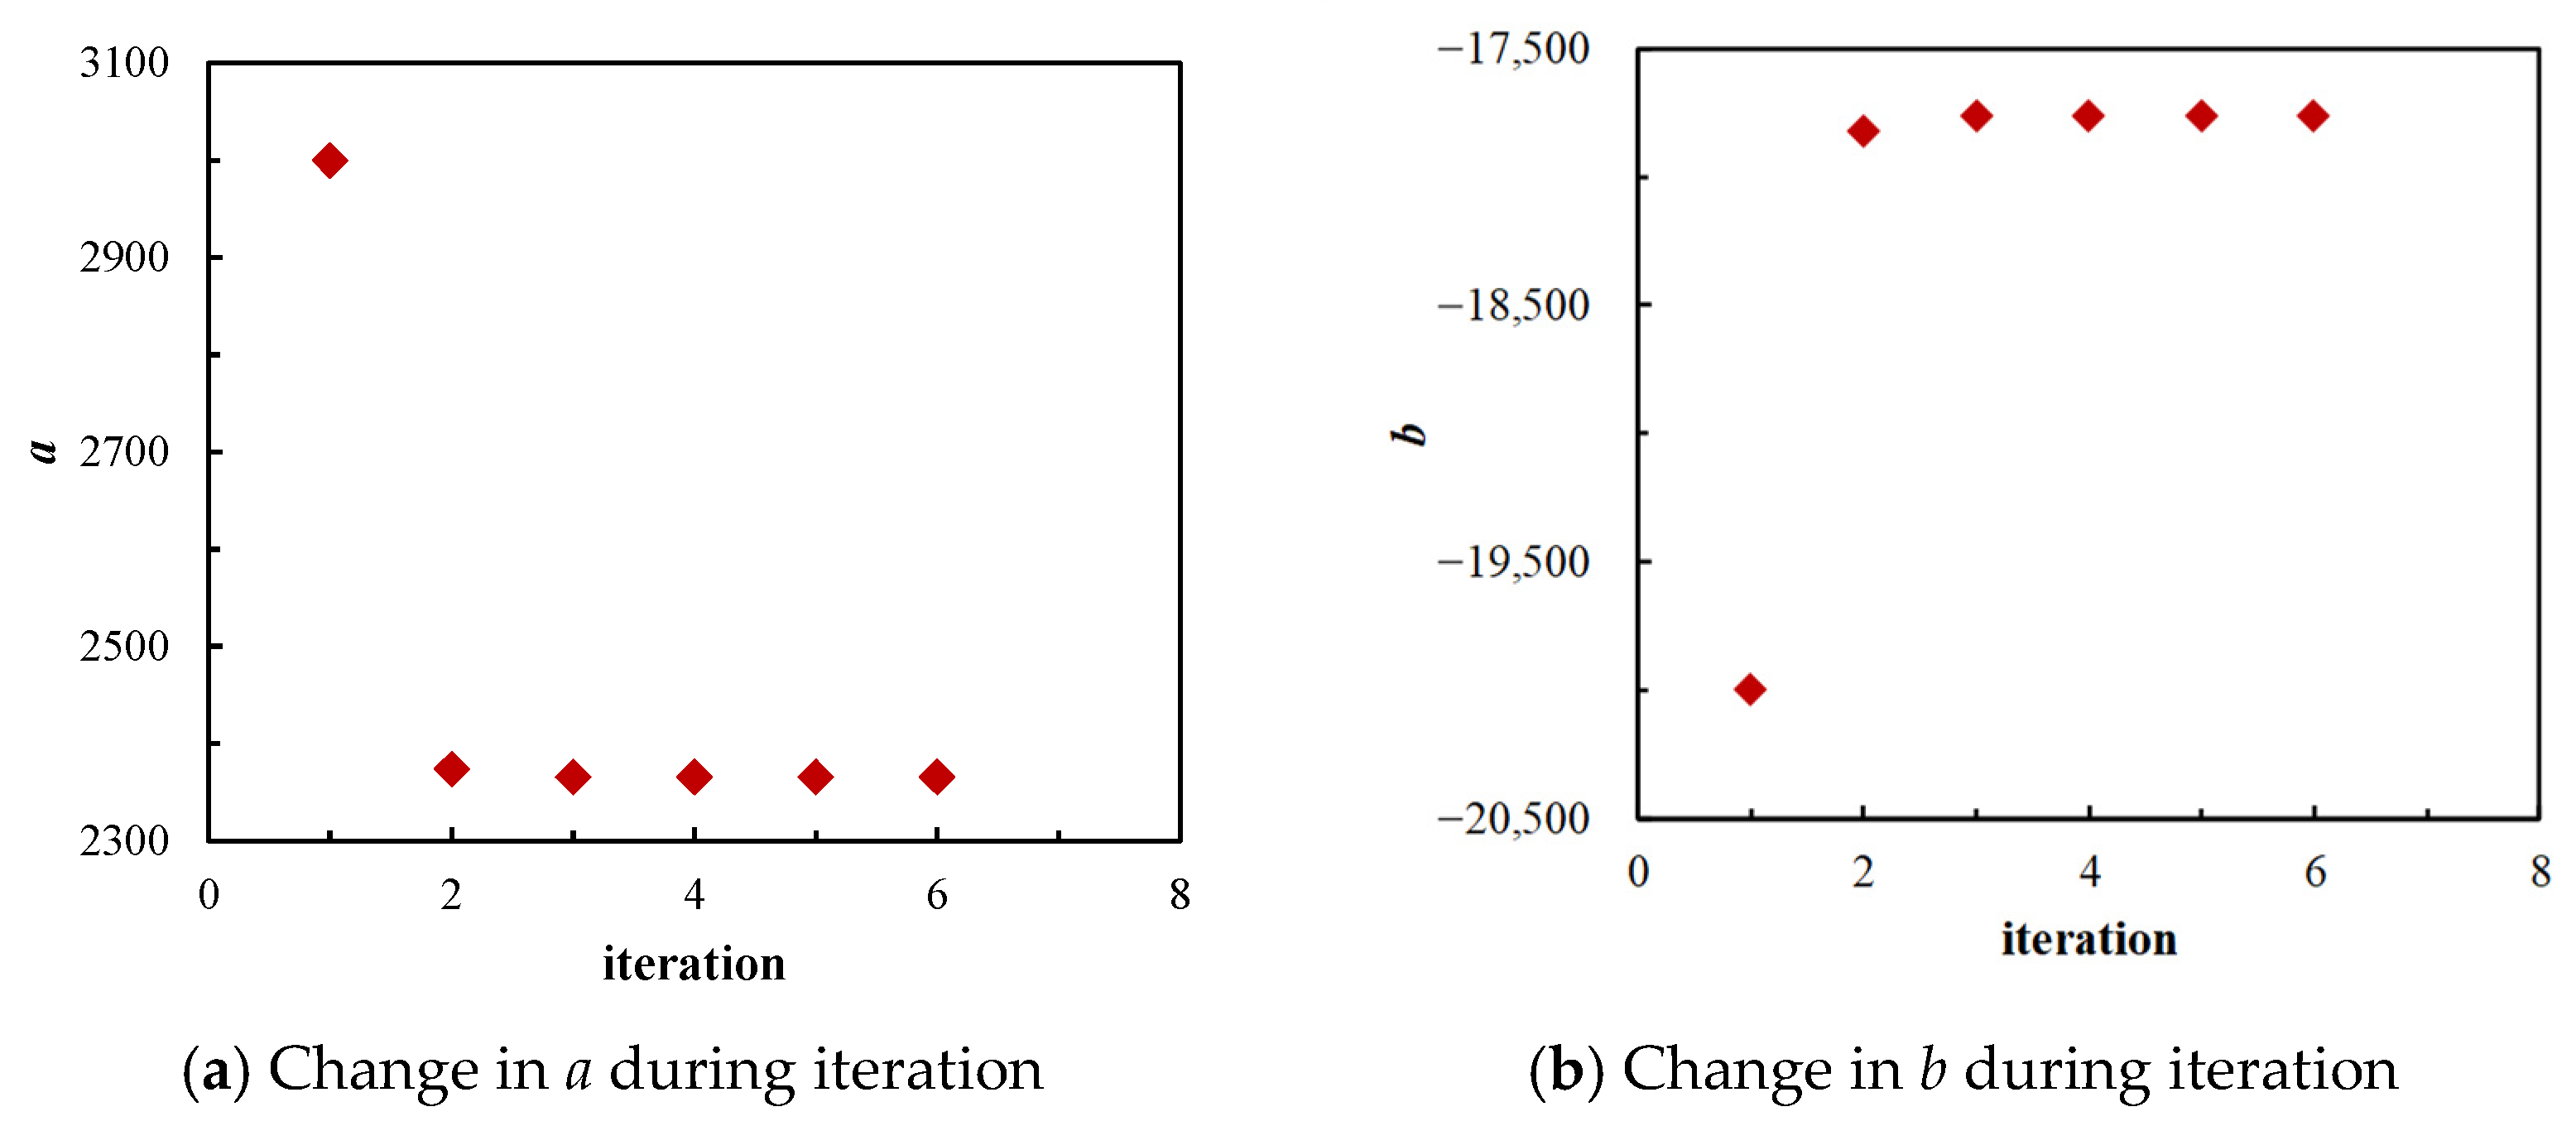
① Assign estimated values to coefficients a and b based on experience. Here a = 3000, b = −20,000 are used initially. Based on production data, Y and X are calculated using Equations (33) and (35);
② Regress X and Y with a linear relationship. Then the slope m is determined, and OOIP N is calculated using Equation (34);
③ Based on production data, a serial of λ is calculated using Equation (38). According to Lajda criterion, some abnormal values for λ are eliminated, and the average value of λ (denoted as λ*) is calculated;
④ Perform logarithmic regression according to Equation (43), and new values for coefficients a and b are obtained;
⑤ Return to step ① and replace a and b with new values obtained from step ④ Repeat steps ①–④ until the values for a and b converge;
⑥ Substituting the obtained a and b from step ⑤ and N into Equation (22) to calculate the net water influx.
This novel method is applicable under the following conditions: (1) When reservoirs, blocks, or individual production wells are under the same formation pressure system. (2) In addition to the initial reservoir pressure, at least two stratigraphic hydrostatic gradient test points are required. (3) The more stratigraphic hydrostatic gradient test points, the higher the accuracy of the test results, and the higher the degree of reserve recovery, the more reliable the results of this method are for the calculation of OOIP and the water influx rate. (4) The selected dynamic production data must be time-continuous. For production downtime resulting from well shutdowns, missing values must be processed, for example, by interpolation, completions, or deletion of missing points. (5) This novel method is sensitive to the value of initial reservoir pressure and the test result of oil formation volume factor, so the convergence of the iterative calculation is affected by the above sensitivity factors to a certain extent.

4. Method Validation

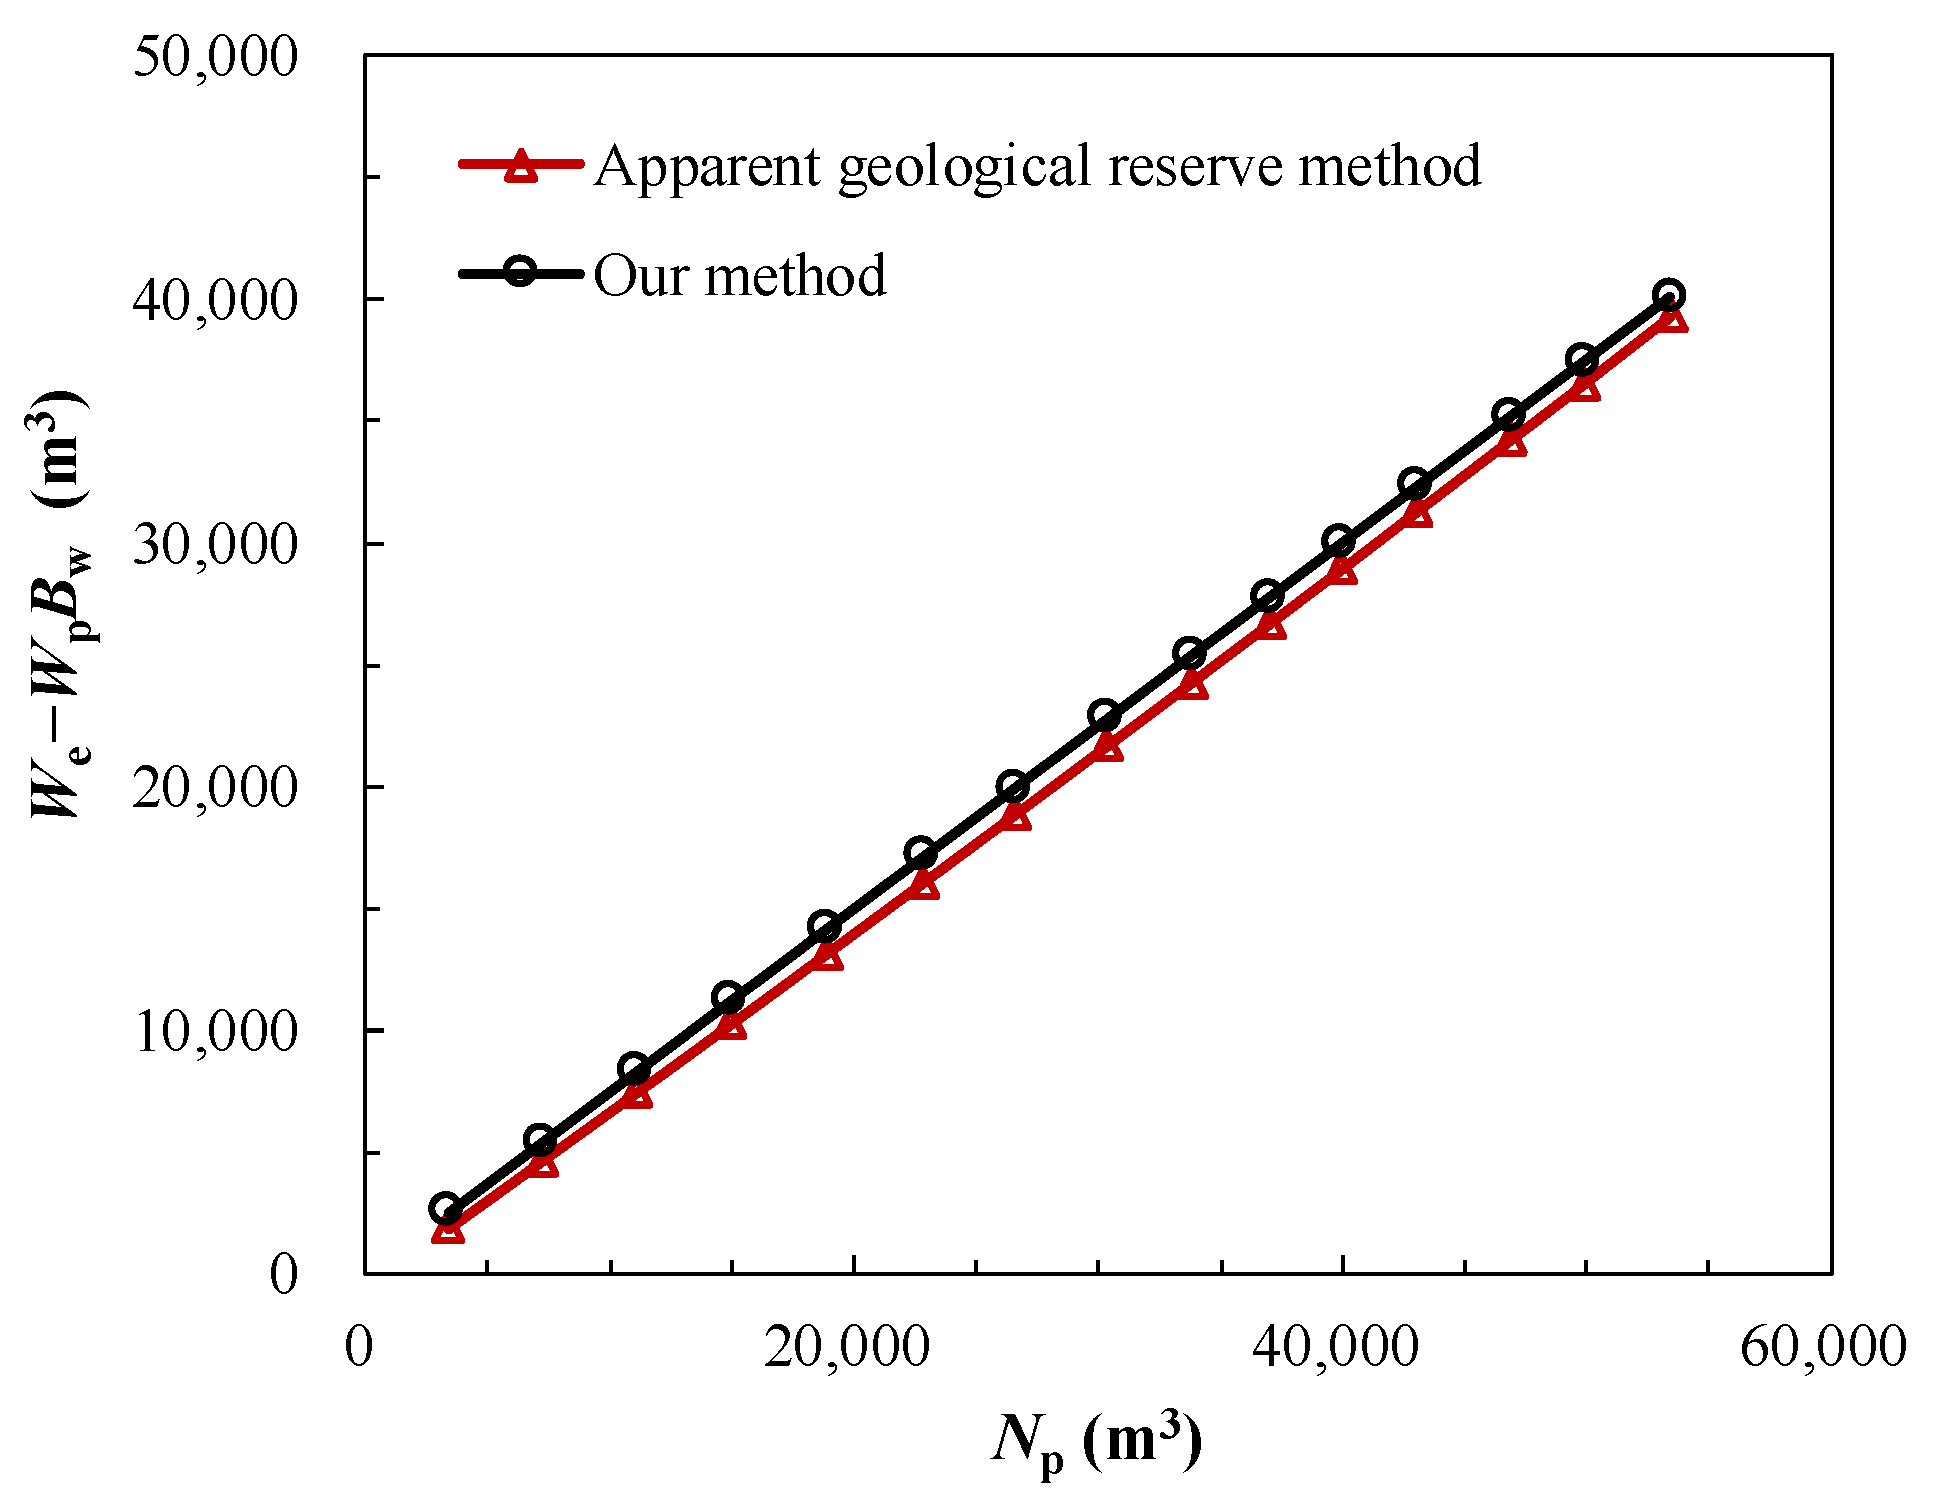
In this section, our developed method is validated by comparing with the already mature apparent geologic reserve method. The example used here is described in the below. At the initial condition, reservoir pressure pi = 71.15 MPa, oil formation volume Boi = 2.5658, oil density = 0.8 × 10³ kg/m3, formation water compressibility is 4.5 × 10⁻⁴ MPa−1, the rock compressibility is 1 × 10⁻⁴ MPa−1, and the initial water saturation Swi = 0. The dynamic data and the calculated water influx using both methods are shown in Table 1 below. Comparison of the calculated net water influx from the apparent geological reserve method and our method is shown in Figure 4.
From Table 1 and Figure 4, it can be seen that there is acceptable discrepancy between the apparent geological reserve method and our method. A more careful examination shows that, at the early stages of production, the discrepancy is relatively high, due to the relatively less water influx. However, as production proceeds, the discrepancy becomes negligible.
Furthermore, a plot with the apparent geological reserve Np on the Y-axis and cumulative oil production Np on the X-axis is shown in Figure 5. When the cumulative oil production Np = 0, OOIP is obtained, OOIPs calculated using apparent geological reserve and our method are 310.15 and 316.67 × 10⁶ m3, respectively. The difference is within 3%. Therefore, it concludes our developed method is reliable.

5. Application of the Developed Method to a Field Case

In this section, our developed method is applied to our target reservoir M. Table 2 summarizes some collected data for reservoir M. Table 3 lists the production data.
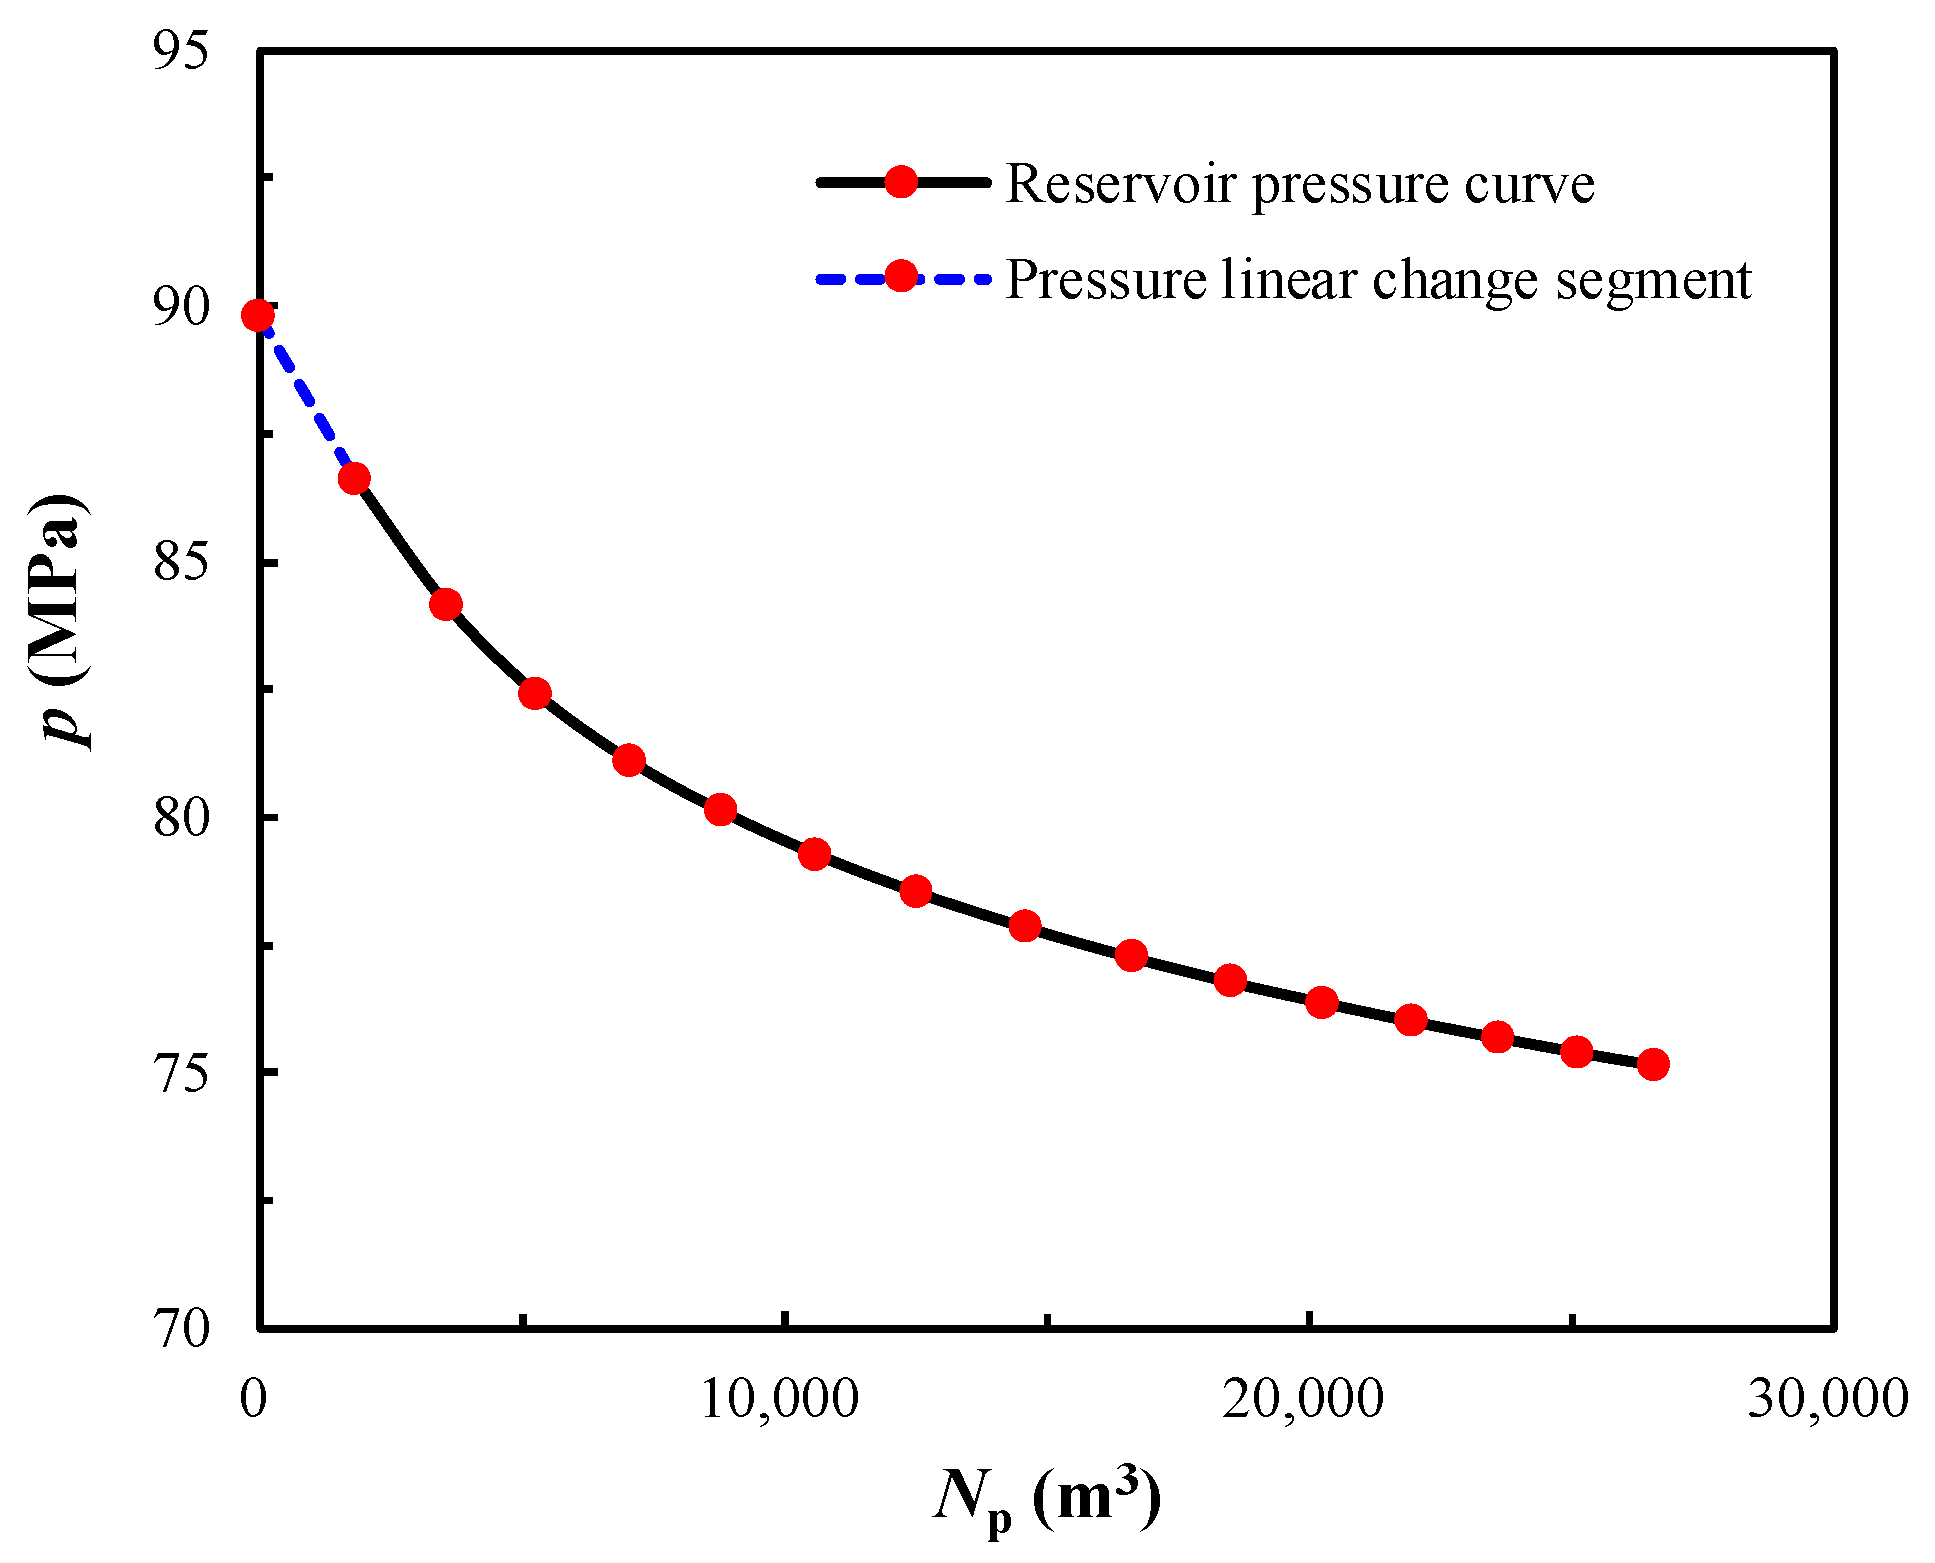
A plot of reservoir pressure versus cumulative oil production is shown in Figure 6. As can be seen, a sharp pressure drop occurs at the early stage. And in this stage, the reservoir behaves like a constant volume reservoir without water influx. As production proceeds, water from the waterbody starts to invade into the reservoir, which slows down the reservoir pressure decline.
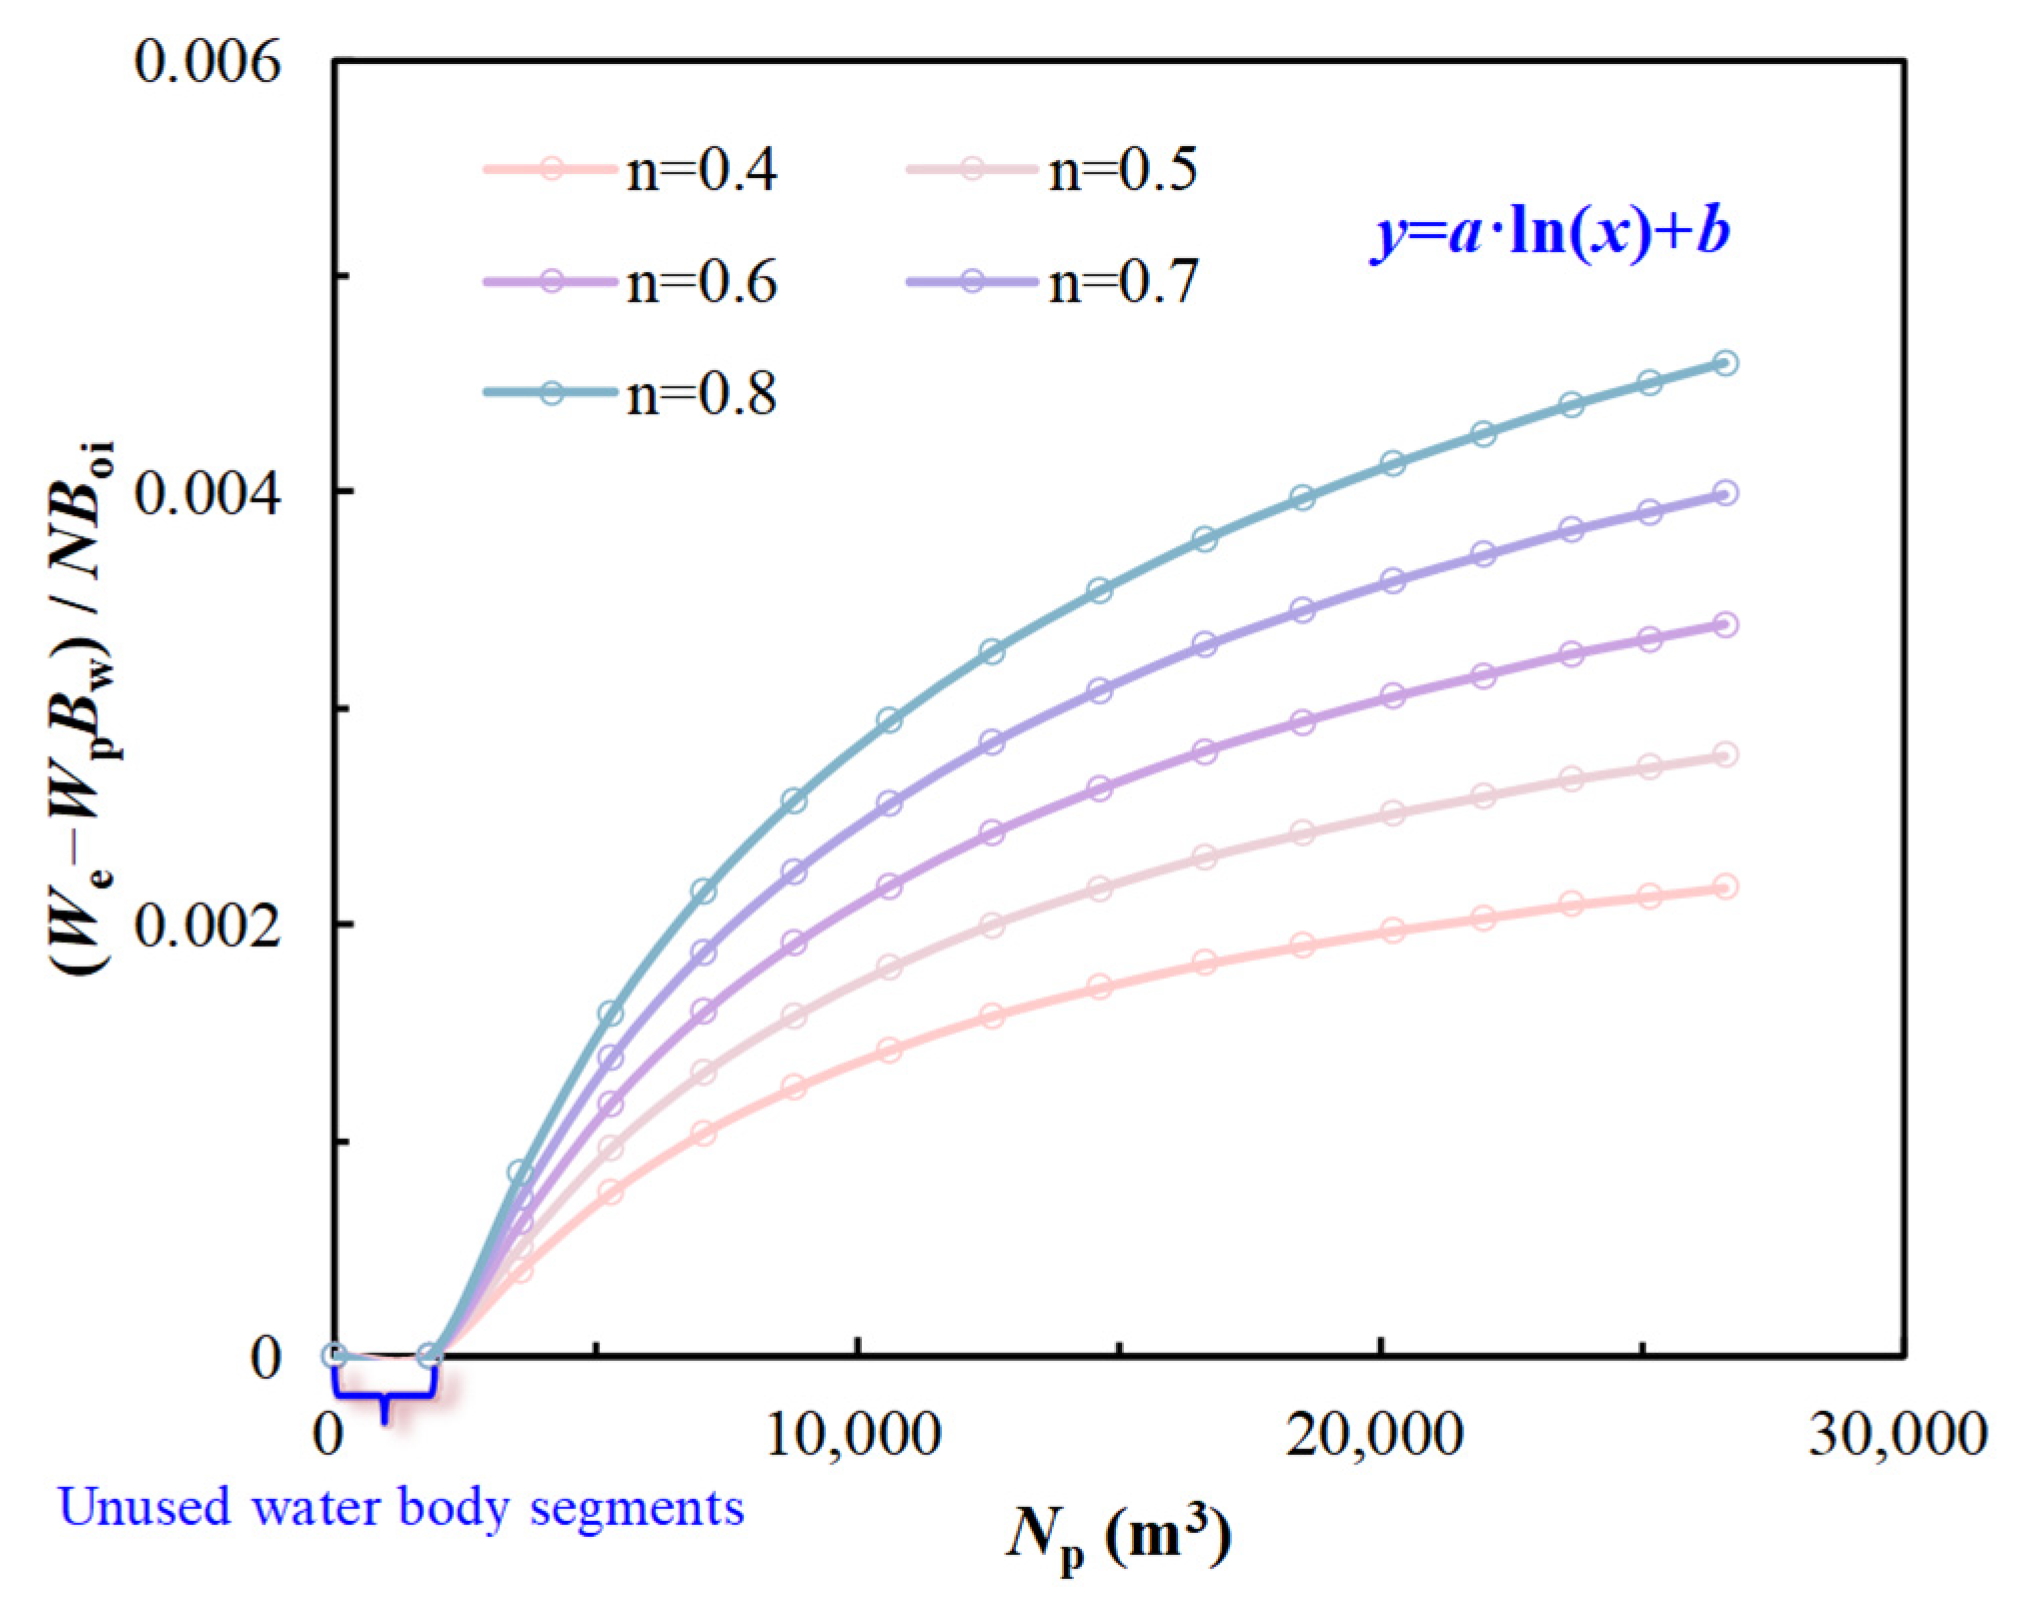
In addition, from Figure 6, the time when water starts to invade the reservoir is determined, i.e., the time when the decline curve deviates from the linear trend. Based on the water influx conditions of the production wells in the study area, appropriate and different aquifer to hydrocarbon ratios should be set using Equations (21) and (22). Through function fitting, it was found that the curve in Figure 7 exhibits a logarithmic curve similar to that described by Equation (22).
As shown in Figure 8, the coefficients a and b gradually converge to certain values as the number of iterations increases, using the iterative solution method described in Section 3. Once the required precision is achieved, the values are output, resulting in a = 2365.8 and b = −18,167.8.
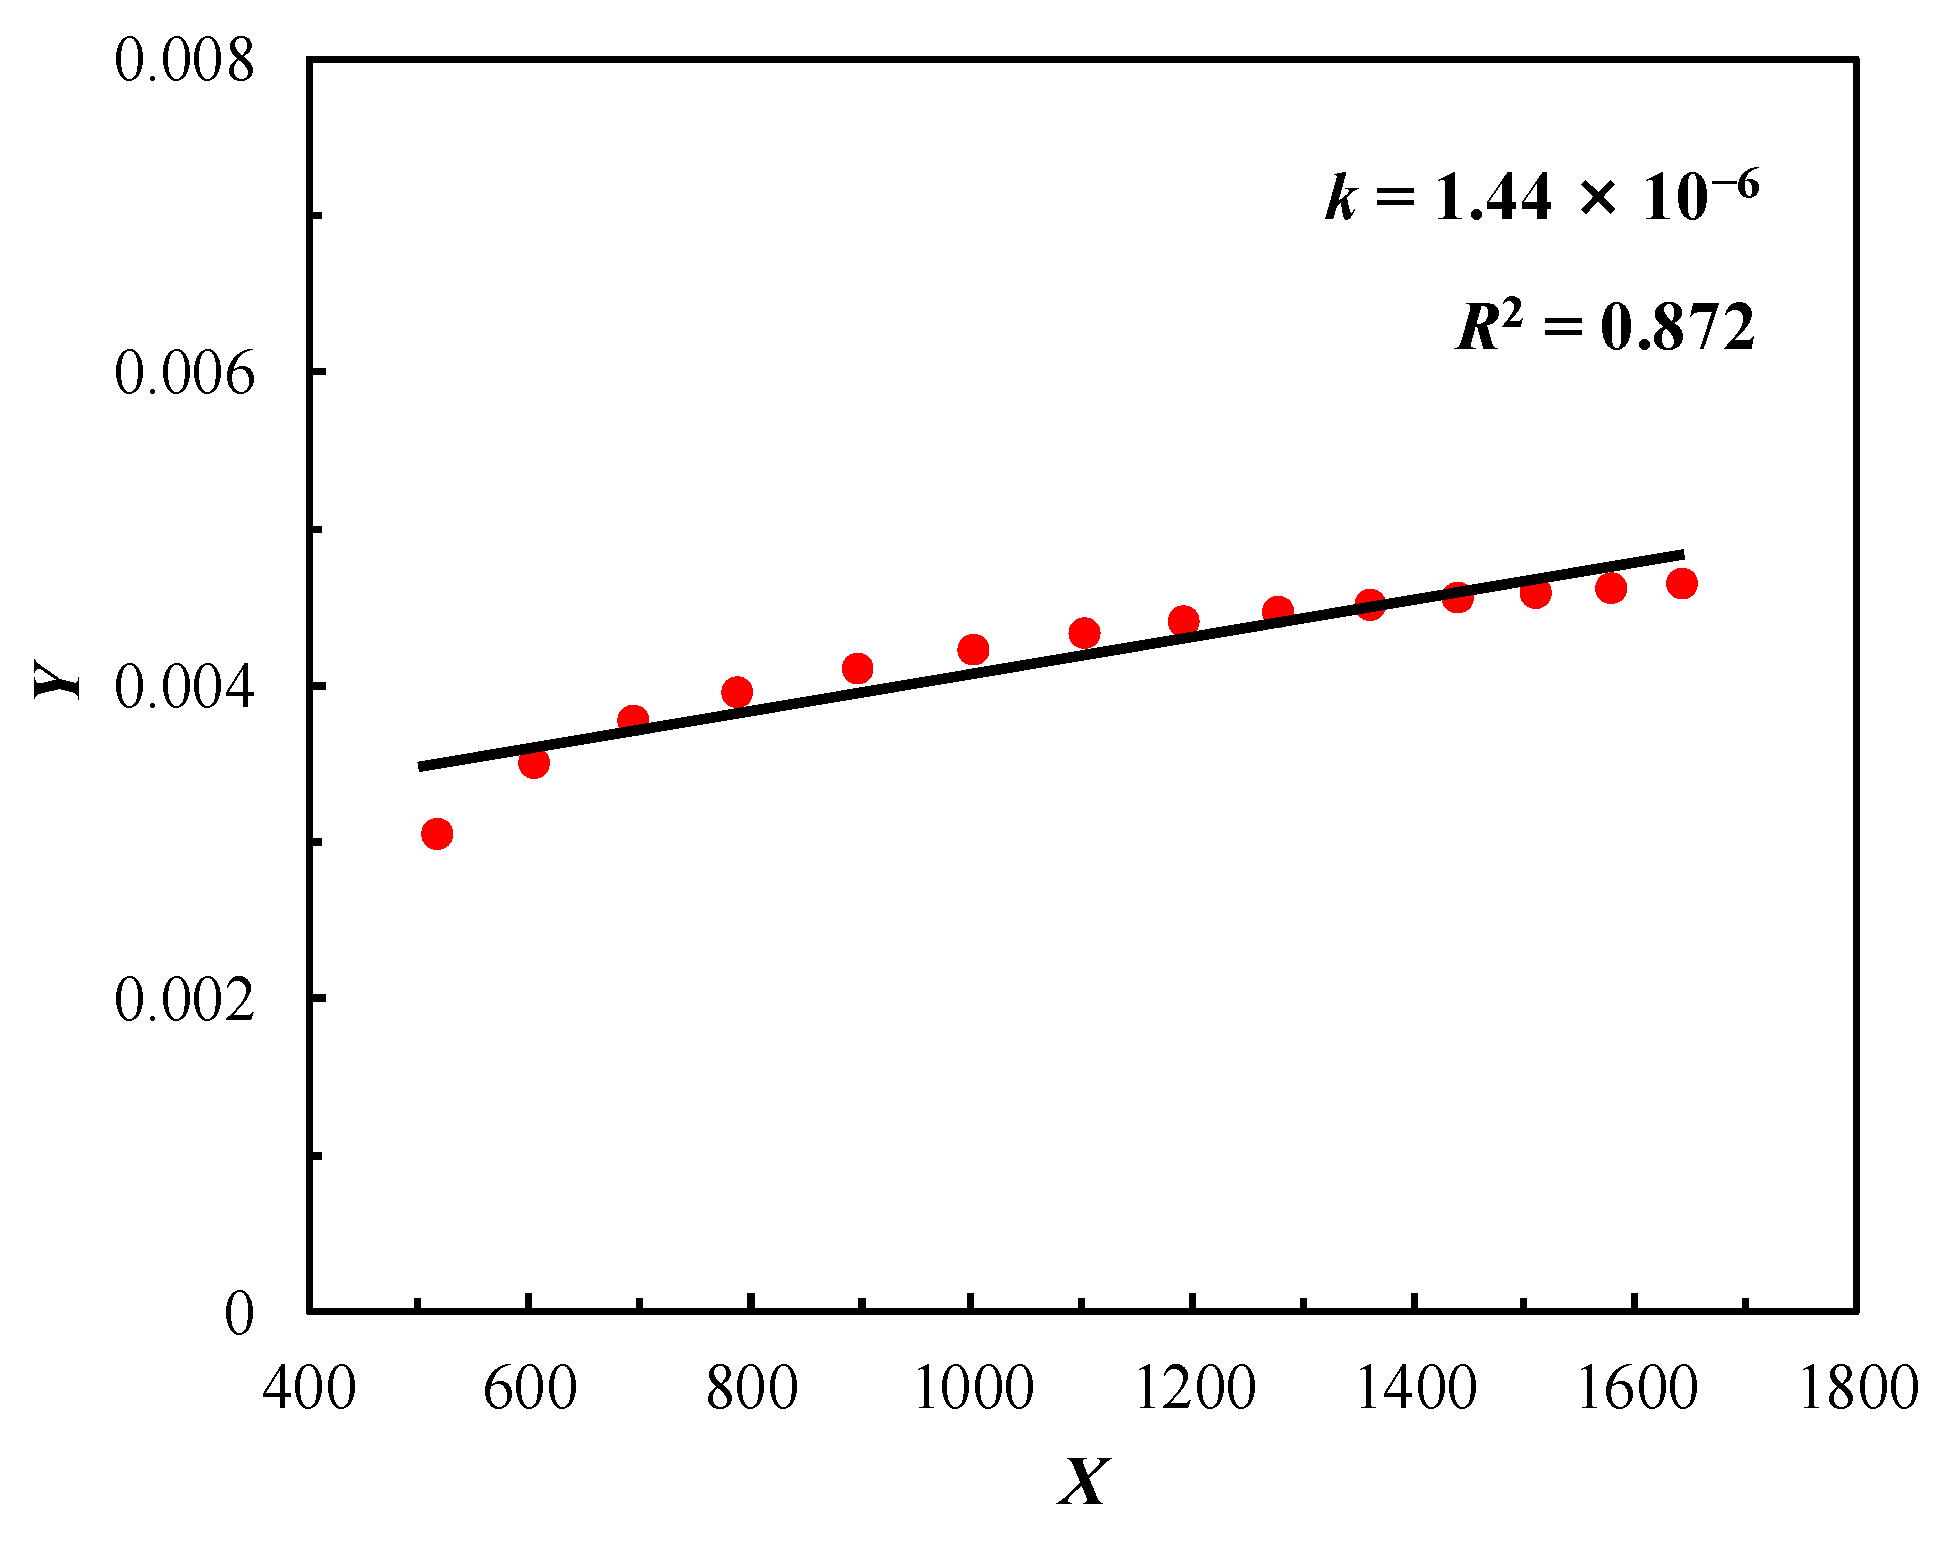
After determining the coefficients a and b and substituting them into Equations (33) and (35), the values for X and Y are obtained. As shown in Figure 9, X vs. Y falls into a good linear relationship. According to Equation (34), the OOIP is determined by the reciprocal of the slope of the XY curve. After fitting and calculating, the value of N is found to be 692,073 m3.
Through regression, net water influx versus cumulative oil production was fitted into the curve as shown in Figure 10 below.
Furthermore, to calculate the aquifer to hydrocarbon ratio, the net water influx (WeWpBw) is converted into the form of (WeWpBw)/NBoi. By fitting the actual production data into the chart, which describes the net water invasion term versus cumulative oil production under different aquifer to hydrocarbon ratios n, as shown in Figure 11 below, it yields n = 0.6.

6. Conclusions

In this paper, a novel method based on the mechanism of water influx and the material balance equation is established to simultaneously solve water influx, OOIP, and aquifer to hydrocarbon ratios for fractured-vuggy carbonate reservoirs. After applying it to an actual fractured-vuggy carbonate reservoir with bottom water, the following points are pinpointed:
(1)
The calculation method is sensitive to the values of reservoir pressure and crude oil formation volume factor. Significant errors in reservoir static pressure tests and calculation errors in the oil formation volume factor may lead to the non-convergence of calculation results;
(2)
Water influx for fractured-vuggy carbonate reservoirs with bottom/edge water can be characterized into two types, logarithmic water influx and linear water influx. In the early stages of water influx, the water influx rate of logarithmic water influx often exceeds that of linear water influx;
(3)
For logarithmic water influx wells, the volume of the connected waterbody is relatively small, and the energy of the waterbody is weak. Water influx phenomena typically occur only within a short period after water movement. In contrast, for linear water influx wells, the volume of the connected waterbody is larger, and the energy of the waterbody can sustain a stable water influx rate.
(4)
The determination method of the aquifer to hydrocarbon ratio for fracture-vuggy carbonate reservoirs with bottom water, as well as related research findings on OOIP and the prediction of water invasion patterns, can provide theoretical support for the evaluation of waterbody energy, dynamic analysis of water invasion, and water control and management for such reservoirs.

Author Contributions

Methodology, Q.Z.; Formal analysis, F.Z.; Investigation, C.Y. and W.C.; Resources, G.N.; Data curation, F.C.; Writing—original draft, R.Y.; Writing—review & editing, J.W. All authors have read and agreed to the published version of the manuscript.

Funding

This research was funded by Research on New Mechanisms and Methods for Enhancing Recovery in Condensate Gas Reservoirs, 2023ZZ0406.

Data Availability Statement

Data are contained within the article.

Conflicts of Interest

Authors Chao Yao, Fei Zhou, Ge Niu, Fangfang Chen, Wen Cao were employed by the Tarim Oilfield Company, PetroChina. Author Qi Zhang was employed by the Research Institute of Petroleum Exploration and Development. The remaining authors declare that the research was conducted in the absence of any commercial or financial relationships that could be construed as a potential conflict of interest.

References

  1. Tan, Y.; Li, Q.; Xu, L.; Ghaffar, A.; Zhou, X.; Li, P. A critical review of carbon dioxide enhanced oil recovery in carbonate reservoirs. Fuel 2022, 328, 125256. [Google Scholar] [CrossRef]
  2. Yao, Y.; Wei, M.; Kang, W. A review of wettability alteration using surfactants in carbonate reservoirs. Adv. Colloid Interface Sci. 2021, 294, 102477. [Google Scholar] [CrossRef]
  3. Xu, Z.X.; Li, S.Y.; Li, B.F.; Chen, D.Q.; Liu, Z.Y.; Li, Z.M. A review of development methods and EOR technologies for carbonate reservoirs. Pet. Sci. 2020, 17, 990–1013. [Google Scholar] [CrossRef]
  4. Wang, J.; Song, H.; Wang, Y. Investigation on the micro-flow mechanism of enhanced oil recovery by low-salinity water flooding in carbonate reservoir. Fuel 2020, 266, 117156. [Google Scholar] [CrossRef]
  5. Liu, B.; Jin, Y.; Chen, M. Influence of vugs in fractured-vuggy carbonate reservoirs on hydraulic fracture propagation based on laboratory experiments. J. Struct. Geol. 2019, 124, 143–150. [Google Scholar] [CrossRef]
  6. Wen, Y.C.; Hou, J.R.; Xiao, X.L.; Li, C.M.; Qu, M.; Zhao, Y.J.; Wu, W.P. Utilization mechanism of foam flooding and dis-tribution situation of residual oil in fractured-vuggy carbonate reservoirs. Pet. Sci. 2023, 20, 1620–1639. [Google Scholar] [CrossRef]
  7. Guo, L.; Wang, S.; Sun, L.; Kang, Z.; Zhao, C. Numerical simulation and experimental studies of karst caves collapse mechanism in fractured-vuggy reservoirs. Geofluids 2020, 2020, 8817104. [Google Scholar] [CrossRef]
  8. Fang, Z.J. Practice and knowledge of volumetric development of deep fractured-vuggy carbonate reservoirs in Tarim Basin, NW China. Pet. Explor. Dev. 2019, 46, 576–582. [Google Scholar]
  9. Zhang, Y.; Zhang, L.; He, J.; Zhang, H.; Zhang, X.; Liu, X. Fracability evaluation method of a fractured-vuggy carbonate reservoir in the shunbei block. ACS Omega 2023, 8, 15810–15818. [Google Scholar] [CrossRef]
  10. Sheng, S.; Duan, Y.; Wei, M.; Yue, T.; Wu, Z.; Tan, L. Analysis of Interwell Connectivity of Tracer Monitoring in Carbonate Fracture-Vuggy Reservoir: Taking T-Well Group of Tahe Oilfield as an Example. Geofluids 2021, 2021, 5572902. [Google Scholar] [CrossRef]
  11. Zhao, R.; Zhao, T.; Kong, Q.; Deng, S.; Li, H. Relationship between fractures, stress, strike-slip fault and reservoir productivity, China Shunbei oil field, Tarim Basin. Carbonates Evaporites 2020, 35, 1–14. [Google Scholar] [CrossRef]
  12. Zhang, F.; An, M.; Yan, B.; Wang, Y.; Han, Y. A novel hydro-mechanical coupled analysis for the fractured vuggy carbonate reservoirs. Comput. Geotech. 2019, 106, 68–82. [Google Scholar] [CrossRef]
  13. Yong, W.; Han, Q.J.; Jun, J.L. Study on water injection indicator curve model in fractured vuggy carbonate reservoir. Geofluids 2021, 2021, 5624642. [Google Scholar] [CrossRef]
  14. Cheng, H.; Jiang, L.; Li, C. Experimental Study on Production Characteristics of Bottom Water Fractured-Vuggy Reservoir. Geofluids 2022, 2022, 7456697. [Google Scholar] [CrossRef]
  15. Deng, H.; Yang, S.L.; Liu, Y.C.; Fan, H.C.; Zhang, Y.; Wang, J.; Shen, Y. A new method for predicting water-invasion laws in fractured-vuggy carbonate gas reservoirs with bottom water. Nat. Gas Explor. Dev. 2023, 46, 37–43. [Google Scholar]
  16. Gu, J.W.; Jiang, H.Q.; Wu, Y.Z.; Guo, M. Quantitative description of vertical well water coning in bottom water reservoir with no interlayer. Pet. Geol. Recovery Effic. 2012, 19, 78–81. [Google Scholar]
  17. Guo, B.Y.; Lee, R. A simple approach to optimization of completion interval in oil/water coning systems. SPE Reserv. Eng. 1993, 8, 249–255. [Google Scholar]
  18. Zhang, W.Z.; Gao, C.G.; Li, X.M. A new method for determining water intrusion in bottom water reservoirs. Pet. Geol. Oilfield Dev. Daqing 2006, 25, 62–63. [Google Scholar]
  19. Li, Y.S.; Teng, S.N. Study on prediction model for unsteady water influx rate and dynamic reserves of gas reservoirs with bottom water. Spec. Oil Gas Reserv. 2023, 30, 116–121. [Google Scholar]
  20. Chen, Q.H.; Liu, C.Y.; Wang, S.X.; Li, Q.; Wang, S.L.; Xiao, H.P.; Zhang, F.Q. Study on carbonate fracture-cavity system-status and prospects. Oil Gas Geol. 2002, 23, 196–202. [Google Scholar]
  21. Schilthuis, R.J. Active Oil and Reservoir Energy. Pet. AIME 1936, 118, 33–52. [Google Scholar] [CrossRef]
  22. Hurst, W. Water Influx into a Reservoir and its Application to the Equation of Volumetric Balance. SPE AIME 1943, 151, 57–72. [Google Scholar] [CrossRef]
  23. Van Everdingen, A.F.; Hurst, W. The Application of The Laplace Transformation to Flow Problems in Resevoirs. AIME 1949, 186, 97–104. [Google Scholar]
  24. Carter, R.D.; Tracy, G.W. An Improved Method for calculating Water Influx. AIME 1960, 219, 415–417. [Google Scholar] [CrossRef]
  25. Fetkovich, M.J. A Simplified Approach to Water Influx Calculations-Finite Aquifer Systems. J. Pet. Technol. 1971, 23, 814–828. [Google Scholar] [CrossRef]
  26. Shi, J.Y.; Jin, Z.J.; Liu, Q.Y.; Zhang, R.; Huang, Z.K. Cyclostratigraphy and astronomical tuning of the middle eocene terrestrial successions in the Bohai Bay Basin, Eastern China. Glob. Planet. Change 2019, 174, 115–126. [Google Scholar] [CrossRef]
  27. Shi, J.Y.; Jin, Z.J.; Liu, Q.Y.; Fan, T.L.; Gao, Z.Q. Sunspot cycles recorded in Eocene lacustrine fine-grained sedimentary rocks in the Bohai Bay Basin, eastern China. Glob. Planet. Change 2021, 205, 103614. [Google Scholar] [CrossRef]
  28. Yang, L.; Zhang, Y.; Zhang, M.; Ju, B.; Liu, Y.; Bai, Z. A Simple Calculation Method for Original Gas-in-Place and Water Influx of Coalbed Methane Reservoirs. Transp. Porous Media 2023, 148, 191–214. [Google Scholar] [CrossRef]
  29. Pletcher, J.L. Improvements to reservoir material-balance methods. SPE Reserv. Eval. Eng. 2002, 5, 49–59. [Google Scholar] [CrossRef]
  30. Fetkovich, M.J.; Reese, D.E.; Whitson, C.H. Application of a general material balance for high-pressure gas reservoirs. SPE J. 1998, 3, 3–13. [Google Scholar] [CrossRef]
  31. Chen, J.; Ao, Y.T.; Zhang, A.H. Applied research of estimation of water influx in fractured gas pool with aquifer. Spec. Oil Gas Reserv. 2010, 17, 66–68. [Google Scholar]
  32. Yue, S.J.; Liu, Y.R.; Xiang, Y.W.; Wang, Y.L.; Chen, F.J.; Zheng, C.L.; Jing, Z.Y.; Zhang, T.J. A new method for calculating dynamic reserves and water influx of water-invaded gas reservoirs. Lithol. Reserv. 2023, 35, 153–160. [Google Scholar]
  33. Tan, X.; Peng, G.; Li, X.; Chen, Y.; Xu, X.; Kui, M.; Xiao, H. Material balance method and classification of non-uniform water invasion mode for water-bearing gas reservoirs considering the effect of water sealed gas. Nat. Gas Ind. B 2021, 8, 353–358. [Google Scholar] [CrossRef]
  34. Xiong, Y.; Wang, L.; Zhu, Z.; Xie, W. A new method for the dynamic reserves of gas condensate reservoir using cyclic gas injection based on the effects of reinjection ratio and water influx. Engineering 2015, 7, 455–461. [Google Scholar] [CrossRef]
  35. Yong, L.; Chun, X.J.; Hui, P.; Bao, Z.L.; Zhi, L.L.; Qi, W. Method of water influx identification and prediction for a fractured-vuggy carbonate reservoir. In Proceedings of the SPE Middle East Oil and Gas Show and Conference, Manama, Kingdom of Bahrain, 6 March 2017. [Google Scholar]
  36. Gu, H.; Zhen, S.Q.; Zhang, D.L.; Yang, Y. Modification and application of material balance equation for ultra-deep reservoirs. Acta Pet. Sin. 2022, 43, 1623–1631. [Google Scholar]
  37. Jiao, Y.W.; Xia, J.; Liu, P.C.; Zhang, J.; Li, B.; Tian, Q.; Wu, Y. New material balance analysis method for abnormally high-pressured gas-hydrocarbon reservoir with water influx. Int. J. Hydrogen Energy 2017, 42, 18718–18727. [Google Scholar] [CrossRef]
Figure 1. Schematic of water invasion as fluid pressure declines.
Energies 17 02822 g001
Figure 2. Curve fitting results between net water influx and cumulative oil production.
Energies 17 02822 g002
Figure 3. Flow chart for calculating OOIP and net water influx.
Energies 17 02822 g003
Figure 4. Comparison of net water influx between our method and apparent geological reserve method.
Energies 17 02822 g004
Figure 5. Apparent geological reserves versus cumulative oil production.
Energies 17 02822 g005
Figure 6. Reservoir pressure versus cumulative oil production.
Energies 17 02822 g006
Figure 7. Curve of net water influx versus cumulative oil production.
Energies 17 02822 g007
Figure 8. Graph of the change in a and b during the iteration.
Energies 17 02822 g008
Figure 9. X versus Y.
Energies 17 02822 g009
Figure 10. Water influx vs cumulative oil production for M.
Energies 17 02822 g010
Figure 11. Chart for net water influx versus cumulative oil production for different aquifer to hydrocarbon ratio.
Energies 17 02822 g011
Table 1. Reservoir production data and the calculated water influx using both methods.
p
(MPa)
Bo
Dimensionless
Np
(m3)
Wp
(m3)
Apparent Geological Reserve Method
(WeWpBw)
(m3)
Our Method
(WeWpBw)
(m3)
Relative Discrepancy
(%)
70.822.5673383.1765.931868.522537.3835.80
70.492.5707182.86143.284605.535387.1516.97
70.152.57211,091.32247.277438.208318.4911.83
69.822.57414,909.24323.1010,222.2311,181.939.39
69.472.57618,864.04396.9613,123.7414,148.037.80
69.132.57922,810.20486.5216,036.8517,107.656.68
68.812.58126,528.77550.1318,798.3219,896.585.84
68.472.58330,343.55600.5121,647.7722,757.665.13
68.182.58533,766.67635.5024,218.9225,325.004.57
67.892.58736,996.19673.2926,657.0027,747.144.09
67.642.58839,949.24702.1128,896.8729,961.933.69
67.372.59043,033.64732.1631,247.0732,275.233.29
67.032.59246,869.24783.1034,184.9235,151.932.83
66.772.59449,871.80826.2336,496.5137,403.852.49
66.462.59653,431.04896.0839,250.1140,073.282.10
Table 2. Basic data for our target reservoir M.
ParameterValueUnitParameterValueUnit
psc0.101325MPaBoi2.463
Tsc293KBw1.0344
pi89.8MPaCw0.00045MPa−1
T423.48KCf0.0001MPa−1
ρo0.8 × 103kg/m3Swi0
Table 3. Production data of our target reservoir M.
DateCumulative Days of Production
(d)
Np
(m3)
Wp
(m3)
p
(MPa)
15 September 202100089.80
10 October 2021251805.3746.3286.58
27 December 2021503551.6577.5284.13
21 January 2022755267.72120.3582.40
15 February 20221007039.40134.7581.10
12 March 20221258781.00150.7180.11
11 April 202215010,599.23166.0679.27
15 May 202217512,534.98181.3278.52
9 June 202220014,598.91214.477.83
4 July 202222516,617.45241.3177.25
29 July 202225018,478.59278.8976.78
23 August 202227520,234.52308.9476.37
17 September 202230021,937.77344.8476.01
12 October 202232523,607.90366.0875.68
21 November 202235025,123.31400.8675.40
16 December 202237526,555.01424.2375.16
Disclaimer/Publisher’s Note: The statements, opinions and data contained in all publications are solely those of the individual author(s) and contributor(s) and not of MDPI and/or the editor(s). MDPI and/or the editor(s) disclaim responsibility for any injury to people or property resulting from any ideas, methods, instructions or products referred to in the content.