Abstract
Energy is essential for crucial development in Africa. The current electricity shortages and load shedding in South Africa show that the country faces significant challenges in reaching positive economic growth. For industries to operate sustainably, an innovative mechanism must be tailored to solve the negative impacts of industrial energy use, particularly climate change. This study aims to show how renewable energy technologies can provide new economic opportunities, contribute to higher standards of living, and reduce the impacts of society on ecosystems, among other things. This paper presents a feasibility analysis and optimization of new energy technologies by designing and simulating a grid-connected PV system for sustainable development. PV Syst software (PV Syst 6.8.8) was used to simulate and optimize the PV system. The software was employed to design and model the PV systems, calculating energy production, economic performance, and environmental impact. Using simulation data, the researchers compared PV system performance across three scenarios and identified the optimal system. Scenario A was chosen as the best system, with an energy production of 1720 MWh/year. Overall, the findings of this study suggest that grid-connected PV systems are a feasible and sustainable option for meeting South Africa’s energy needs. By implementing the results and recommendations, the government, investors, and community can work together to develop and deploy a successful PV system that will benefit all.
1. Introduction
A theoretical issue that has dominated the engineering field is that energy is the lifeblood of all economies globally [1]. Photovoltaic (PV) power systems are becoming increasingly popular with increasing energy demands and concern for environmental pollution worldwide. In recent years, the design and use of solar PV systems have gained significant attention for harnessing and analyzing the feasibility of renewable energy sources.
Recent developments validate that energy is essential in any country because energy powers the nation from all economic sectors, including transport, manufacturing, tourism, and mining [2]. Energy is, therefore, an enabler of economic growth and stability. In South Africa, the Department of Mineral and Energy ensures the availability, affordability, reliability, and sustainability of energy resources while reducing environmental impacts, thus aligning with the target of Sustainable Development Goal number 7 [3]. South Africa should shift towards a more sustainable green energy future while solving the country’s impending energy problem and simultaneously mitigating carbon dioxide emissions and climate change by providing clean energy.
The available evidence suggests that globally, such as in emerging economies and developing countries like South Africa, there is a pressing need to accelerate progress towards achieving the Sustainable Development Goals while still fulfilling the requirements of international climate change mitigation agreements [4]. Further evidence supports that more than 180 United Nations Framework Convention on Climate Change parties signed the Paris Agreement, committing the world to a transition to clean energy sources. Energy affects the economy. Green economy initiatives aim to produce renewable energy resources, encourage local economies, create sustainable green jobs, and transition to a cleaner region with more reliable energy [5].
1.1. Background of the Problem
Renewable energy is one of Africa’s fastest-growing energy sources [6]. South Africa will have an energy sector that promotes economic growth and development by 2030, and the country’s national energy sector development plan prioritizes investing in renewable energy infrastructure to promote economic growth and development by 2030 [7]. Load shedding in South Africa encounters significant challenges in reaching positive economic growth. Therefore, energy optimization is needed to tackle the energy crisis and to advise on how to proceed. For industries to function sustainably, it is essential to develop innovative mechanisms specifically designed to address the adverse consequences of industrial energy consumption, focusing on mitigating the impacts of climate change.
South African President Cyril Ramaphosa has recognized energy as the lifeblood of the economy. In support of this, H. Kumba et al. [8] stated that this vital sector creates jobs and generates value by extracting, transforming, and distributing energy, goods, and services. Therefore, it is now the foundation of every modern economy around the globe. South Africa’s economic slump and falling economic growth are directly related to deteriorating power sustainability, as the industrial sector is the leading financial contributor to South Africa’s gross domestic product.The Figure 1 below illustrates power cuts in South Africa from 2018 to 2022. Recently, there has been a power shortage in South Africa due to load shedding, poor energy usage, and a lack of effective energy management, resulting in a rise in electricity tariffs and blackouts [9].
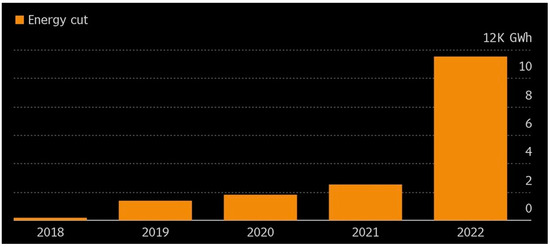
Figure 1.
Power cuts in South Africa from 2018 to 2022 [10].
The South African economy is affected by power supply uncertainties, which also have significant economic consequences for its potential to accomplish industrial targets [11]. Therefore, for industries to thrive sustainably, creative procedures must be adapted to mitigate the negative repercussions of industrial energy use, including climate change.
It is believed that South Africa’s electrical energy demands are expected to multiply as load shedding continues to significantly impact all South Africans’ lives, interrupting business and putting further strain on families and communities [12]. South Africa heavily depends on fossil fuels, leading to concerns about its electricity supply system and energy policies [13]. The current study identified research related to the literature reviewed to analyze and conduct a comprehensive feasibility review of new energy technologies in South Africa for sustainable development. Secondly, it is observed from the literature study that the design and installation of solar PV systems have been widely studied to achieve sustainable development goals. However, most studies have been conducted on stand-alone PV systems. Nevertheless, grid-connected PV systems supply power to the grid, and their potential solar benefits cannot be overlooked.
1.2. Scope and Aim
Renewable energy systems are becoming increasingly feasible in Africa, offering solutions to energy crises and promoting sustainable development [14]. Several studies have shown that solar PV systems are technically and economically feasible, providing a viable solution to Africa’s energy challenges [15]. The practicality of renewable energy in Africa has generated increasing interest, as evidenced by several studies that have emphasized the window of opportunity for incorporation and implementation. H. Kumba et al. [8] suggest that African countries can efficiently build their economies on renewable energy with a higher growth potential than conventional fossil fuels. Hafner et al. [6] additionally highlighted constraints such as scalability, economics, and seating issues, emphasizing the financial feasibility and societal consequences of renewable energy adoption, while H. Kumba et al. [8] specifically concentrated on its capacity to tackle energy accessibility, affordability, and sustainability difficulties in South Africa.
The feasibility and optimization of renewable energy using the PV Syst software have been explored in many studies. Some studies also highlighted the importances of renewable energy uptake [16,17]. A demonstration of the potential of solar PV systems in Indonesia was investigated, resulting in an optimal design of 144.21 MWh/year of energy production [18]. Aronescu et al. [19] highlighted that designing and optimizing systems is crucial, especially for stand-alone photovoltaic (PV) systems, emphasizing that proper system design and performance are essential for maximizing effectiveness and efficiency. Khan et al. [20] analyzed the techno-economic and social feasibility of a solar PV–wind hybrid system for rural India, utilizing PV Syst for its optimization and sizing. Krishna Priya et al. [21] introduced a design space approach for sizing stand-alone photovoltaic thermal (PVT) systems, which considers the electrical and thermal demands, temperature requirements, and working fluid properties.
Few researchers have focused on designing PV systems at academic institutions to determine the optimal system configurations and performance under different load conditions [22,23,24]. Another researcher further considered these additional factors: location (geographic coordinates), climate, and inverter efficiency [25]. A recent study emphasized the importance of geographical and climatic conditions, as well as the number and type of PV modules, in achieving optimal system performance; however, the authors excluded some factors from the design [26].
This study aims to optimize renewable energy technology using PV Syst software. The authors reviewed the available literature and some work carried out by other researchers regarding the feasibility and optimization of renewable energy. The reviewed literature was analyzed by examining what other authors have achieved and the outcomes. In addition, the researchers examined how previous researchers tackled the feasibility issue and noted the problems they faced. These studies collectively highlight the need for a comprehensive approach to PV system design that considers both technical and practical aspects. In this regard, the evaluation and identification of gaps in the current energy scenario in South Africa were reviewed from the literature and research published by the authors.
After reviewing the gaps in the current energy scenario, the authors designed a grid-connected PV system using PV Syst software. The system was designed, simulated, evaluated, and optimized under the desired working conditions. Economic and environmental evaluations were also conducted to make informed decisions about the system’s design, installation, and operation. We focused on designing and improving the performance of renewable energy technologies—using different strategies such as energy storage, innovative grid technologies, and digitalization—and developing a roadmap for their implementation.
The study was motivated by the extreme power shortage in which demand exceeded availability, leading to continuous electricity disruptions in South Africa. This study aimed to generate awareness and knowledge about renewable energy adoption and help improve the issue at hand. Enhancing industrial energy efficiency and management is a highly effective approach to reducing the adverse effects of industrial energy use and bolstering these industries’ overall productivity and competitiveness. This study will focus on the green economy and sustainable development.
Therefore, the novelty of this study lies in exploring the design and feasibility analysis of installing a grid-connected PV system, and the authors used PV Syst software for the design.
2. Materials and Methods
Globally, South Africa is the seventh-largest producer of coal and the fifth-largest coal exporter. For South Africa to play an essential role in mitigating global climate change, there needs to be a reduction in the use of coal from coal-fired power stations, thus resulting in the introduction of renewable energy [27]. The development and use of renewable energy technologies will not only tackle climate crisis but also provide energy security and employment to people [28]. The potential renewable energy sources in South Africa are sun, wind, biomass, geothermal, hydropower, waste-to-energy, and tidal (wave) energy, and their potential varies from province to province [29].
South Africa developed a feasible regulatory framework to increase the amount of renewable energy in the national energy mix. South Africa established and managed the Renewable Energy Independent Power Producer Procurement Initiative (REIPPP) to ensure the effective development and application of renewable energy for electricity generation [30,31]. This resulted in more electricity being added to the grid through renewable energy, making renewable energy a reality in the country, though in a small percentage. The procurement scheme will not only promote a whole new industry for South Africa and cut greenhouse gas emissions by greening grid electricity; it also aims to address economic development on the local level.
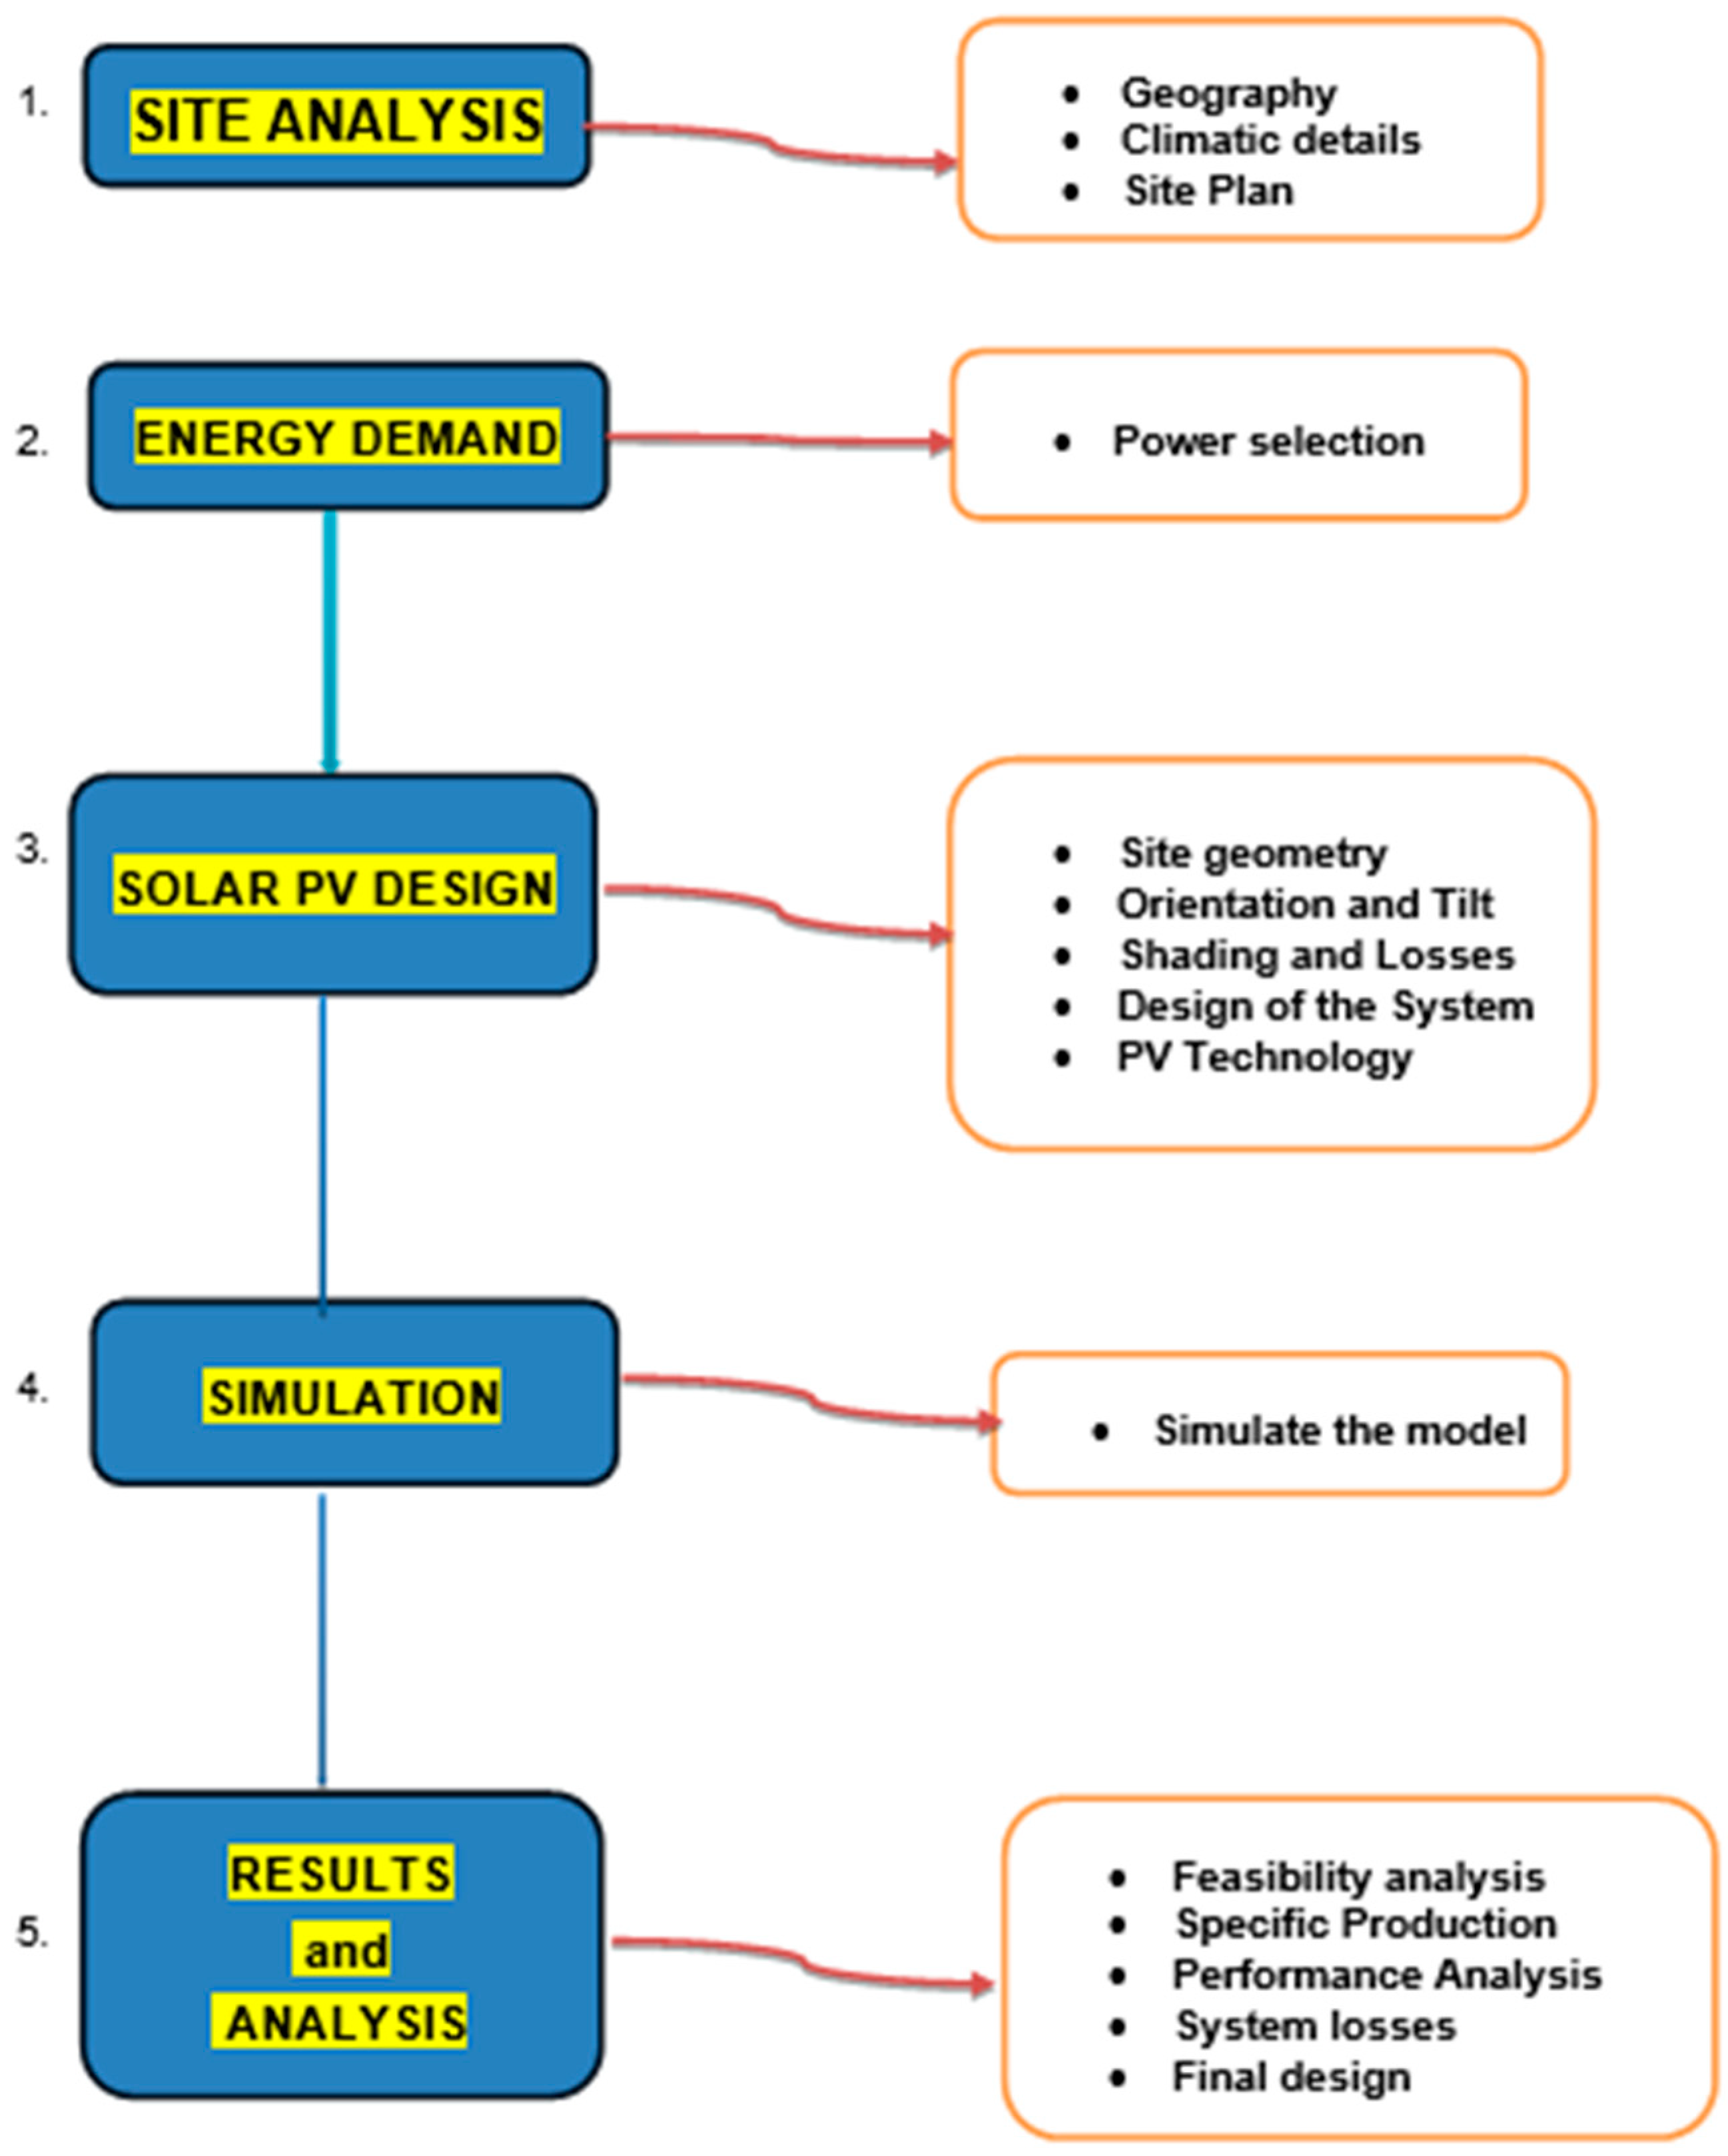
In order to carry out the design, it is necessary to analyze the research design. This research consists of five different stages before the final result. All these phases are interconnected, as shown in Figure 2 below:
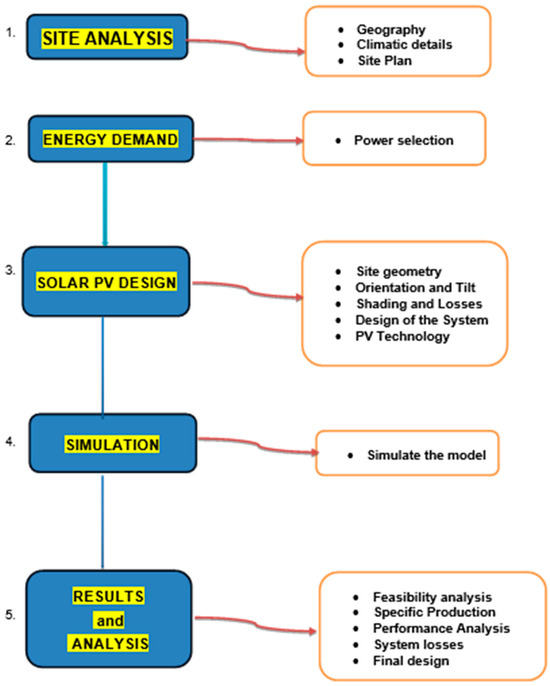
Figure 2.
When designing a research study on the design of a grid-connected PV system using PV Syst, the below listing for the research design should be considered [32].
- Site Analysis
- Energy Demand
- Solar PV Design
- Simulation
- Results and Analysis
A series of studies have utilized PV Syst software to design and simulate grid-connected PV systems for various applications. Another researcher further extended this work to residential buildings, emphasizing the importance of considering geographical location, solar irradiance, and module orientation in system design [33]. The use of PV Syst software for the design and performance analysis of solar PV systems has been explored in several studies [32,34]. These studies collectively highlight the versatility and effectiveness of PV Syst in designing and simulating PV systems for different settings. The novelty of this work lies in unique features such as the customization of system parameters to meet the energy demand profile of the small town, integration of local weather data for accurate simulation, and finally, innovative strategies for optimizing system performance and cost-effectiveness.
To design, analyze, and simulate the system and assess its performance, the researchers used the PV Syst software as a valuable tool in this project. PV Syst software, created by Mermoud and Villoz, was explicitly designed to facilitate the entire PV system’s examination, dimensioning, and comprehensive data analysis.
PV system software is used to optimize renewable energy systems. Baqir et al. [35] demonstrated the analysis and design of solar PV systems using PV Syst software for a study in Afghanistan. The paper’s results prove that using PV Syst software for analyzing and designing a solar PV system is viable, providing insights into the system’s performance and potential contribution to the country’s electricity demand. Data from several studies have identified the use of PV Syst software as an optimization tool for system analysis, visualization, and simulation results, assessing solar energy feasibility and potential for electricity generation, being particularly useful for grid-connected and stand-alone photovoltaic systems [36,37].
2.1. Design Process
The process of designing and integrating the system into PV Syst necessitates the input of extensive data and the meticulous definition of numerous parameters to establish an accurate, valid, and comprehensive grid-connected system. In order to conduct a thorough analysis, it is imperative that we have access to essential data for the plant, which includes the following:
- Geographical information;
- Site and climatic conditions;
- PV technology selection;
- Simulation of the model.
Site Identification and Climatic Data
To design a PV system, it is crucial to know where the system is located so that the designer understands various factors affecting system performance. Therefore, site analysis is essential. This methodology presents the project location, addition, and meteorological data, including temperature variation and annual/monthly solar radiation from reliable sources.
Due to its solar potential and higher irradiation levels, the project will be located in Lephalale, a town in Limpopo province. The selected area is Onverwacht, with a latitude of −23.72639, a longitude of 27.68833, and an altitude of 848 m. The proposed project area is reasonably flat, with a high topography. The project is located between Matimba and Medupi power stations, making it easy to connect to the primary grid supplying the municipality or other parts of the country. Table 1 below shows the geographic site parameters of the location.

Table 1.
Geographical site parameters for Onverwacht.
Lephalale is one of the warmest areas in South Africa, with predominantly sunny conditions and prevailing temperatures reaching up to 40 °C in summer. The data shown in Table 2 below are the meteorological data for the town and were derived from the latest available information contained in Meteonorm 7.2, which is a comprehensive meteorological database encompassing weather data from across the globe for the period 1991–2020 and also integrated with data from the Photovoltaic Geographical Information System, referred to as PV-GIS, which is a specialized tool that has been developed and is currently maintained by the European Commission [38].
Table 2.
Meteorological data for Lephalale.
From the data presented, it can be concluded that Lephalale, Onverwacht, is a suitable place in which to implement a PV plant. The site’s soil is presumed to be highly suitable for this study because of its favorable characteristics, including dryness, resistivity, load-bearing capacity, and chemical properties, and generally, the predominant ground layer at the site consists of sandy soil. Information on floods, rainfalls, snow, and high temperatures was also analyzed, as these factors can affect the plant’s performance. The chosen location is not under extreme weather conditions, so every parameter will not affect the design.
There are several steps needed to come up with the model of the system in the software.
- Definition of the project;
- Definition of the site (already achieved);
- Selection of the metereo file in PV Syst software;
- Defining the orientation of the system;
- Defining the system variants;
- Definition of the PV system in several “Variants” or “Calculation versions”;
- Running of various simulations.
Multiple simulations will be conducted to facilitate meaningful comparisons, enabling refinement of the system design to meet specific conditions. The software offers insights into the total energy output and losses and delivers an economic evaluation encompassing factors such as pricing, energy costs, and profitability.
2.2. System Design
It is essential to choose the right technology for the system. This also affects the operational efficiency of the system. The system components include a PV module and solar inverter.
2.2.1. PV Module
The photovoltaic module is one of the most important components of the grid-connected PV system as it changes solar radiation energy into electrical energy. The PV module refers to the fundamental building block of the photovoltaic system as it directly converts sunlight into electricity through the photovoltaic effect. So, choosing the correct PV modules is critical in designing the grid-connected system.
In order to enhance the system’s output power, a specific number of PV modules are interconnected to create a solar array. The PV array must be accurately sized to ensure an uninterrupted power supply throughout the year without operational issues. The researchers also consider factors like module type (monocrystalline, polycrystalline, or thin-film), efficiency, temperature coefficient, and manufacturer’s reputation during the design.
The most important parameters when choosing PV modules are as follows:
- Efficiency: Efficiency refers to how effectively a PV module converts sunlight into electricity. Higher efficiency modules generate more power for a given area, which can be crucial if space is limited.
- Temperature coefficient: The temperature coefficient measures how a PV module’s efficiency is affected by temperature changes. Solar panels tend to produce less electricity as they get hotter. A lower temperature coefficient signifies reduced sensitivity to temperature fluctuations, resulting in improved performance under hot weather conditions. Consequently, the durability of the PV module is extended when the temperature coefficient is less sensitive.
- Manufacturer’s reputation: The reputation of the PV module manufacturer is essential for ensuring the quality and long-term reliability of the panels. Reputable and established manufacturers are more likely to produce reliable modules.
- Durability: This refers to the ability of the selected PV modules to withstand various environmental and operational conditions over an extended period without significant deterioration in performance. Durability ensures a solar PV system’s long-term reliability and cost-effectiveness.
In summary, when considering PV module selection for a grid-connected PV system, it is important to weigh factors like module type, efficiency, temperature coefficient, and the manufacturer’s reputation. These factors will help you choose PV modules that align with your budget, available space, and performance requirements, ultimately optimizing the performance and longevity of the solar energy system.
For this study, the researchers chose a Q.PLUS L-G4.1 340 panel manufactured by Hanwha Q Cells. This monocrystalline solar panel is known in the industry for its high efficiency and space-efficient design.
Its key features and specifications are as follows:
- Type: this monocrystalline solar panel is known for its high efficiency and space-efficient design.
- Power output: The “340” in the product name suggests that this panel has a power output of approximately 340 watts under standard test conditions (STC). The actual power output can vary based on sunlight intensity and temperature.
- Efficiency: Monocrystalline panels like the Q.PLUS L-G4.1 are more efficient than other solar panel types. The efficiency indicates how effectively the panel converts sunlight into electricity.
- Durability: Hanwha Q Cells typically produce high-quality solar panels with a focus on durability. These panels are designed to withstand various environmental conditions and have a long lifespan.
- Applications: solar panels like the Q.PLUS L-G4.1 340 are commonly used in grid-connected solar PV systems for residential, commercial, and industrial applications.
2.2.2. Inverter
The inverter holds significant importance within grid-connected PV systems because it plays a pivotal role in converting the DC power generated by the PV modules into the AC power necessary for integration with the grid. It is an essential electric component involved in aligning the the inverter specification with the PV specification to run the system properly. In a grid-connected system, the electricity produced by the solar panels must be synchronized with the utility grid’s frequency and voltage. Inverters are designed to match the grid’s electrical characteristics to ensure a seamless connection. This synchronization is crucial for safely injecting excess electricity into the grid or drawing electricity from the grid when needed.
For this research, we used the “Ingecon Sun 50”, a solar inverter manufactured by Ingeteam, a well-known company in the renewable energy industry.
Its key features and specifications are as follows:
- Capacity: The “50” in the product name indicates the inverter’s capacity, often expressed in kilowatts (kW). In this case, the inverter has a capacity of 50 kW.
- Efficiency: Solar inverters like the Ingecon Sun 50 have efficiency ratings that indicate how effectively they convert DC power into AC power. High-efficiency inverters are desirable as they minimize energy losses during conversion.
Table 3.
Operating characteristics for the inverter (input).
Table 4.
Operating characteristics for the inverter (output).
In this study, it was assumed that the proximity or vicinity of the PV system remains unobstructed by objects or buildings that can cast direct shadows on the panels, thereby obstructing their performance. Without such obstacles, sunlight should have an unobstructed path and pass to the ground.
The figure below shows the designed grid-connected PV system with all its components. Once all the steps outlined in the preceding sections have been carried out and every detail has been thoroughly established and finalized, the resulting grid-connected system is illustrated in the Figure 3 below.
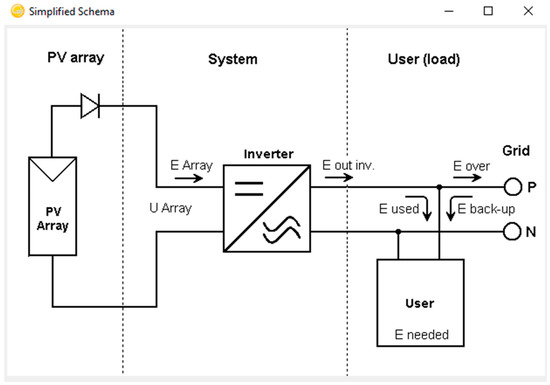
Figure 3.
The designed grid-connected PV system.
In conclusion, this chapter presents a comprehensive methodology for designing a PV system using PV Syst software. This section explains the methodological approach for designing a PV system in detail. The methodology for designing a PV system using PV Syst software involves a systematic and data-driven approach. A better understanding of how the data used in this research were obtained is illustrated through a research design diagram. The research design provided the research flow, and the data were explained in detail. A grid-connected photovoltaic system was designed and simulated using PV Syst software. The system’s output depends on the received solar radiation, as the simulation results show in the next section. This methodology ensures that the system is appropriately sized, configured, and optimized for maximum energy production and cost-effectiveness.
3. Results and Analysis
3.1. System Performance
In this section, we present the results of our simulations and provide an overview of the methodology employed to identify the optimal solution for a PV system. This section explains the significance of the research and draws meaningful conclusions. This includes the system performance analysis, thus presenting data on the actual performance of the grid-connected PV system—including energy generation, system efficiency, and any relevant metrics—and comparing the actual performance with the expected or simulated results.
The key parameters to be analyzed are as follows:
- The performance ratio (PR) is a crucial metric for assessing the efficiency of photovoltaic systems. This metric is precisely defined as the ratio between the actual energy output or utilization and the energy that would have been produced if the system consistently operated at its nominal capacity.
- Energy yield: This energy yield represents the total energy that the PV system generates throughout a specified duration. It is usually expressed in kilowatt-hours (kWh) per year or month, depending on simulation expectations. Energy yield can be used to evaluate the overall performance of a grid system.
- Normalized production: Normalized production is the ratio of actual energy production to the installed capacity of the PV system. This is usually expressed as kilowatt-hours per kilowatt-peak (kWh/kW) per year or month. The normalized production parameter helps evaluate the system’s performance relative to its installed capacity.
- Loss: This is a factor that reduces the efficiency of the PV system. They can be caused by shading, soiling, module quality, and other factors during design. From PV Syst’s loss diagram, one can identify the primary sources of losses in the system and evaluate their impact on its performance.
- Sensitivity analysis: Sensitivity analysis is performed to identify the key parameters significantly affecting system performance. This aids in understanding the robustness of the system under varying conditions.
All the simulation scenarios and their respective parameters are detailed in Table 4. Notably, the remaining parameters, including losses and technology configuration, remained consistent across all scenarios. Why is it essential to form different scenarios? It is vital to create different scenarios because they allow researchers to model the performance and efficiency of a PV system under different conditions [39]. This will enable them to identify the scenario that best meets their needs, considering all relevant factors in the design.
The three scenarios for the PV system in the software were formed by varying the tilt angle of the PV modules. The tilt angle, also known as the inclination angle, pertains to the angle at which the PV modules are positioned relative to the horizontal ground surface [40]. The tilt angle affects the amount of sunlight that the PV modules receive and the amount of energy they produce.
- Scenario A assumes a tilt angle of 30 degrees. This is the standard tilt angle for PV systems in several parts of the world.
- Scenario B assumes a tilt angle of 45 degrees. This tilt angle is often used in PV systems in areas of high solar radiation.
- Scenario C assumes a tilt angle of 15 degrees. This tilt angle is often used in PV systems in areas with low solar radiation levels.
The software calculated the energy production of the PV system for each Scenario based on the tilt angle of the PV modules and the amount of solar radiation available at the site. The three scenarios were formed as shown in Table 5 below, to provide a range of possible outcomes for the PV system and to optimize or choose the best system. The researchers utilized simulation data to compare PV system performance in three scenarios and identify the optimal one.
Table 5.
PV modules used in the analysis.
The specific energy production, derived from a PV Syst simulation, quantifies the energy generated by a photovoltaic (PV) system per unit of installed capacity. This metric is typically expressed in kilowatt-hours per kilowatt-peak per year (kWh/kWp/year). The specific energy production is an essential metric for evaluating the performance of a PV system and comparing it to other systems. It considers factors such as the efficiency of the PV modules, the orientation and tilt angle of the modules, shading, and other losses.
From the simulation scenarios, the specific energy production values for scenarios A, B, and C are 1325, 1147, and 1438 kWh/kWp/year, respectively. These values indicate each system’s energy per unit of the installed capacity. Higher specific energy production indicates a more efficient PV system. Scenario C has a higher specific energy production than Scenarios A and B. This is because Scenario C has a tilt angle of 15°, which is closer to the optimal tilt angle for solar panels in the southern hemisphere. Based on the specific energy production, Scenario C had the highest specific energy production value of 1438 kWh/kWp/year. This indicates that scenario c has the highest potential for energy production per unit of installed capacity, and the optimal tilt angle is the angle at which the solar panels will receive the most sunlight throughout the year.
Scenario A has a specific energy production of 1325 kWh/kWp/year, which falls between Scenario C (higher) and Scenario B (lower), with Scenario B having the lowest specific energy production at 1147 kWh/kWp/year.
3.2. Energy Production
Energy production is a PV system’s total energy over a given period. It is typically measured in kilowatts (kWh). Higher energy production indicates that a PV system can produce more power. Table 6 below shows that the energy production values for scenarios A, B, and C were 1720, 1720, and 2259 MWh/year, respectively. Scenario C produced the highest total energy output at 2259 MWh/year, being significantly higher than scenarios A and B.
Table 6.
Energy production for the systems designed.
However, it is essential to note that specific energy production values alone do not provide a complete picture of the performance of PV systems. Other factors such as cost, maintenance requirements, and environmental impact should also be considered when evaluating different scenarios for optimizing a system.
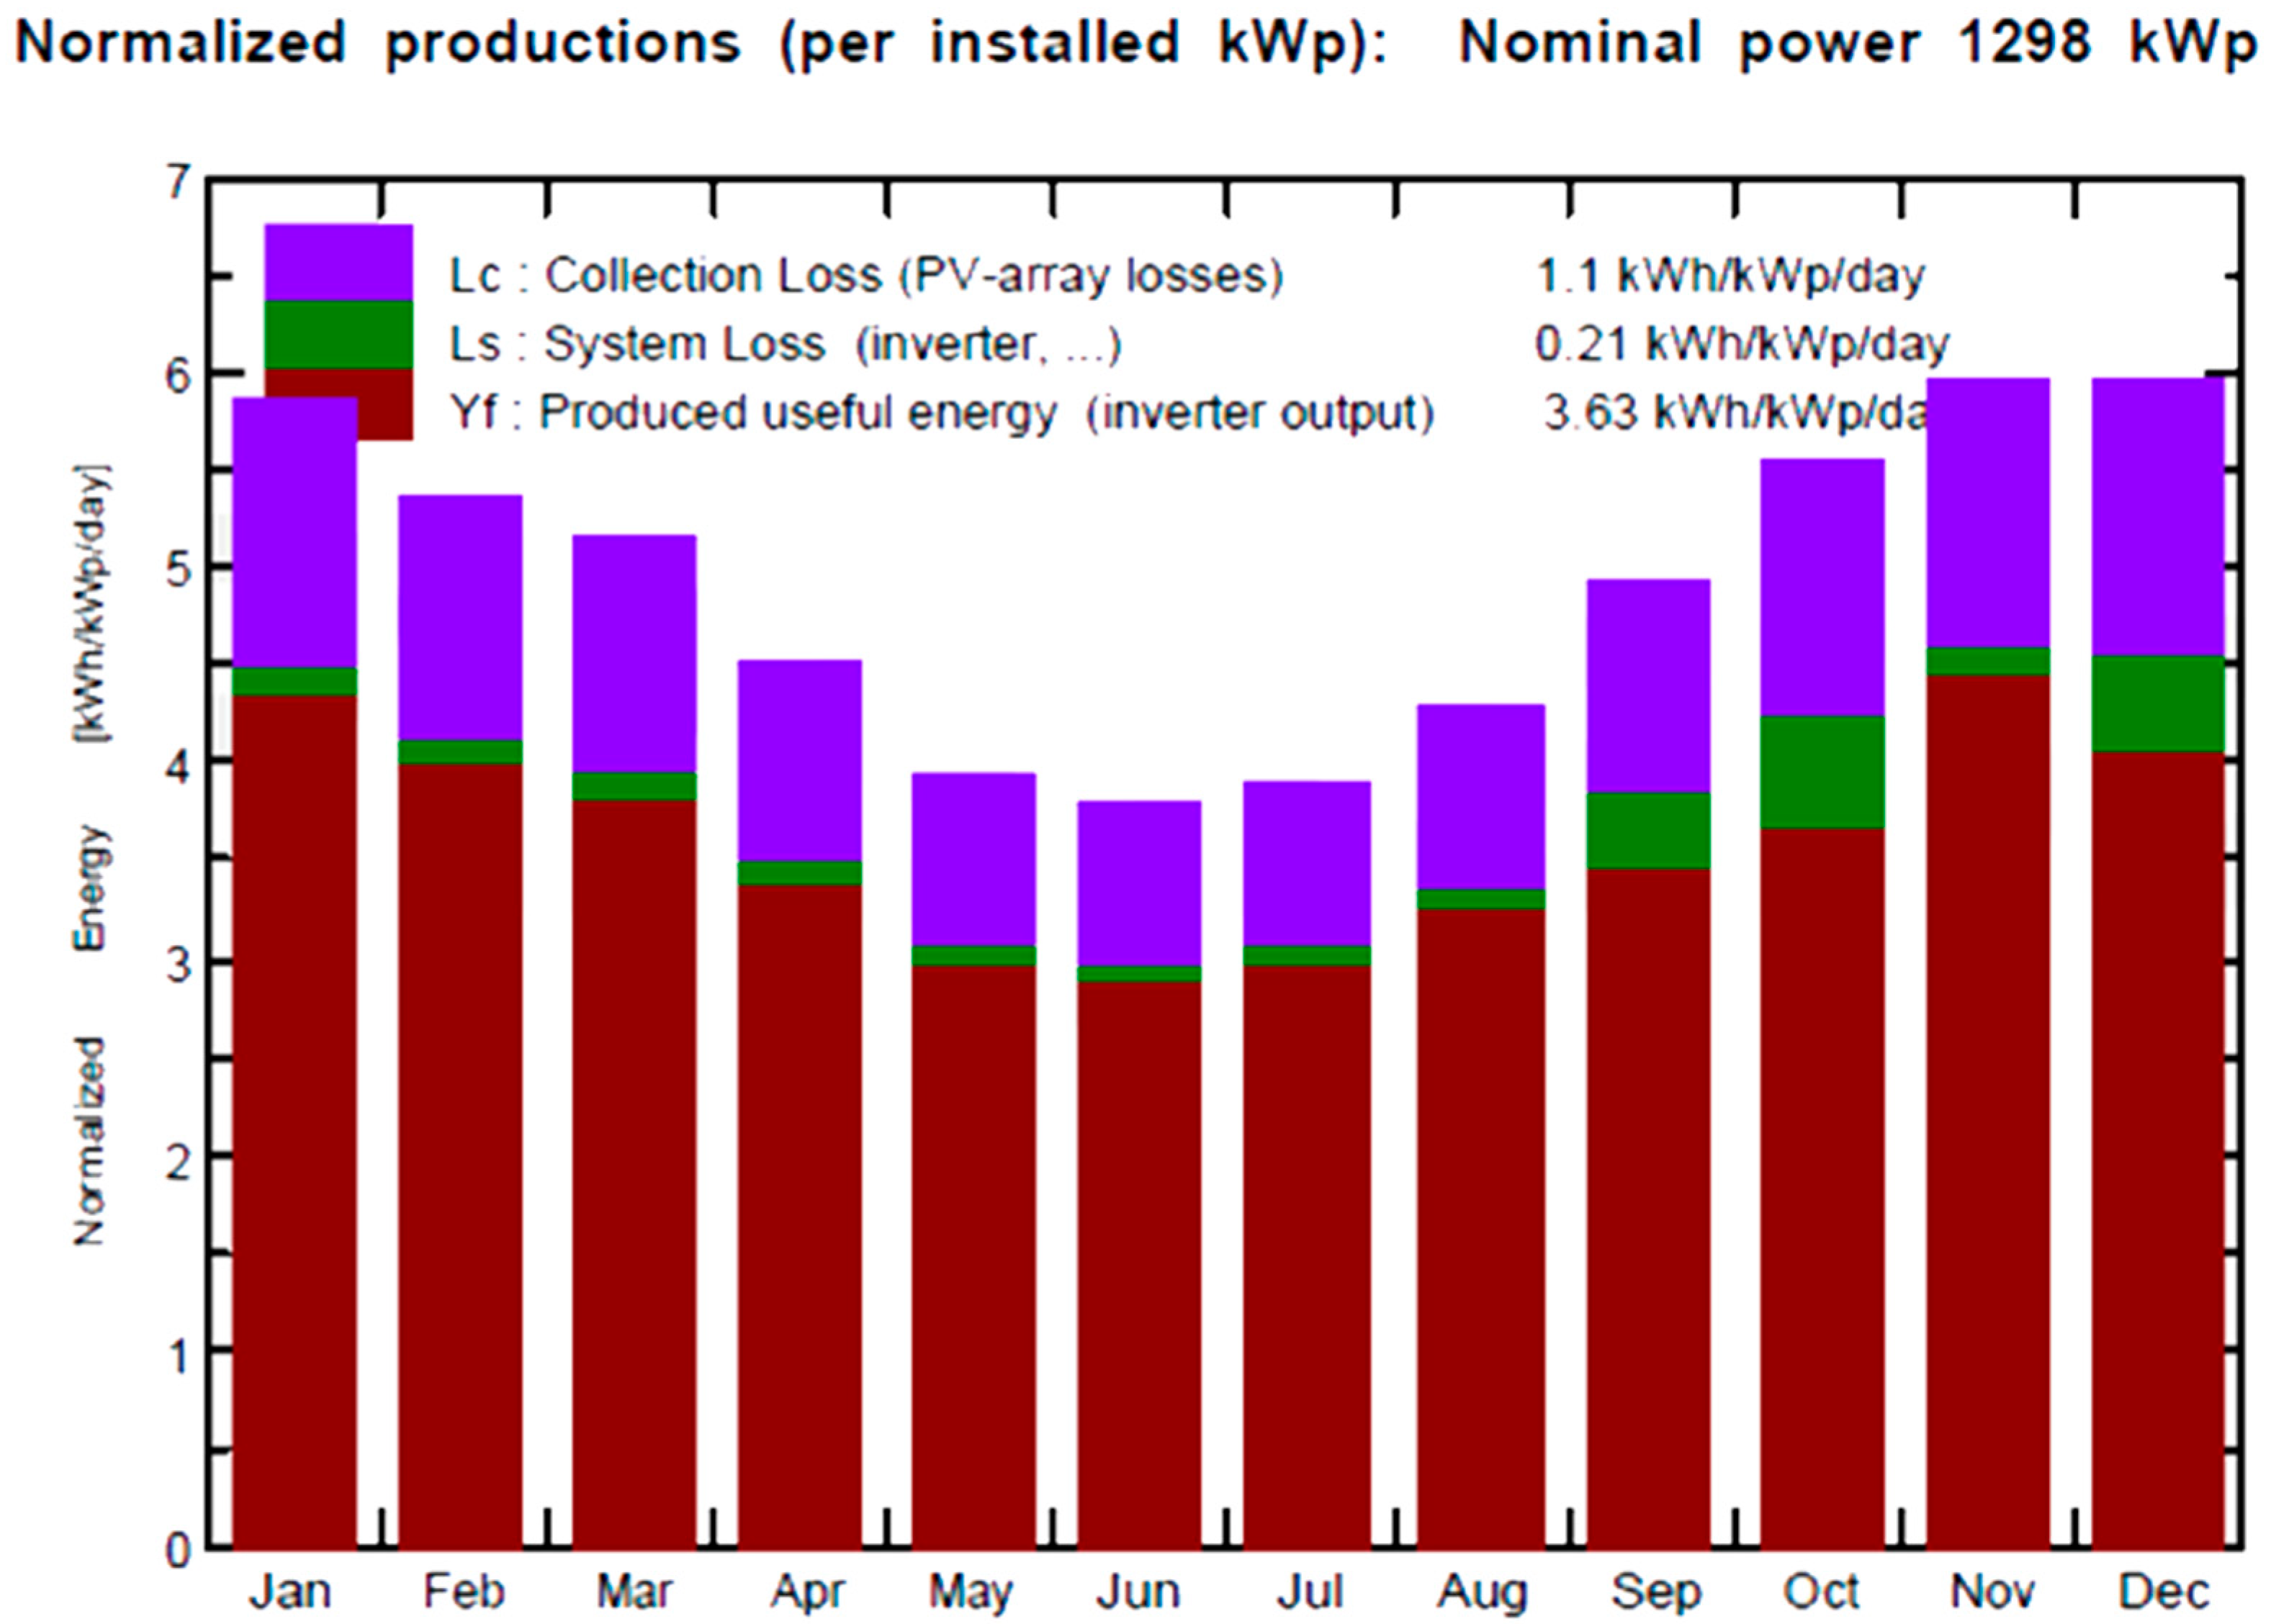
From the Figure 4 below, which shows the energy production for Scenario A, the x-axis represents the months of the year, and the y-axis represents the normalized energy production in kWh/kWp/day. The graph shows the normalized production of energy per installed kilowatt peak (kWp) for a PV system with a specific energy production of 1325 kWh/kWp/year. This means that the PV system for Scenario A will produce 1325 kWh of energy per kilowatt peak of installed capacity over a year, or the system will generate 1325 kWh of energy per kWp annually. The graph illustrates and offers a visual representation of how energy production changes over the year for Scenario A, which is highest in summer with more sunlight and lowest in winter with less sunlight; the winter months also had the highest losses from the system.

Figure 4.
Energy production for Scenario A.
It is evident from the graph that energy production is at its peak during the summer months when there is ample sunlight; however, it drops during the winter months when there is reduced sunlight. The presence of losses within the system, visually depicted by the green and purple bars on the graph, is noteworthy. These losses are most pronounced during winter, aligning with reduced energy production. The red bars represent the valuable energy produced by the inverter output, whereas the green bars indicate system losses, including losses from the inverter. Finally, the purple bars represent collection losses encompassing PV array-related losses.
The total energy production for the PV system in Scenario A can be calculated by multiplying the normalized energy production by the system’s installed capacity. In this case, the installed capacity of the system is 1298 kWp, so the total energy production is calculated as follows:
Energy production = Normalized production of energy × Installed capacity
Energy production = 1.1 kWh/kWp/day × 1298 kWp × 365 days/year
Energy production = 1720 MWh/year.
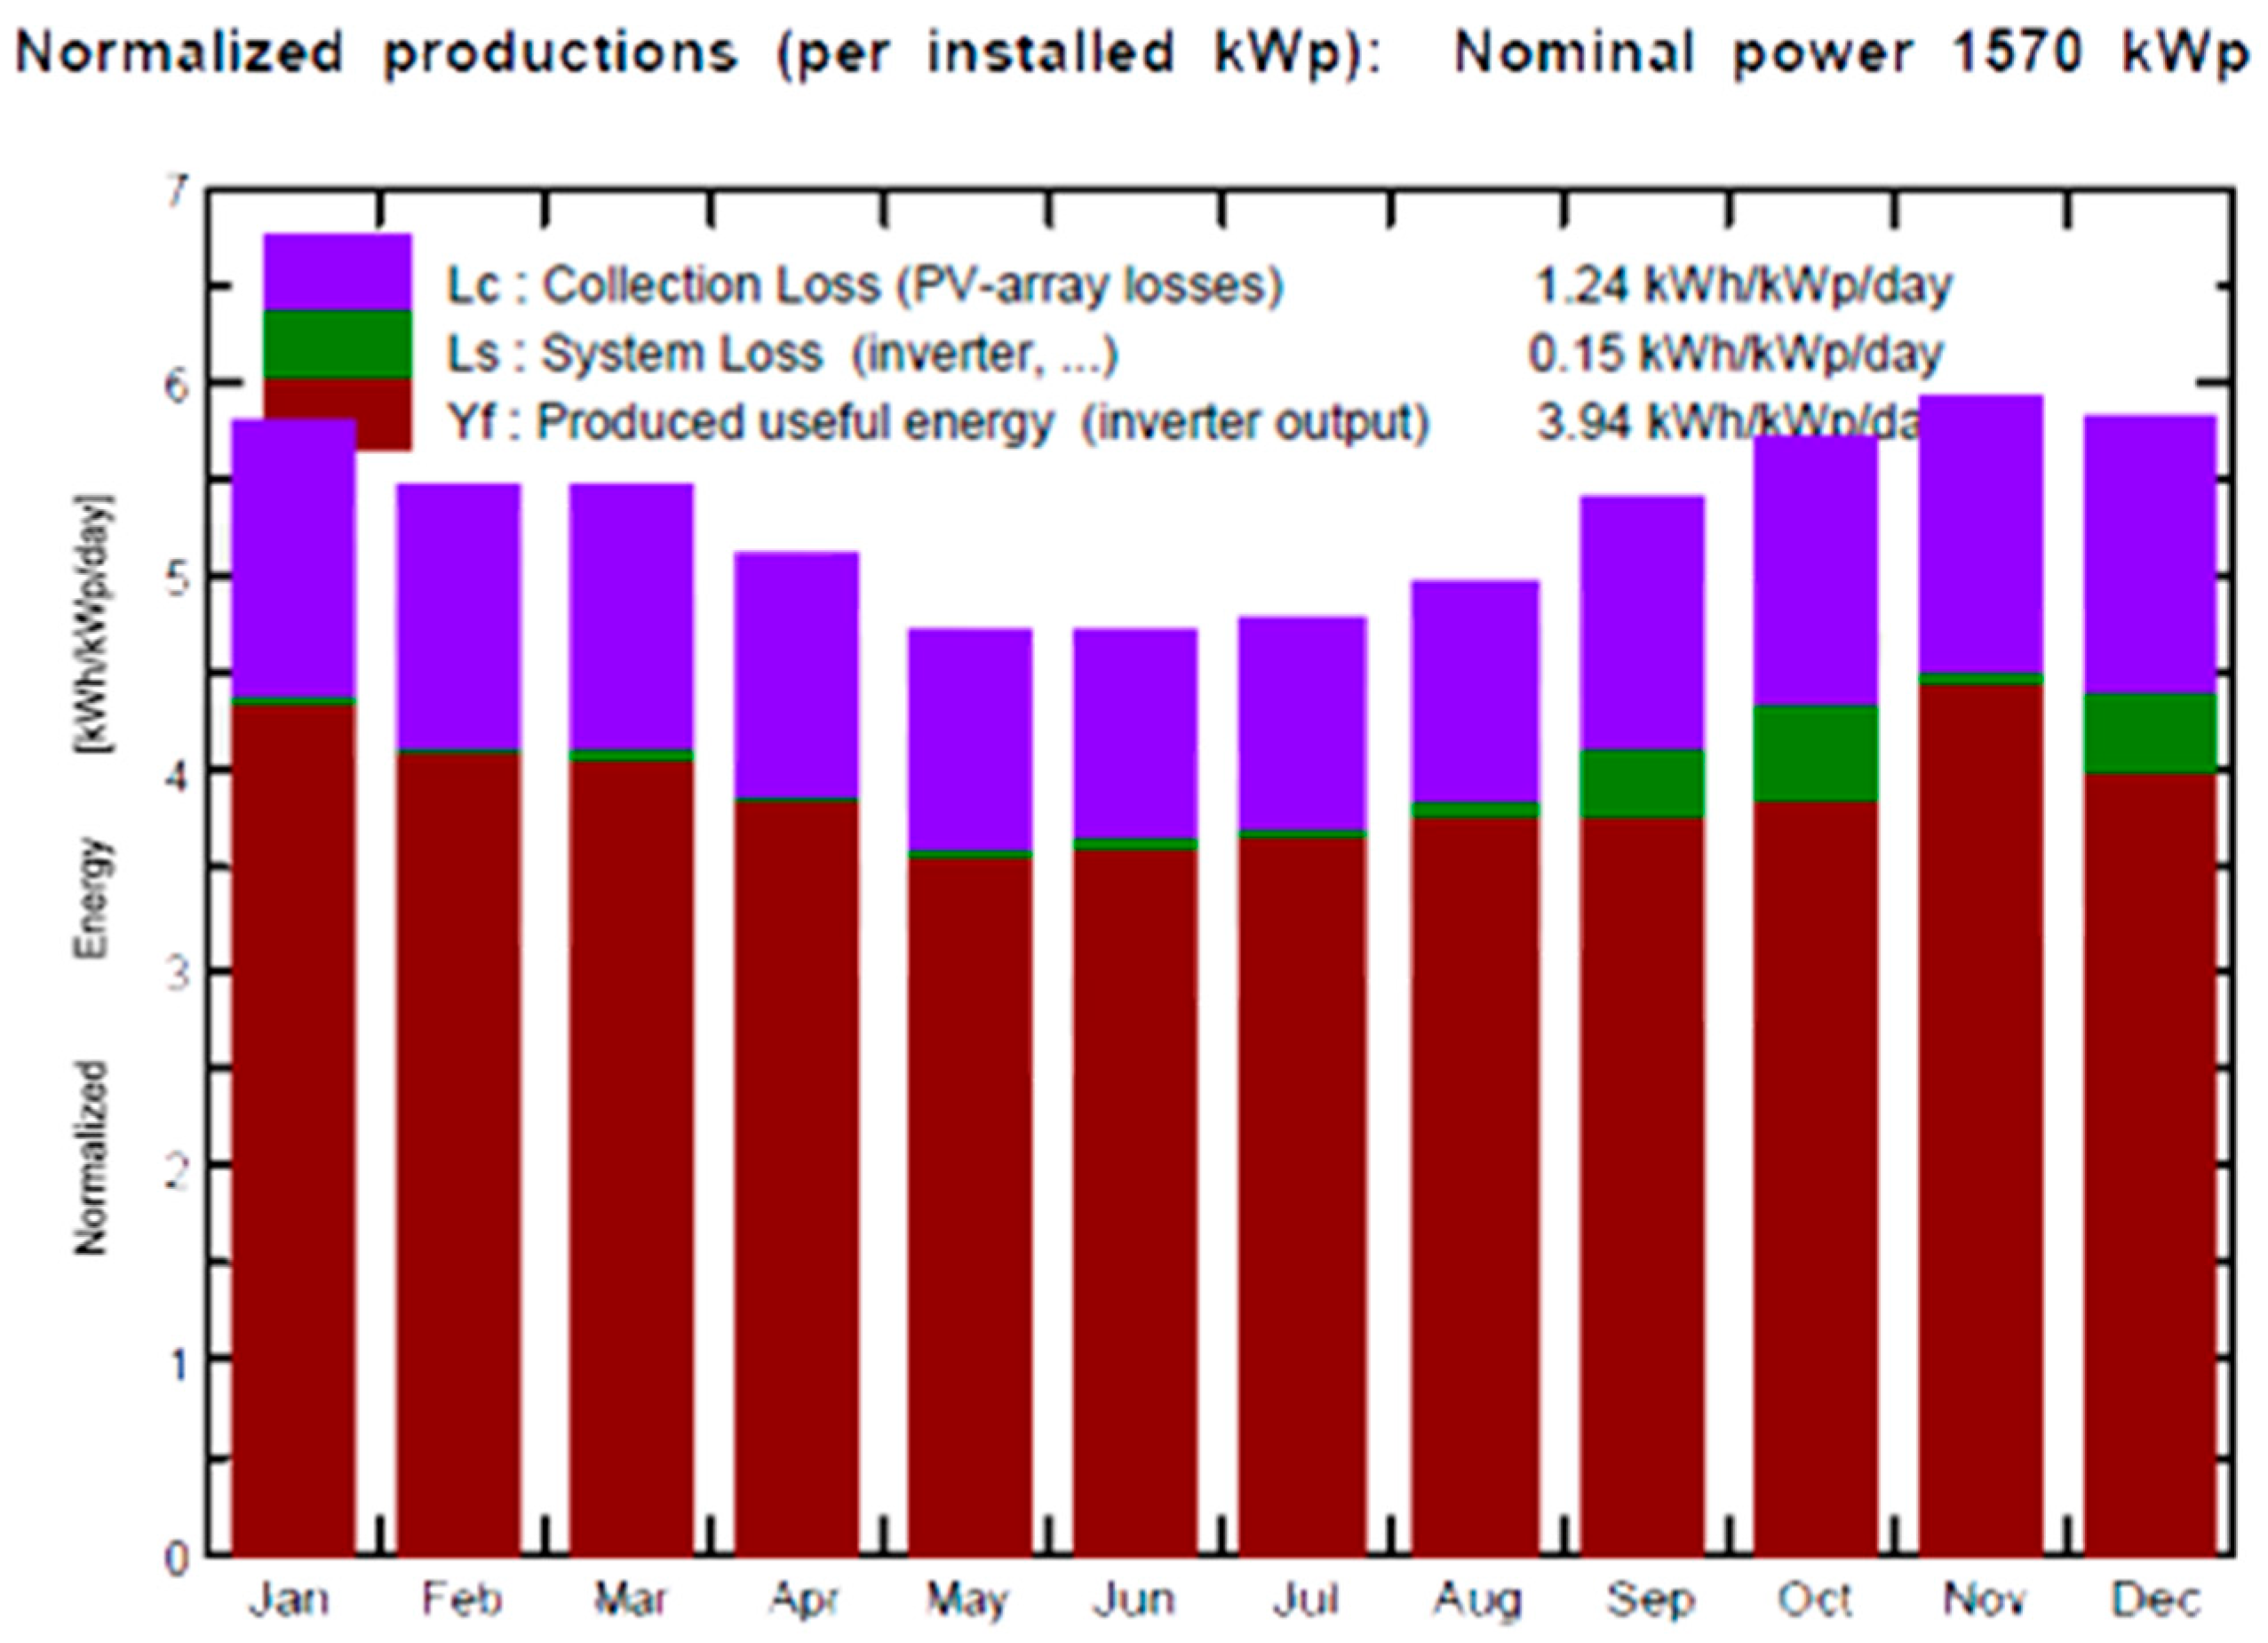
Figure 5 and Figure 6 below provide a visual representation of how energy production varies throughout the year for Scenarios B and C. Scenario C has a specific energy production of 1438 kWh/kWp/year, which is higher than Scenario A (1325 kWh/kWp/year) and Scenario B (1147 kWh/kWp/year). This means that Scenario C will produce more energy per kilowatt peak of installed capacity over the course of a year than Scenario A and Scenario B. The graphs show that in Scenario C, energy production is highest during summer and lowest in winter, just like in Scenarios A and B. However, Scenario C consistently outperforms Scenarios A and B throughout the year. This proves that energy production is highest during the summer when there is more sunlight and lower during winter when there is less sunlight.
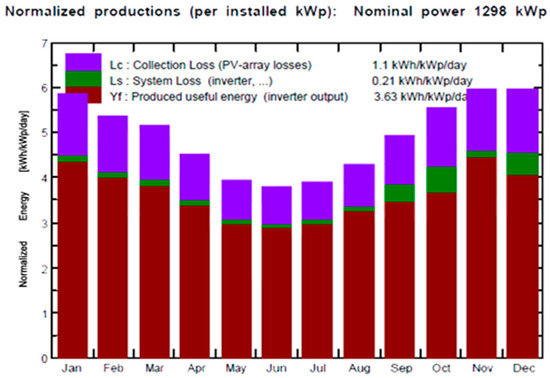
Figure 5.
Energy production for Scenario B.
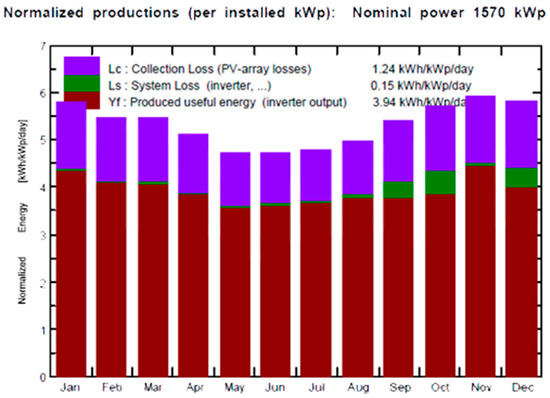
Figure 6.
Energy production for Scenario C.
For example, in June, the normalized production of energy for Scenario C was 1.438 kWh/kWp/day, while the normalized production of energy for Scenario A was 1.325 kWh/kWp/day, and the normalized production of energy for Scenario B was 1.147 kWh/kWp/day. This means that Scenario C produced 8.5% more energy than Scenario A and 25.7% more energy than Scenario B in June.
Therefore, the total energy production for Scenario C was calculated as follows:
Energy production = Normalized production of energy × Installed capacity
Energy production = 1.438 kWh/kWp/day × 1570 kWp × 365 days/year
Energy production = 2259 MWh/year
In summary Table 7 below highlights the performance ratio for all the scenarios.
Table 7.
Comparing energy production and performance ratio for both scenarios.
- Specific energy production: Scenario C has the highest specific energy production, meaning it will produce the highest energy per kilowatt peak of installed capacity. This is because Scenario C has a tilt angle of 15°, which is closer to the optimal tilt angle for solar panels in the Northern Hemisphere.
- Energy production: Scenario C has the highest energy production, producing the most energy overall. This is because Scenario C has the highest specific energy production and the same installed capacity as Scenarios A and B.
- Performance ratio: Scenario C has the second highest performance ratio, which means it is more efficient than Scenario B but less efficient than Scenario A. The lower performance ratio is likely because Scenario C has a lower tilt angle than Scenario A. Solar panels tend to have lower performance ratios at higher tilt angles. After all, they are more susceptible to shading and dust buildup.
Scenario C is the best PV system from this analysis because it has the highest specific energy production and the second highest performance ratio.
In addition to the above factors, other factors may need to be considered when selecting the best PV system for a particular application. These factors include the following:
- Cost: The cost of the PV system is an important consideration. Scenario C may be the best PV system based on the factors mentioned earlier, but it may also be the most expensive.
- Space: The amount of space available for a PV system is another critical consideration. A PV system with higher specific energy production may be the best option if limited space is available.
- Aesthetics: the appearance of the PV system may also be a consideration.
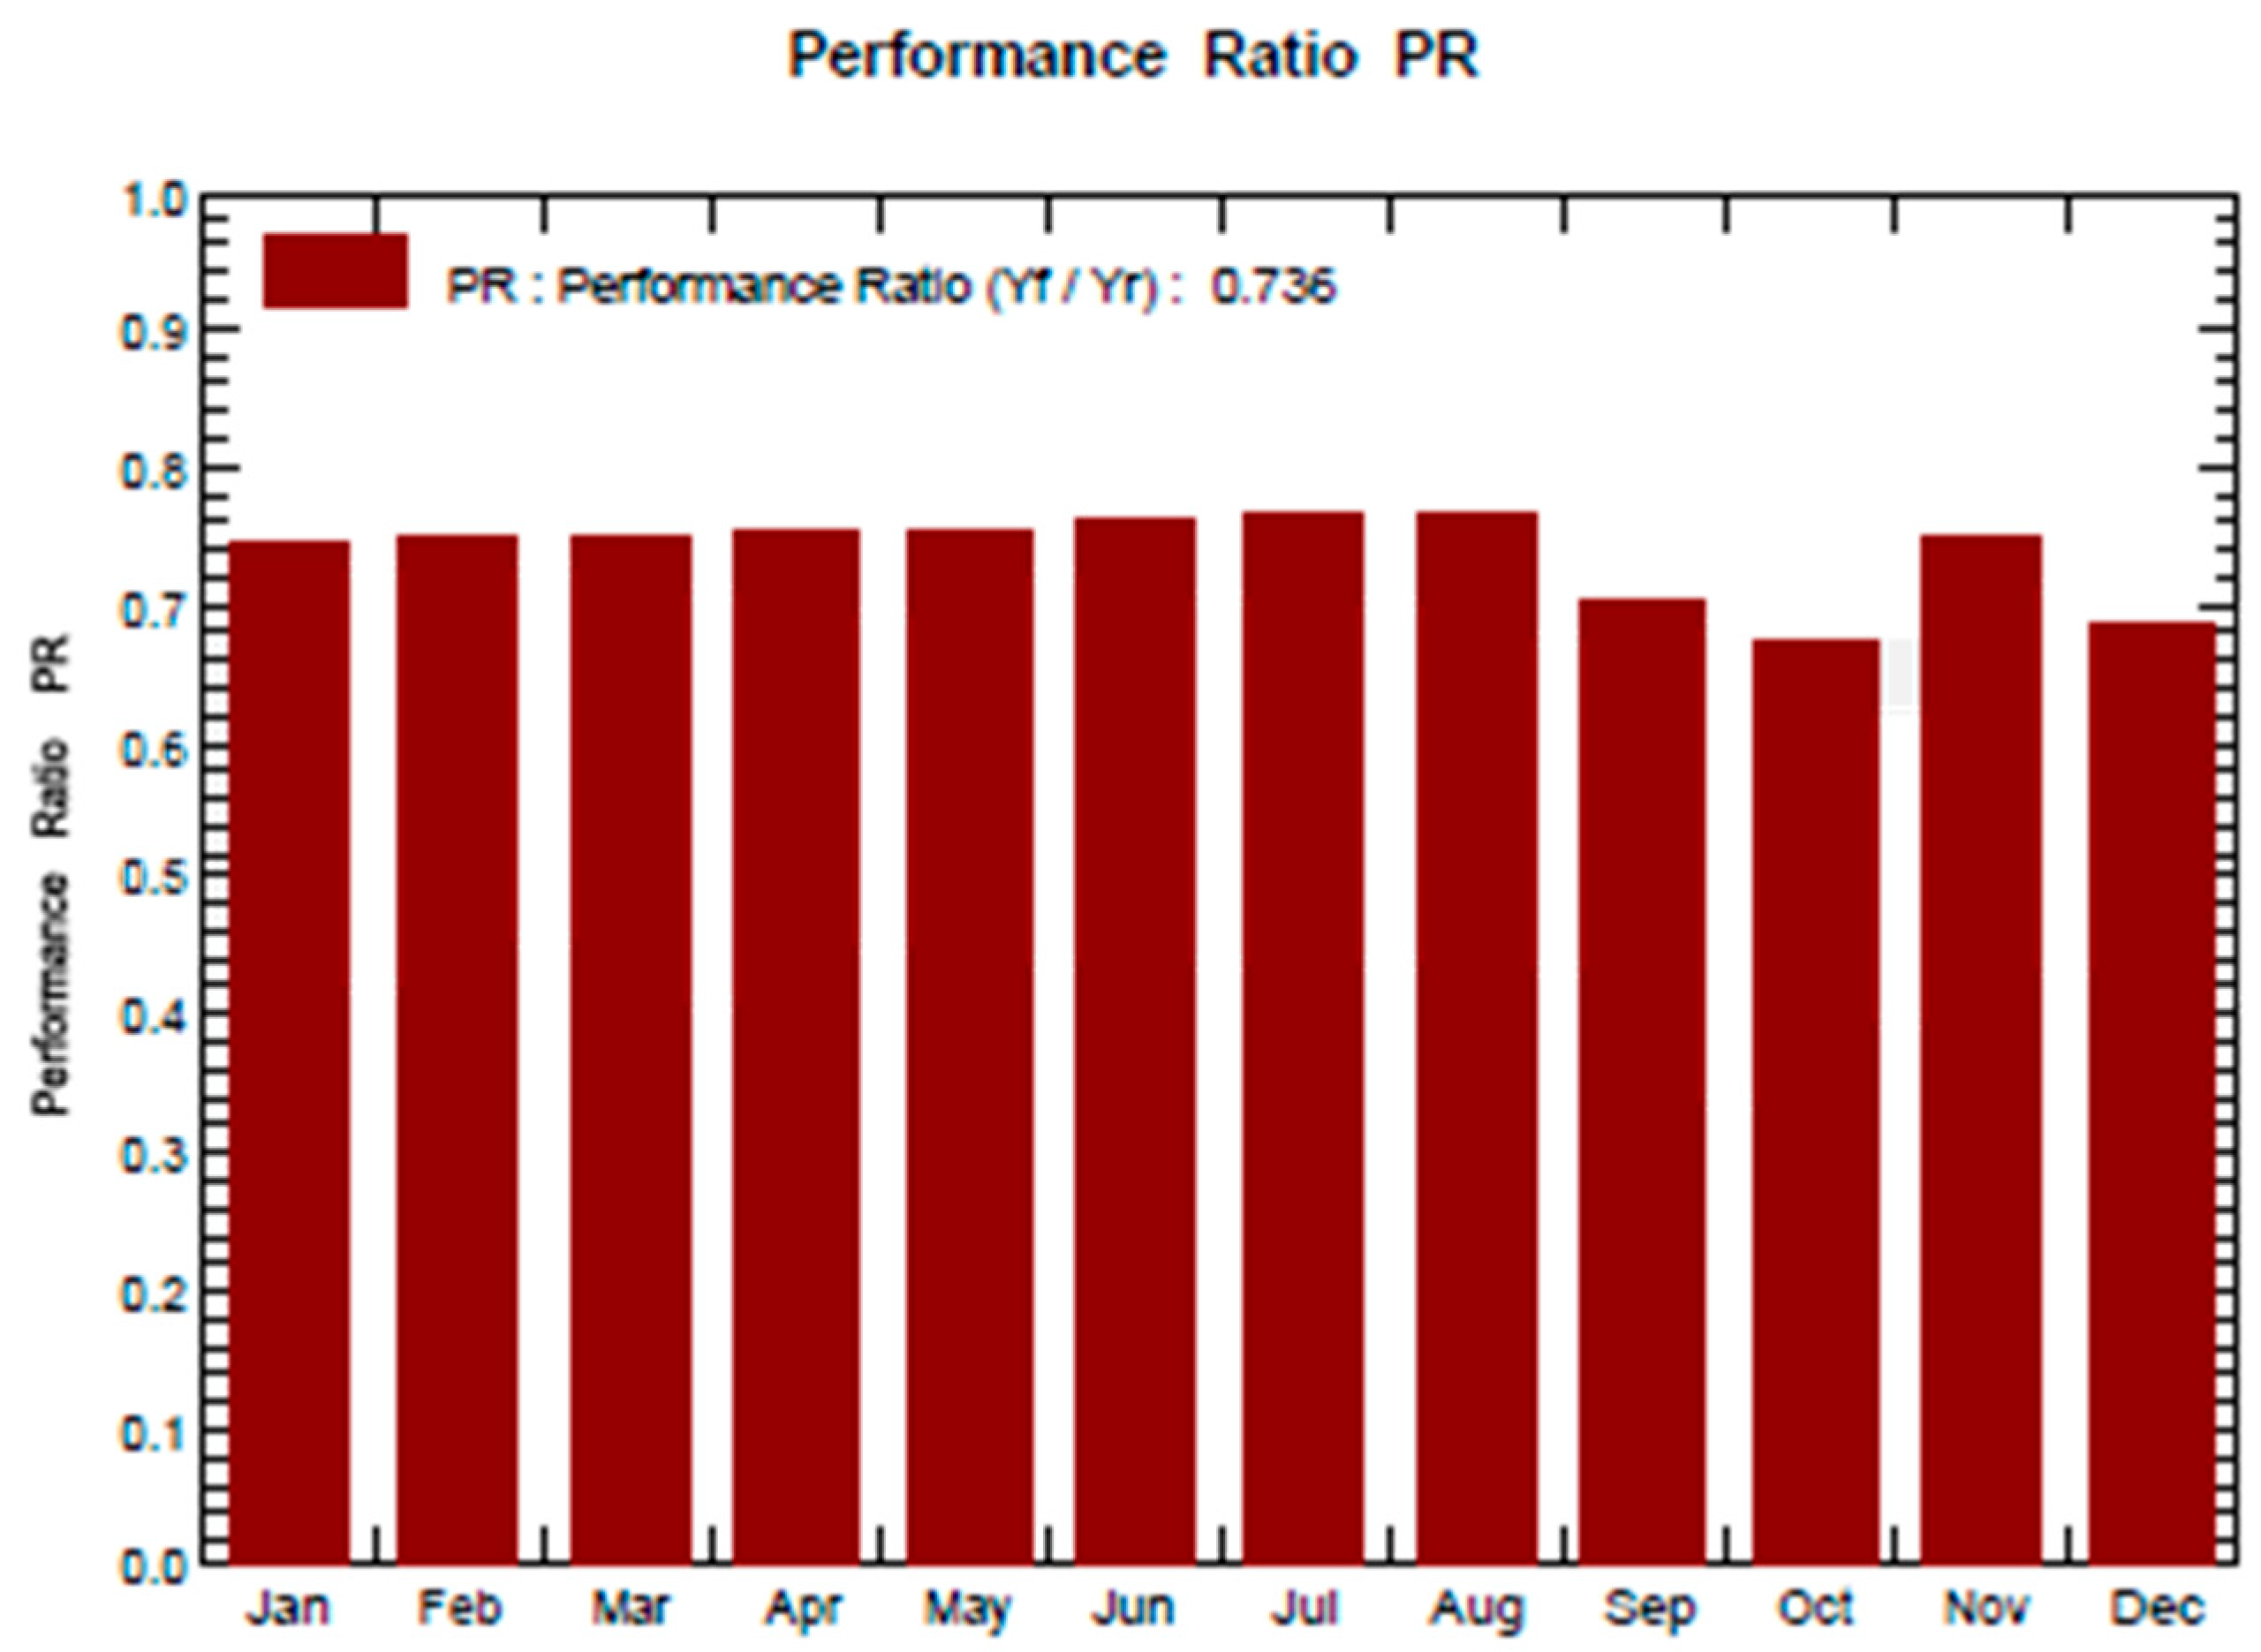
3.3. Performance Ratio
The performance ratio (PR) measures the efficiency of a PV system in converting sunlight into electrical energy [35]. It is explicitly defined as the ratio of the energy that is effectively produced to the energy that would be generated if the system operated continuously under its standard operational conditions. The PR is expressed as a percentage and is calculated by dividing the actual energy production by the expected energy production.
The PR values of the three simulated scenarios are as follows:
- Scenario A: 73.6%
- Scenario B: 73%
- Scenario C: 75%
Scenario C had the highest PR, indicating it was the most efficient of the three systems.
This is likely due to the fact that Scenario C has a tilt angle of 15 degrees, which is closer to the optimal tilt angle for solar panels. The higher the PR, the more efficient the PV system.
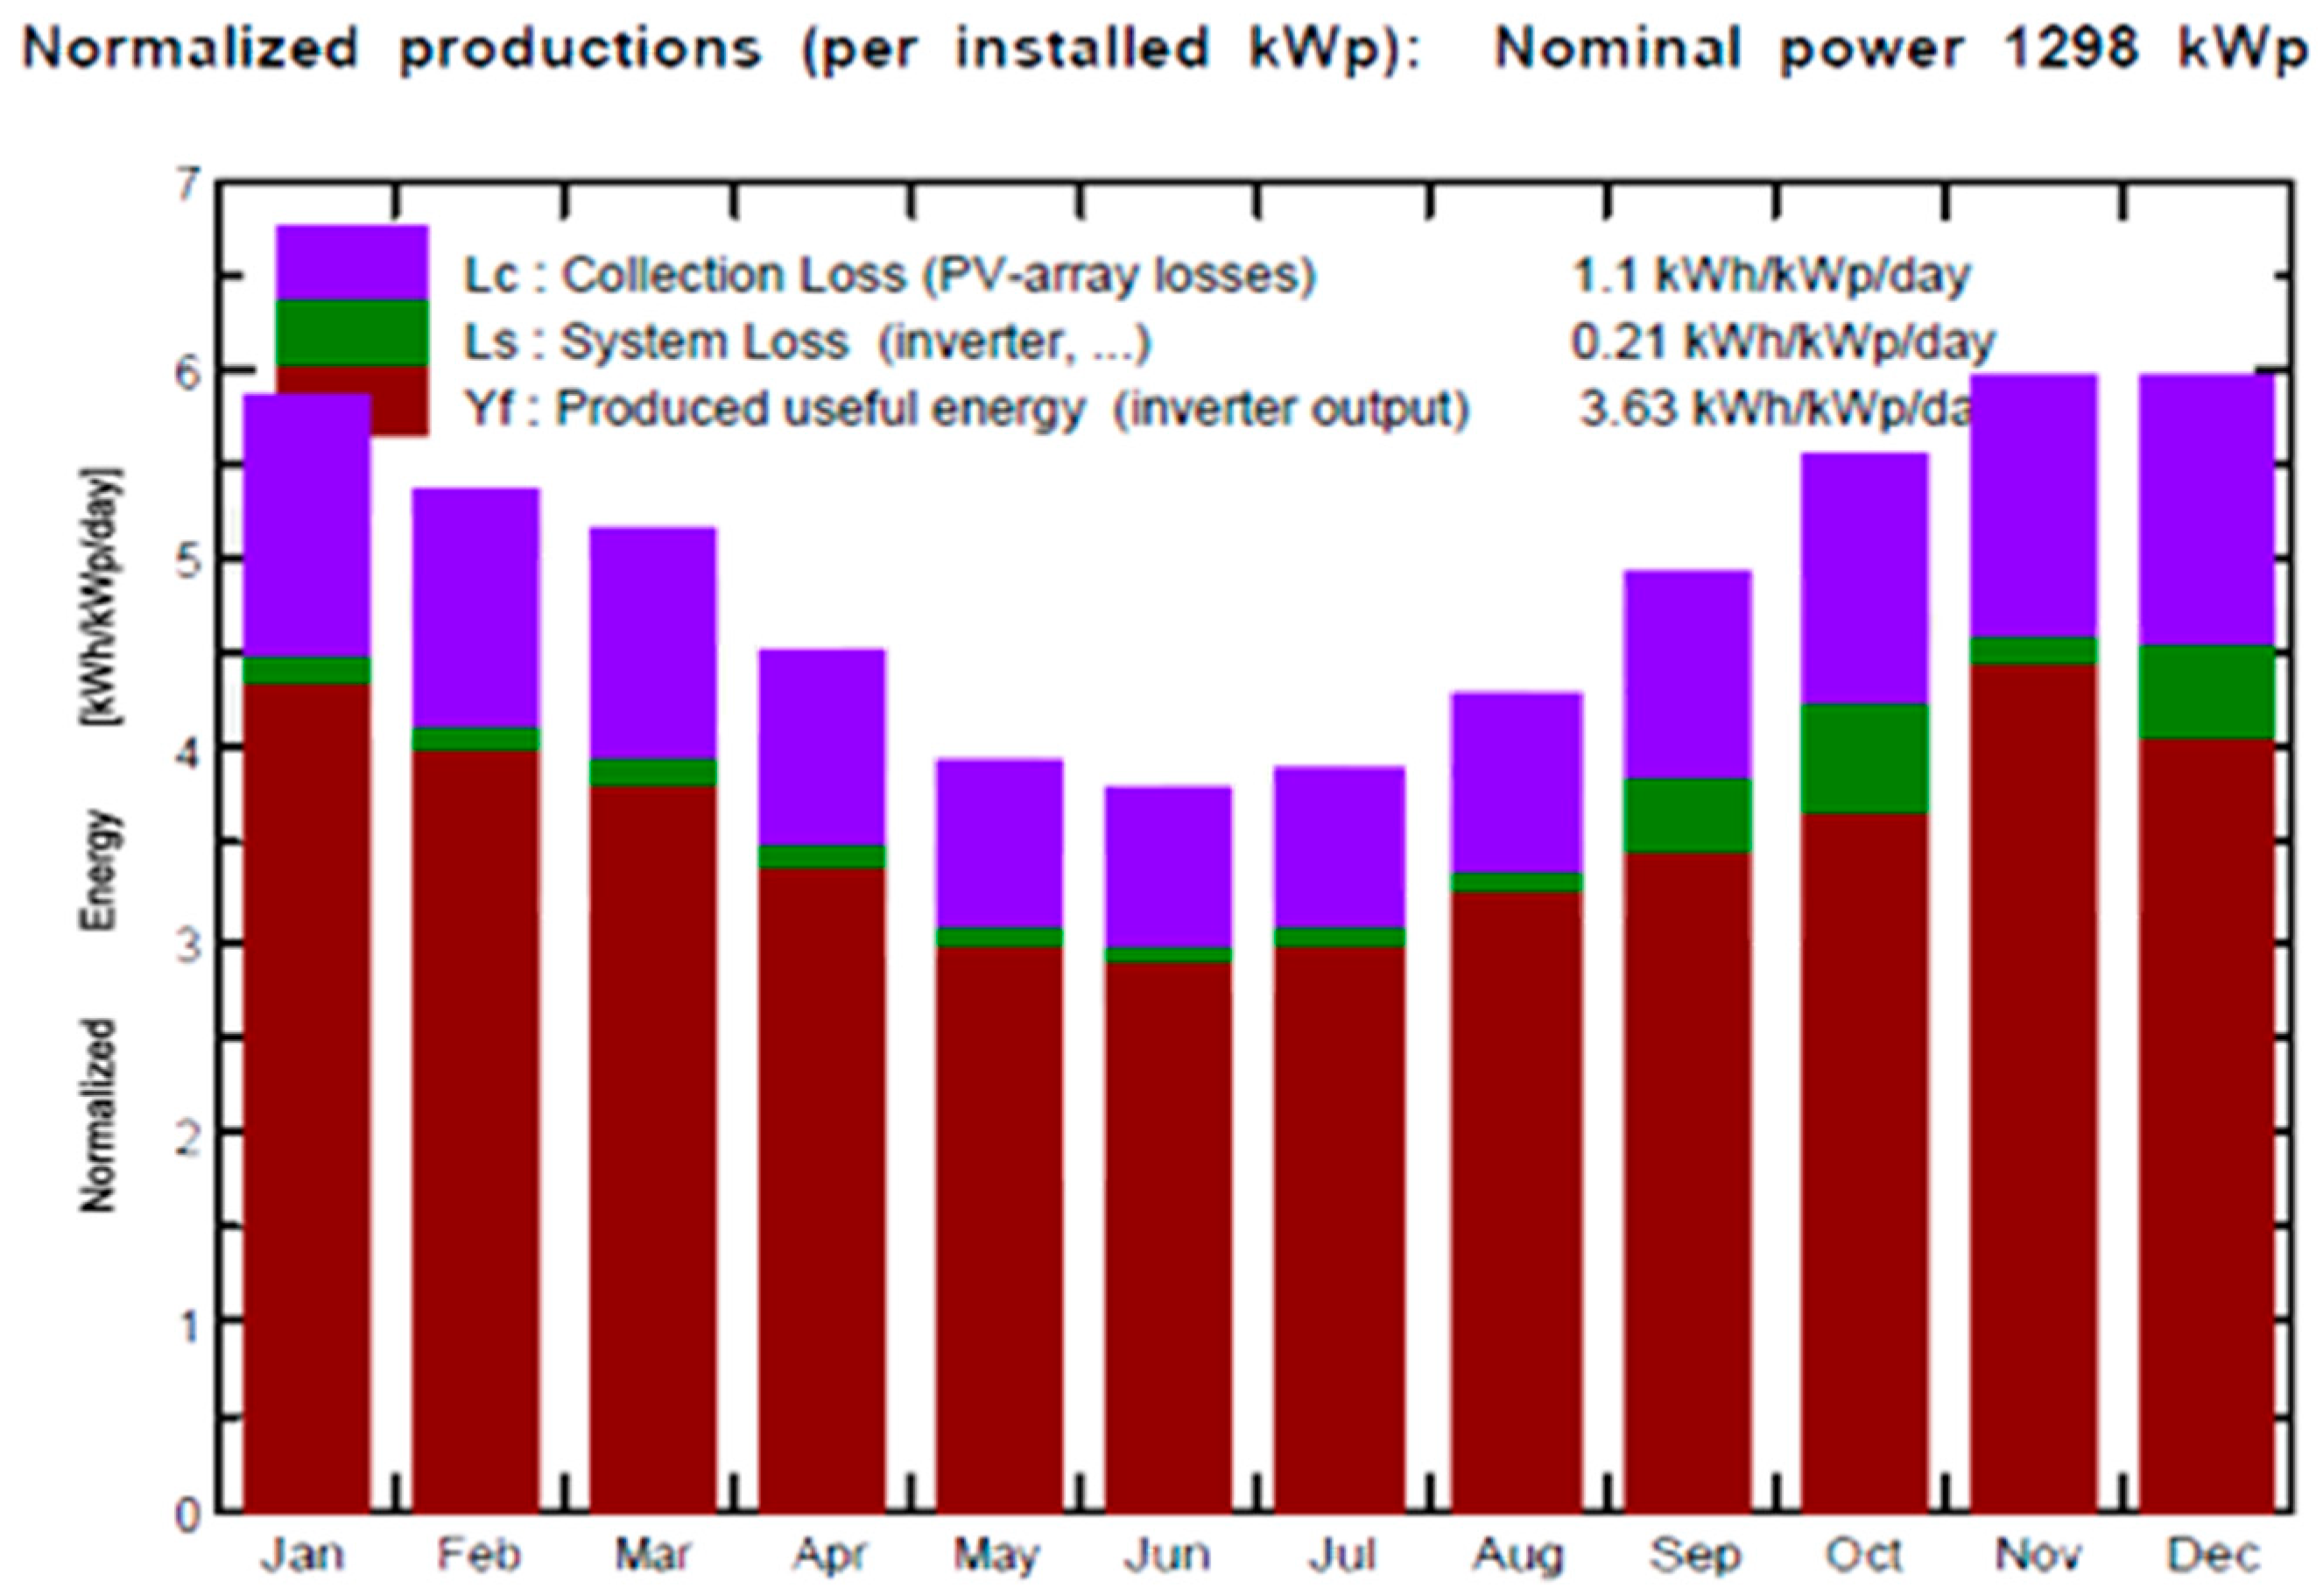
The Figure 7 below illustrates the energy production per kilowatt-peak (kWp) of installed capacity, normalized for Scenario A, with a specific energy production of 1325 kWh/kWp/year and a PR of 73.6%.
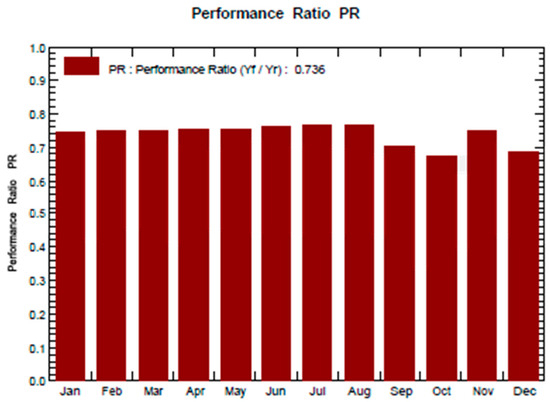
Figure 7.
Normalized production and PR for Scenario A.
This means that the PV system will produce 1325 kilowatt-hours of energy per kilowatt peak of installed capacity over the course of a year. A PV system’s performance ratio (PR) measures its efficiency; therefore, the PV system in Scenario A has higher efficiency, which means that the system has a higher output. The higher the PR, the better the system’s performance.
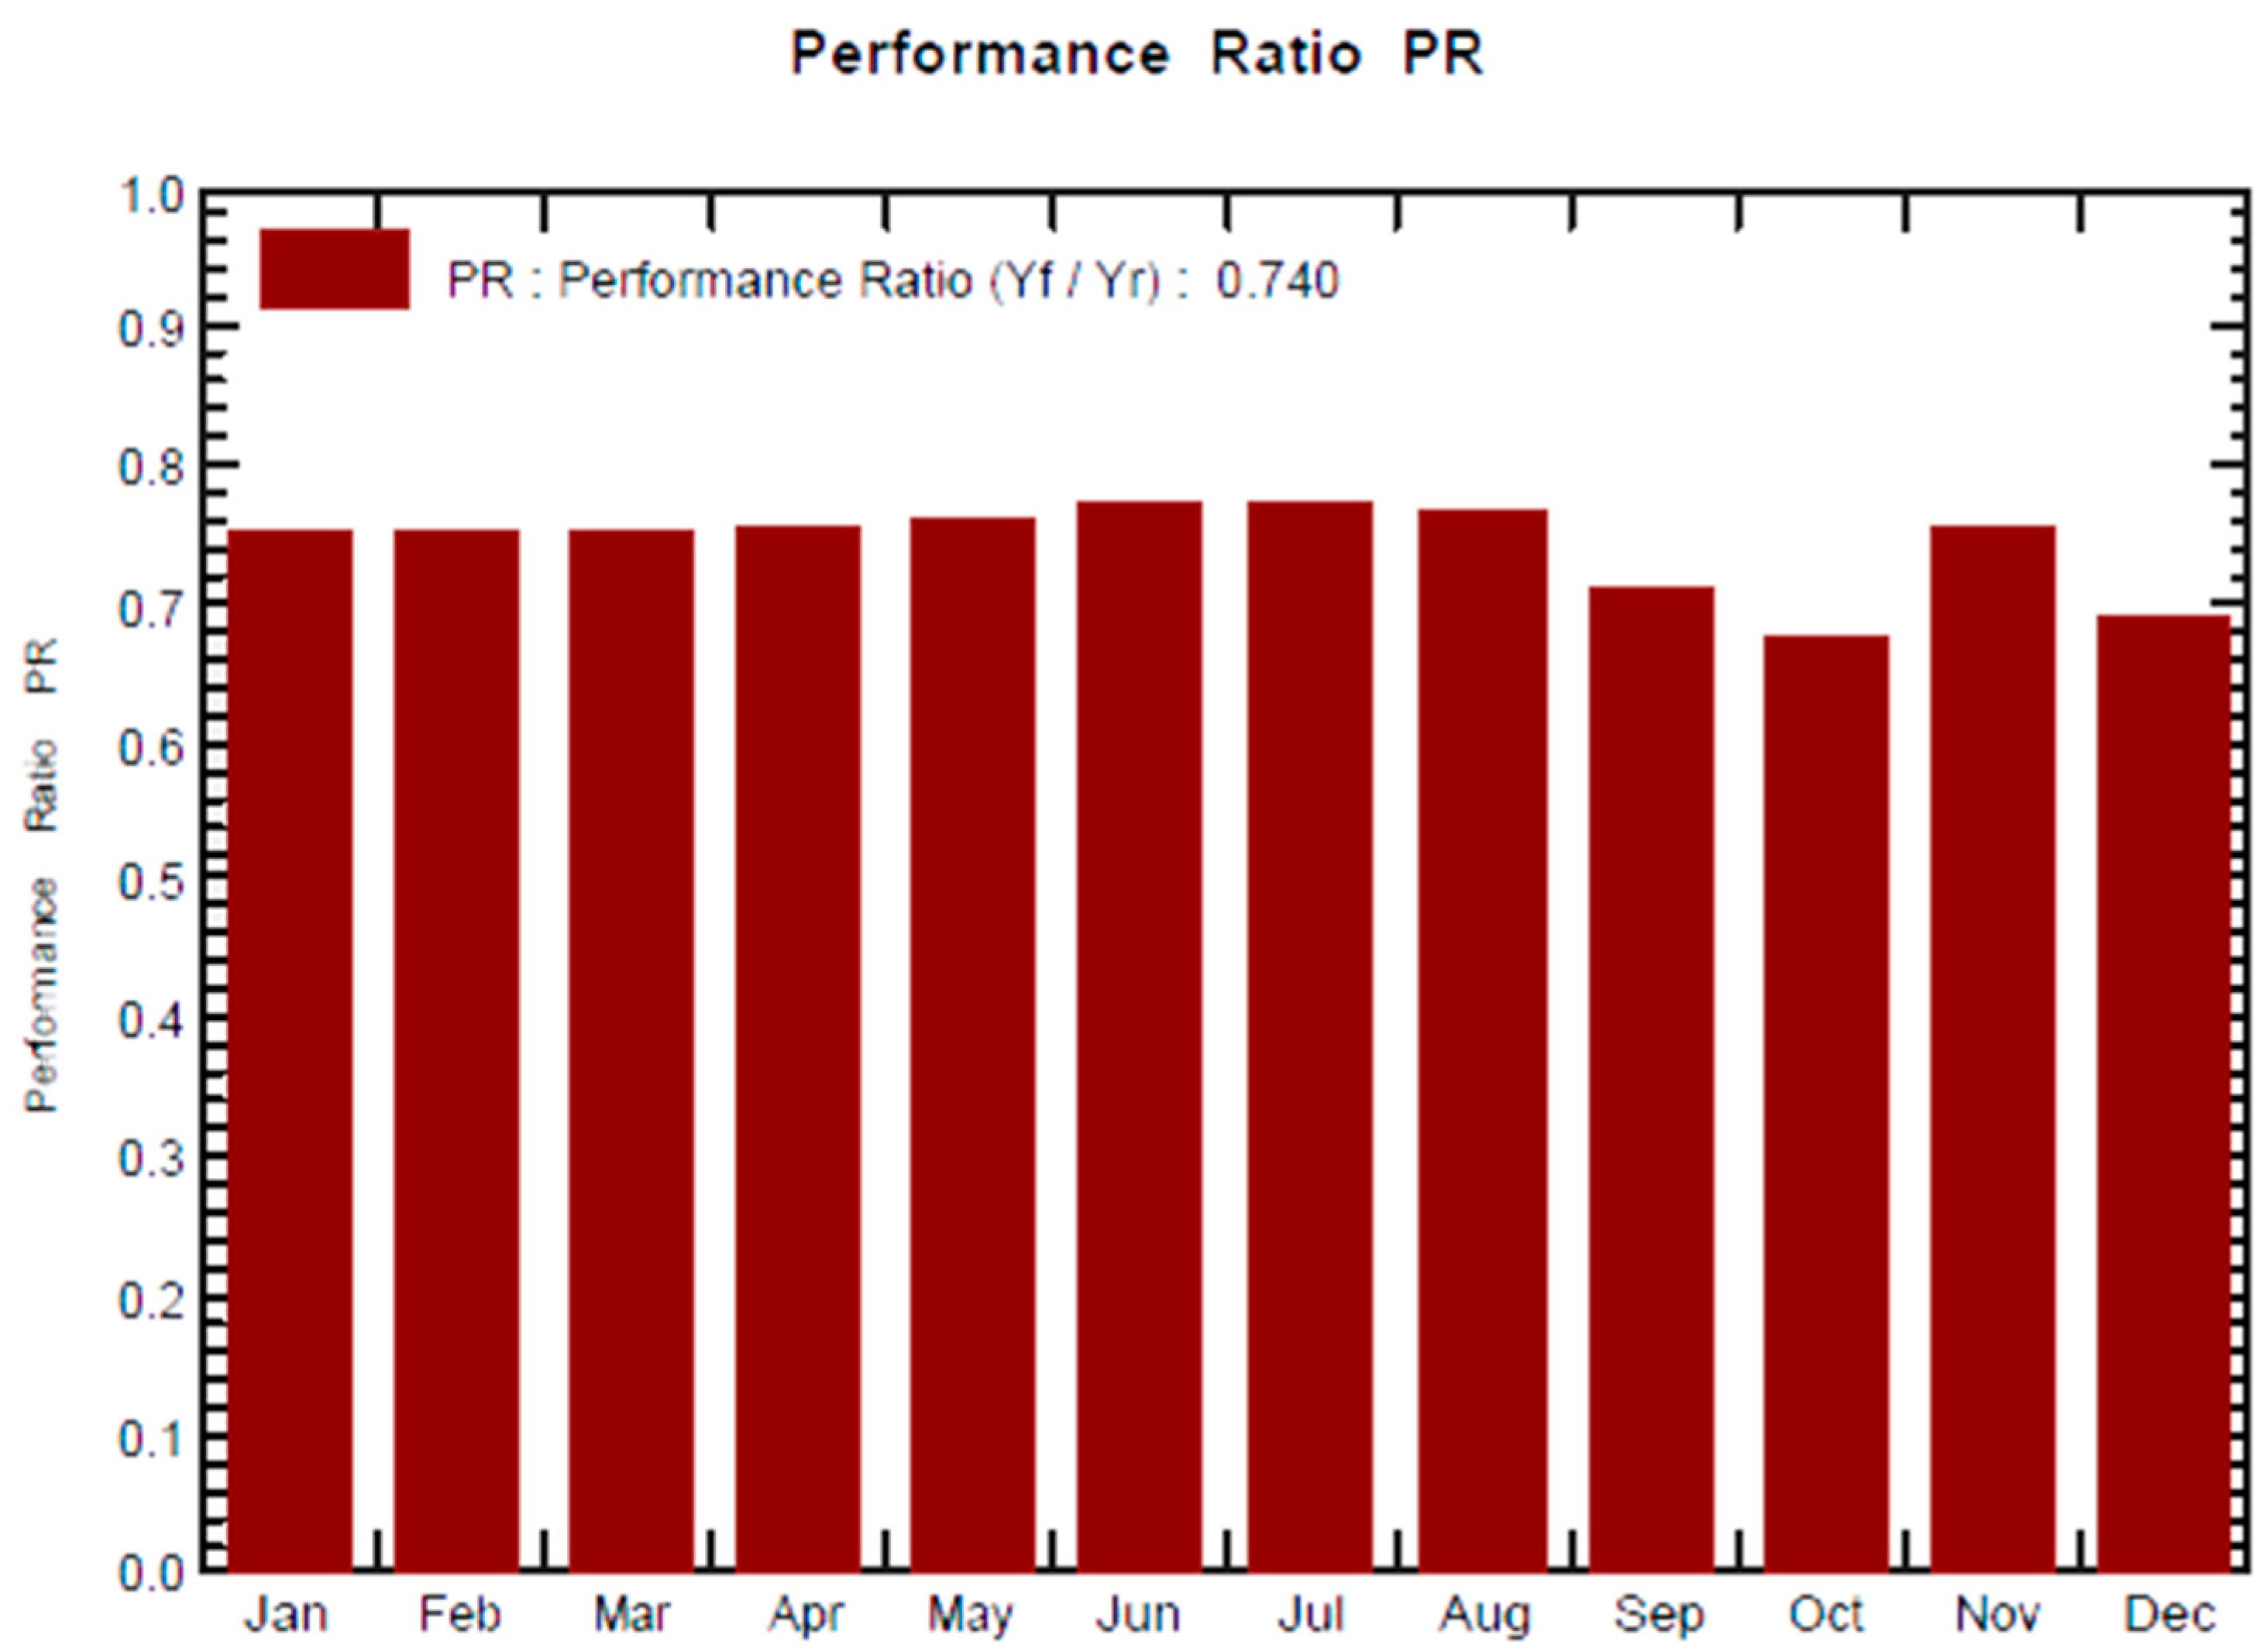
Scenario C had the highest PR, followed by Scenarios A and B as shown on Figure 8 below. This indicates that Scenario C is the most efficient of the three systems. Scenario C’s high PR suggests an efficient PV system, likely due to its 15-degree tilt angle, which is close to the Northern Hemisphere’s optimal angle for solar panels. A high-quality inverter furthers system efficiency.
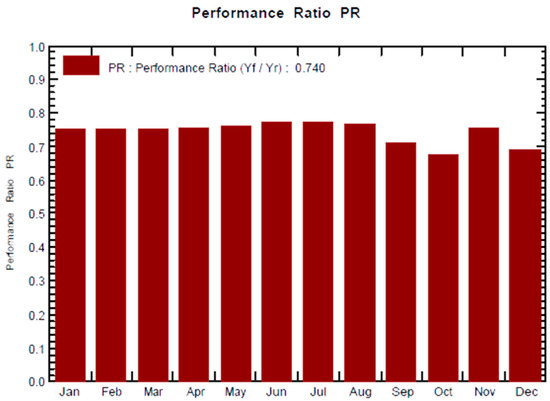
Figure 8.
Performance ratio for Scenario C.
The PR of a PV system is affected by several factors, including the following:
- Tilt angle: The tilt angle of the solar panels is an essential factor in determining the PR. The optimal tilt angle for solar panels in the Northern Hemisphere is typically between 30 and 45 degrees. Solar panels tilted at the optimal angle will receive the most sunlight throughout the year, leading to a higher PR.
- Shading: if trees or other objects shade the solar panels, sunlight will be reduced, leading to a lower PR.
- Dust buildup: if the solar panels are covered in dust, this will reduce their sunlight and lead to a lower PR.
- Type of solar panels: The type used will also affect the PR. Some types of solar panels are more efficient than others.
- The efficiency of the inverter: The inverter, which serves as the key device, is responsible for converting the DC electricity produced by solar panels into AC electricity, thereby making it compatible with household appliances and electronic devices for practical usage. The efficiency of the inverter will also affect the PR
Generally, a higher PR indicates a more efficient PV system. Nevertheless, it is essential to understand that PR is only one factor when selecting a PV system. Other aspects, such as cost, space requirements, and aesthetics, should also be considered in the decision.
3.4. Evaluating and Choosing the Best PV System
To fulfil the aim of this study and design and optimize renewable energy technology, after performing the simulation for the scenarios, we had to choose the best system for the grid, the energy output, performance, energy production, and efficiency of which were analyzed, showing that the three systems had different outputs.
Scenario C is the best PV system among the three scenarios.
Scenario C has the highest specific energy production, total energy production, and performance ratio. Combining a lower tilt angle (15°) and efficient energy conversion led to superior performance.
Scenario B has the lowest specific energy production and performance ratio, suggesting that a 45-degree tilt angle may not be optimal for this location.
Scenario C, with a 15-degree tilt angle, is the best PV system among the three scenarios, as it maximizes energy production and system efficiency.
Scenario A falls in the middle regarding the specific energy production and performance ratio. However, it is essential to consider other factors, such as cost, local climate conditions, and maintenance requirements, when making a final decision for real-world applications.
In Table 8, as displayed above, you can find a detailed listing of the necessary quantity of PV modules for each system. In terms of cost, Scenario B is the most expensive, as it requires the most PV modules. Scenario A is the least expensive because it requires the fewest PV modules. Scenario C falls between these two scenarios. Considering energy production, efficiency, the number of modules required, performance ratio, and maintenance, Scenario A has the best PV system. It requires fewer PV modules than other systems, thus reducing costs (the most crucial issue) but still producing the same amount of energy. The installation cost is a significant concern; hence, Scenario A will be installed.
Table 8.
Number of PV modules in the systems.
In conclusion, Scenario A is the optimal PV system; it has fewer modules, reduced costs and generates the same amount of energy, making it the best choice for installation due to critical capital concerns.
3.5. Economical and Environmental Analysis
The design of PV systems heavily relies on economic and environmental analyses. These analyses form a framework that helps assess and evaluate the feasibility and effectiveness of installing such systems by considering several key factors. Economic and environmental analyses are crucial in designing PV systems as they provide the necessary insights and information to make informed decisions about whether the goal is to save money, decrease environmental impact, or satisfy sustainability objectives [38]. Following the successful completion of the design, thorough simulation, and confirmation of the viability, the next crucial step is conducting an in-depth assessment of the economic feasibility of the installation.
Economic and environmental analyses are vital for the design of photovoltaic (PV) systems for multiple reasons. A cost–benefit analysis is an economic analysis that helps determine the financial feasibility of installing a PV system. It considers initial setup costs, operational expenses, and potential revenue or savings from the system as shown on the Table 9 below. This analysis allows individuals and organizations to make informed decisions about whether to invest in a PV system that is financially viable.
Table 9.
Cost breakdown for the system.
- Return on investment (ROI): By assessing the economic viability of a PV system, stakeholders can calculate their expected ROI. This helps them understand how long it will take to recoup their initial investment and generate profits or savings. A positive ROI is a key driver for the adoption of PV systems.
- Environmental impact assessment: Environmental analysis assesses the ecological footprint of a photovoltaic (PV) system. It evaluates factors such as carbon emissions reduction, reduced dependence on fossil fuels, and overall environmental benefits. This information is vital for individuals and organizations interested in reducing their environmental impact and contributing to sustainability goals.
- Life cycle assessment: Environmental analysis can include the PV system’s life-cycle assessment (LCA). This assesses the ecological consequences of PV panel production on disposal, considering resource extraction, manufacturing, transportation, and end-of-life disposal. This holistic view helps us understand these systems’ long-term environmental implications.
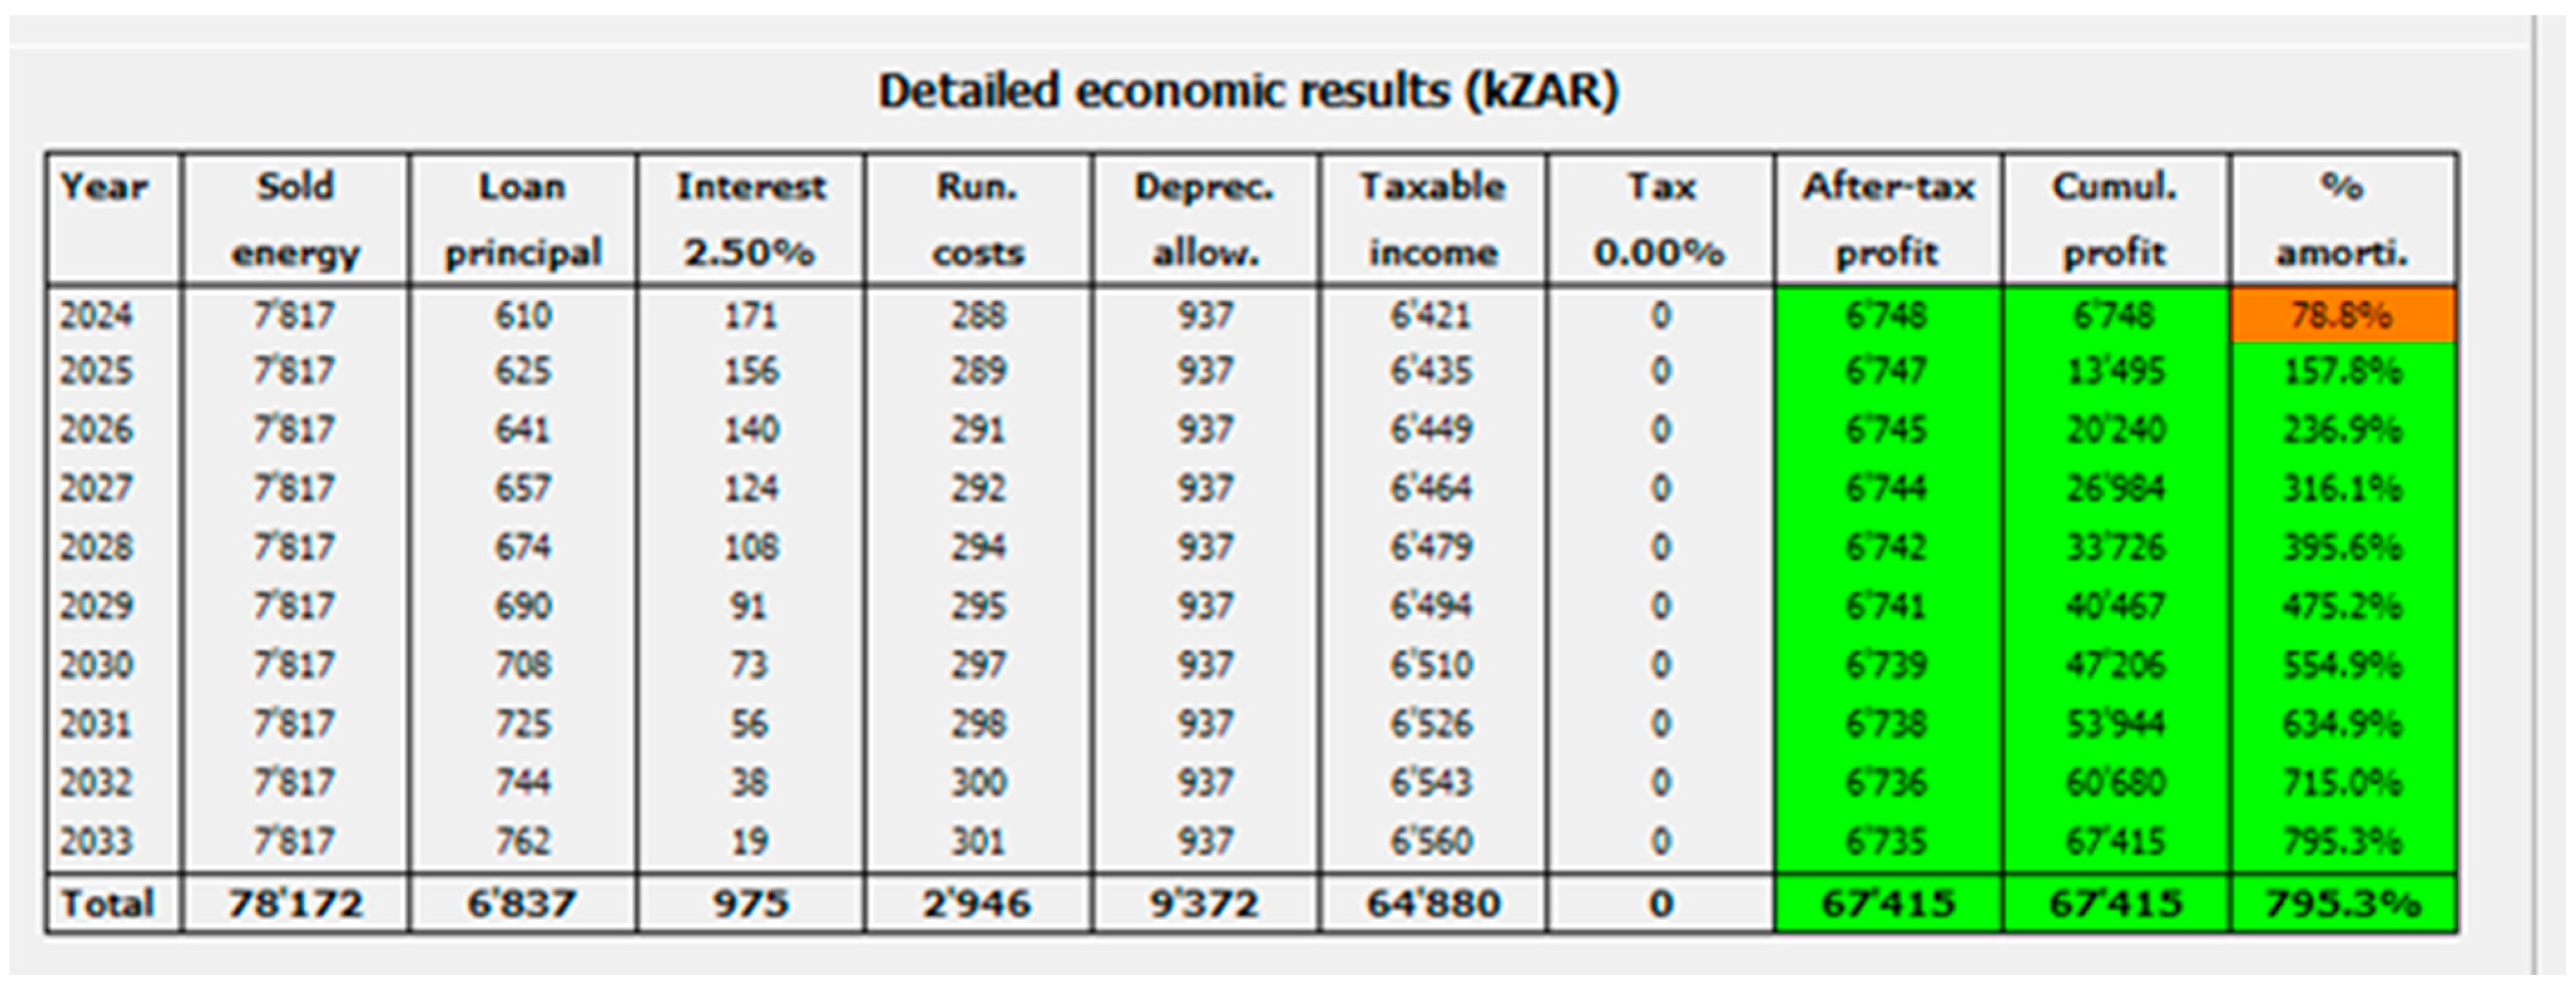
Removing taxes and subsidies of about ZAR 35,000, the Net Investment (CAPEX) is ZAR 9,336,500.00. This means that approximately ZAR 10 million are required for this investment. The Figure 9 below outlines the detailed economic results of the system.The investment will be funded through a combination of equity investment, a bank loan, and government incentives, with the total investment amounting to ZAR 10 million, as shown below.
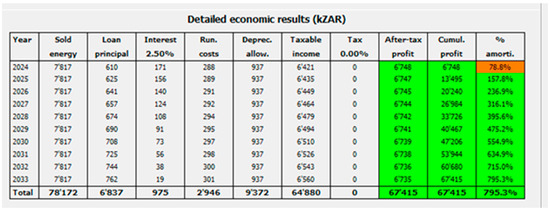
Figure 9.
Detailed economic results for the system.
Based on the economic evaluation, the PV system in Scenario A is a viable investment. The system has a payback period of 11.8 years and is expected to generate positive net income annually. As shown in the table from 2023–2033, there will be an increase in profits from the system. Cash flow was calculated based on the rate from the government, and the green side of the table shows profits from 2024 onwards, starting at 79%, which is the best investment. The investment cost is less than the cumulative profit, so positive values result in annual profits from the PV system. The return on investment is already positive as of 2024, which means that the payback period for the system is about 1.3 years, with a percentage of 695% of the capital in 20 years of service. The table also shows that profit from the system is expected to increase over time. This is because the system’s operating costs are relatively low, and the price of electricity is expected to rise over time.
3.6. Environmental Analysis
The environmental impact of a photovoltaic (PV) system refers to its effects on the environment throughout its life cycle, from its development and installation to its operation and disposal. PV systems have a generally favorable environmental impact due to their role in decreasing greenhouse gas emissions and supporting clean energy generation. PV systems do not produce any greenhouse gas emissions or air pollution during operation. The land footprint necessary for a PV system remains relatively compact compared with other energy generation methods, particularly when compared with large-scale coal-fired power plants. The details for this can be further seen in the Appendix.
This section thoroughly analyzes a grid-connected PV system from a techno-economic standpoint and evaluates its environmental impact. The results indicate that a grid connection using Scenario A is viable and demonstrates renewable energy sources’ superiority over traditional coal-fired power stations regarding sustainability. Furthermore, the analysis demonstrated that renewable energy sources are a more sustainable alternative to traditional coal-fired power stations.
4. Conclusions and Recommendations
4.1. Conclusions
The previous section analyzed the results of the designed PV system. This study explored the feasibility and optimization of new energy technologies, specifically focusing on grid-connected photovoltaic (PV) systems, using PV Syst as a software tool for design and analysis. This research revealed several significant findings and insights that will contribute to the broader goal of sustainable development.
New energy technologies play vital roles in sustainable development [40]. They offer the potential to reduce greenhouse gas emissions, improve energy security, and create jobs. However, it is essential to carefully assess the feasibility and optimize the deployment of new energy technologies to ensure they are truly sustainable.
This study presents a feasibility analysis and optimization of new energy technologies for sustainable development. After an extensive literature review and identifying research gaps, this research focused on grid-connected photovoltaic systems, one of the most promising renewable energy technologies. This study aimed to evaluate the techno-economic feasibility of a grid-connected photovoltaic system. Our research also highlights the importance of adopting renewable energy sources in the fight against climate change and reducing greenhouse gas emissions. Using renewable energy sources such as solar, wind, and hydropower can significantly reduce our reliance on fossil fuels, which will be essential to reduce environmental impact and actively contribute to mitigating the adverse effects of climate change.
The authors developed a methodology for designing and optimizing grid-connected PV systems using PV Syst software. This methodology was applied to a case study of a PV system in Lephalale, South Africa. The designed and simulated grid-connected PV system using the PV Syst software has proven an effective solution for sustainable energy production. Analysis of grid-connected PV systems has demonstrated the potential of solar energy as a viable and sustainable energy source. A detailed feasibility study, including site selection, energy production estimates, and economic analysis, provides a comprehensive view of the benefits and challenges associated with such systems.
Additionally, this study emphasizes the significance of considering environmental impacts and local regulatory frameworks to ensure the sustainability of PV projects. By incorporating such considerations into the analysis, we are better equipped to meet the long-term energy needs of communities while minimizing their ecological footprints. Overall, the findings of this thesis suggest that grid-connected PV systems are a feasible and sustainable option for meeting the energy needs of South Africa. This is linked to SDG 7, which refers to access to affordable and reliable energy sources. Therefore, grid-connected PV systems can help achieve SDG 7 in several ways. They can provide access to electricity for people without electricity, particularly in rural and remote areas. PV systems can reduce electricity costs, making electricity affordable to everyone.
4.2. Recommendations
This study demonstrates that PV systems are technically and economically feasible and can substantially impact sustainable development in South Africa. Based on the findings and analysis presented in this thesis, several recommendations can be made for future research in the field of sustainable energy development:
- Further research and development
We should continue research on emerging energy technologies and stay updated with advancements in PV technology. Integrating energy storage solutions, such as batteries, has been explored to enhance system reliability; an improvement of this integration should be looked at.
- 2.
- Economic incentives and policy support
We should advocate for implementing government incentives and policies that promote adoption of renewable energy. Governments and policy makers should support developing and deploying new energy technologies such as grid-connected PV systems. This can be achieved through financial incentives, tax breaks, or other policy measures.
- 3.
- Community education:
We should develop educational programs and community outreach initiatives to raise awareness of the benefits of solar energy. A well-informed public member will likely support and invest in sustainable energy solutions.
- 4.
- Environmental impact mitigation
We should invest in the research and development of technologies and practices to minimize the environmental impact of PV systems, such as recycling and sustainable end-of-life management of solar panels. Investors should consider investing in new energy technologies such as grid-connected PV systems. These technologies have the potential to generate attractive returns and contribute to sustainable development.
- 5.
- Continuous monitoring and maintenance
Regular monitoring and maintenance of PV systems to ensure they operate at peak efficiency should be emphasized. This includes cleaning, equipment inspection, and software updates.
- 6.
- More research and collaboration
Collaboration should be encouraged among academia, industry, and the government to share knowledge, best practices, and data to improve PV technology and the adoption of sustainable energy. Therefore, researchers should continue developing and improving new energy technologies. This includes developing more efficient and cost-effective PV systems and new energy storage technologies.
Overall, the findings of this thesis suggest that grid-connected PV systems are a feasible and sustainable option for meeting South Africa’s energy needs. By implementing the recommendations above, the government, investors, and community can work together to develop and deploy a successful PV system that will benefit all.
Therefore, by implementing these recommendations, we can work towards a future where sustainable energy technologies, such as grid-connected PV systems, play a central role in achieving our environmental and economic goals. The journey towards sustainable development is ongoing, requiring collective efforts and ongoing research to realize its full potential.
Author Contributions
Conceptualization, H.K. and R.P.; methodology, O.A.O.; software, H.K.; validation, R.P. and O.A.O.; analysis, H.K.; writing—original draft preparation, H.K.; review and editing, O.A.O. and R.P.; supervision, O.A.O.; funding acquisition, O.A.O. All authors have read and agreed to the published version of the manuscript.
Funding
This research received no external funding.
Data Availability Statement
All data used in this study are openly available and have been appropriately referenced.
Acknowledgments
The authors appreciate the support of the Durban University of Technology under the Postgraduate RFA–Energy Research Scholarship.
Conflicts of Interest
The authors declare no conflicts of interest.
References
- Maji, I.K.; Sulaiman, C.; Abdul-Rahim, A.S. Renewable energy consumption and economic growth nexus: A fresh evidence from West Africa. Energy Rep. 2019, 5, 384–392. [Google Scholar] [CrossRef]
- Kumba, H.; Olanrewaju, O.A. Towards Sustainable Development: Analyzing the Viability and Integration of Renewable Energy Solutions in South Africa”—A Review. Energies 2024, 17, 1418. [Google Scholar] [CrossRef]
- South-African-Energy-Sector-Report.pdf. 2021. Available online: http://www.energy.gov.za/files/media/explained/2021-South-African-Energy-Sector-Report.pdf (accessed on 23 May 2024).
- Elavarasan, R.M.; Pugazhendhi, R.; Jamal, T.; Dyduch, J.; Arif, M.; Kumar, N.M.; Shafiullah, G.; Chopra, S.S.; Nadarajah, M. Envisioning the UN Sustainable Development Goals (SDGs) through the lens of energy sustainability (SDG 7) in the post-COVID-19 world. Appl. Energy 2021, 292, 116665. [Google Scholar] [CrossRef]
- Wu, H. Evaluating the role of renewable energy investment resources and green finance on the economic performance: Evidence from OECD economies. Resour. Policy 2023, 80, 103149. [Google Scholar] [CrossRef]
- Hafner, M.; Tagliapietra, S.; de Strasser, L. Prospects for Renewable Energy in Africa. In Energy in Africa: Challenges and Opportunities; Hafner, M., Tagliapietra, S., de Strasser, L., Eds.; Springer International Publishing: Cham, Switzerland, 2018; pp. 47–75. [Google Scholar]
- Ngepah, N.; Djemo, C.R.T.; Saba, C.S. Forecasting the Economic Growth Impacts of Climate Change in South Africa in the 2030 and 2050 Horizons. Sustainability 2022, 14, 8299. [Google Scholar] [CrossRef]
- Kumba, H.; Akpan, J.; Twite, B.; Olanrewaju, O. Renewable energy adoption and integration in South Africa: An overview. In Proceedings of the 12th International Conference on Clean and Green Energy (ICCGE 2023), Xiamen, China, 25–27 May 2023. [Google Scholar]
- Wiese, M.; van der Westhuizen, L.-M. Impact of planned power outages (load shedding) on consumers in developing countries: Evidence from South Africa. Energy Policy 2024, 187, 11403. [Google Scholar] [CrossRef]
- Kock, Z.; Govender, K.K. Load-Shedding and the Declining Energy Availability Factor: A Case Study of a South African Power Station. Mediterr. J. Soc. Sci. 2021, 12, 128. [Google Scholar] [CrossRef]
- Bowman, A. Parastatals and economic transformation in South Africa: The political economy of the Eskom crisis. Afr. Aff. 2020, 119, 395–431. [Google Scholar] [CrossRef]
- Fouché, E.; Brent, A. Journey towards Renewable Energy for Sustainable Development at the Local Government Level: The Case of Hessequa Municipality in South Africa. Sustainability 2019, 11, 755. [Google Scholar] [CrossRef]
- Mirzania, P.; Gordon, J.A.; Balta-Ozkan, N.; Sayan, R.C.; Marais, L. Barriers to powering past coal: Implications for a just energy transition in South Africa. Energy Res. Soc. Sci. 2023, 101, 103122. [Google Scholar] [CrossRef]
- Mutezo, G.; Mulopo, J. A review of Africa’s transition from fossil fuels to renewable energy using circular economy principles. Renew. Sustain. Energy Rev. 2021, 137, 110609. [Google Scholar] [CrossRef]
- Longe, O.M.; Myeni, L.; Ouahada, K. Renewable Energy Solution for Electricity Access in Rural South Africa. In Proceedings of the 2019 IEEE International Smart Cities Conference (ISC2), Casablanca, Morocco, 14–17 October 2019 2019; pp. 772–776. [Google Scholar] [CrossRef]
- Holechek, J.L.; Geli, H.M.E.; Sawalhah, M.N.; Valdez, R. A Global Assessment: Can Renewable Energy Replace Fossil Fuels by 2050? Sustainability 2022, 14, 4792. [Google Scholar] [CrossRef]
- Twidell, J. Renewable Energy Resources; Routledge: London, UK, 2021. [Google Scholar]
- Siregar, Y.; Hutahuruk, Y.; Suherman. Optimization Design and Simulating Solar PV System Using PVSyst Software. In Proceedings of the 2020 4rd International Conference on Electrical, Telecommunication and Computer Engineering (ELTICOM), Medan, Indonesia, 3–4 September 2020; pp. 219–223. [Google Scholar] [CrossRef]
- Aronescu, A.; Appelbaum, J. Design optimization of photovoltaic solar fields-insight and methodology. Renew. Sustain. Energy Rev. 2017, 76, 882–893. [Google Scholar] [CrossRef]
- Khan, F.A.; Pal, N.; Saeed, S.H. Optimization and sizing of SPV/Wind hybrid renewable energy system: A techno-economic and social perspective. Energy 2021, 233, 121114. [Google Scholar] [CrossRef]
- Priya, G.K.; Thakare, M.S.; Ghosh, P.C.; Bandyopadhyay, S. Sizing of standalone photovoltaic thermal (PVT) systems using design space approach. Sol. Energy 2013, 97, 48–57. [Google Scholar] [CrossRef]
- Rachit, S.; Giri, V.K. Design of Grid Connected PV System using PVsyst. J. Electr. Eng. 2016, 10, 14. [Google Scholar] [CrossRef]
- Balal, A.; Herrera, M.; Johnson, E.; Dallas, T. Design and Simulation of a Solar PV System for a University Building. In Proceedings of the 2021 IEEE 4th International Conference on Power and Energy Applications (ICPEA), Busan, Republic of Korea, 9–11 October 2021; pp. 122–125. [Google Scholar] [CrossRef]
- Mahmood, A.L.; Shakir, A.M.; Numan, B.A. Design and performance analysis of stand-alone PV system at Al-Nahrain University, Baghdad, Iraq. Int. J. Power Electron. Drive Syst. 2020, 11, 921–930. [Google Scholar] [CrossRef]
- Ramoliya, J.V. Performance evaluation of grid-connected solar photovoltaic plant using PVSYST software. J. Emerg. Technol. Innov. Res. 2015, 2, 372–378. [Google Scholar] [CrossRef]
- Roshana, A.; Inbamani, A.; Rithan, S.S.; Krishnakumar, R.; Vishal, J.M. Design and Investigation of Grid Associated PV Framework Using PVSYST Software. In Proceedings of the 2021 International Conference on Advancements in Electrical, Electronics, Communication, Computing and Automation (ICAECA), Coimbatore, India, 8–9 October 2021; pp. 1–6. [Google Scholar] [CrossRef]
- Jain, S.; Jain, P.K. The rise of Renewable Energy implementation in South Africa. Energy Procedia 2017, 143, 721–726. [Google Scholar] [CrossRef]
- Aliyu, A.K.; Modu, B.; Tan, C.W. A review of renewable energy development in Africa: A focus in South Africa, Egypt and Nigeria. Renew. Sustain. Energy Rev. 2018, 81, 2502–2518. [Google Scholar] [CrossRef]
- Ayamolowo, O.J.; Manditereza, P.; Kusakana, K. South Africa power reforms: The Path to a dominant renewable energy-sourced grid. Energy Rep. 2022, 8, 1208–1215. [Google Scholar] [CrossRef]
- Department of Mineral Resources & Energy. The South African Energy Sector Report. 2021. Available online: http://www.energy.gov.za (accessed on 23 May 2024).
- Todd, I.; McCauley, D. Assessing policy barriers to the energy transition in South Africa. Energy Policy 2021, 158, 112529. [Google Scholar] [CrossRef]
- Yadav, P.; Kumar, N.; Chandel, S.S. Simulation and performance analysis of a 1 kWp photovoltaic system using PVsyst. In Proceedings of the 2015 International Conference on Computation of Power, Energy, Information and Communication (ICCPEIC), Melmaruvathur, India, 22–23 April 2015; pp. 358–363. [Google Scholar] [CrossRef]
- Vidur, P.R.; Jagwani, S. Design and simulation of a Rooftop solar PV system Using PV syst software. In Proceedings of the 2022 4th International Conference on Smart Systems and Inventive Technology (ICSSIT), Tirunelveli, India, 20–22 January 2022; pp. 724–728. [Google Scholar] [CrossRef]
- Alam, B.; Mustafa, S.; Akram, T.; Naaz, A.; Tariq, M.; Rahman, M.A. Design and Performance Analysis of Grid-Connected Solar PV System Using PV Syst Software. In Intelligent Data Analytics for Power and Energy Systems; Malik, H., Ahmad, M.W., Kothari, D.P., Eds.; Springer Nature: Singapore, 2022; pp. 363–372. [Google Scholar]
- Baqir, M.; Channi, H.K. Analysis and design of solar PV system using Pvsyst software. Mater. Today Proc. 2022, 48, 1332–1338. [Google Scholar] [CrossRef]
- Luo, L.; Abdulkareem, S.S.; Rezvani, A.; Miveh, M.R.; Samad, S.; Aljojo, N.; Pazhoohesh, M. Optimal scheduling of a renewable based microgrid considering photovoltaic system and battery energy storage under uncertainty. J. Energy Storage 2020, 28, 101306. [Google Scholar] [CrossRef]
- Rachchh, R.; Kumar, M.; Tripathi, B. Solar photovoltaic system design optimization by shading analysis to maximize energy generation from limited urban area. Energy Convers. Manag. 2016, 115, 244–252. [Google Scholar] [CrossRef]
- Hasti, F.; Mamkhezri, J.; McFerrin, R.; Pezhooli, N. Optimal solar photovoltaic site selection using geographic information system–based modeling techniques and assessing environmental and economic impacts: The case of Kurdistan. Sol. Energy 2023, 262, 111807. [Google Scholar] [CrossRef]
- Teh, C.J.Q.; Drieberg, M.; Soeung, S.; Ahmad, R. Simple PV modeling under variable operating conditions. IEEE Access 2021, 9, 96546–96558. [Google Scholar] [CrossRef]
- Oyewo, A.S.; Aghahosseini, A.; Ram, M.; Lohrmann, A.; Breyer, C. Pathway towards achieving 100% renewable electricity by 2050 for South Africa. Sol. Energy 2019, 191, 549–565. [Google Scholar] [CrossRef]


Disclaimer/Publisher’s Note: The statements, opinions and data contained in all publications are solely those of the individual author(s) and contributor(s) and not of MDPI and/or the editor(s). MDPI and/or the editor(s) disclaim responsibility for any injury to people or property resulting from any ideas, methods, instructions or products referred to in the content. |
© 2024 by the authors. Licensee MDPI, Basel, Switzerland. This article is an open access article distributed under the terms and conditions of the Creative Commons Attribution (CC BY) license (https://creativecommons.org/licenses/by/4.0/).