Abstract
The power sector is one of the major CO2-emitting industries in China. It is also the first key emissions control industry included in China’s national carbon trading market established in 2021. Therefore, based on the data of 30 provinces and cities in China from 2015 to 2022, this study analyzes the impact of the national carbon market policy on the carbon emissions of the power industry based on the generalized Difference-in-Difference (DID) model. Based on the method of text analysis, this paper constructs the carbon market policy intensity index of each region and incorporates it into the DID model. Empirical analysis finds that the national carbon market policy can significantly inhibit the carbon emissions of the power industry. However, the heterogeneity analysis of 30 provinces and cities shows that the national carbon market policy has a significant impact on the regions that already have a carbon pilot, but not on the non-pilot regions. Therefore, this paper demonstrates the effectiveness of the national carbon market policy in the power industry emissions control, and also exposes the heterogeneity between regions, providing an important empirical basis for the inclusion of other energy-intensive industries.
1. Introduction
With the rapid growth of the global economy, the continuous growth of greenhouse gas emissions concentrations has become the focus of the international community. This growth poses a severe challenge to the global environment, especially the increasingly prominent environmental problems such as global climate warming, which makes carbon emissions one of the top environmental issues to the global government, the public and the scientific community [1]. Against this background, China, as one of the largest developing countries in the world, has taken a firm and positive stance in the global response to climate change. Among them, a particularly critical measure is to promote the construction of a carbon market to promote the reduction in carbon emissions by market-oriented means. Since 2011, China gradually launched and implemented the pilot work of carbon trading, which provided valuable practical experience for China’s carbon emissions control and triggered extensive research on its emission reduction effect, especially in the power industry, which is a large carbon emitter. In 2021, China accelerated the construction of a national carbon market [2]. As a deepening and expansion of the pilot work of carbon trading, the national carbon market aims to achieve the effective regulation of carbon emissions and the achievement of emission reduction targets through a broader and more systematic market mechanism. At present, the national carbon market mainly focuses on the power sector, which reflects China’s emphasis on carbon reductions in the power sector and indicates that the carbon market will gradually cover more high-emission industries in the future (the “Interim Regulations on the Administration of Carbon Emission Trading” issued by The State Council of China pointed out that the regulation shall combine the characteristics of greenhouse gas emission control in civil aviation and other industries, and formulate specific management measures for key emitting units in civil aviation and other industries (https://www.gov.cn/zhengce/zhengceku/202402/content_6930138.htm (accessed on 4 February 2024))). Therefore, revealing the impact of China’s national carbon market policy on the emission reduction effect of the power industry will provide important enlightenment for the future inclusion of other industries, and is of great significance for the sustainable and healthy development of the national carbon market.
As a key policy tool to promote the reduction in carbon emissions in the power industry, the core of the carbon market operation lies in the establishment of a carbon emissions trading system and the introduction of a carbon pricing mechanism. This mechanism provides an effective environmental policy framework for the power industry by using the regulating function of market supply and demand [3]. The government allocates a certain amount of free carbon emission quotas to power enterprises according to the established carbon emission targets. These quotas become legal certificates for companies to emit carbon. For firms that emit less carbon than their free quota, they can make a profit by selling the remaining quota, thus forming a supply side of carbon emission allowances in the market. For those enterprises whose carbon emissions exceed the free quota, they need to purchase additional quotas in the carbon market to meet the government’s emission limit requirements, thus becoming the demanders of carbon emission allowances. The operation of the carbon market relies on market supply and demand to determine the price of carbon emission permits. This price mechanism provides clear economic incentives for firms to reduce their costs in the carbon market by adopting clean and low-carbon production methods and technological innovations to reduce carbon emissions [4]. With the gradual tightening of carbon emission allowances, companies will face greater pressure to reduce emissions, which will further stimulate them to increase emission reduction efforts and invest in low-carbon, clean technologies and renewable energy projects. Hence, the carbon market provides a strong incentive for the power industry to reduce emissions through the comprehensive role of market mechanisms and economic incentives. It prompts companies to actively reduce carbon emissions, and drives the transformation of the entire industry to a more sustainable and low-carbon direction. Theoretically, the carbon market has a significant positive impact on carbon emission reduction in the power sector.
This study focuses on the impact of the China’s national carbon market policy on carbon emission reduction in the power sector, aiming to provide a basis for the sustainable and healthy development of the national carbon market in the future. Meanwhile, we test whether the impacts differ for pilot regions and non-pilot regions, and whether the degree of policy control affects the effect. Based on the generalized Difference-in-Difference (DID) model, this study makes the following two contributions to the literature. First, unlike existing studies that focus on China’s carbon pilots, this study evaluates the effect of national carbon market policies on carbon emission reduction in the power sector. The empirical analysis based on provincial panel data provides additional information on China’s national carbon market to the existing literature. Secondly, based on the method of text mining, this study constructs the regional carbon market policy implementation intensity index to measure the implementation intensity of the national carbon market policy in different regions, which is helpful to deeply understand the regional differences and effects of policy implementation.
The rest of this paper is structured as follows. Section 2 summarizes the current literature on the effects of carbon market policies. Section 3 introduces the data and model. Section 4 presents the empirical results and heterogeneity analysis. Section 5 conducts the heterogeneity analysis and discusses the results. Section 6 concludes the study.
2. Literature Review
Emissions trading is a policy tool that allows governments, businesses and other entities to trade when they meet certain carbon emissions targets. Carbon markets were established in response to the need for cost-effective emission reduction strategies [5]. A “cap-and-trade” system, which sets a cap on emissions and allocates tradable allowances to polluters, is a central feature of many carbon market policies [6].
Some recent studies suggest that emissions trading has been moderately successful in reducing greenhouse gas emissions. Teixidó et al. [7] summarized the empirical literature on the impact of the EU Emissions Trading System (EU ETS) on low-carbon technological change, and concluded that carbon emissions markets in free-allocation (grandfathering) regimes tended to discourage low-carbon investment in phase I (2005–2007) and II (2008–2012). Meanwhile, they summarized that the EU ETS appeared to be relatively more effective in stimulating innovation in low-carbon technologies than in the adoption of low-carbon technologies. However, the empirical evidence from the third stage (2013–2020) was relatively small. Similarly, the study of Bayer and Aklin [8] demonstrated that the EU ETS reduced CO2 emissions at a low carbon price through counterfactual analysis. Their study found that the EU ETS reduced carbon dioxide by about 1.2 billion tons between 2008 and 2016 compared to a world without a carbon market. Based on a sample of the largest 100 countries in the world [9], Bai and Ru [9] found that the adoption of ETS reduced greenhouse gas emissions and CO2 emissions by 12.1% and 18.1%, respectively. Many other studies also provide macro- and micro-evidence that the EU ETS contributes to carbon reduction, e.g., [10].
There is a large amount of literature on the effects of China’s carbon pilots. For example, Qi et al. [11] used the DID model to compare carbon emissions and economic development between carbon emissions trading areas and non-trading areas, and before and after carbon emissions trading, and concluded that the ETS policy significantly reduced carbon emissions in the ETS areas. Based on China’s provincial panel data from 2005 to 2016, Yi et al. [12] found that the implementation of carbon markets in Beijing, Shanghai and Hubei had a significant inhibitory effect on local carbon emissions, while Guangdong had a promoting effect and Tianjin had no significant effect. Moreover, the establishment of Shanghai’s carbon pilot had no significant effect on local carbon emissions in the first year, and had a significant inhibitory effect only after that. Zhang et al. [13] used the DID method to evaluate the impact of emissions trading systems on corporate carbon emission reduction and economic growth, and estimated the operating efficiency of the carbon emissions trading management system in seven pilot regions. They found that the implementation of carbon trading policy increased the economic outcome measured by the total industrial output value, but significantly reduced the industrial CO2 emissions. Shi et al. [14] regarded the implementation of the pilot carbon trading policy as a quasi-natural experiment, and used the county panel data from 1997 to 2017 to analyze the emission reduction effects of carbon quotas and the carbon trading price. The analysis based on the DID method showed that the implementation of the pilot carbon trading policy reduced regional carbon emissions and inhibited per capita carbon dioxide emissions. However, the carbon emission reduction effect brought by the carbon pilot policy showed significant heterogeneous results, with different regional carbon emissions and environmental regulation degrees. They found that this effect was more pronounced in regions with a higher carbon emission density and stronger legal regulation. In addition, differences in the allocation of carbon allowances led to different abatement effects, with the historical approach having the strongest effect. Zhang and Lin [15] constructed a computable general equilibrium (CGE) model coupling the China Certified Emission Reduction (CCER) and cap-and-trade (CaT) mechanism to evaluate the impact of the CCER mechanism on China’s energy economy and environment. It was found that the introduction of the CCER mechanism could promote the output growth and price reduction in the renewable energy sector while maintaining the welfare of the GDP and residents, and hedge the negative impact brought by the CaT mechanism. The CCER mechanism effectively promoted carbon emission reduction by improving the energy consumption efficiency and promoting the transformation of the energy consumption structure. Gu et al. [16] pointed out that, after the implementation of the carbon emissions trading market policy in 2013, the energy consumption per unit of GDP in China decreased significantly, which indicates that the carbon market policy has a continuous positive effect on energy conservation and emission reductions. However, the pilot regions produced different degrees of energy conservation and emission reduction effects, indicating that carbon market policies have significant regional heterogeneity. Based on the study in China, Ma et al. [17] found that the ETS pilot policy significantly inhibited the carbon emissions generated by the pilot cities through two-way foreign direct investment (FDI), among which, the scale, industrial structure and technology effects of the two-way FDI are important transmission mechanisms. Using the panel data of 122 resource-based cities in China, Wu et al. [18] analyzed the emission reduction effect of the carbon emissions trading system, and pointed out that China’s ETS effectively reduced the carbon emissions of resource-based cities, and the policy effect was more prominent in the short term. However, the low-carbon transformation of resource-based cities had different evolutionary characteristics.
However, emissions trading is not without controversy. Some studies have raised doubts about its effect, arguing that the effect is not significant. For example, Lin and Huang [19] noted that carbon trading can indeed effectively curb carbon emissions. However, this policy effect was not achieved through the market mechanism, but through the role of government intervention. The results also showed that the carbon trading mechanism promoted the carbon reduction structure through energy consumption rather than industry. Li et al. [20] built an economic dispatch model to simulate the operation of China’s hourly power supply system, and argued that moderate carbon pricing alone is not enough to effectively reduce carbon dioxide emissions without concurrent power market reform. Meanwhile, the effectiveness of carbon emissions trading schemes varies among pilot provinces because of regional policy differences [21].
Overall, as a policy instrument, carbon emissions trading has an important impact on carbon emission reduction to a certain extent. However, its effectiveness is influenced by many factors, including market stability, policy consistency and international cooperation [19,20]. In 2023, important breakthroughs were made in the accounting, verification, quota allocation, data management, voluntary emissions reductions and other institutional methods of China’s national carbon market. After two compliance cycles, the national carbon market formed a full-process institutional framework with complete elements, with a clear division of responsibility subjects, supporting the safe operation of the platform, greatly improving the quality of carbon emissions data and forming the initial shape of a carbon price discovery mechanism. The incentive and restraint effect of carbon emission reduction is significant, and the carbon market has become an important policy tool for China to achieve the strategic goal of “dual carbon” [22]. However, there is little evidence on the emission reduction effect of China’s national carbon market. On the one hand, due to data limitation, the existing literature pays more attention to the carbon emission reduction effect of regional carbon pilot policies, e.g., [13]. On the other hand, there is insufficient research on electricity markets. For instance, the current study mainly focuses on regional rather than industrial emission reductions. However, considering that the expansion of the national carbon market is carried out from the perspective of the industry, the research from this aspect has greater implications for the policy formulation and improvement of the national carbon market.
3. Data and Methodology
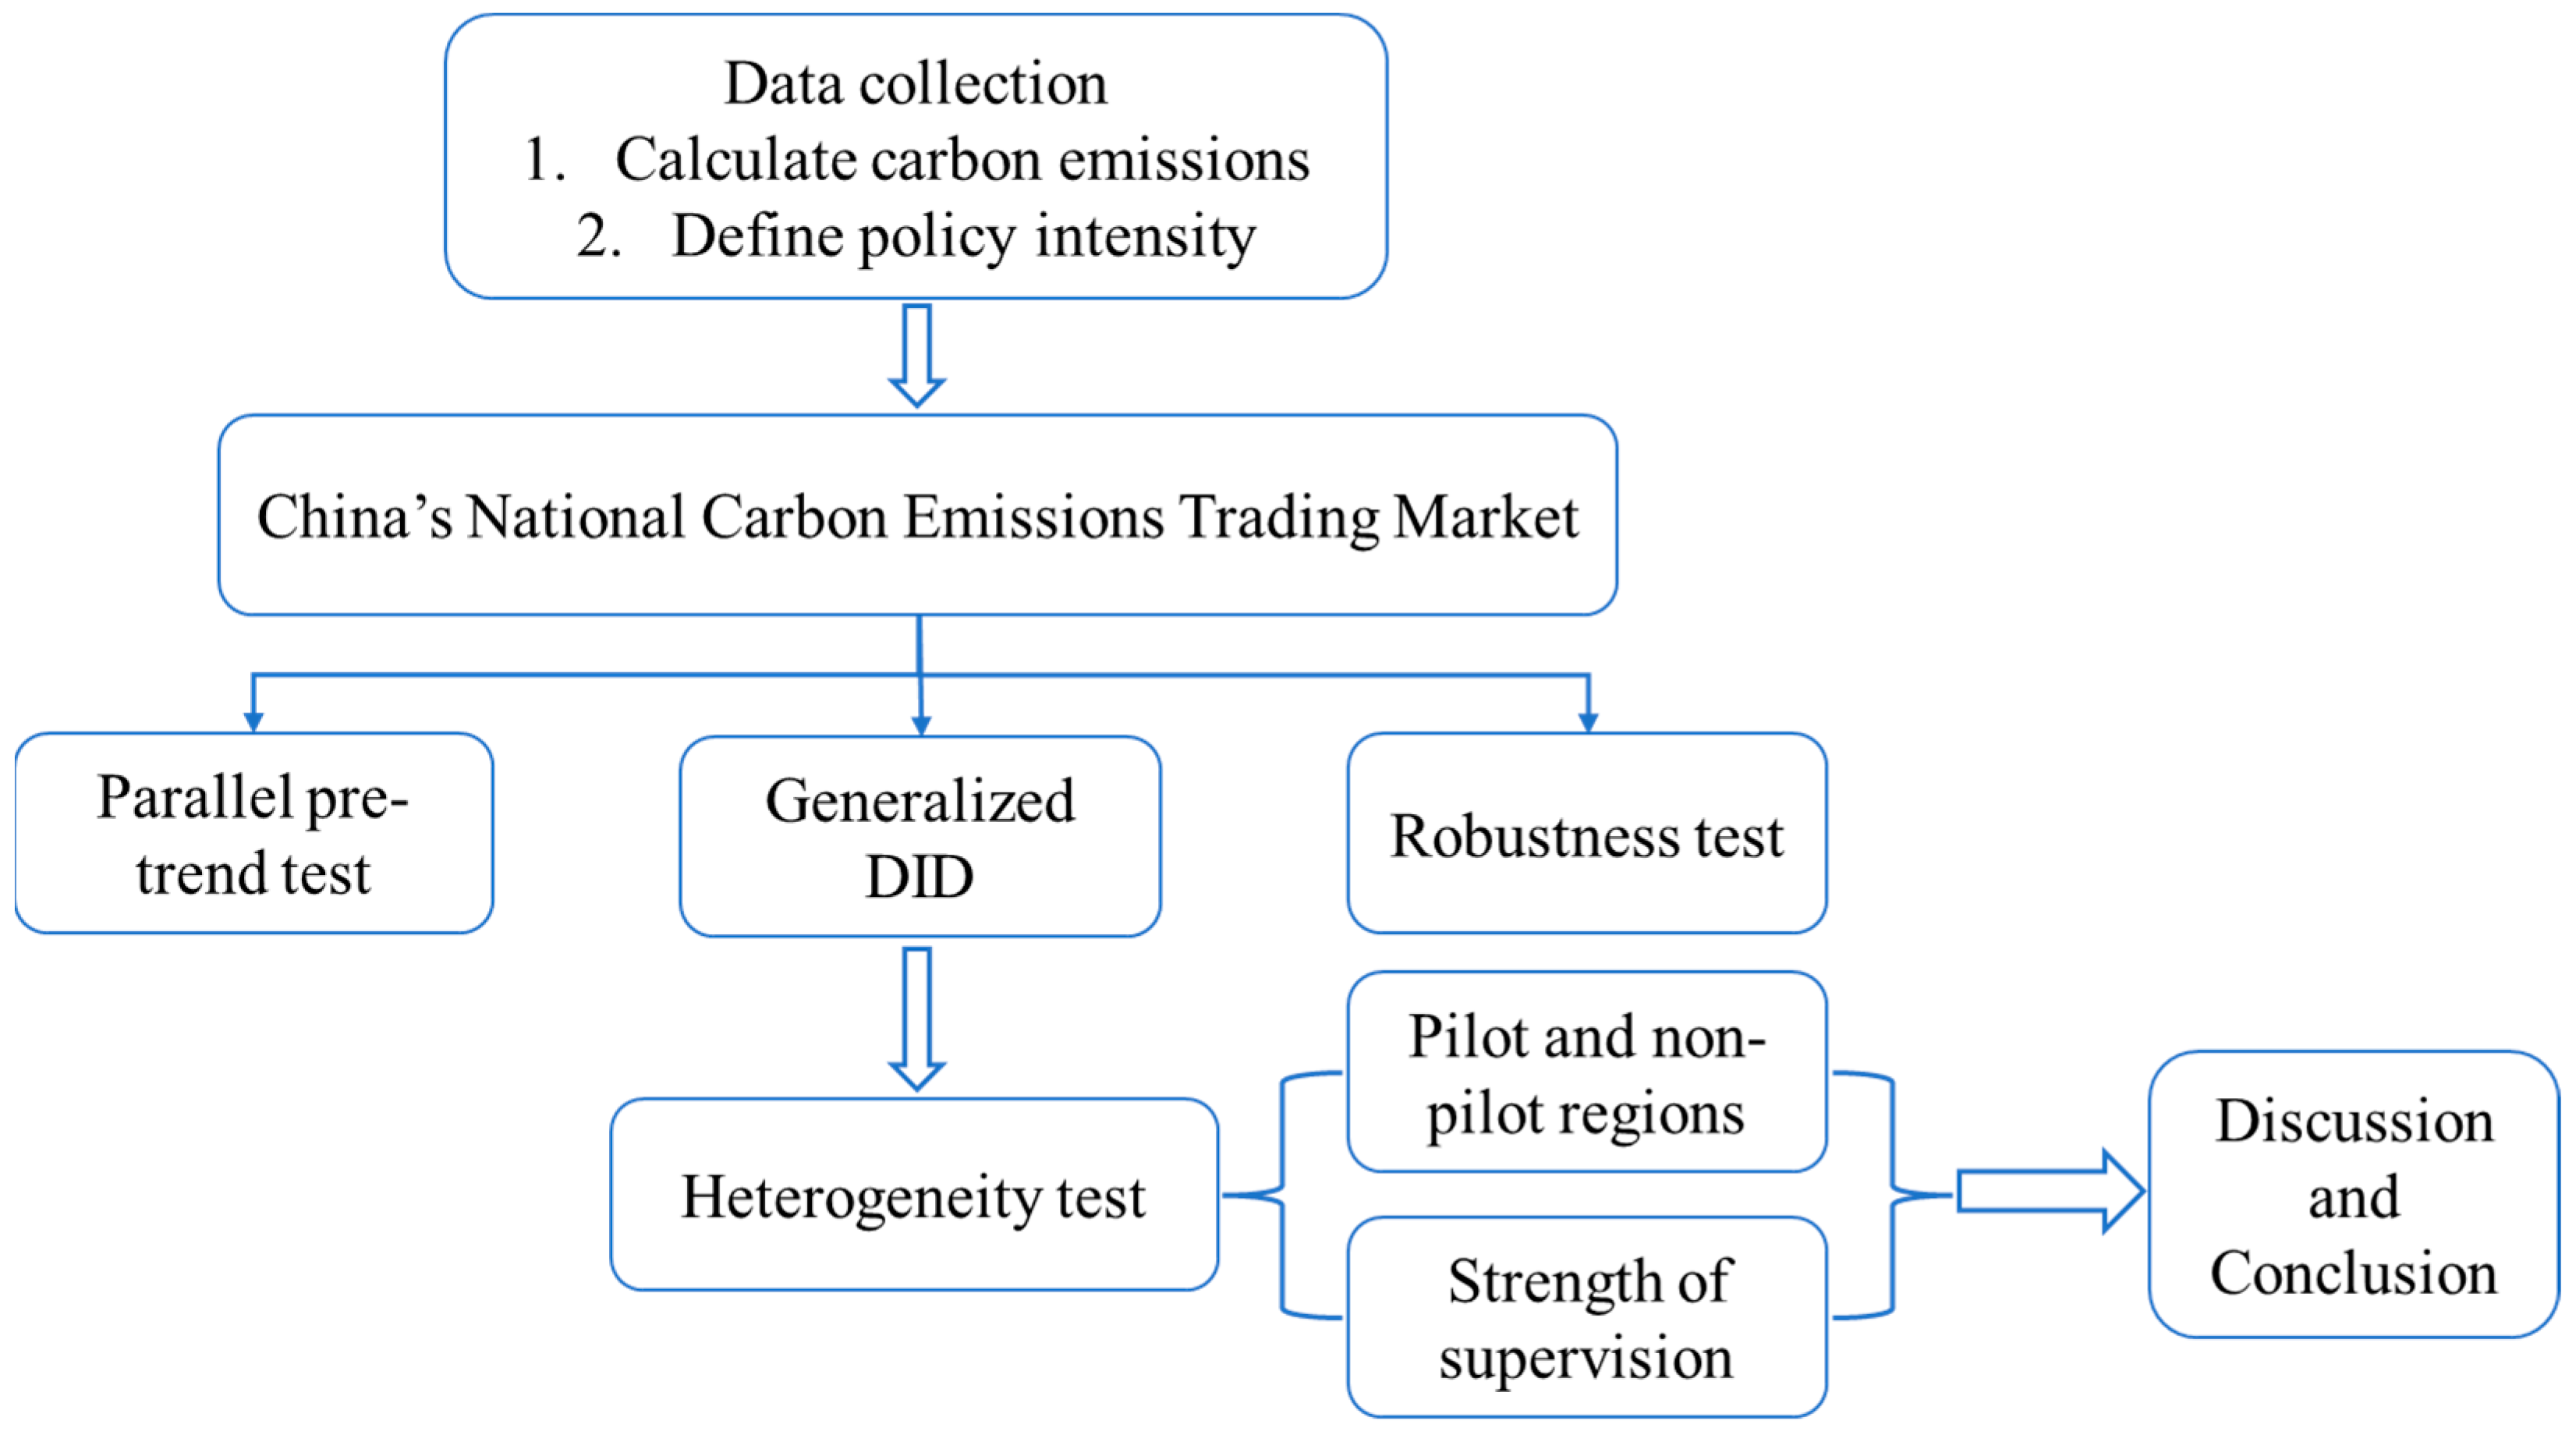
Figure 1 shows the method flow chart. First, the necessary data were collected, including independent, dependent and control variables. Then, the generalized DID model was used for the empirical analysis, and the corresponding heterogeneity test and robustness test were carried out.
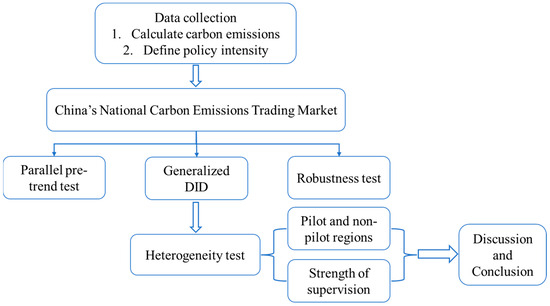
Figure 1.
Research model.
3.1. Independent Variables
This study analyzes the impact of China’s national carbon market policy on carbon emissions in the power industry, and the main independent variables include the national carbon market policy dummy variable and related control variables.
Since China’s carbon emissions market is a national market, a dummy time variable was used to reflect the official online trading of the market, which is one before 2021 and zero after that. In addition, the emphasis on carbon emission reduction is different in each region, which will also affect the emission reduction effect of the power industry in this region [23]. Therefore, this paper constructs an index to measure the intensity of carbon emission reduction policies in each region. The specific construction method is as follows. This paper adopts a quantitative method to evaluate the policy intensity (PI) of carbon emission reduction in each province and region by analyzing the number of effective carbon emission reduction policies implemented in these regions between 2015 and 2022. The degree to which provinces and cities attach importance to the carbon emission market is directly reflected in the number of policy documents issued by the government. In order to accurately capture this information, this paper first uses crawler technology to collect all policy documents related to carbon emission reduction released from the official websites of local governments of 30 provinces and cities in China during this period. Subsequently, the number of policy documents in each year is selected as the key indicator to measure the PI in the region, which intuitively reflects the government’s efforts to promote carbon emission reduction in the corresponding years. To enhance the data comparability, we normalize the number of policies in each year by transforming the original number of policy documents into a continuous variable between 0 and 1. This treatment ensures that policy intensities across years and regions can be compared on a uniform scale.
where X is the original number of policy documents, and and are the maximum and minimum number of policy documents, respectively. After the above data processing steps, the indicator PI is employed, which continuously reflects the intensity of carbon emission reduction policies implemented by the governments in each region from 2015 to 2022. This variable provides an important data base for the subsequent analysis, allowing us to explore the relationship between the PI and carbon reduction effects in more depth.
According to the literature, many other factors affect the carbon emissions of the power sector. For example, Zhang et al. [24] and Chen et al. [25] considered the contribution of population size to regional carbon emissions, and Yang et al. [26] considered the impact of the economic development level on carbon emissions. In addition, enterprises are facing great pressure on emission reduction costs, and they generally control their carbon emission costs through technology R&D and technology upgrading [27]. Urbanization changes people’s lifestyles and energy-use patterns, usually increasing energy consumption and carbon emissions [28]. Industrial structure and regional electricity generation also have a significant impact on carbon emissions [29,30]. Ehrlich and Holdren [31] believed that population size and technological progress would have a very important impact on environmental output. Therefore, in this study, the total power generation (PG, unit: 100 million KWH), per capita GDP (GDP, unit: yuan), enterprise R&D level (RD, the number of valid invention patents in each region, unit: pieces), urbanization level (UR, the ratio of urban population to total population, unit: %) and industrial structure (IS, the proportion of secondary industry, unit: %) are selected as control variables. The above data are from China Energy Statistical Yearbook and China Statistical Yearbook. In the empirical analysis, we use the logarithm of the control variables, except for the industrial structure (IS). The raw data for the control variables are from the China Energy Statistical Yearbook and China Statistical Yearbook [24,25,26,27,28,29,30].
3.2. Carbon Emissions from the Power Sector
When testing the emission reduction effect of the national carbon emissions market, this paper takes the carbon emissions of the power industry of 30 provinces and cities (excluding Hong Kong, Macao, Taiwan and Tibet) in China as the target variable. In terms of the measurement of carbon emissions, this paper adopts the Intergovernmental Panel on Climate Change (IPCC) carbon emissions algorithm to measure the carbon emissions generated by the thermal power consumption of fossil energy in the power industry [32]. The calculation formula is as follows:
where represents the carbon emissions of the power industry (ten thousand tons) and i represents the type of energy. In this paper, coal, coke, kerosene, gasoline, diesel, fuel oil and natural gas are used for the calculation. is the consumption of each form of energy (ten thousand tons), represents average low calorific value, represents the carbon content of the average calorific value and denotes the carbon oxidation rate. The calculation of each indicator is based on the Guidelines for Compiling Provincial Greenhouse Gas Inventory (Trial) compiled and issued by the Climate Department of the National Development and Reform Commission organized by relevant departments. The raw data for are from the China Energy Statistical Yearbook. In the empirical analysis, this paper takes the logarithm of carbon emissions in the power industry.
Table 1 shows the sample descriptive statistical results of the variables in this paper. Among them, the 25% quantile of the policy intensity variable (PI) is 0, which is because many provinces and cities that have not conducted pilot carbon emission trading have not released policies related to the carbon market and carbon emission reduction before 2021. Meanwhile, the policy intensity variables in most provinces and cities show an increasing trend from 2015 to 2022.

Table 1.
Descriptive statistics.
3.3. Methodology
This study uses the generalized DID approach to study the impact of China’s national carbon market on the emission reduction effect of the power sector. Taking 2021 as the year of policy implementation, this paper selects the panel data of 30 provinces and cities in China from 2015 to 2022 for analysis. The generalized DID model, considering individual and time-fixed effects, is constructed as follows:
where represents the carbon emissions of the power industry in region i in year t (taken in log), stands for the policy intensity and is the time dummy variable of the policy. Since China’s carbon emissions trading market was officially launched in July 2021, the value of 2021 and after is 1, and the value before is 0. is the interaction term of the generalized DID, and its coefficient β represents the effect of the national carbon trading market on the carbon emissions of power sector, which is the focus of this paper. represents the control variable, and represent individual fixed effects and time-fixed effects, respectively, and is the random error term.
4. Empirical Results
4.1. The Impact of China’s National Carbon Market Policy on Carbon Emissions of Power Sector
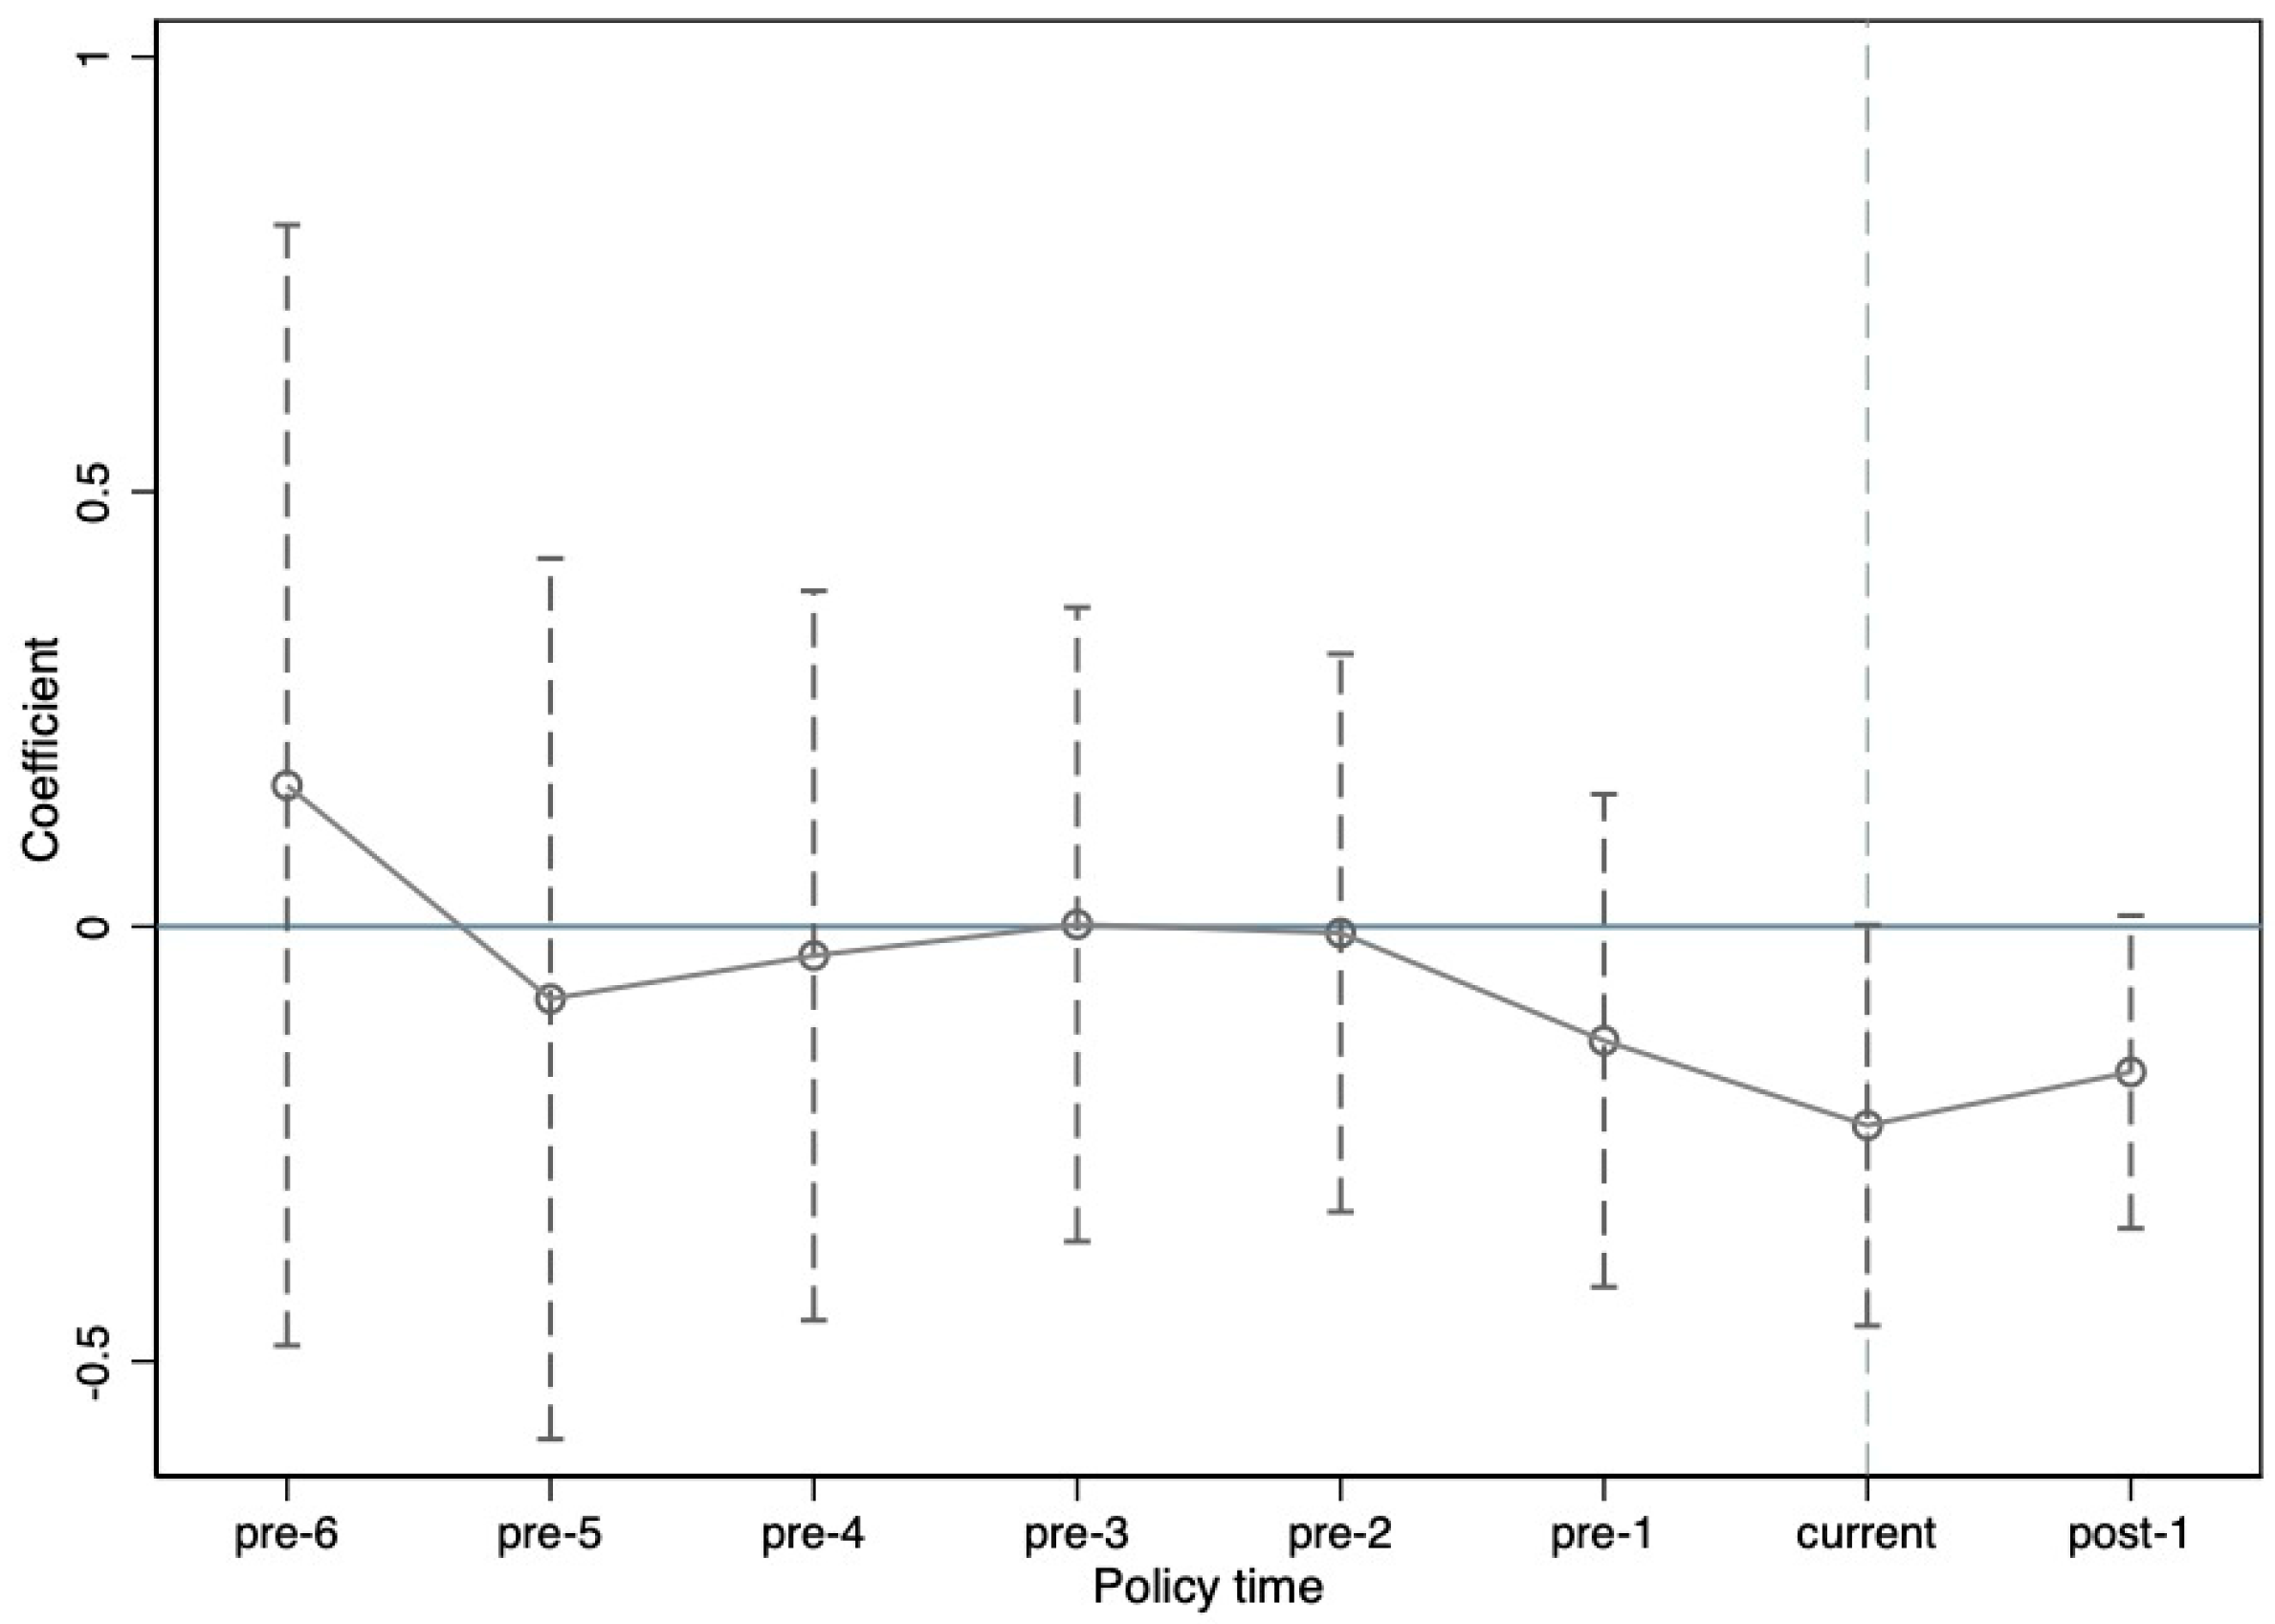
This paper uses the generalized DID model with two-way fixed effects to test whether the establishment of the national carbon market in 2021 can significantly reduce the carbon emissions of the power industry. Figure 2 shows that the model satisfies the parallel pre-trend test.
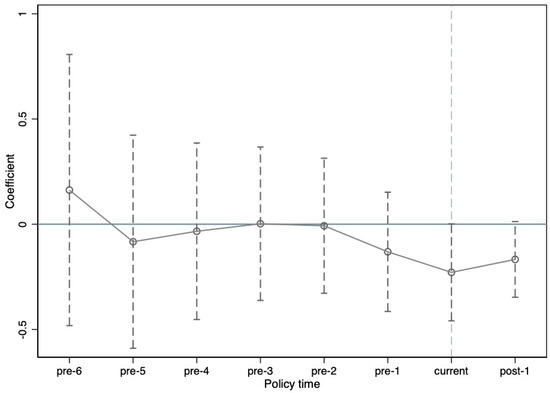
Figure 2.
Parallel pre-trend test.
OLS, OLS with variance inflation factor screening (VIF), principal component regression (PCR) and partial least squares regression (PLS) are commonly used approaches to solve multicollinearity [33]. Following the literature [34,35], we use the VIF to screen multicollinearity. If VIF > 10, it means that the selected variables are highly correlated. Table 2 shows that the VIF of each control variable is less than five, and there is no serious multicollinearity problem.
Table 2.
The results of the VIF test.
The estimation results are shown in Table 3. M1 in Table 3 represents the estimation results without control variables, and M2 adds necessary control variables. The results show that the coefficient estimates of the DID terms with and without the control variables are both statistically negative. The estimated coefficient of −0.166 indicates that the establishment of a national carbon emissions trading market can reduce the carbon emissions of the power industry by 16.6%. In other words, the national carbon market has significantly reduced the carbon emissions of the power industry, and the policy effect of the national carbon market is effective.
Table 3.
The results of the DID regressions.
Considering that the effect of the national carbon market policy on carbon emission reduction in the power sector may be caused by unobservable common factors, this paper adopts the placebo test, conducts 500 repeated random draws on the interaction term and observes whether the coefficient is significantly different from the benchmark estimation result. The regression coefficients obtained from the simulation show a normal distribution centered at zero, indicating that the placebo test passes. Therefore, it can be concluded that the effect of the national carbon market on China’s electricity carbon emission reduction is not caused by unobservable common factors, and the effect on carbon emissions in the power sector is the result of the establishment of the national carbon emissions trading market.
4.2. Robustness Test
This study changes the timing of policy shocks to verify the robustness of the model. First, we advance the time shock to 2017, and obtain the interaction term by multiplying the time shock and the policy dummy variable again. According to Table 4, the coefficient of the DID term is statistically insignificant for model (3). Additionally, we refer to the cancellation pre-effectiveness test method [36]. A policy usually has antecedents before it is implemented, such as the period in which the emissions trading policies were developed and comments were publicly collected. For example, in December 2017, the National Development and Reform Commission issued the Construction Plan of the National Carbon Emission Trading Market (Electric Power Industry). This marks the completion of the overall design of China’s carbon emissions trading system and its official launch. This will greatly affect the number of policies, i.e., the intensity index proposed in this study. Therefore, we advance the time of the policy shock to 2018, and the regression result of model (4) is again statistically insignificant. Therefore, the empirical results in this study are robust.
Table 4.
The results of the robustness tests.
5. Heterogeneity Analysis and Discussions
5.1. Heteregeneity Analysis
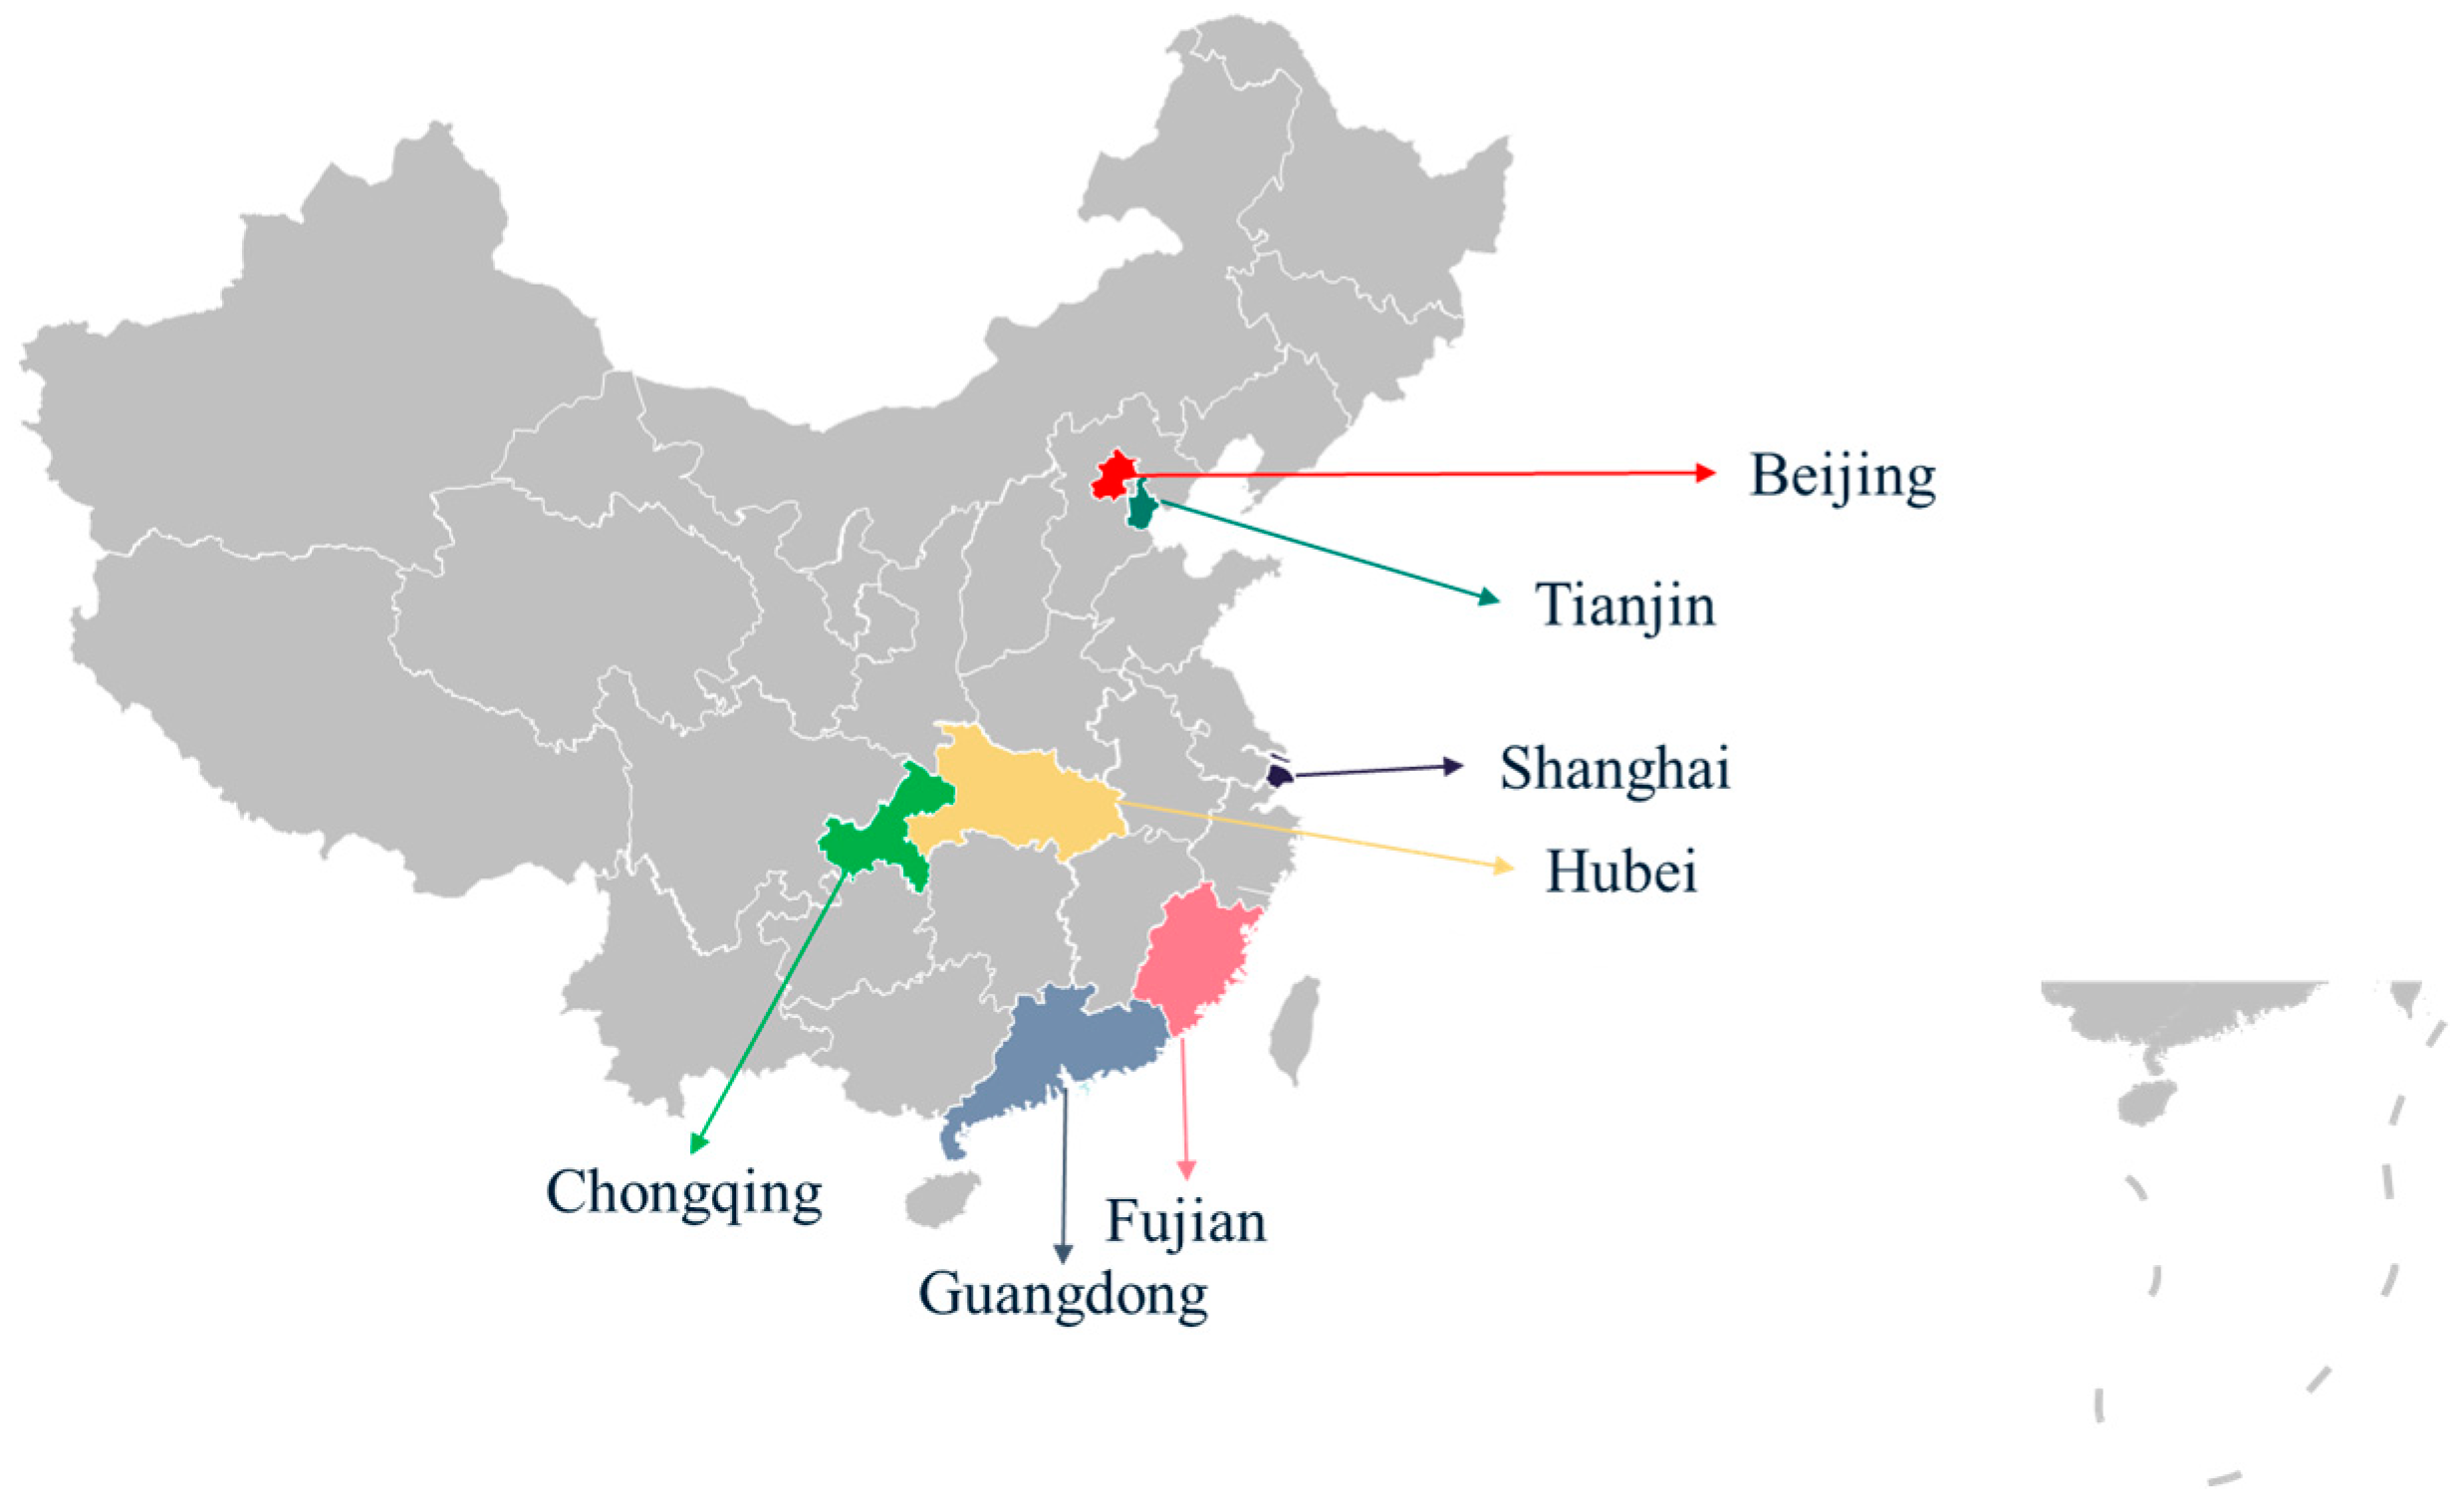
Since 2011, China has launched carbon trading pilots in Beijing, Tianjin, Shanghai, Chongqing, Hubei, Guangdong and Fujian. Many studies have supported that pilot carbon trading policies can help lower carbon emissions. Therefore, this paper further analyzes whether the impact of the national carbon market policy on the power industry in the pilot and non-pilot areas is heterogeneous. We divide the whole sample data into the following two subsamples: one is the 7 provinces and cities that have been piloted, and the other one is the remaining 23 provinces and cities that have no pilot (see Figure 3).
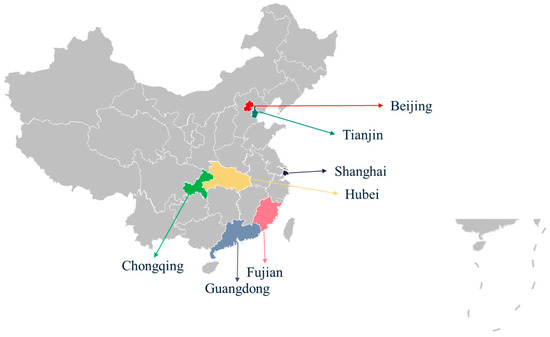
Figure 3.
Map of China with pilot regions highlighted.
According to Table 5, M3 shows the results of the provinces and cities that have not been piloted, and M4 shows the results of the piloted regions.
Table 5.
The results of the heterogeneity analysis.
On the one hand, the coefficient of the DID term in M5 is statistically negative, which is in line with the results of M1 and M2, thus further indicating that the national carbon market policy reduces the carbon emissions of the power industry in piloted regions. On the other hand, the results of the non-pilot regions suggest that the national carbon market appears to be insignificant in reducing carbon emissions in the power sector.
Meanwhile, many studies have pointed out that the government’s supervision of policies will directly affect the impact of carbon market policies on carbon emission reduction [14,37]. Therefore, on this basis, the policy intensity is divided into strong policy supervision regions and weak policy supervision regions. Then, we conducted the benchmark regression based on these two samples. M7–M8 in Table 5 show the results. Accordingly, the coefficient of the DID term of M7 is statistically insignificant, thus indicating that the effect of the national carbon market policy on carbon emission reduction is not significant in the regions where the government’s policy supervision is weak. In contrast, the coefficient in M8 is statistically negative. In other words, the effect of the national carbon market on carbon emission reduction is more significant in regions with strong policy supervision. It also demonstrates that the intensity of policy regulation is an important factor affecting the effect of carbon emission reduction.
5.2. Discussions
The results in Table 3 show that the establishment of China’s national carbon emissions trading market can significantly reduce the carbon emissions of the power industry. This finding is in line with many studies, e.g., [38], who found that regional carbon trading policy significantly promotes carbon emission reduction in the power industry, and the longer the implementation time of the carbon trading policy is, the stronger the inhibitory effect is. In addition, this finding is consistent with the literature that supports the significant impact of carbon trading policy on carbon reductions in China [13]. While the literature has focused on China’s regional carbon market policies, this study demonstrates for the first time that the national carbon market policy is effective in promoting carbon emission reductions in the power industry.
For the control variables, the findings are generally in line with the literature. For example, as shown in Table 3, the impact of the total power generation (PG) on carbon emissions in the power industry is significantly positive, indicating that the power generation of a province or city is an important factor affecting carbon emissions in its power industry. Therefore, provinces and cities where economic development has a strong long-term dependence on the power generation industry will be significantly affected by the national carbon emissions policy, so they should become the focus of local governments’ economic development policies. An increase in the level of urbanization also creates an increase in electricity demand, although statistically insignificant. This effect works through multiple pathways. For example, with the acceleration of urbanization, the population is concentrated in cities, leading to a sharp increase in the demand for electricity [39]. To meet this increased demand, the power industry may need to increase electricity generation, which may result in more fossil fuels being burned, thereby increasing carbon emissions. Moreover, urbanization is often accompanied by industrialization and modernization, which may improve the efficiency of energy use [40]. However, if urbanization is accompanied by inefficient energy use and reliance on high-carbon energy sources, then carbon emissions may increase. The impact of GDP per capita and R&D on carbon emissions in the power sector is negative, although statistically insignificant. Such a result is consistent with the theoretical analysis. On the one hand, economic development has driven the construction and renewal of infrastructure, including electricity transmission and distribution networks [41]. If the construction of such infrastructure tends to use renewable energy and more efficient technologies, then carbon emissions may be reduced [42]. Regions with higher levels of GDP per capita are likely to have stricter environmental protection policies and regulations, including limits on carbon emissions in the power sector, which may prompt the adoption of cleaner energy and emission reduction technologies in the power sector. The economic structure of these regions may be more skewed towards services and high-tech industries, which generally emit less carbon than an economic structure dominated by heavy industry. Better conditions for R&D and technological innovation, which may promote the development and application of low-carbon technologies and clean energy technologies, thus contribute to the reduction in carbon emissions [2].
For pilot and non-pilot regions, our empirical analysis shows that the impact of the national carbon market policy on carbon emission reductions in the electricity sector is different. While the national carbon market policy reduces the carbon emissions of the power sector in the pilot areas, the impact on the non-pilot regions is not significant. One possible reason is that the effect of carbon emissions trading policy is reflected later. For example, Chappin and Dijkema [39] found that absolute emissions from the electricity sector rose in most countries during the early stages of carbon markets, mainly because the economic effects of CO2 emissions trading in power generation were not sufficient to offset the economic incentives to choose high-emission energy sources such as coal. Therefore, in the early stage of the implementation of the carbon market policy, the marginal profit of thermal power is greater than the marginal cost brought by the purchase of carbon emission allowances, and enterprises can still make profits and lack the motivation to reduce emissions. This will lead to an increase in carbon emissions in the power industry, resulting in an insignificant effect of the national carbon market policy. However, in the later stage of the implementation of the carbon market policy, as the marginal cost of enterprises increases, firms will be motivated to reduce carbon emissions by developing emission reduction technologies or investing in renewable energy, which will lead to a reduction in carbon emissions in the power industry. Therefore, at the beginning of the policy implementation, the carbon emissions of the power industry in non-pilot areas will increase. If implemented for a long time, it is expected that carbon emissions from the power sector in non-pilot regions will be significantly reduced.
Figure 4 shows that, before the implementation of the national carbon market policy in 2021, the carbon emissions of the power industry in the seven provinces and cities that have been piloted were on a downward trend. However, before the implementation of the national carbon market policy in 2021, the average carbon emissions of the power sector in the 23 provinces and cities that were not piloted rose. This is consistent with the empirical results of this study. In addition to the above reasons, the difference in the impact of the national carbon market on the pilot areas and non-pilot regions may also be caused by the following reasons: the regions that have set up carbon pilots have advanced experience in carbon market operation, carbon allowance allocation, carbon trading and other aspects. This experience promotes innovation in low-carbon technologies in pilot regions [43], enabling them to adapt more quickly to the requirements of national carbon markets and manage carbon emissions and carbon assets more effectively.
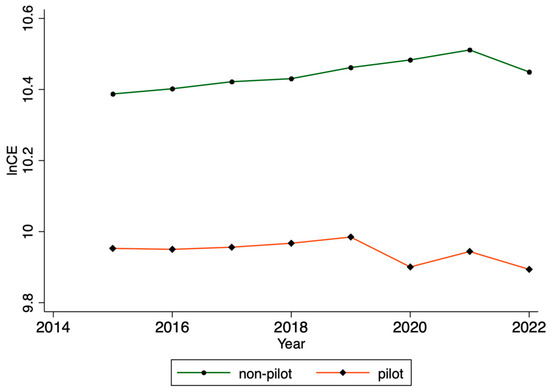
Figure 4.
Carbon emissions of the power sector in pilot and non-pilot regions. Note: The green line represents the mean value of carbon emissions in non-pilot areas, and the red line represents the mean value of carbon emissions in pilot regions.
According to Guo [44], financial support and supervision systems are necessary for the implementation of low-carbon policies. This means that a lack of financial support or monitoring systems could lead to increased carbon emissions. Carbon market institutions in carbon pilot regions may be more mature and perfect, including monitoring, reporting and verification (MRV) systems, as well as carbon trading and regulatory frameworks [45]. This helps them participate more effectively in the national carbon market. In these regions, companies and governments may already have a deeper understanding and preparation of the carbon market, including the monitoring and management of carbon emissions and the development of carbon trading strategies. Carbon pilot regions are likely to pay more attention to low-carbon technologies and green innovation, helping them gain competitive advantages in the carbon market while reducing carbon emissions. Meanwhile, carbon pilot regions may have started economic restructuring earlier to adapt to the requirements of low-carbon development, which may include the optimization of the industrial structure and the transformation of the energy consumption mode [46]. Carbon pilot regions introduced carbon pricing earlier to internalize the external cost of carbon emissions and promote the formation of emission reduction incentives. All of these reasons will lead to the improvement of the efficiency of the national carbon market policy in the pilot areas.
Finally, we find that the intensity of government policy regulation affects the emission reduction effect of the national carbon market policy, which is consistent with the literature. For example, Shi et al. [14] believed that the implementation effect of carbon trading pilot policy largely depends on the strength of environmental regulation. Similarly, we find that the effect of the national carbon market on carbon emission reduction in the power sector is more significant in regions with stronger policy regulation. Lin and Huang [19] reported that the pilot carbon market in China did achieve carbon emission reductions under the premise of an immature carbon market. Their further study showed that the emission reduction effect of China’s carbon market is achieved through government intervention rather than market mechanisms. The significant difference in the impact of the national carbon market policy on carbon emission reduction between regions with strong and weak policy regulation can thus be explained. Furthermore, this finding highlights the importance of the combination of market mechanisms and policy interventions to reduce carbon emissions.
6. Conclusions
China has pledged to reach carbon peak before 2030 and carbon neutrality before 2060. As a major source of carbon emissions, the abatement effect of the power sector is crucial to achieving this target. Through the pricing mechanism, the carbon market can promote the optimal allocation of resources among enterprises and sectors with different abatement costs to achieve cost-effective emission reductions. Therefore, this paper aimed to study the impact of a national carbon market policy on carbon emission reductions in China’s power sector. The empirical analysis based on the generalized DID model finds that the national carbon market policy significantly inhibits the carbon emissions of the power sector. However, this effect is only significant in areas with carbon pilots, and the effect in areas without carbon pilots is statistically insignificant. One possible reason is that the non-pilot areas were affected by the national carbon market policy for a relatively short period of time. For regions with weak supervision, the effect of the national carbon market policy on carbon emission reduction is insignificant, but becomes statistically significant for regions with strong policy supervision.
Our study has important policy implications. First of all, policy makers should attach importance to the successful experiences and practices of carbon pilot areas, and extend these experiences to non-pilot areas through policy guidance and technical support to help these areas establish and improve the carbon market mechanism. Second, considering the differences in carbon market construction in different regions, a differentiated approach should be adopted in policy formulation, and more policy support and incentive measures may be needed for regions that have not established carbon pilots. For regions that have not established carbon pilots, capacity building needs to be strengthened, including raising awareness of carbon market rules among enterprises and government officials, and strengthening the capacity of enterprises to monitor, report and verify carbon emissions (MRV). The government should encourage and support technological innovation and provide technical and financial support to non-pilot regions to help them adopt cleaner and more efficient energy technologies and reduce carbon emissions. Third, exchanges and cooperation between pilot and non-pilot regions should be encouraged to promote coordinated emission reductions between regions through knowledge sharing and technology transfer. Finally, long-term carbon market development and emission reduction strategic planning should be formulated to ensure policy continuity and stability, and to provide clear market expectations for enterprises. The above policy implications can help regions that have not established carbon pilots to speed up the construction of carbon markets and improve the emission reduction effect of the national carbon market policy, so as to better achieve China’s carbon peak and carbon neutrality goals.
This study can be expanded from a number of perspectives in the future. For example, future research could examine the transmission mechanism of the emission reduction effect of the national carbon market on the electricity sector. In addition, it is also very important to test whether the emission reduction effect of the national carbon market on the power sector will be strengthened in non-pilot areas over time.
Author Contributions
Conceptualization, Y.X. and S.Z.; methodology, Y.X. and S.Z.; software, S.Z. and B.C.; validation, Y.X., S.Z. and Y.Z.; formal analysis, Y.X. and S.Z.; investigation, Y.X. and S.Z.; resources, S.Z. and Y.Z.; data curation, S.Z. and B.C.; writing—original draft preparation, Y.X. and S.Z.; visualization, Y.X. and S.Z.; supervision, Y.X.; project administration, Y.X.; funding acquisition, Y.X. and Y.Z. All authors have read and agreed to the published version of the manuscript.
Funding
This research was funded by the National Natural Science Foundation of China, grant number 72203019, and the Fundamental Research Funds for the Central Universities, China Foreign Affairs University, grant number 3162023XSX03.
Data Availability Statement
The data come from the China Statistical Yearbook, China Energy Statistical Yearbook and the official websites of local governments.
Conflicts of Interest
The authors declare no conflicts of interest.
References
- Nejat, P.; Jomehzadeh, F.; Taheri, M.M.; Gohari, M.; Majid, M.Z.A. A global review of energy consumption, CO2 emissions and policy in the residential sector (with an overview of the top ten CO2 emitting countries). Renew. Sustain. Energy Rev. 2015, 43, 843–862. [Google Scholar] [CrossRef]
- Xu, Y.; Xu, Z.; Zhou, Y.; Su, C.; Guo, L. Interactions between carbon prices and the construction industry in China: Evidence based on Network-SVAR. Build. Environ. 2022, 215, 108936. [Google Scholar] [CrossRef]
- Lederer, M. Market making via regulation: The role of the state in carbon markets. Regul. Gov. 2012, 6, 524–544. [Google Scholar] [CrossRef]
- Xu, Y.; Salem, S. Explosive behaviors in Chinese carbon markets: Are there price bubbles in eight pilots? Renew. Sustain. Energy Rev. 2021, 145, 111089. [Google Scholar] [CrossRef]
- Cui, J.; Wang, C.; Zhang, J.; Zheng, Y. The effectiveness of China’s regional carbon market pilots in reducing firm emissions. Proc. Natl. Acad. Sci. USA 2021, 118, e2109912118. [Google Scholar] [CrossRef]
- Perdan, S.; Azapagic, A. Carbon trading: Current schemes and future developments. Energy Policy 2011, 39, 6040–6054. [Google Scholar] [CrossRef]
- Teixidó, J.; Verde, S.F.; Nicolli, F. The impact of the EU Emissions Trading System on low-carbon technological change: The empirical evidence. Ecol. Econ. 2019, 164, 106347. [Google Scholar] [CrossRef]
- Bayer, P.; Aklin, M. The European Union emissions trading system reduced CO2 emissions despite low prices. Proc. Natl. Acad. Sci. USA 2020, 117, 8804–8812. [Google Scholar] [CrossRef]
- Bai, J.; Ru, H. Carbon emissions trading and environmental protection: International evidence. Manag. Sci. 2024. [Google Scholar] [CrossRef]
- Dechezleprêtre, A.; Nachtigall, D.; Venmans, F. The joint impact of the European Union emissions trading system on carbon emissions and economic performance. J. Environ. Econ. Manag. 2023, 118, 102758. [Google Scholar] [CrossRef]
- Qi, S.; Cheng, S.; Cui, J. Environmental and economic effects of China’s carbon market pilots: Empirical evidence based on a DID model. J. Clean. Prod. 2021, 279, 123720. [Google Scholar] [CrossRef]
- Yi, L.; Bai, N.; Yang, L.; Li, Z.; Wang, F. Evaluation on the effectiveness of China’s pilot carbon market policy. J. Clean. Prod. 2020, 246, 119039. [Google Scholar] [CrossRef]
- Zhang, W.; Li, J.; Li, G.; Guo, S. Emission reduction effect and carbon market efficiency of carbon emissions trading policy in China. Energy 2020, 196, 117117. [Google Scholar] [CrossRef]
- Shi, B.; Li, N.; Gao, Q.; Li, G. Market incentives, carbon quota allocation and carbon emission reduction: Evidence from China’s carbon trading pilot policy. J. Environ. Manag. 2022, 319, 115650. [Google Scholar] [CrossRef]
- Zhang, C.; Lin, B. Impact of introducing Chinese certified emission reduction scheme to the carbon market: Promoting renewable energy. Renew. Energy 2024, 222, 119887. [Google Scholar] [CrossRef]
- Gu, G.; Zheng, H.; Tong, L.; Dai, Y. Does carbon financial market as an environmental regulation policy tool promote regional energy conservation and emission reduction? Empirical evidence from China. Energy Policy 2022, 163, 112826. [Google Scholar] [CrossRef]
- Ma, G.; Qin, J.; Zhang, Y. Does the carbon emissions trading system reduce carbon emissions by promoting two-way FDI in developing countries? Evidence from Chinese listed companies and cities. Energy Econ. 2023, 120, 106581. [Google Scholar] [CrossRef]
- Wu, J.; Nie, X.; Wang, H. Curse to blessing: The carbon emissions trading system and resource-based cities’ carbon mitigation. Energy Policy 2023, 183, 113796. [Google Scholar] [CrossRef]
- Lin, B.; Huang, C. Analysis of emission reduction effects of carbon trading: Market mechanism or government intervention? Sustain. Prod. Consum. 2022, 33, 28–37. [Google Scholar] [CrossRef]
- Li, M.; Gao, H.; Abdulla, A.; Shan, R.; Gao, S. Combined effects of carbon pricing and power market reform on CO2 emissions reduction in China’s electricity sector. Energy 2022, 257, 124739. [Google Scholar] [CrossRef]
- Wu, R.; Tan, Z.; Lin, B. Does carbon emission trading scheme really improve the CO2 emission efficiency? Evidence from China’s iron and steel industry. Energy 2023, 277, 127743. [Google Scholar] [CrossRef]
- Wang, Y.; Liu, J.; Zhao, Z.; Ren, J.; Chen, X. Research on carbon emission reduction effect of China’s regional digital trade under the “double carbon” target––combination of the regulatory role of industrial agglomeration and carbon emissions trading mechanism. J. Clean. Prod. 2023, 405, 137049. [Google Scholar] [CrossRef]
- Li, Y.; Zhang, Y.; Pan, A.; Han, M.; Veglianti, E. Carbon emission reduction effects of industrial robot applications: Heterogeneity characteristics and influencing mechanisms. Technol. Soc. 2022, 70, 102034. [Google Scholar] [CrossRef]
- Zhang, Y.; Li, S.; Luo, T.; Gao, J. The effect of emission trading policy on carbon emission reduction: Evidence from an integrated study of pilot regions in China. J. Clean. Prod. 2020, 265, 121843. [Google Scholar] [CrossRef]
- Chen, S.; Shi, A.; Wang, X. Carbon emission curbing effects and influencing mechanisms of China’s Emission Trading Scheme: The mediating roles of technique effect, composition effect and allocation effect. J. Clean. Prod. 2020, 264, 121700. [Google Scholar] [CrossRef]
- Yang, X.; Jiang, P.; Pan, Y. Does China’s carbon emission trading policy have an employment double dividend and a Porter effect? Energy Policy 2020, 142, 111492. [Google Scholar] [CrossRef]
- Lv, M.; Bai, M. Evaluation of China’s carbon emission trading policy from corporate innovation. Financ. Res. Lett. 2021, 39, 101565. [Google Scholar] [CrossRef]
- Wang, X.; Wang, S. Effect of carbon trading pilot policy on carbon emission reduction in electricity. Distrib. Energy 2023, 8, 10–16. (In Chinese) [Google Scholar]
- Feng, X.; Zhao, Y.; Yan, R. Does carbon emission trading policy has emission reduction effect? An empirical study based on quasi-natural experiment method. J. Environ. Manag. 2024, 351, 119791. [Google Scholar] [CrossRef]
- Zhang, Y.; Zhang, J. Estimating the impacts of emissions trading scheme on low-carbon development. J. Clean. Prod. 2019, 238, 117913. [Google Scholar] [CrossRef]
- Ehrlich, P.R.; Holdren, J.P. Impact of Population Growth: Complacency concerning this component of man’s predicament is unjustified and counterproductive. Science 1971, 171, 1212–1217. [Google Scholar] [CrossRef]
- Joos, F.; Prentice, I.C.; Sitch, S.; Meyer, R.; Hooss, G.; Plattner, G.K.; Hasselmann, K. Global warming feedbacks on terrestrial carbon uptake under the Intergovernmental Panel on Climate Change (IPCC) emission scenarios. Glob. Biogeochem. Cycles 2001, 15, 891–907. [Google Scholar] [CrossRef]
- Kroll, C.N.; Song, P. Impact of multicollinearity on small sample hydrologic regression models. Water Resour. Res. 2013, 49, 3756–3769. [Google Scholar] [CrossRef]
- Mansfield, E.R.; Helms, B.P. Detecting multicollinearity. Am. Stat. 1982, 36, 158–160. [Google Scholar]
- O’brien, R.M. A caution regarding rules of thumb for variance inflation factors. Qual. Quant. 2007, 41, 673–690. [Google Scholar] [CrossRef]
- Zhang, G.; Bi, S. Inhibition or promotion: The impact of carbon emission trading on market structure: Evidence from China. Front. Energy Res. 2023, 11, 1238416. [Google Scholar] [CrossRef]
- Feng, R.; Lin, P.; Hou, C.; Jia, S. Study of the effect of China’s emissions trading scheme on promoting regional industrial carbon emission reduction. Front. Environ. Sci. 2022, 10, 947925. [Google Scholar] [CrossRef]
- Liu, L.L.; Feng, T.T.; Kong, J.J. Can carbon trading policy and local public expenditures synergize to promote carbon emission reduction in the power industry? Resour. Conserv. Recycl. 2023, 188, 106659. [Google Scholar] [CrossRef]
- Chappin, E.J.L.; Dijkema, G.P.J. On the impact of CO2 emission-trading on power generation emissions. Technol. Forecast. Soc. Chang. 2009, 76, 358–370. [Google Scholar] [CrossRef]
- Madlener, R.; Sunak, Y. Impacts of urbanization on urban structures and energy demand: What can we learn for urban energy planning and urbanization management? Sustain. Cities Soc. 2011, 1, 45–53. [Google Scholar] [CrossRef]
- Gu, C. Urbanization: Processes and driving forces. Sci. China Earth Sci. 2019, 62, 1351–1360. [Google Scholar] [CrossRef]
- Démurger, S. Infrastructure development and economic growth: An explanation for regional disparities in China? J. Comp. Econ. 2001, 29, 95–117. [Google Scholar] [CrossRef]
- Cui, J.; Zhang, J.; Zheng, Y. Carbon pricing induces innovation: Evidence from China’s regional carbon market pilots. In AEA Papers and Proceedings; American Economic Association: Nashville, TN, USA, 2018; Volume 108, pp. 453–457. [Google Scholar]
- Guo, S. Exploring low-carbon pilot city policy implementation: Evidence from China. Clim. Policy 2023, 23, 1045–1057. [Google Scholar] [CrossRef]
- Xu, Y.; Shao, X.; Tanasescu, C. How are artificial intelligence, carbon market, and energy sector connected? A systematic analysis of time-frequency spillovers. Energy Econ. 2024, 132, 107477. [Google Scholar] [CrossRef]
- Shen, B.; Yang, X.; Xu, Y.; Ge, W.; Liu, G.; Su, X.; Ran, Q. Can carbon emission trading pilot policy drive industrial structure low-carbon restructuring: New evidence from China. Environ. Sci. Pollut. Res. 2023, 30, 41553–41569. [Google Scholar] [CrossRef]

Disclaimer/Publisher’s Note: The statements, opinions and data contained in all publications are solely those of the individual author(s) and contributor(s) and not of MDPI and/or the editor(s). MDPI and/or the editor(s) disclaim responsibility for any injury to people or property resulting from any ideas, methods, instructions or products referred to in the content. |
© 2024 by the authors. Licensee MDPI, Basel, Switzerland. This article is an open access article distributed under the terms and conditions of the Creative Commons Attribution (CC BY) license (https://creativecommons.org/licenses/by/4.0/).