Abstract
Hydrate-based CO2 sequestration is a novel approach that can not only realize permanent CO2 sequestration but can also form an artificial cap to prevent its upward migration. In this work, a self-developed large-scale 3D apparatus was employed to investigate hydrate formation characteristics in hydrate-based CO2 sequestration at a constant liquid CO2 injection rate through a vertical well for the first time. Temperature and pressure evolutions in the sediment were analyzed in detail. Key indicators, including cumulative sequestered CO2, CO2 in hydrate and liquid phases, the instantaneous hydrate conversion, and liquid CO2 retention rates, were calculated. The results show that hydrate continuously forms with increased CO2 injection and exhibits strong heterogeneity due to the variation in hydrate formation rate and quantity. Severe liquid CO2 heterogeneous figuring phenomena occur since hydrate deteriorates the effective pore structure and topology, resulting in relatively small cumulative sequestered CO2 when a large amount of CO2 is released from the outlet. Meanwhile, the instantaneous hydrate conversion and liquid CO2 retention rates have large fluctuations owing to water consumption and variation in the effective contact area between liquid CO2 and water. However, hydrate formation does not cause blockage of wellbore and formation nearby under given experimental conditions, which is beneficial for hydrate formation in deeper sediment. This study provides insights into hydrate formation and liquid CO2 immigration regularity during hydrate-based CO2 sequestration and demonstrates its feasibility at a field scale.
1. Introduction
With the exacerbation of global warming, rising sea levels, and the intensification of extreme weather in recent years [1,2,3,4], CO2 emission reduction has been gaining attention globally [5]. As one of the key approaches to achieving CO2 reduction [6,7,8,9], CO2 geological sequestration is estimated to contribute to a cumulative reduction ratio of over 15%. Currently, most field tests about CO2 storage focus on saline aquifers [10,11,12,13,14,15] with sequestration mechanisms [16,17] involving structural trapping, capillary trapping, solubility trapping, and mineralization, with the latter being recognized as the most enduring and secure mode. However, the geochemical reaction rate is extremely slow [18,19] which aggregates CO2 leakage risk [20]. As a novel CO2 geological sequestration technology through the formation of hydrate in the sediment [21,22,23], hydrate-based CO2 sequestration can not only enable stable CO2 storage [24,25,26] but can also prevent its upward migration [27,28,29,30], reducing CO2 leakage risk from the underlying layer. Current research on CO2 regarding the replacement of natural gas hydrate [31,32,33,34,35,36] with the mechanical stability of the sediment after the replacement is maintained by the generated CO2 hydrate [37,38,39] has confirmed the feasibility of CO2 sequestration in the form of solid hydrate [40,41,42]. Therefore, there is an urgent need to investigate CO2 migration and hydrate formation characteristics during hydrate-based CO2 sequestration.
In recent years, many investigations on hydrate-based CO2 sequestration have been carried out [43,44,45]. Liu et al. (2018) [46] studied CO2 hydrate dynamic formation regularity in depleted natural gas hydrate reservoirs through a series of sequential experiments, including natural gas hydrate formation and dissociation in the sediment as well as CO2 injection and water replenishment combined with MRI. The results indicated that CO2 hydrate and connate water saturation after hydrate formation was proportional to the initial water content, and subsequent water replenishment was beneficial for continuous CO2 hydrate formation. Zheng et al. (2020) [47] summarized the research on hydrate-based CO2 sequestration in various regions containing deep-sea and sub-seafloor saline formation, permafrost, and natural gas hydrate deposits. The technical feasibility, potential, challenges, and prospects of hydrate-based CO2 sequestration were pointed out, while no effective analysis of the scale effects and economic aspects involved was conducted. In 2021, Zhang et al. [48] explored the feasibility of CO2 sequestration in the sediment where the temperature and pressure for hydrate formation were satisfied with pressure-controlling methods through CO2 injection and water production wells based on the CMG STARS simulator. The results showed that formed hydrate delayed CO2 breakthrough to the water production well and inhibited the subsequent CO2 injection by compressing the effective pore space to a certain extent. However, the simulation results were not validated with experimental data. In 2022, Kuang et al. [49] observed in situ CO2 hydrate formation using pressure oscillations combined with low-field MRI techniques. The experimental results indicated that CO2 hydrate preferentially formed in larger pores and hindered the CO2–water contact area. In addition, it was beneficial for hydrate-based CO2 sequestration at high initial water saturation when the displacement pressure was large. Zhao et al. (2023) [50] investigated CO2 upward transport and the Plugging Law caused by hydrate formation in overlying layers at different injection rates by MRI and flow characteristic analysis. It was indicated that a low CO2 injection rate and a high overburden pressure were beneficial for hydrate formation. Moreover, the strength of the hydrate cap increased with continuous hydrate formation. Meanwhile, Beatrice Castellani (2023) [51] analyzed the role of hydrate-based CO2 sequestration in traditional CO2 geological storage and discussed the knowledge required to pursue a stable, efficient, and environmentally friendly pathway for hydrate-based CO2 sequestration.
Although many scholars have conducted foundational research on hydrate-based CO2 sequestration [52,53,54], current conclusions drawn from small-scale experiments and numerical simulations need further validation due to the scale effects and complex mechanisms involved in hydrate formation and migration. To overcome the scale effects on CO2 transport and hydrate formation in hydrate-based CO2 sequestration, a self-developed large-scale 3D platform with a maximal volume of 1695 L, a maximal pressure of 30 MPa, and a temperature ranging from −20 to 200 °C was employed to investigate hydrate formation characteristics in the sediment where the temperature and pressure were satisfied for hydrate formation at a constant liquid CO2 injection rate through a vertical well. The dynamic evolution of the pressure and temperature in the sediment was analyzed in detail, revealing CO2 hydrate dynamic formation regularity. Afterward, the amount of cumulative sequestered CO2, CO2 percentage in hydrate and liquid phases, and the instantaneous hydrate conversion and liquid CO2 retention rates were calculated. This work revealed liquid CO2 transport and hydrate formation characteristics from a large-scale perspective for the first time, providing robust data support for hydrate-based CO2 sequestration at a field scale.
2. Experimental Setup and Procedure
2.1. Experimental Setup
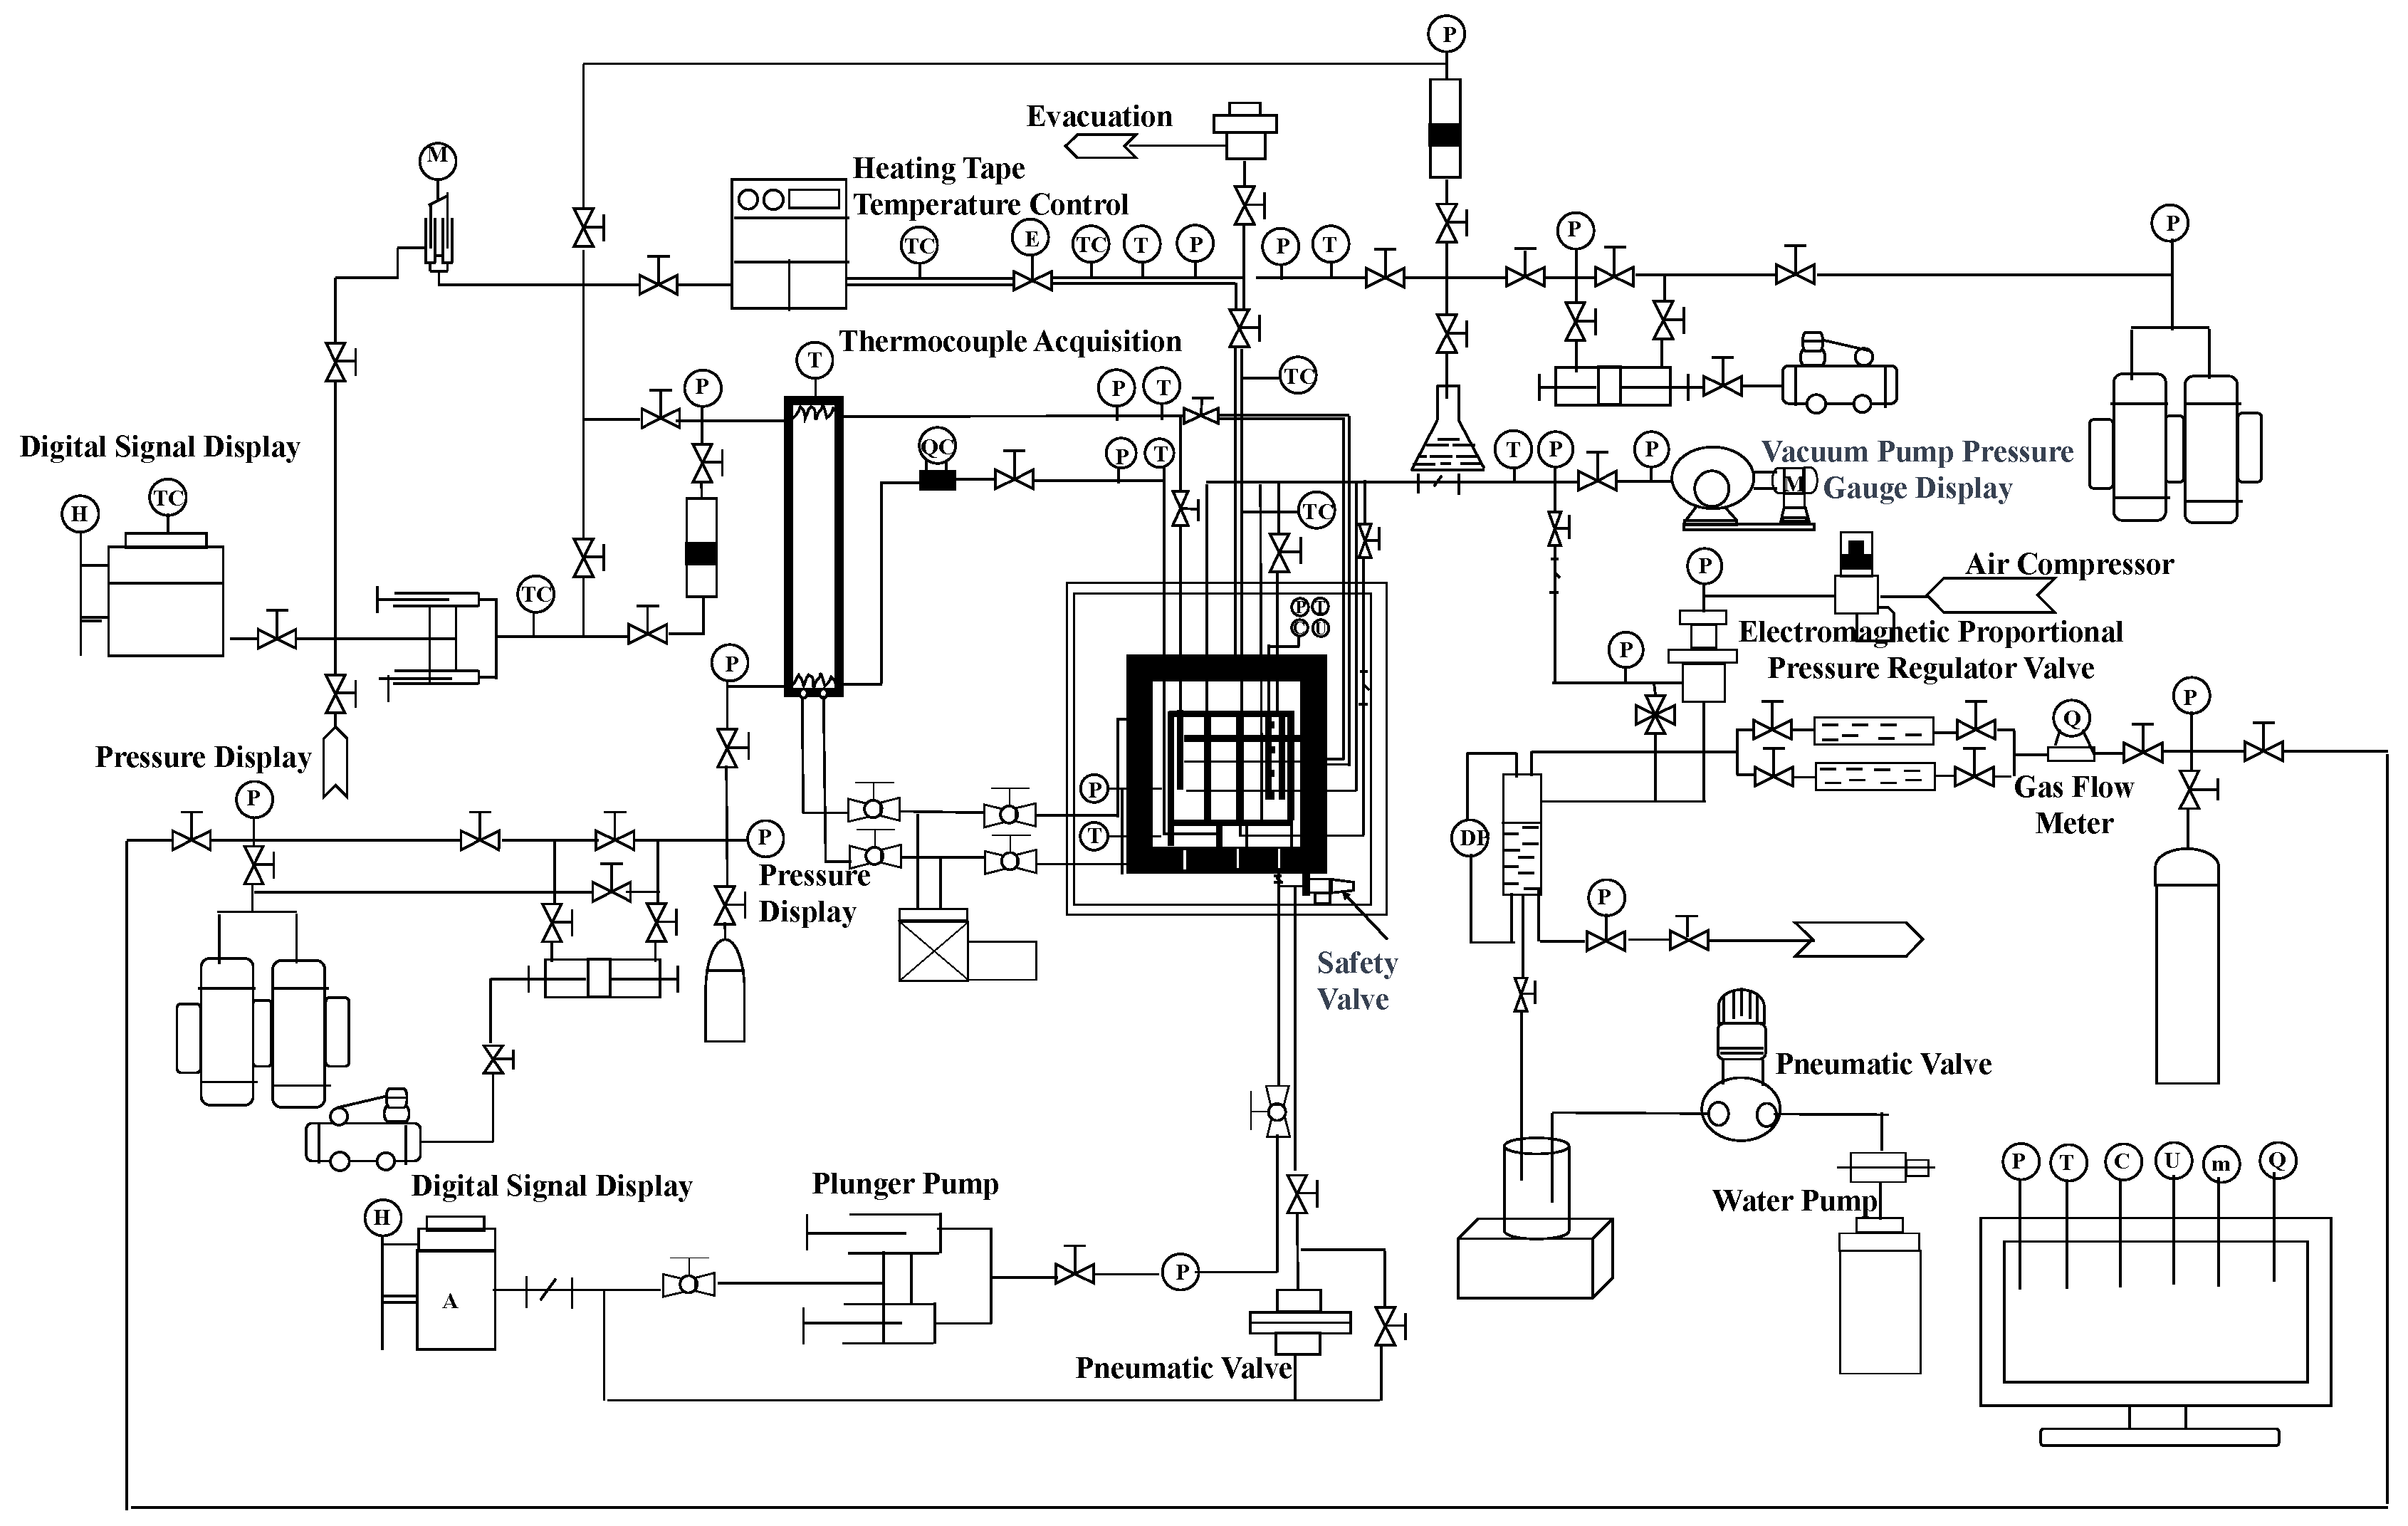
The self-developed large-scale 3D platform with a maximal volume of 1695 L, maximal pressure of 30 MPa, and temperature ranging from −20 to 200 °C was employed to carry out experiments on hydrate-based CO2 sequestration. As shown in Figure 1, the whole system can be divided into eight parts, which are the main body module, liquid injection module, gas injection module, temperature control module, vacuum pump module, back pressure control module, ambient pressure control module, fluid production module, and data measurement and acquisition module. The main body module is the core of the entire system, which is used to reshape the sediment for CO2 migration and hydrate formation. It consists of components such as a high-pressure reactor vessel, internal model, pipeline extraction system, load-bearing operating platform, hydraulic system, and so on. The liquid injection module is used for liquid CO2 injection. The temperature control module is primarily composed of a stepwise low-temperature control chamber, a water jacket, and a refrigeration unit, which are used to adjust the temperature for hydrate formation. The ambient pressure control module is utilized to maintain the pressure difference between the internal model and the chamber in the reactor vessel. The back pressure module is employed to control pressure in the internal model to prevent an excessively high value caused by liquid CO2 injection. The data measurement and acquisition module is used to quantify fluid production when the pressure in the internal module surpasses the back pressure at the outlet. The instruments or components involved in the experimental setup were sourced from Yongruida Technology Co., Ltd., Beijing, China.

Figure 1.
Schematic of the large-scale experimental setup.
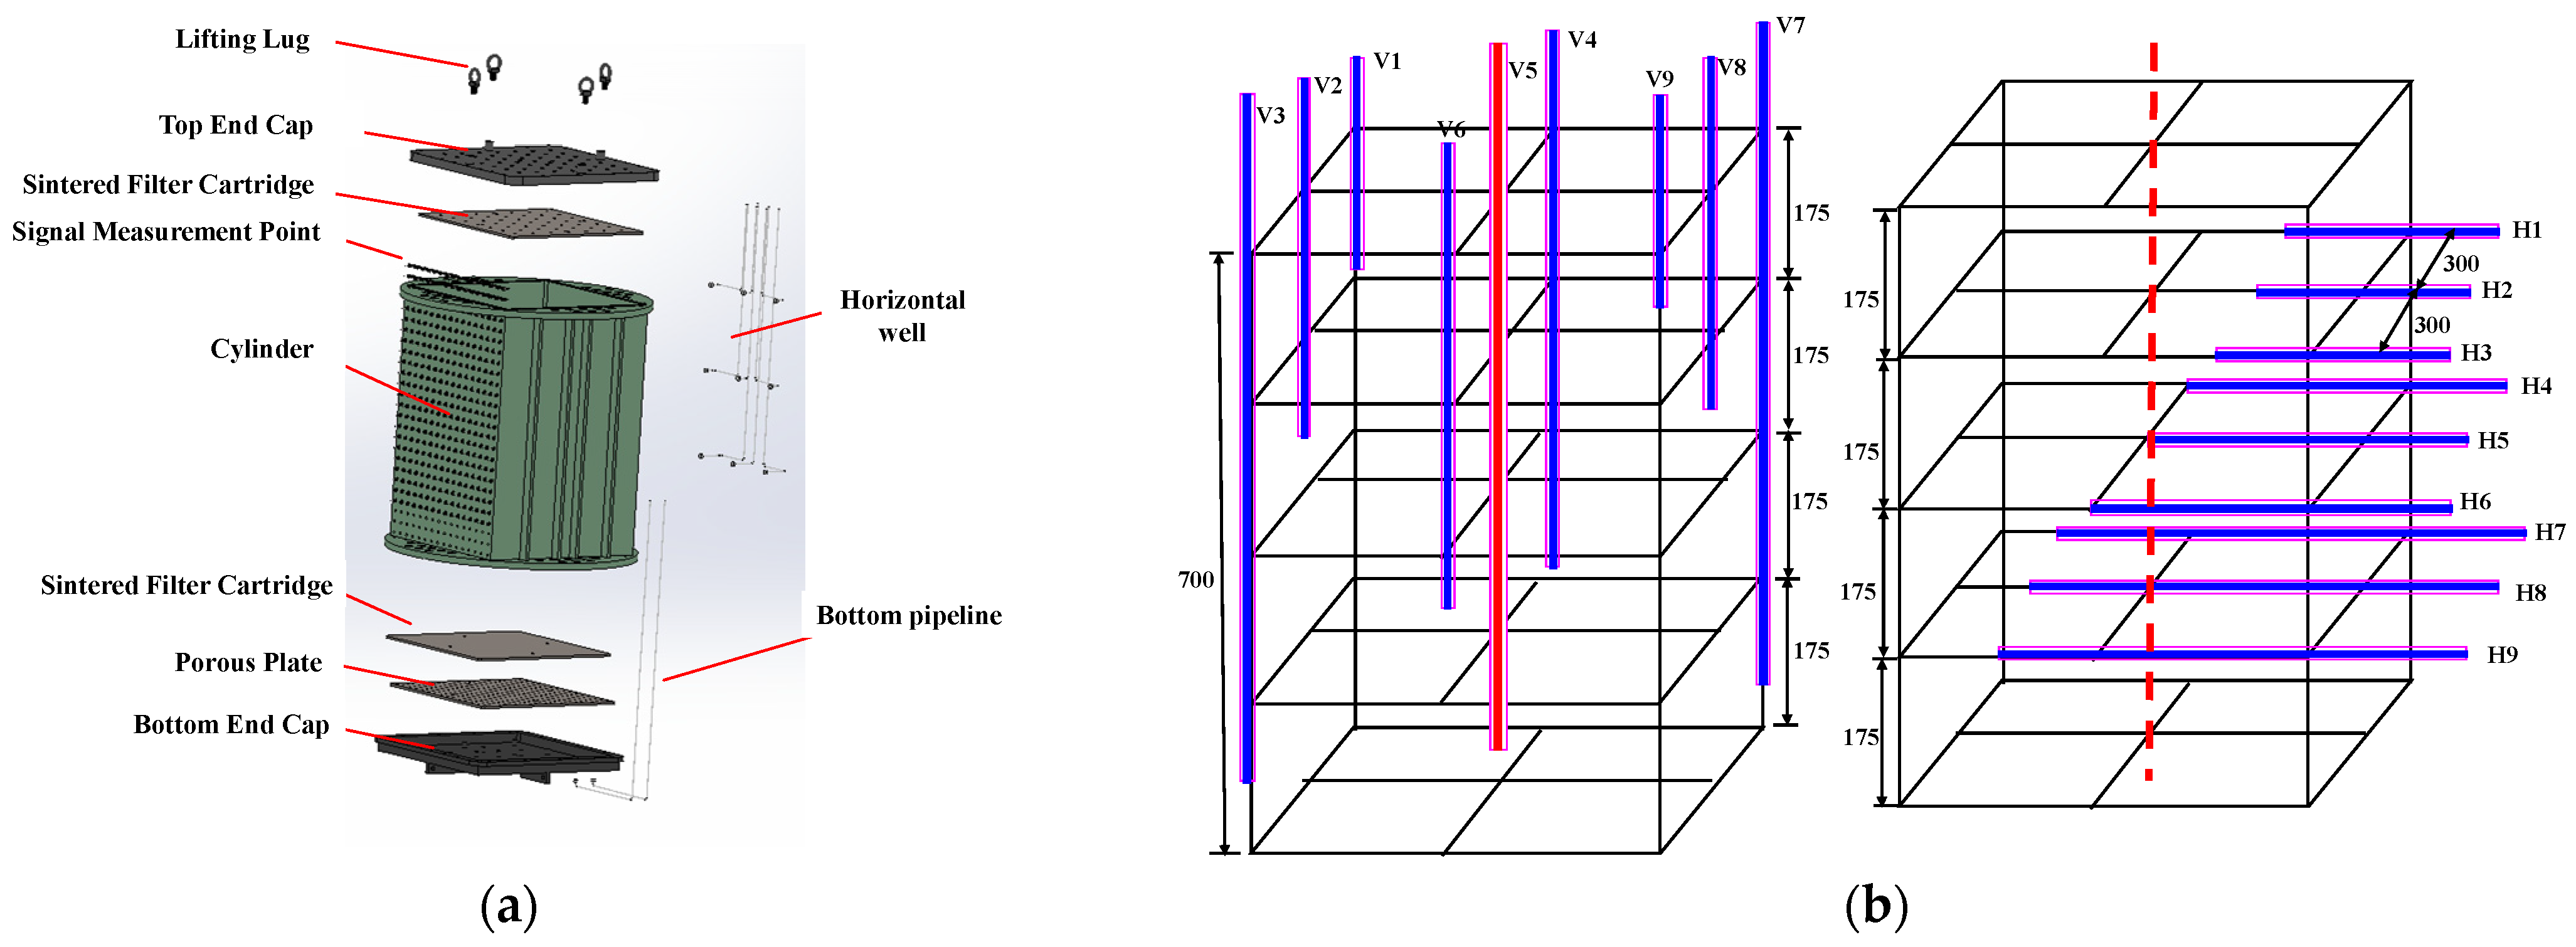
Compared to other large-scale 3D experimental systems, this platform has an internal reaction vessel with a size of 760 × 760 × 700 mm3 (Figure 2a), which can be used to apply confining pressure and better reshape the real sediment. The components of the square internal module include a lifting lug, top endcap, sintered filter cartridge, cylinder, porous plate, bottom endcap, and bottom pipeline. Nine vertical and nine horizontal wells are placed in the internal module, with their distribution shown in Figure 2b. Three vertical wells labeled V3, V5, and V7 are distributed in the lower region, which has a distance of 90 mm to the bottom. Two vertical wells named V1 and V9 are located in the first layer from the top of the internal model, while another two vertical wells, namely, V2 and V8, are situated in the second layer. The V4 and V6 wells are positioned in the third layer. Three horizontal wells, namely, H1, H2, and H3, are penetrated to a depth of 150 mm into the internal model, while the horizontal wells H4, H5, and H6 are extended to a depth of 350 mm. The H7, H8, and H9 wells are extended to a depth of 500 mm into the internal model. The horizontal and vertical wells exhibit interleaved arrangements, allowing for liquid CO2 injection under different well types or well patterns. In the experiment, the internal module is used to reshape the marine sediment with sieved sand to investigate CO2 immigration and hydrate formation during CO2 injection, and the vertical well labeled as V5 is employed as the injection well.
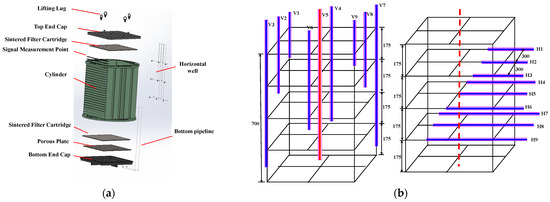
Figure 2.
(a) Internal model. (b) Well patterns (Dashed lines mean central axis of the internal reaction vessel).
In addition, eighty temperature and eighty pressure detection points are distributed at five layers in the internal model, with sixteen of them arranged in each layer, as shown in Figure 3. The temperature detection points exhibit a square-shaped distribution in each detected cell, while the pressure detection points show a diamond-shaped arrangement. The temperature and pressure detection points are arranged in an interleaved distribution, which can be used for real-time monitoring during liquid CO2 injection. The temperature and pressure signals collected by the detection points are transferred to a computer in another room to be recorded.
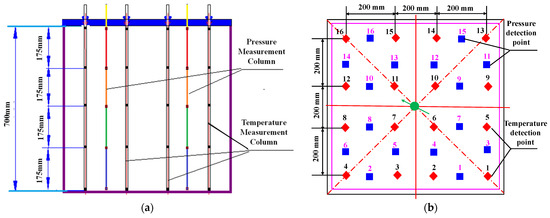
Figure 3.
Distribution of the temperature and pressure detection points in the internal model: (a) side view and (b) top view (Color labels of red and blue dots respectively represent temperature and pressure detection points with the numbers indicating their index identifiers, green arrow indicates injection well).
2.2. Experimental Procedure
The detailed experimental procedure of hydrate-based CO2 sequestration is shown as follows:
- (1)
- A certain amount of sand with a particle size of 120 mesh was first prepared and mixed with water for sand washing. Afterward, the sand was placed into the incubator for drying and was selected a second time to ensure the consistency of the sand particle mesh.
- (2)
- The sieved sand and water were mixed again in the stainless steel to make all the sand wet, and the water between the sand particles was discharged. The sand with the remaining water was then evenly stirred to ensure that the water on the sand surface was as uniform as possible.
- (3)
- The wet sand was filled into the internal model and compacted evenly layer by layer. After sealing, the internal model was turned over and kept standing to ensure the uniform distribution of water between the sand particles. The internal model was then placed into the large reactor vessel with a volume of 1695 L.
- (4)
- Nitrogen was then injected into the internal model from the bottom until the pressure reached 13.5 MPa, which was maintained for 7 h to test the seal of the system.
- (5)
- After the seal check, water was injected into the internal model from the bottom to displace the nitrogen. The top valve was then closed, and water injection continued until the pressure in the internal model reached 11 MPa.
- (6)
- The chiller and cold-water jacket were then opened to adjust the temperature of the internal model to 7 °C. It can be seen from Figure 4 that the reshaped sediment satisfied the condition for hydrate-based CO2 sequestration.
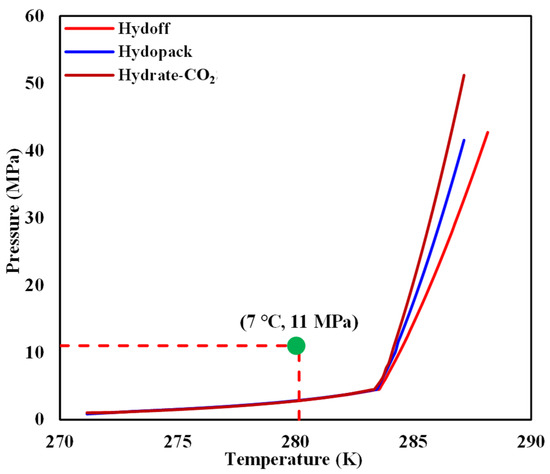 Figure 4. Comparison of the initial temperature and pressure in the internal model with a CO2 hydrate-phase equilibrium curve.
 - (7)
- Afterward, liquid CO2 was injected into the internal model at a constant flux of 10 mL/min through an intermediate vertical well labeled as V5. To avoid an exceedingly high pressure in the inlet model, an outlet was set at the bottom with a back pressure of 12 MPa.
- (8)
- The water and CO2 produced were recorded once the outlet was opened due to a pressure difference. When one tank of liquid CO2 injection was completed, another tank was opened until a large amount of CO2 was released from the outlet.
- (9)
- The cumulative sequestered CO2 and proportion of CO2 in the hydrate and the fluid were calculated.
3. Results and Analysis
3.1. Evolution of the Temperature and Pressure during Liquid CO2 Injection
3.1.1. Evolution of the Temperature
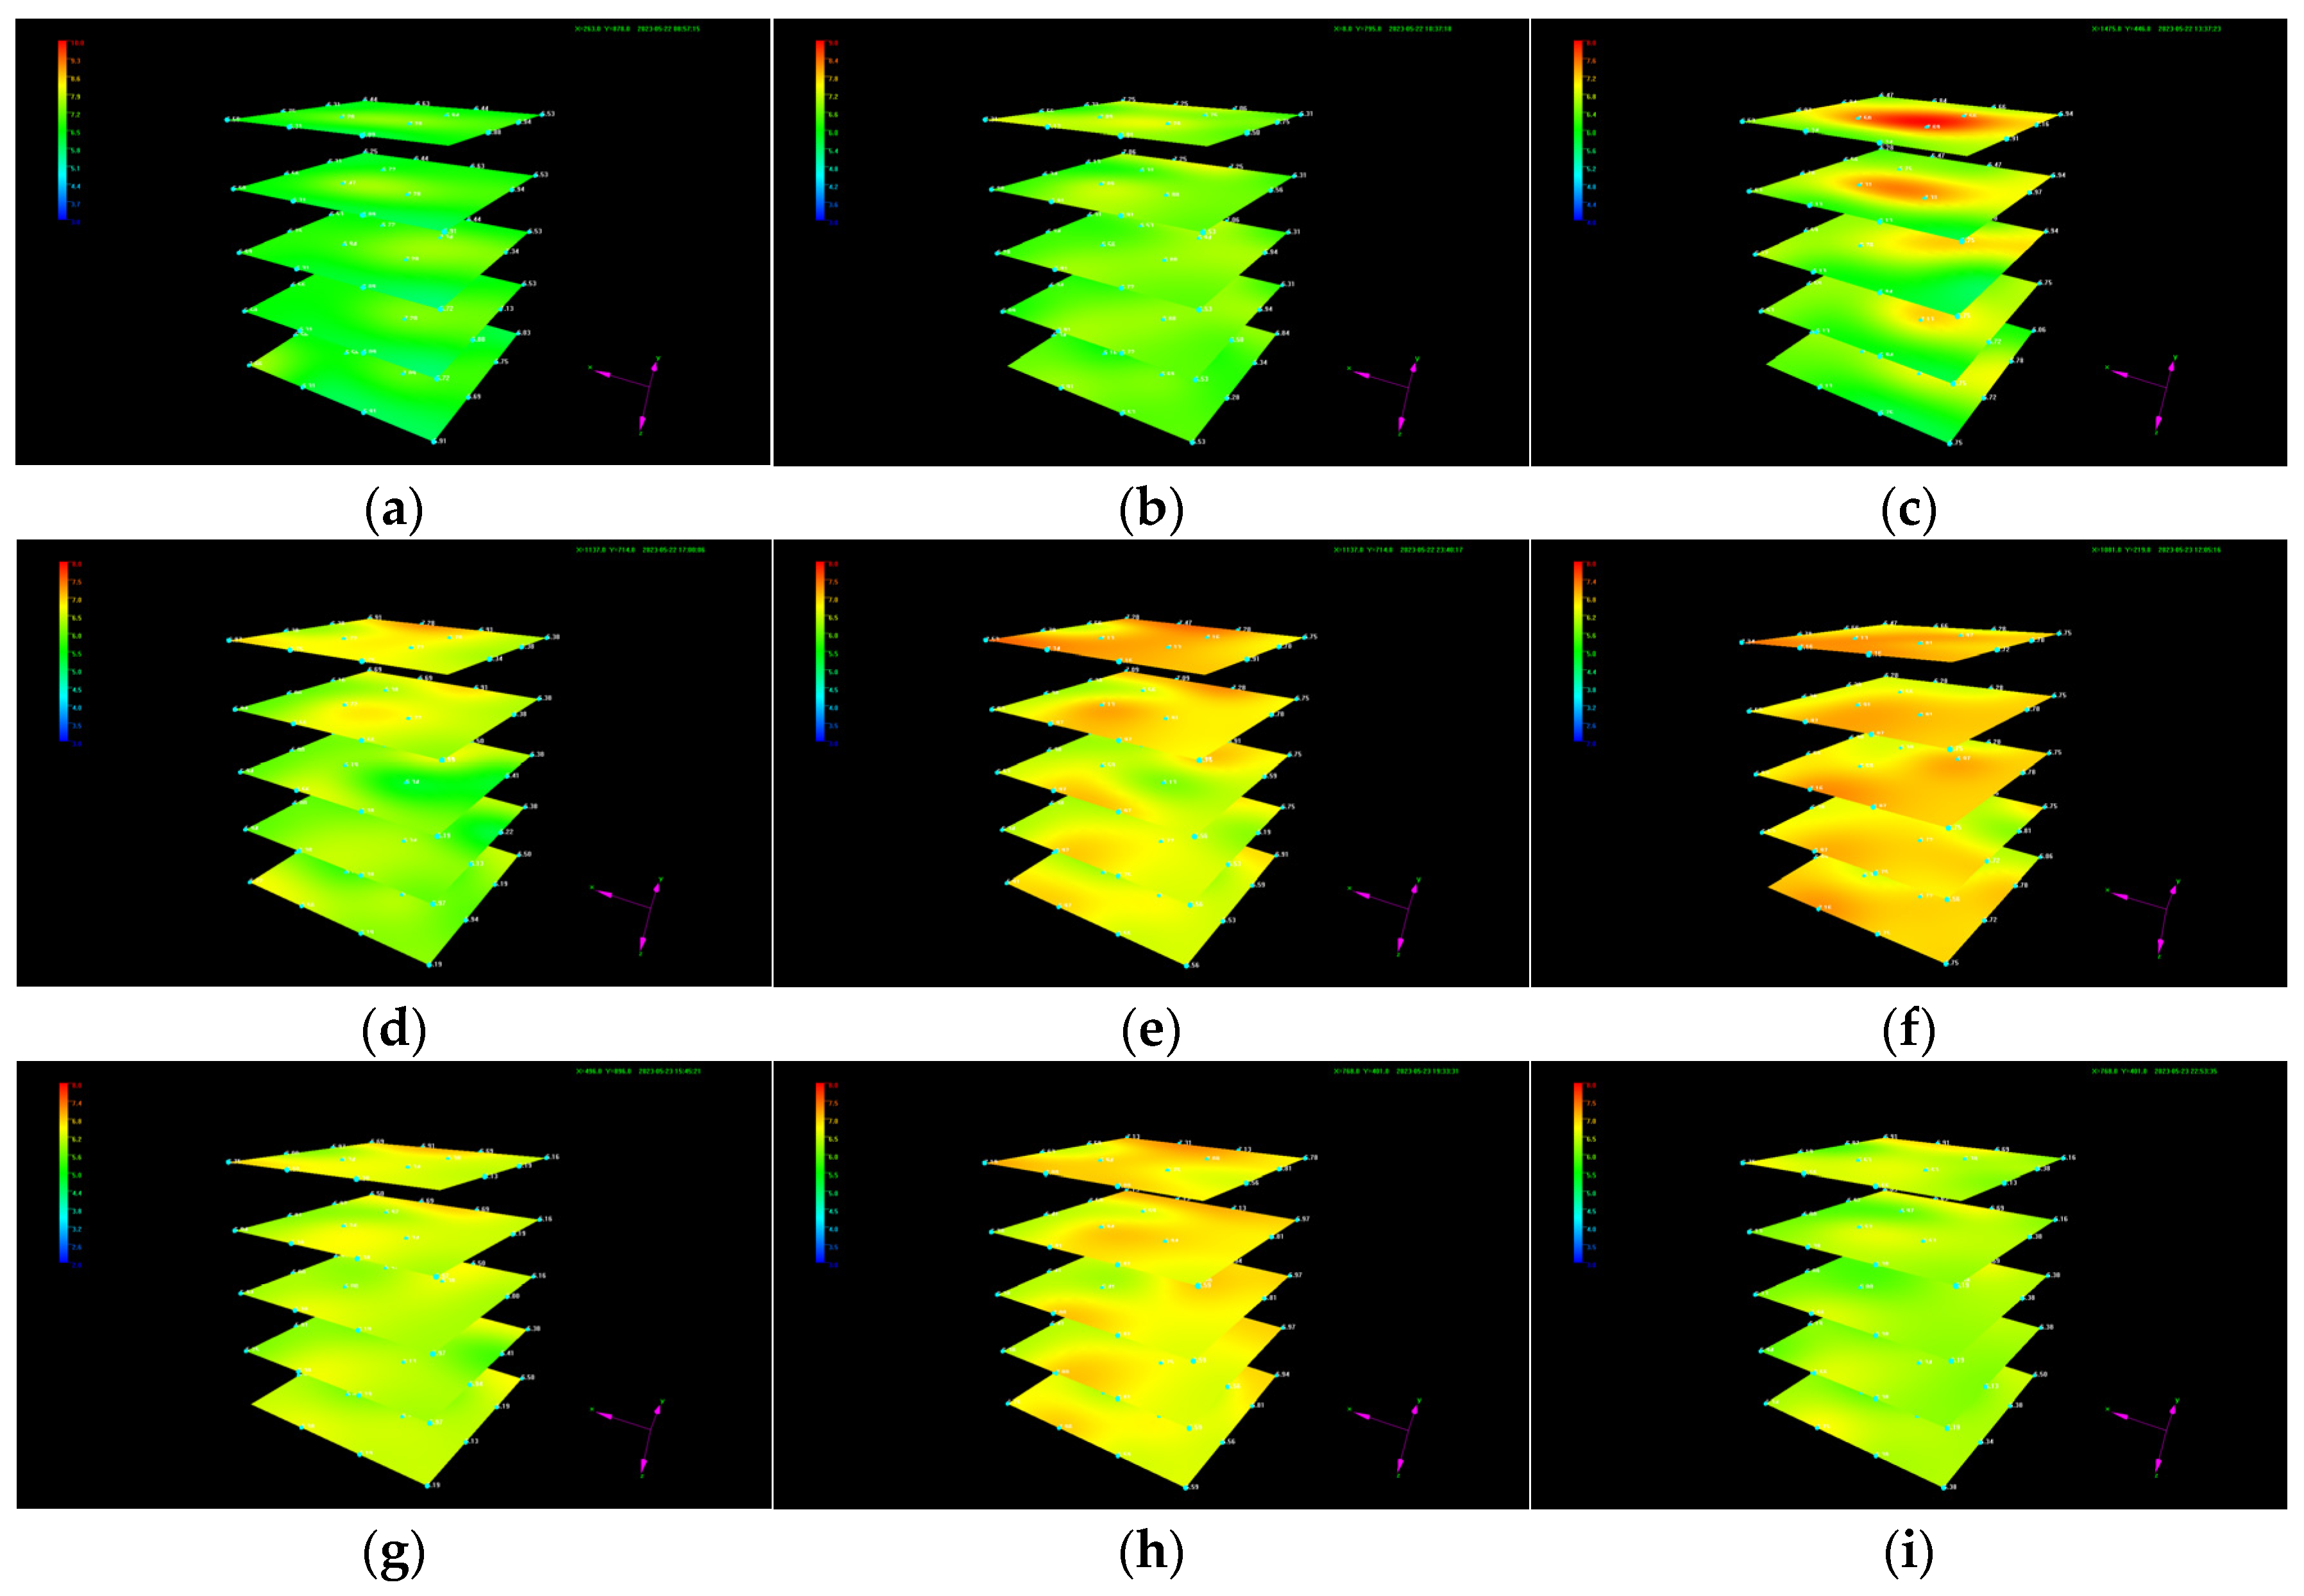
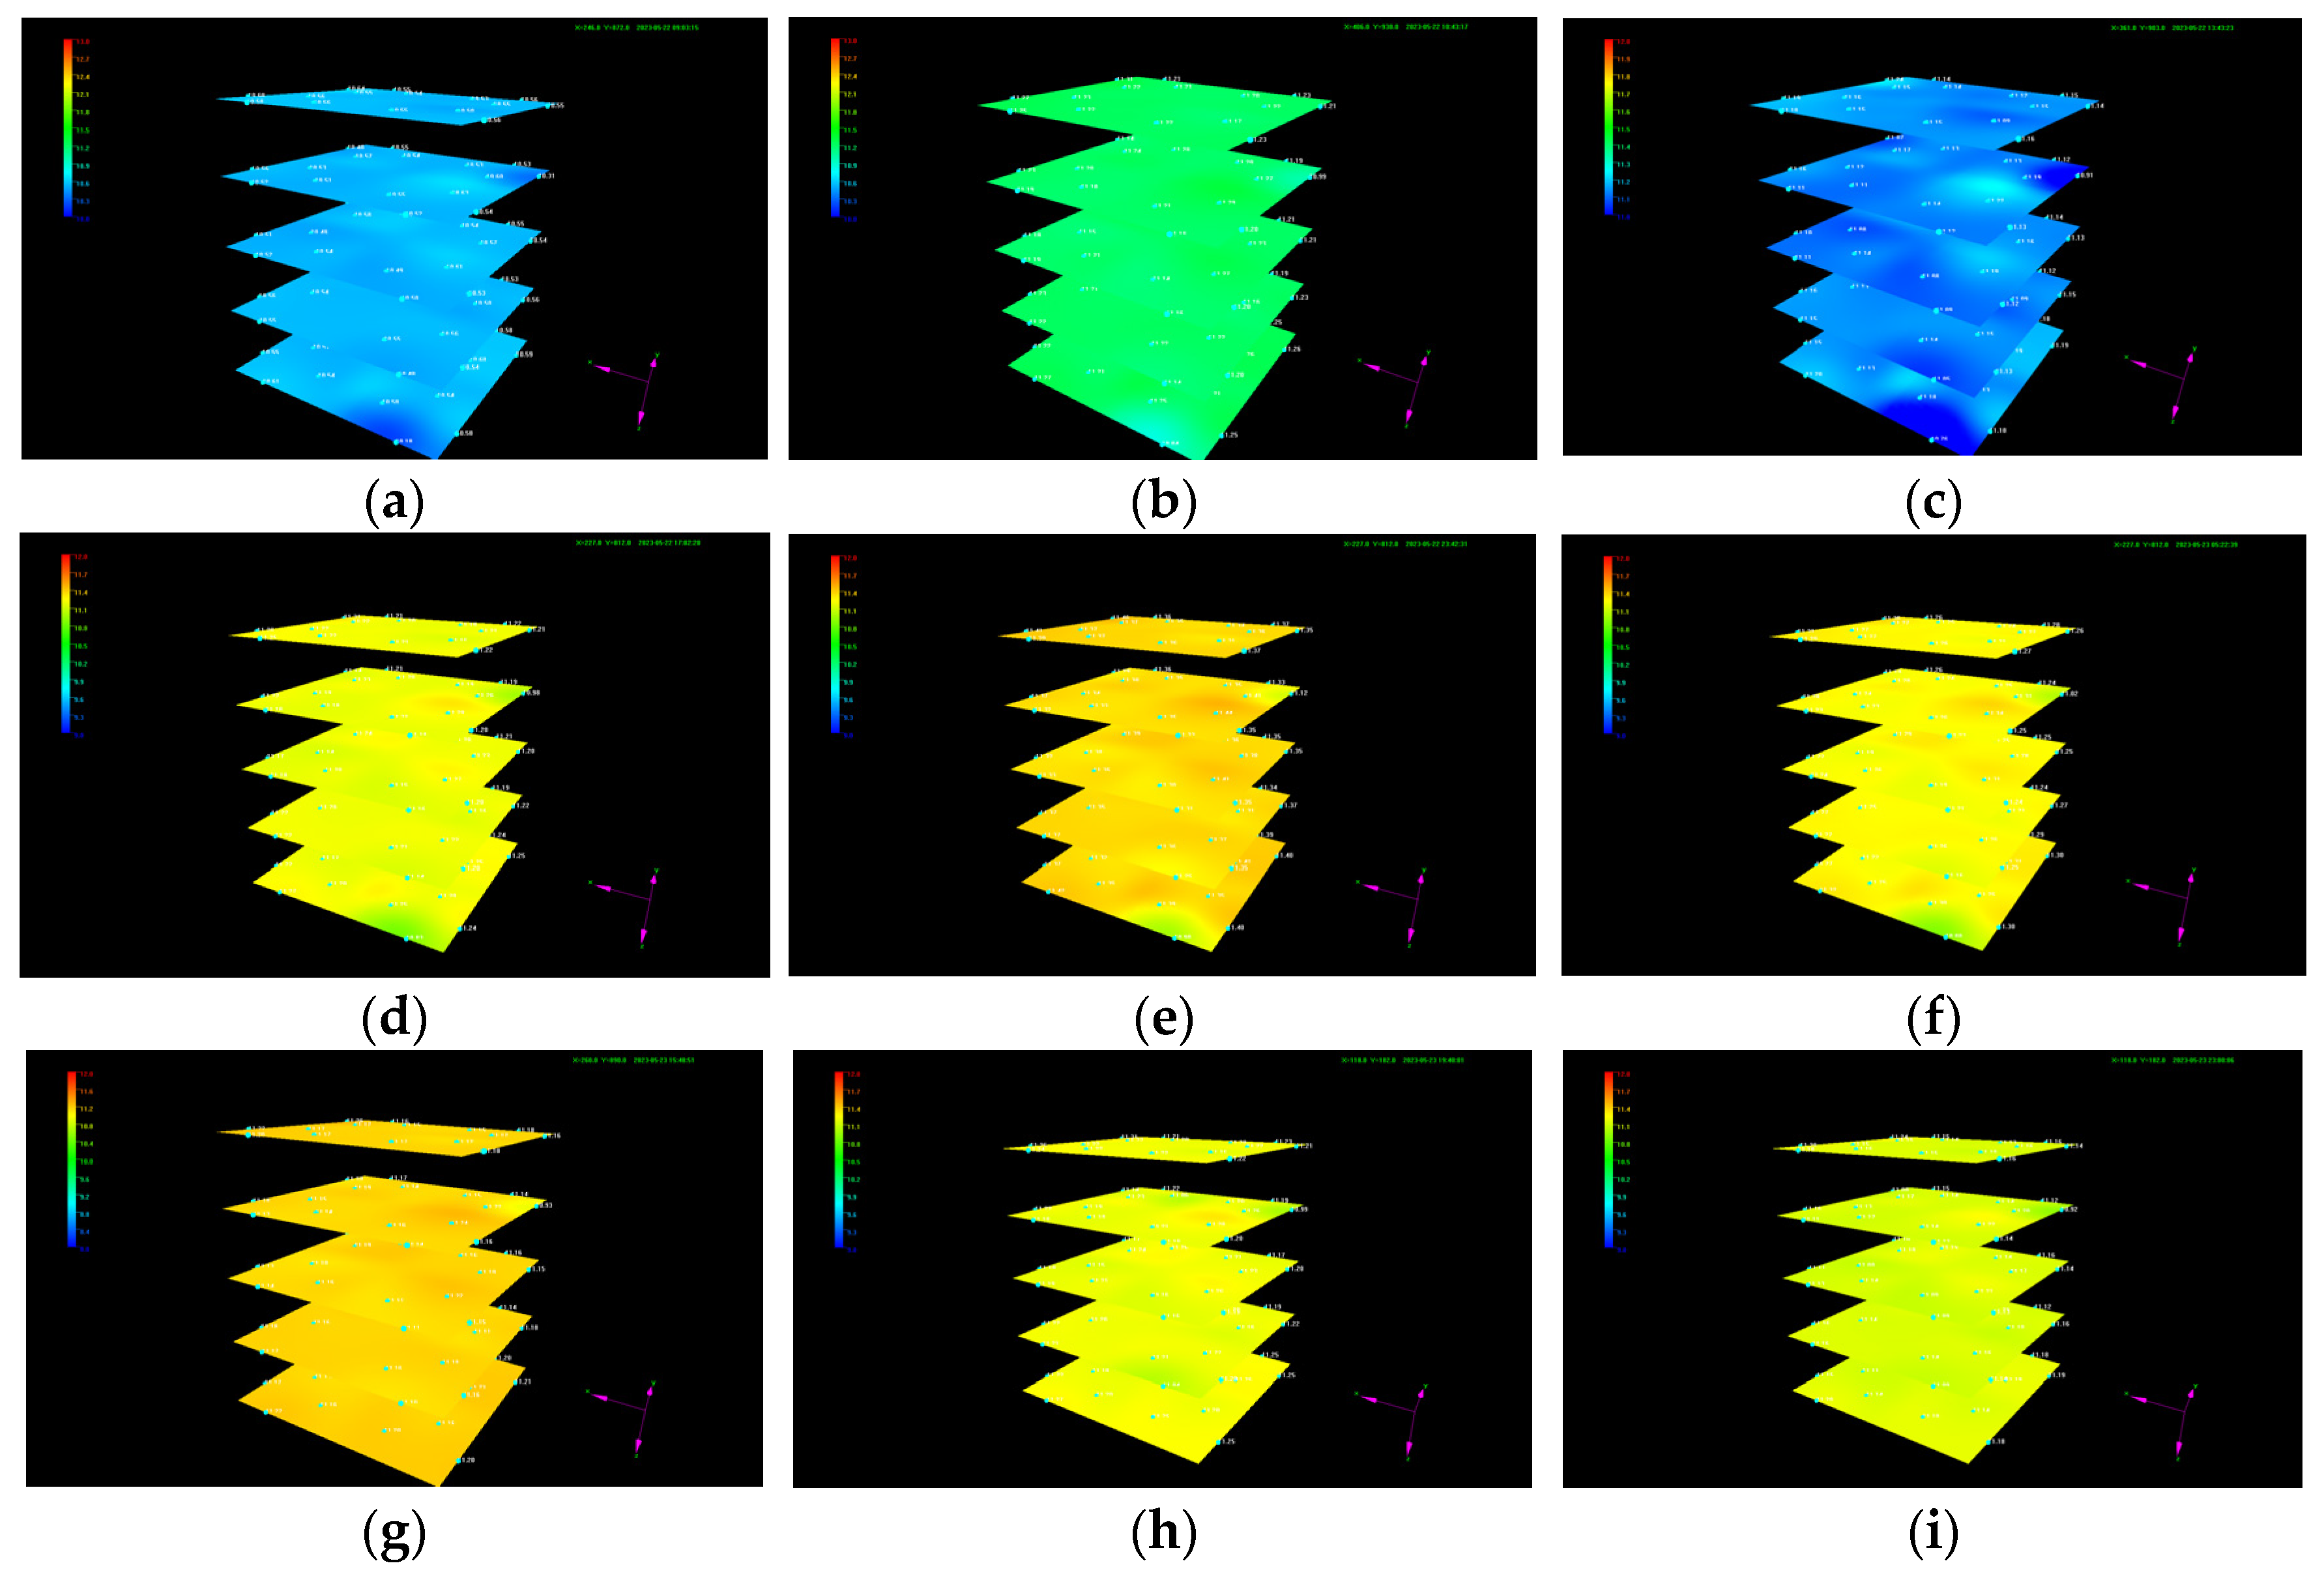
The dynamic evolution of the temperature in each layer is shown in Figure 5. It can be seen that the temperature does not remain constant, while an irregular variation occurs in the local position during liquid CO2 injection. Since the injected liquid CO2 will not transform to dry ice or gas to cause heat variation under the given temperature and pressure conditions, the fluctuation in the temperature at local positions indicates the localized formation of CO2 hydrate with different formation rates and formation times and heterogeneous distribution. The increase in the local temperature grows more pronounced at the position where hydrate is generated at a faster rate and in larger quantities. Since the temperature control module is always in operation during liquid CO2 injection and water has large thermal conductivity, the temperature at which CO2 hydrate forms gradually decreases after the formation rate slows down.

Figure 5.
Evolution of the temperature during liquid CO2 injection. (a) t = 0.2 h; (b) t = 1.87 h; (c) t = 4.87 h; (d) t = 8.25 h; (e) t = 14.92 h; (f) t = 27.33 h; (g) t = 31 h; (h) t = 34.8 h; and (i) t = 38.13 h.
It is worth noting that the generated CO2 hydrate does not cause plugging near the injection well at a liquid CO2 injection rate of 10 mL/min. This is mainly because the amount of hydrate generated near the wellbore is less and not as dense as imagined at the given injection rate. The formed CO2 hydrate may either be displaced or disrupted with continuous CO2 injection, preventing hydrated-induced plugging. However, CO2 hydrate-induced plugging with different liquid CO2 injection rates and well types cannot be ruled out.
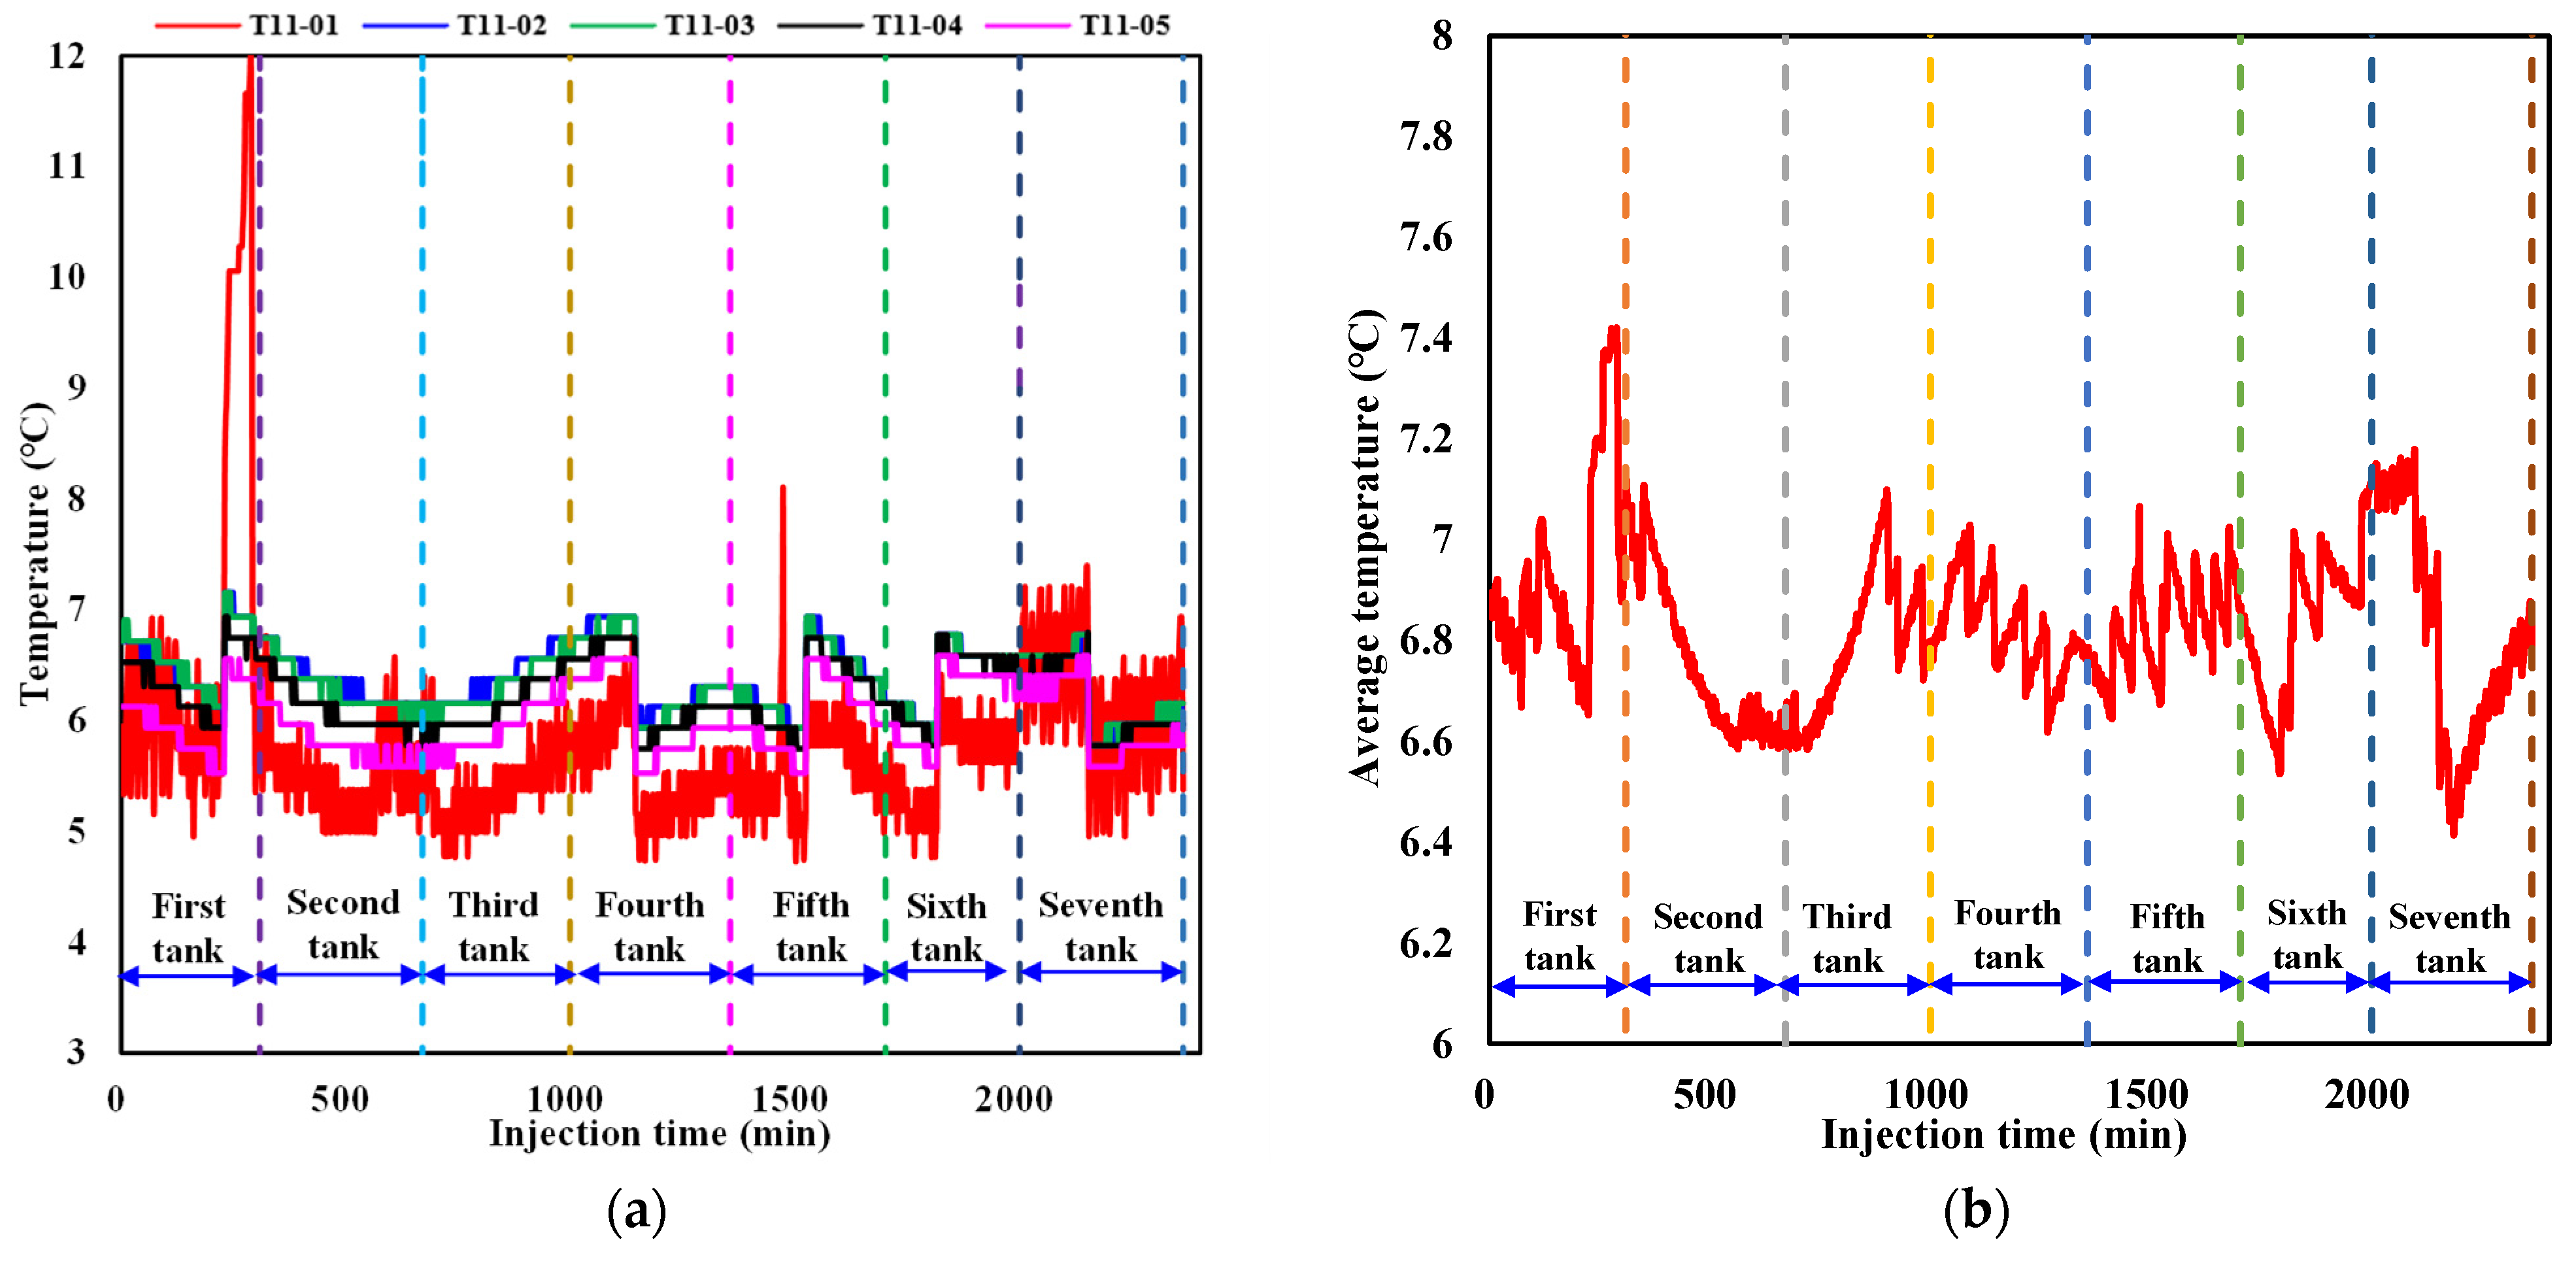
To better analyze the dynamic temperature evolution during liquid CO2 injection, variations in the temperature at detection point 11 in each layer near the injection well as well as the average temperature in the sediment are summarized in Figure 6a,b. It can be seen from Figure 6a that the temperature at detection point 11 in each layer exhibits a sawtooth variation pattern with the evolution regularity among different layers showing a relatively consistent trend. The temperature evolution regularity is mainly induced by the combined effect of three factors, including hydrate formation, the large thermal conductivity of formation water, and a low-temperature control module that is always in operation during liquid CO2 injection. When the heat release induced by CO2 hydrate formation at point 11 in each layer is dominant, the temperature increases. As the hydrate formation rate slows down, the impact of hydrate formation on temperature rise gradually weakens. When the effect of large water thermal conductivity and a low-temperature control module on the prevention of a temperature rise exceeds the heat release from hydrate formation, the temperature decreases, which results in sawtooth fluctuations in the temperature. It is also noted that the magnitude of temperature fluctuations at detection point 11 in each layer varies at different liquid CO2 injection stages and among different layers. The degree of the increase in temperature in the first layer at the first tank of liquid CO2 injection is larger than that at other injection stages and layers. This is primarily because the CO2 density is smaller than that of water under the experimental temperature and pressure conditions. The injected liquid CO2 gradually moves upward to the first layer, resulting in a much larger contact area between liquid CO2 and water at point 11 than that at the same position in other layers. The CO2 hydrate formation rate and quantity grow much larger, leading to an instantaneous release of large amounts of heat and a sharp increase in temperature at point 11 in the first layer. When CO2 hydrate formation is stable, the effect of water thermal conductivity and the low-temperature control module dominates, causing a significant decrease in temperature. Since the generated hydrate at detection point 11 hinders the effective contact between water and subsequently injected liquid CO2 to some degree, the hydrate formation rate and quantity decrease, resulting in a small magnitude of temperature fluctuations with continuous CO2 injection at this point. Hydrate formation at different positions in the sediment also results in similar fluctuations in the average temperature at different magnitudes of CO2 injection (Figure 6b), while the smoothness of temperature fluctuations is more gradual than the variation in temperature at a certain detection point.
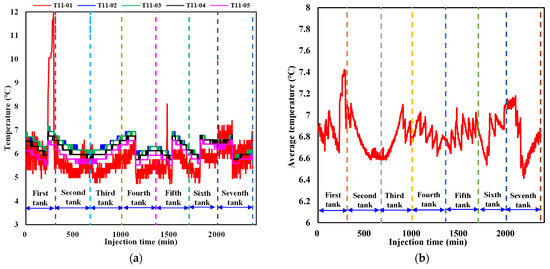
Figure 6.
Variation in the temperature during liquid CO2 injection. (a) Temperature variation at point 11 in each layer near the injection well. (b) Variation in the average temperature in the sediment.
3.1.2. Evolution of the Pressure
The dynamic evolution of the pressure distribution in each layer during liquid CO2 injection is shown in Figure 7, indicating that the pressure in the sediment gradually increases before the outlet valve opens. Since the sand particle size used for sediment reformation is uniform and the sediment is compacted uniformly layer by layer during reconstruction, the reshaped sediment is relatively homogeneous. If there was no hydrate formation, the overall pressure should have had high values near the injection well and gradually decreased with increasing distance from the vertical liquid CO2 injection well at a constant rate. However, it is evident that the dynamic evolution of pressure in the sediment indicates an irregular variation with locally low pressure at some positions, which is attributed to localized hydrate formation under the experimental temperature and pressure conditions. The generated hydrate alters the heterogeneity and anisotropy in the sediment to some degree, causing the pressure distribution to exhibit irregular variations during liquid CO2 injection. When the pressure in the sediment exceeds the back pressure at the outlet, the outlet valve opens and the overall pressure gradually decreases, accompanied with fluid production from the outlet. The outlet valve automatically closes when the pressure in the sediment is smaller than the outlet back pressure. With the continuous CO2 injection, the average pressure in the sediment gradually increases again. Liquid CO2 injection continues until a large amount of CO2 is produced at the outlet.
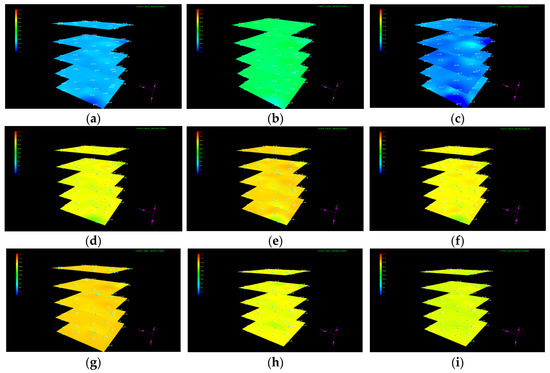
Figure 7.
Variation in the pressure distribution during liquid CO2 injection. (a) t = 0.3 h; (b) t = 1.97 h; (c) t = 4.97 h; (d) t = 8.28 h; (e) t = 14.95 h; (f) t = 20.62 h; (g) t = 31.05 h; (h) t = 34.92 h; and (i) t = 38.25 h.
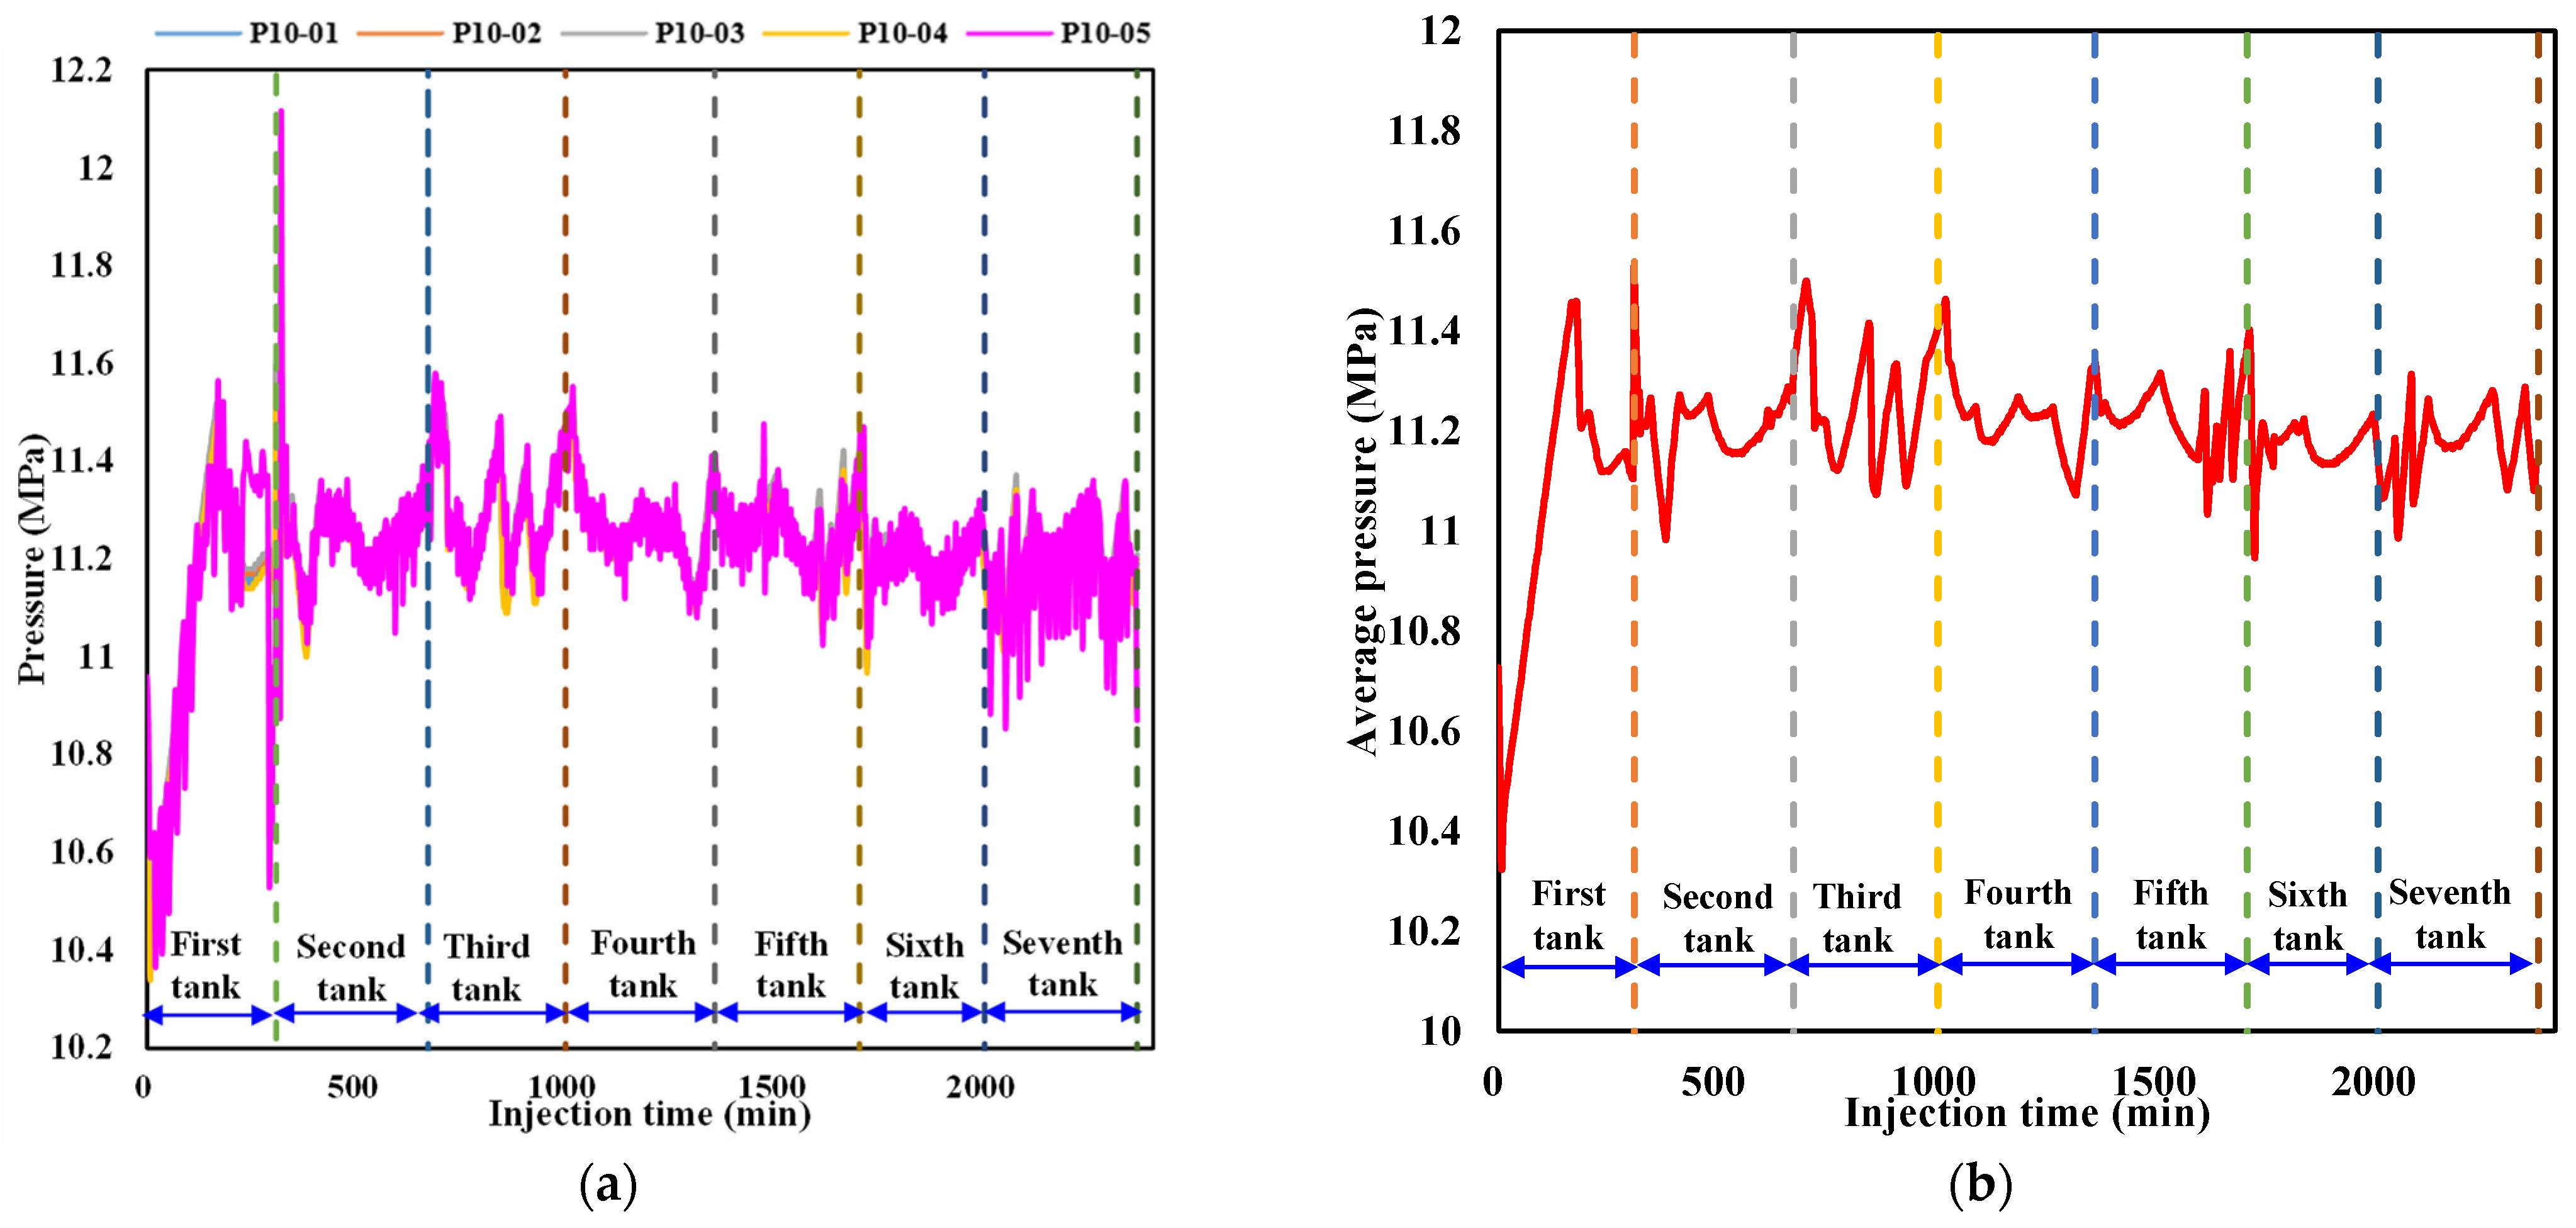
To better characterize the pressure evolution during liquid CO2 injection, variations in the pressure at detection point 10 in each layer near the injection well as well as the average pressure in the sediment are respectively illustrated in Figure 8a,b. It can be seen from Figure 8a that the pressure at point 10 in each layer exhibits a certain degree of fluctuation, with the amplitude in the fifth layer generally being higher than that in other layers during liquid CO2 injection. The irregular fluctuation in pressure at the interval of the outlet valve from closing to opening can be attributed to a change in the volume of liquid CO2 and a variation in the effective pore structure caused by hydrate formation. Since the density of CO2 hydrate is slightly higher than that of liquid CO2, hydrate formation results in a slight reduction in fluid volume, leading to a small decrease in pore pressure. Meanwhile, the formed hydrate aggravates the heterogeneity of the sediment, resulting in an increase in the disorderliness of pressure propagation and heterogeneous pressure distribution. Therefore, the pressure at detection point 10 in each layer exhibits irregular fluctuations. When the pressure in the sediment surpasses the back pressure at the outlet, the outlet valve automatically opens and the pressure rapidly decreases as the fluid flows out from the outlet. The pressure evolution at detection point 10 in each layer in the whole process of liquid CO2 injection can be attributed to the joint effects of CO2 hydrate formation, fluid expelled from the outlet, and continuous liquid CO2 injection. Since the outlet valve is located at the bottom of the internal model, the magnitude of the pressure fluctuation caused by the fluid released from the outlet has a greater impact on the fifth layer than the other four layers. It is observed from Figure 8b that the localized pressure fluctuation also results in irregular variations in the average pressure of the sediment, while the magnitude and smoothness of the evolution have some differences in local pressure fluctuations at a certain point.
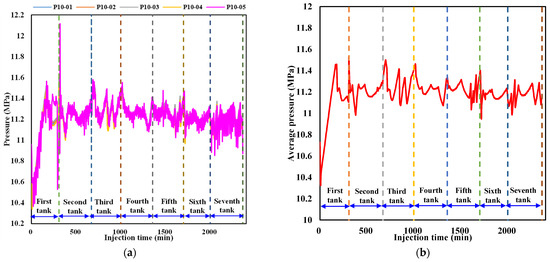
Figure 8.
Variation in the pressure during liquid CO2 injection. (a) Pressure variation at detection point 10 in each layer near the injection well. (b) Variation in the average pressure in the sediment.
3.2. Water and Gas Production Behavior during Liquid CO2 Injection
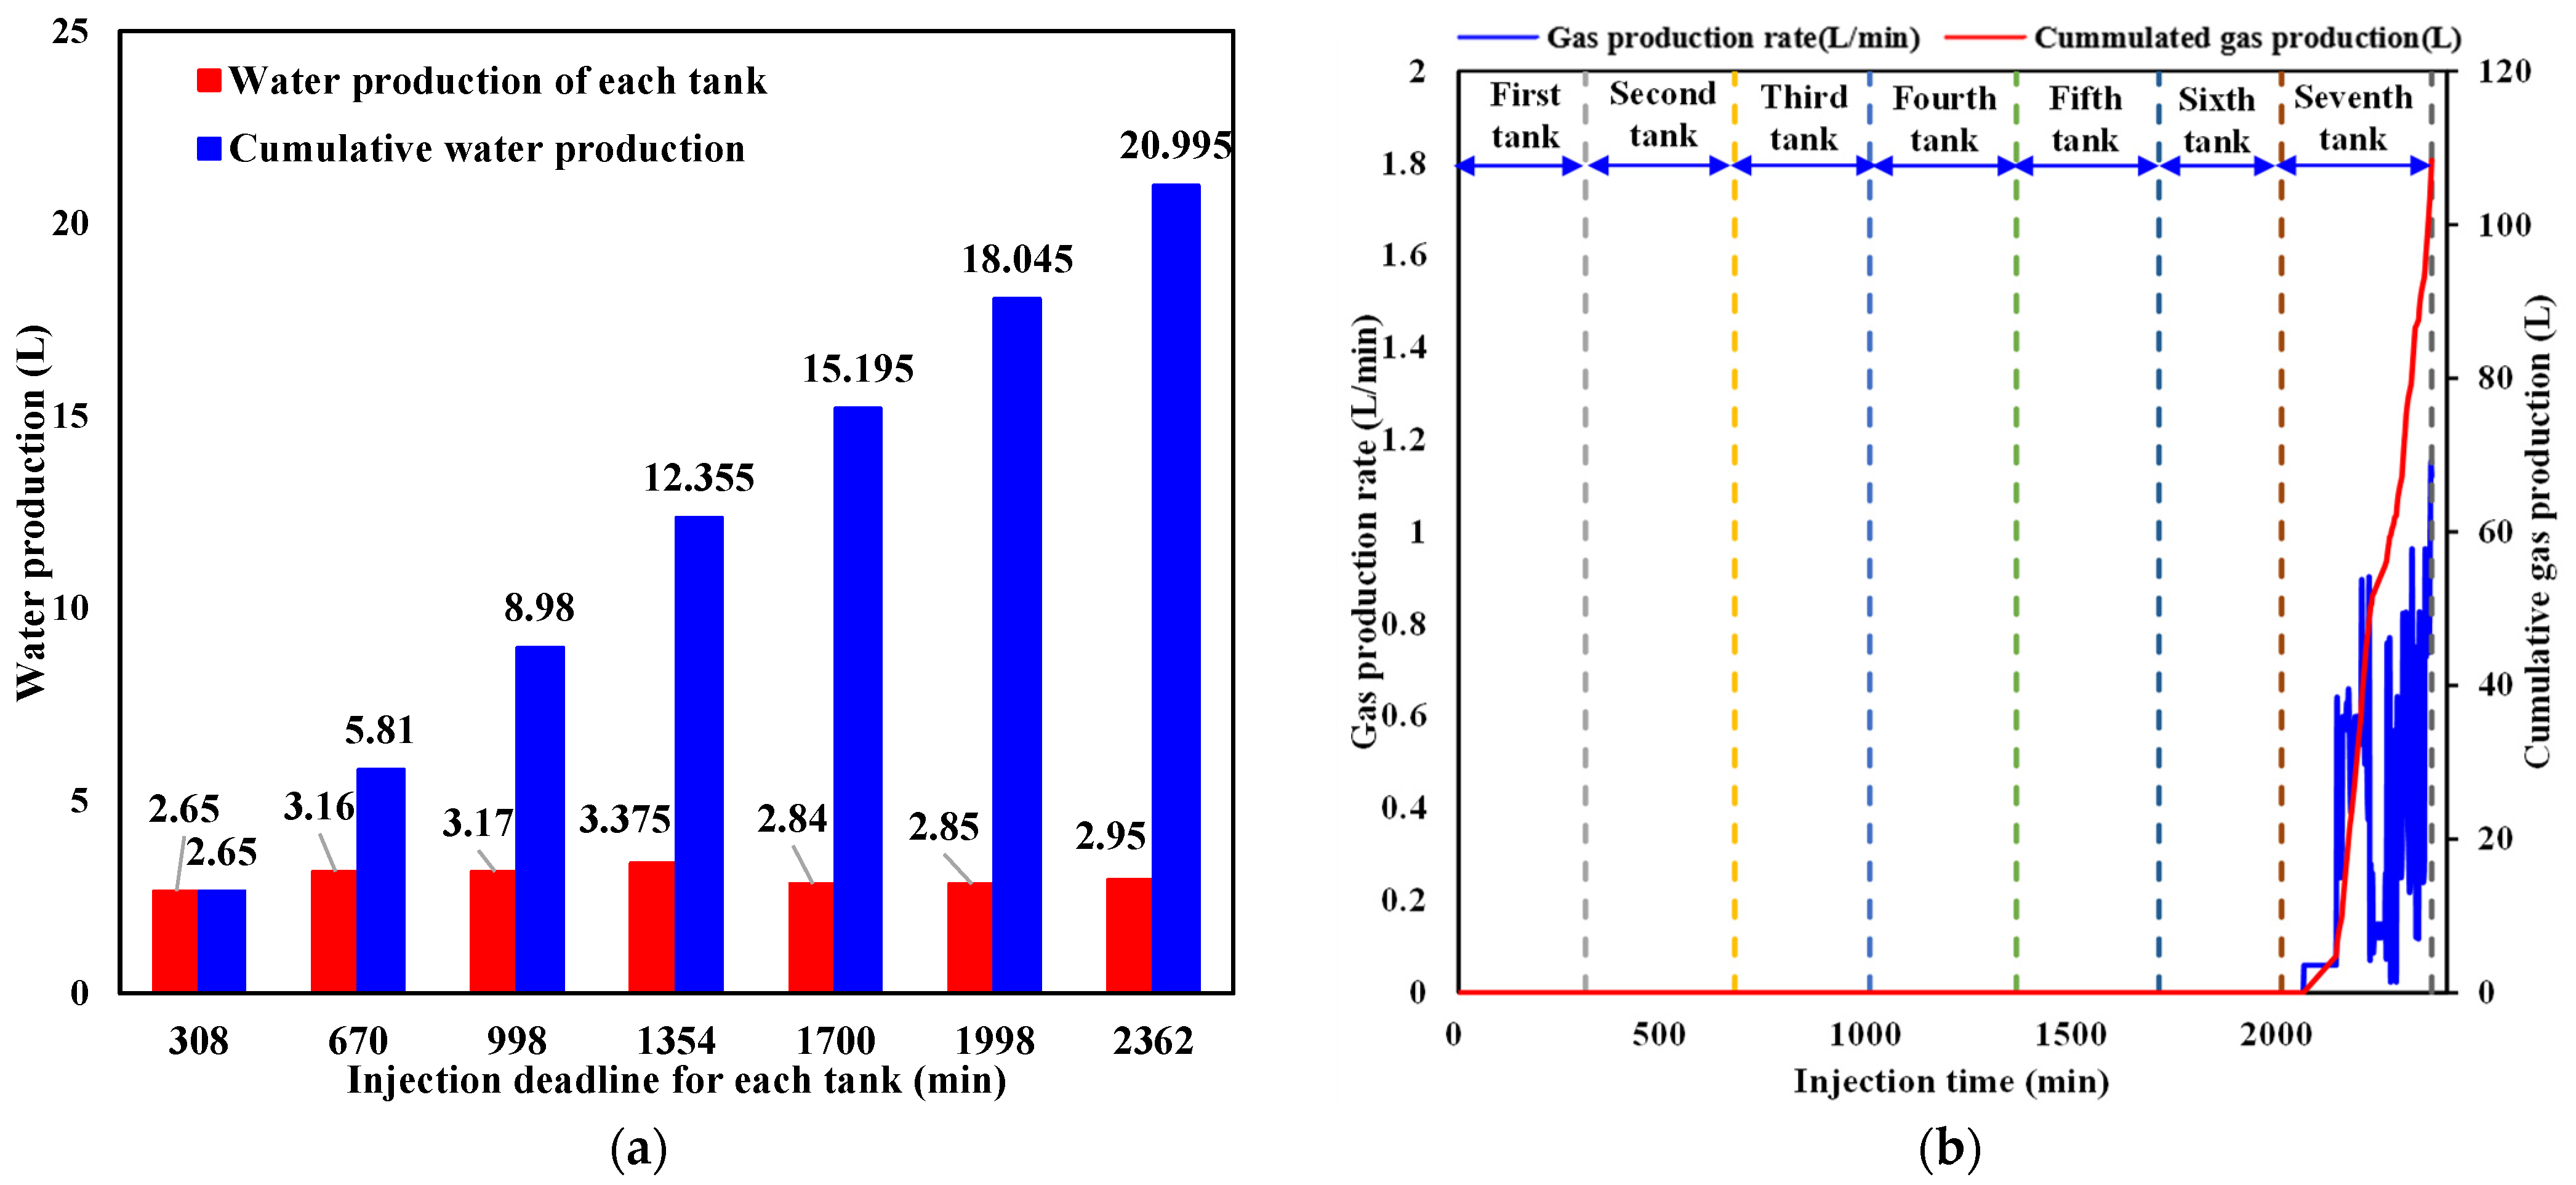
The production characteristics of water and CO2 from the outlet during liquid CO2 injection are respectively shown in Figure 9a,b. As is indicated in Figure 9a, water production exhibits intermittent behavior due to the pressure difference between the sediment and the outlet. When the pressure in the sediment exceeds the back pressure, the outlet valve opens and water is expelled. Otherwise, the outlet valve closes, and no water is produced. It is noticed that the amount of water produced is almost the same every time the outlet valve opens. Combined with Figure 9b, it can be seen that the fluid released from the outlet does not contain CO2 each time the outlet valve opens during the first six tanks of liquid CO2 injection since the injected CO2 in the sediment has not arrived at the outlet. In the process of injecting the seventh tank of liquid CO2, CO2 breaks through the outlet and the production rate rapidly increases. The cumulative CO2 produced reaches 108.44 L in a short period before liquid CO2 injection is terminated. In the next part, the cumulative sequestered CO2 and its quantity in hydrate and liquid phases are calculated.
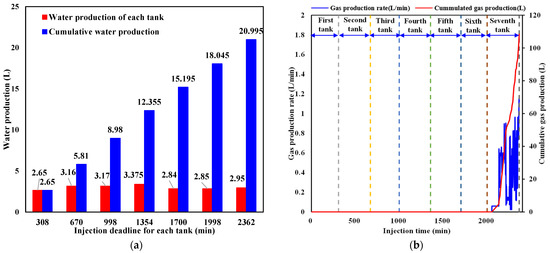
Figure 9.
Water and CO2 production behavior during liquid CO2 injection. (a) Water production behavior. (b) CO2 production behavior.
3.3. Sequestration Calculation in Hydrate-Based CO2 Storage
3.3.1. Cumulative CO2 Sequestration
The expression of cumulative sequestered CO2 at different times can be obtained using the mass conservation law, as follows:
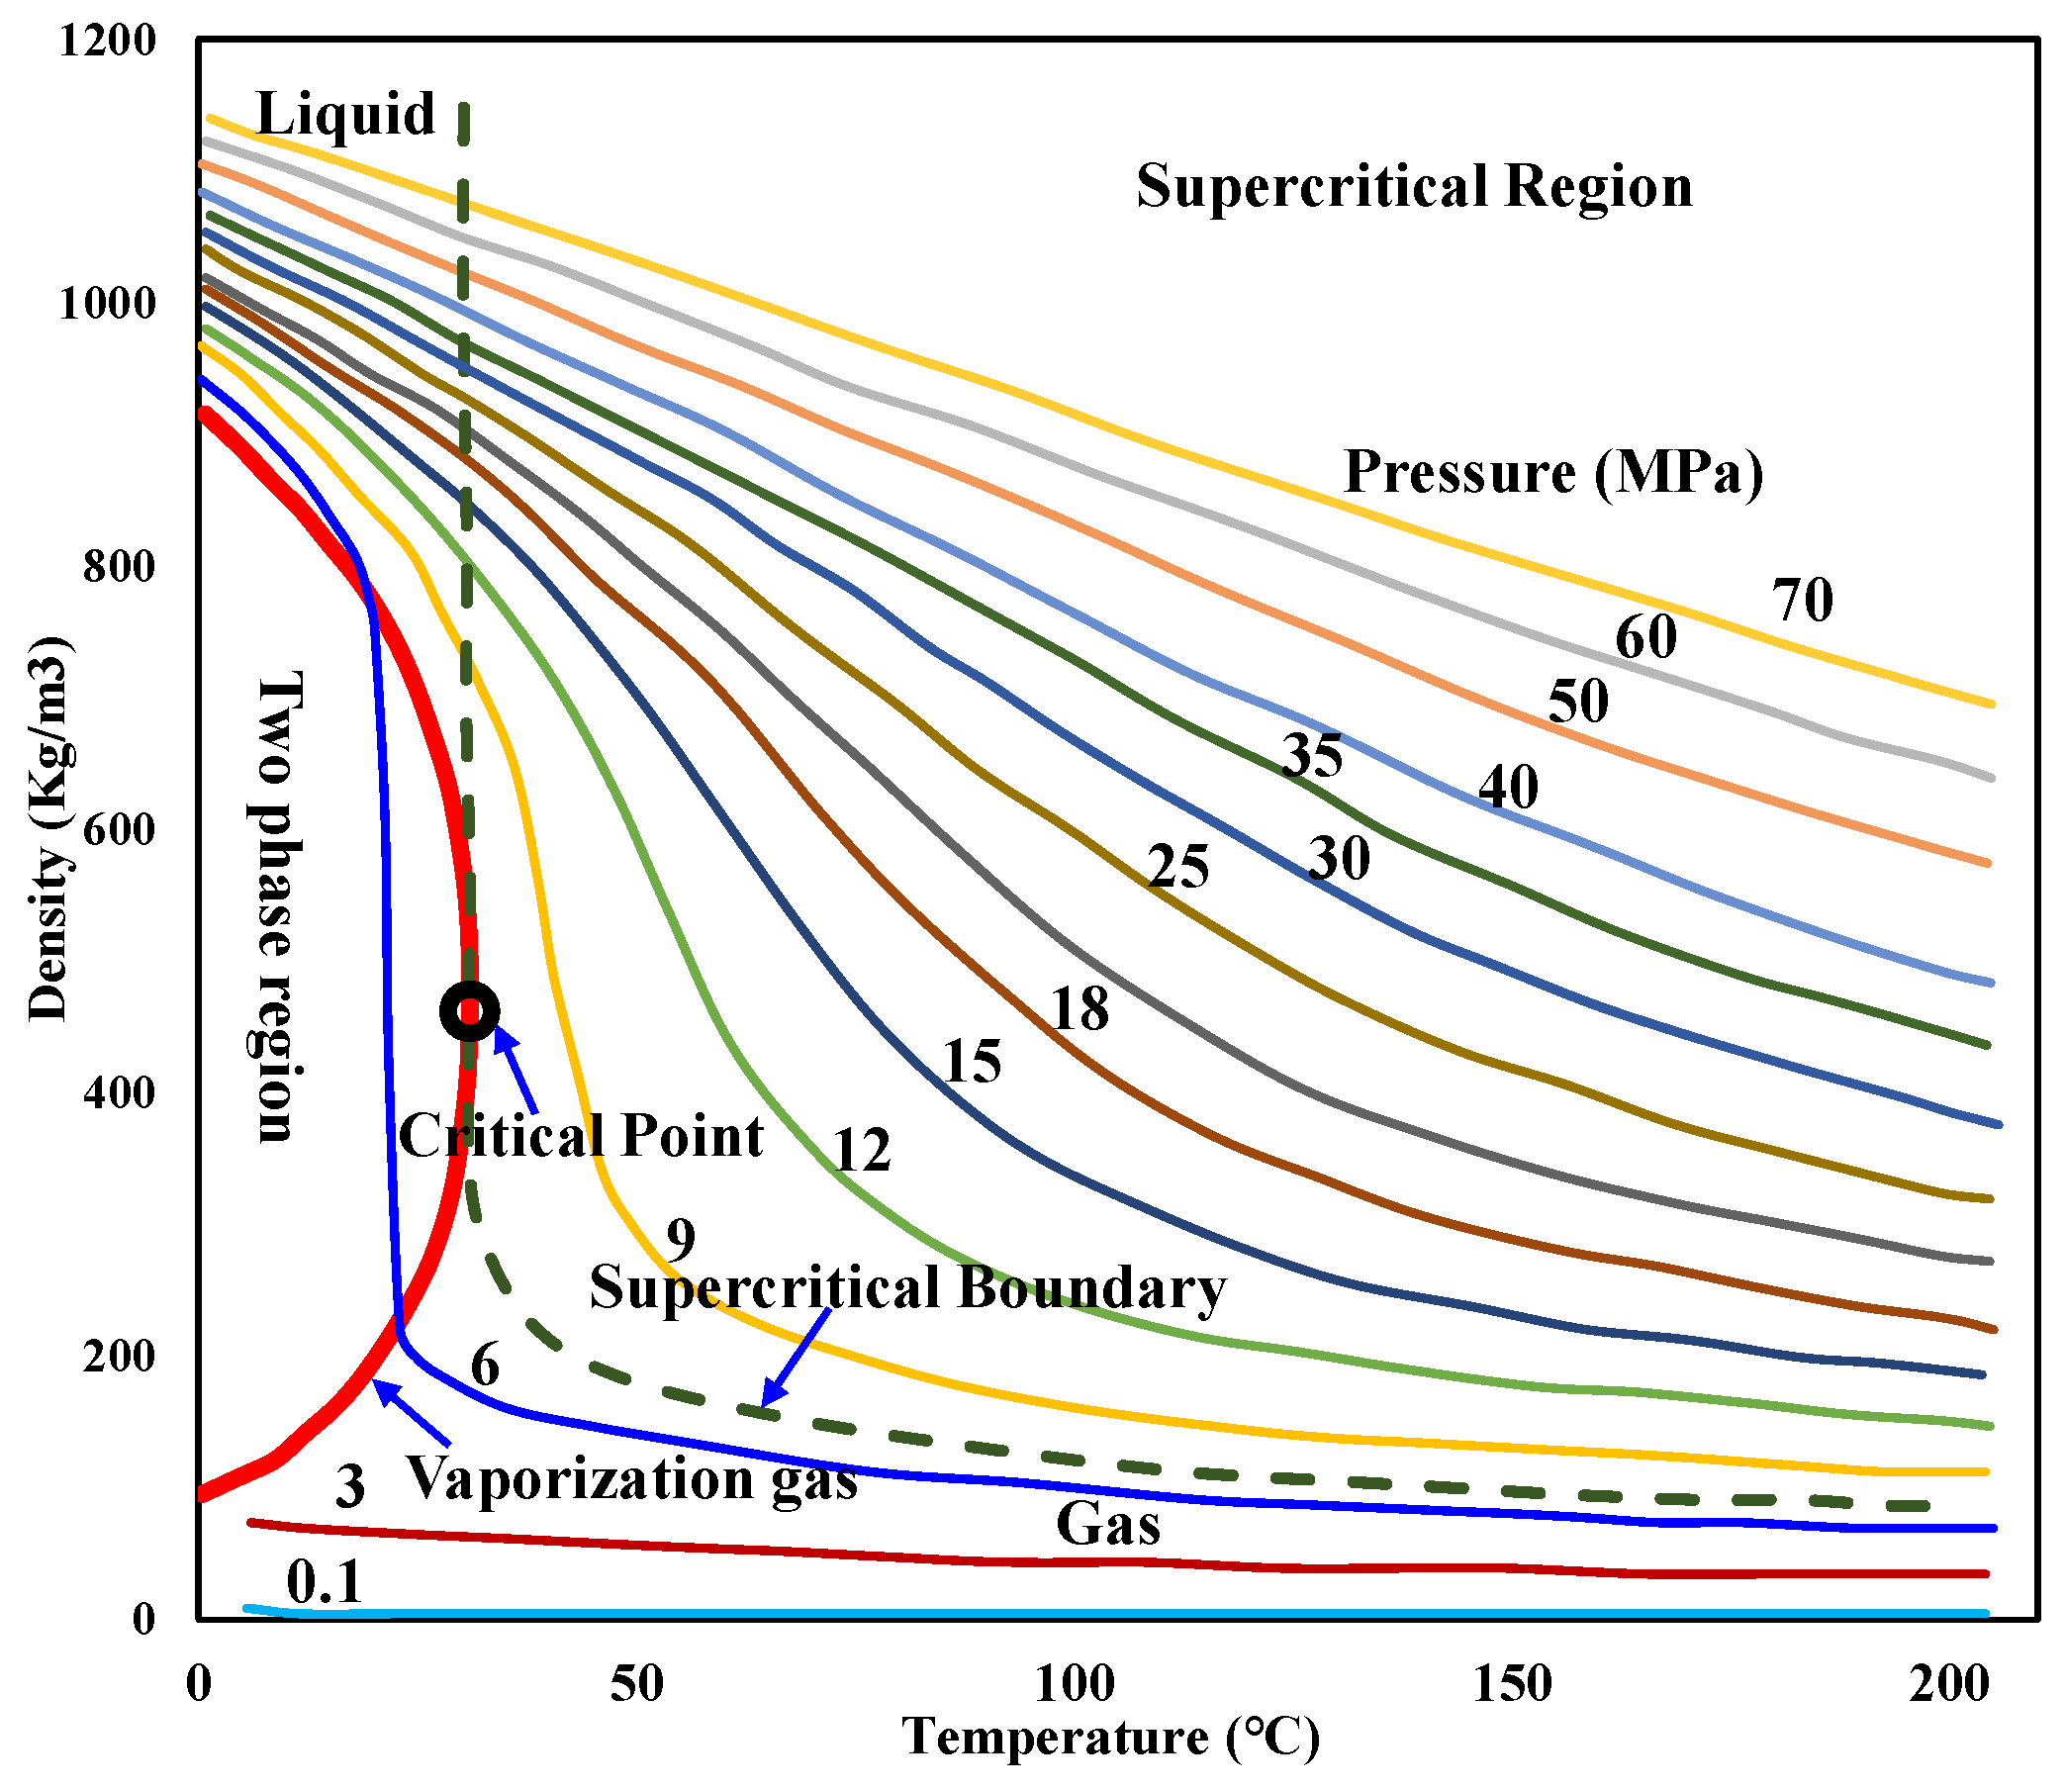
where msCO2i, minjCO2i, and moutCO2i are, respectively, the amount of cumulative sequestered, injected, and produced CO2 at different times, in Kg; ρinjCO2i and ρoutCO2i are, respectively, the densities of injected and produced CO2 under the corresponding condition, in Kg/m3; VinjCO2i and VoutCO2i are, respectively, the injected and produced CO2 volumes under the corresponding condition, in m3; QinjCO2 is the liquid CO2 injection rate, in L/min; and t represents the injection time, in min.
The CO2 density at different temperatures and pressures during injection can be obtained by referring to Figure 10 [55] or the manual [56].
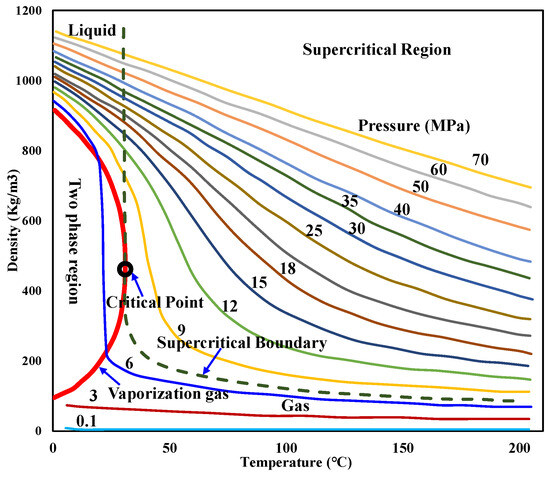
Figure 10.
CO2 density at different temperatures and pressures.
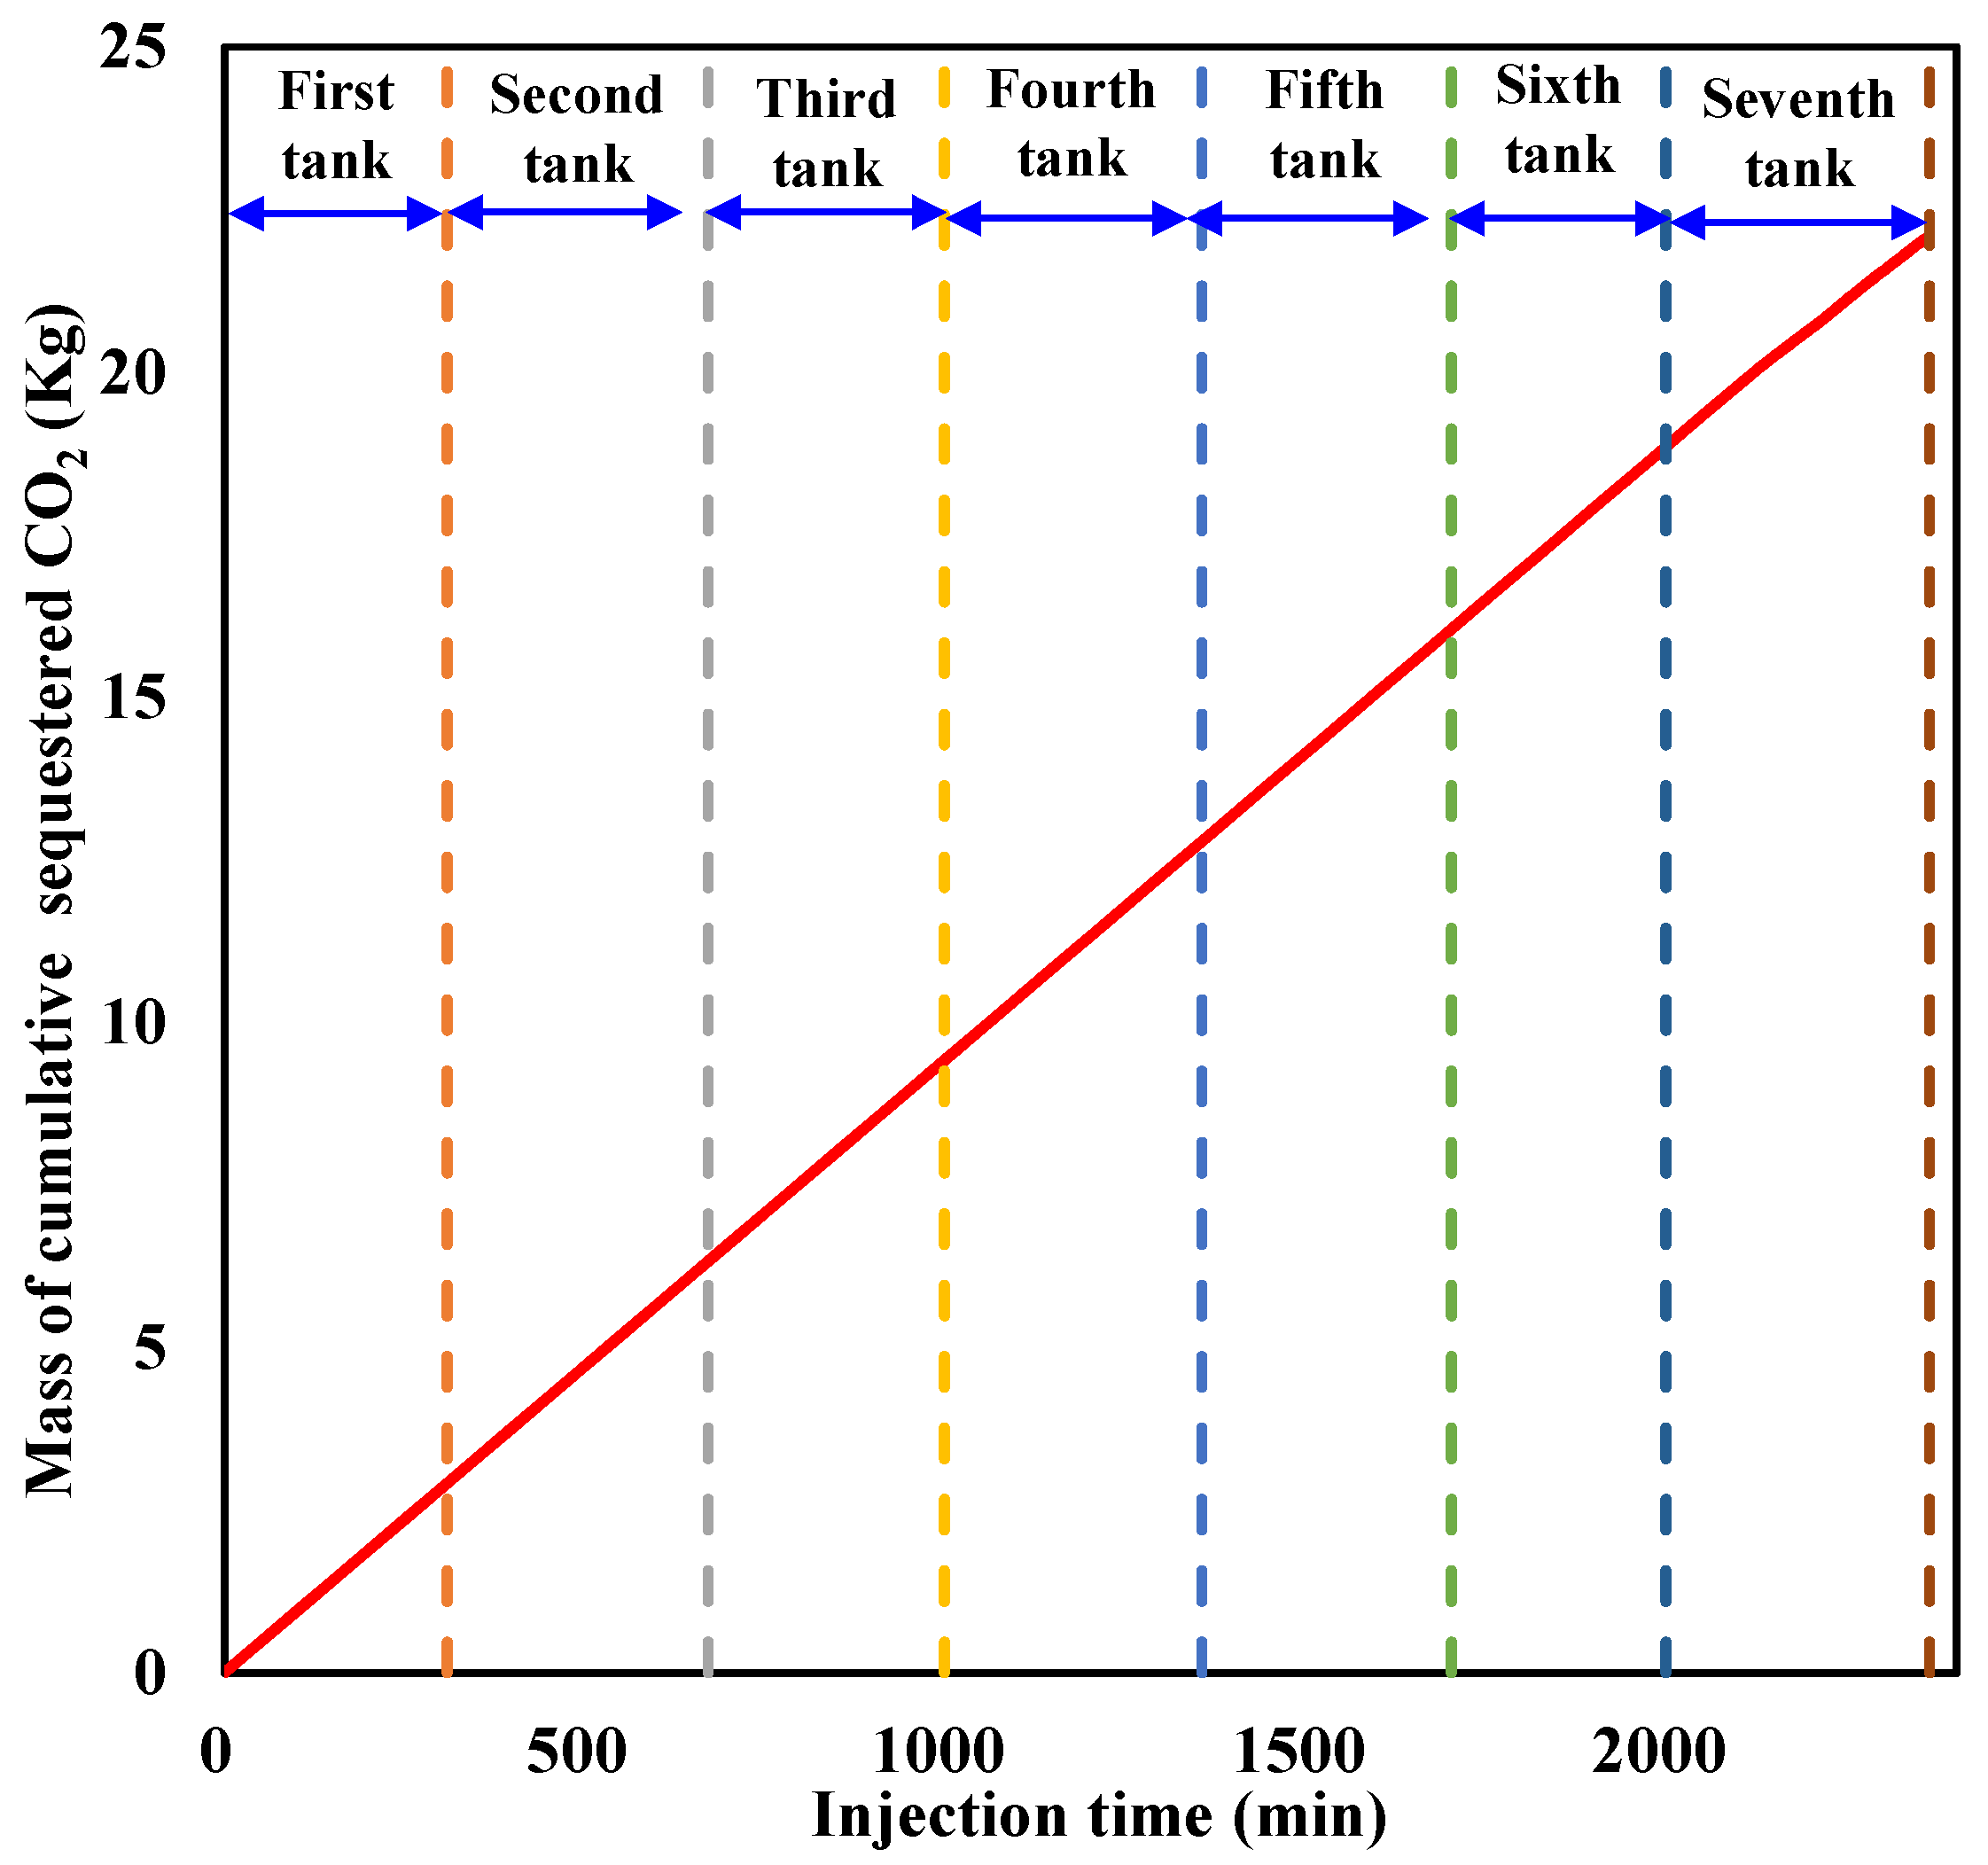
The cumulative sequestered CO2 with time during liquid CO2 injection is calculated and illustrated in Figure 11. It can be seen that the cumulative sequestered CO2 in the sediment increases almost linearly with an increase in CO2 injection at a constant rate before large amounts of CO2 are released from the outlet. When liquid CO2 injection is terminated, the cumulative sequestered CO2 reaches 22.098 Kg.

Figure 11.
Cumulative sequestered CO2 in the sediment during injection.
For comparison with CO2 sequestration in saline aquifers, a novel cumulative sequestration factor in hydrate-based CO2 storage is defined as the ratio of the equivalent volume of the cumulative sequestered CO2 to the effective pore volume in the sediment. It is calculated by taking into consideration that the cumulative sequestration factor reaches 0.1353 PV when liquid CO2 injection is stopped, indicating a relatively low sequestered amount.
This can be mainly attributed to three reasons. One is that viscous fingering occurs due to a low viscosity ratio of liquid CO2 to formation water, resulting in low sweep efficiency. Another is that the formed hydrate aggravates the heterogeneity and anisotropy of the sediment, causing severe heterogeneous figuring phenomena. The third is that the effective pore space for subsequent CO2 injection is compressed due to hydrate formation.
3.3.2. CO2 Sequestration in Hydrate and Liquid Phases
Since the dissolved CO2 in water is much easier to form hydrate, the quantity of dissolved CO2 is extremely low in hydrate-based CO2 sequestration, which can be ignored. In addition, the generated hydrate at the CO2–water interface will prevent the effective contact between remaining CO2 and water from the further formation of hydrate. As a result, we assume that the sequestered CO2 in the sediment co-exists in hydrate and liquid phases in the large-scale 3D experiment on hydrate-based CO2 sequestration.
To calculate the proportion of sequestered CO2 in hydrate and liquid phases, the mass conservation law of CO2, including the injected, sequestered, and produced CO2, is first applied using Equation (2):
where ρCO2i and ρSCCO2 are CO2 densities, respectively, at the corresponding temperature and pressure in the internal model and under atmospheric conditions, in Kg/m3; VCO2i and Vhi represent the volumes of liquid CO2 and hydrate sequestered in the sediment, in m3; and RCO2 is CO2 volume under standard conditions released from per-volume hydrate dissociation, in 175 sm3/m3.
The mass of the initial, retained, and effluent water in the internal model at a certain stage of liquid CO2 injection also satisfies the mass conservation law with the expression indicated in Equation (3):
where ρw is the water density, in Kg/m3; Vp represents the effective pore volume in the sediment, in m3; Rw is the water volume released from per-volume CO2 hydrate dissociation, in 0.75 m3/m3; and Vwouti represents the water volume released from the outlet at different liquid CO2 injection stages, in m3.
The volume of sequestered CO2 in hydrate and liquid phases can be determined by combining Equations (2) and (3) with their expressions shown in Equations (4) and (5):
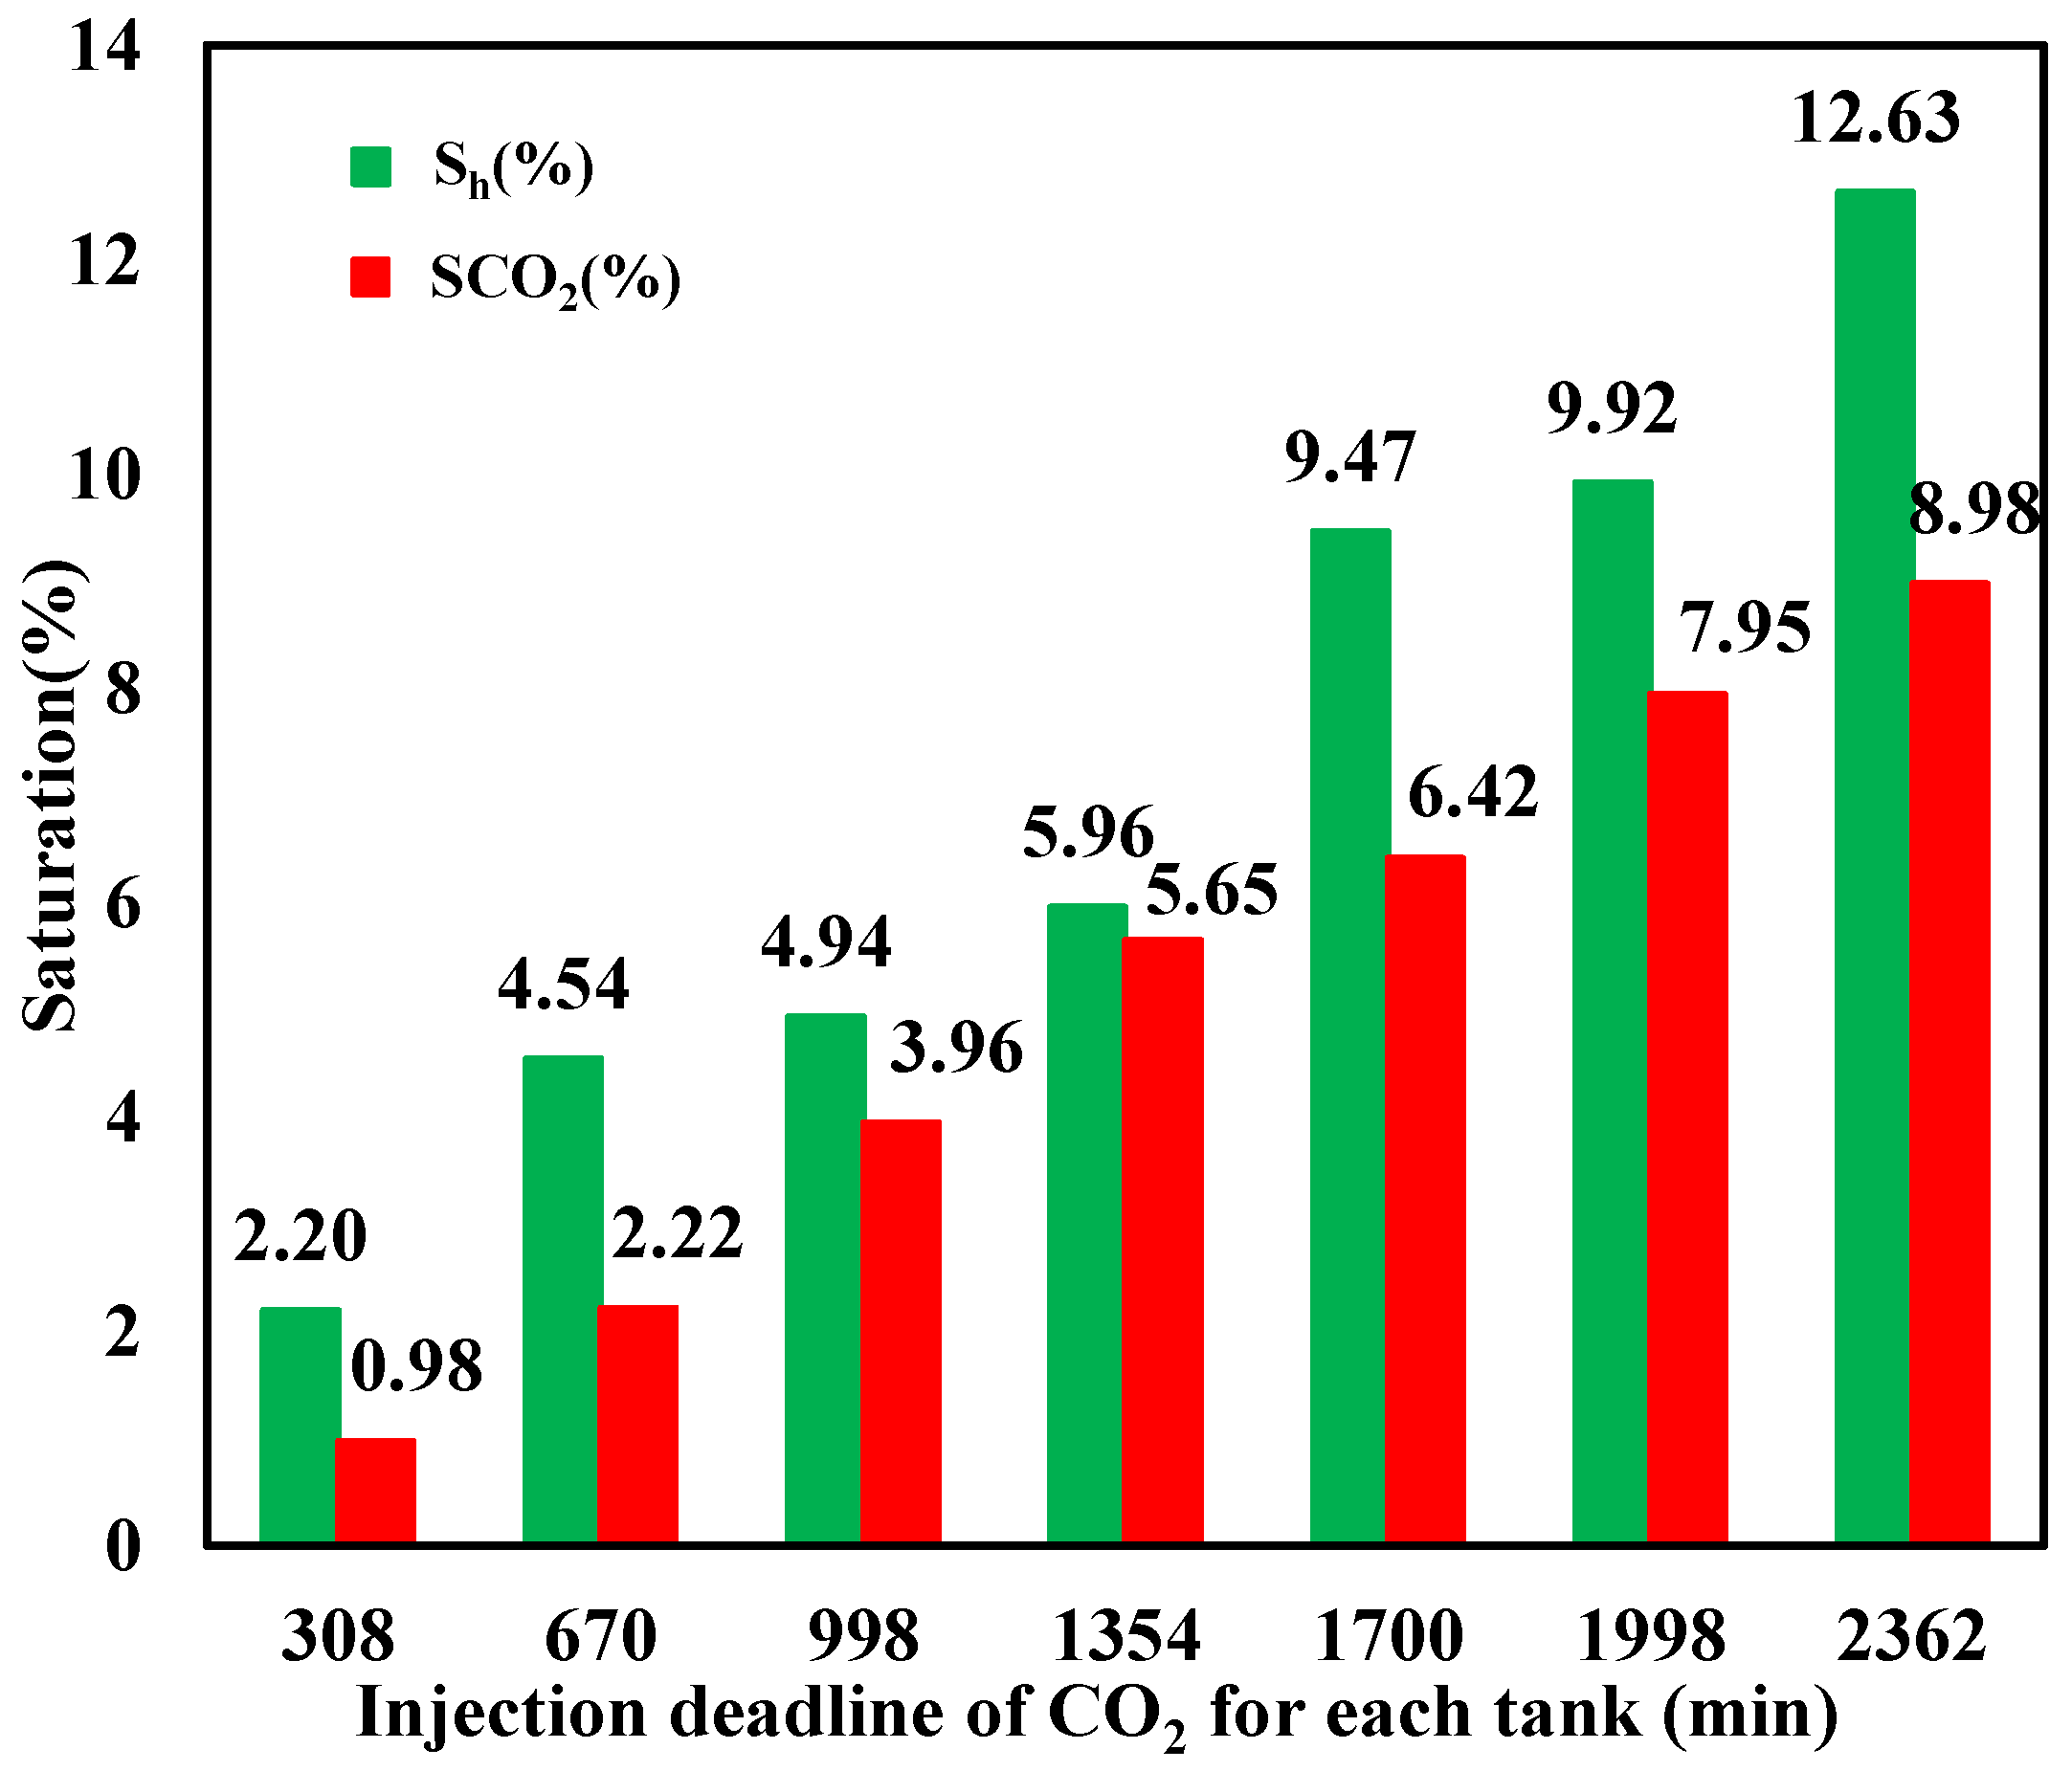
The saturation of CO2 hydrate and liquid CO2 at different injection stages is calculated based on Equations (4) and (5), respectively, with the result illustrated in Figure 12, which indicates that a portion of injected liquid CO2 transforms to hydrate, resulting in hydrate saturation increasing with time. Since hydrate preferentially forms at the interface of CO2 and water with small Gibbs free energy and hinders their effective contact to some degree, which is not beneficial for further hydrate formation, not all liquid CO2 can transform into hydrate, with its saturation showing a nonlinear increasing trend with continuous CO2 injection, while hydrate saturation is always larger than that of liquid CO2. It can also be seen that both the final liquid CO2 and hydrate saturation were small with values of 8.98% and 12.63%, respectively, when the CO2 injection was stopped. This is mainly because the formed hydrate aggravates the heterogeneity and anisotropy in the sediment, resulting in severe heterogeneous figuring phenomena. As a result, the sweep efficiency of injected CO2 is small, with a substantial portion of the water being retained in the sediment, which cannot be effectively displaced by CO2 when a large amount of CO2 is released from the outlet.

Figure 12.
Hydrate- and liquid-based CO2 saturation during injection.
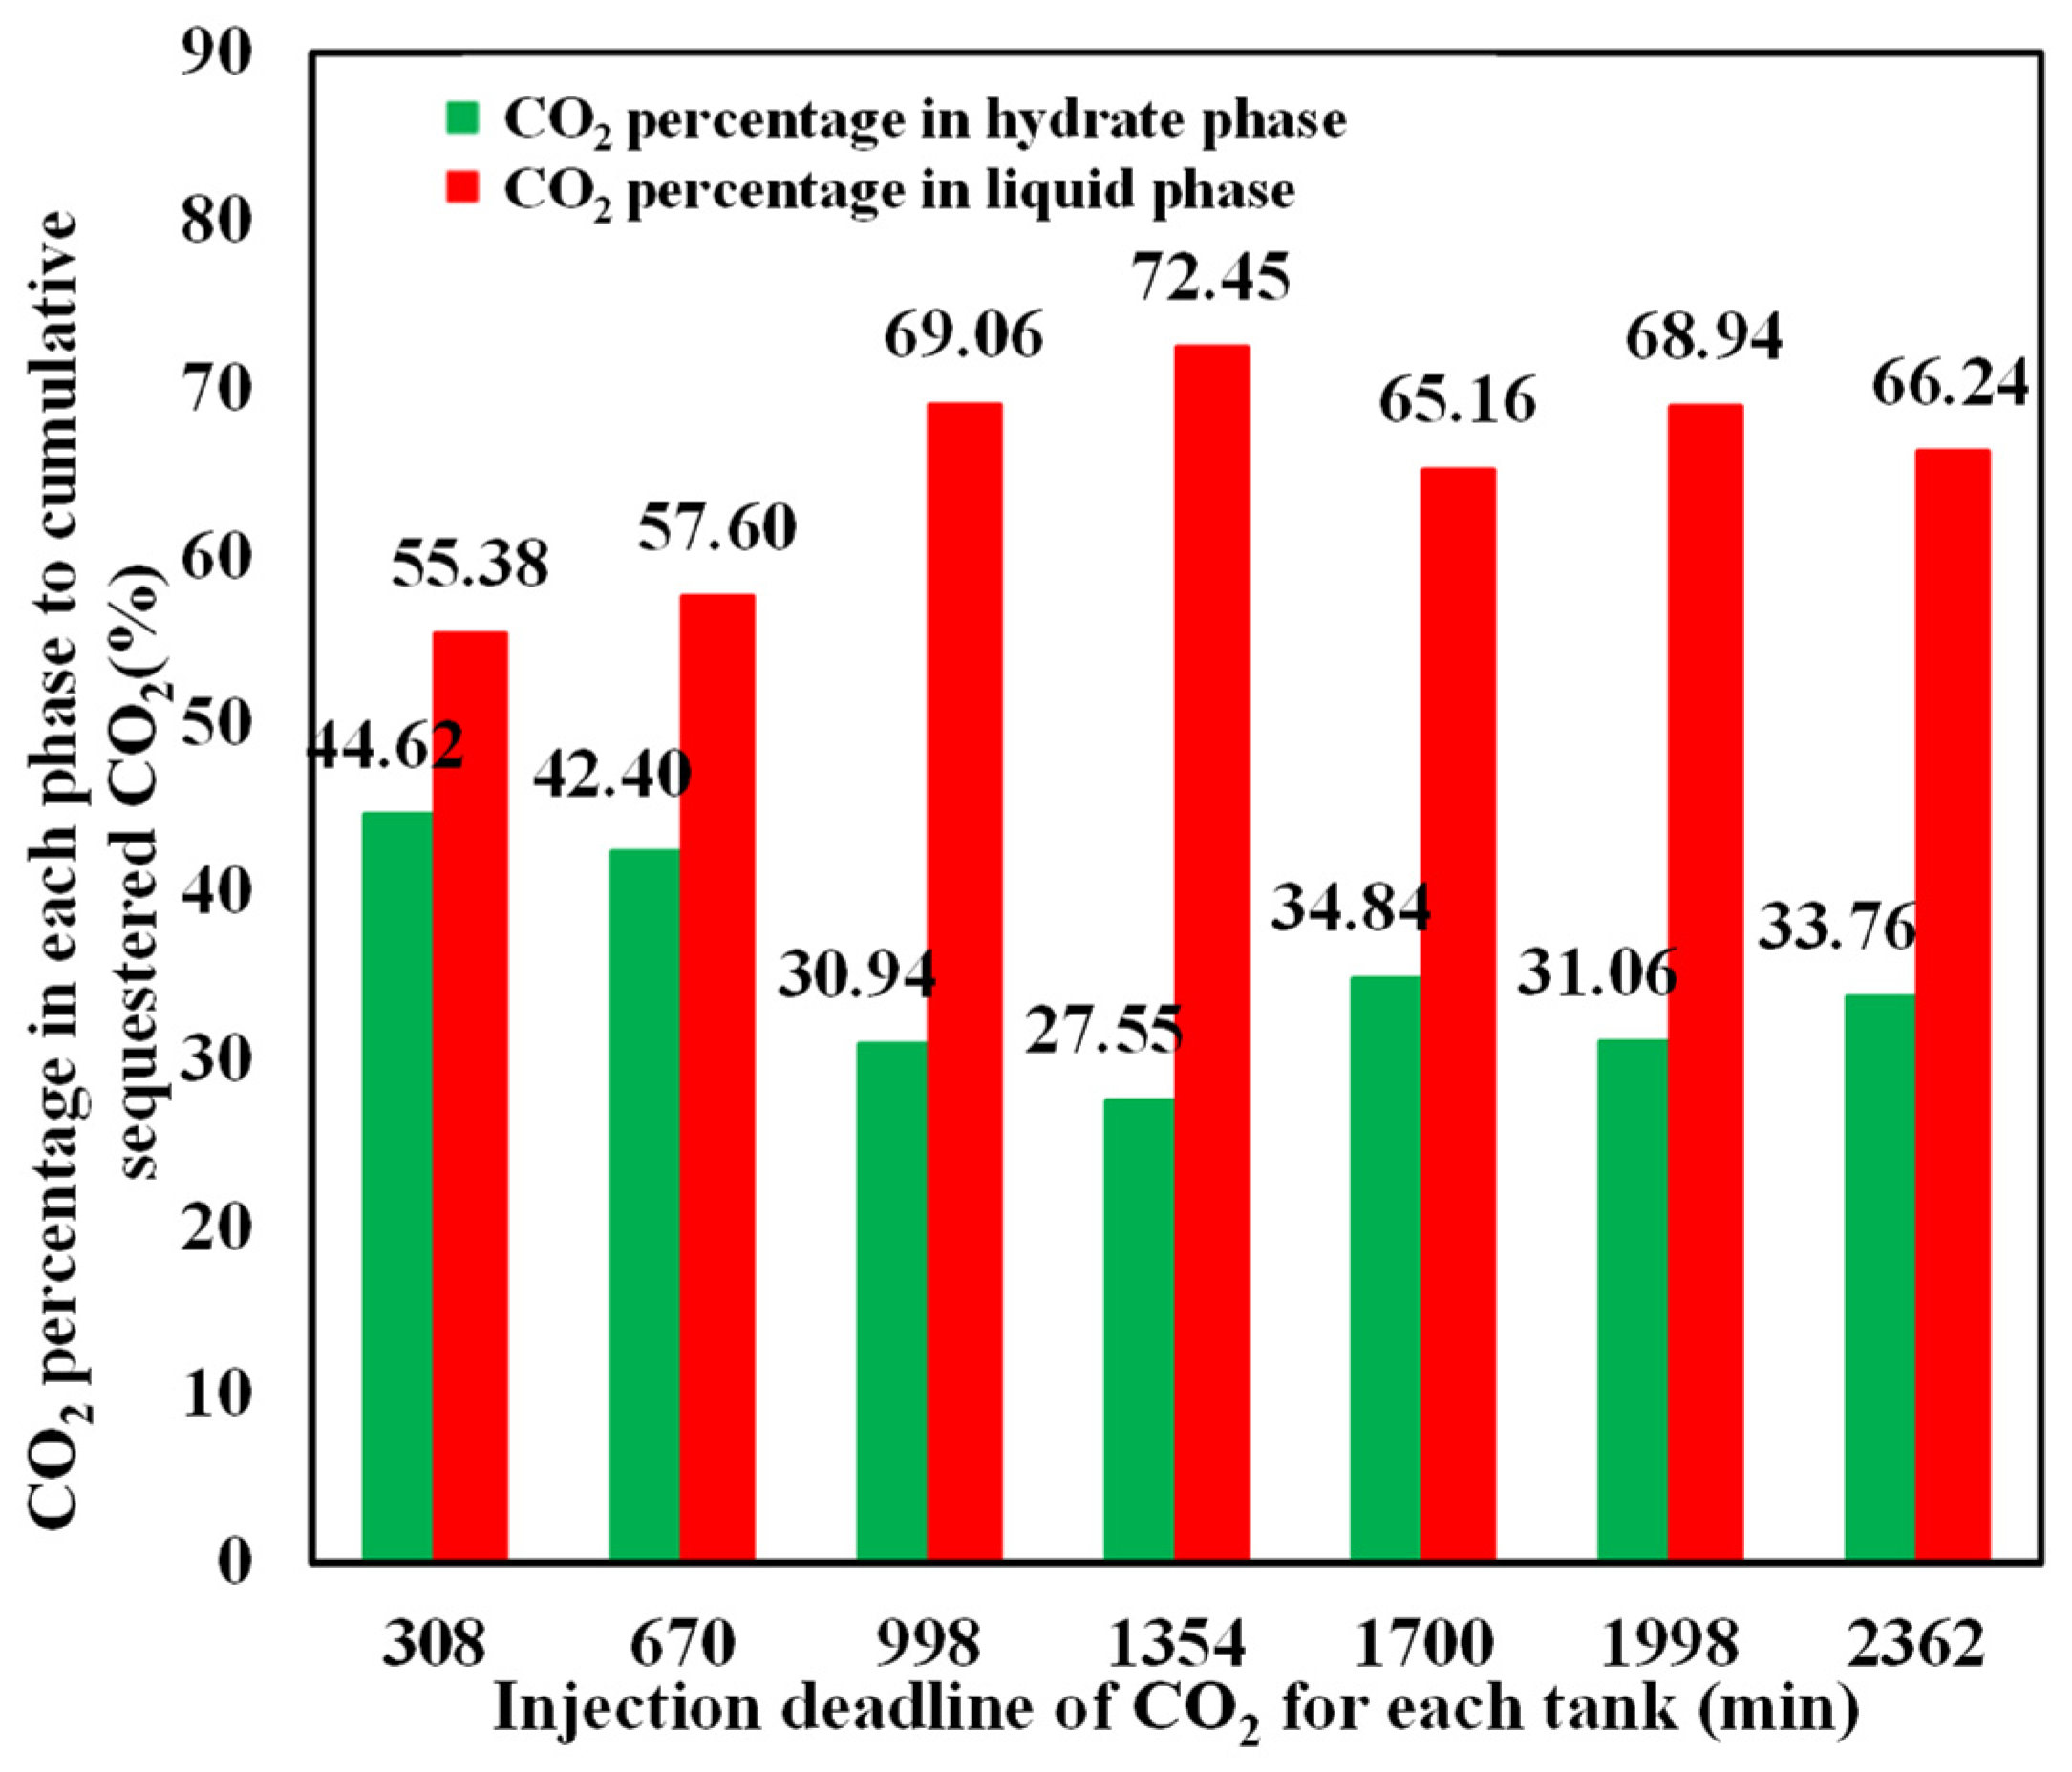
The mass percentage of CO2 in hydrate and liquid phases relative to the cumulative sequestered CO2 at different injection stages is depicted in Figure 13, which shows that the CO2 percentage in the hydrate phase is always smaller than that in the liquid phase, although hydrate saturation is higher than liquid CO2 in the sediment. This is primarily because CO2 hydrate contains a significant proportion of water, with approximately 0.75 volume of water released from per-volume hydrate dissociation. The challenge of further enhancing hydrate saturation and CO2 fraction in the hydrate phase still remains.

Figure 13.
Percentage of sequestered CO2 in hydrate and liquid phases.
3.3.3. Instantaneous Hydrate Conversion and Liquid CO2 Retention Rates
In order to further investigate the dynamic formation characteristics of CO2 hydrate during liquid CO2 injection, the instantaneous hydrate conversion rate is proposed, which is defined as the ratio of the mass difference of CO2 converted to hydrate at different injection stages to the cumulative sequestered CO2. The detailed expression is indicated in Equation (6):
Similarly, the liquid CO2 instantaneous retention rate is defined as the ratio of the mass difference of liquid CO2 sequestered in the sediment at different injection stages to the cumulative sequestered CO2, with the expression shown in Equation (7):
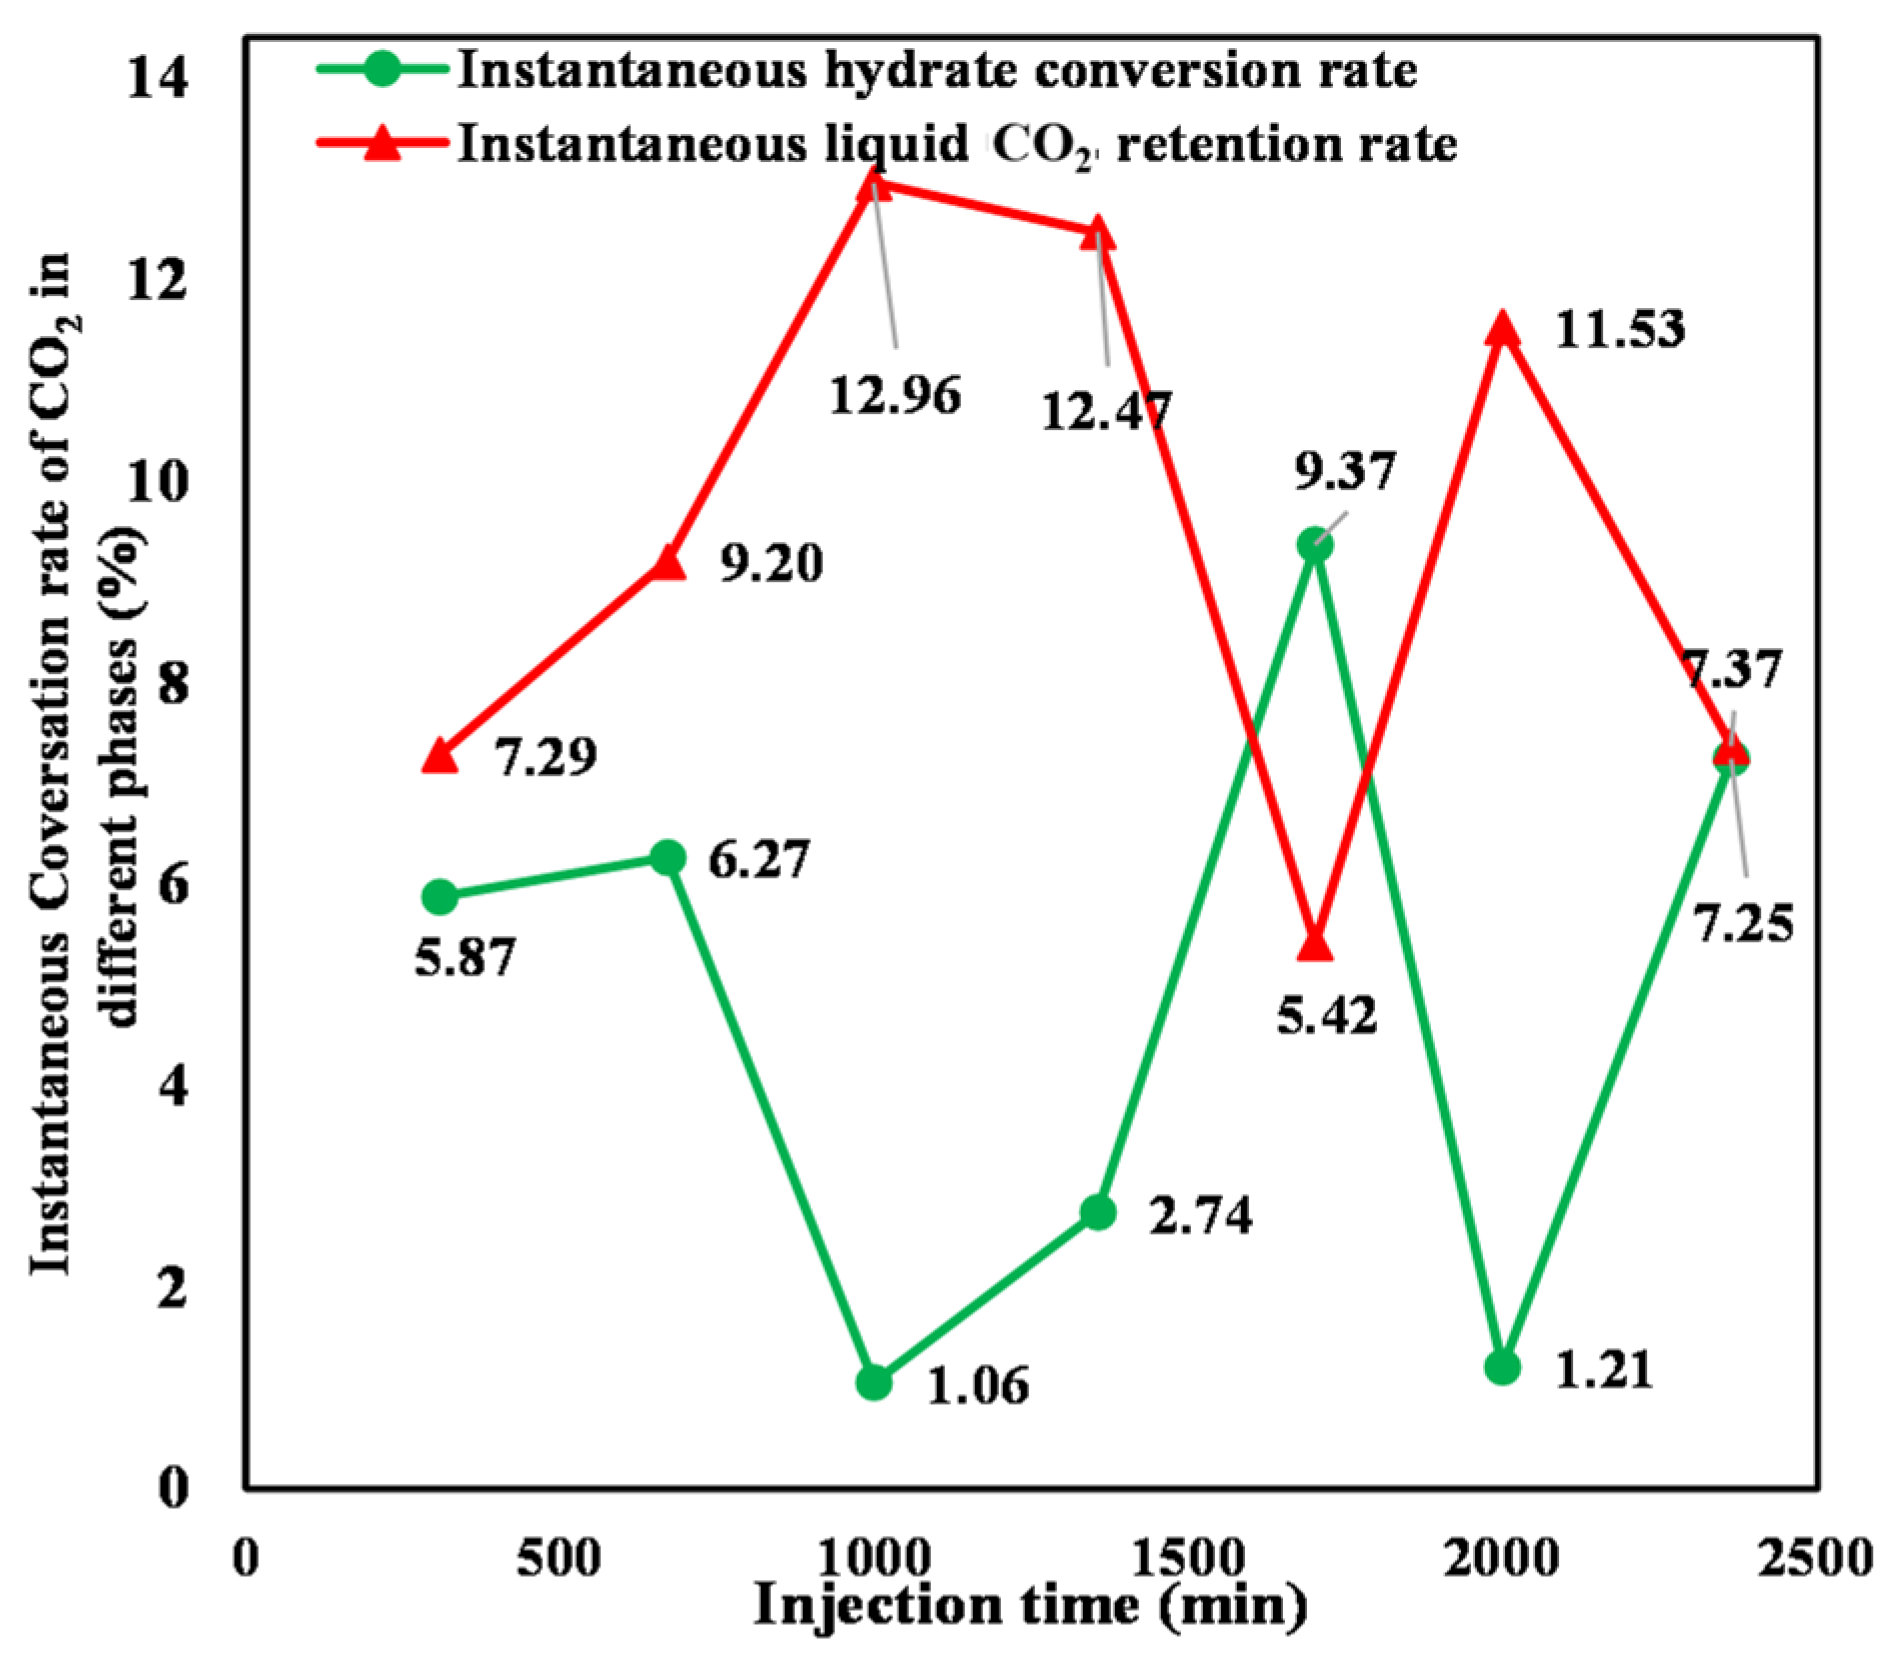
Equations (6) and (7) were utilized to calculate the instantaneous hydrate conversion rate and the liquid CO2 instantaneous retention rate, respectively, during injection, with the result shown in Figure 14. It can be seen that both rates exhibit significant fluctuations with increasing CO2 injection. At the initial stage of liquid CO2 injection, the sediment has a large amount of formation water. The injected CO2 immigrates uniformly in the initially homogeneous sediment. The injected CO2 has thorough contact with the formation water, resulting in a large CO2–water contact area. Therefore, the instantaneous conversion rate of hydrate increases with increasing CO2 injection. However, a proportion of water in the sediment is consumed as a result of hydrate formation with continuous CO2 injection. The generated hydrate impedes the direct contact between subsequently injected CO2 and formation water, reducing their effective contact area. As a result, the instantaneous hydrate conversion rate changes to a decreasing mode. The quantity of the generated hydrate gradually increases as the amount of CO2 injection continues to increase, which causes a more pronounced degradation of the effective pore structure and aggravation of heterogeneity in the sediment. The injected CO2 then shifts toward high-permeability zones with large pore throat radii and good connectivity. Consequently, the contact area between liquid CO2 and formation water increases, resulting in a gradual increase in the instantaneous hydrate conversion rate. With the ongoing injection of liquid CO2, the effective contact area between liquid CO2 and water decreases a second time, leading to a reduction in the instantaneous hydrate conversion rate. The superimposition of the aforementioned factors results in irregular fluctuations in the instantaneous hydrate conversion rate and liquid CO2 instantaneous retention rate. There is an overall opposite evolutionary trend between the instantaneous liquid CO2 retention and hydrate conversion rate during CO2 injection. However, it can be found that the two rates exhibit the same increasing trend for the second tank of liquid CO2 injection. This is mainly because hydrate formation lags behind liquid CO2 injection. In the process of injecting the second tank of liquid CO2 injection, the injected CO2 from the first one continues to generate hydrate, resulting in an instantaneous hydrate conversion rate and instantaneous liquid CO2 retention rate, both evolving in the same increasing trend.

Figure 14.
Instantaneous hydrate conversion and liquid phase retention rates of sequestered CO2.
4. Conclusions
- (1)
- Irregular variations in the temperature and pressure at a certain point and in each layer during CO2 injection confirm the generation of CO2 hydrate as well as its heterogeneous spatial distribution.
- (2)
- When CO2 is injected into the deposit at a constant rate and no large amount of gas is expelled from the outlet, the cumulative sequestered CO2 increases approximately linearly with continuous CO2 injection, while hydrate saturation is always larger than liquid CO2.
- (3)
- CO2 hydrate aggravates the heterogeneity and anisotropy of the sediment, resulting in low CO2 sweep efficiency and small cumulative sequestration in the sediment when a large amount of CO2 is released from the outlet.
- (4)
- The instantaneous hydrate conversion rate and liquid CO2 retention rate both exhibit irregular fluctuations due to the consumption of formation water by CO2, variation in the effective contact area between liquid CO2 and water, and heterogeneity aggravation of the sediment.
Author Contributions
Conceptualization, W.P. and S.Z.; methodology, Y.G.; investigation, M.C.; resources, X.Z.; data curation, H.W.; writing—original draft preparation, M.C.; writing—review and editing, Q.F.; visualization, X.L.; supervision, W.P. and Q.L.; project administration, W.P.; and funding acquisition, W.P. All authors have read and agreed to the published version of the manuscript.
Funding
This research was funded by Research on Hydrate-based CO2 Sequestration Technology in the marine sediments (grant number KJGG-2022-12-CCUS-0302), Research on Production Prediction Method for Complex Structure wells with joint gas production (grant number 2021YFC28000903-2), Research on Cross-scale Phase Transition Characteristics and Numerical Simulation Methods for Depressurization development of natural gas hydrates (grant number KJQZ-2023-2003), and the National Basic Research Program of China (grant number U19B2005).
Data Availability Statement
The data presented in this study are available on request from the corresponding authors. The data are not publicly available, owing to the funding institution’s research data-security commitments.
Conflicts of Interest
Authors Weixin Pang, Yang Ge, Mingqiang Chen, Xiaohan Zhang, Huiyun Wen, Qiang Fu and Xin Lei were employed by the company Research Institute of China National Offshore Oil Cooperation. Shouwei Zhou was employed by the company China National Offshore Oil Corporation. The authors declare that the research was conducted in the absence of any commercial or financial relationships that could be construed as a potential conflict of interest.
References
- Markewitz, P.; Kuckshinrichs, W.; Leitner, W.; Linssen, J.; Zapp, P.; Bongartz, R.; Schreiber, A.; Müller, T.E. Worldwide innovations in the development of carbon capture technologies and the utilization of CO2. Energy Environ. Sci. 2012, 5, 7281–7305. [Google Scholar] [CrossRef]
- Yoro, K.O.; Daramola, M.O. CO2 emission sources, greenhouse gases, and the global warming effect. In Advances in Carbon Capture; Rahimpour, M.R., Farsi, M., Makarem, M.A., Eds.; Woodhead Publishing: Salzton, UK, 2020; pp. 3–28. [Google Scholar]
- Lee, Z.H.; Sethupathi, S.; Lee, K.T.; Bhatia, S.; Mohamed, A.R. An overview on global warming in Southeast Asia: CO2 emission status, efforts done, and barriers. Renew. Sustain. Energy Rev. 2013, 28, 71–81. [Google Scholar] [CrossRef]
- Quadrelli, R.; Peterson, S. The energy–Climate challenge: Recent trends in CO2 emissions from fuel combustion. Energy Policy 2007, 35, 5938–5952. [Google Scholar] [CrossRef]
- Nejat, P.; Jomehzadeh, F.; Taheri, M.M.; Gohari, M.; Abd Majid, M.Z. A global review of energy consumption, CO2 emissions and policy in the residential sector (with an overview of the top ten CO2 emitting countries). Renew. Sustain. Energy Rev. 2015, 43, 843–862. [Google Scholar] [CrossRef]
- Albertz, M.; Stewart, S.A.; Goteti, R. Perspectives on geologic carbon storage. Front. Energy Res. 2023, 10, 1–13. [Google Scholar] [CrossRef]
- Yang, B.; Shao, C.; Hu, X.; Ngata, M.R.; Aminu, M.D. Advances in Carbon Dioxide Storage Projects: Assessment and Perspectives. Energy Fuels 2023, 37, 1757–1776. [Google Scholar]
- Lin, Q.; Zhang, X.; Wang, T.; Zheng, C.; Gao, X. Technical Perspective of Carbon Capture, Utilization, and Storage. Engineering 2022, 14, 27–32. [Google Scholar] [CrossRef]
- de Coninck, H.; Benson, S.M. Carbon Dioxide Capture and Storage: Issues and Prospects. Annu. Rev. Environ. Resour. 2014, 39, 243–270. [Google Scholar] [CrossRef]
- Ringrose, P.S.; Furre, A.-K.; Gilfillan, S.M.V.; Krevor, S.; Landrø, M.; Leslie, R.; Meckel, T.; Nazarian, B.; Zahid, A. Storage of Carbon Dioxide in Saline Aquifers: Physicochemical Processes, Key Constraints, and Scale-Up Potential. Annu. Rev. Chem. Biomol. Eng. 2021, 12, 471–494. [Google Scholar] [CrossRef]
- Wei, N.; Li, X.; Jiao, Z.; Stauffer, P.H.; Liu, S.; Ellett, K.; Middleton, R.S. A Hierarchical Framework for CO2 Storage Capacity in Deep Saline Aquifer Formations. Front. Earth Sci. 2022, 9, 1–21. [Google Scholar] [CrossRef]
- Ismail, I.; Gaganis, V. Carbon Capture, Utilization, and Storage in Saline Aquifers: Subsurface Policies, Development Plans, Well Control Strategies and Optimization Approaches—A Review. Clean Technol. 2023, 5, 609–637. [Google Scholar] [CrossRef]
- Worden, R.H. Carbon Dioxide Capture and Storage (CCS) in Saline Aquifers versus Depleted Gas Fields. Geosciences 2024, 14, 146. [Google Scholar] [CrossRef]
- Williams, G.A.; Chadwick, R.A. Influence of reservoir-scale heterogeneities on the growth, evolution and migration of a CO2 plume at the Sleipner Field, Norwegian North Sea. Int. J. Greenh. Gas Control 2021, 106, 103260. [Google Scholar] [CrossRef]
- Wen, G.; Li, Z.; Long, Q.; Azizzadenesheli, K.; Anandkumar, A.; Benson, S.M. Real-time high-resolution CO2 geological storage prediction using nested Fourier neural operators. Energy Environ. Sci. 2023, 16, 1732–1741. [Google Scholar] [CrossRef]
- Akai, T.; Kuriyama, T.; Kato, S.; Okabe, H. Numerical modelling of long-term CO2 storage mechanisms in saline aquifers using the Sleipner benchmark dataset. Int. J. Greenh. Gas Control 2021, 110, 103405. [Google Scholar] [CrossRef]
- Luo, A.; Li, Y.; Chen, X.; Zhu, Z.; Peng, Y. Review of CO2 sequestration mechanism in saline aquifers. Nat. Gas Ind. B 2022, 9, 383–393. [Google Scholar] [CrossRef]
- Bickle, M.J. Geological carbon storage. Nat. Geosci. 2009, 2, 815–818. [Google Scholar] [CrossRef]
- Bradshaw, J.; Bachu, S.; Bonijoly, D.; Burruss, R.; Holloway, S.; Christensen, N.P.; Mathiassen, O.M. CO2 storage capacity estimation: Issues and development of standards. Int. J. Greenh. Gas Control 2007, 1, 62–68. [Google Scholar] [CrossRef]
- Wang, Z.; Li, H.; Liu, S.; Xu, J.; Liu, J.; Wang, X. Risk evaluation of CO2 leakage through fracture zone in geological storage reservoir. Fuel 2023, 342, 127896. [Google Scholar] [CrossRef]
- Katsuki, D.; Ohmura, R.; Ebinuma, T.; Narita, H. Formation, growth and ageing of clathrate hydrate crystals in a porous medium. Philos. Mag. 2006, 86, 1753–1761. [Google Scholar] [CrossRef]
- Sadeq, D.; Iglauer, S.; Lebedev, M.; Rahman, T.; Zhang, Y.; Barifcani, A. Experimental pore-scale analysis of carbon dioxide hydrate in sandstone via X-Ray micro-computed tomography. Int. J. Greenh. Gas Control 2018, 79, 73–82. [Google Scholar] [CrossRef]
- Circone, S.; Stern, L.A.; Kirby, S.H.; Durham, W.B.; Chakoumakos, B.C.; Rawn, C.J.; Rondinone, A.J.; Ishii, Y. CO2 Hydrate: Synthesis, Composition, Structure, Dissociation Behavior, and a Comparison to Structure I CH4 Hydrate. J. Phys. Chem. B 2003, 107, 5529–5539. [Google Scholar] [CrossRef]
- Kim, H.-S.; Cho, G.-C. Experimental Simulation of the Self-Trapping Mechanism for CO2 Sequestration into Marine Sediments. Minerals 2019, 9, 579. [Google Scholar] [CrossRef]
- Almenningen, S.; Gauteplass, J.; Fotland, P.; Aastveit, G.; Barth, T.; Ersland, G. Visualization of hydrate formation during CO2 storage in water-saturated sandstone. Int. J. Greenh. Gas Control 2018, 79, 272–278. [Google Scholar] [CrossRef]
- House, K.Z.; Schrag, D.P.; Harvey, C.F.; Lackner, K.S. Permanent carbon dioxide storage in deep-sea sediments. Proc. Natl. Acad. Sci. USA 2006, 103, 12291–12295. [Google Scholar] [CrossRef] [PubMed]
- Tohidi, B.; Yang, J.; Salehabadi, M.; Anderson, R.; Chapoy, A. CO2 Hydrates Could Provide Secondary Safety Factor in Subsurface Sequestration of CO2. Environ. Sci. Technol. 2010, 44, 1509–1514. [Google Scholar] [CrossRef] [PubMed]
- Gauteplass, J.; Almenningen, S.; Ersland, G.; Barth, T.; Yang, J.; Chapoy, A. Multiscale investigation of CO2 hydrate self-sealing potential for carbon geo-sequestration. Chem. Eng. J. 2020, 381, 122646. [Google Scholar] [CrossRef]
- Sun, Z.; Li, N.; Jia, S.; Cui, J.; Yuan, Q.; Sun, C.; Chen, G. A novel method to enhance methane hydrate exploitation efficiency via forming impermeable overlying CO2 hydrate cap. Appl. Energy 2019, 240, 842–850. [Google Scholar] [CrossRef]
- Cui, J.; Sun, Z.; Kan, J.; Jia, S.; Sun, C.; Chen, G.; Wang, X.; Yuan, Q.; Li, N. Study on the factors affecting the sealing performance and mechanical stability of CO2 hydrate cap during gas production from methane hydrate. J. Nat. Gas Sci. Eng. 2021, 93, 104050. [Google Scholar] [CrossRef]
- Zhang, L.; Yang, L.; Wang, J.; Zhao, J.; Dong, H.; Yang, M.; Liu, Y.; Song, Y. Enhanced CH4 recovery and CO2 storage via thermal stimulation in the CH4/CO2 replacement of methane hydrate. Chem. Eng. J. 2017, 308, 40–49. [Google Scholar] [CrossRef]
- Lee, S.; Lee, Y.; Lee, J.; Lee, H.; Seo, Y. Experimental Verification of Methane–Carbon Dioxide Replacement in Natural Gas Hydrates Using a Differential Scanning Calorimeter. Environ. Sci. Technol. 2013, 47, 13184–13190. [Google Scholar] [CrossRef]
- Liu, T.; Wu, P.; Chen, Z.; Li, Y. Review on Carbon Dioxide Replacement of Natural Gas Hydrate: Research Progress and Perspectives. Energy Fuels 2022, 36, 7321–7336. [Google Scholar] [CrossRef]
- Wei, W.; Li, B.; Gan, Q.; Li, Y. Research progress of natural gas hydrate exploitation with CO2 replacement: A review. Fuel 2022, 312, 122873. [Google Scholar] [CrossRef]
- Ndlovu, P.; Babaee, S.; Naidoo, P. Review on CH4-CO2 replacement for CO2 sequestration and CH4/ CO2 hydrate formation in porous media. Fuel 2022, 320, 123795. [Google Scholar] [CrossRef]
- Jia, W.; Song, S.; Li, C.; Wu, X. Predictions on CH4 recovery factors using the CO2 replacement method to develop natural gas hydrate resources. J. CO2 Util. 2020, 41, 101238. [Google Scholar] [CrossRef]
- Hyodo, M.; Li, Y.; Yoneda, J.; Nakata, Y.; Yoshimoto, N.; Kajiyama, S.; Nishimura, A.; Song, Y. A comparative analysis of the mechanical behavior of carbon dioxide and methane hydrate-bearing sediments. Am. Miner. 2014, 99, 178–183. [Google Scholar] [CrossRef]
- Ersland, G.; Husebø, J.; Graue, A.; Kvamme, B. Transport and storage of CO2 in natural gas hydrate reservoirs. Energy Procedia 2009, 1, 3477–3484. [Google Scholar] [CrossRef]
- Ren, L.; Jiang, M.; Wang, L.; Zhu, Y.; Li, Z.; Sun, C.; Chen, G. Gas hydrate exploitation and carbon dioxide sequestration under maintaining the stiffness of hydrate-bearing sediments. Energy 2020, 194, 116869. [Google Scholar] [CrossRef]
- Kvamme, B.; Graue, A.; Buanes, T.; Kuznetsova, T.; Ersland, G. Storage of CO2 in natural gas hydrate reservoirs and the effect of hydrate as an extra sealing in cold aquifers. Int. J. Greenh. Gas Control 2007, 1, 236–246. [Google Scholar] [CrossRef]
- Castellani, B.; Rossetti, G.; Tupsakhare, S.; Rossi, F.; Nicolini, A.; Castaldi, M.J. Simulation of CO2 storage and methane gas production from gas hydrates in a large scale laboratory reactor. J. Pet. Sci. Eng. 2016, 147, 515–527. [Google Scholar] [CrossRef]
- Baldwin, B.A.; Stevens, J.; Howard, J.J.; Graue, A.; Kvamme, B.; Aspenes, E.; Ersland, G.; Husebø, J.; Zornes, D.R. Using magnetic resonance imaging to monitor CH4 hydrate formation and spontaneous conversion of CH4 hydrate to CO2 hydrate in porous media. Magn. Reson. Imaging 2009, 27, 720–726. [Google Scholar] [CrossRef] [PubMed]
- Sun, Y.; Jiang, S.; Li, S.; Wang, X.; Peng, S. Hydrate formation from clay bound water for CO2 storage. Chem. Eng. J. 2021, 406, 126872. [Google Scholar] [CrossRef]
- Cao, X.; Wang, H.; Yang, K.; Wu, S.; Chen, Q.; Bian, J. Hydrate-based CO2 sequestration technology: Feasibilities, mechanisms, influencing factors, and applications. J. Pet. Sci. Eng. 2022, 219, 111121. [Google Scholar] [CrossRef]
- Zhang, X.; Zhang, M.; Yang, H.; Li, J.; Li, Y.; Wu, Q. Experimental study on the formation characteristics of CO2 hydrate in porous media below the freezing point: Influence of particle size and temperature on the formation process and storage capacity. Energy Sci. Eng. 2022, 10, 1164–1176. [Google Scholar] [CrossRef]
- Liu, Y.; Wang, P.; Yang, M.; Zhao, Y.; Zhao, J.; Song, Y. CO2 sequestration in depleted methane hydrate sandy reservoirs. J. Nat. Gas Sci. Eng. 2018, 49, 428–434. [Google Scholar] [CrossRef]
- Zheng, J.; Chong, Z.R.; Qureshi, M.F.; Linga, P. Carbon Dioxide Sequestration via Gas Hydrates: A Potential Pathway toward Decarbonization. Energy Fuels 2020, 34, 10529–10546. [Google Scholar] [CrossRef]
- Zhang, K.; Lau, H.C. Sequestering CO2 as CO2 hydrate in an offshore saline aquifer by reservoir pressure management. Energy 2022, 239, 122231. [Google Scholar] [CrossRef]
- Kuang, Y.; Zhang, L.; Zheng, Y. Enhanced CO2 sequestration based on hydrate technology with pressure oscillation in porous medium using NMR. Energy 2022, 252, 124082. [Google Scholar] [CrossRef]
- Zhao, G.; Zheng, J.; Gong, G.; Chen, B.; Yang, M.; Song, Y. Formation characteristics and leakage termination effects of CO2 hydrate cap in case of geological sequestration leakage. Appl. Energy 2023, 351, 121896. [Google Scholar] [CrossRef]
- Castellani, B. Potential Pathway for Reliable Long-Term CO2 Storage as Clathrate Hydrates in Marine Environments. Energies 2023, 16, 2856. [Google Scholar] [CrossRef]
- Junji Yamaguchi, A.; Sato, T.; Tobase, T.; Wei, X.; Huang, L.; Zhang, J.; Bian, J.; Liu, T.-Y. Multiscale numerical simulation of CO2 hydrate storage using machine learning. Fuel 2023, 334, 126678. [Google Scholar] [CrossRef]
- Zatsepina, O.Y.; Pooladi-Darvish, M. Storage of CO2 as Hydrate in Depleted Gas Reservoirs. SPE Reserv. Eval. Eng. 2012, 15, 98–108. [Google Scholar] [CrossRef]
- De-Galda, V.; Rahmanian, N.; Batrshin, D. Assessment of CO2 Storage as Hydrates in Saline Aquifers using Machine Learning Algorithms. Chem. Eng. Trans. 2021, 86, 517–522. [Google Scholar]
- Nordbotten, J.M.; Celia, M.A.; Bachu, S. Injection and Storage of CO2 in Deep Saline Aquifers: Analytical Solution for CO2 Plume Evolution During Injection. Transp. Porous Media 2005, 58, 339–360. [Google Scholar] [CrossRef]
- Anwar, S.; Carroll, J.J. Density (kg/m3) of Carbon Dioxide as a Function of Temperature and Pressure. In Carbon Dioxide Thermodynamic Properties Handbook; Scrivener Publishing LLC: Beverly, MA, USA, 2016; pp. 9–148. [Google Scholar]


Disclaimer/Publisher’s Note: The statements, opinions and data contained in all publications are solely those of the individual author(s) and contributor(s) and not of MDPI and/or the editor(s). MDPI and/or the editor(s) disclaim responsibility for any injury to people or property resulting from any ideas, methods, instructions or products referred to in the content. |
© 2024 by the authors. Licensee MDPI, Basel, Switzerland. This article is an open access article distributed under the terms and conditions of the Creative Commons Attribution (CC BY) license (https://creativecommons.org/licenses/by/4.0/).