
Competing Manufacturers Adopt Blockchain for Tracing Power Batteries: Is There a Win-Win Zone?
Abstract
:1. Introduction
2. Literature Review
- (1)
- Existing research on battery manufacturer decisions to adopt blockchain is inadequate. A comprehensive view should consider the closed-loop battery supply chain integrating sales and recycling. Specifically, blockchain’s role in the reverse recycling supply chain requires discussion.
- (2)
- Asymmetric competition between manufacturers and battery quality influence decisions, yet current research does not account for these factors.
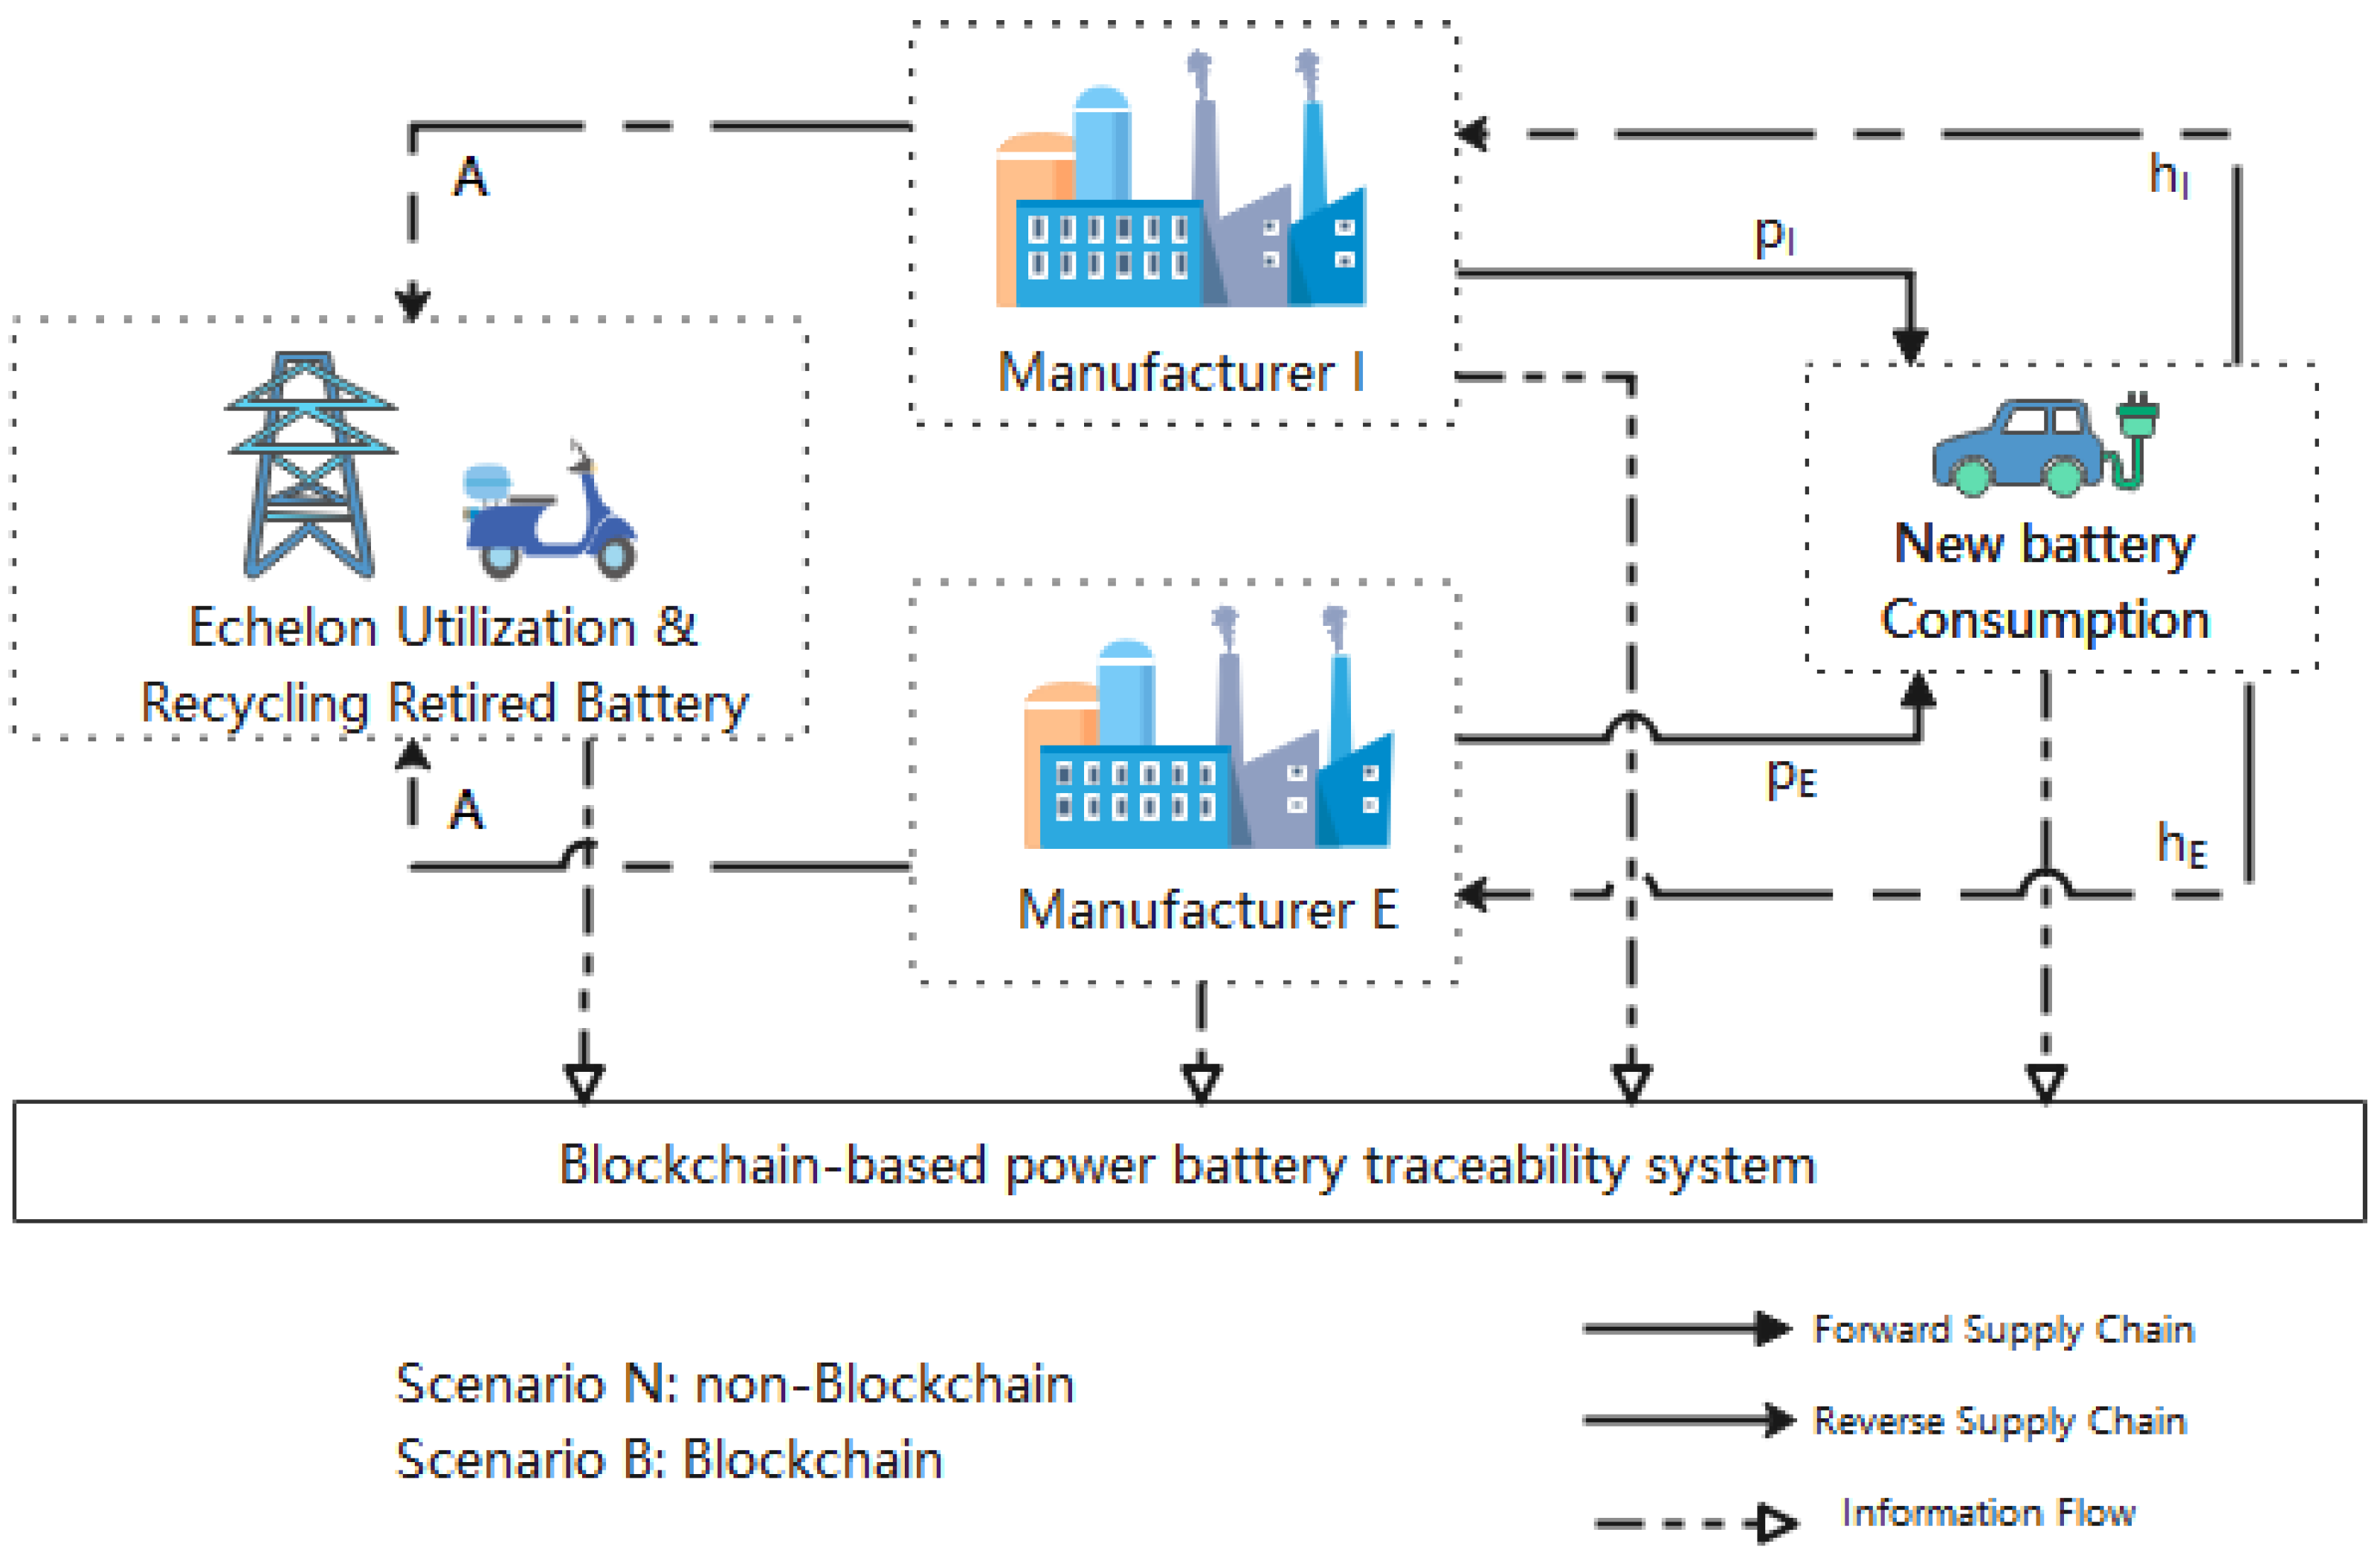
3. Model and Equilibrium Analysis
- (1)
- Expanding market potential.
- (2)
- Reducing retired batteries reuse cost.
4. Discussion
4.1. Analysis of Forward Supply Chain
- (i)
- , or
- (ii)
4.2. Analysis of Reverse Supply Chain
- (i)
- , or
- (ii)
- (i)
- , or
- (ii)
4.3. Preference of Manufacturers
- (i)
- , or
- (ii)
5. Extension of the Models
5.1. Model Extension 1—Asymmetric Competition (Model E1)
5.2. Model Extension 2—Considering Battery Quality (Model E2)
5.3. Preference of Manufacturers in Extensions
5.3.1. Model E1
5.3.2. Model E2
6. Conclusions
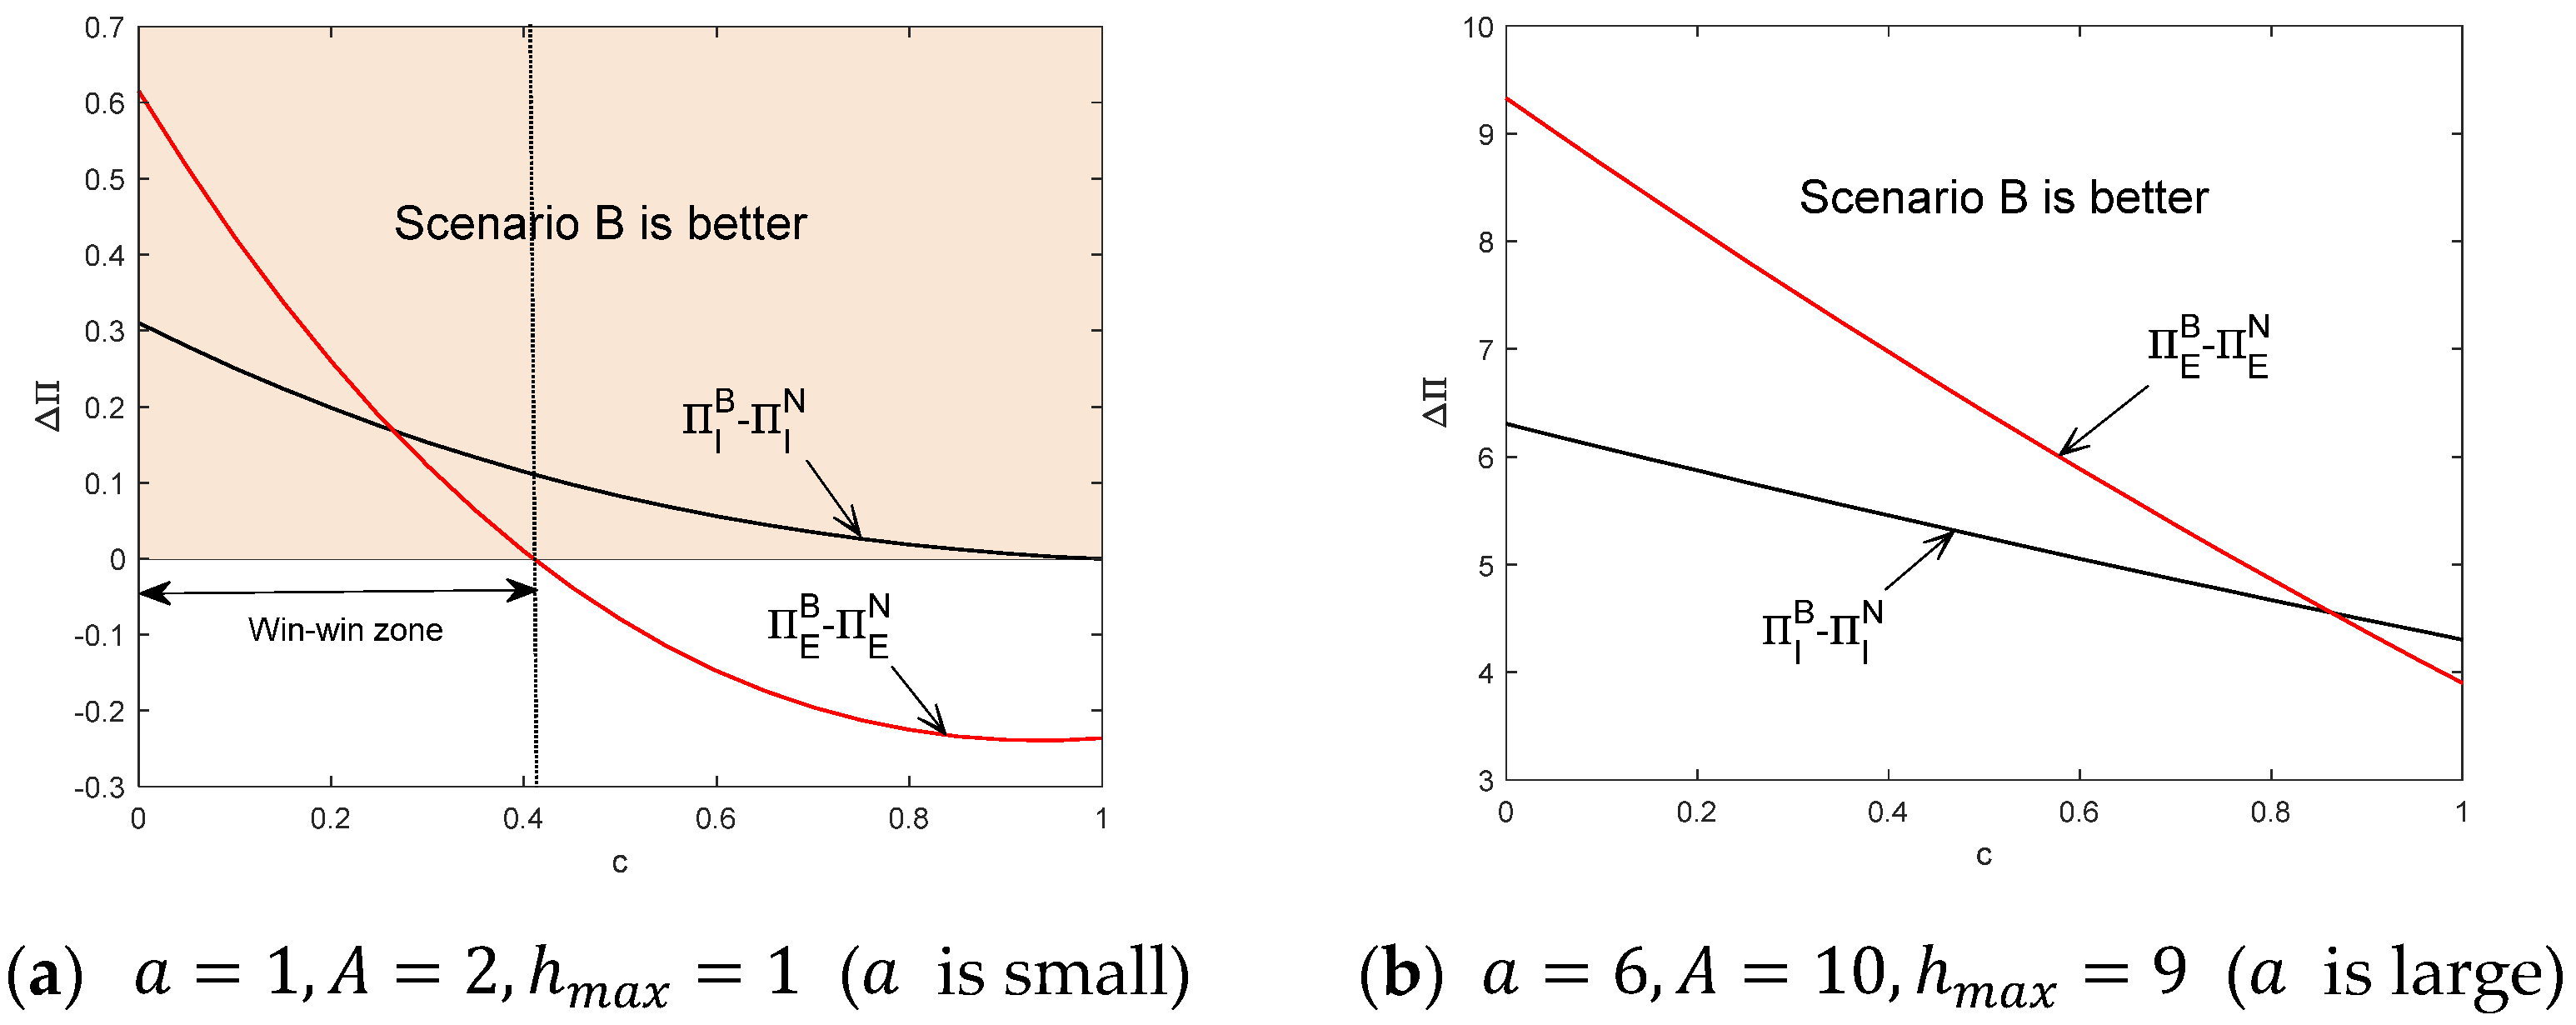
- (1)
- When the market scale is large, blockchain-based tracking can enhance the recycling amount of retired batteries as well as reverse supply chain profits to fend off competition risks. Therefore, an appropriately expanded market is more conducive to the recycling of retired batteries.
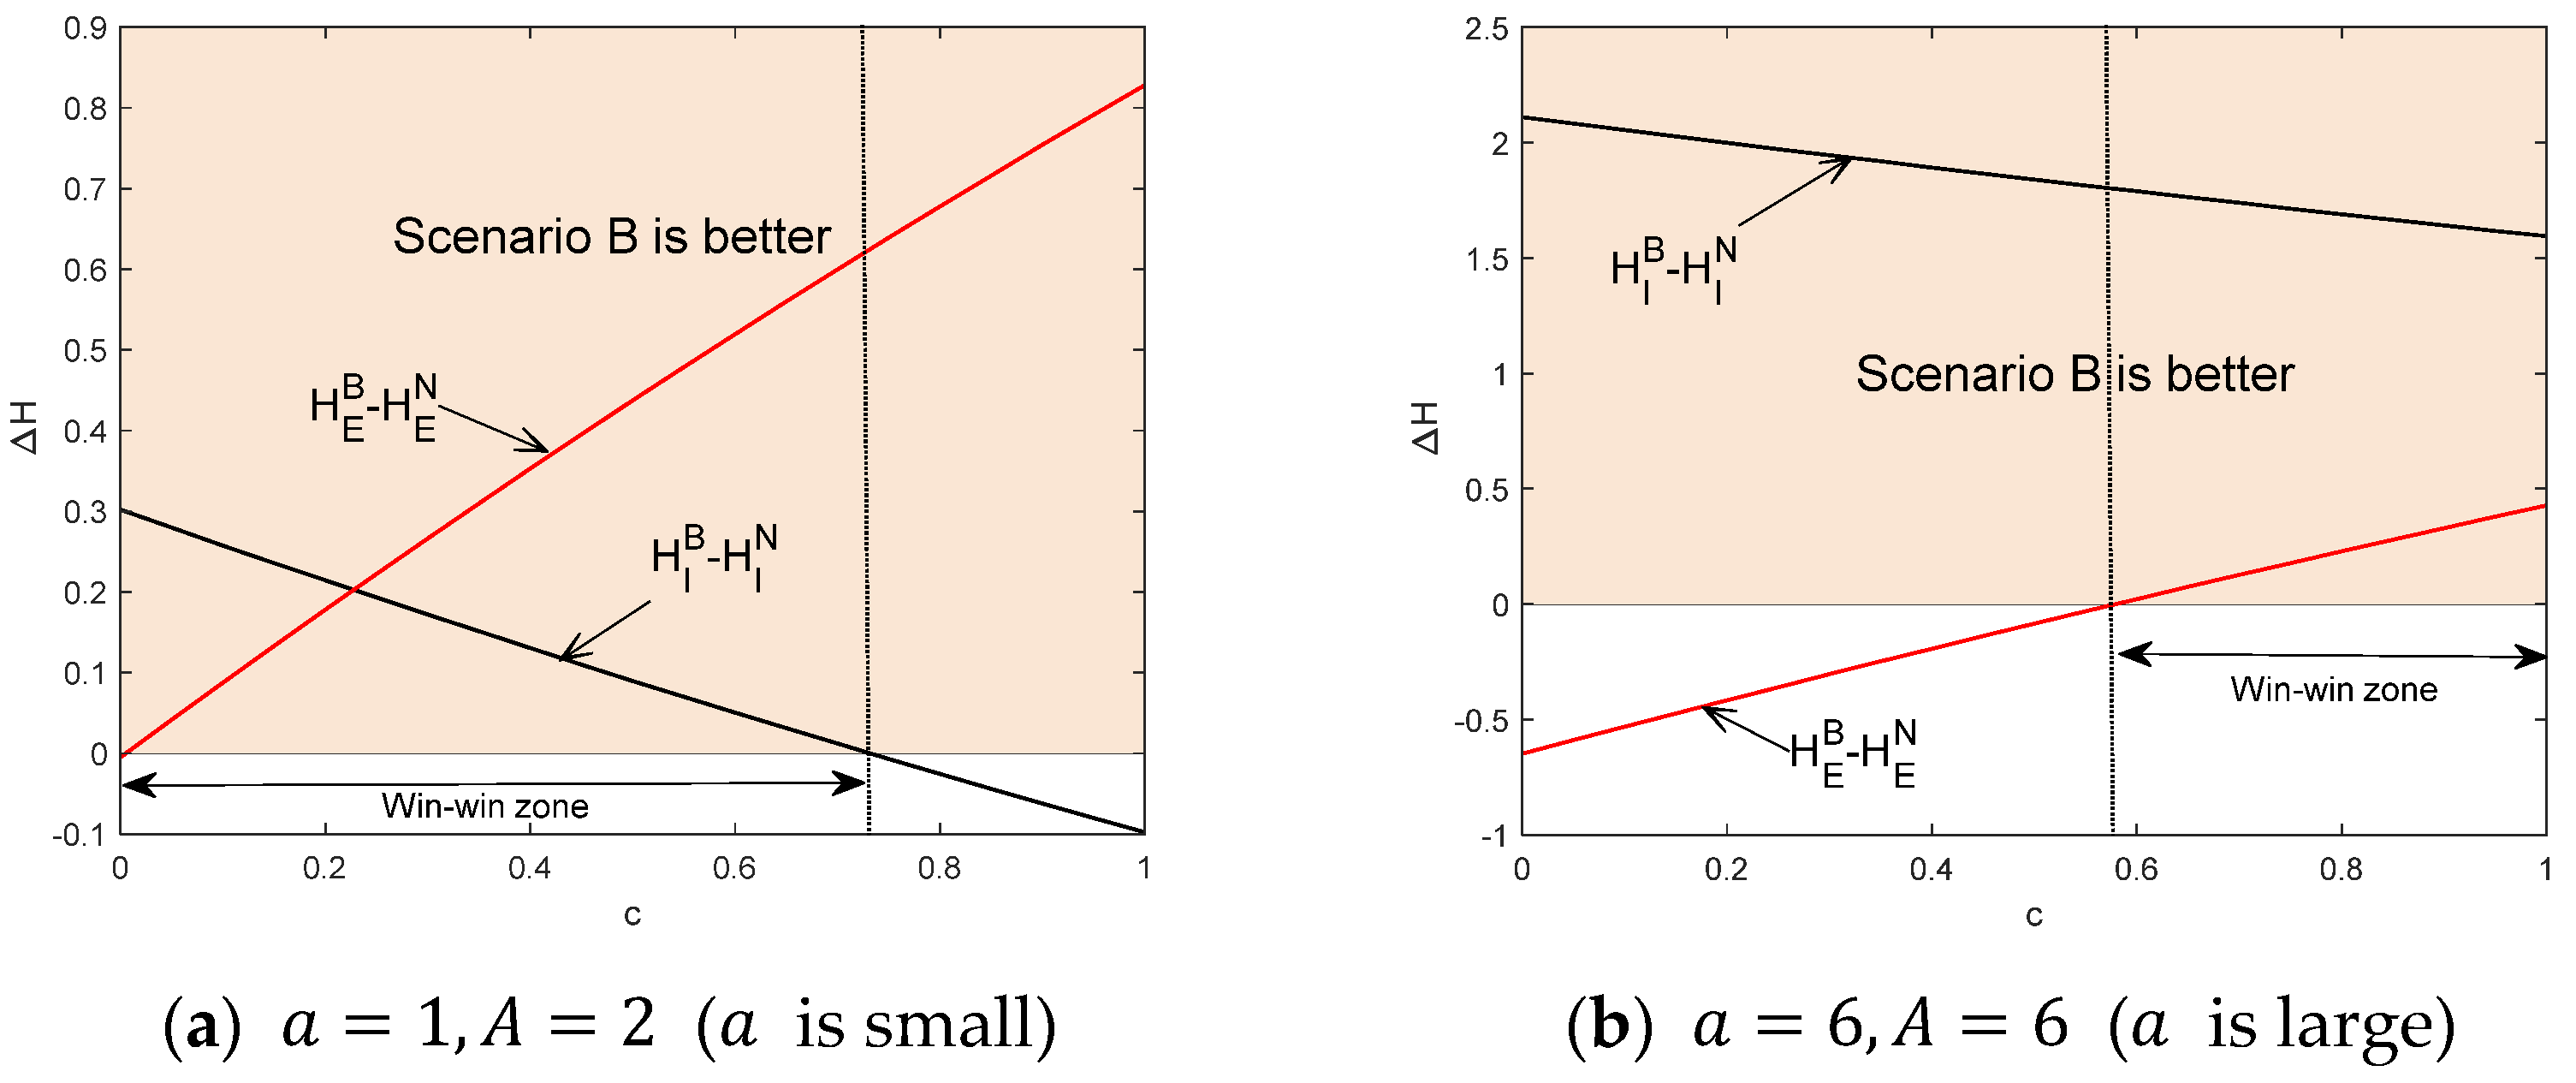
- (2)
- There is a “win-win” zone of battery quality in the small-scale market with low cost or the large-scale market with high cost. Blockchain-based tracking to improve battery quality could be achieved by reducing blockchain costs or expanding the market.
Supplementary Materials
Author Contributions
Funding
Data Availability Statement
Acknowledgments
Conflicts of Interest
Appendix A
- (i)
- , or
- (ii)
- . □
- (i)
- , or
- (ii)
- . □
- (i)
- , or
- (ii)
- □
- (i)
- , and , or
- (ii)
- or
- (iii)
- □
References
- Alimujiang, A.; Jiang, P. Synergy and Co-Benefits of Reducing CO2 and Air Pollutant Emissions by Promoting Electric Vehicles—A Case of Shanghai. Energy Sustain. Dev. 2020, 55, 181–189. [Google Scholar] [CrossRef]
- Harper, G.; Sommerville, R.; Kendrick, E.; Driscoll, L.; Slater, P.; Stolkin, R.; Walton, A.; Christensen, P.; Heidrich, O.; Lambert, S.; et al. Recycling Lithium-Ion Batteries from Electric Vehicles. Nature 2019, 575, 75–86. [Google Scholar] [CrossRef]
- Chen, J.; Zhang, W.; Gong, B.; Zhang, X.; Li, H. Optimal Policy for the Recycling of Electric Vehicle Retired Power Batteries. Technol. Forecast. Soc. Chang. 2022, 183, 121930. [Google Scholar] [CrossRef]
- Liu, M.; Liu, W.; Liu, W.; Chen, Z.; Cui, Z. To What Extent Can Recycling Batteries Help Alleviate Metal Supply Shortages and Environmental Pressures in China? Sustain. Prod. Consum. 2023, 36, 139–147. [Google Scholar] [CrossRef]
- Leal, V.M.; Ribeiro, J.S.; Coelho, E.L.D.; Freitas, M.B.J.G. Recycling of Spent Lithium-Ion Batteries as a Sustainable Solution to Obtain Raw Materials for Different Applications. J. Energy Chem. 2022, 79, 118–134. [Google Scholar] [CrossRef]
- Guo, X.; Sun, Y.; Ren, D. Life Cycle Carbon Emission and Cost-Effectiveness Analysis of Electric Vehicles in China. Energy Sustain. Dev. 2023, 72, 1–10. [Google Scholar] [CrossRef]
- Ruoso, A.C.; Ribeiro, J.L.D. The Influence of Countries’ Socioeconomic Characteristics on the Adoption of Electric Vehicle. Energy Sustain. Dev. 2022, 71, 251–262. [Google Scholar] [CrossRef]
- Tian, G.; Yuan, G.; Aleksandrov, A.; Zhang, T.; Li, Z.; Fathollahi-Fard, A.M.; Ivanov, M. Recycling of Spent Lithium-Ion Batteries: A Comprehensive Review for Identification of Main Challenges and Future Research Trends. Sustain. Energy Technol. Assess. 2022, 53, 102447. [Google Scholar] [CrossRef]
- Sarker, M.T.; Haram, M.H.S.M.; Shern, S.J.; Ramasamy, G.; Al Farid, F. Second-Life Electric Vehicle Batteries for Home Photovoltaic Systems: Transforming Energy Storage and Sustainability. Energies 2024, 17, 2345. [Google Scholar] [CrossRef]
- Nazaralizadeh, S.; Banerjee, P.; Srivastava, A.K.; Famouri, P. Battery Energy Storage Systems: A Review of Energy Management Systems and Health Metrics. Energies 2024, 17, 1250. [Google Scholar] [CrossRef]
- Cao, K.; Guo, Q.; Xu, Y. Information Sharing and Carbon Reduction Strategies with Extreme Weather in the Platform Economy. Int. J. Prod. Econ. 2023, 255, 108683. [Google Scholar] [CrossRef]
- Ha, A.Y.; Tong, S. Contracting and Information Sharing under Supply Chain Competition. Manag. Sci. 2008, 54, 701–715. [Google Scholar] [CrossRef]
- Mishra, B.K.; Raghunathan, S.; Yue, X. Demand Forecast Sharing in Supply Chains. Prod. Oper. Manag. 2009, 18, 152–166. [Google Scholar] [CrossRef]
- Shang, W.; Ha, A.Y.; Tong, S. Information Sharing in a Supply Chain with a Common Retailer. Manag. Sci. 2016, 62, 245–263. [Google Scholar] [CrossRef]
- Antônio Rufino Júnior, C.; Sanseverino, E.R.; Gallo, P.; Koch, D.; Schweiger, H.-G.; Zanin, H. Blockchain Review for Battery Supply Chain Monitoring and Battery Trading. Renew. Sustain. Energy Rev. 2022, 157, 112078. [Google Scholar] [CrossRef]
- Lu, W.; Jiang, Y.; Chen, Z.; Ji, X. Blockchain Adoption in a Supply Chain System to Combat Counterfeiting. Comput. Ind. Eng. 2022, 171, 108408. [Google Scholar] [CrossRef]
- Ouyang, T.; Wang, C.; Xu, P.; Ye, J.; Liu, B. Prognostics and Health Management of Lithium-Ion Batteries Based on Modeling Techniques and Bayesian Approaches: A Review. Sustain. Energy Technol. Assess. 2023, 55, 102915. [Google Scholar] [CrossRef]
- Li, J.; Wang, Y.; Tan, X. Research on the Classification Method for the Secondary Uses of Retired Lithium-Ion Traction Batteries. Energy Procedia 2017, 105, 2843–2849. [Google Scholar] [CrossRef]
- Yadav, S.; Singh, S.P. Blockchain Critical Success Factors for Sustainable Supply Chain. Resour. Conserv. Recycl. 2020, 152, 104505. [Google Scholar] [CrossRef]
- Guo, H.; Yu, X. A Survey on Blockchain Technology and Its Security. Blockchain Res. Appl. 2022, 3, 100067. [Google Scholar] [CrossRef]
- Hua, S.; Zhou, E.; Pi, B.; Jun, S.; Yoshihide, N.; Hidetoshi, K. Apply Blockchain Technology to Electric Vehicle Battery Refueling. 2018. Available online: https://aisel.aisnet.org/hicss-51/os/blockchain_and_fintech/4/ (accessed on 6 May 2024).
- Semeraro, C.; Caggiano, M.; Olabi, A.-G.; Dassisti, M. Battery Monitoring and Prognostics Optimization Techniques: Challenges and Opportunities. Energy 2022, 255, 124538. [Google Scholar] [CrossRef]
- Babich, V.; Hilary, G. OM Forum—Distributed Ledgers and Operations: What Operations Management Researchers Should Know About Blockchain Technology. Manuf. Serv. Oper. Manag. 2020, 22, 223–240. [Google Scholar] [CrossRef]
- Gebhardt, M.; Beck, J.; Kopyto, M.; Spieske, A. Determining Requirements and Challenges for a Sustainable and Circular Electric Vehicle Battery Supply Chain: A Mixed-Methods Approach. Sustain. Prod. Consum. 2022, 33, 203–217. [Google Scholar] [CrossRef]
- Tang, R.; Zhang, S.; Zhang, S.; Zhang, Y.; Lai, J. Parameter Identification for Lithium Batteries: Model Variable-Coupling Analysis and a Novel Cooperatively Coevolving Identification Algorithm. Energy 2019, 263, 125762. [Google Scholar] [CrossRef]
- De Giovanni, P. Blockchain and Smart Contracts in Supply Chain Management: A Game Theoretic Model. Int. J. Prod. Econ. 2020, 228, 107855. [Google Scholar] [CrossRef]
- Biswas, B.; Gupta, R. Analysis of Barriers to Implement Blockchain in Industry and Service Sectors. Comput. Ind. Eng. 2019, 136, 225–241. [Google Scholar] [CrossRef]
- Knirsch, F.; Unterweger, A.; Engel, D. Implementing a Blockchain from Scratch: Why, How, and What We Learned. EURASIP J. Inf. Secur. 2019, 2019, 2. [Google Scholar] [CrossRef]
- Bürer, M.J.; de Lapparent, M.; Pallotta, V.; Capezzali, M.; Carpita, M. Use Cases for Blockchain in the Energy Industry Opportunities of Emerging Business Models and Related Risks. Comput. Ind. Eng. 2019, 137, 106002. [Google Scholar] [CrossRef]
- Kim, T.; Ochoa, J.; Faika, T.; Mantooth, H.A.; Di, J.; Li, Q.; Lee, Y. An Overview of Cyber-Physical Security of Battery Management Systems and Adoption of Blockchain Technology. IEEE J. Emerg. Sel. Top. Power Electron. 2022, 10, 1270–1281. [Google Scholar] [CrossRef]
- Lim, M.K.; Li, Y.; Wang, C.; Tseng, M.-L. A Literature Review of Blockchain Technology Applications in Supply Chains: A Comprehensive Analysis of Themes, Methodologies and Industries. Comput. Ind. Eng. 2021, 154, 107133. [Google Scholar] [CrossRef]
- Raj Kumar Reddy, K.; Gunasekaran, A.; Kalpana, P.; Raja Sreedharan, V.; Arvind Kumar, S. Developing a Blockchain Framework for the Automotive Supply Chain: A Systematic Review. Comput. Ind. Eng. 2021, 157, 107334. [Google Scholar] [CrossRef]
- Sunny, J.; Undralla, N.; Madhusudanan Pillai, V. Supply Chain Transparency through Blockchain-Based Traceability: An Overview with Demonstration. Comput. Ind. Eng. 2020, 150, 106895. [Google Scholar] [CrossRef]
- Esmaeilian, B.; Sarkis, J.; Lewis, K.; Behdad, S. Blockchain for the Future of Sustainable Supply Chain Management in Industry 4.0. Resour. Conserv. Recycl. 2020, 163, 105064. [Google Scholar] [CrossRef]
- Zhou, X.; Pullman, M.; Xu, Z. The Impact of Food Supply Chain Traceability on Sustainability Performance. Oper. Manag. Res. 2022, 15, 93–115. [Google Scholar] [CrossRef]
- Li, G.; Xue, J.; Li, N.; Ivanov, D. Blockchain-Supported Business Model Design, Supply Chain Resilience, and Firm Performance. Transp. Res. Part E Logist. Transp. Rev. 2022, 163, 102773. [Google Scholar] [CrossRef]
- Kouhizadeh, M.; Saberi, S.; Sarkis, J. Blockchain Technology and the Sustainable Supply Chain: Theoretically Exploring Adoption Barriers. Int. J. Prod. Econ. 2021, 231, 107831. [Google Scholar] [CrossRef]
- Zhang, Z.; Ren, D.; Lan, Y.; Yang, S. Price Competition and Blockchain Adoption in Retailing Markets. Eur. J. Oper. Res. 2022, 300, 647–660. [Google Scholar] [CrossRef]
- Choi, T.-M. Blockchain-Technology-Supported Platforms for Diamond Authentication and Certification in Luxury Supply Chains. Transp. Res. Part E Logist. Transp. Rev. 2019, 128, 17–29. [Google Scholar] [CrossRef]
- Chod, J.; Trichakis, N.; Tsoukalas, G.; Aspegren, H.; Weber, M. On the Financing Benefits of Supply Chain Transparency and Blockchain Adoption. Manag. Sci. 2020, 66, 4378–4396. [Google Scholar] [CrossRef]
- Liu, X.; Barenji, A.V.; Li, Z.; Montreuil, B.; Huang, G.Q. Blockchain-Based Smart Tracking and Tracing Platform for Drug Supply Chain. Comput. Ind. Eng. 2021, 161, 107669. [Google Scholar] [CrossRef]
- Mackey, T.K.; Nayyar, G. A Review of Existing and Emerging Digital Technologies to Combat the Global Trade in Fake Medicines. Expert Opin. Drug Saf. 2017, 16, 587–602. [Google Scholar] [CrossRef]
- Omar, I.A.; Debe, M.; Jayaraman, R.; Salah, K.; Omar, M.; Arshad, J. Blockchain-Based Supply Chain Traceability for COVID-19 Personal Protective Equipment. Comput. Ind. Eng. 2022, 167, 107995. [Google Scholar] [CrossRef]
- Heydari, J.; Govindan, K.; Jafari, A. Reverse and Closed Loop Supply Chain Coordination by Considering Government Role. Transp. Res. Part D Transp. Environ. 2017, 52, 379–398. [Google Scholar] [CrossRef]
- Helo, P.; Hao, Y. Blockchains in Operations and Supply Chains: A Model and Reference Implementation. Comput. Ind. Eng. 2019, 136, 242–251. [Google Scholar] [CrossRef]
- Kshetri, N. Blockchain’s Roles in Meeting Key Supply Chain Management Objectives. Int. J. Inf. Manag. 2018, 39, 80–89. [Google Scholar] [CrossRef]
- Niu, B.; Dong, J.; Dai, Z.; Jin, J.Y. Market Expansion vs. Intensified Competition: Overseas Supplier’s Adoption of Blockchain in a Cross-Border Agricultural Supply Chain. Electron. Commer. Res. Appl. 2022, 51, 101113. [Google Scholar] [CrossRef]
- Modak, N.M.; Modak, N.; Panda, S.; Sana, S.S. Analyzing Structure of Two-Echelon Closed-Loop Supply Chain for Pricing, Quality and Recycling Management. J. Clean. Prod. 2018, 171, 512–528. [Google Scholar] [CrossRef]
- Latini, D.; Vaccari, M.; Lagnoni, M.; Orefice, M.; Mathieux, F.; Huisman, J.; Tognotti, L.; Bertei, A. A Comprehensive Review and Classification of Unit Operations with Assessment of Outputs Quality in Lithium-Ion Battery Recycling. J. Power Sources 2022, 546, 231979. [Google Scholar] [CrossRef]
- Genc, T.S.; Giovanni, P.D. Trade-in and Save: A Two-Period Closed-Loop Supply Chain Game with Price and Technology Dependent Returns. Int. J. Prod. Econ. 2017, 183, 514–527. [Google Scholar] [CrossRef]
- Atasu, A.; Sarvary, M.; Van Wassenhove, L.N. Remanufacturing as a Marketing Strategy. Manag. Sci. 2008, 54, 1731–1746. [Google Scholar] [CrossRef]


Disclaimer/Publisher’s Note: The statements, opinions and data contained in all publications are solely those of the individual author(s) and contributor(s) and not of MDPI and/or the editor(s). MDPI and/or the editor(s) disclaim responsibility for any injury to people or property resulting from any ideas, methods, instructions or products referred to in the content. |
© 2024 by the authors. Licensee MDPI, Basel, Switzerland. This article is an open access article distributed under the terms and conditions of the Creative Commons Attribution (CC BY) license (https://creativecommons.org/licenses/by/4.0/).
Share and Cite
Shen, D.; Liu, Q.; Cudjoe, D. Competing Manufacturers Adopt Blockchain for Tracing Power Batteries: Is There a Win-Win Zone? Energies 2024, 17, 2868. https://doi.org/10.3390/en17122868
Shen D, Liu Q, Cudjoe D. Competing Manufacturers Adopt Blockchain for Tracing Power Batteries: Is There a Win-Win Zone? Energies. 2024; 17(12):2868. https://doi.org/10.3390/en17122868
Chicago/Turabian StyleShen, Danyun, Qiyao Liu, and Dan Cudjoe. 2024. "Competing Manufacturers Adopt Blockchain for Tracing Power Batteries: Is There a Win-Win Zone?" Energies 17, no. 12: 2868. https://doi.org/10.3390/en17122868