Abstract
As civilization and technology have developed, there have been multiple energy transitions that have pushed various resources like coal, wood, oil, and gas to the forefront of the energy mix. Due to a variety of geopolitical initiatives, there have been progressively more restrictions on the energy sector in recent years. One of the main concerns of researchers is the widespread use of renewable energy and the replacement of fossil resources. The utilization of non-renewable energy sources results in a detrimental increase in greenhouse gas emissions. One of the most crucial strategies for lowering energy consumption and enhancing the energy system’s sustainability is to increase energy efficiency. Numerous studies note that energy transition has become necessary in the modern day. Using the analysis of the main components as an extraction method, hierarchical cluster analysis, this study focuses on the situation of the states of the European Union in their race for energy transition, taking into account the main challenges generated by geopolitical tensions and the energy poverty spectrum for the population. The conclusions of the study call for a reconfiguration of the energy mix based on renewable energy. Increasing the share of renewable energy is a goal pursued by EU countries, but energy policies must be considered in a broader context that includes the social aspects of the energy transition. So, just transition is a new concept that reshapes the actions of public authorities on the path to a low-carbon economy. Just transition is a necessity that puts the consumer at the center of attention so that the negative externalities generated by the move away from fossil fuels are minimized in terms of social impact.
1. Introduction
Concerns regarding sustainable development have become increasingly intense, and companies are involved in the transition to a low-carbon economy [1,2,3]. There is a close relationship between energy, the economy, and the environment. Along with the development of humanity, energy sources have diversified, and energy consumption has increased substantially, the negative externalities on the environment being dramatic [4,5,6,7]. As society and technology have progressed, humanity has gone through several energy transitions that have brought to the center of the energy mix different resources, such as wood, coal, oil, and gas. Currently, the paradigm shifts in the energy sector envisage the predominant use of renewable energy resources, which have a low environmental impact [8,9,10,11,12,13,14,15]. Redefining the energy mix is a complex problem considering the economic, social, technological, and geopolitical challenges that affect the energy sector [16,17,18,19]. The interests of the companies in the traditional energy sector are very large and are supported at a high level; coal/oil and gas lobby are a new trend in countries such as India and Poland, where these resources play an important role in energy generation [20,21,22,23].
In recent years, there have been increasingly strong constraints in the energy area generated by various geopolitical actions with important economic and social effects. Consequently, imbalances in the economic sector have influenced environmental decisions [24,25,26]. For this reason, energies considered dirty, such as coal or nuclear energy, have been reconsidered due to their role in energy security goals [27,28]. Although the new energy transition was generated by the stakeholders’ desire to reduce the effect of energy production and consumption on the environment, concerns related to energy security and ensuring access to energy for all have become a priority.
This new energy transition is aligned with all sustainable development goals (SDGs) and puts consumers at the center of attention, which is increasingly facing the specter of energy poverty [29,30,31,32,33,34,35]. New technologies, the use of renewable energies, and the existence of prosumers have led to the decentralization and flexibility of national energy systems. In addition, the existence of the European Energy Union ensures the interconnection of the energy systems of the member countries, the watchword being flexibility. The European authorities promote flexible markets in the field of energy, which is a tool through which the zero-carbon objective for 2050 can be achieved. Flexibility allows consumers to adjust their energy usage during peak times when prices are higher, thus reducing their energy bills. By shifting usage to off-peak times, households can take advantage of lower rates. Flexibility helps balance the intermittent nature of renewable energy sources such as wind and solar by adjusting demand to match supply. This is critical for maintaining grid stability. By enabling a more responsive grid, flexibility ensures that renewable energy can be integrated without compromising reliability. This reduces the reliance on fossil fuels. Flexibility is a crucial element in both combating energy poverty and advancing the energy transition. It enables more efficient and equitable use of energy resources, integrates renewable energy effectively, and enhances the resilience and reliability of the energy system [36,37]. The widespread use of renewable energy and, consequently, the replacement of fossil resources is of key interest to researchers but also to public authorities or management teams of international economic bodies, such as the European Union [38,39,40,41]. The European Union is the undisputed leader of the energy transition worldwide, the concerns of the public authorities being complex to achieve a balance between the concerns of protecting the environment, ensuring access to energy for all residents, energy solidarity between member countries and operational internal energy [20,42,43,44,45].
Energy consumption is a major constituent in terms of the economic progress of each nation because the configuration and achievement of production at national and global levels are governed by the quantity and quality of these energy resources. Conventional non-renewable energy resources, namely oil, natural gas, and coal, are exhaustible. In these circumstances, it is particularly important to have a very well-developed strategy regarding this energy transition.
It is energy that drives all economic and financial mechanisms globally. When problems arise in the energy production area, they are immediately felt and quantified in all other areas. A rise in fuel prices generates a build-up in the costs of equipment that uses directly (transport equipment, production) or indirectly (equipment running on electricity) this type of fuel. These costs are then passed on downstream to the final consumer [46,47]. This was observed during the distortions generated by the COVID-19 pandemic when, globally and locally, enormous funds were used to counteract its effects on the economy and population. As a result of these actions, considerable sums of money were thrown into the market in the form of incentives, aid, etc., in order to assure proper access to energy for consumers [48].
Non-renewable energy source usage leads to increased greenhouse gas emissions, which have a particularly harmful effect. At the moment, energy production and consumption that generate greenhouse gas emissions are particularly high [49,50]. In recent years, the energy transition has become a global priority, as it is necessary to reduce emissions of greenhouse gases and other pollutants to prevent climate change and protect people’s health and quality of life. Increasing energy efficiency is one of the most important approaches to lowering energy consumption and improving the sustainability of the energy system [51,52,53]. In the context of an energy transition, increasing energy efficiency can be achieved through specific methods. Improving the energy efficiency of buildings is an important tool used in many countries, taking into account the fact that buildings consume a significant amount of energy for heating, cooling, and lighting. Improving the energy efficiency of buildings can be achieved through thermal insulation, installation of double-glazed windows, use of LED lighting systems, and improvement of ventilation and heating systems. In addition, advanced technologies such as heat pumps and solar panels can be used to reduce energy consumption and increase energy efficiency. Transport represents another significant source of energy consumption, so increasing the energy efficiency of vehicles through the use of cleaner and more efficient technologies, like electric vehicles, can considerably reduce energy consumption. Increased use of renewable energy, mainly solar and wind power, has the potential to significantly cut down energy consumption and greenhouse gas emissions.
The European Commission Is debating a number of measures and programs to reduce greenhouse gas emissions, such as the regulation on reducing methane emissions in the energy sector [54]. It is also concerned with increasing the production of renewable energy by issuing several directives to reach a certain share of renewable energy in total energy. Thus, the 2018 directive aimed at a 32% share of renewable energy sources in gross final energy consumption by 2030 [55]). This target was increased to a minimum of 42.5% by a revised directive [56]. Subsequently, the European Commission proposed a revision of the renewables target to 40% renewable energy in gross final energy consumption and then a further increase to 45% under the REPowerEU plan. Information from the EU’s latest publications states that it accounts for 6% of the global GHG emissions, being the fourth largest emitter. Between 1990 and 2022, the EU decreased its emissions by 31% and has a target of 55% for the year 2030 compared to 1990 [57].
The objective of this paper is to analyze the EU’s development toward reaching net-zero emissions and the main components that impact this goal. Additionally, the objective involves discerning variations between different member states by classifying them into different clusters. Followed up by making predictions on when net zero emissions will be achieved based on their actual evolution.
The article begins with an Introductory section In Ih the authors present the main results recorded worldwide regarding the energy transition. In the Section 2, the results of the most representative studies identified in the international scientific literature are presented, which demonstrate the existence of a research gap that justifies the completion of this study. In the Section 3 and Section 4, the scientific method, the data used, and the results obtained are presented. The Section 5 of the study presents in detail the authors acknowledging research limitations, which is why they propose future research avenues that will be the subject of further studies.
2. Literature Review
The mitigation of climate change is the main objective for humanity’s future: to survive the harm done to the planet and reverse it. One of the most efficient tools in achieving this goal is the energy transition to renewable energy. From one point of view, it helps lower greenhouse gas (GHG) emissions, and from another point, it provides an efficient instrument to fight climate change [58]. Starting with the 2000s, many countries, especially those with high climate risk, took important steps toward transitioning their energy production from fossil fuels to renewable energy [59,60].
The research on energy transition Is mainly located In Europe and North America, given their highly active approach to the subject. The increased focus of both scientists and public institutions on the energy transition in these countries is generated by their high level of economic development and the existence of abundant financial resources. The screening of the international scientific literature demonstrates the existence of numerous papers focused on single-country case studies or comparative approaches by using quantitative and qualitative tools [61,62,63,64,65]. Lately, an increasing interest in Global South countries spurred a new wave of research from these regions [66,67,68,69].
Energy transition has come with the important metamorphosis of the energy mix. The renewable energy market has constantly increased its market share. This is a must if a cleaner future is to be achieved [70]). This gives rise to complex problems that must be overcome, like the decoupling from traditional and inefficient methods while fulfilling the energy needs of a growing population and increasing corporate demand [71,72,73,74,75]. Throughout the implementation of GHG reduction activities and energy transition, many researchers have conducted complex analyses to see how the timeline is respected and identify possible ways and policies to better ensure an organized and smooth transition.
Ref. [76] conducted a review of past transitions and identified three modern cases of energy transition: Brazil, France, and the United States. Their findings highlight that energy transition fixed on energy efficiency can take place more rapidly [76]. Ref. [77] conducted a comprehensive review of energy storage technologies that may have an important impact on energy transition as many renewable energy technologies suffer from the challenge of delivering energy on demand as their source is not continuous [77].
Ref. [78], identified four premises on sustainable energy transition pathways: (1) sustainable energy economics and management; (2) renewable energy generation and consumption; (3) environmental impacts of energy systems; and (4) electric vehicle and energy storage. They suggested that innovative, robust, and bold strategies in governance, management, and education are vital to encourage sustainable energy transition amongst various scales and sectors [78]. Tian et al., 2022, conducted an in-depth review of the energy transition pre-COVID-19 pandemic and identified the challenges for energy transition during the pandemic. The study proposed a post-pandemic energy transition roadmap by expanding green financing tools, bolstering international cooperation, and improving green financing instruments [79].
Qadir et al., 2021, analyzed the necessity for extra capital spending on energy resources that can assemble global demand with no environmental damage. Investments in clean forms of energy, like solar, wind, and hydropower, have fluctuated even though they are both successful and readily available. The study presents the main obstacles impeding investment in clean energy production, underlines vital incentives that could hurry up the investment processes, and surveys a number of essential tactics for the switch from fossil-fuel-based energy to renewables [71].
Ref. [80] highlighted the technical capability and economic practicability of 100% renewable energy systems covering the power, heat, transport, and desalination sectors. Ref. [81] identified four dimensions that permit the detection of certain economic principles or key plans to steer the energy transition. The energy transition (1) is driven by policies instead of technology forces and (2) disrupts liberalized electricity markets that influence the economic foundation of this process, (3) is going to be incomplete, taking into account the technological challenges, at least in the next few decades, (4) generates a change in consumer behavior that determined new business models.
Limpens et al., 2019, presented EnergyScope TD, an innovative open-source model for the strategic energy planning of urban and regional energy systems. One of the most advanced energy modelling systems which optimises both the investment and operating strategy of an entire energy system [82].
Building on these advancements in the literature, this study focuses on the EU’s development toward reaching net-zero emissions and analyses the main components that impact this goal.
3. Data and Methods
Achieving the energy transition is a crucial objective that we consider in this research and in this context. We will analyze the dynamic developments of some indicators, such as the production and recycling of materials and materials necessary for the renewable sector, the production and consumption of renewable energy/non-renewable energy, energy imports, and the intensity of greenhouse gas emissions at the European Union level. Data on the evolving dynamics of the studied indicators are presented in Table 1.

Table 1.
Evolution of indicators in dynamics between 2000 and 2021 at the EU27 level.
Through the methodology used (the method of indices, the method of dynamic series, the comparative study, bringing the indicators used by deflation to real/comparable values, the method of grouping by components, and others), the authors highlight the fact that the energy transition must remain a priority of the European Union even the social and geopolitical issues they gained ground.
4. Results and Discussions
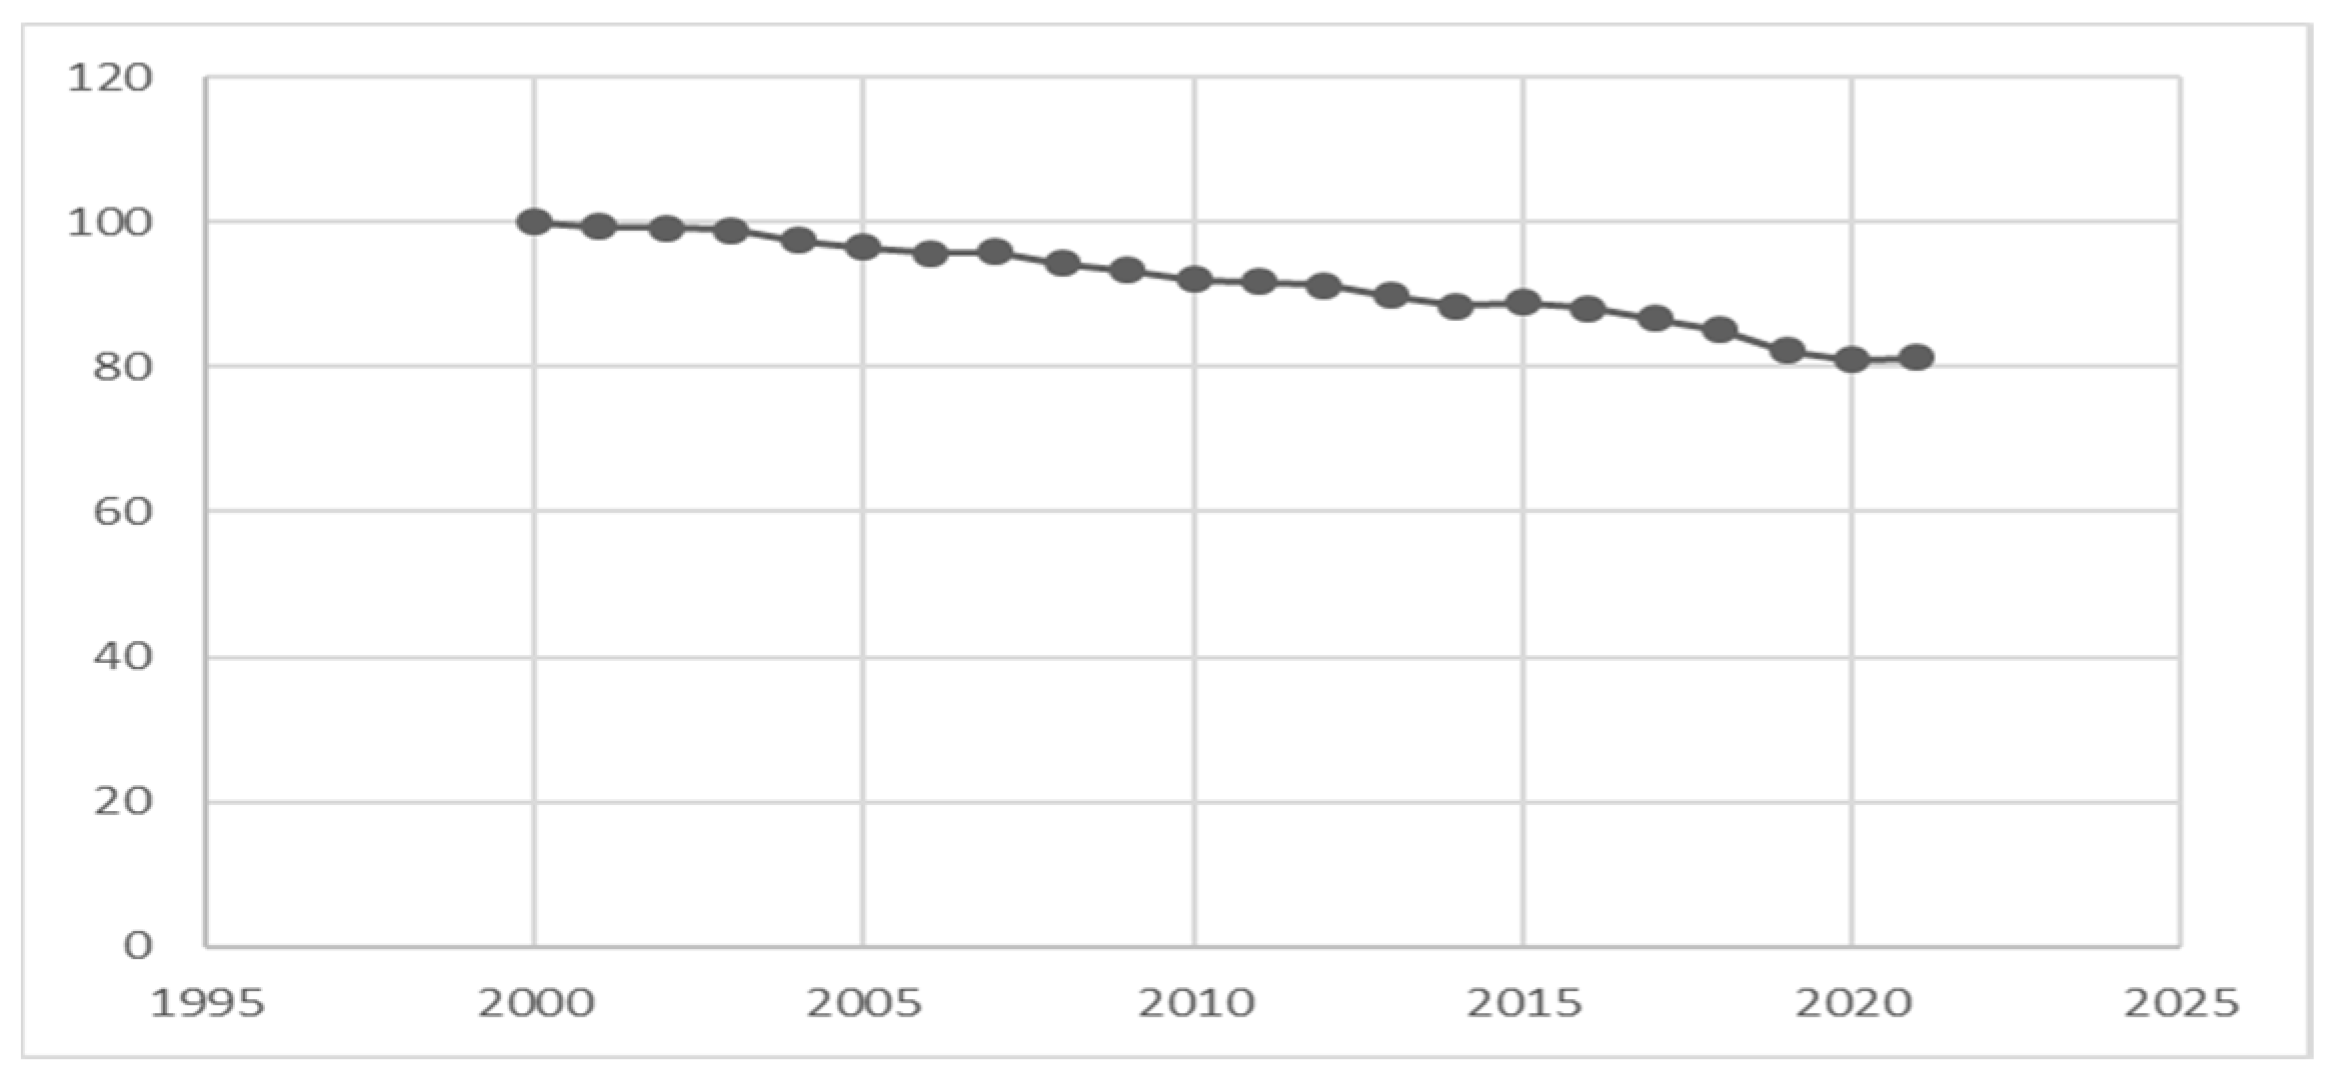
One of the primary objectives of this research is to quantify the situation in the European Union and in each member country in terms of greenhouse gas emissions intensity due to energy consumption and to identify some solutions that could lead to a decrease in greenhouse gas intensity. At the EU level, the evolution of greenhouse gas emissions is downward, an aspect presented in Figure 1.
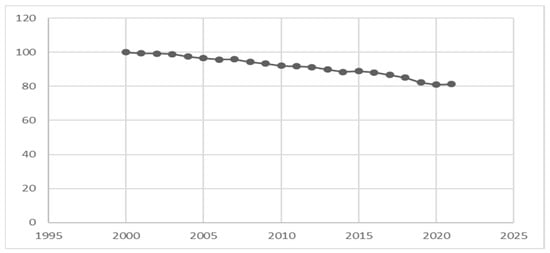
Figure 1.
Evolution of greenhouse gas emissions in the European Union between 2000 and 2021 (Year 2000 = 100). Source: Eurostat. Data processed by authors.
It can be noted that in 22 years, there has been a decrease of almost 20% in greenhouse gas emissions at the European Union level. Also, the average year-on-year pace of decline is 0.98%. Renewable energy is gaining prominence in consumers’ lives, and the technological revolution offers solutions for exploiting the natural capacity of each region. Wind, solar energy, and biofuels have progressively joined the energy mix of each country, being crucial in this setup both the territorial distribution of these resources, the involvement of economic agents in the process of innovation, research, and development, as well as the attitude of consumers and local communities towards new types of energy. Of course, the amount of renewable energy consumed tends to increase from one period of time to another, which should draw attention, as mentioned above, to the replacement of non-renewable energy with renewable energy. The shift towards renewable energy is a global phenomenon, with most countries endeavoring to increase renewable energy production for the benefit of consumers and the development of national economies. Figure 2 shows the evolution of renewable energy production between 2000 and 2021 at the European Union level.
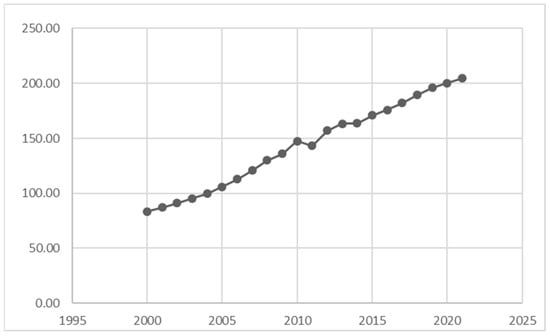
Figure 2.
The evolution of renewable energy production between 2000 and 2021 at the EU level. Source: Eurostat. Data processed by authors.
It can easily be seen that renewable energy production in the European Union has increased significantly. Thus, in absolute data, renewable energy production increased from 83.43 million tons of oil equivalent in 2000 to 204.61 million tons of oil equivalent in 2021, thus registering an average annual rate of 4.4%.
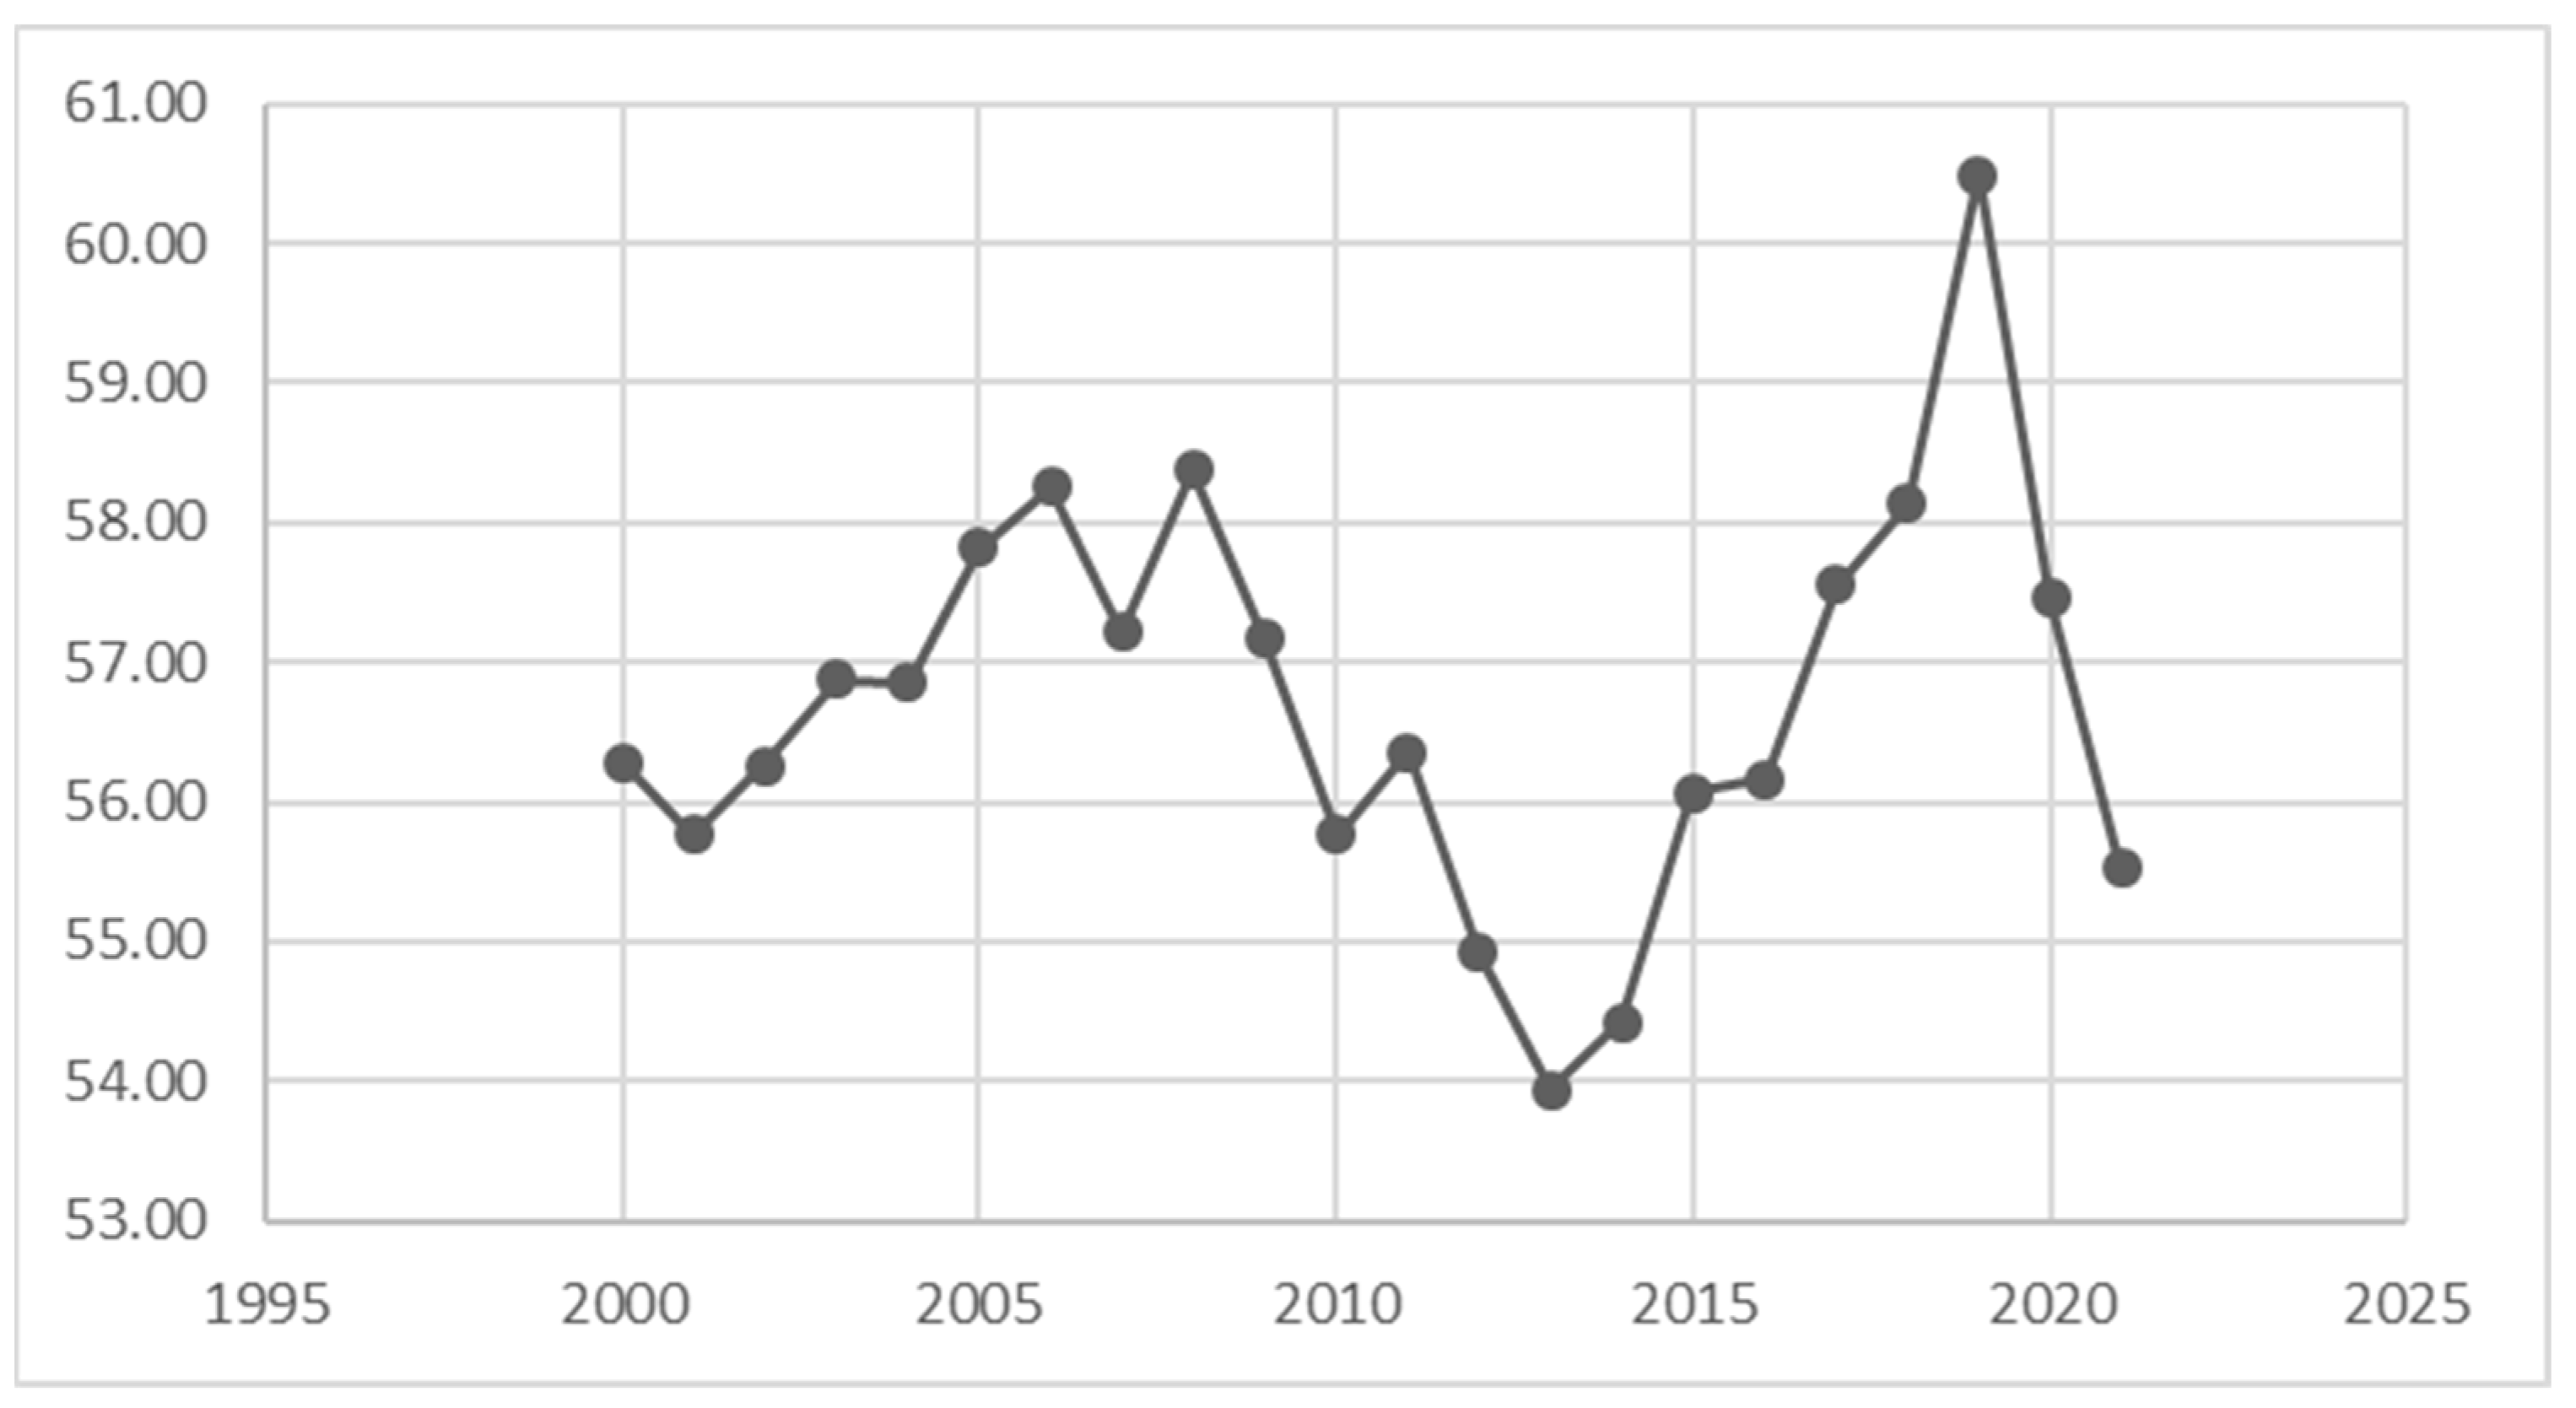
Consequently, the research aims to trace the positions and evolutionary trends of some variables in view of taking urgent measures to accelerate the achievement of the energy transition, taking into account in this regard also the energy crisis due to a large extent to the geopolitical tensions and the restrictions imposed by the European Union on Russia, which are practically turning like a boomerang against the Member States. It is important to note that the European Union currently imports around 55% of the energy consumed, and practically, the European Union’s real strategic autonomy in terms of energy sources is far from being achieved. Figure 3 shows the evolution of energy imports in the European Union.
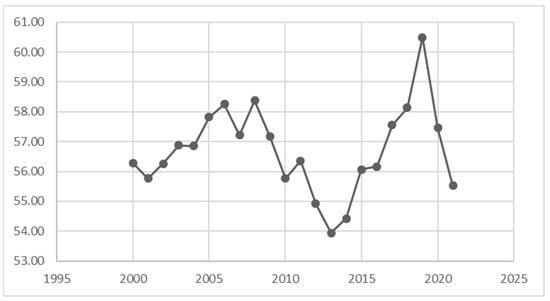
Figure 3.
Evolution of energy imports in the European Union between 2000 and 2021. Source: Eurostat. Data processed by authors.
The evolution of energy imports in the European Union during the analyzed period exhibits oscillations, with minimum values of 53.94% in 2013 and maximums of 60.48% in 2019, but we can say that more than half of the energy consumed by the Member States of the European Union comes from imports. Achieving the energy transition requires the use of resources such as rare earth metals such as lithium, cobalt, and nickel for energy storage batteries, as well as solar panels and wind turbines. However, these resources are available in limited quantities and concentrated in certain countries, which can lead to supply security issues. Moreover, the extraction and processing of these resources can have negative environmental impacts, such as soil and water pollution and deforestation. Increased demand for these raw materials may also lead to higher prices, which could affect access to these technologies for poorer countries. However, there are solutions to this problem. One of them would be the development of alternative technologies for replacing scarce raw materials. For example, researchers are working on developing batteries that use more common materials, such as sodium or magnesium, instead of lithium and cobalt. In addition, there is also the possibility to recycle rare materials from batteries and other electronic devices, which could reduce dependence on extracting new resources. Greater use of nuclear energy and hydrogen could also reduce dependence on fossil fuels and scarce raw materials used in current technologies.
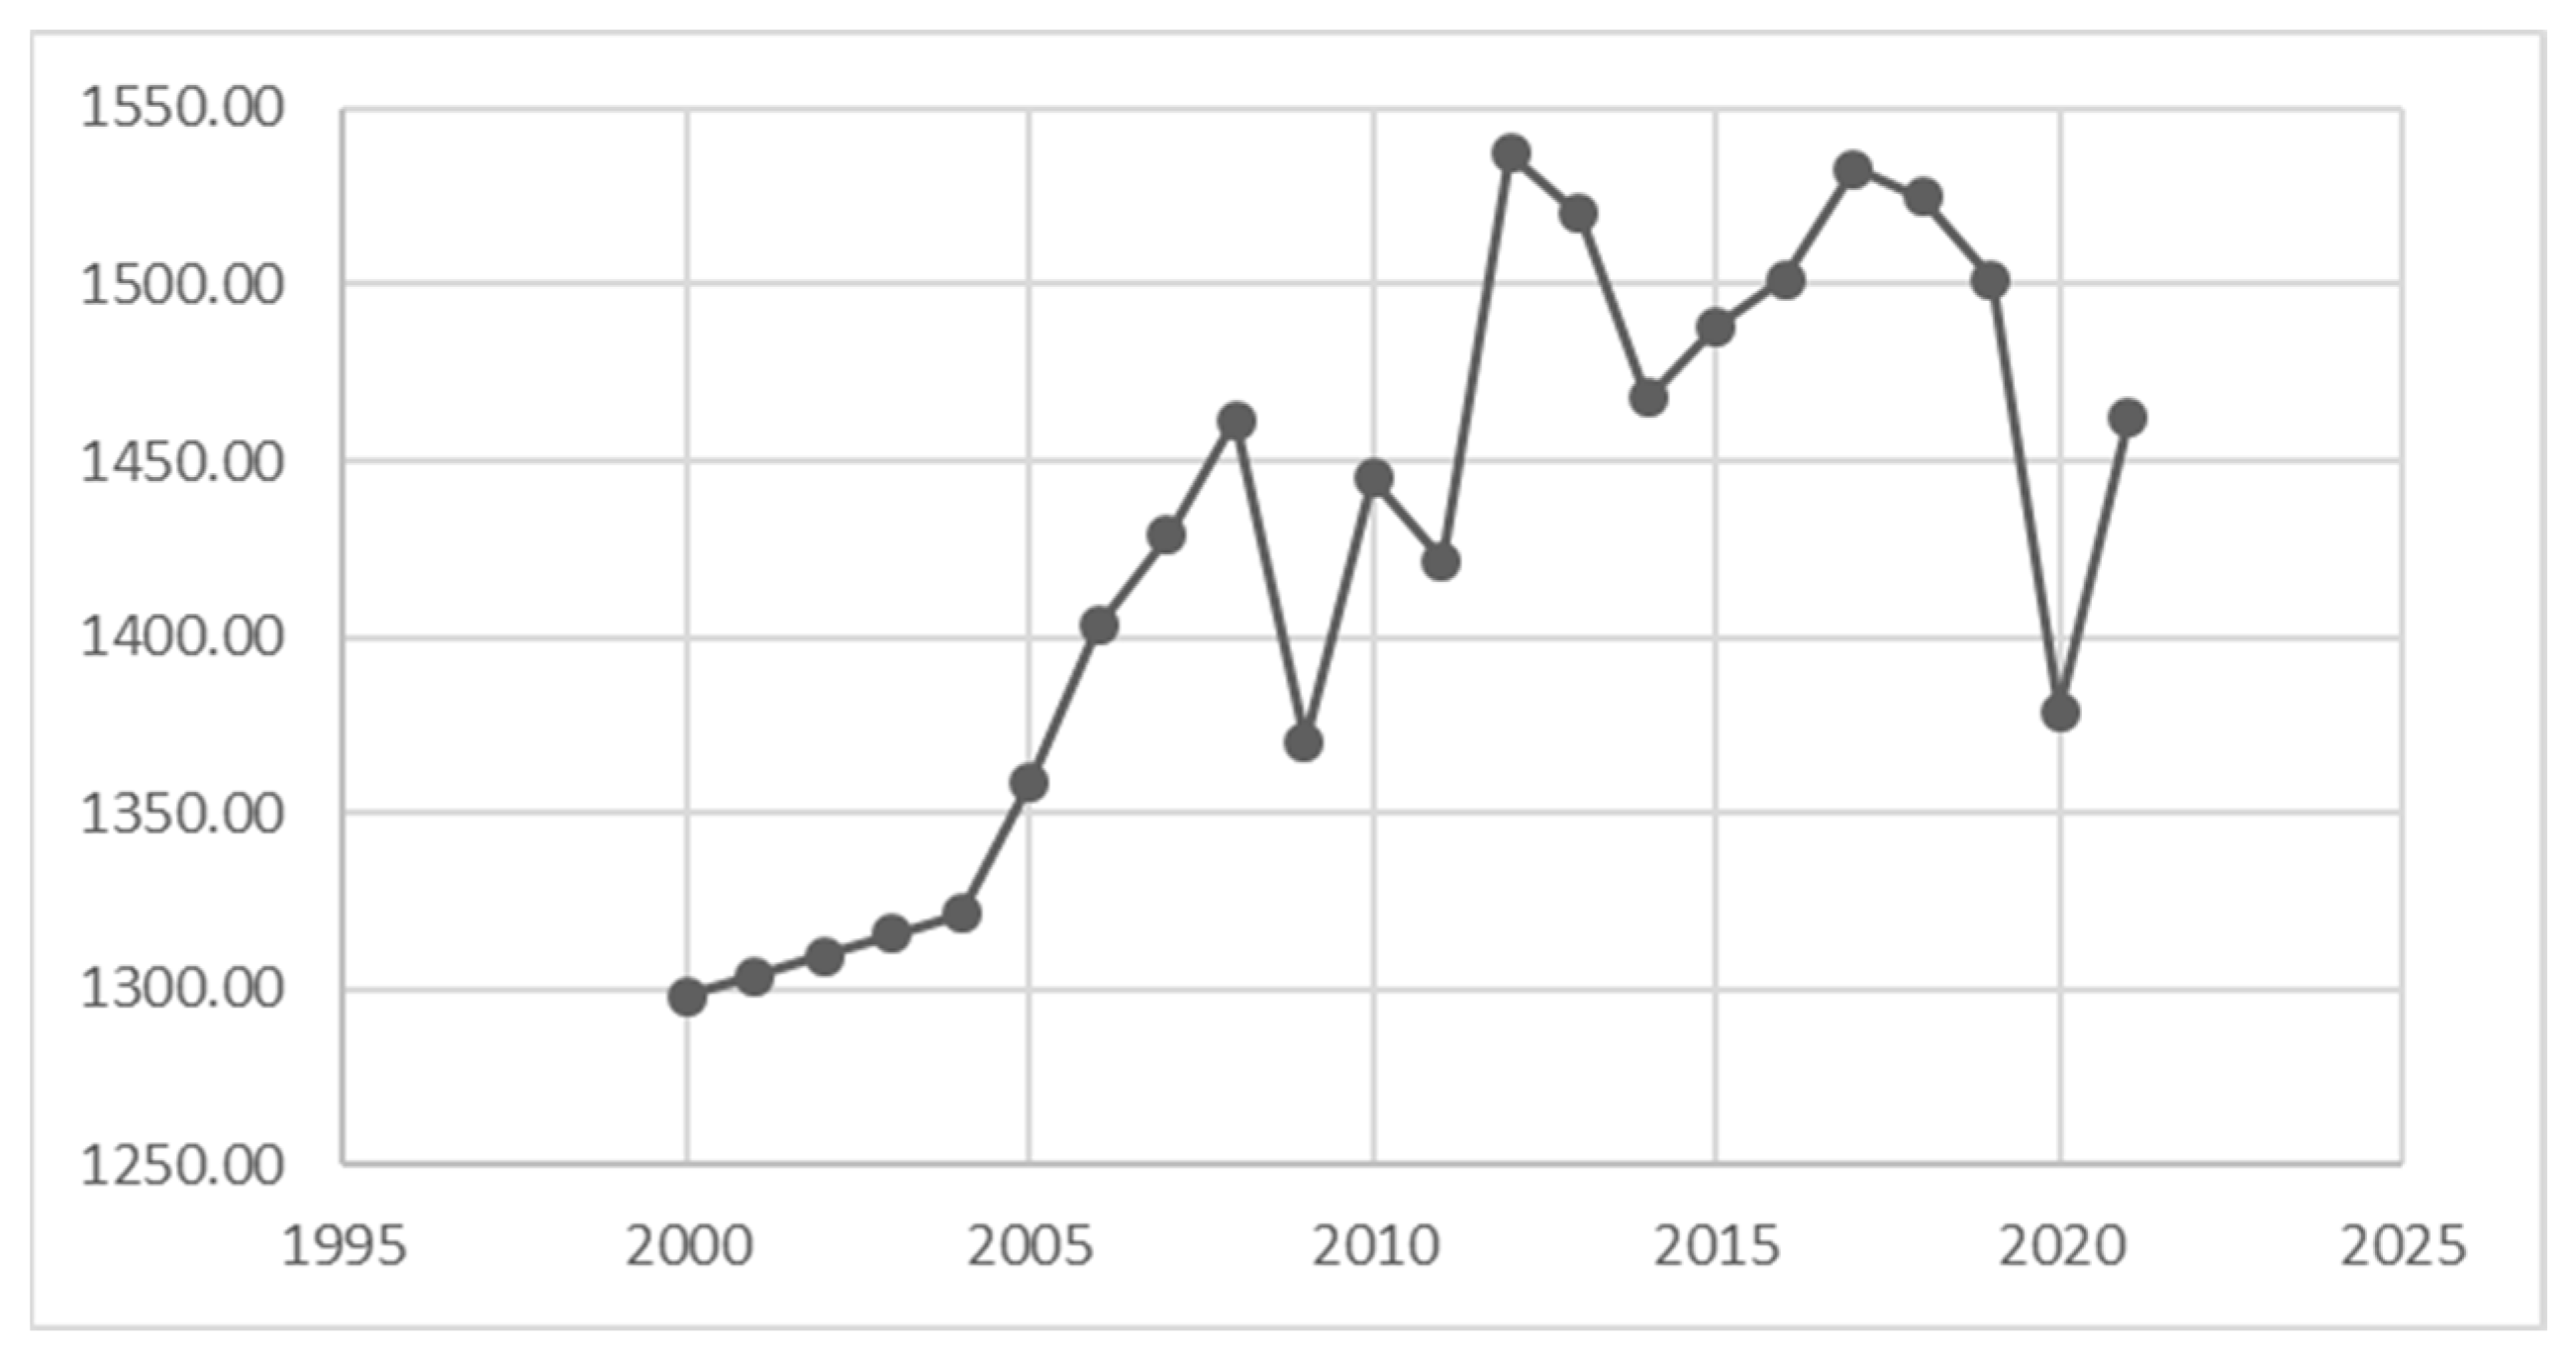
It can be noted that although the gross energy available in the European Union increased with some oscillations from 1297.94 million tons of oil equivalent in 2000 to the maximum of 1537.23 million tons of oil equivalent in 2012 and in 2014, the trend changed, and we could even say with syncope in 2020, following a recovery in 2021 reaching the value of 1462.43 million tons of oil equivalent (Figure 4). Another indicator that we considered decisive for the energy transition is energy consumption at the European Union level.
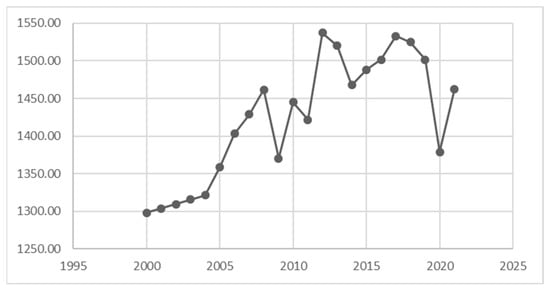
Figure 4.
Gross energy available in the European Union between 2000 and 2021. Source: Eurostat. Data processed by authors.
It can be seen from Figure 5 that, although there were some fluctuations, they did not have high intensities, and energy consumption in the European Union remains at a level comparable to 2000 in 2021. Table 2 present what is the situation in 2021 for the 27 Member States of the European Union regarding the evolution of these indicators, which were studied one by one in dynamics. In this regard, we presented the data taken from Eurostat and processed by the authors in the following table.
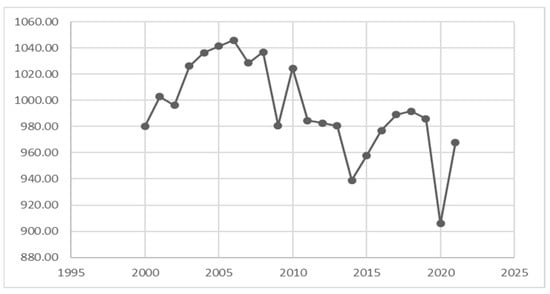
Figure 5.
Energy consumption in the European Union between 2000 and 2021. Source: Eurostat. Data processed by authors.
Table 2.
Indicator values by country (EU27) in 2021.
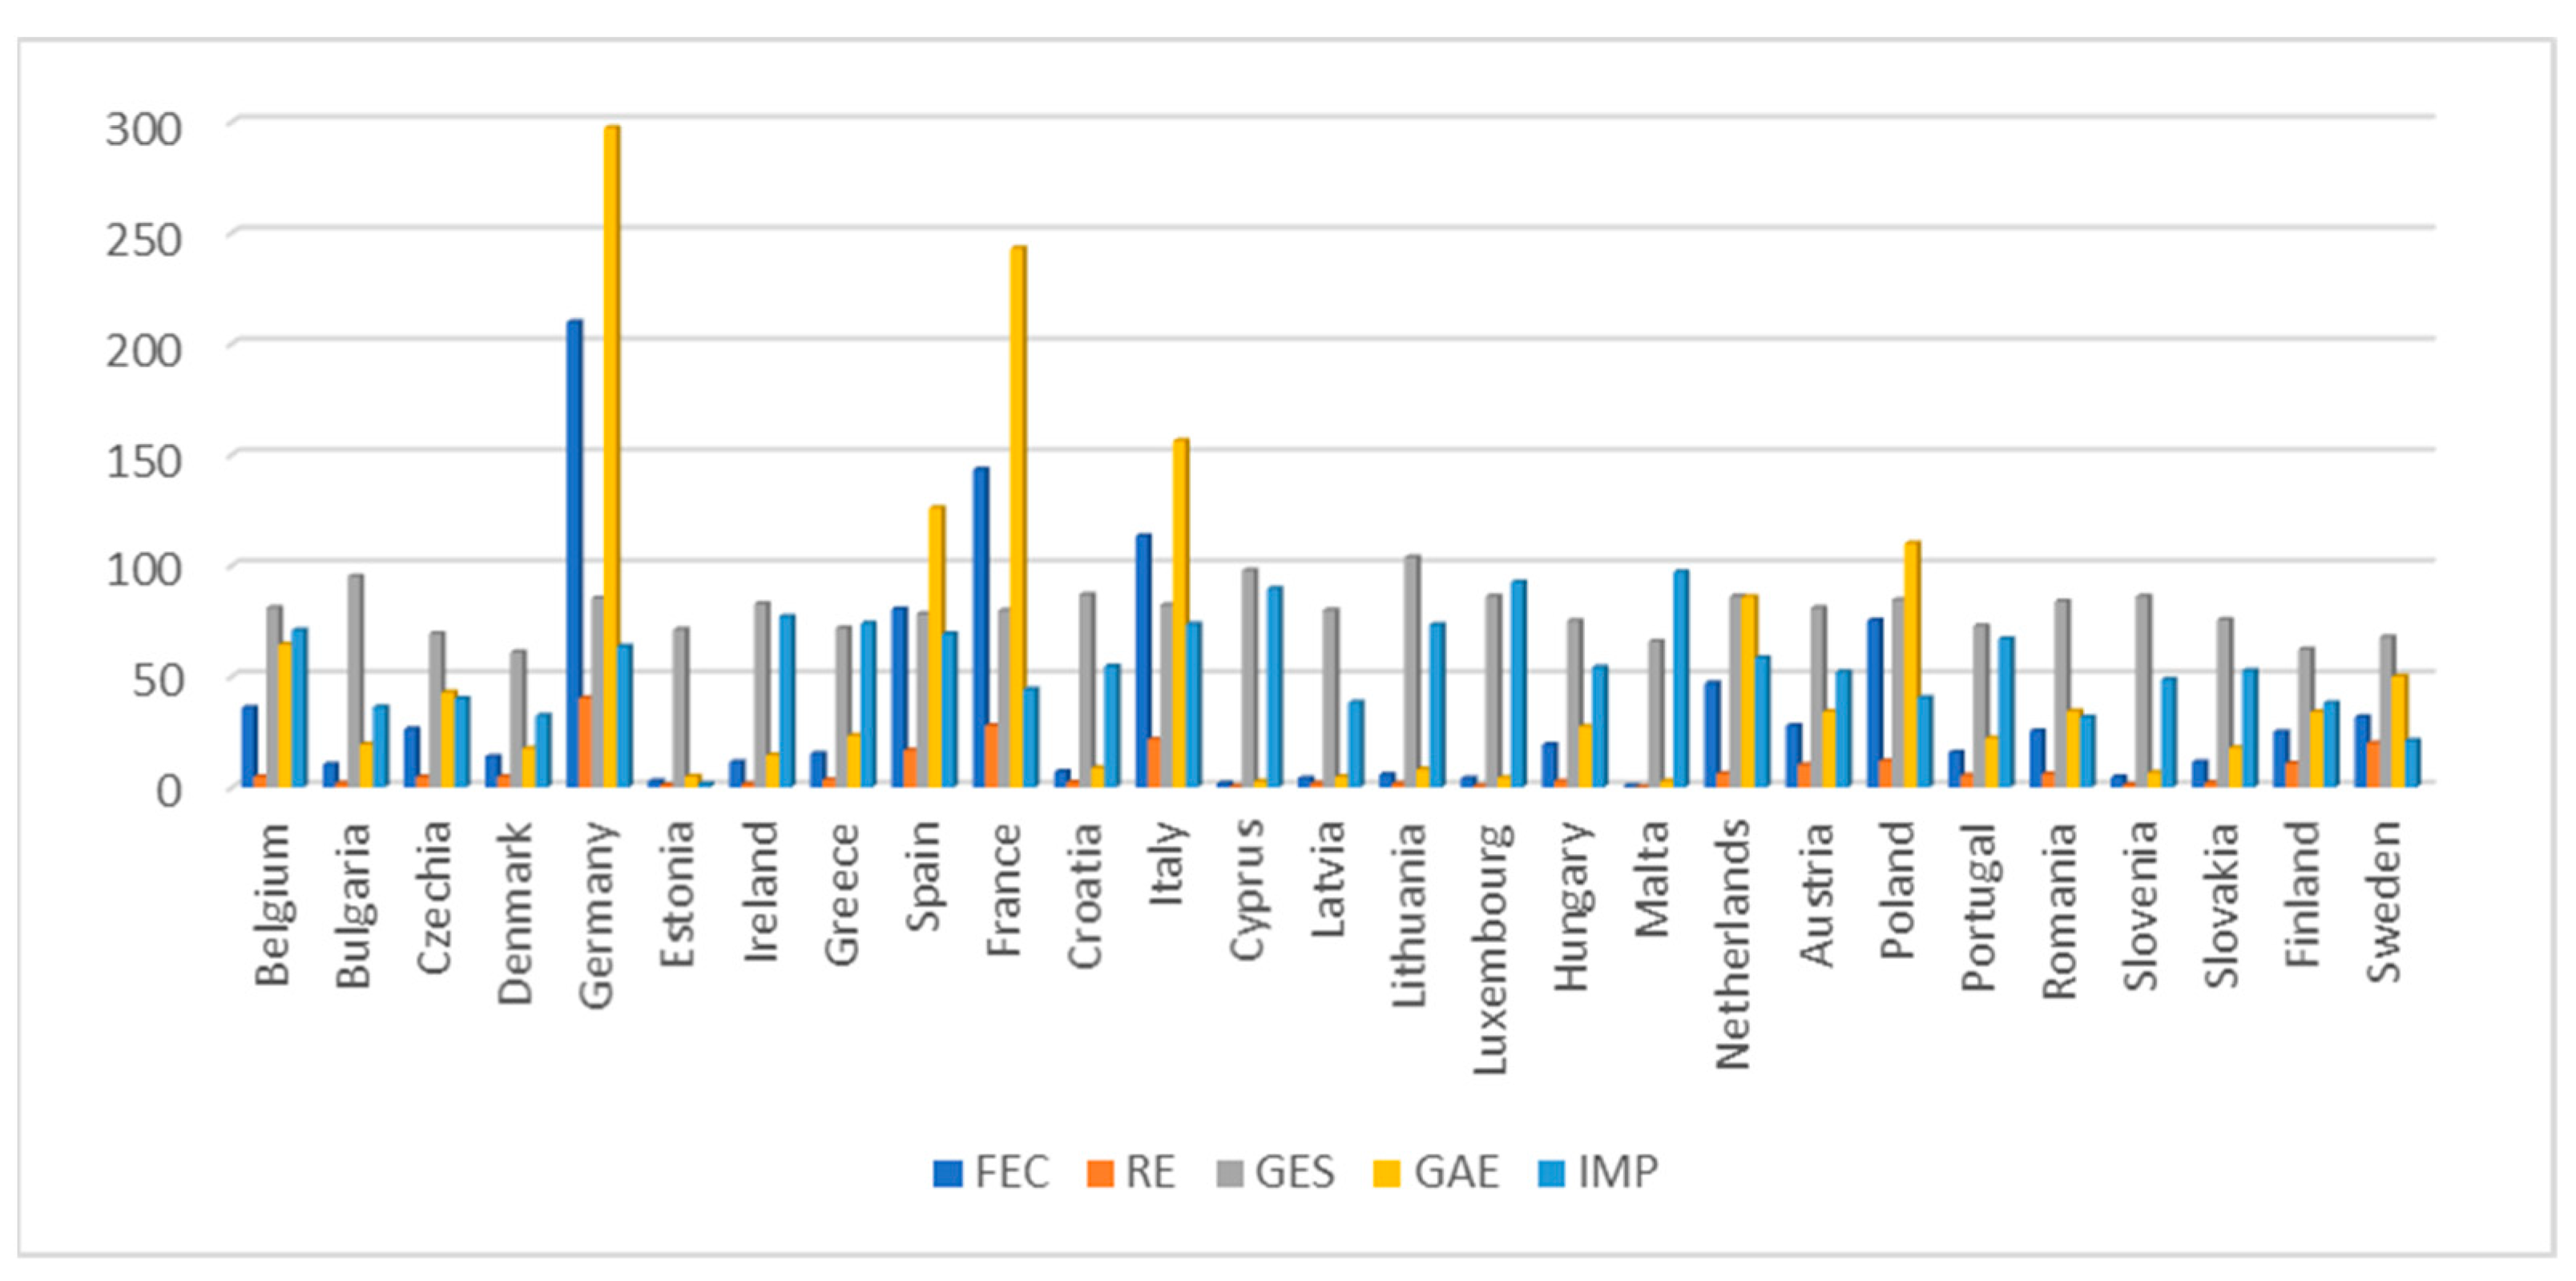
Comparative analysis leads to the following observations. Thus, in terms of final energy consumption, we find that Germany holds a leading position, followed by France and Italy (Figure 6).
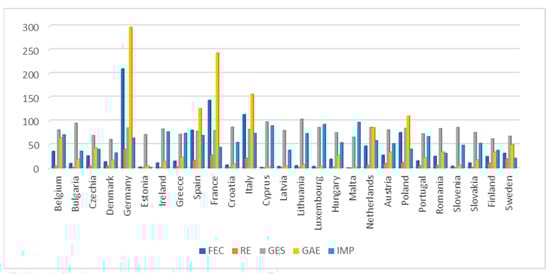
Figure 6.
Evolution of FEC, RE, GES, GAE, and IMP indicators for the 27 Member States of the European Union in 2021. Source: Eurostat. Data processed by authors.
Also, at the bottom of the ranking are Malta, Cyprus, and Estonia. Interestingly, although there are significant differences between countries in final energy consumption, 2021 greenhouse gas emission values do not show such a discrepancy. In terms of raw energy available, there are significant differences between countries, and we mention Germany, France, and Italy, which were at the top in 2021. In terms of renewable energy production in 2021, the leaders are Germany, France, Spain, and Italy, and at the opposite pole are Malta and Luxembourg. In terms of energy imports, the most dependent countries in the European Union are Cyprus, Luxembourg, and Malta.
In order to deepen the research and to be able to issue some indications on the implementation of the plan for achieving an efficient energy transition, we will study the correlations between the indicators: renewable/non-renewable energy production, imports, energy consumption, and greenhouse gas emissions intensity, using in this regard some statistical-econometric methods. Thus, we will continue to address an analysis of the main components at the level of 2021, taking into account the 27 Member States of the European Union.
We considered the component grouping method useful in the analysis because it involves the identification of the closest pairs of cases and/or variables, depending on the type of measurement unit used, and combines them to form a cluster. The algorithm involves the formation of pairs of clusters so that the data can finally be concentrated in a cluster.
The K-means cluster analysis method assumes the use of the first n cases as temporary estimates of n means of the groups. The analysis assumes that the identification of the initial centers of the groups involves the assignment of a cluster for each case as close as possible to the center, later averaging the two until the identification of the final centers of the respective clusters. This recalculation is performed until there are no more changes at the group centers or when the desired (set) maximum number of iterations is reached.
The hierarchical cluster analysis method involves identifying groups that are relatively homogeneous according to certain selected characteristics, using, in this sense, an algorithm that starts with each case in a separate group and then combines the groups until, finally, there is only one.
The hierarchical cluster analysis method ensures the flexibility of the analysis by the fact that it is not necessary to specify the number of clusters at the beginning of the analysis; they are formed along the way in a hierarchical way, leaving it up to the researcher to choose the optimal level of grouping after the final hierarchy has been determined. Also, the dendrogram provides a clear visual representation of the relationships between the elements in the data set, showing how and when the clusters are joined in the process of building the hierarchy. At the same time, the method is effective for the analysis of small and medium-sized data sets and, at the same time, can be applied even when there are missing data, using, in this sense, appropriate imputation methods or matrices that can handle missing data. The method ensures the exploratory study of the data in the sense that structures can be identified on the basis of which hypotheses can be issued, which can be tested and validated through statistical-co-econometric methods. Thus, we will continue to address an analysis of the main components at the level of 2021, taking into account the 27 Member States of the European Union.
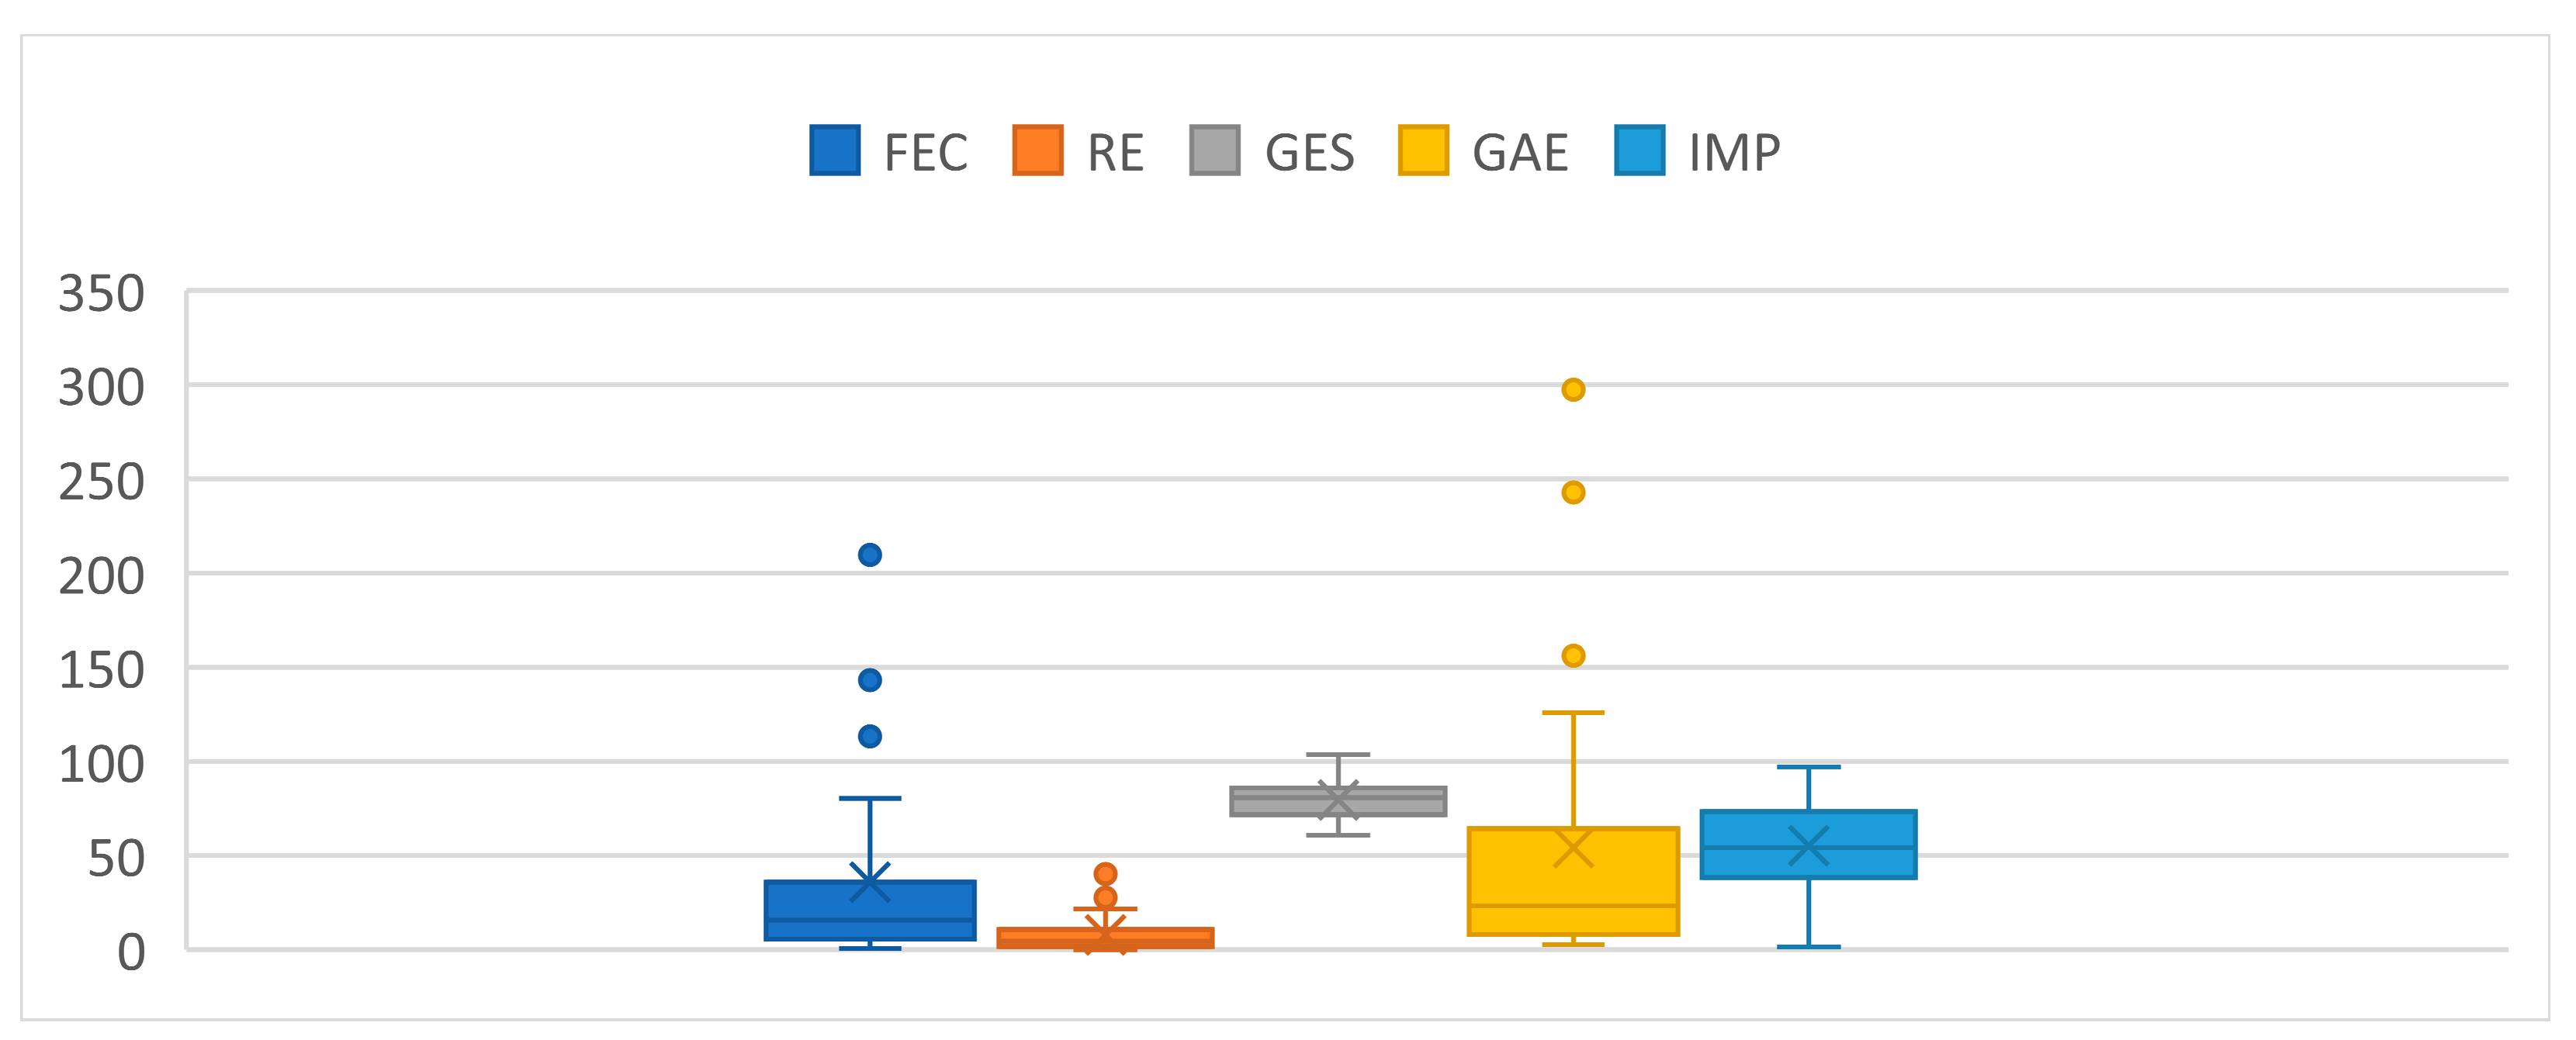
We find that all components (Figure 7), greenhouse gas emissions, final energy consumption, energy imports, available raw energy, and renewable energy production have asymmetries, leading to the conclusion that this is due to differences between members of the European Union according to their development level. Subsequently, we will use the analysis of the main components as an extraction method. Thus, the component matrix is presented in Table 3.
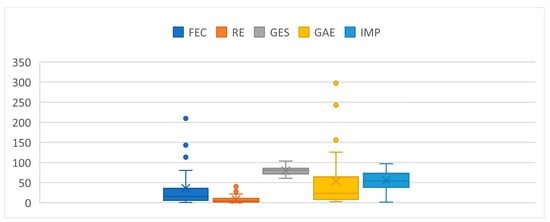
Figure 7.
Component structure. Source: Eurostat. Data processed by authors.
Table 3.
Matrix of components.
For easier interpretation of the results, they are shown in Figure 8.
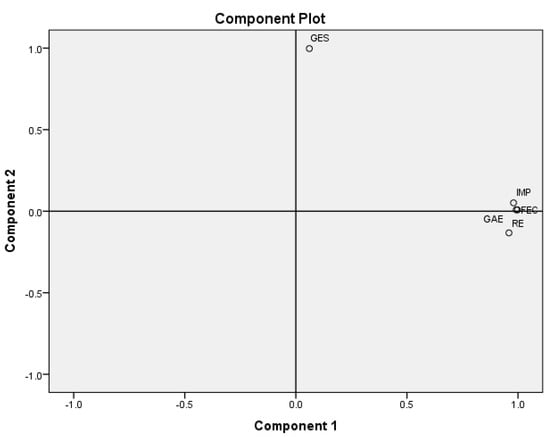
Figure 8.
Analysis of key components.
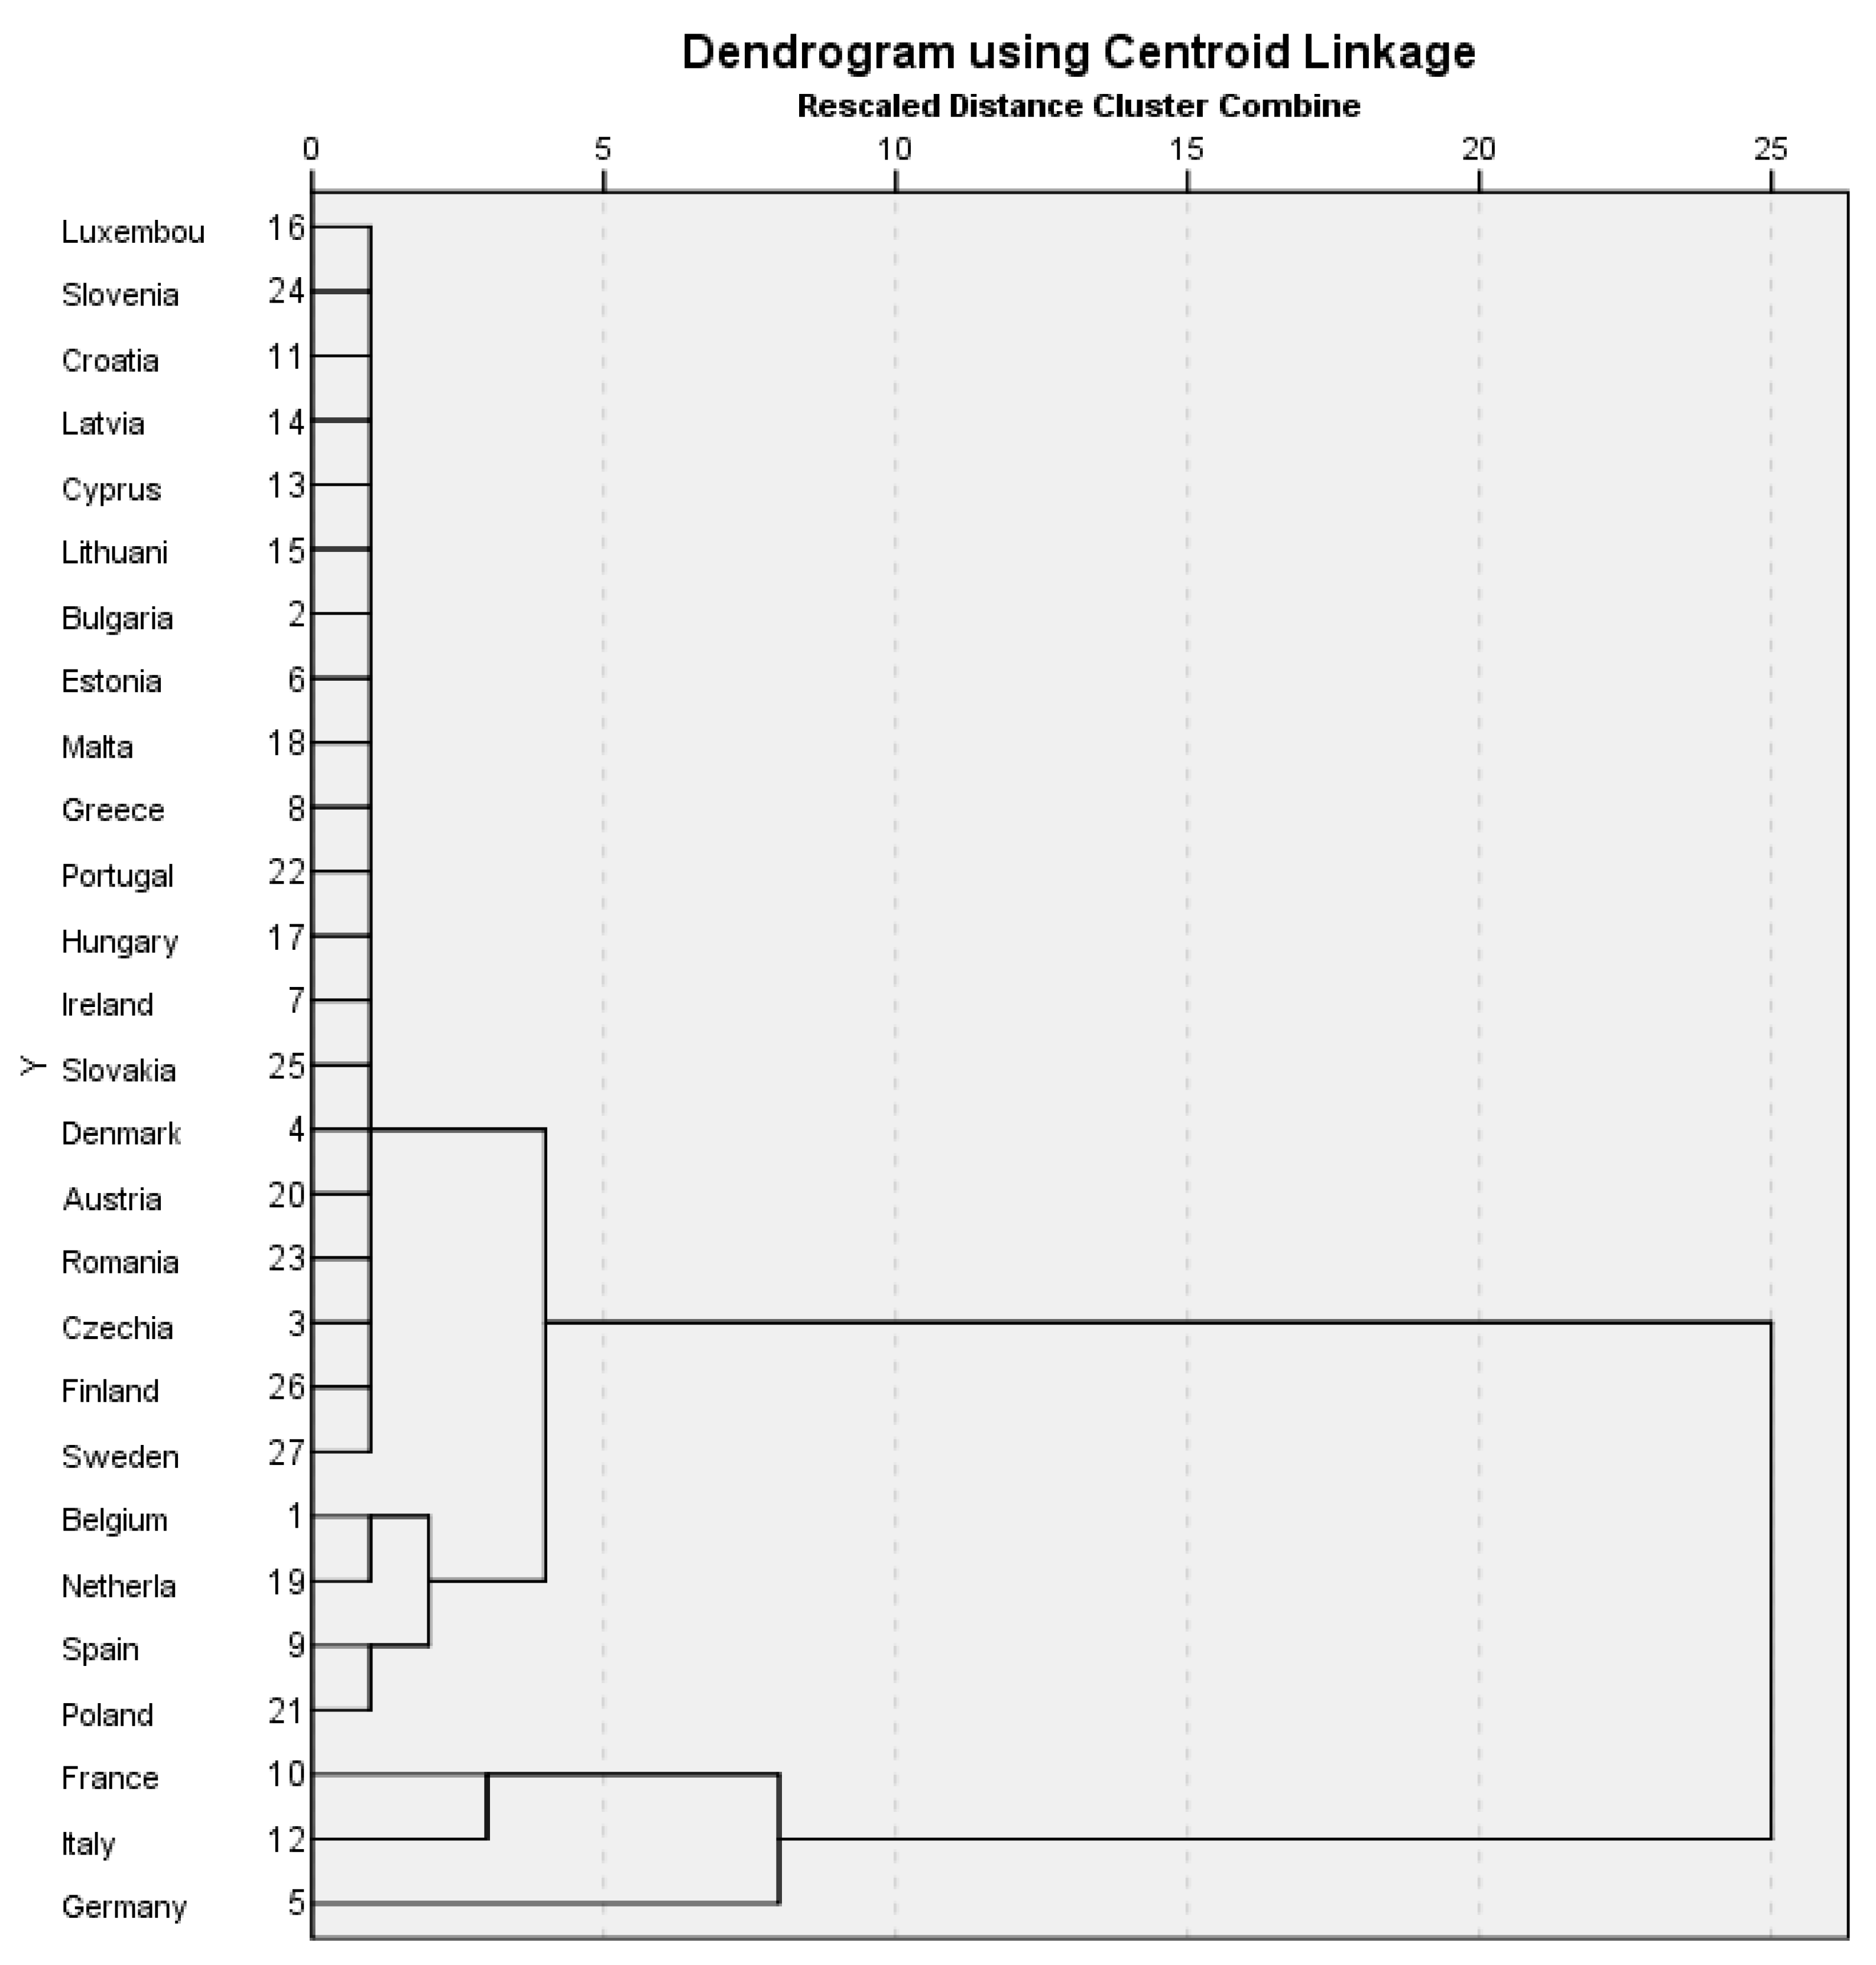
According to the obtained results, we find that in component 1, there are strong positive correlations for the variables IMP, GAE, FEC, and RE, and GHG shows a weak positive correlation. In component 2, the correlation for GHG is positive and strong, and for the other variables, there is a weak correlation, specifying that on this component, in terms of RE, the correlation is negative. What is noteworthy is that there is a significant difference in the correlation between the variables IMP, GAE, FEC, RE, and the GHG variable. We will continue the study using the hierarchical cluster analysis method to identify groups that are relatively homogeneous according to the selected characteristics. Thus, in Figure 9, the dendrogram is shown.
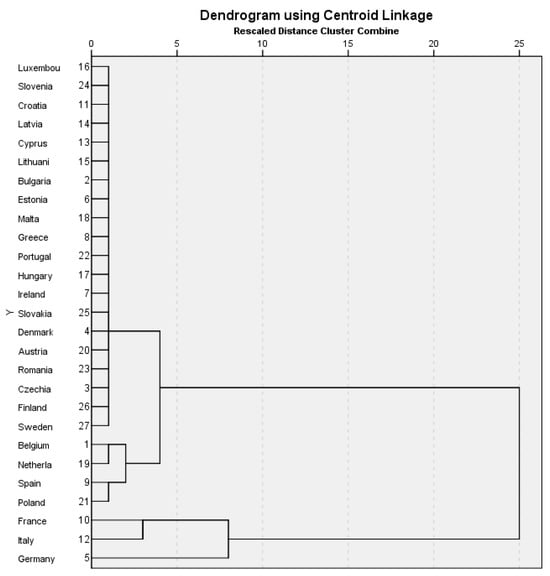
Figure 9.
Dendrogram.
Interpreting the results presented graphically, we find that the vast majority of Member States of the European Union have small differences in the evolution of the variables considered, which are represented on the scale with a value of 1. The exceptions are Belgium and the Netherlands, which also make a group. Then Spain and Poland make the next group, which group with Belgium and the Netherlands at level 2. The more developed countries, France and Italy, also form a group at level 3 and, together with Germany, another group at level 8 according to the representation scale. In other words, we find that this grouping by main components highlights the fact that there is a discrepancy between members of the European Union according to their development level.
The results of the ANOVA statistical test for this main component analysis are presented in Table 4.
Table 4.
ANOVA.
Looking at the data, we find that the results obtained are significant for the chosen materiality threshold, which is confirmed by the F-statistical test values that are superior to the tabulated values for FEC, RE, IMP, and GAE, except for GHGs, whose probability of error is high, much higher than the significance level. What emerges from this analysis of main components is the fact that at the European Union level, the evolution of Member States is still overshadowed by the development power of some states, and this aspect hinders in a certain way the future positive evolution of the European Union. Also, in the framework of the research undertaken, the authors were concerned with highlighting the component links between the member states of the European Union in terms of greenhouse gas emissions, final energy consumption, energy imports, raw energy, and available energy production from renewable sources. The observed discrepancies reveal the fact that measures to mitigate them are required within the European Union. What we must not forget is that non-renewable energy sources worldwide are exhaustible, and substantial efforts need to be made to achieve the energy transition. In Table 5, the state of fossil resources as of 7 October 2023 is presented.
Table 5.
Statement of global resources 7 October 2023.
It can be noted that at the time of writing this article, energy consumption from non-renewable sources worldwide was 288,774,836 MWh, and those from renewable sources represent only 15% of the total energy consumed daily. What we should worry about is that non-renewable sources (oil, natural gas, and coal) are exhaustible and harmful to the environment. Thus, if this average rate of exploitation and consumption is maintained for about 40 years, oil resources will be exhausted, and so will natural gas resources in about 154 years and coal in about 400 years. The use of these non-renewable energy sources is not only exhaustible but also generates greenhouse gases as a result of their exploitation and use. In this sense, China ranks first worldwide with 29.18%, followed by the US with 14.02%, India with 7.09% and Russia with 4.65%. Worldwide, the largest coal producers are China, India, Indonesia, the United States (USA), Australia, and Russia, and at the level of the European Union are Germany, Poland, the Czech Republic, Bulgaria, Greece, and Romania. At the same time, a third of the coal used by the European Union is imported, most of it coming from Russia. Why was coal taken as an example? Because it provides about 40% of global electricity production; therefore, it is equally responsible for greenhouse gas emissions. Next, we will deepen the study in the sense that, based on the data we have, we will make the forecast regarding the achievement of the energy transition at the level of the European Union.
We have structured in Table 6 the data taken by Eurostat, based on which we calculated the average change indices for the variable’s final consumption of energy and renewable energy. We chose these variables because the energy transition can be fully achieved when the two indicators mentioned reach equilibrium. Thus, the production of renewable energy registered an upward trend during the analyzed period 2000–2021, and the final energy consumption fluctuated, but in 2021, it remained at levels comparable to 2020.
Table 6.
Renewable energy and final energy consumption in the European Union.
In order to identify what is the moment of time t until the two mentioned indicators reach equilibrium, we will use an exponential equation of the following form:
Substituting into the equation the values of the variables, solving the equation, and thus determining the moment of time t, we found that renewable energy production will cover the final energy consumption at the European Union level after 36.05 years. Of course, this calculation is valid if the average rate of change is maintained in the coming period, but from our point of view, these aspects are particularly worrying, and we believe that each Member State of the European Union should guide its efforts in research, development, and innovation so that it can ensure the increase in renewable energy production and, consequently, the achievement of the energy transition. The results are in line with the targets of the EU and other organizations around the world. The shift in policies, like the latest meeting COP28 held in Dubai in 2023, marked the shift toward nuclear energy as a mean to reach net zero emissions with the Declaration to Triple Nuclear Energy Capacity by 2050 [83]. Previously, nuclear power has been depicted as dangerous, especially after the Fukushima event, when countries like Germany shut down their entire capacity of production from nuclear power. Moves like the one presented above can influence the rate of transition in the sense of faster or slower transition, depending on the direction the decision-makers consider adequate. Another aspect is presented by the scarcity of natural resources that are needed to maintain the actual rate of transition. The energy transition requires a massive amount of new raw materials like nickel, cobalt, lithium, copper, and other rare earth minerals that were not previously used at this magnitude [84]. In addition, energy transition is supported by the digital revolution, and the use of artificial intelligence offers proper solutions taking into account the complexity of the situation generated by the need to connect national energy markets, supporting the energy supply considering the reconfiguration of the energy mix at international level and energy storage challenges [85,86,87,88].
As part of the research undertaken regarding the state and evolution of energy resources at the level of the European Union, specific aspects are summarized.
- Greenhouse gas emissions have decreased and will continue to decrease as a result of the development of the consumption of renewable energy sources.
- The production of energy from renewable sources has increased at the level of the European Union as a result of the development of technologies for the production of wind, solar, and other energy.
- However, the need for the consumption of energy resources is insufficient, there are even periods of decrease.
- For the future, in line with the reduction in the production of non-renewable resources, it is necessary to undertake measures for each country aimed at developing the production of renewable energy sources.
- Both the comparative analysis and the one on main components highlighted the fact that there are discrepancies between the evolution of the indicators regarding the production and use of energy sources in the 27 member states of the European Union.
- Based on the statistical-mathematical model used, it follows that the production of renewable energy will be able to cover the final energy consumption at the level of the European Union in approximately 36 years.
5. Conclusions
The energy transition is a very complex conundrum that humanity must resolve by putting its brightest ideas at work. To solve the problem of climate change and human intervention in natural mechanisms developed over millions of years, the decision-makers must extract the most adequate solutions available. From the study conducted and presented in this paper, some conclusions are drawn. Firstly, in order to achieve a significant increase in energy efficiency in the context of the energy transition, significant investments are needed in research and development of advanced technologies and energy infrastructure. It is also important to have government policies in place to support these investments and encourage companies and consumers to adopt more energy-efficient solutions. By combining these efforts, we can create a more sustainable and efficient energy system that contributes to our environmental goals and brings significant economic and social benefits. Another conclusion that emerges is that the energy transition is vital to protect the environment and ensure a sustainable energy system for the future. However, the limited availability of raw materials needed to achieve it is an important problem that needs to be addressed by developing alternative technologies and recycling existing resources. The fossil fuel sources worldwide are exhaustible, and substantial efforts need to be made to achieve the energy transition. Greater use of nuclear energy and hydrogen could also reduce dependence on fossil fuels and scarce raw materials used in current technologies.
At the current stage, the development of artificial intelligence can lead to the development of new technologies that are usable in order to achieve the goals aimed at the energy transition. In this sense, in order to increase energy efficiency aiming at its transition, major investments are required in the research and development of advanced technologies and the modernization of the energy infrastructure. It also becomes important to promote government policies aimed at the development of these investments and to encourage, to the same extent, the economic factor and consumers to adopt effective measures in terms of saving energy resources. Under these conditions, through combined efforts, a durable and efficient energy system can be created, which will ensure the fulfillment of environmental objectives and bring significant economic and social benefits. In another order of ideas, the conclusion emerges that the energy transition is vital for protecting the environment and ensuring a sustainable energy system in the following period.
It must be taken into account that the limited availability of raw materials, as it results from the analysis undertaken and presented in this paper, is an important problem, which must be addressed through the development of alternative technologies and especially the improvement and development of renewable resources.
The dynamic analysis of the indicators (data) subjected to research highlighted the tendency to reduce greenhouse gas emissions at the level of the European Union in the period 2000–2021. This is performed against the background of the sharp increase in the production of energy from renewable sources in the same period.
During the research, it was highlighted that the hierarchical cluster analysis method is an appropriate tool for identifying and understanding the internal structure of data sets, providing a clear visualization of the relationships between elements and components.
The undertaken study highlighted the fact that fossil fuel sources worldwide are exhaustible, a context in which increased efforts are required to ensure the energy transition aimed at the rapid development of renewable resources. For example, the more intense use of nuclear energy and hydrogen will lead to a reduction in dependence on fossil fuels.
The authors are aware of the limits of the research carried out considering the focus of the study on the countries of the European Union that are deeply involved in the energy transition process and that have always found the appropriate resources and solutions for managing black swan events such as the COVID-19 crisis or the geopolitical tensions.
The energy transition and the increase in energy efficiency are concerns for all countries considering the international commitments assumed by the Paris Agreement. The European Union is the undisputed leader of the energy transition, considering the political commitment assumed by the European authorities. For this reason, the European experience can be a source of inspiration for countries from other regions as well. So, a future direction of research is to extend the study globally and have different approaches towards the measures undertaken by the Global North and the Global South, as the directions of the two groups are somehow divergent, given the late developments of power shifts on the global stage.
Author Contributions
Conceptualization, M.P., Ș.I. and C.V.; methodology, M.P., Ș.I. and C.V.; validation, M.P., Ș.I. and C.V.; formal analysis, M.P., Ș.I. and C.V.; investigation, M.P., Ș.I. and C.V.; resources, M.P., Ș.I., C.V., V.I., D.I., C.M. and C.T.; data curation, M.P., Ș.I. and C.V.; writing—original draft preparation, M.P., Ș.I. and C.V.; writing—review and editing, M.P., Ș.I., C.V., V.I., D.I., C.M. and C.T.; visualization, M.P., Ș.I., C.V., V.I., D.I., C.M. and C.T.; supervision, M.P., Ș.I., C.V., V.I., D.I., C.M. and C.T.; project administration, M.P. and Ș.I. All authors have read and agreed to the published version of the manuscript.
Funding
This research received no external funding.
Data Availability Statement
The original contributions presented in the study are included in the article, further inquiries can be directed to the corresponding author.
Acknowledgments
This work was supported by a grant from the Petroleum-Gas University of Ploiesti, Romania, project number GO-GICS-11063/8 June 2023, within the Internal Grant for Scientific Research.
Conflicts of Interest
The authors declare no conflicts of interest.
References
- Volosevici, D. Corporations—Between Governance and Social Responsibility: The European Commission Approach. Econ. Insights Trends Chall. 2013, 2, 65. [Google Scholar]
- Milán-García, J.; Uribe-Toril, J.; Ruiz-Real, J.L.; de Pablo Valenciano, J. Sustainable local development: An overview of the state of knowledge. Resources 2019, 8, 31. [Google Scholar] [CrossRef]
- Sułkowski, Ł.; Dobrowolski, Z. The role of supreme audit institutions in energy accountability in EU countries. Energy Policy 2021, 156, 112413. [Google Scholar] [CrossRef]
- Koilo, V. Evidence of the Environmental Kuznets Curve: Unleashing the opportunity of industry 4.0 in emerging economies. J. Risk Financ. Manag. 2019, 12, 122. [Google Scholar] [CrossRef]
- Panait, M.; Voica, M.C.; Rădulescu, I. Approaches regarding environmental Kuznets curve in the European Union from the perspective of sustainable development. Appl. Ecol. Environ. Res. 2019, 17, 6801. [Google Scholar] [CrossRef]
- Režný, L.; Bureš, V. Energy transition scenarios and their economic impacts in the extended neoclassical model of economic growth. Sustainability 2019, 11, 3644. [Google Scholar] [CrossRef]
- Popescu, C.; Uță, D.S.; Mitu, A.C.; Anghel, D.A. Business Approaches in the Energy Sector—A Review. Econ. Insights Trends Chall. 2024, 13, 27–43. [Google Scholar] [CrossRef]
- Kádár, P. Pros and cons of the renewable energy application. Acta Polytech. Hung. 2014, 11, 211–224. [Google Scholar]
- Caetano, N.S.; Mata, T.M.; Martins, A.A.; Felgueiras, M.C. New trends in energy production and utilization. Energy Procedia 2017, 107, 7–14. [Google Scholar] [CrossRef]
- Zaharia, M.; Gogonea, R.M.; Tănăsescu, A. Characteristics of the evolution of renewable energy production in European Union. In MATEC Web of Conferences; EDP Sciences: Les Ulis, France, 2017; Volume 126, p. 04003. [Google Scholar]
- Bucur, C.; Tudorică, B.G.; Oprea, S.V.; Nancu, D.; Duşmănescu, D.M. Insights into energy indicators analytics towards European green energy transition using statistics and self-organizing maps. IEEE Access 2021, 9, 64427–64444. [Google Scholar] [CrossRef]
- Oprea, S.V.; Bâra, A.; Tudorică, B.G.; Călinoiu, M.I.; Botezatu, M.A. Insights into demand-side management with big data analytics in electricity consumers’ behaviour. Comput. Electr. Eng. 2021, 89, 106902. [Google Scholar] [CrossRef]
- Erokhin, V.; Tianming, G. Renewable energy as a promising venue for China-Russia collaboration. In Energy Transition: Economic, Social and Environmental Dimensions; Springer Nature: Singapore, 2022; pp. 73–101. [Google Scholar]
- Popescu, C.; Hysa, E.; Kruja, A.; Mansi, E. Social innovation, circularity and energy transition for environmental, social and governance (ESG) practices—A comprehensive review. Energies 2022, 15, 9028. [Google Scholar] [CrossRef]
- Driha, O.; Cascetta, F.; Nardini, S.; Bianco, V. Evolution of renewable energy generation in EU27. A decomposition analysis. Renew. Energy 2023, 207, 348–358. [Google Scholar] [CrossRef]
- Cristescu, T.; Stoica, M.E.; Suditu, S. Research on the Carbon Dioxide Emission Factor as a Result of Fuel Combustion. Rev. De Chim. 2019, 70, 585–590. [Google Scholar] [CrossRef]
- Morina, F.; Lyroudi, K.; Balomenou, C. The economic impact of the coronavirus pandemic (COVID-2019): Implications for the energy sector. In Energy Transition: Economic, Social and Environmental Dimensions; Springer Nature: Singapore, 2022; pp. 193–213. [Google Scholar]
- Dumitrache, L.N.; Suditu, S.; Ghețiu, I.; Pană, I.; Brănoiu, G.; Eparu, C. Using Numerical Reservoir Simulation to Assess CO2 Capture and Underground Storage, Case Study on a Romanian Power Plant and Its Surrounding Hydrocarbon Reservoirs. Processes 2023, 11, 805. [Google Scholar] [CrossRef]
- Beer, M.; Rybár, R. Development process of energy mix towards neutral carbon future of the Slovak Republic: A review. Processes 2021, 9, 1263. [Google Scholar] [CrossRef]
- Jianzhong, X.; Assenova, A.; Erokhin, V. Renewable Energy and Sustainable Development in a Resource-Abundant Country: Challenges of Wind Power Generation in Kazakhstan. Sustainability 2018, 10, 3315. [Google Scholar] [CrossRef]
- Graham, N.; Carroll, W.K.; Chen, D. Carbon Capital’s Political Reach: A Network Analysis of Federal Lobbying by the Fossil Fuel Industry from Harper to Trudeau. Can. Political Sci. Rev. 2020, 14, 1–31. [Google Scholar] [CrossRef]
- Żuk, P.; Pacześniak, A. Sustainable development, energy transition, and climate challenges in the context of gender: The framework of gender determinants of environmental orientation in Poland. Sustainability 2020, 12, 9214. [Google Scholar] [CrossRef]
- Roy, B.; Schaffartzik, A. Talk renewables, walk coal: The paradox of India’s energy transition. Ecol. Econ. 2021, 180, 106871. [Google Scholar] [CrossRef]
- Salimi, M.; Amidpour, M. The impact of energy transition on the geopolitical importance of oil-exporting countries. World 2022, 3, 607–618. [Google Scholar] [CrossRef]
- Hu, G.; Yang, J.; Li, J. The Dynamic Evolution of Global Energy Security and Geopolitical Games: 1995~2019. Int. J. Environ. Res. Public Health 2022, 19, 14584. [Google Scholar] [CrossRef]
- Wiertz, T.; Kuhn, L.; Mattissek, A. A turn to geopolitics: Shifts in the German energy transition discourse in light of Russia’s war against Ukraine. Energy Res. Soc. Sci. 2023, 98, 103036. [Google Scholar] [CrossRef]
- Andersen, A.D.; Markard, J.; Bauknecht, D.; Korpås, M. Architectural change in accelerating transitions: Actor preferences, system architectures, and flexibility technologies in the German energy transition. Energy Res. Soc. Sci. 2023, 97, 102945. [Google Scholar] [CrossRef]
- Siddi, M. The Geopolitics of Energy Transition: New Resources and Technologies. The Implications of Emerging Technologies in the Euro-Atlantic Space: Views from the Younger Generation Leaders Network; Springer: Berlin/Heidelberg, Germany, 2023; pp. 73–85. [Google Scholar]
- Ceglia, F.; Marrasso, E.; Samanta, S.; Sasso, M. Addressing energy poverty in the energy community: Assessment of energy, environmental, economic, and social benefits for an Italian residential case study. Sustainability 2022, 14, 15077. [Google Scholar] [CrossRef]
- Neacsa, A.; Panait, M.; Muresan, J.D.; Voica, M.C. Energy poverty in European Union: Assessment difficulties, effects on the quality of life, mitigation measures. some evidences from Romania. Sustainability 2020, 12, 4036. [Google Scholar] [CrossRef]
- Dobrowolski, Z. Energy and local safety: How the administration limits energy security. Energies 2021, 14, 4841. [Google Scholar] [CrossRef]
- Hoicka, C.E.; Lowitzsch, J.; Brisbois, M.C.; Kumar, A.; Camargo, L.R. Implementing a just renewable energy transition: Policy advice for transposing the new European rules for renewable energy communities. Energy Policy 2021, 156, 112435. [Google Scholar] [CrossRef]
- Popescu, C.; Apostu, S.A.; Rădulescu, I.G.; Mureșan, J.D.; Brezoi, A.G. Energizing the Now: Navigating the Critical Landscape of Today’s Energy Challenges—An In-Depth Review. Energies 2024, 17, 675. [Google Scholar] [CrossRef]
- Siksnelyte-Butkiene, I. A systematic literature review of indices for energy poverty assessment: A household perspective. Sustainability 2021, 13, 10900. [Google Scholar] [CrossRef]
- Yasmeen, R.; Huang, H.; Shah, W.U.H. Assessing the significance of FinTech and mineral resource depletion in combating energy poverty: Empirical insights from BRICS economies. Resour. Policy 2024, 89, 104691. [Google Scholar] [CrossRef]
- Pop, C.A.; Cioara, T.; Antal, M.; Mihailescu, V.; Mitrea, D.; Anghel, I.; Salomie, I.; Raveduto, G.; Bertoncini, M.; Croce, V.; et al. Blockchain based decentralized local energy flexibility market. Energy Rep. 2021, 7, 5269–5288. [Google Scholar]
- Lindholm, O.; Rehman, H.U.; Reda, F. Positioning positive energy districts in European cities. Buildings 2021, 11, 19. [Google Scholar] [CrossRef]
- Gabriela, R.I.; Catalin, P. Renewable Energy Strategies: Where European Union Headed. Ann. Econ. Ser. 2015, 102–107. [Google Scholar]
- Christensen, A. Transportation Carbon Intensity Targets for the European Union–Road and Aviation Sectors. 2021. Available online: https://theicct.org/publication/transportation-carbon-intensity-targets-for-the-european-union-road-and-aviation-sectors/ (accessed on 9 January 2024).
- Doğan, B.; Driha, O.M.; Balsalobre Lorente, D.; Shahzad, U. The mitigating effects of economic complexity and renewable energy on carbon emissions in developed countries. Sustain. Dev. 2021, 29, 1–12. [Google Scholar] [CrossRef]
- Balsalobre-Lorente, D.; Driha, O.M.; Tiwari, A.K. Renewable Energy Trade. In Renewable Energy: Analysis, Resources, Applications, Management, and Policy; AIP Publishing LLC.: Melville, Australia; New York, NY, USA, 2022; pp. 3-1–3-20. [Google Scholar] [CrossRef]
- Brożyna, J.; Mentel, G.; Szetela, B. Renevable energy and economic development in the European Union. Acta Polytech. Hung. 2017, 14, 11–34. [Google Scholar]
- Kulkarni, S.S.; Wang, L.; Venetsanos, D. Managing Technology Transfer Challenges in the Renewable Energy Sector within the European Union. Wind 2022, 2, 150–174. [Google Scholar] [CrossRef]
- Fernández-González, R.; Arce, E.; Garza-Gil, D. How political decisions affect the economy of a sector: The example of photovoltaic energy in Spain. Energy Rep. 2021, 7, 2940–2949. [Google Scholar] [CrossRef]
- Çomuk, P.; Akkaya, B.; Ercoşkun, S.; Apostu, S.A. The foreıgn dırect ınvestments, economıc growth, renewable energy and carbon (CO2) emıssıons nexus: An empırıcal analysıs for Turkey and European Unıon Countrıes. Environ. Dev. Sustain. 2023, 1–17. [Google Scholar] [CrossRef]
- Neacsa, A.; Muresan, J.D.; Voica, M.C.; Manta, O.; Ivan, M.V. Oil Price—A Sensor for the Performance of Romanian Oil Manufacturing Companies. Energies 2023, 16, 2336. [Google Scholar] [CrossRef]
- Petrescu, M.G.; Ilincă, C.; Tănase, M. Reliability of manufacturing technologies. In Innovation and Sustainable Manufacturing; Woodhead Publishing: Cambridge, UK, 2023; pp. 29–65. [Google Scholar]
- Petrescu, M.G.; Neacșa, A.; Laudacescu, E.; Tănase, M. Energy in the Era of Industry 5.0—Opportunities and Risks. In Industry 5.0: Creative and Innovative Organizations; Springer International Publishing: Cham, Switzerland, 2023; pp. 71–90. [Google Scholar]
- González-Sánchez, M.; Martín-Ortega, J.L. Greenhouse gas emissions growth in Europe: A comparative analysis of determinants. Sustainability 2020, 12, 1012. [Google Scholar] [CrossRef]
- Khan, S.A.R.; Zia-Ul-Haq, H.M.; Ponce, P.; Janjua, L. Re-investigating the impact of non-renewable and renewable energy on environmental quality: A roadmap towards sustainable development. Resour. Policy 2023, 81, 103411. [Google Scholar] [CrossRef]
- Khan, S.A.R.; Panait, M.; Guillen, F.P.; Raimi, L. (Eds.) Energy Transition: Economic, Social and Environmental Dimensions; Springer Nature: Berlin/Heidelberg, Germany, 2022. [Google Scholar]
- Renna, P.; Materi, S. A literature review of energy efficiency and sustainability in manufacturing systems. Appl. Sci. 2021, 11, 7366. [Google Scholar] [CrossRef]
- Pereira, F.; Caetano, N.S.; Felgueiras, C. Increasing energy efficiency with a smart farm—An economic evaluation. Energy Rep. 2022, 8, 454–461. [Google Scholar] [CrossRef]
- Zaharia, M.; Pătrașcu, A.; Gogonea, M.R.; Tănăsescu, A.; Popescu, C. A cluster design on the influence of energy taxation in shaping the new EU-28 economic paradigm. Energies 2017, 10, 257. [Google Scholar] [CrossRef]
- European Union. Renewable Energy Directive EU/2018/2001; European Union: Brussels, Belgium, 2001. [Google Scholar]
- European Union. Revised Renewable Energy Directive EU/2023/2413; European Union: Brussels, Belgium, 2023. [Google Scholar]
- EEA. Available online: https://www.eea.europa.eu/en/topics/in-depth/climate-change-mitigation-reducing-emissions (accessed on 9 January 2024).
- Long, N.; Steinberger, K. Renewable Energy Is Key to Fighting Climate Change. Nat. Resour. Def. Council 2016. Available online: https://www.nrdc.org/bio/noah-long/renewable-energy-key-fighting-climate-change (accessed on 20 April 2024).
- Chan, H.W.; Udall, A.M.; Tam, K.P. Effects of perceived social norms on support for renewable energy transition: Moderation by national culture and environmental risks. J. Environ. Psychol. 2022, 79, 101750. [Google Scholar] [CrossRef]
- Sovacool, B.K.; Schmid, P.; Stirling, A.; Walter, G.; MacKerron, G. Differences in carbon emissions reduction between countries pursuing renewable electricity versus nuclear power. Nat. Energy 2020, 5, 928–935. [Google Scholar] [CrossRef]
- Morina, F.; Balomenou, C.; Ergün, U. Determinants of Profitability: Evidence of Renewable Energy Companies. In Global, Regional and Local Perspectives on the Economies of Southeastern Europe: Proceedings of the 11th International Conference on the Economies of the Balkan and Eastern European Countries (EBEEC), Bucharest, Romania, 10–12 May 2019; Springer International Publishing: Berlin/Heidelberg, Germany, 2021; pp. 243–256. [Google Scholar]
- Gigauri, I.; Vasilev, V. Corporate social responsibility in the energy sector: Towards sustainability. In Energy Transition: Economic, Social and Environmental Dimensions; Springer Nature: Singapore, 2022; pp. 267–288. [Google Scholar]
- Ishaq, M.; Ghouse, G.; Fernandez-Gonzalez, R.; Puime-Guillen, F.; Tandir, N.; Santos de Oliveira, H.M. From Fossil Energy to Renewable Energy: Why is Circular Economy Needed in the Energy Transition? Front. Environ. Sci. 2022, 10, 941791. [Google Scholar] [CrossRef]
- Postea, M.M.; Achim, M.V.; Noja, G.G. New estimate of shadow economy based on the total energy consumption. Evidence from the European Union countries. Energy Econ. 2024, 130, 107335. [Google Scholar]
- Sajid, M.J.; Zhang, Y.; Janjua, L.R. Breaking barriers: Assessing technology transfer for climate-resilient development. Environ. Technol. Innov. 2024, 33, 103471. [Google Scholar] [CrossRef]
- Cantarero, M.M.V. Of renewable energy, energy democracy, and sustainable development: A roadmap to accelerate the energy transition in developing countries. Energy Res. Soc. Sci. 2020, 70, 101716. [Google Scholar] [CrossRef]
- Swilling, M.; Nygaard, I.; Kruger, W.; Wlokas, H.; Jhetam, T.; Davies, M.; Jacob, M.; Morris, M.; Robbins, G.; Funder, M. Linking the energy transition and economic development: A framework for analysis of energy transitions in the global South. Energy Res. Soc. Sci. 2022, 90, 102567. [Google Scholar] [CrossRef]
- Heras, A.; Gupta, J. Fossil fuels, stranded assets, and the energy transition in the Global South: A systematic literature review. Wiley Interdiscip. Rev. Clim. Change 2023, 15, e866. [Google Scholar] [CrossRef]
- Apergi, M.; Eicke, L.; Goldthau, A.; Hashem, M.; Huneeus, S.; de Oliveira, R.L.; Otieno, M.; Schuch, E.; Veit, K. An energy justice index for the energy transition in the global South. Renew. Sustain. Energy Rev. 2024, 192, 114238. [Google Scholar] [CrossRef]
- Imteyaz, B.; Lawal, D.U.; Tahir, F.; Rehman, S. Prospects of large-scale photovoltaic-based power plants in the Kingdom of Saudi Arabia. Eng. Rep. 2021, 3, e12398. [Google Scholar] [CrossRef]
- Qadir, S.A.; Al-Motairi, H.; Tahir, F.; Al-Fagih, L. Incentives and strategies for financing the renewable energy transition: A review. Energy Rep. 2021, 7, 3590–3606. [Google Scholar] [CrossRef]
- Alasseri, R.; Rao, T.J.; Sreekanth, K.J. Institution of incentive-based demand response programs and prospective policy assessments for a subsidized electricity market. Renew. Sustain. Energy Rev. 2020, 117, 109490. [Google Scholar] [CrossRef]
- Pitelis, A.; Vasilakos, N.; Chalvatzis, K. Fostering innovation in renewable energy technologies: Choice of policy instruments and effectiveness. Renew. Energy 2020, 151, 1163–1172. [Google Scholar] [CrossRef]
- Ellabban, O.; Refaat, S.S.; Abu-Rub, H.; Al-Fagih, L. A novel methodology to determine the maximum PV penetration in distribution networks. In Proceedings of the 2019 2nd International Conference on Smart Grid and Renewable Energy (SGRE), Doha, Qatar, 19–21 November 2019; pp. 1–6. [Google Scholar] [CrossRef]
- Yoo, T.H.; Ko, W.; Rhee, C.H.; Park, J.K. The incentive announcement effect of demand response on market power mitigation in the electricity market. Renew. Sustain. Energy Rev. 2017, 76, 545–554. [Google Scholar] [CrossRef]
- Solomon, B.D.; Krishna, K. The coming sustainable energy transition: History, strategies, and outlook. Energy Policy 2011, 39, 7422–7431. [Google Scholar] [CrossRef]
- Gallo, A.B.; Simões-Moreira, J.R.; Costa, H.K.M.; Santos, M.M.; Dos Santos, E.M. Energy storage in the energy transition context: A technology review. Renew. Sustain. Energy Rev. 2016, 65, 800–822. [Google Scholar] [CrossRef]
- Chen, B.; Xiong, R.; Li, H.; Sun, Q.; Yang, J. Pathways for sustainable energy transition. J. Clean. Prod. 2019, 228, 1564–1571. [Google Scholar] [CrossRef]
- Tian, J.; Yu, L.; Xue, R.; Zhuang, S.; Shan, Y. Global low-carbon energy transition in the post-COVID-19 era. Appl. Energy 2022, 307, 118205. [Google Scholar] [CrossRef]
- Bogdanov, D.; Ram, M.; Aghahosseini, A.; Gulagi, A.; Oyewo, A.S.; Child, M.; Caldera, U.; Sadovskaia, K.; Farfan, J.; De Souza Noel Simas Barbosa, L.; et al. Low-cost renewable electricity as the key driver of the global energy transition towards sustainability. Energy 2021, 227, 120467. [Google Scholar] [CrossRef]
- Blazquez, J.; Fuentes, R.; Manzano, B. On some economic principles of the energy transition. Energy Policy 2020, 147, 111807. [Google Scholar] [CrossRef]
- Limpens, G.; Moret, S.; Jeanmart, H.; Maréchal, F. EnergyScope TD: A novel open-source model for regional energy systems. Appl. Energy 2019, 255, 113729. [Google Scholar] [CrossRef]
- USA Energy Department. Available online: https://www.energy.gov/articles/cop28-countries-launch-declaration-triple-nuclear-energy-capacity-2050-recognizing-key (accessed on 9 January 2024).
- International Energy Agency. The Role of Critical Minerals in Clean Energy Transitions; World Energy Outlook Special Report; International Energy Agency: Paris, France, 2021. [Google Scholar]
- Farzaneh, H.; Malehmirchegini, L.; Bejan, A.; Afolabi, T.; Mulumba, A.; Daka, P.P. Artificial intelligence evolution in smart buildings for energy efficiency. Appl. Sci. 2021, 11, 763. [Google Scholar] [CrossRef]
- Višković, A.; Franki, V.; Jevtić, D. Artificial intelligence as a facilitator of the energy transition. In Proceedings of the 2022 45th Jubilee International Convention on Information, Communication and Electronic Technology (MIPRO), Opatija, Croatia, 23–27 May 2022; pp. 494–499. [Google Scholar]
- Iglesias-Sanfeliz Cubero, Í.M.; Meana-Fernández, A.; Ríos-Fernández, J.C.; Ackermann, T.; Gutiérrez-Trashorras, A.J. Analysis of Neural Networks Used by Artificial Intelligence in the Energy Transition with Renewable Energies. Appl. Sci. 2023, 14, 389. [Google Scholar] [CrossRef]
- Dudnik, O.; Vasiljeva, M.; Kuznetsov, N.; Podzorova, M.; Nikolaeva, I.; Vatutina, L.; Khomenko, E.; Ivleva, M. Trends, impacts, and prospects for implementing artificial intelligence technologies in the energy industry: The implication of open innovation. J. Open Innov. Technol. Mark. Complex. 2021, 7, 155. [Google Scholar] [CrossRef]


Disclaimer/Publisher’s Note: The statements, opinions and data contained in all publications are solely those of the individual author(s) and contributor(s) and not of MDPI and/or the editor(s). MDPI and/or the editor(s) disclaim responsibility for any injury to people or property resulting from any ideas, methods, instructions or products referred to in the content. |
© 2024 by the authors. Licensee MDPI, Basel, Switzerland. This article is an open access article distributed under the terms and conditions of the Creative Commons Attribution (CC BY) license (https://creativecommons.org/licenses/by/4.0/).