Article

Qualities and Quantities of Poultry Litter Biochar Characterization and Investigation

by
Yulai Yang
1,
Xuejun Qian
2,*,
Samuel O. Alamu
3,
Kayla Brown
1,
Seong W. Lee
3,* and
Dong-Hee Kang
1,*
1
Department of Civil and Environmental Engineering, Morgan State University, 1700 East Cold Spring Lane, Baltimore, MD 21251, USA
2
DOE Great Lakes Bioenergy Research Center, University of Wisconsin-Madison, Madison, WI 53726, USA
3
Industrial and Systems Engineering Department, Morgan State University, 1700 East Cold Spring Lane, Baltimore, MD 21251, USA
*
Authors to whom correspondence should be addressed.
Energies 2024, 17(12), 2885; https://doi.org/10.3390/en17122885
Submission received: 20 May 2024 / Revised: 3 June 2024 / Accepted: 8 June 2024 / Published: 12 June 2024
(This article belongs to the Special Issue Biomass and Bio-Energy—2nd Edition)

Abstract

:
Excessive land application of poultry litter (PL) may lead to surface runoff of nitrogen (N) and phosphorus (P), which cause eutrophication, fish death, and water pollution that ultimately have negative effects on humans and animals. Increases in poultry production in the Delmarva Peninsula underscore the need for more efficient, cost-effective, and sustainable disposal technologies for processing PL instead of direct land application. The pyrolysis conversion process can potentially produce nutrient-rich poultry litter biochar (PLB), while the pyrolysis process can change the N and P to a more stable component, thus reducing its runoff. Pyrolysis also kills off any microorganisms that would otherwise trigger negative environmental health effects. This study is to apply an integrated method and investigate the effect of pyrolysis temperature (300 °C, 500 °C), poultry litter source (different feedstock composition), and bedding material mixture (10% pine shavings) on PLB qualities and quantities. Proximate and ultimate analysis showed PL sources and bedding material addition influenced the physicochemical properties of feedstock. The SEM and BET surface results indicate that pyrolysis temperature had a significant effect on changing the PLB morphology and structure, as well as the pH value (7.78 at 300 °C vs. 8.78 at 500 °C), extractable phosphorus (P) (18.73 ppm at 300 °C vs. 11.72 ppm at 500 °C), sulfur (S) (363 ppm at 300 °C vs. 344 ppm at 500 °C), and production yield of PLBs (47.65% at 300 °C vs. 60.62% at 500 °C). The results further suggest that adding a bedding material mixture (10% pine shavings) to PLs improved qualities by reducing the content of extractable P and S, as well as pH values of PLBs. This study also found the increment in both the pore volume and the area of Bethel Farm was higher than that of Sun Farm. Characterization and investigation of qualities and quantities of PLB using the integrated framework suggest that PL from Bethel Farm could produce better-quality PLB at a higher pyrolysis temperature and bedding material mixture to control N and P runoff problems.

1. Introduction

Poultry production generates substantial quantities of waste, including poultry litter (PL), which consists of manure mixed with spilled feed, dead birds, bones, feathers, and bedding materials such as straw, wood shavings, or sawdust [1]. Biomass energy sources are classified into five categories: woody biomass, agricultural biomass, aquatic biomass, animal and human waste, and industrial waste. PL is one type of biomass and the most prevalent organic animal waste produced within the U.S. and globally [1,2,3]. In 2019, Maryland’s around 2000 poultry farms alone produced more than 350,000 tons of PL [1]. According to the recently released report by the Delmarva Chicken Association (DCA), the total PL generated was estimated to be 706,399 tons within the Delmarva Peninsula area [2,3]. Using the assumption of PL production of between 1.1 and 1.4 tons per 1000 birds, the entire U.S. annually produces around 9.24–12.46 million tons of PL [4]. The main disposal routes for the PL were direct land application, combustion, composting, anaerobic digestion, and pyrolysis [5,6,7]. Improper disposal of PL, coupled with tons of airborne ammonia generation per year, create downstream problems such as eutrophication and nutrient runoff (e.g., phosphorus, nitrogen) into bodies of water (e.g., the Chesapeake Bay), as well as water contamination and air pollution, all of which contribute to environmental concerns [8]. Because of the superior energetic and biological properties of PL, its sustainable use as an energy resource and soil amendment has been stimulated via thermal chemical processes.
Particularly, there has been growing interest in converting PL into poultry litter biochar (PLB) using pyrolysis. Pyrolysis is well known as one of the promising thermochemical conversion technologies for producing carbon-rich solid material (e.g., biochar) and other value-added products (e.g., bio-oil and syngas) in the absence of oxygen from biomass resources and waste organic materials [9,10,11]. Biochar is a lightweight black residue, porous, solid, and rich in organic carbon (OC), that can consist of carbon and ash [12]. PLB derived from the pyrolysis process possesses several desirable properties that make it suitable for addressing both waste management challenges and sustainable agricultural practices. Previous studies found that biochar has a high carbon content and a porous structure, which enhances its ability as a soil amendment to retain water and nutrients in soil and improve soil fertility and crop yield [13,14,15]. Biochar observed with a high specific surface and pore volume can be used as a remediation tool to adsorb heavy metals, reducing leaching to water courses [16]. Compared with wood shavings, PLB is significantly superior in positively charged metal ion adsorption [17]. PLB also showed the highest sorption capacity compared with green waste-derived biochar, commercial activated carbon (AC), and laboratory-produced black carbon (BC). Chemical sorption between biochar and metals was observed. Moreover, PLB immobilized Pb and Cd up to 93.5% and 88.4%, respectively [18]. Additionally, biochar can serve as a renewable energy source and contribute to carbon sequestration, thereby mitigating greenhouse gas emissions and climate change impacts [19]. Biochar can be utilized as a feed additive in animal husbandry to mitigate the impact of enteric methane emissions and improve animal health and productivity [20]. Furthermore, PLB has been explored for its potential in wastewater treatment, where its adsorption properties can effectively remove contaminants such as heavy metals, organic pollutants, and pathogens from aqueous solutions [21]. Compared with plant-based biochar, PLB has higher nutrient levels, which is increasing the yield of crop production [22,23]. Instead of direct land application of PL, PLB made from pyrolysis can be used as a soil amendment to reduce environmental problems and maintain sustainable agriculture [24].
Biochar yield, qualities, and structure depend on the physicochemical properties of feedstock (e.g., moisture content, lignin, particle size), various pyrolysis conditions (e.g., temperature, heating rate, residence time, pressure, catalyst, pyrolysis reactor bed height), feed stock pretreatment, and even factors related to storage [25]. Understanding these factors is essential for maximizing the yield, quality, and potential applications of PLB in agriculture, environmental remediation, and other fields. Pyrolysis temperature is the key factor in determining the yield and quality of biochar from slow pyrolysis of PL [26,27]. A previous study investigated the effect of pyrolysis temperature on the quality of PL biochar, and an optimal pyrolysis temperature of within 300–500 °C was suggested to convert PL to agricultural-use biochar. The optimal pyrolysis temperatures using thermogravimetric analysis (TGA) and the effect of various residence times of 0.5 h, 1 h, 2 h, 4 h, and 6 h at optimal temperature on biochar qualities were determined [28]. The effect of production methods including torrefaction (TOR), tube furnace (TF), and hydrothermal carbonization (HTC) on the physical, chemical, and biological properties of PLB was further studied. This study found the presence of sylvite (KCl) crystals on the surface of TOR samples, which change in pore structure, leading to a significant variation in pore size, inhibition of the germination in TOR biochars, and the suppression of growth in HTC hydrochars [29]. The extractable nutrient concentrations in the biochar were strongly influenced by feedstock types [23]. A previous study found that the nutrients N, P, K, Ca, and Mg and micronutrients B, Cu, Fe, Mn, Na, and Zn were significantly higher in PLB compared to pelletized peanut hulls and pine chips (p < 0.05) [23]. There is still limited research on the effect of feedstock composition, bedding material types, and pretreatment conditions on both quantities and qualities of PLB. This study selected PL from two different farms and applied a bedding material mixture to represent the change in feedstock compositions. This study intends to develop a systemic evaluation framework and investigate the effect of feedstock compositions and pretreatment conditions on the qualities and quantiles of PLBs as well as the possibility of P reduction compared to direct application of PL into soil.

2. Materials and Methods

2.1. Sample Collection and Fuel Property Analysis

PL samples were collected from a permanently roofed storage shed at two local poultry farms, Bethel Farm (4013 St Lukes Rd, Salisbury, MD, USA) and Sun Farm (14470 Backbone Rd, Eden, MD, USA). Samples were transported to the testing site and stored in plastic bags at a room temperature of 23 °C before the pyrolysis testing. Pine shavings used for animal bedding material were obtained from a local store. The PL used was broiler litter, which was a mixture of poultry manure, spilled feed, feathers, dead bird remains, and bedding material (sawdust for these two poultry houses). The percentage of bedding material depends on the initial depth (a layer of bedding material that was added when a new poultry house was built, reusing the material for many years) as well as the replacement amount (about 25.4–50.8 mm over the top level) during the cleaning period. Collected PL samples contained little bedding material because these two houses were built more than 15 years ago. In this study, 10% wt. of pine shavings was added as bedding material to collected raw PL samples to simulate more realistic conditions and allow one to better investigate the effect of bedding material on quality of the PLB [23].
Proximate and ultimate analysis on a dry basis was performed to investigate the fuel properties of biochar. Proximate analysis was used to determine the weight percentages (wt.%) of moisture (M), volatile matter (VM), fixed carbon (FC), and ash (ASH) content, while ultimate analysis was used to determine the weight percentages of chemical elements (carbon, hydrogen, nitrogen, oxygen, and sulfur) along with moisture and ash [1]. For ultimate analysis, the standard testing method, ASTM D5373 [30], was used. For proximate analysis, standard test methods, including ASTM D3302/D3173 [31,32], ASTM D3174 [33], ASTM D3175 [34], and ASTM D5865/5864 [35,36], were used to analyze the composition of moisture, ash, volatile matter and heating value, respectively. Fixed C and O concentrations were calculated by subtracting the percentage of other compositions from 100% [1]. These analyses were conducted by Mineral Labs, Inc., Salyersville, KY, USA.

2.2. Poultry Litter Biochar Preparation and Framework

As shown in Figure 1, the samples were collected and prepared before processing in the benchtop pyrolysis testing facilities. The benchtop pyrolysis equipment/supplies include a Hi-Temp Electric Burnout Oven (Tabletop Furnace Company, Tacoma, WA, USA, serial number: FUR-0155), pyrolysis canisters (Hurrise, ASIN: B08BFQ1G87), and a drying oven (WYDDDARY, serial number: DZF-6050). The Tabletop burnout oven has a maximum working temperature of 1200 °C and is designed with a programmable controller. There is a pre-drilled 6.35 mm (1/4”) vent hole on the top of the oven to remove the smoky vapor (volatiles) during the pyrolysis process, which is ideal for biochar production [26]. The pyrolysis canister was a 119.38 mm (4.7”W) × 114.30 mm (4.5”H) stainless steel container with a 4.76 mm (3/16”) hole drilled in the lid. The collected PL samples (about 300 to 400 g) were packed loosely in the multiple pyrolysis canisters (see the pyrolysis step). The loaded canisters were placed in the drying oven (105 °C, 4–8 h) to fully remove moisture before the pyrolysis. The samples were then taken out and weighed to calculate the percentage of total solids. The burnout oven was set at the designed pyrolysis temperature of 300 °C or 500 °C. Pre-dried PL samples were placed in the burnout oven after the oven reached the desired pyrolysis temperature. An air-free environment was achieved inside the canister during pyrolysis, as the canister lid and the furnace door were airtight and the continuous emission of pyrolysis volatiles from the canister prevented air from diffusing through the hole in the lid. The pyrolysis temperature was maintained until no visible vapors were observed. The reaction (pyrolysis) time between the start and end of visible vapors from the furnace was approximately 1.5 h at 500 °C, or 2 h at 300 °C. The canisters were cooled, taken out, and weighed. The PLB yield was calculated using Equation (1). Prepared PLB samples were stored in the plastic bags at a room temperature of 23 °C before conducting the fuel property analysis. Table 1 summarizes the experimental conditions to prepare 8 PLB samples based on various conditions.

2.3. Mophology and Elemental Analysis

Scanning electron microscopy–energy dispersive X-ray spectroscopy (SEM-EDS) (Thermo Scientific, Boston, MA, USA, Phenom XL G2, Serial No. MVE031342-0124-L) was used to obtain a high-resolution image and analyze the biochar morphology and elemental compositions. This unit has a large chamber and sample stage (100 × 100 mm2). Morphology and elemental analysis were performed with assistance from lab technicians in the Department of Civil and Environmental Engineering at Morgan State University. Surface area and porosity are important physical properties of biochar, playing a crucial role in many biochar applications. The Brunauer–Emmett–Teller (BET) method is a physical characterization technique that provides quantitative data on the specific surface area and porosity distribution of solid materials [37]. The BET analysis was conducted by MSE Supplies LLC (Tucson, AZ, USA) using a surface area and porosimetry analyzer (Micromeritics, Norcross, GA, USA; ASAP 2460) in adherence with the ISO 9277 [38] standard to evaluate pore size (at both meso- and micro-pores), specific surface area, and pore volume (Figure 2).

2.4. Yield, pH, and Extractable Nutrient Analysis

The biochar yield can be calculated using the following formula [39]:
Biochar   yield   ( % ) = m a s s   o f   b i o c h a r ( g ) o v e n   d r y   m a s s   o f   P L ( G ) × 100 ,
The standard method, ASTM D4972 [40], was used for measuring the pH value of PBL samples. The test specimens were sieved through a 2.00 mm (No. 10) sieve and pH measurements were made in deionized water using a pH meter (Fisher Scientific (Waltham, MA, USA) Fisherbrand Accumet Meters, AR20). Ion-exchange resin technologies developed by Dr. Earl Skogley at Montana State University were adopted to evaluate extractable nutrients of soil, PL, and PLB samples [41]. This method is based on placement of specially blended and encapsulated ion-exchange resin into the medium to be tested [41]. Solutes, both cations and anions, were independently and selectively adsorbed based on the concentration in the solution phase and the rate of diffusion of the resin sink. The exchange capacity of the resin capsule functions as an effectively infinite sink, allowing continuous adsorption of elements in a manner somewhat analogous to absorption by living organisms. Thus, quantities of elements accumulated in the capsule during a selected time relate to their bioavailability. This method was developed as the universal single-extraction approach for laboratory soil testing to simulate soil nutrient release interactions and plant-root uptake [41]. PLB samples 1–8, the soil sample, and the PL sample from Sun Farm (total of 10 samples) were analyzed by Predictive Nutrient Solutions, Inc. (Walla Walla, WA, USA).

3. Results and Discussion

3.1. Fuel Property Analysis (Proximate and Ultimate Analysis) Results

Proximate and ultimate analysis of four samples, including two PL samples, pine shavings (PS), and PLB made from PL that were collected from the Bethel Farm, are summarized in Table 2. The results indicate that two PL samples from the different farms had moderate differences in composition. The percentage difference of various elements was between 0.5% and 19%. PS had 55% lower carbon content, 31% higher oxygen content, and 32% lower ash content compared with PL samples. The N and S levels of PL samples were almost 22 times and 29 times higher than the PS sample. The results infer that the PLBs made from two PL samples may have had similar properties and that the addition of PS into the PL may have changed the overall properties of the PLBs significantly.
PLB has a high ash content and is useful as a liming agent due to its relatively high CaCO3, MgCO3, Mg (OH)2, and MgO content [42]. A previous study investigated the effectiveness of lime, PL, and PLB on acidic soils. Compared to PL and lime, PLB registered a greater increase in pH value within the soil. PLB can also increase levels of Ca, Mg, K, and P in soil [43]. It is an effective soil amendment for reducing soil acidity, thereby enhancing soil fertility and productivity in acid soils. Another study compared the biochar produced from different biomass resources, namely, sawdust, pine bark, sugarcane bagasse, coffee husk, and PL. The results show that PLB had the highest ash content (52.0–56.4%) [44]. Our test data are consistent with the above literature and found that the ash content was 52.42%. Carbon content increased from 38.0% (in PL) to 72.5% (in PLB) (excluding the proportion of ash) after the PL was converted into PLB through pyrolysis. The high carbon content in PLB is a supporting aspect for making it a good soil-carbon enhancing material.
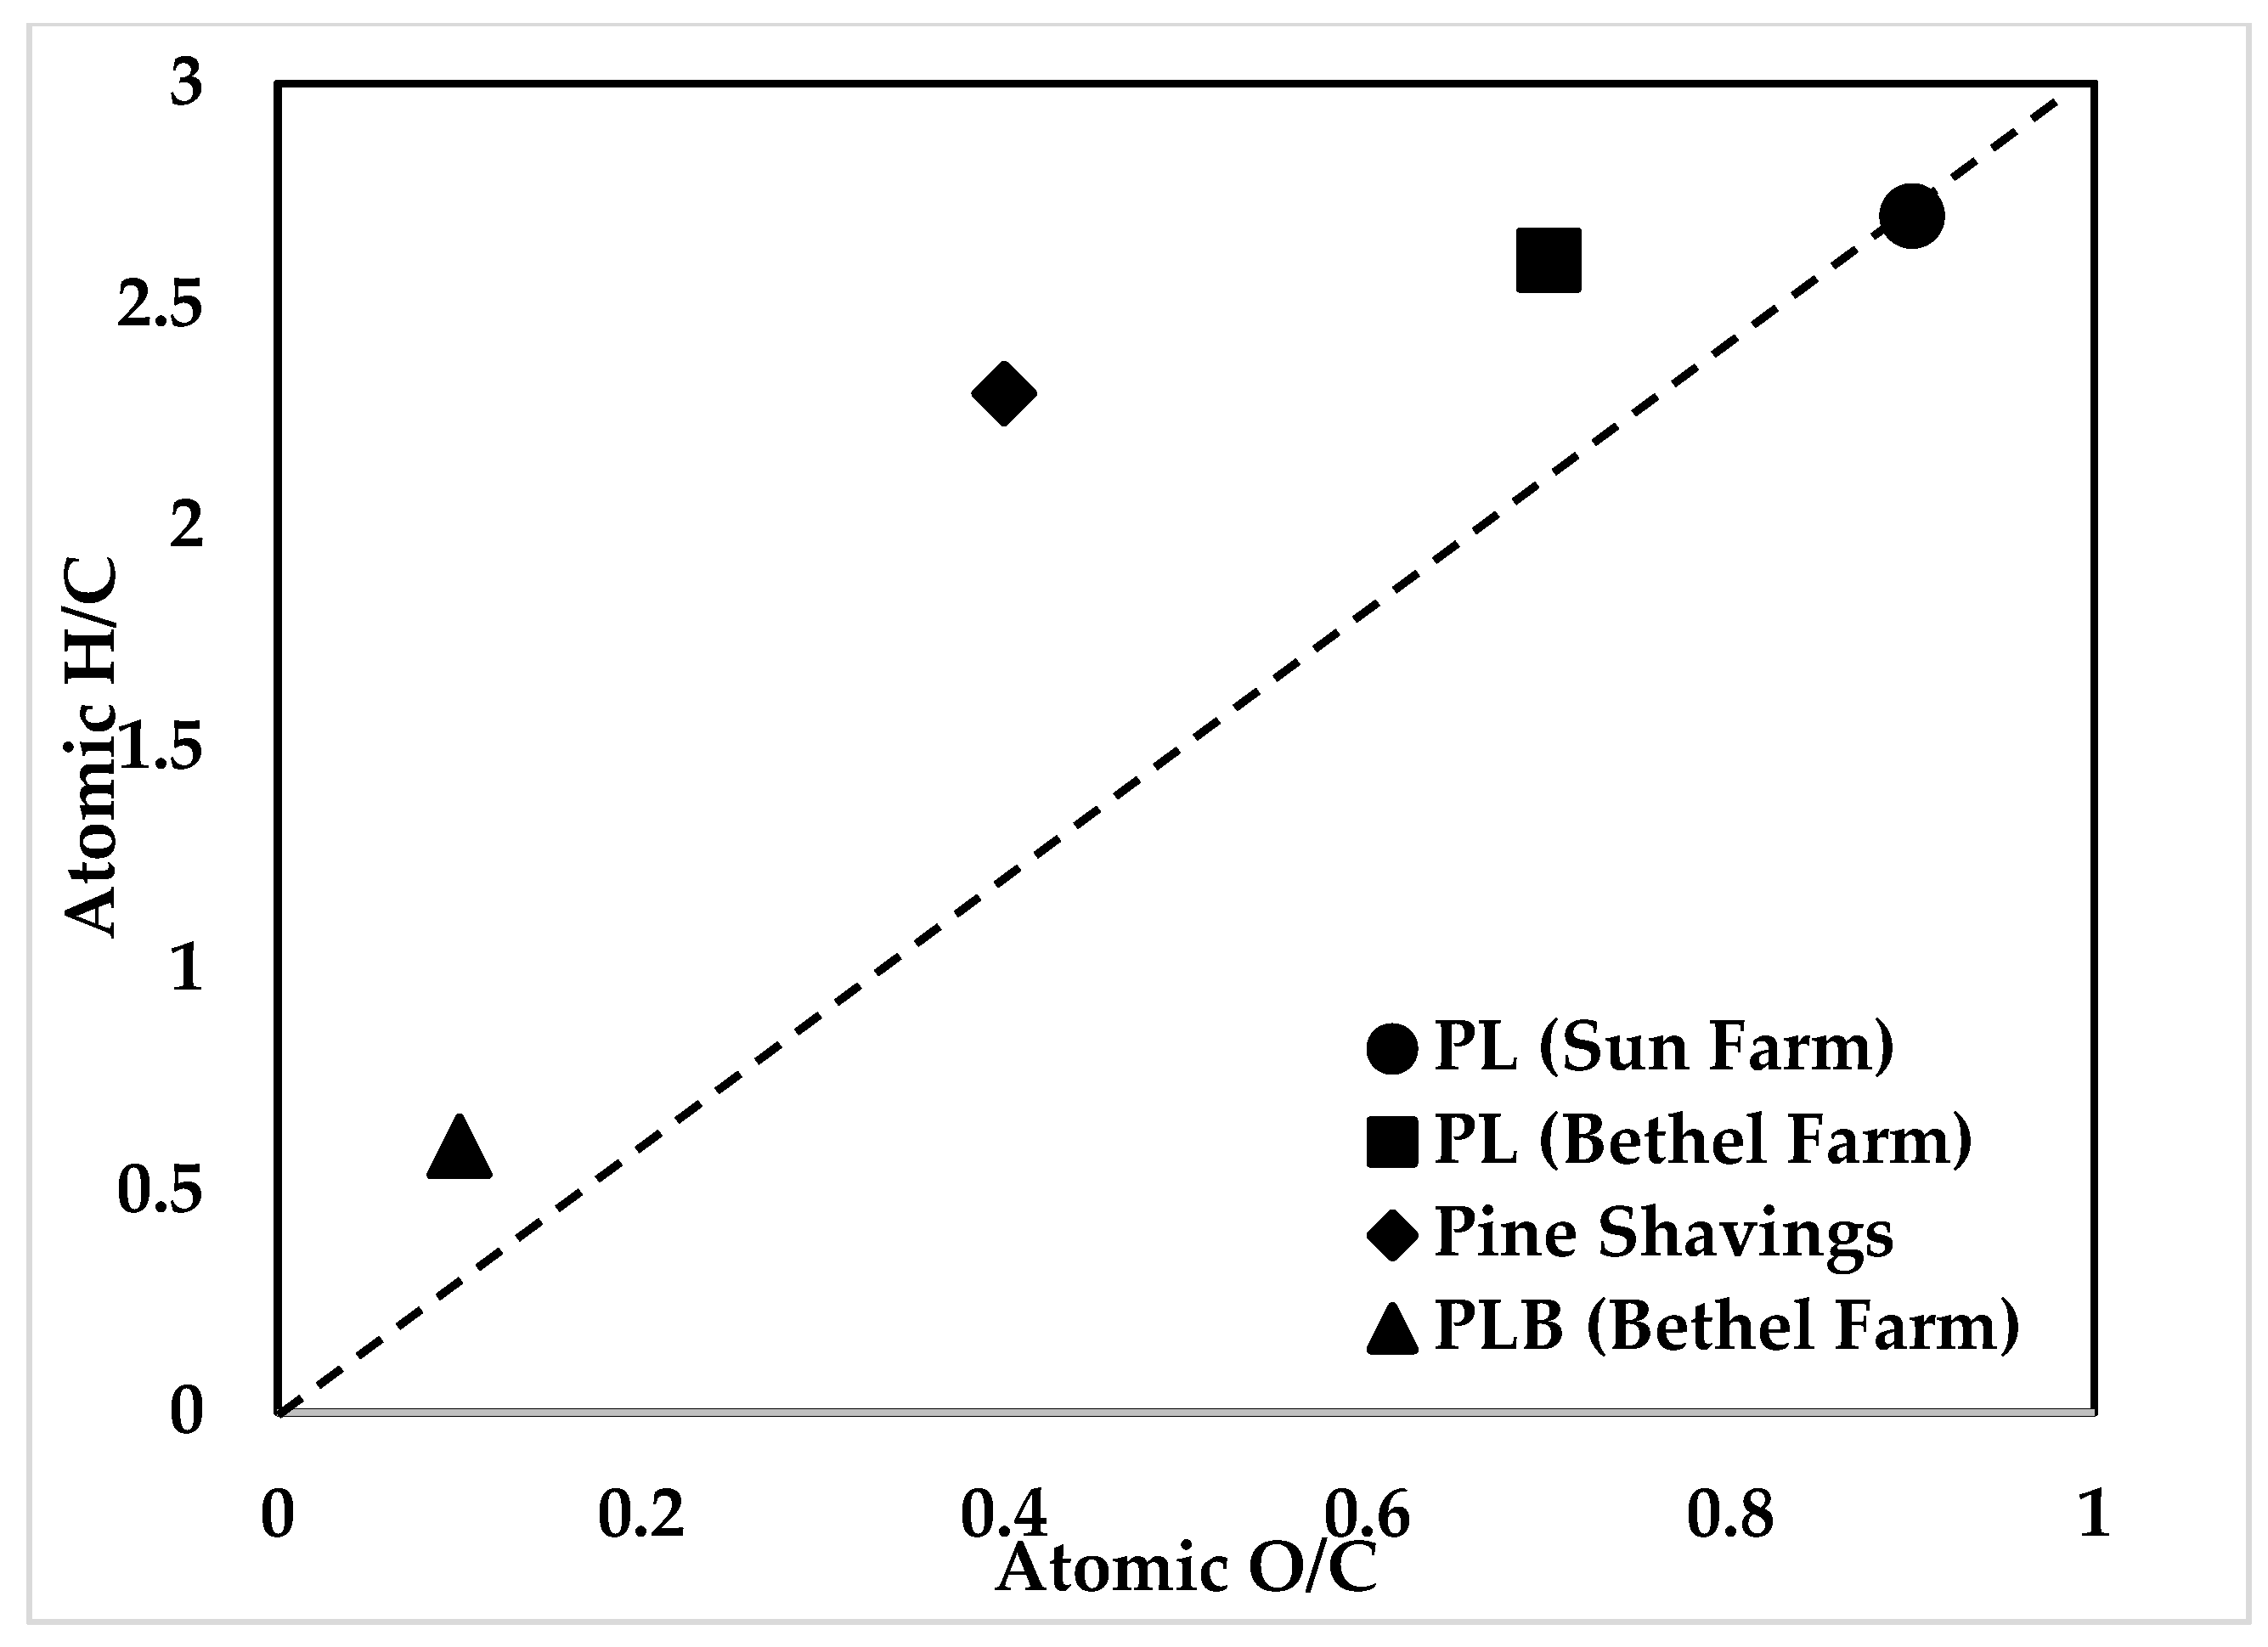
The molar H/C ratio is a material property that is correlated with the stability of the material, while a H:Corg below 0.7 is referred to as thermochemically converted; this criterion is used to distinguish biochar from biomass that has not been fully thermochemically altered [39]. Biochar materials have a greater proportion of fused aromatic ring structures [45]. As shown in Figure 3, a van Krevelen diagram was plotted to show the degree of aromaticity and carbonation in both raw biomass and PLB samples. Atomic H/C and O/C ratios are indexes of aromaticity and carbonization of biochars. The H/C and O/C ratios in PLB were lower than those in their respective raw materials due to dehydration, decarboxylation, and decarbonylation [46]. The results indicate that the H/C ratios decreased more significantly than the O/C ratios, resulting from dehydrogenation and demethylation [47]. As seen in the van Krevelen diagram, lower O/C and H/C ratios were associated with higher heating values (HHV) of biochar [48]. The pyrolysis process also reduced the oxygen content and increased the carbon percentage of the sample. The resulting PLB had a higher HHV value than two PL samples (14,596 Kj/kg vs. 13,782 Kj/kg and 13,698 Kj/kg) despite its high ash content (52.42% vs. 26.63% and 33.00%). The resulting PLB is also ideal for use as a fuel due to its higher HHV.

3.2. Biochar Surface & Chemical Composition Analysis

Figure 4 shows the SEM images of the prepared PLB samples under the various conditions at two pyrolysis temperatures. The PLB 1, 3, 5, and 7 samples underwent pyrolysis at 300 °C, while the PLB 2, 4, 6, and 8 samples underwent pyrolysis at 500 °C. The large porous structures were readily visible in all the PLB samples. As shown in the highlighted red areas, the flake structure of graphite can be observed clearly in sample PLB 1 and PLB 8. The results indicate that increasing the pyrolysis temperature (500 °C) favored the pore opening. This finding shows the pyrolysis temperature had a notable impact on the pore structure and morphology of biomass char. Previous studies found the removal of volatile matter produced pore openings from 200 °C to 500 °C. Structural shrinkage and pore narrowing occurred when the surface area reached a maximum value at 500 °C [49]. Furthermore, the macrospores possessed a nearly spherical shape (in the PLB 6 image). This may be the result of the softening and melting effect caused by local high temperatures. High temperatures led to plastic deformation of particles and resulted in smooth surfaces (in the PLB 6 image) and large cavities (in the PLB 2 and 3 images). After devolatilization at 500 °C, the morphology of the particles changed and an ordered structure was observed. PLB with a high surface area has an adsorption capacity that makes it suitable as a remediation agent for removing heavy metals.
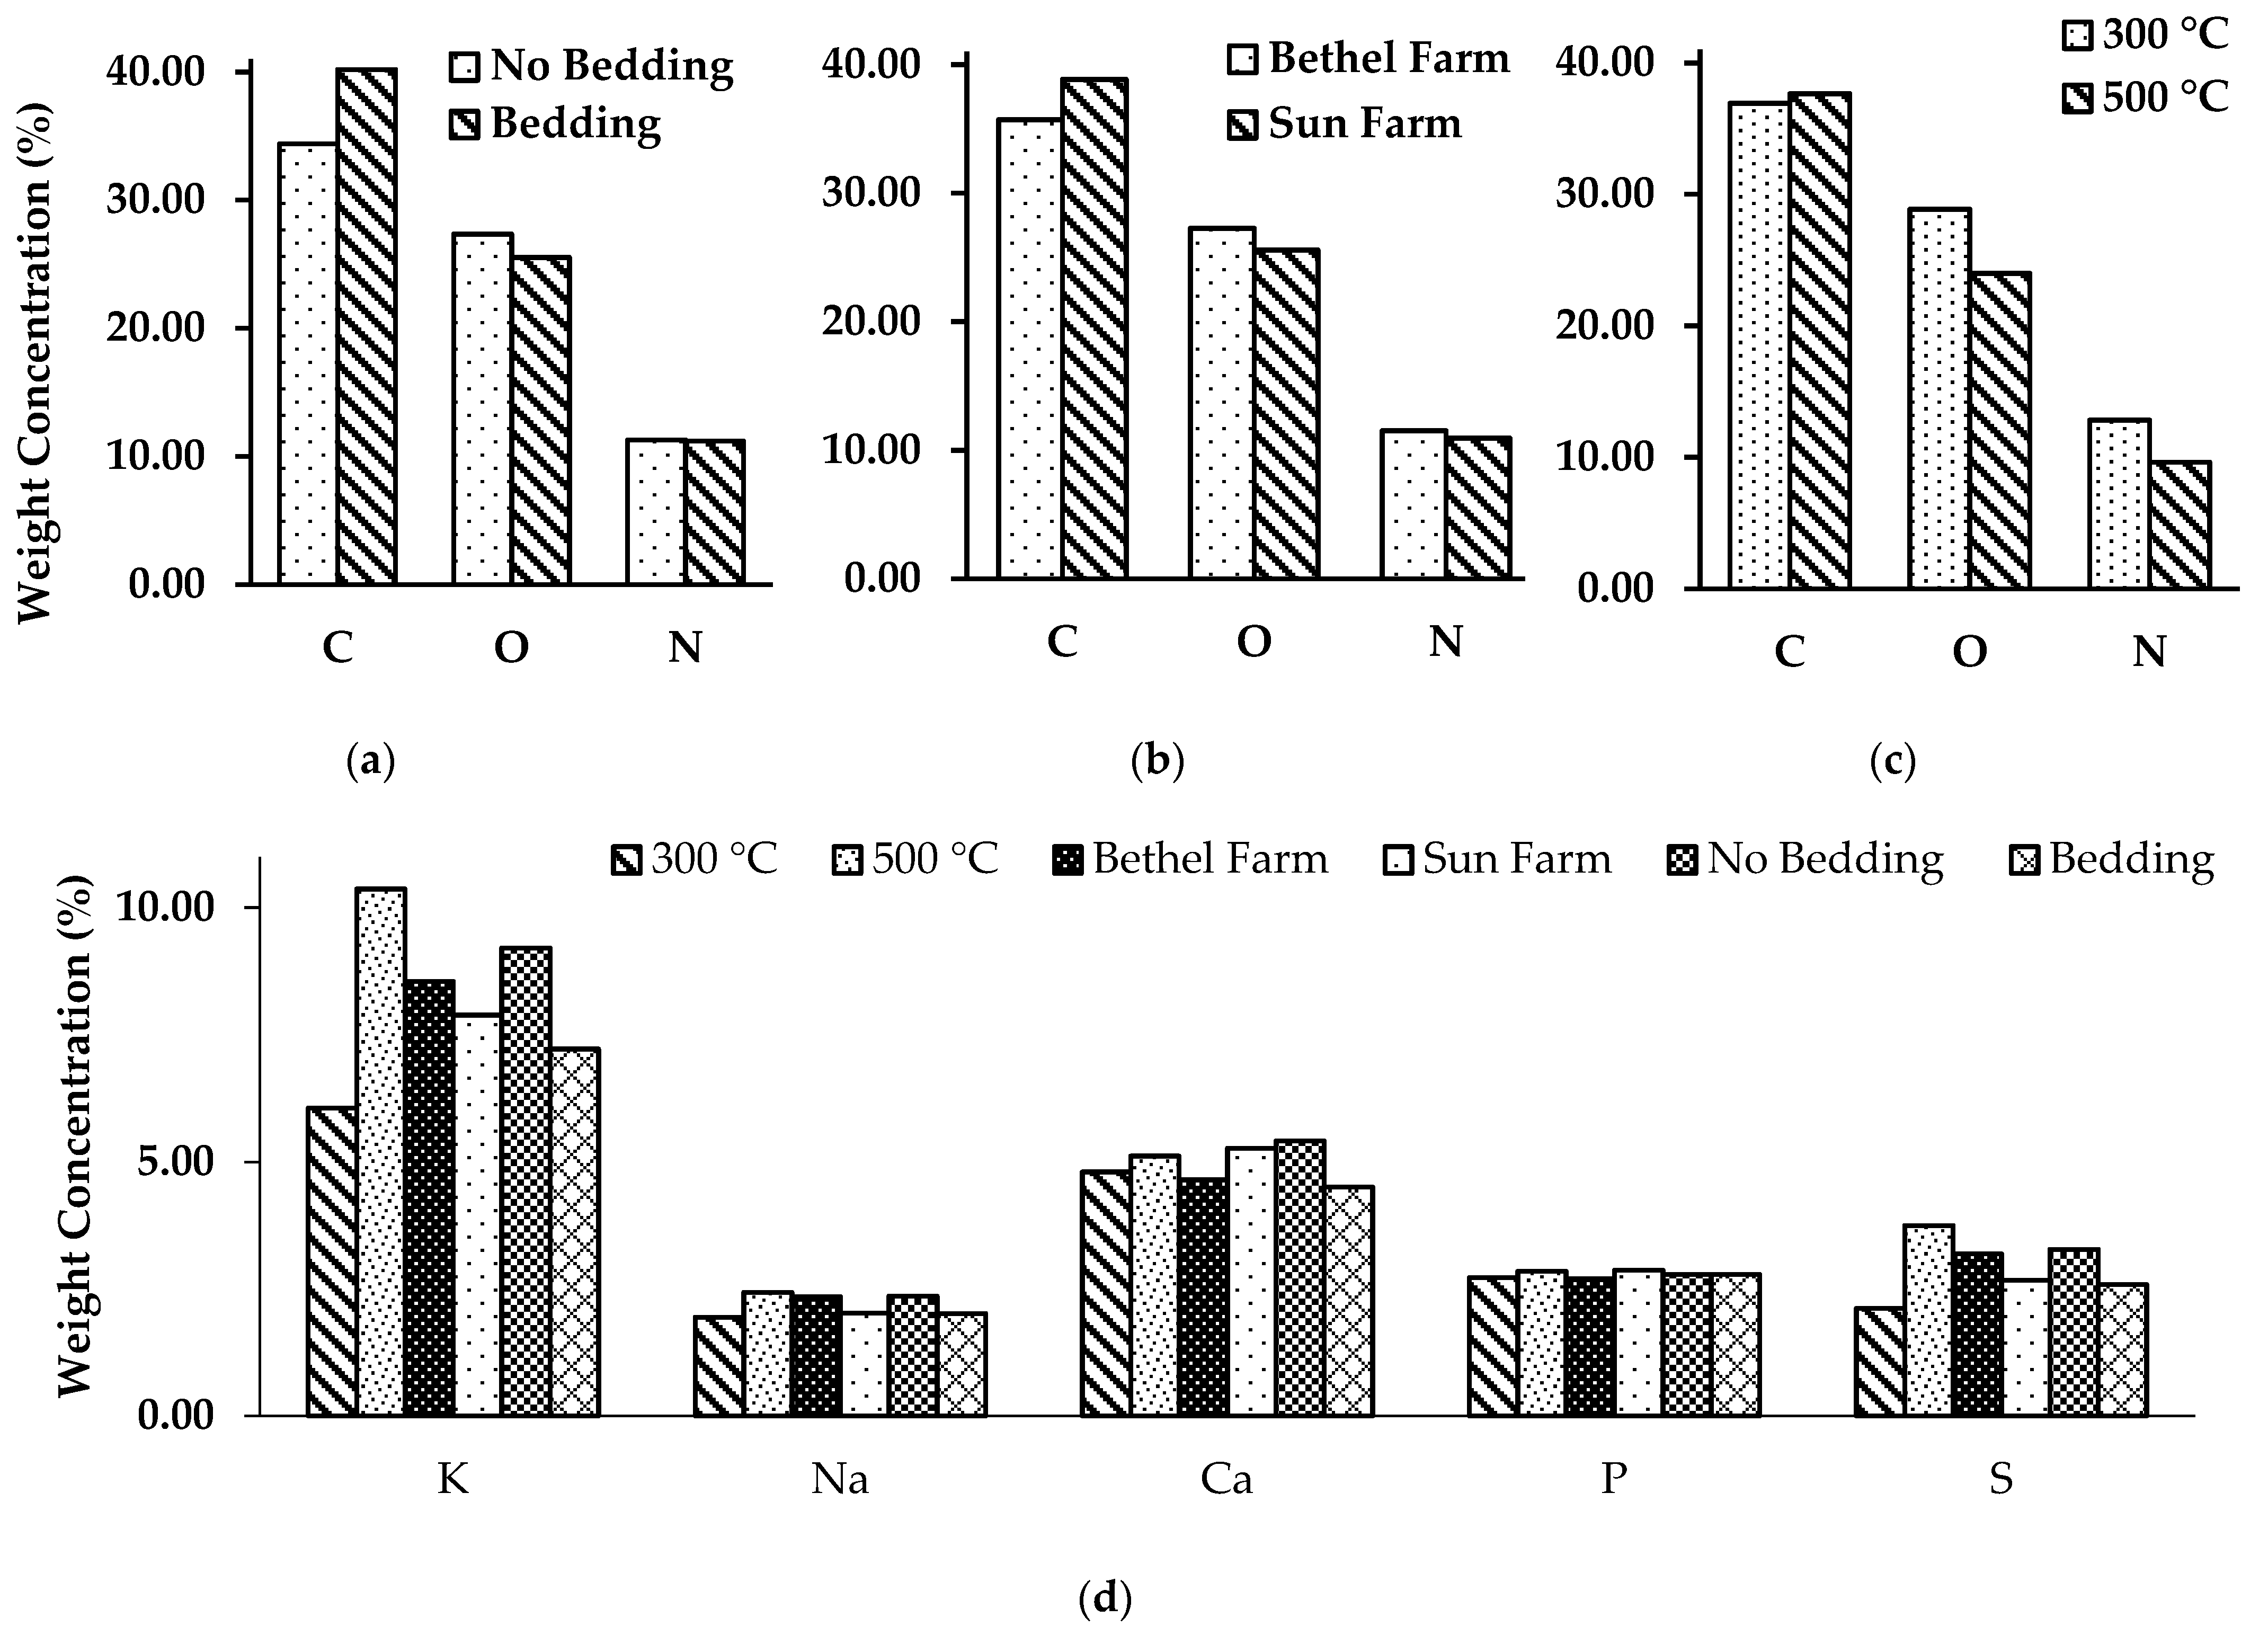
Elemental analysis of the eight produced PLB samples was conducted and the weight concentration (%) of each element is summarized in Table 3. In all PLB samples, carbon was found to be significantly higher in concentration compared to other compositions (28.7% to 47.7%). Oxygen was the second major element in PLB (19.16% to 30.58%), followed by N (8.84–13.63%), K (5.61–14.34%), P (1.89–3.5%), Ca (3.63–6.42%), and S (1.71–6.13%), and then other minor elements (Na, Cl, Mg, Si, Al). Compared with the relatively higher carbon content of 83.29% from wood biochar, PLB has much lower carbon content [41]. This indicates a larger number of inorganic compounds as minor elements may be present in the PLBs. The results indicate that the PLBs had relatively higher concentrations of NPKs that are three main nutrients for plant growth as well as for other important nutrients (e.g., Ca, S, Mg). PLB may be a good fertilizer for plants due to the higher concentration of nutrients in inorganic compounds.
Figure 5a,d confirms the addition of PS as bedding material in the PL feedstock can increase the carbon content and reduce the oxygen content of the PLB, since PS had a higher carbon and lower oxygen level, as shown in Table 1. The content of N and P changed slightly with the addition of PS. The content of S and some other inorganic compounds such as K, Na, and Ca decreased since PS was not the significant source of these elements. Figure 5b,d shows that the element compositions of PLB from different farms were very similar. The pyrolysis process can reduce the oxygen content and increase the carbon percentage of the sample, and a high pyrolysis temperature was favorable for this transaction. This trend is clearly shown in Figure 5c. The content of N was observed to be reduced due to the high pyrolysis temperature. Other element compositions increased, as shown in Figure 5d. The removal of volatile matter at a high pyrolysis temperature may effectively condense the inorganic elements in the PLBs.

3.3. pH and BIOCHAR Yield Calculations & Extractable Nutrient Analysis by Ion Exchange Resin Method

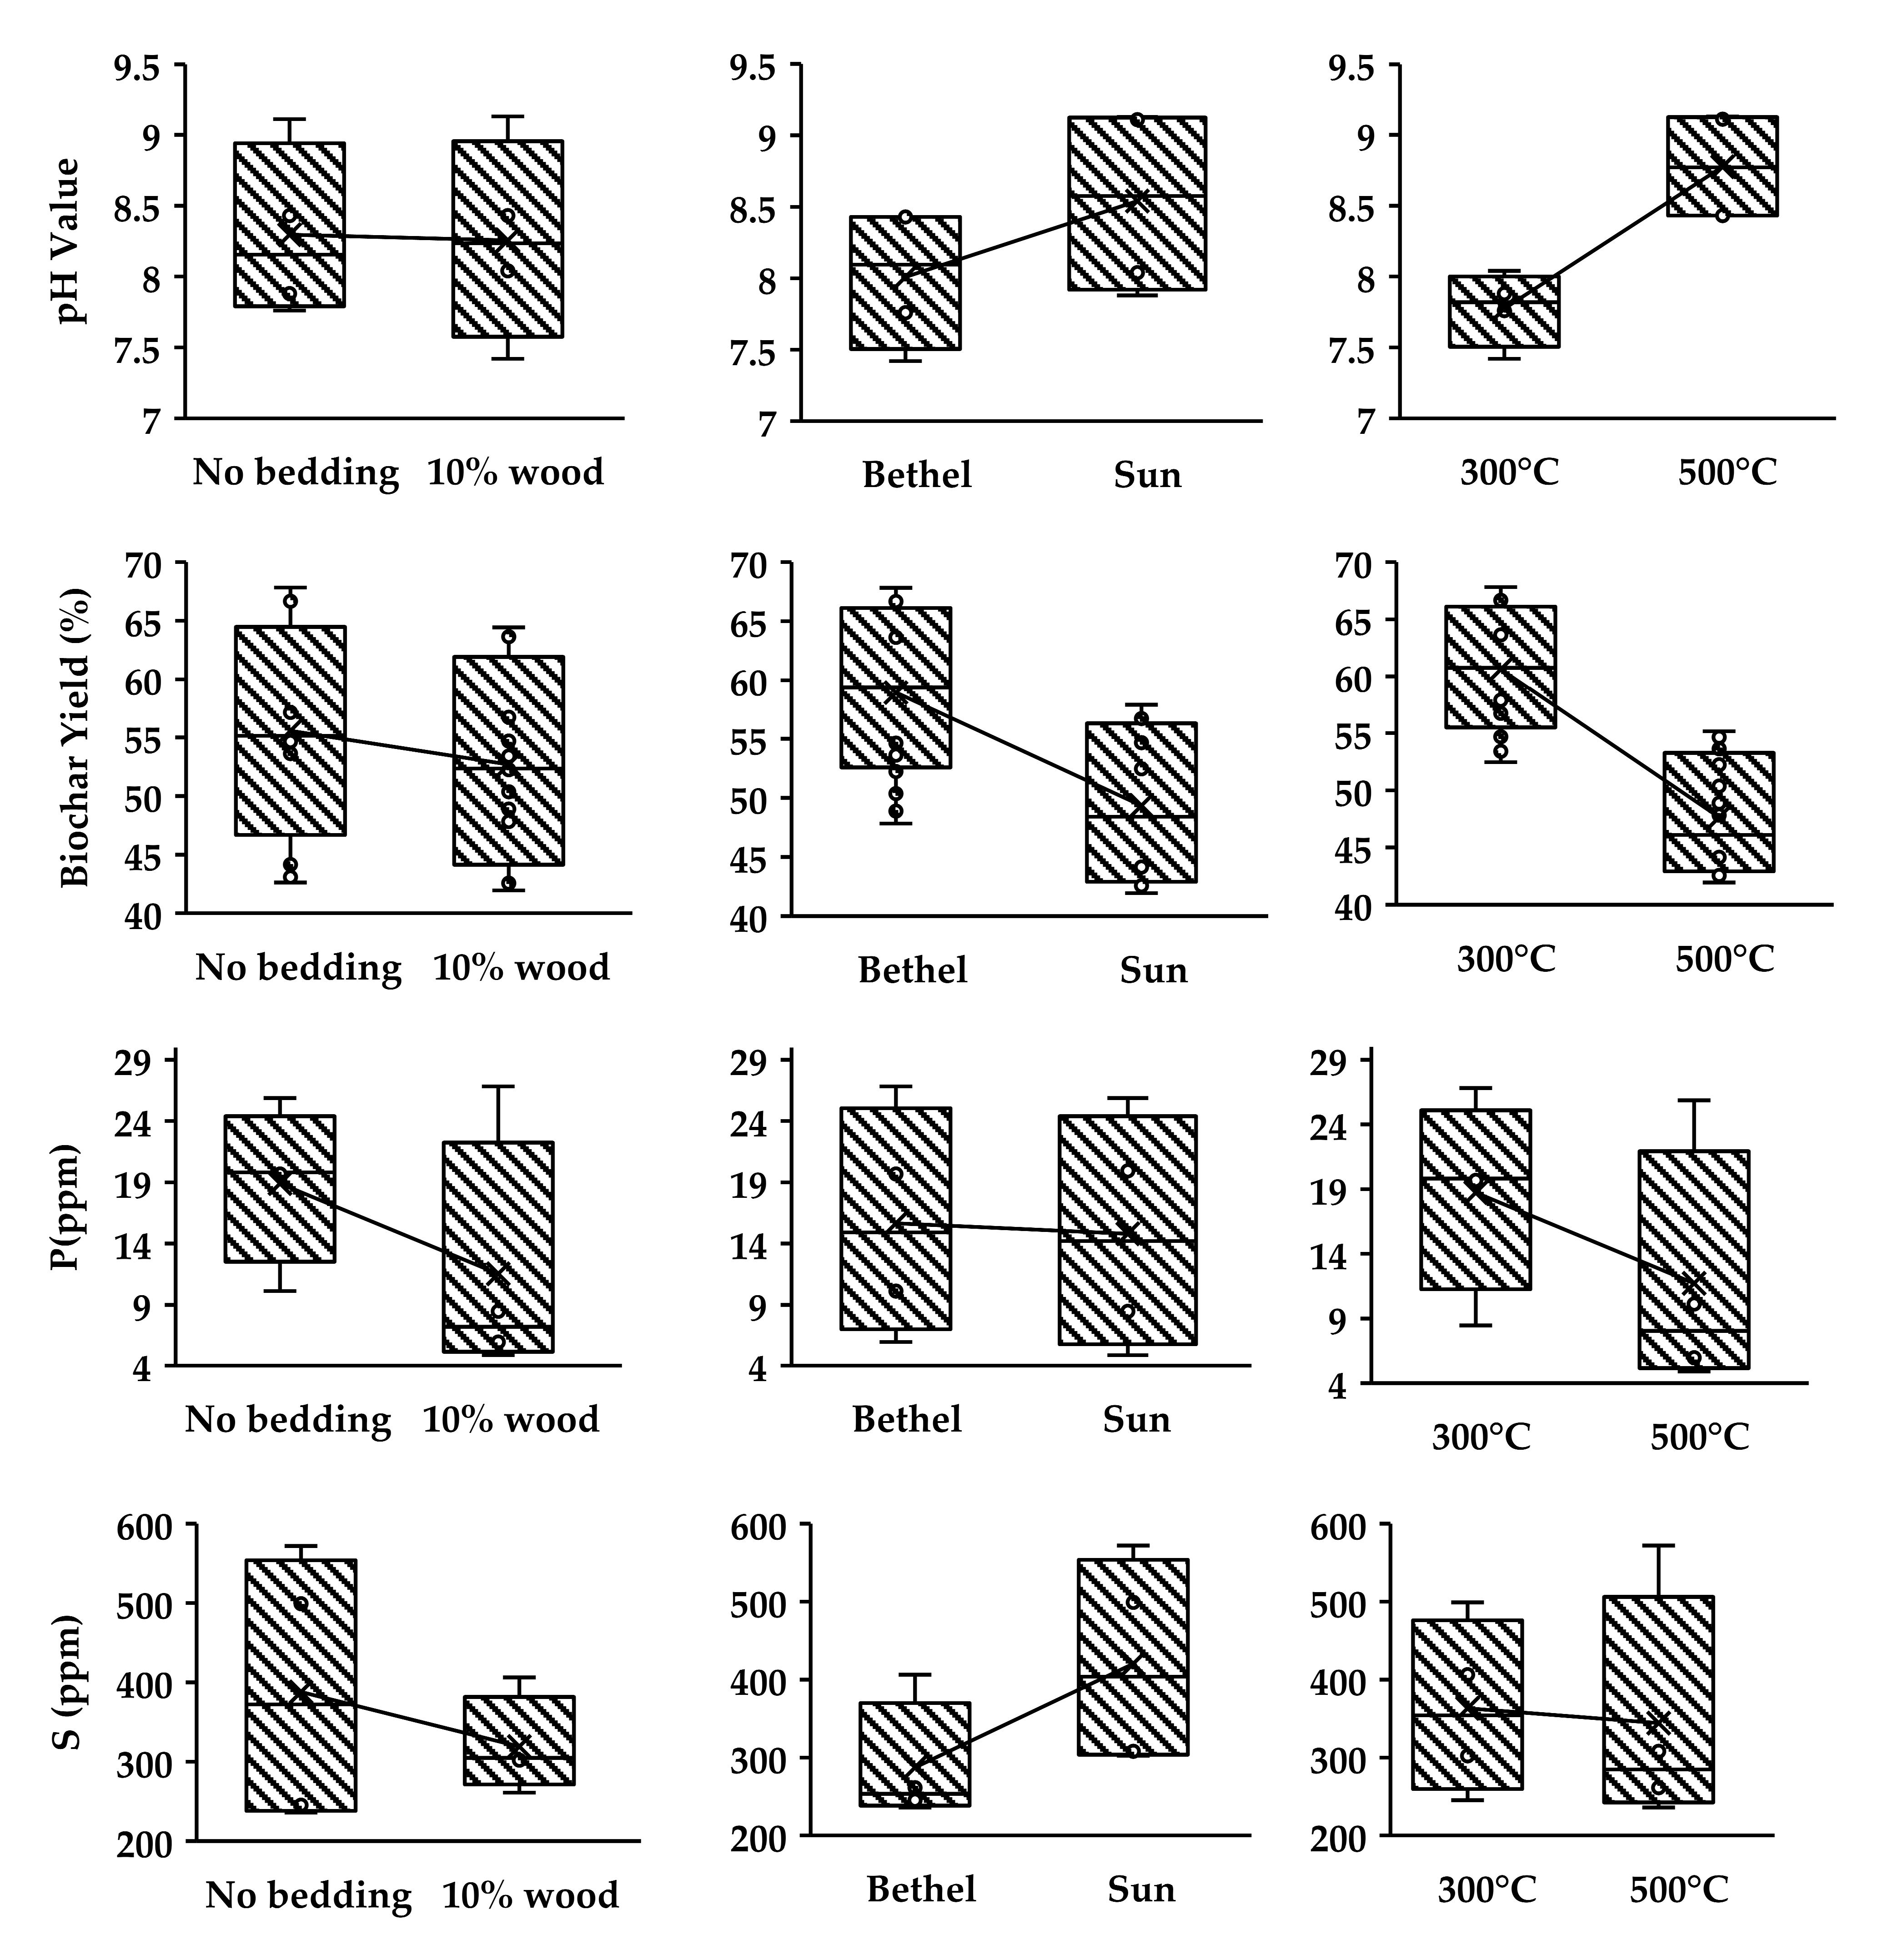
As shown in Figure 6, the effect of bedding material mixture (10% PS), PL source, and pyrolysis temperature on the pH value, PLB yield, and extractable nutrients of phosphorus and sulfur were investigated using a box-and-whisker plot. The results indicate that the addition of PS bedding material could potentially reduce the biochar yield. This can be explained by the feedstock compositions. According to the proximate and ultimate analysis (in Table 2), PS had higher VM (69.60% vs. 65.31 and 57.94%) and lower ash content (22.39% vs. 26.63 and 33.00%) than PL. Previous studies found that PS with a high VM portion was easy to decompose, which ultimately decreased the biochar yield during pyrolysis [25,26,50]. The addition of PS as bedding material could also potentially reduce extractable nutrients level of P and S as well because manure-based biochar usually has a lower surface area than biomass biochar. The reason is that larger pores present in PLB produce a small surface area compared to smaller pores in PS biochar [51]. The high surface area of PS within PLBs efficiently absorbed and reduced the P and S levels [51,52,53]. It can be also seen that PL collected from the Bethel Farm had about 10% higher PLB yield compared to the one from Sun Farm because of the high ash content of the PL feedstock from Bethel Farm (33% vs. 26.63%). Meanwhile, the difference of extractable P was very small, and the extractable S was significantly reduced (32%) when using PL from Bethel Farm to produce PLB because the original S content of Bethel Farm (1.43%) was smaller than that of Sun Farm (1.72%). This study also found that pyrolysis temperature plays a key role in changing the extractable phosphorus, sulfur, and PLB yield. PLB yield was reduced by 13% when the pyrolysis temperature increased from 300 °C to 500 °C, which is consistent with previous studies [26,27]. Meanwhile, a higher pyrolysis temperature can reduce the extractable P by 37% because the high temperature may help to transform labile P in raw PL into non-labile P in PLB. The pH test results found that the soil and PL from Sun Farm was slightly acidic and that the PLB samples were alkaline (pH 7.42–pH 9.13), which suggests that PLB can be selected as a liming agent. In addition, the pH value increased with the increased pyrolysis temperature, while adding PS as a bedding material had a minor influence on the pH level of the samples. Based on the results, the PL from Sun Farm, with a high pyrolysis temperature, will be suggested while using PLB as a liming agent. For further control of the surface runoff of P, adding bedding material and using a pyrolysis temperature of 500 °C is suggested.
Soil samples from uncultivated land near Bethel Farm were collected and tested to evaluate the nutrition level of the Chesapeake Bay area (there was no PL fertilizer directly applied to this land). According to Table 4, this soil sample had a low concentration of N and K, and high concentrations of P, compared with the optimal range suggested by Predictive Nutrient Solutions, Inc. (Walla Walla, WA, USA). The high concentration of P may have been from the phosphorus-rich PL because the poultry farm and PL shed is only about 100 m away from the location where the soil samples were collected. The P level was 586.6% higher than the upper limit of the optional range. PL should not be applied to these lands directly. The PL sample from Sun Farm was also tested. A P level 178.8% higher than the upper limit of the optional range was detected. The total N level was also higher than the optional range. Therefore, the direct application of PL to land may add unnecessary N and P to the soil and trigger runoff from heavy rains.
As shown in Table 4, the average extractable P and N levels were greatly reduced by converting PL into PLB (P from 55.74 ppm to 15.23 ppm, N from 69.13 ppm to 3.44 ppm). The average N concentration of the PLB samples was only 5.67% of the upper limit of the optional level of N (60 ppm), while the PL sample from Sun Farm was 115.22% of the upper limit. The average P concentration of the PLB samples was only 76% of the upper limit of the optional level of P (20 ppm), while the PL sample from Sun Farm and the soil sample were 278.7% and 686.6% of the upper limit, respectively. Extractable nutrients refer to the amount of nutrients that can be extracted from the soil solution and is ready for plant uptake. It is one of the most important measured characteristics of PLB as a soil amendment. However, this nutrition can be the source of nutrient runoff. The high N and P levels of the PL and soil samples are highly likely to cause surface runoff. This result shows the possibility of N and P nutrient runoff reduction into the watershed by using the processed PLB in the soil instead of direct land application of PL. In addition, increased K and S concentrations in PLB-applied soil indicate the potential for PLB to be used as fertilizer. Furthermore, PLB also contains traceable elements, including magnesium (Mg), calcium (Ca), iron (Fe), manganese (Mn), and potassium (K), which are the traceable elements necessary for plant growth [26]. Compared with PL, the nutrients of PLB were more stable and decomposed slowly. Thus, the nutrient loss can be reduced, and PLB can also supply available nutrients for a long time. N in PL carbonized at 500 °C is not plant-available [54]. Hydrolysable organic N decreases with higher pyrolysis temperature [55]. A previous study compared the P release behaviors of PLB as a soil amendment versus that of raw PL and found that the water-soluble P levels were 2.95 g/kg in raw PL vs. 0.17 g/kg in PLB. The pyrolysis process transformed labile P in raw PL to non-labile P in biochar. The release of P from PL biochar in both water and neutral soils was observed to be at a slower and steadier rate over a longer period [53]. A more recent study also concluded that PLB soil amendment affects microbial community structures, increases P-mobilizing bacteria, and promotes P cycling, which improved the growth of barley [52]. Our test data are consistent with the previous study confirming that using PLB as a soil amendment may reduce nutrient runoff, especially P runoff. This study further suggested that PL from Bethel Farm could produce better-quality PLB at a higher pyrolysis temperature and bedding material mixture than the control nutrient.

3.4. BET Surface

As shown in Table 5 and Figure 7, the increment in pore volume and area for PLB1 (Bethel Farm, 300 °C), PLB2 (Bethel Farm, 500 °C), PLB5 (Sun Farm, 300 °C), and PLB6 (Sun Farm, 500 °C) was measured. The results show that both pore volume and pore area increased when the temperature increased from 300 °C to 500 °C. For PLB generated from Bethel Farm (PLB 1 and 2), the pore area increased by 229.8% (from 5.71 m2/g to 18.82 m2/g), and the pore volume increased 200.54% (from 0.0196 m3/g to 0.0589 m3/g). However, the average pore diameter decreased by 6.3% (from 13.59 nm to 12.74 nm). For PLB produced on Sun Farm (PLB 5 and 6), the pore area increased only 37.8% (from 5.3 m2/g to 7.31 m2/g) and the pore volume increased 15.5% (from 0.0219 m3/g to 0.0253 m3/g). The average pore diameter decreased 13.0% (from 16.54 nm to 14.39 nm). Our results indicate that the pyrolysis temperature positively affected the pore area, pore volume, and pore size distribution of PLB. The increment in both pore volume and area was due to the removal of volatile matter, thus producing more pore openings. The average pore diameter decreased with the increased pyrolysis temperature, which may be explained by the decreased pore size due to structural shrinkage and pore narrowing and increased quantity of small-sized pores [56]. This study observed that the PL samples from Bethel Farm had a much smaller pore size, which guarantees thorough removal of volatile matter and generates more openings.
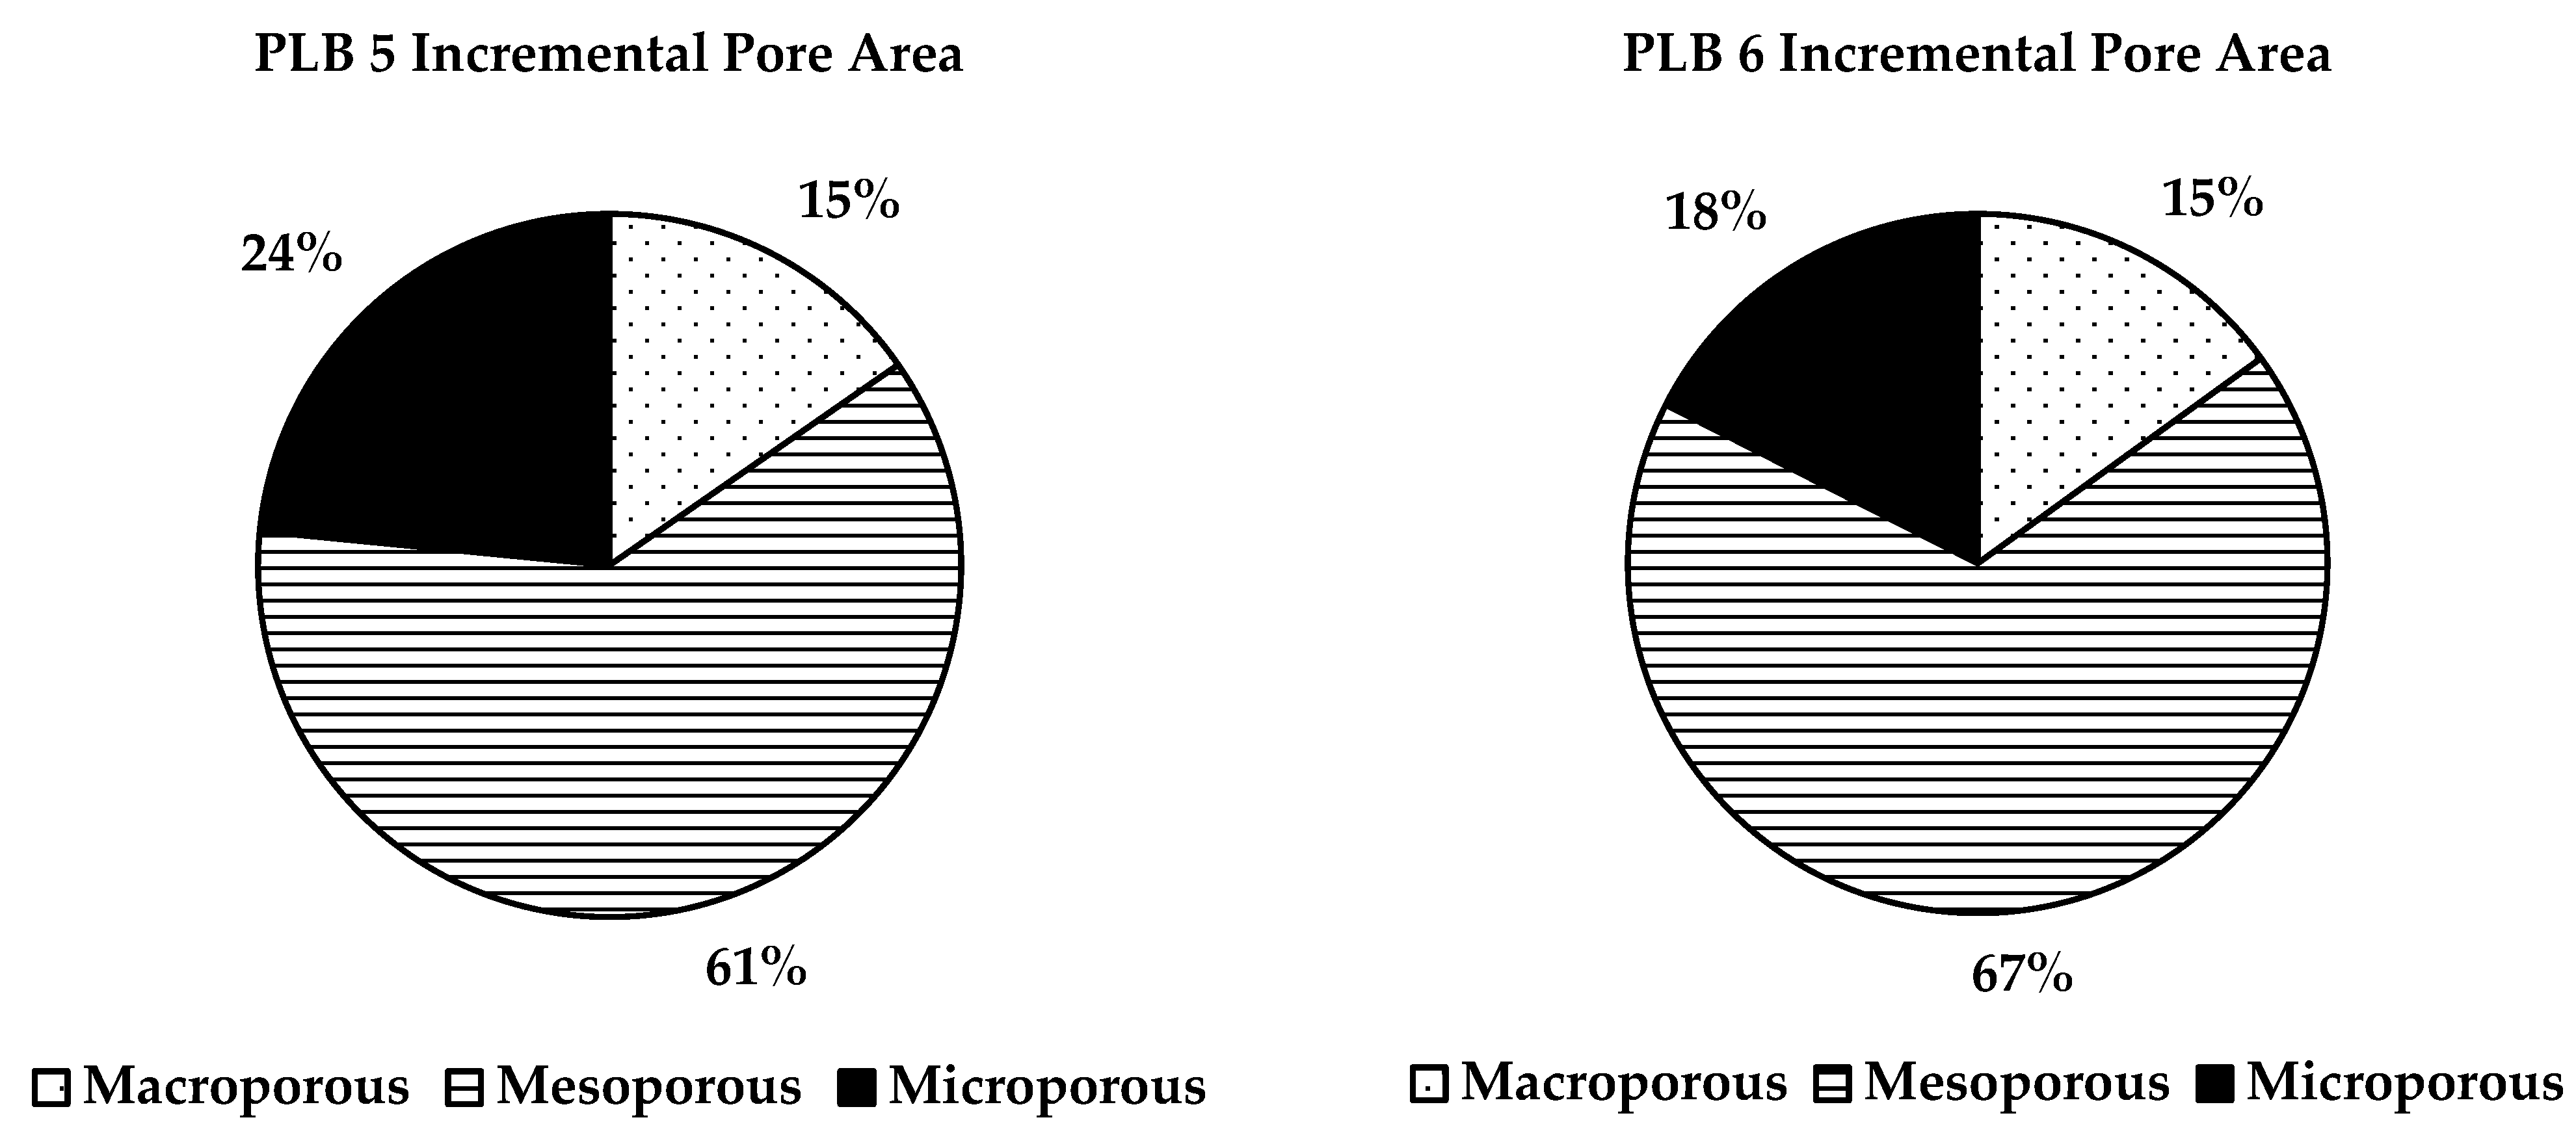
According to the percentage distribution of pore size (three levels) (Figure 8), when pyrolysis temperature changed from 300 °C to 500 °C, the percentage of micropores (<2 nm) decreased from 19% to 10% and 24% to 18% for PL from Bethel Farm and Sun Farm, respectively. In the meantime, the percentage of mesopores (2–50 nm) increased from 74% to 82% and 61% to 67% for PL from Bethel Farm and Sun Farm, respectively. However, the change in the percentage of macro-pores (>50 nm) was not significant compared to that of the mesopores and micropores. The pore size distributions of PLB differed from biochar derived from biomass materials. A previous study found that the biomass of biochar-activated carbon showed a narrow monomodal distribution that was centered in the microporous range. The average pore diameters were between 2.01 nm and 4.15 nm [57]. The pores of biomass-derived biochar originate from the cellular structure of the raw materials, and manure-based biochar has a more versatile pore structure and thus a wider pore size distribution. Manure-based biochar has a lower surface area than biomass biochar. The reason is that the larger pores present in PL biochar produce a small surface area compared to the smaller pores in biomass biochar [51].

4. Conclusions

There is a critical need for more efficient, cost-effective, and sustainable PL conversion technologies due to nutrient runoff and water pollution in the watershed from excess direct land application. In this study, a systematic framework was used to evaluate PL and PLB from a qualitative and quantitative perspective. Proximate and ultimate analyses were used to identify the fuel property difference between one PS and two PL samples generated from different farms. This study confirmed morphology and pore structure were significantly affected by pyrolysis temperature and PL source. In particular, the pore volume and surface area of PLB increased significantly due to the difference in bulk size and VM between the PL samples collected from Bethel Farm compared to those collected from Sun Farm. The addition of PS as a bedding material can potentially generate PLB with a small number of extractable nutrients (e.g., P, S, K, Ca, etc.). The PL sample from Sun Farm had a high P level of 178.8% and an N level of 15.0% higher than the suggested range of P and N in soil. After pyrolysis, the average P and N levels were greatly reduced from 55.74 ppm to 15.23 ppm and from 69.13 ppm to 3.44 ppm, respectively. This study also found that PLB from Sun Farm had a higher pH value, which is appropriate for the acidic soil, and the lower P content mitigates runoff reduction. These test results confirm hydrolysable organic N decreases with higher pyrolysis temperature and the pyrolysis process transforms labile P in raw PL into non-labile P in PLB. This study showed the possibility of N and P nutrient runoff reduction in the watershed by using processed PLB in the soil instead of direct land application of PL. In a future study, performance of the produced PLBs as a soil amendment and effects on plant growth will be investigated. A wide range of feedstocks and bedding materials will also be considered to provide more comprehensive insights into the variability of PLB properties and qualities. In addition, life cycle analysis and process optimization should be performed to demonstrate the efficient poultry litter conversion process and close the loops for the circular economy.

Author Contributions

Conceptualization, X.Q. and Y.Y.; methodology, Y.Y. and X.Q.; experiment and data analysis, Y.Y., S.O.A. and K.B.; writing—original draft preparation, Y.Y.; writing—review and editing, X.Q., D.-H.K. and S.W.L.; supervision, D.-H.K. and S.W.L.; funding acquisition, S.W.L., D.-H.K. and X.Q. All authors have read and agreed to the published version of the manuscript.

Funding

This research was supported and funded by the National Science Foundation’s Excellence in Research Program, Division of Chemical, Bioengineering, Environmental and Transport Systems (CBET), Directorate for Engineering (ENG), granted under award number 2200616.

Data Availability Statement

The original contributions presented in the study are included in the article, further inquiries can be directed to the corresponding author.

Acknowledgments

The author (Yulai Yang) would like to acknowledge the Morgan State University School of Graduate Studies for providing tuition support for this graduate research study. This author also wishes to acknowledge the support received from the research team members at the Center for Advanced Energy Systems and Environmental Control Technologies (CAESECT) Lab and the guidance received from the lab director.

Conflicts of Interest

The authors declare no conflicts of interest.

References

  1. Qian, X.; Lee, S.; Chandrasekaran, R.; Yang, Y.; Caballes, M.; Alamu, O.; Chen, G. Electricity evaluation and emission characteristics of poultry litter co-combustion process. Appl. Sci. 2019, 9, 4116. [Google Scholar] [CrossRef]
  2. Parker, D.D.; Lichtenberg, E. Impacts of agricultural nutrient regulation in a heterogeneous region. In Proceedings of the American Agricultural Economics Association Annual Meeting, Denver, CO, USA, 1–4 July 2004. [Google Scholar]
  3. Tabeling, K. Delaware’s Chicken Industry Breaks $5B Sales. Delaware Business Times. 9 March 2023. Available online: https://delawarebusinesstimes.com/news/delawares-chicken-5b-sales/ (accessed on 6 January 2024).
  4. Lynch, D.; Henihan, A.M.; Bowen, B.; Lynch, D.; McDonnell, K.; Kwapinski, W.; Leahy, J.J. Utilisation of poultry litter as an energy feedstock. Biomass Bioenergy 2013, 49, 197–204. [Google Scholar] [CrossRef]
  5. Dalólio, F.S.; da Silva, J.N.; de Oliveira, A.C.C.; Tinôco, I.D.F.F.; Barbosa, R.C.; de Oliveira Resende, M.; Albino, L.F.T.; Coelho, S.T. Poultry litter as biomass energy: A review and future perspectives. Renew. Sustain. Energy Rev. 2017, 76, 941–949. [Google Scholar] [CrossRef]
  6. Kelleher, B.P.; Leahy, J.J.; Henihan, A.M.; O’dwyer, T.F.; Sutton, D.; Leahy, M.J. Advances in poultry litter disposal technology–a review. Bioresour. Technol. 2002, 83, 27–36. [Google Scholar] [CrossRef] [PubMed]
  7. Perera, P.; Bandara, W. Potential of Using Poultry Litter as a Feedstock for Energy Production; Louisiana Forest Product Development Center: Baton Rouge, LA, USA, 2010. [Google Scholar]
  8. Lamm, M.; Markow, L.; Bernhardt, C.; Pelton, T. Blind Eye to Big Chicken. The Environmental Integrity Project, 28 October 2021. [Google Scholar]
  9. Kim, S.S.; Agblevor, F.A.; Lim, J. Fast pyrolysis of chicken litter and turkey litter in a fluidized bed reactor. J. Ind. Eng. Chem. 2009, 15, 247–252. [Google Scholar] [CrossRef]
  10. Mohan, D.; Pittman, C.U., Jr.; Steele, P.H. Pyrolysis of wood/biomass for bio-oil: A critical review. Energy Fuels 2006, 20, 848–889. [Google Scholar] [CrossRef]
  11. Van der Drift, A.; Boerrigter, H. Synthesis Gas from Biomass for Fuels and Chemicals; ECN Biomass, Coal and Environmental Research: Petten, The Netherlands, 2006; pp. 1–31. [Google Scholar]
  12. Chan, K.Y.; Van Zwieten, L.; Meszaros, I.; Downie, A.; Joseph, S. Agronomic values of greenwaste biochar as a soil amendment. Soil Res. 2007, 45, 629–634. [Google Scholar] [CrossRef]
  13. Zolfi Bavariani, M.; Ronaghi, A.; Ghasemi, R. Influence of pyrolysis temperatures on FTIR analysis, nutrient bioavailability, and agricultural use of poultry manure biochars. Commun. Soil Sci. Plant Anal. 2019, 50, 402–411. [Google Scholar] [CrossRef]
  14. Ahmad, M.; Rajapaksha, A.U.; Lim, J.E.; Zhang, M.; Bolan, N.; Mohan, D.; Ok, Y.S. Biochar as a sorbent for contaminant management in soil and water: A review. Chemosphere 2014, 99, 19–33. [Google Scholar] [CrossRef]
  15. Brassard, P.; Godbout, S.; Lévesque, V.; Palacios, J.H.; Raghavan, V.; Ahmed, A.; Hogue, R.; Jeanne, T.; Verma, M. Biochar for soil amendment. In Char and Carbon Materials Derived from Biomass; Elsevier: Amsterdam, The Netherlands, 2019; pp. 109–146. [Google Scholar]
  16. Cheng, S.; Chen, T.; Xu, W.; Huang, J.; Jiang, S.; Yan, B. Application research of biochar for the remediation of soil heavy metals contamination: A review. Molecules 2020, 25, 3167. [Google Scholar] [CrossRef]
  17. Lima, I.M.; Ro, K.S.; Reddy, G.B.; Boykin, D.L.; Klasson, K.T. Efficacy of chicken litter and wood biochars and their activated counterparts in heavy metal clean up from wastewater. Agriculture 2015, 5, 806–825. [Google Scholar] [CrossRef]
  18. Park, J.H.; Choppala, G.; Lee, S.J.; Bolan, N.; Chung, J.W.; Edraki, M. Comparative sorption of Pb and Cd by biochars and its implication for metal immobilization in soils. Water Air Soil Pollut. 2013, 224, 1711. [Google Scholar] [CrossRef]
  19. Sri Shalini, S.; Palanivelu, K.; Ramachandran, A.; Raghavan, V. Biochar from biomass waste as a renewable carbon material for climate change mitigation in reducing greenhouse gas emissions—A review. Biomass Convers. Biorefinery 2021, 11, 2247–2267. [Google Scholar] [CrossRef]
  20. Man, K.Y.; Chow, K.L.; Man, Y.B.; Mo, W.Y.; Wong, M.H. Use of biochar as feed supplements for animal farming. Crit. Rev. Environ. Sci. Technol. 2021, 51, 187–217. [Google Scholar] [CrossRef]
  21. Sun, W.; Zhang, S.; Su, C. Impact of biochar on the bioremediation and phytoremediation of heavy metal (loid)s in soil. In Advances in Bioremediation and Phytoremediation; IntechOpen: London, UK, 2018; Volume 149. [Google Scholar]
  22. Ippolito, J.A.; Spokas, K.A.; Novak, J.M.; Lentz, R.D.; Cantrell, K.B. Biochar elemental composition and factors influencing nutrient retention. In Biochar for Environmental Management; Routledge: London, UK, 2015; pp. 139–163. [Google Scholar]
  23. Gaskin, J.W.; Steiner, C.; Harris, K.; Das, K.C.; Bibens, B. Effect of low-temperature pyrolysis conditions on biochar for agricultural use. Trans. ASABE 2008, 51, 2061–2069. [Google Scholar] [CrossRef]
  24. Joardar, J.C.; Mondal, B.; Sikder, S. Comparative study of poultry litter and poultry litter biochar application in the soil for plant growth. SN Appl. Sci. 2020, 2, 1770. [Google Scholar] [CrossRef]
  25. Tripathi, M.; Sahu, J.N.; Ganesan, P. Effect of process parameters on production of biochar from biomass waste through pyrolysis: A review. Renew. Sustain. Energy Rev. 2016, 55, 467–481. [Google Scholar] [CrossRef]
  26. Song, W.; Guo, M. Quality variations of poultry litter biochar generated at different pyrolysis temperatures. J. Anal. Appl. Pyrolysis 2012, 94, 138–145. [Google Scholar] [CrossRef]
  27. Tsai, C.C.; Chang, Y.F. Quality evaluation of poultry litter biochar produced at different pyrolysis temperatures as a sustainable management approach and its impact on soil carbon mineralization. Agronomy 2021, 11, 1692. [Google Scholar] [CrossRef]
  28. Pereira, M.E.; Varanda, L.D.; de Carvalho, N.R.; Sette, C.R., Jr.; de Padua, F.A.; De Conti, A.C.; Yamaji, F.M. Biochar produced from poultry litter waste. Res. Soc. Dev. 2021, 10, e351101119704. [Google Scholar] [CrossRef]
  29. Clarke, J.; Olea, M. The Effect of Temperature and Treatment Regime on the Physical, Chemical, and Biological Properties of Poultry Litter Biochar. Preprints 2024, 2024030998. [Google Scholar] [CrossRef]
  30. ASTM D5373; Standard Test Methods for Instrumental Determination of Carbon, Hydrogen, and Nitrogen in Laboratory Samples of Coal and Coke. ASTM International: West Conshohocken, PA, USA, 2021.
  31. ASTM D3302; Standard Test Method for Total Moisture in Coal. ASTM International: West Conshohocken, PA, USA, 2010.
  32. ASTM D3173; Standard Test Method for Moisture in the Analysis Sample of Coal and Coke. ASTM International: West Conshohocken, PA, USA, 2017.
  33. ASTM D3174; Standard Test Method for Ash in the Analysis Sample of Coal and Coke from Coal. ASTM International: West Conshohocken, PA, USA, 2020.
  34. ASTM D3175; Standard Test Method for Volatile Matter in the Analysis Sample of Coal and Coke. ASTM International: West Conshohocken, PA, USA, 2020.
  35. ASTM D5865; Standard Test Method for Gross Calorific Value of Coal and Coke. ASTM International: West Conshohocken, PA, USA, 2019.
  36. ASTM D5864; Standard Test Method for Determining Aerobic Aquatic Biodegradation of Lubricants or Their Components. ASTM International: West Conshohocken, PA, USA, 2023.
  37. Brunauer, S.; Emmett, P.H.; Teller, E. Adsorption of gases in multimolecular layers. J. Am. Chem. Soc. 1938, 60, 309–319. [Google Scholar] [CrossRef]
  38. ISO 9277; Determination of the Specific Surface Area of Solids by Gas Adsorption—BET Method. International Standard Organization: Geneva, Switzerland, 2022.
  39. Singh, S.V.; Chaturvedi, S.; Dhyani, V.C.; Kasivelu, G. Pyrolysis temperature influences the characteristics of rice straw and husk biochar and sorption/desorption behaviour of their biourea composite. Bioresour. Technol. 2020, 314, 123674. [Google Scholar]
  40. ASTM D4972; Standard Test Method for pH of Soils. ASTM International: West Conshohocken, PA, USA, 2019.
  41. Skogley, E.O. The universal bioavailability environment/soil test unibest. Commun. Soil Sci. Plant Anal. 1992, 23, 2225–2246. [Google Scholar] [CrossRef]
  42. Bolan, N.; Sarmah, A.K.; Bordoloi, S.; Bolan, S.; Padhye, L.P.; Van Zwieten, L.; Sooriyakumar, P.; Khan, B.A.; Ahmad, M.; Solaiman, Z.M.; et al. Soil acidification and the liming potential of biochar. Environ. Pollut. 2023, 317, 120632. [Google Scholar] [CrossRef] [PubMed]
  43. Masud, M.M.; Abdulaha-Al Baquy, M.; Akhter, S.; Sen, R.; Barman, A.; Khatun, M.R. Liming effects of poultry litter derived biochar on soil acidity amelioration and maize growth. Ecotoxicol. Environ. Saf. 2020, 202, 110865. [Google Scholar] [CrossRef] [PubMed]
  44. Domingues, R.R.; Trugilho, P.F.; Silva, C.A.; Melo, I.C.N.D.; Melo, L.C.; Magriotis, Z.M.; Sanchez-Monedero, M.A. Properties of biochar derived from wood and high-nutrient biomasses with the aim of agronomic and environmental benefits. PLoS ONE 2017, 12, e0176884. [Google Scholar] [CrossRef] [PubMed]
  45. IBI-STD-2.1; Standardized Product Definition and Product Testing Guidelines for Biochar That Is Used in Soil. International Biochar Initiative: Canandaigua, NY, USA, 2015; p. 23.
  46. Kim, P.; Johnson, A.; Edmunds, C.W.; Radosevich, M.; Vogt, F.; Rials, T.G.; Labbé, N. Surface functionality and carbon structures in lignocellulosic-derived biochars produced by fast pyrolysis. Energy Fuels 2011, 25, 4693–4703. [Google Scholar] [CrossRef]
  47. Tang, M.M.; Bacon, R. Carbonization of cellulose fibers—I. Low temperature pyrolysis. Carbon 1964, 2, 211–220. [Google Scholar] [CrossRef]
  48. Nanda, S.; Mohanty, P.; Pant, K.K.; Naik, S.; Kozinski, J.A.; Dalai, A.K. Characterization of North American lignocellulosic biomass and biochars in terms of their candidacy for alternate renewable fuels. Bioenergy Res. 2013, 6, 663–677. [Google Scholar] [CrossRef]
  49. Fu, P.; Hu, S.; Xinag, J.; Sun, L.; Yang, T.; Zhang, A.; Wang, Y.; Chen, G. Effects of pyrolysis temperature on characteristics of porosity in biomass chars. In Proceedings of the 2009 International Conference on Energy and Environment Technology, Guilin, China, 16–18 October 2009; Volume 1, pp. 109–112. [Google Scholar]
  50. Huang, H.; Reddy, N.G.; Huang, X.; Chen, P.; Wang, P.; Zhang, Y.; Huang, Y.; Lin, P.; Garg, A. Effects of pyrolysis temperature, feedstock type and compaction on water retention of biochar amended soil. Sci. Rep. 2021, 11, 7419. [Google Scholar] [CrossRef]
  51. Keskinen, R.; Hyväluoma, J.; Sohlo, L.; Help, H.; Rasa, K. Fertilizer and soil conditioner value of broiler manure biochars. Biochar 2019, 1, 259–270. [Google Scholar] [CrossRef]
  52. Deinert, L.; Hossen, S.; Ikoyi, I.; Kwapinksi, W.; Noll, M.; Schmalenberger, A. Poultry litter biochar soil amendment affects microbial community structures, promotes phosphorus cycling and growth of barley (Hordeum vulgare). Eur. J. Soil Biol. 2024, 120, 103591. [Google Scholar] [CrossRef]
  53. Wang, Y.; Lin, Y.; Chiu, P.C.; Imhoff, P.T.; Guo, M. Phosphorus release behaviors of poultry litter biochar as a soil amendment. Sci. Total Environ. 2015, 512, 454–463. [Google Scholar] [CrossRef] [PubMed]
  54. Steiner, C.; Harris, K.; Gaskin, J.; Das, K.C. The nitrogen contained in carbonized poultry litter is not plant available. Open Agric. 2018, 3, 284–290. [Google Scholar] [CrossRef]
  55. Clough, T.J.; Condron, L.M.; Kammann, C.; Müller, C. A review of biochar and soil nitrogen dynamics. Agronomy 2013, 3, 275–293. [Google Scholar] [CrossRef]
  56. Yang, C.; Liu, J.; Lu, S. Pyrolysis temperature affects pore characteristics of rice straw and canola stalk biochars and biochar-amended soils. Geoderma 2021, 397, 115097. [Google Scholar] [CrossRef]
  57. Oginni, O.; Singh, K.; Oporto, G.; Dawson-Andoh, B.; McDonald, L.; Sabolsky, E. Effect of one-step and two-step H3PO4 activation on activated carbon characteristics. Bioresour. Technol. Rep. 2019, 8, 100307. [Google Scholar] [CrossRef]
Figure 1. Benchtop pyrolysis process.
Energies 17 02885 g001
Figure 2. Schematic diagram of fuel property testing instruments.
Energies 17 02885 g002
Figure 3. A van Krevelen diagram of samples.
Energies 17 02885 g003
Figure 4. SEM images of PLB at 300 °C and 500 °C (PLB 1 to PLB 8).
Energies 17 02885 g004aEnergies 17 02885 g004b
Figure 5. Effect of PL properties and pyrolysis on elemental composition (a) Bedding Material, (b) Farm Source, (c) Temperature, (d) Minor Elements.
Energies 17 02885 g005
Figure 6. Box-and-whisker plot for pH value, phosphorus, and sulfur yield based on various factors.
Energies 17 02885 g006
Figure 7. Incremental pore volume and area for PLB 1, PLB 2, PLB 5, and PLB 6.
Energies 17 02885 g007aEnergies 17 02885 g007b
Figure 8. Change in macro-pores, mesopores, and micropores in PLB 1, PLB 2, PLB 5, and PLB 6.
Energies 17 02885 g008aEnergies 17 02885 g008b
Table 1. Summary of experimental conditions to prepare 8 PLBs.
Experimental ConditionPL SourceBeddingReaction
Temperature
Serial No.
1BethelNo bedding300 °CPLB 1
2BethelNo bedding500 °CPLB 2
3Bethel10% wood300 °CPLB 3
4Bethel10% wood500 °CPLB 4
5SunNo bedding300 °CPLB 5
6SunNo bedding500 °CPLB 6
7Sun10% wood300 °CPLB 7
8Sun10% wood500 °CPLB 8
Table 2. Proximate and ultimate analysis of samples.
SourcePLPLPS 1PLB
Sun FarmBethel FarmBeddingBethel Farm
Ultimate analysis
(dry-based, wt.%)
C27.8628.0143.4234.48
H6.285.978.391.77
O33.4927.06<25.544.99
N4.024.54<0.24.28
S1.721.420.062.06
Proximate analysis
(dry-based, wt.%)
VM 265.3157.9469.623.36
FC 38.069.068.0124.23
A 426.6333.0022.3952.42
HHV 513,78213,69819,74514,596
Atomic ratioO/C0.90.70.40.1
H/C2.72.62.30.6
1 Pine shavings, 2 volatile matter, 3 fixed carbon, 4 ash content, 5 high heat value (kJ/kg).
Table 3. Summary of elemental composition (wt. %) of PLBs using SEM-EDS.
Series No.CONKCaPSMinor Elements
PLB 137.9130.2112.325.613.632.511.995.81
PLB 228.7026.569.7714.345.192.896.136.42
PLB 338.5227.0313.635.645.251.891.716.32
PLB 437.7325.2810.348.584.513.502.937.13
PLB 534.4627.6413.467.336.403.322.275.12
PLB 636.4624.959.529.526.422.42.718.02
PLB 736.7830.5811.915.653.923.152.485.53
PLB 847.7019.168.849.014.332.583.215.16
Table 4. Summary of N, P, K, an S in PLB, PL, and soil samples.
Total NPKS
PLB 11.6919.68892.59245.47
PLB 21.6110.13954.78235.98
PLB 31.6126.821110.03406.25
PLB 41.615.98875.62261.23
PLB 53.9719.951610.11499.23
PLB 613.7925.871715.16571.96
PLB 71.618.471021.24302.09
PLB 81.614.91329.36308.07
Average:3.415.21188.6353.8
PL (Sun Farm)69.1355.741260577.86
Soil (near Bethel Farm)9.14137.3219.328.37
Suggested optional range32.0–60.08.0–20.038.0–80.07.0–22.0
Results are provided in parts per million (ppm).
Table 5. Summary of surface area, adsorption cumulative volume, pore diameter.
SampleBET Surface Area (m2/g)Adsorption Cumulative Volume (m3/g)Adsorption Average Pore Diameter (nm)
PLB 15.710.019613.59
PLB 218.820.058912.74
PLB 55.300.021916.54
PLB 67.310.025314.39
Disclaimer/Publisher’s Note: The statements, opinions and data contained in all publications are solely those of the individual author(s) and contributor(s) and not of MDPI and/or the editor(s). MDPI and/or the editor(s) disclaim responsibility for any injury to people or property resulting from any ideas, methods, instructions or products referred to in the content.