
Development of Low-Cost c-Si-Based CPV Cells for a Solar Co-Generation Absorber in a Parabolic Trough Collector

 , , and
Abstract
:
1. Introduction
2. Motivation and State of the Art
3. Development of a Low-Cost c-Si CPV Cell
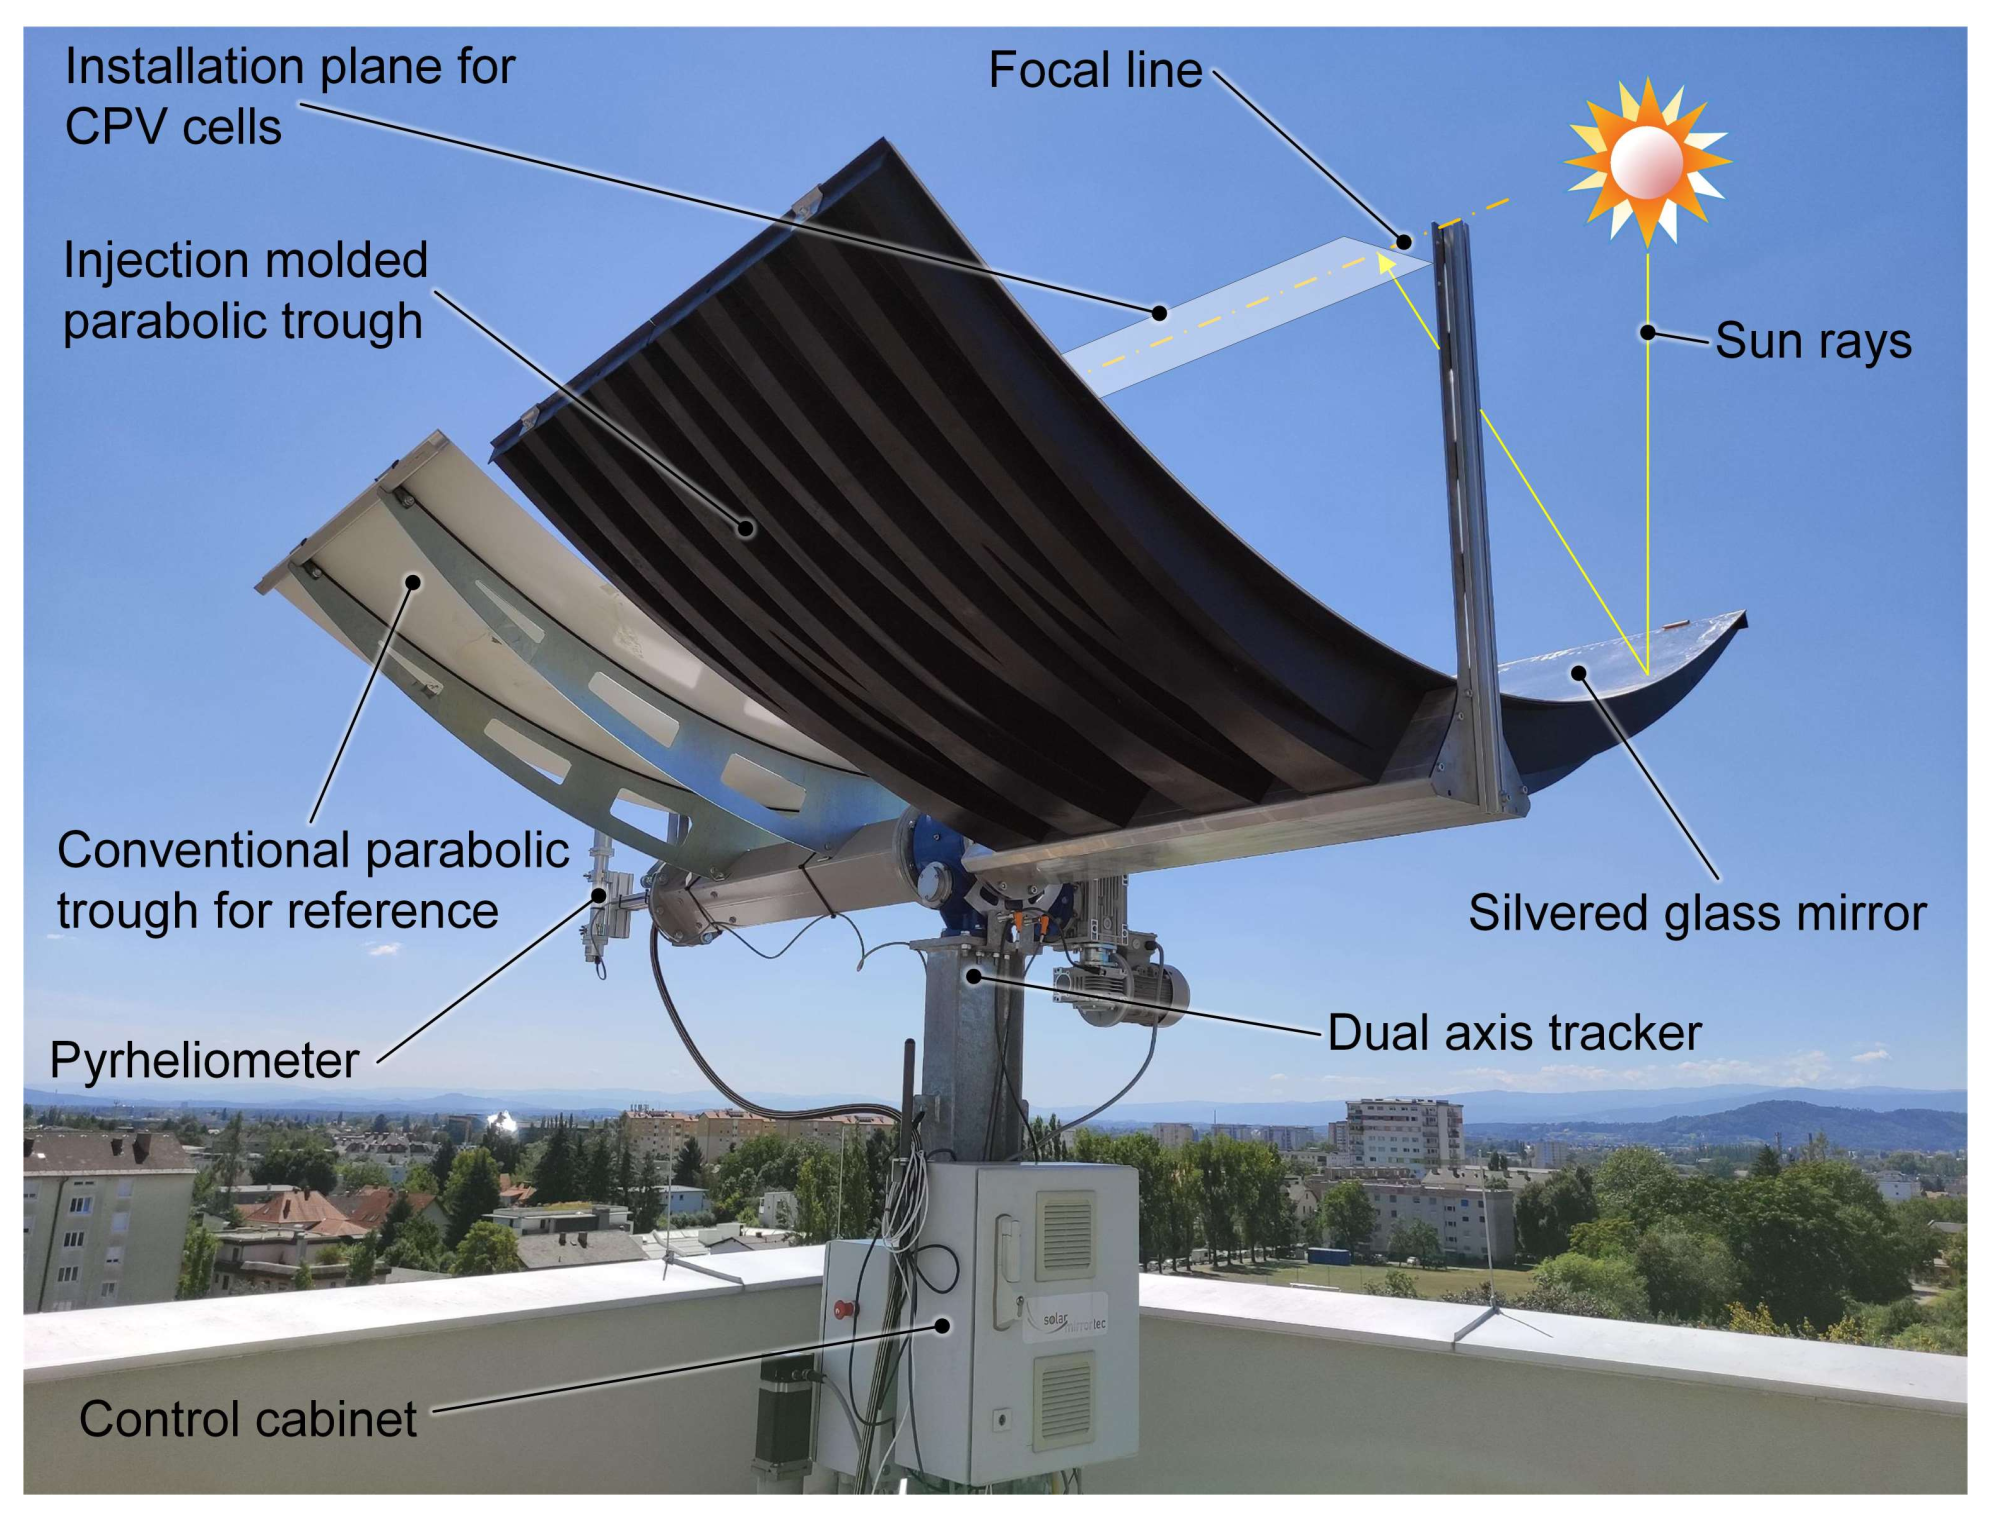
3.1. General System Layout
3.2. CPV Cell Development Steps
- Front side metal design.
- Heat-sink integration requirements.
- Resistance loss analysis.
- Tests for validation toward simulated targets.
- Enhancing the quantity of light gathered by the cell converted into carriers (as in [1]).
- Increasing the aggregation of light-generated carriers by the p–n junction.
- Transporting current from the cell without considerable resistance losses.
3.3. Target Specifications and Design Requirements
- (a)
- Cooling the backside of the solar cell.
- (b)
- Conveying the rejected heat for subsequent use in an absorption chiller or similar.
4. CPV Simulation for Cell Design
4.1. c-Si Cell Architecture
4.2. Front Surface Metallization Design
- q: electric charge
- A: area
- D: diffusivity of the minority carrier
- L: minority carrier diffusion length
- ND: doping coefficient
- B: temperature-independent constant
- T: temperature
- k: Boltzmann’s constant
- EG0: bandgap linearly extrapolated to absolute zero
- B′: temperature independent constant
- γ: factor regarding temperature dependencies of the other material parameters.
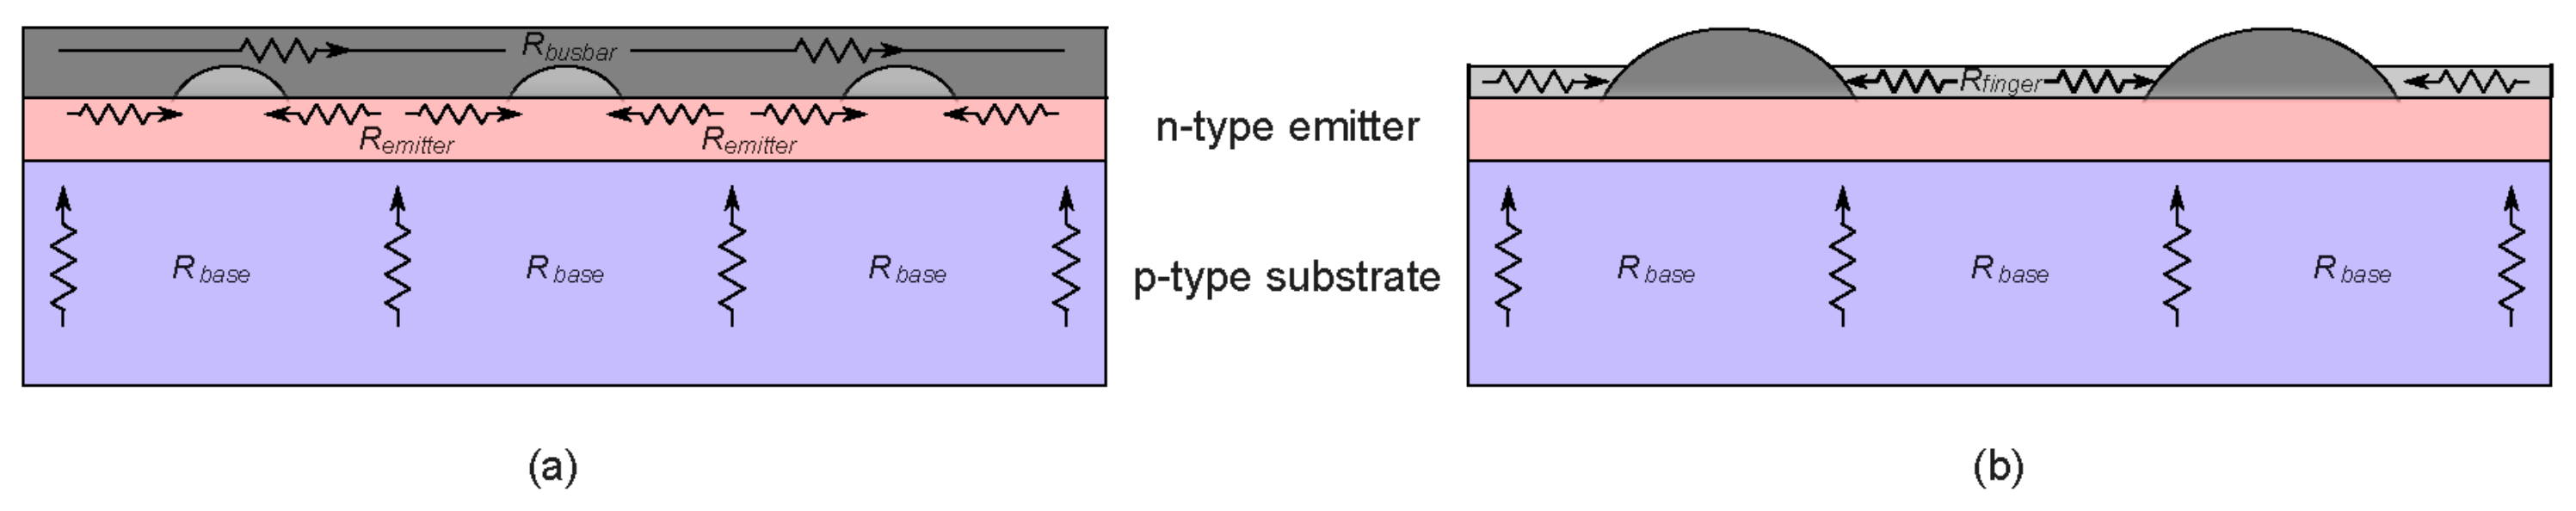
- Series resistance (RS).
- Shunt resistance (RSH).
- Contact resistance (RC = Rfinger + Rbusbar).
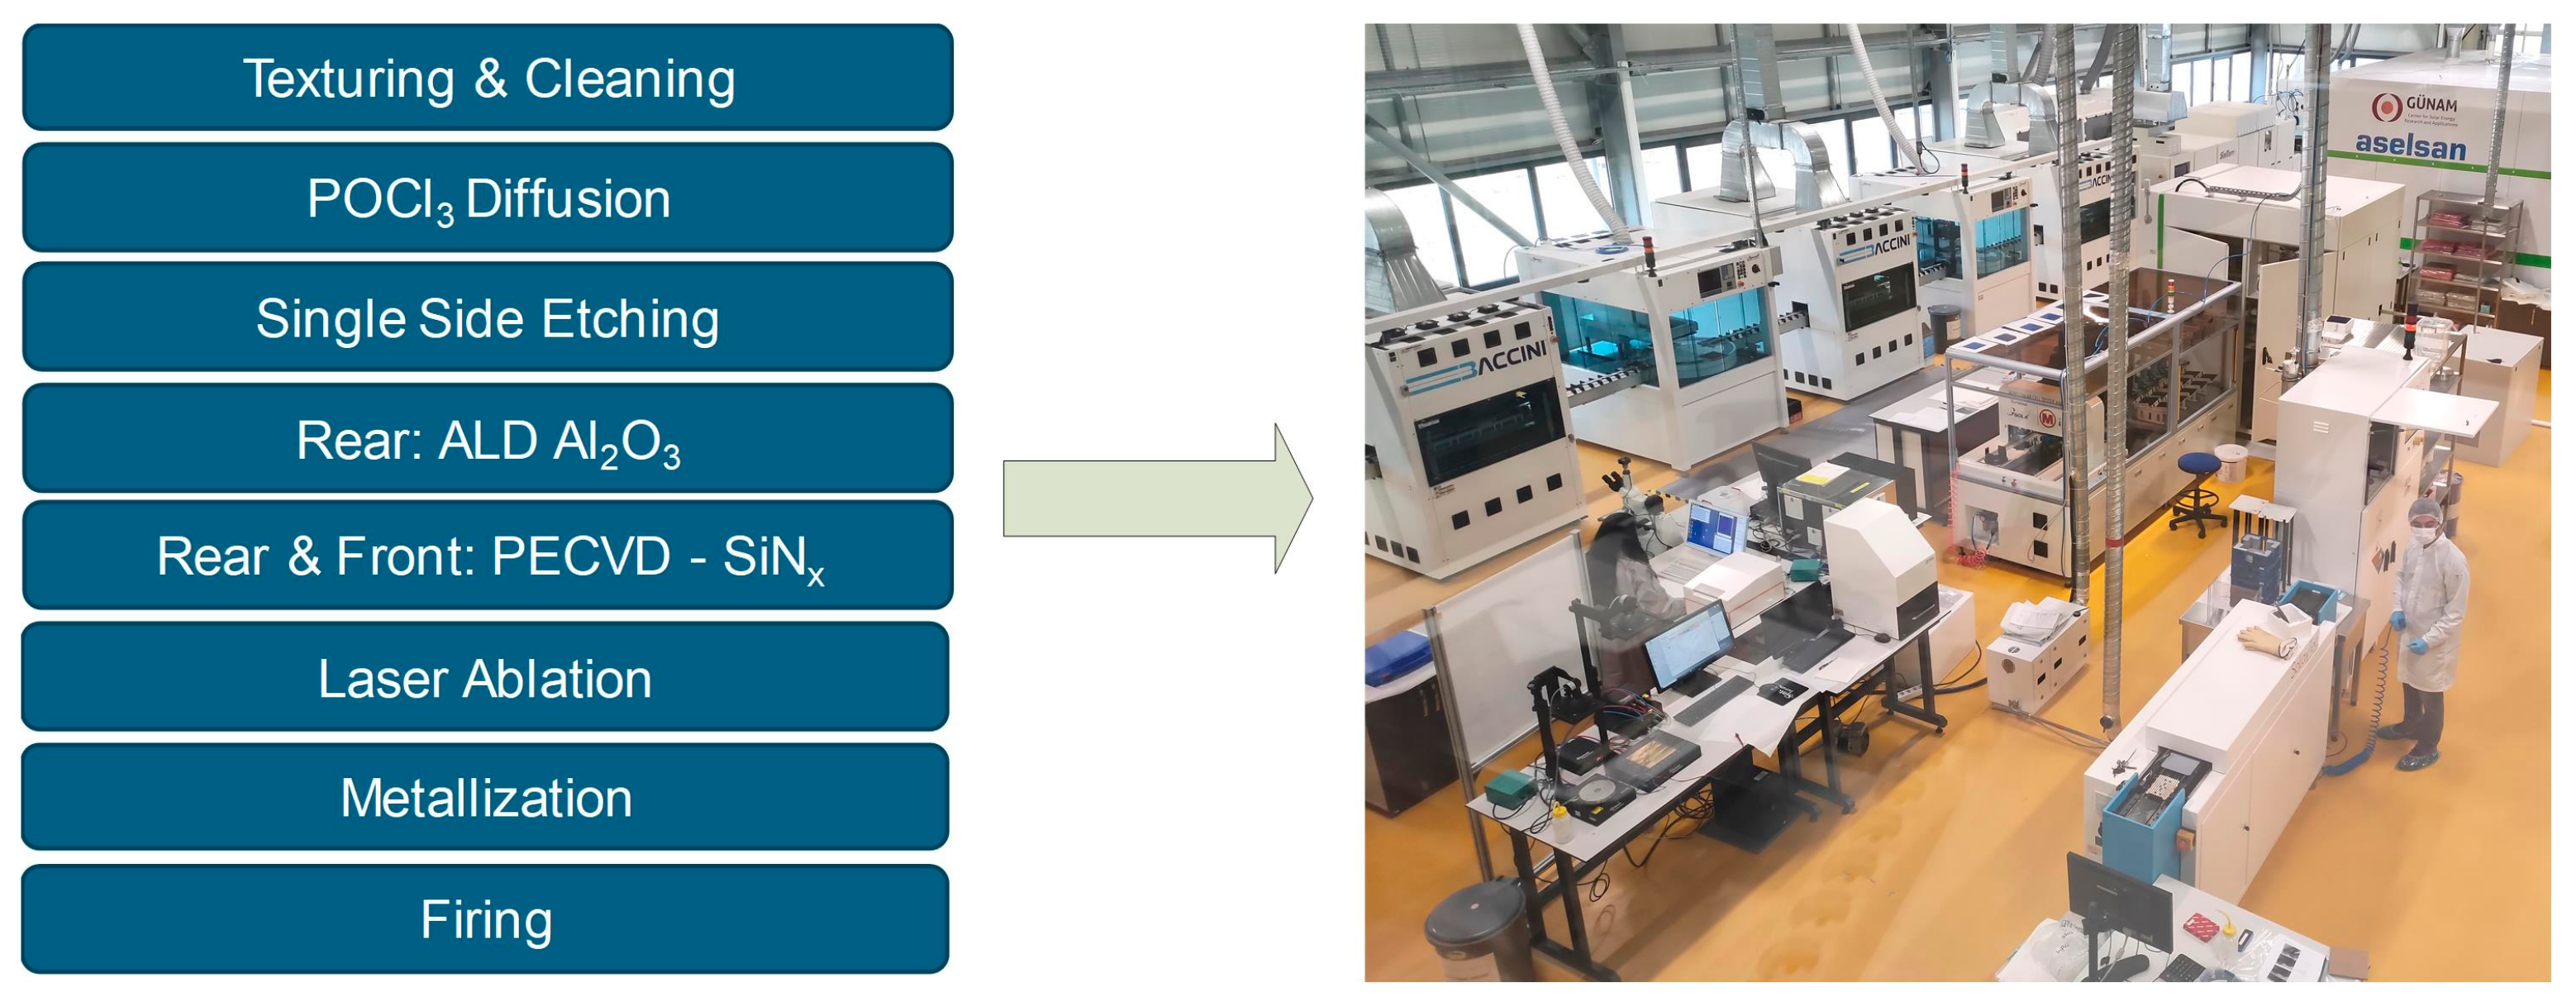
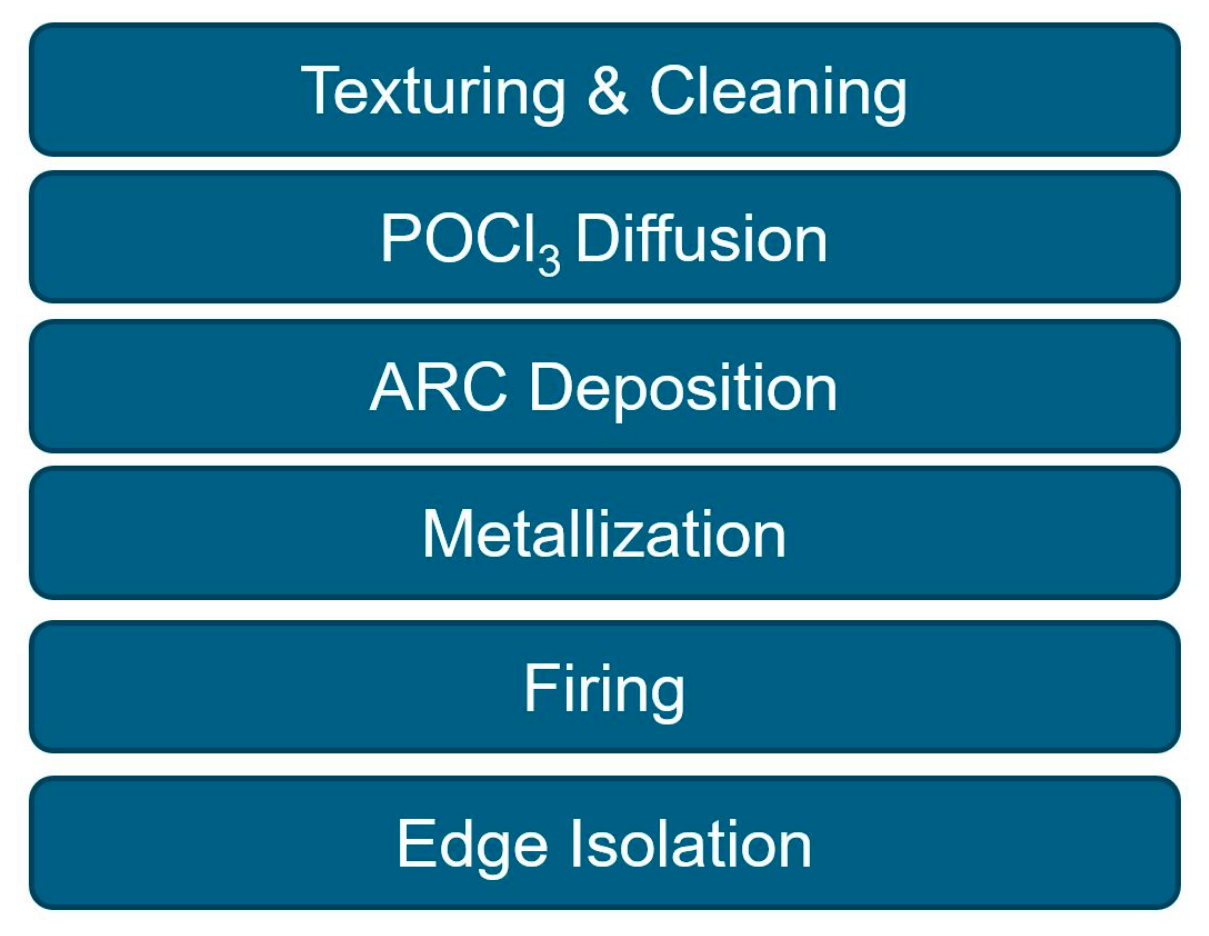
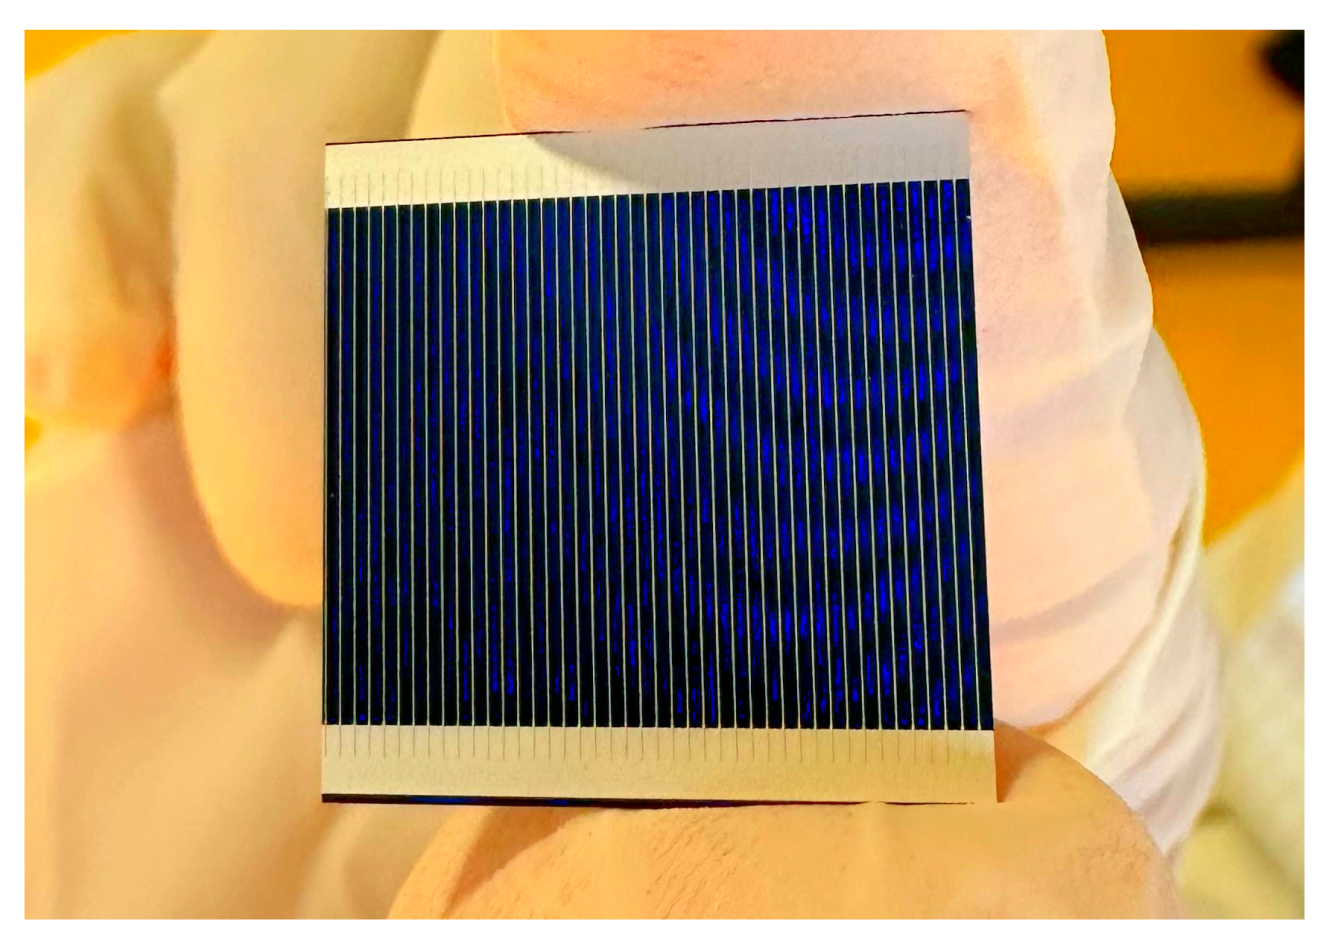
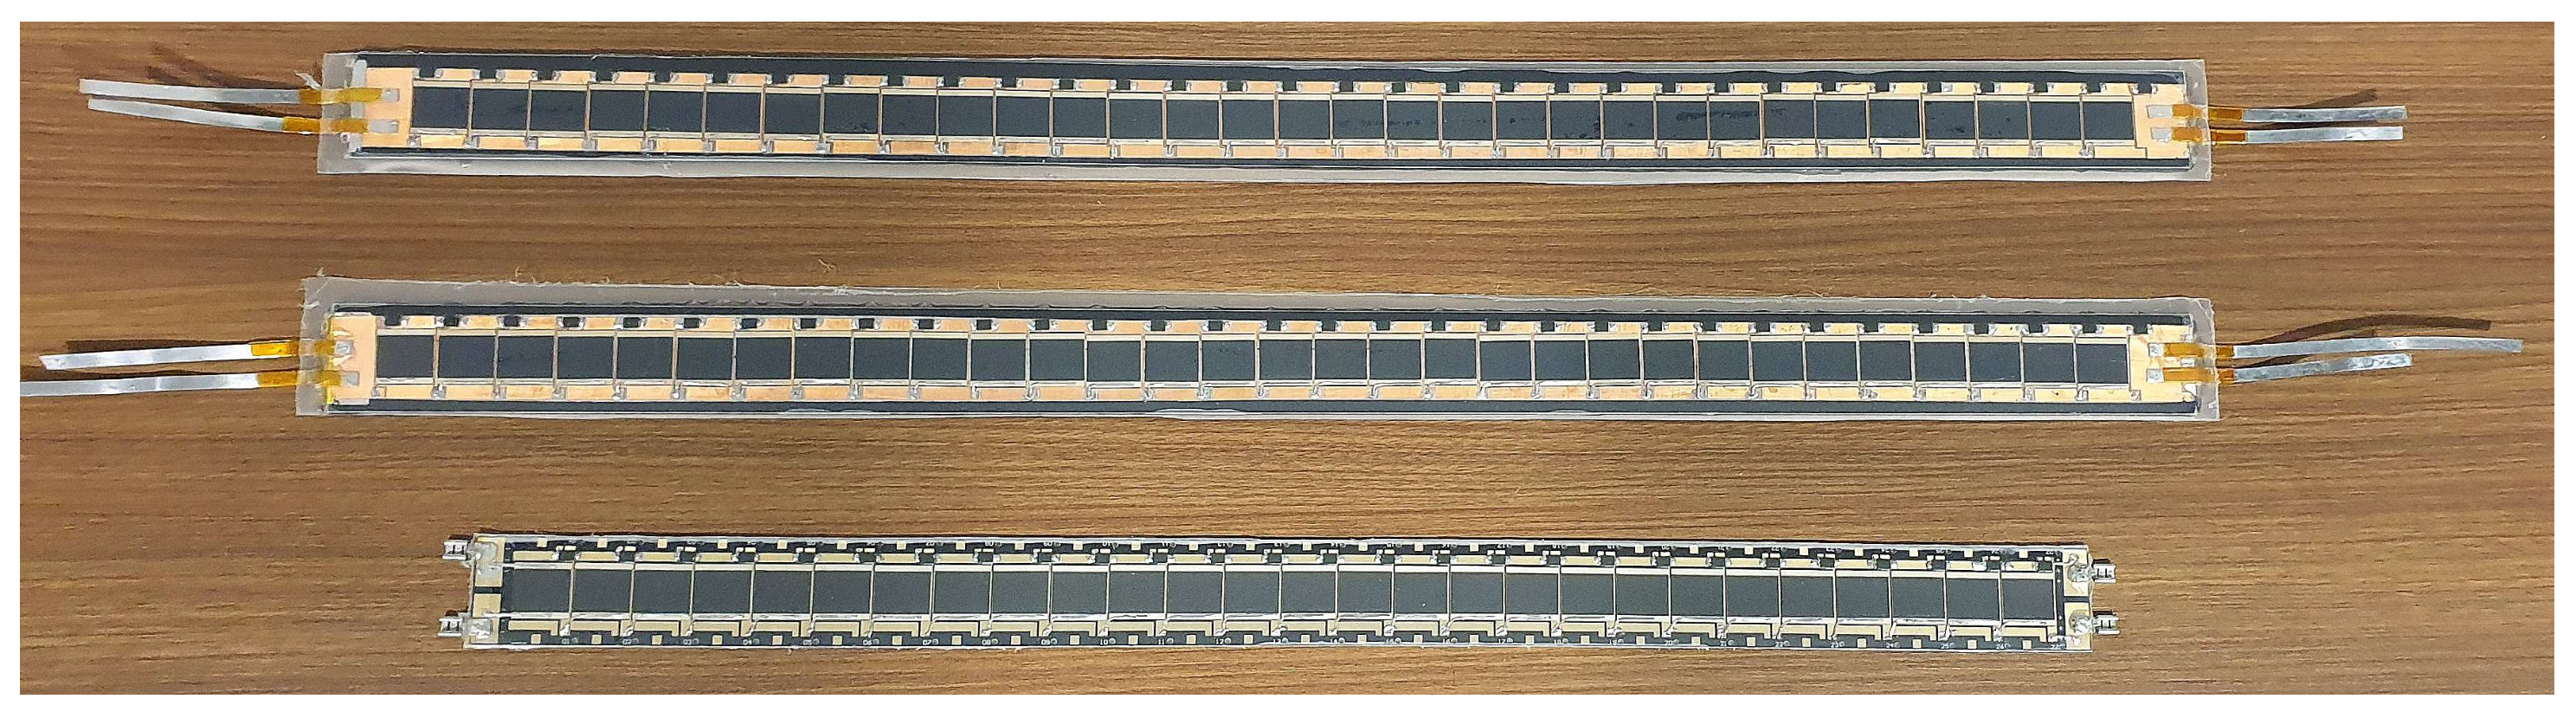
5. Manufacturing
6. Test Results
- (a)
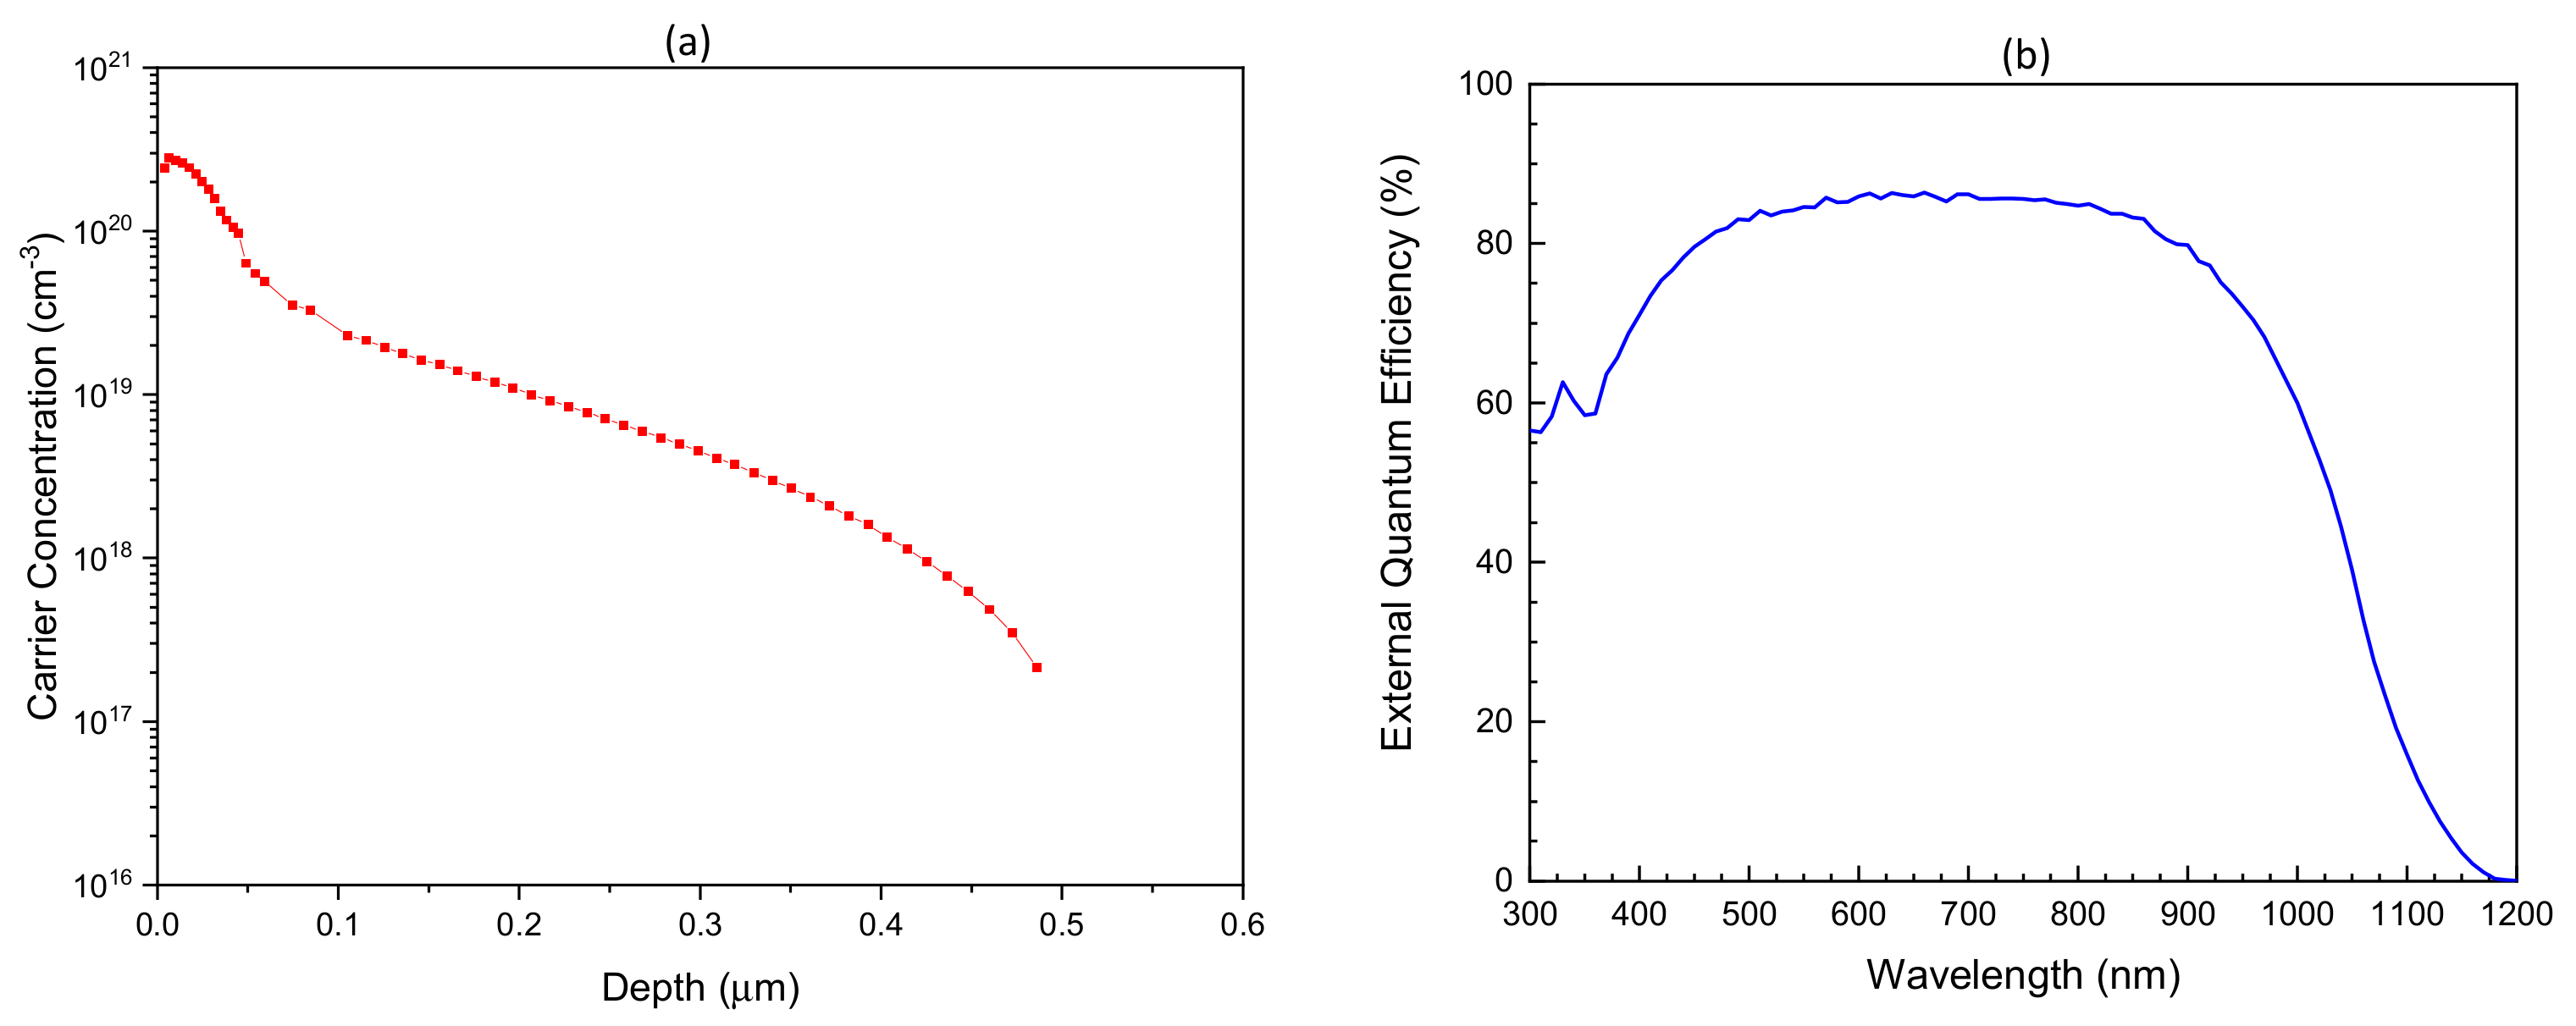
- ECV.
- (b)
- EQE.
- (c)
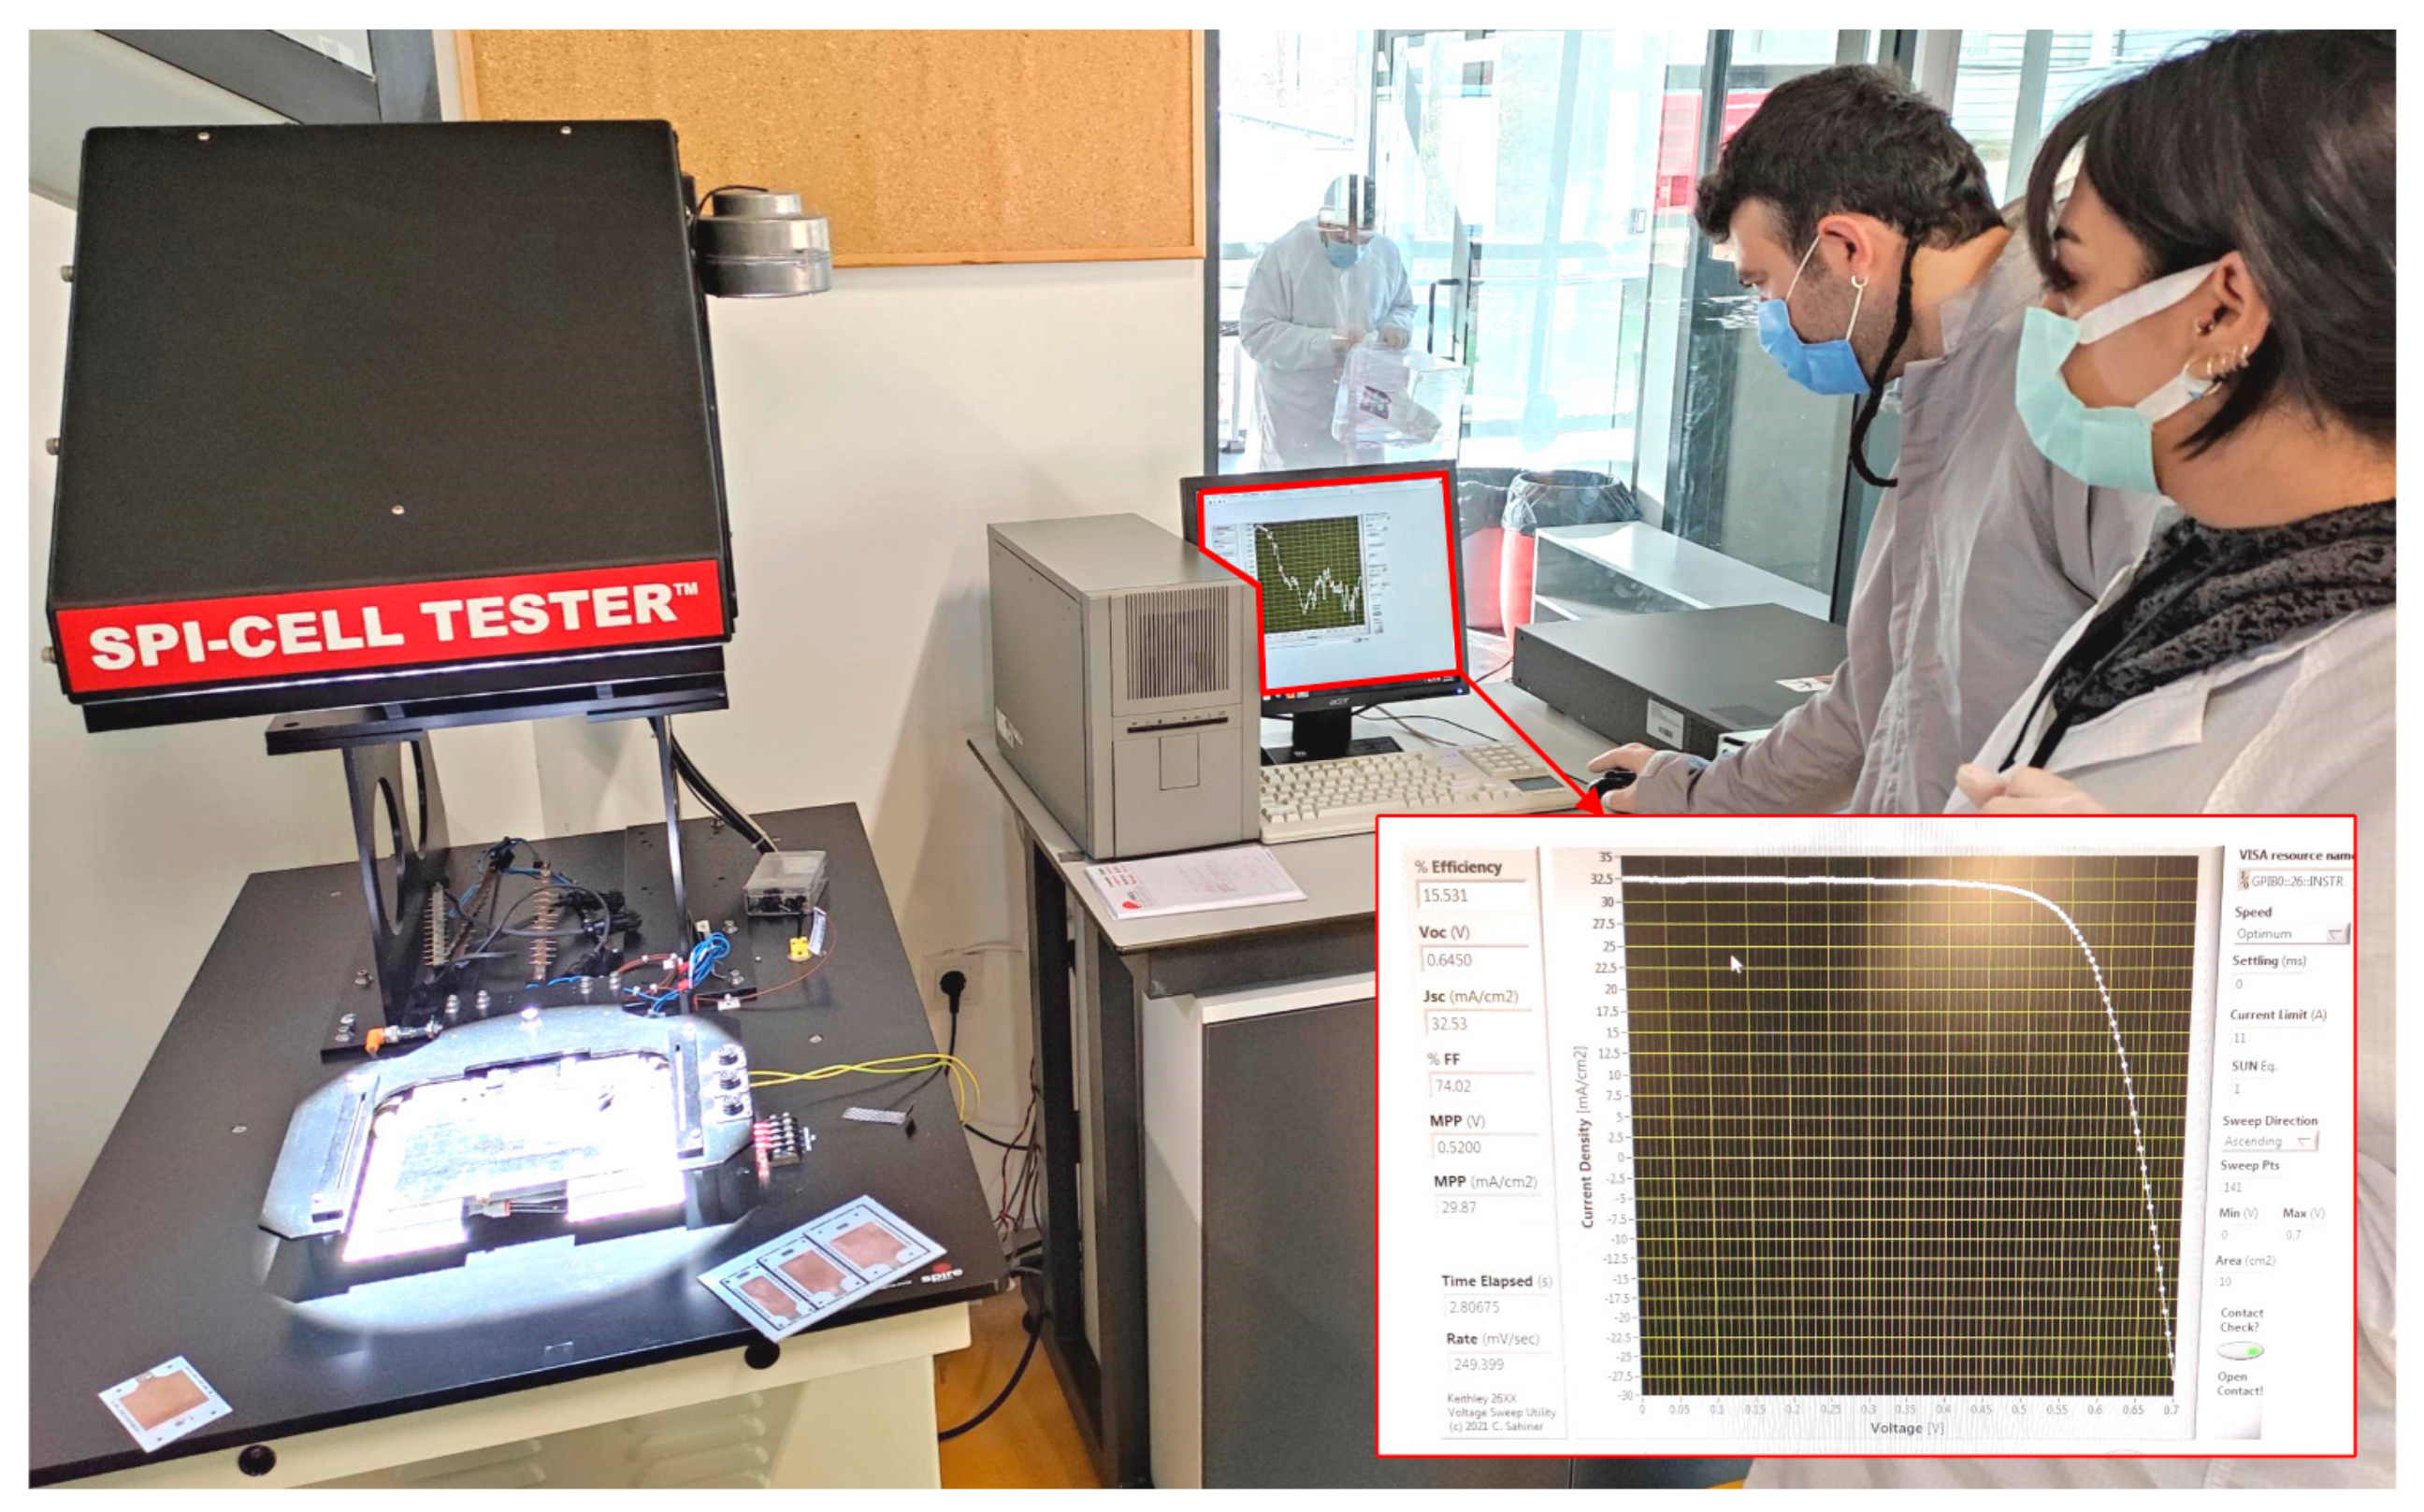
- 1-sun solar simulator tests.
- (d)
- High-flux solar simulator tests.
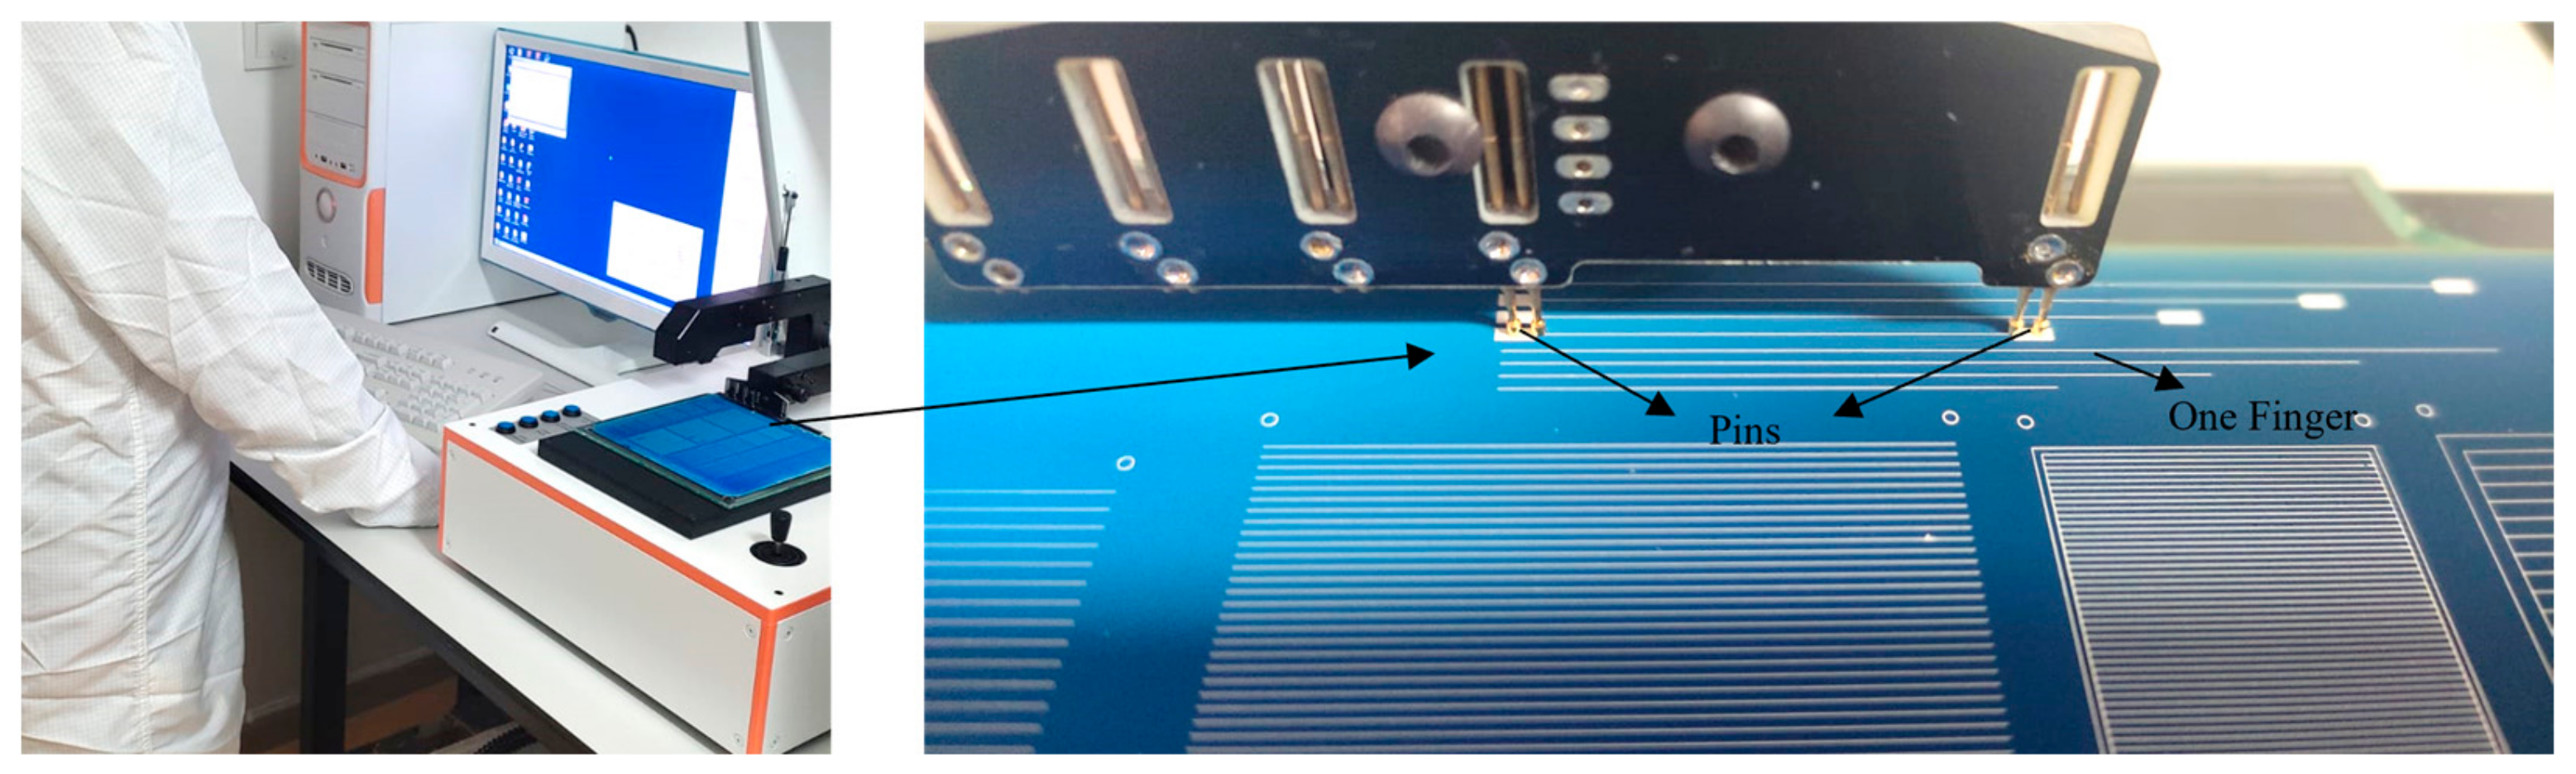
6.1. Rc Measurement Results
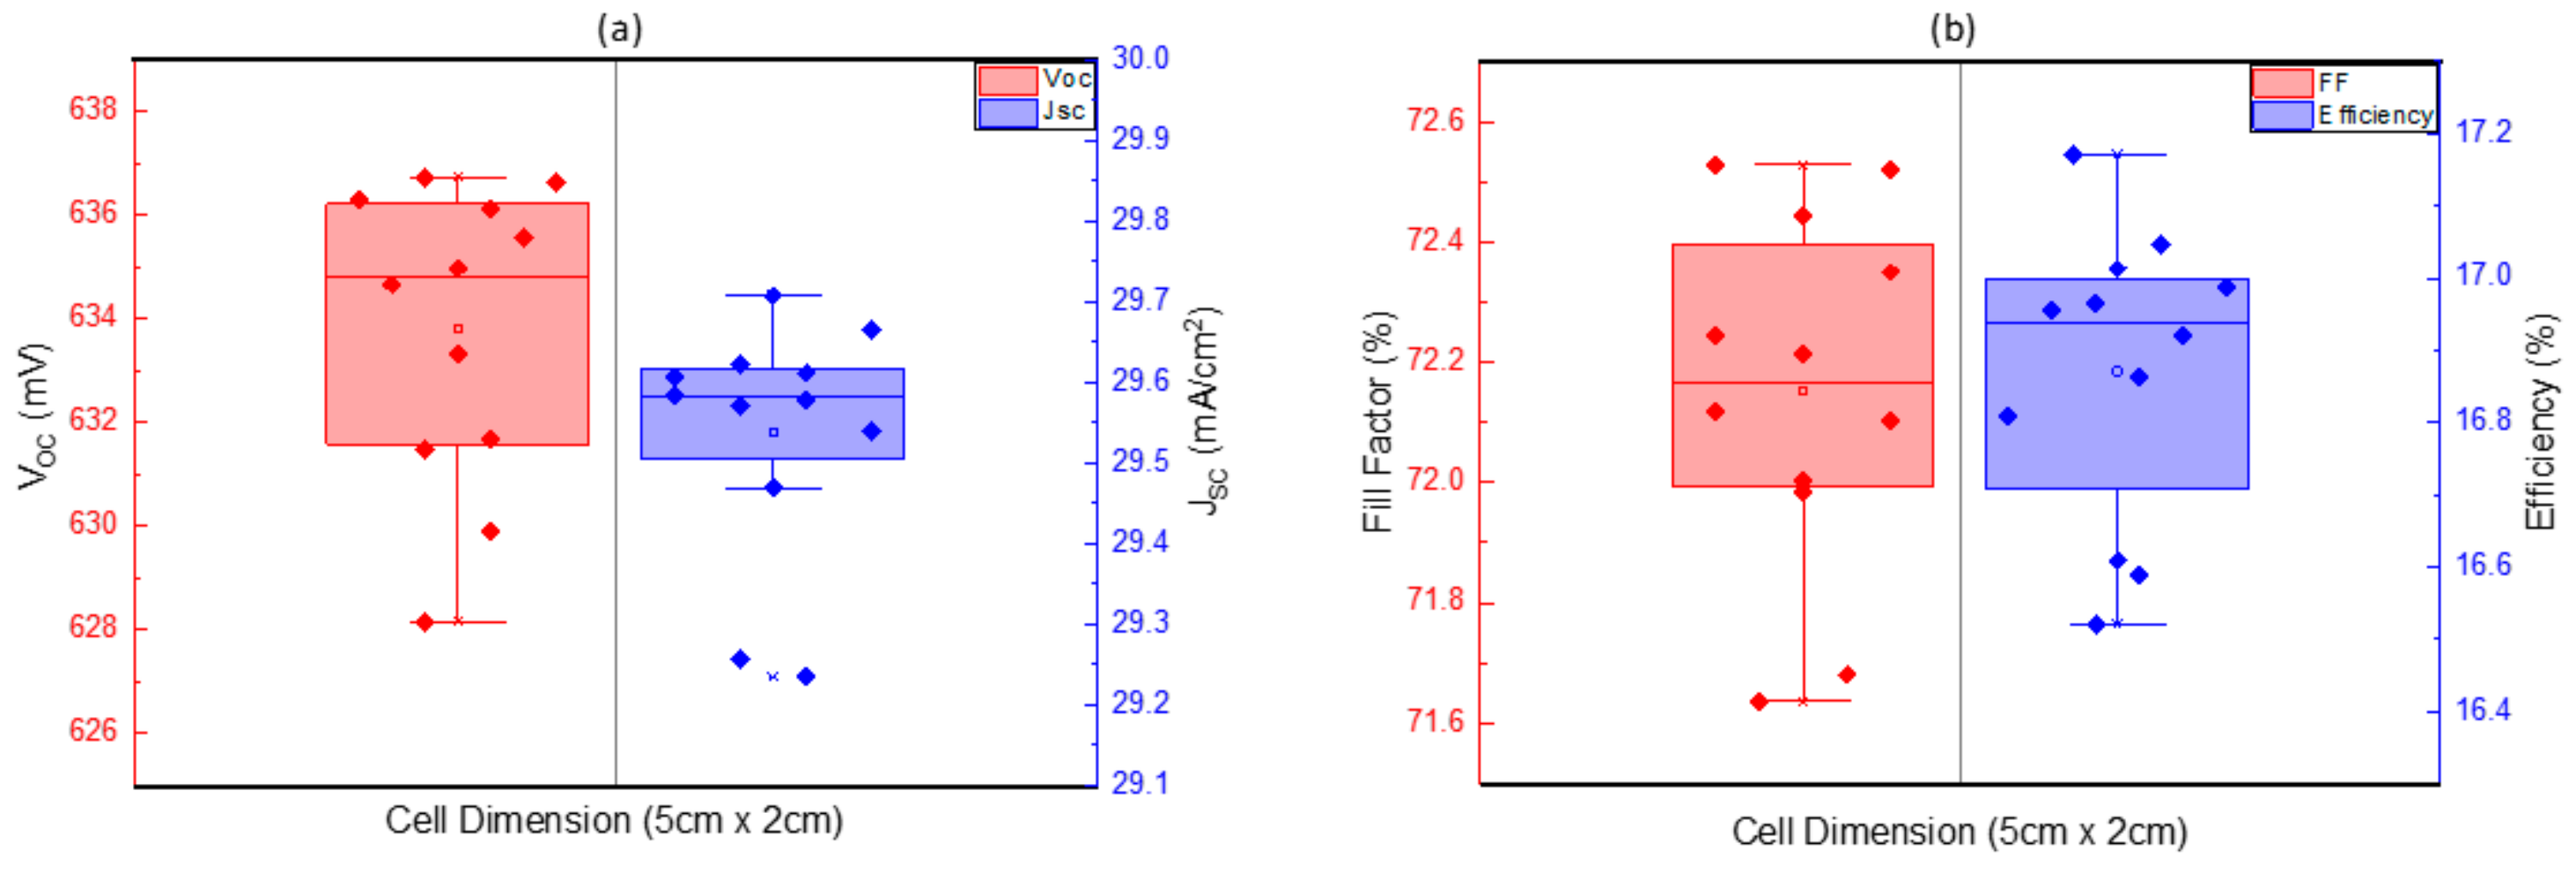
6.2. Standard Solar Simulator Tests
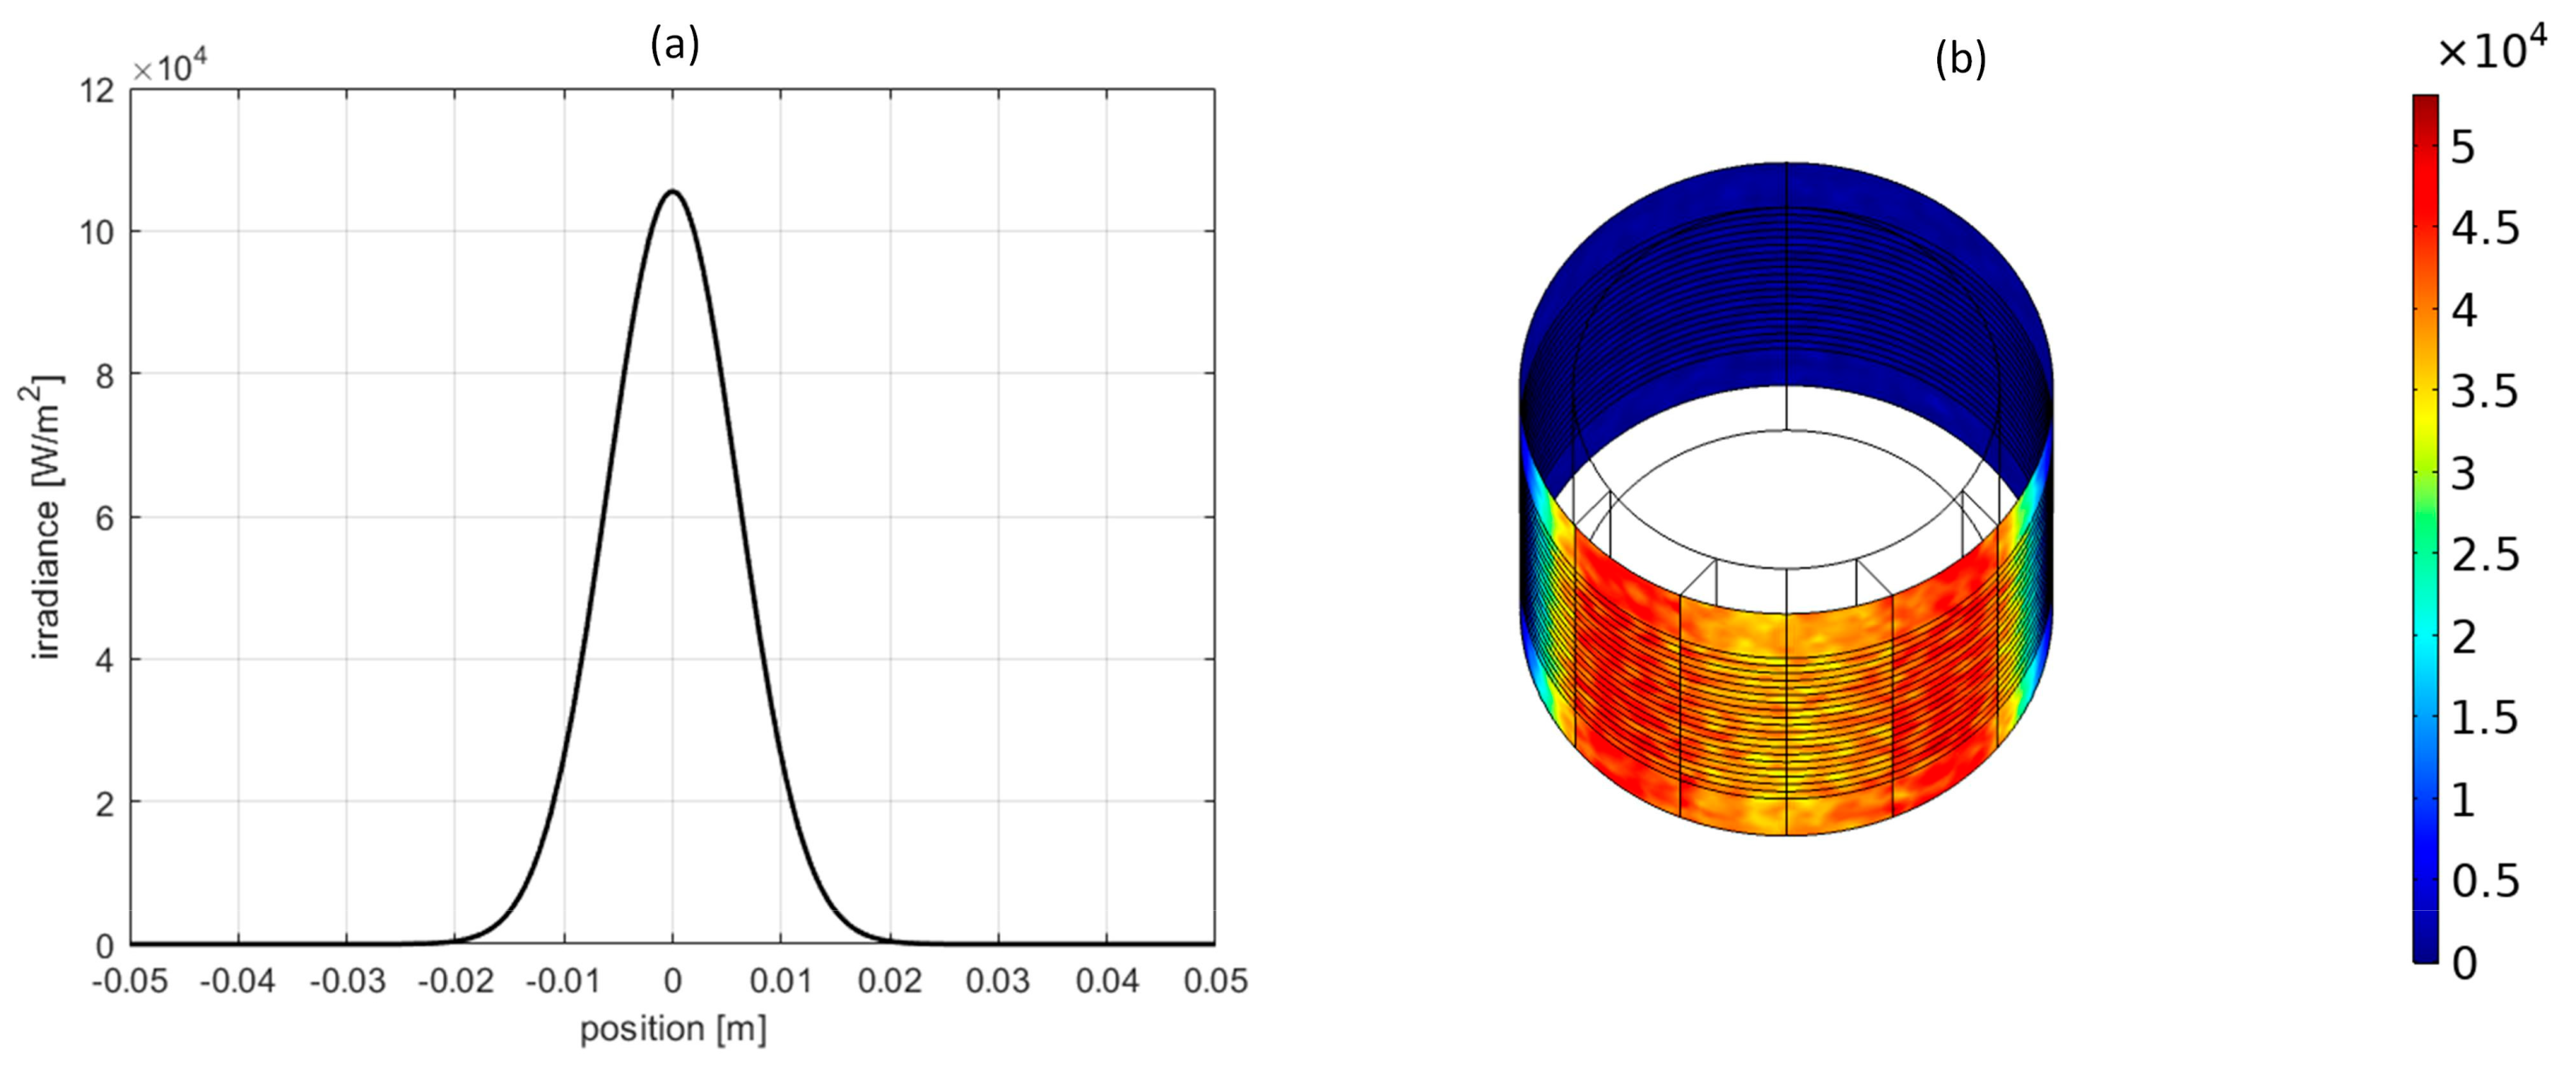
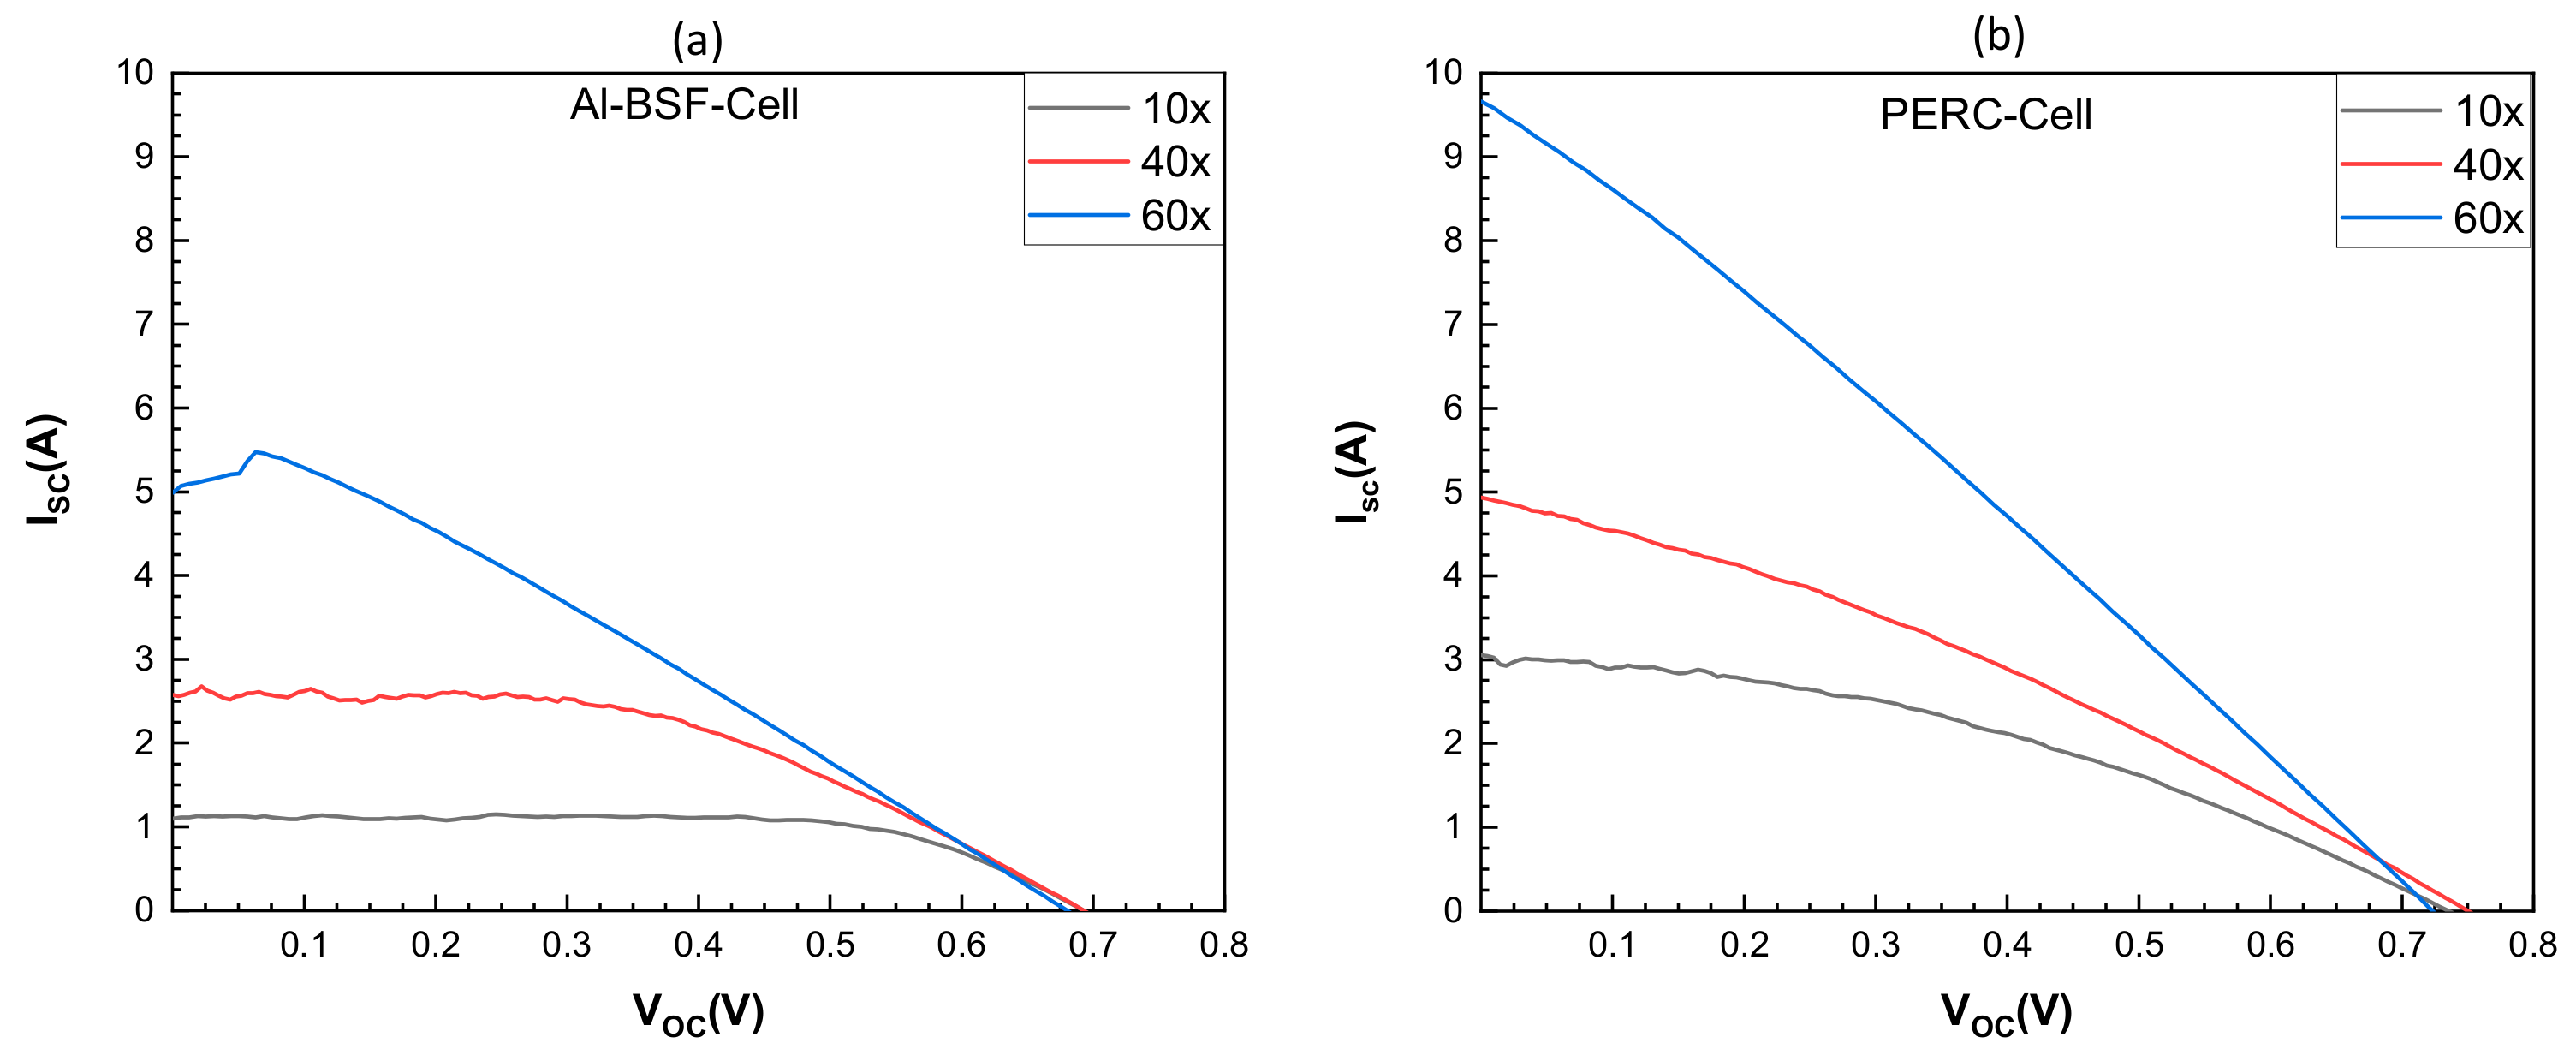
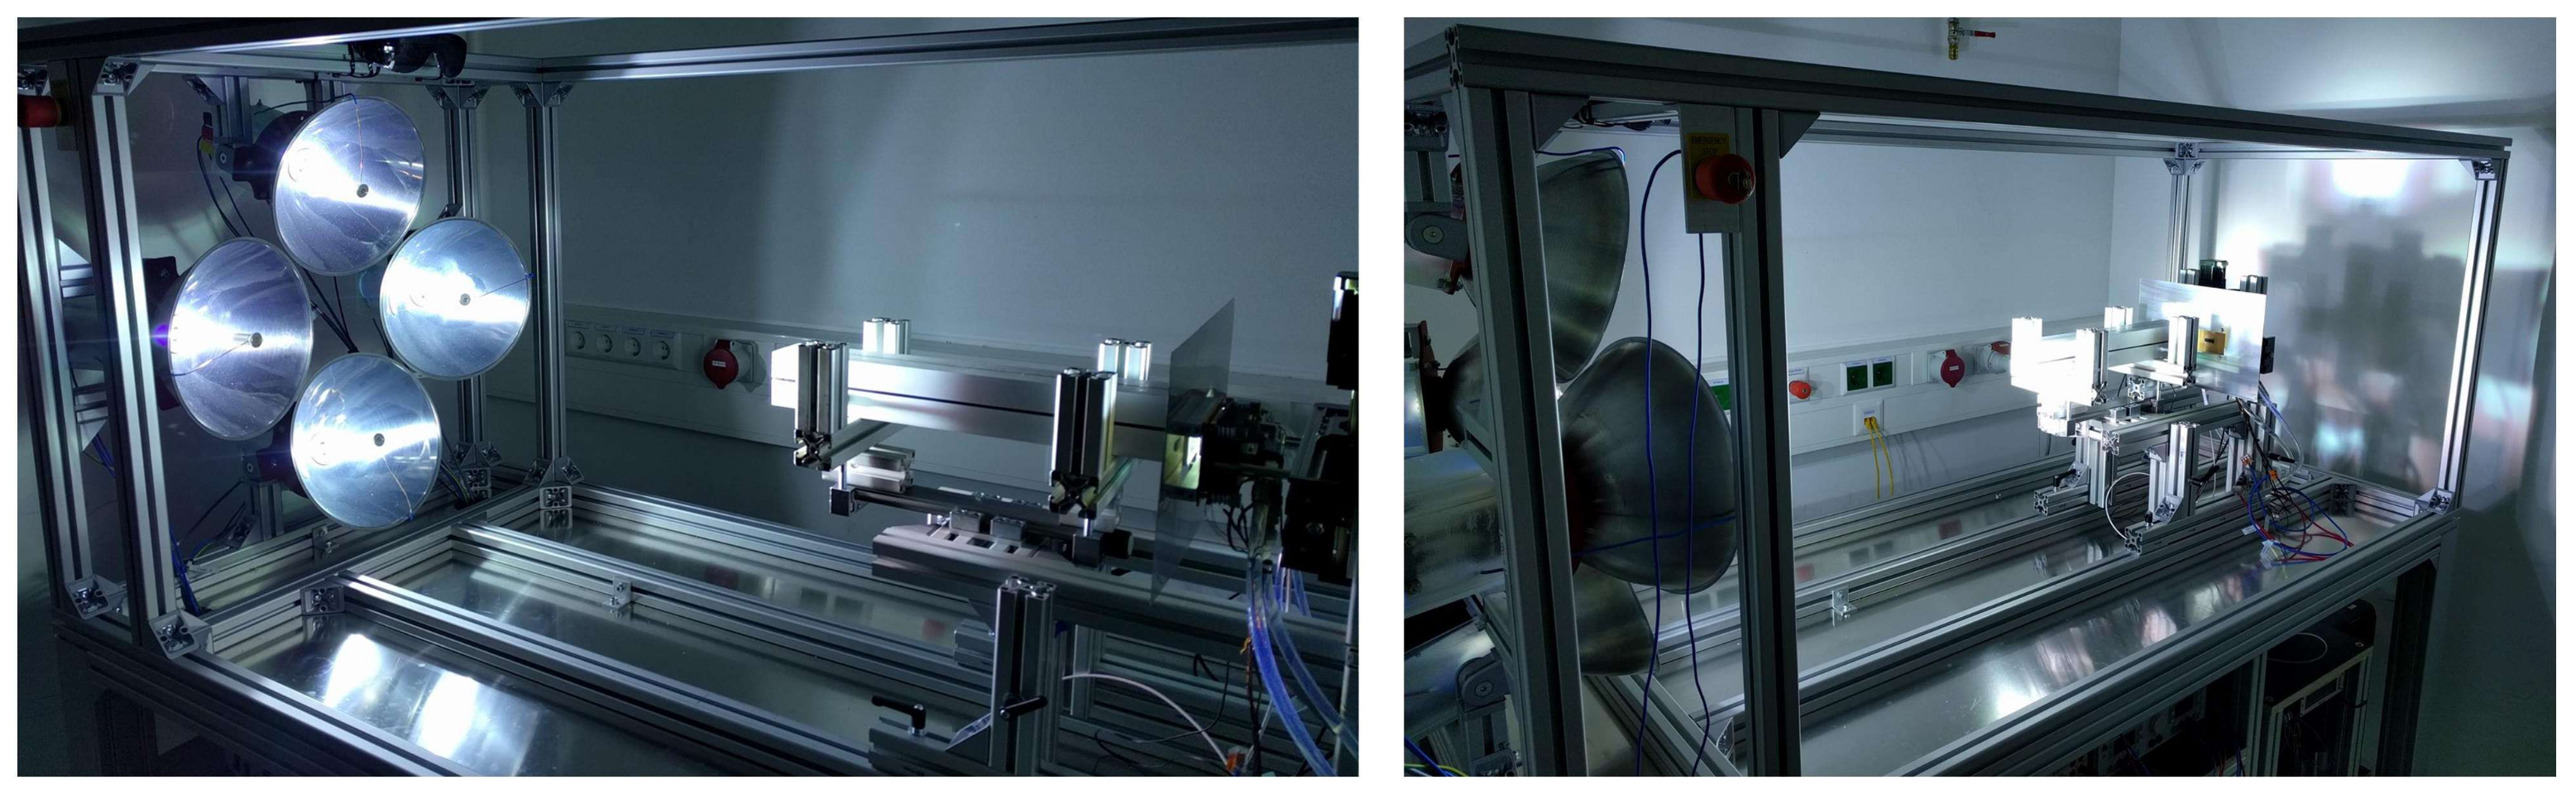
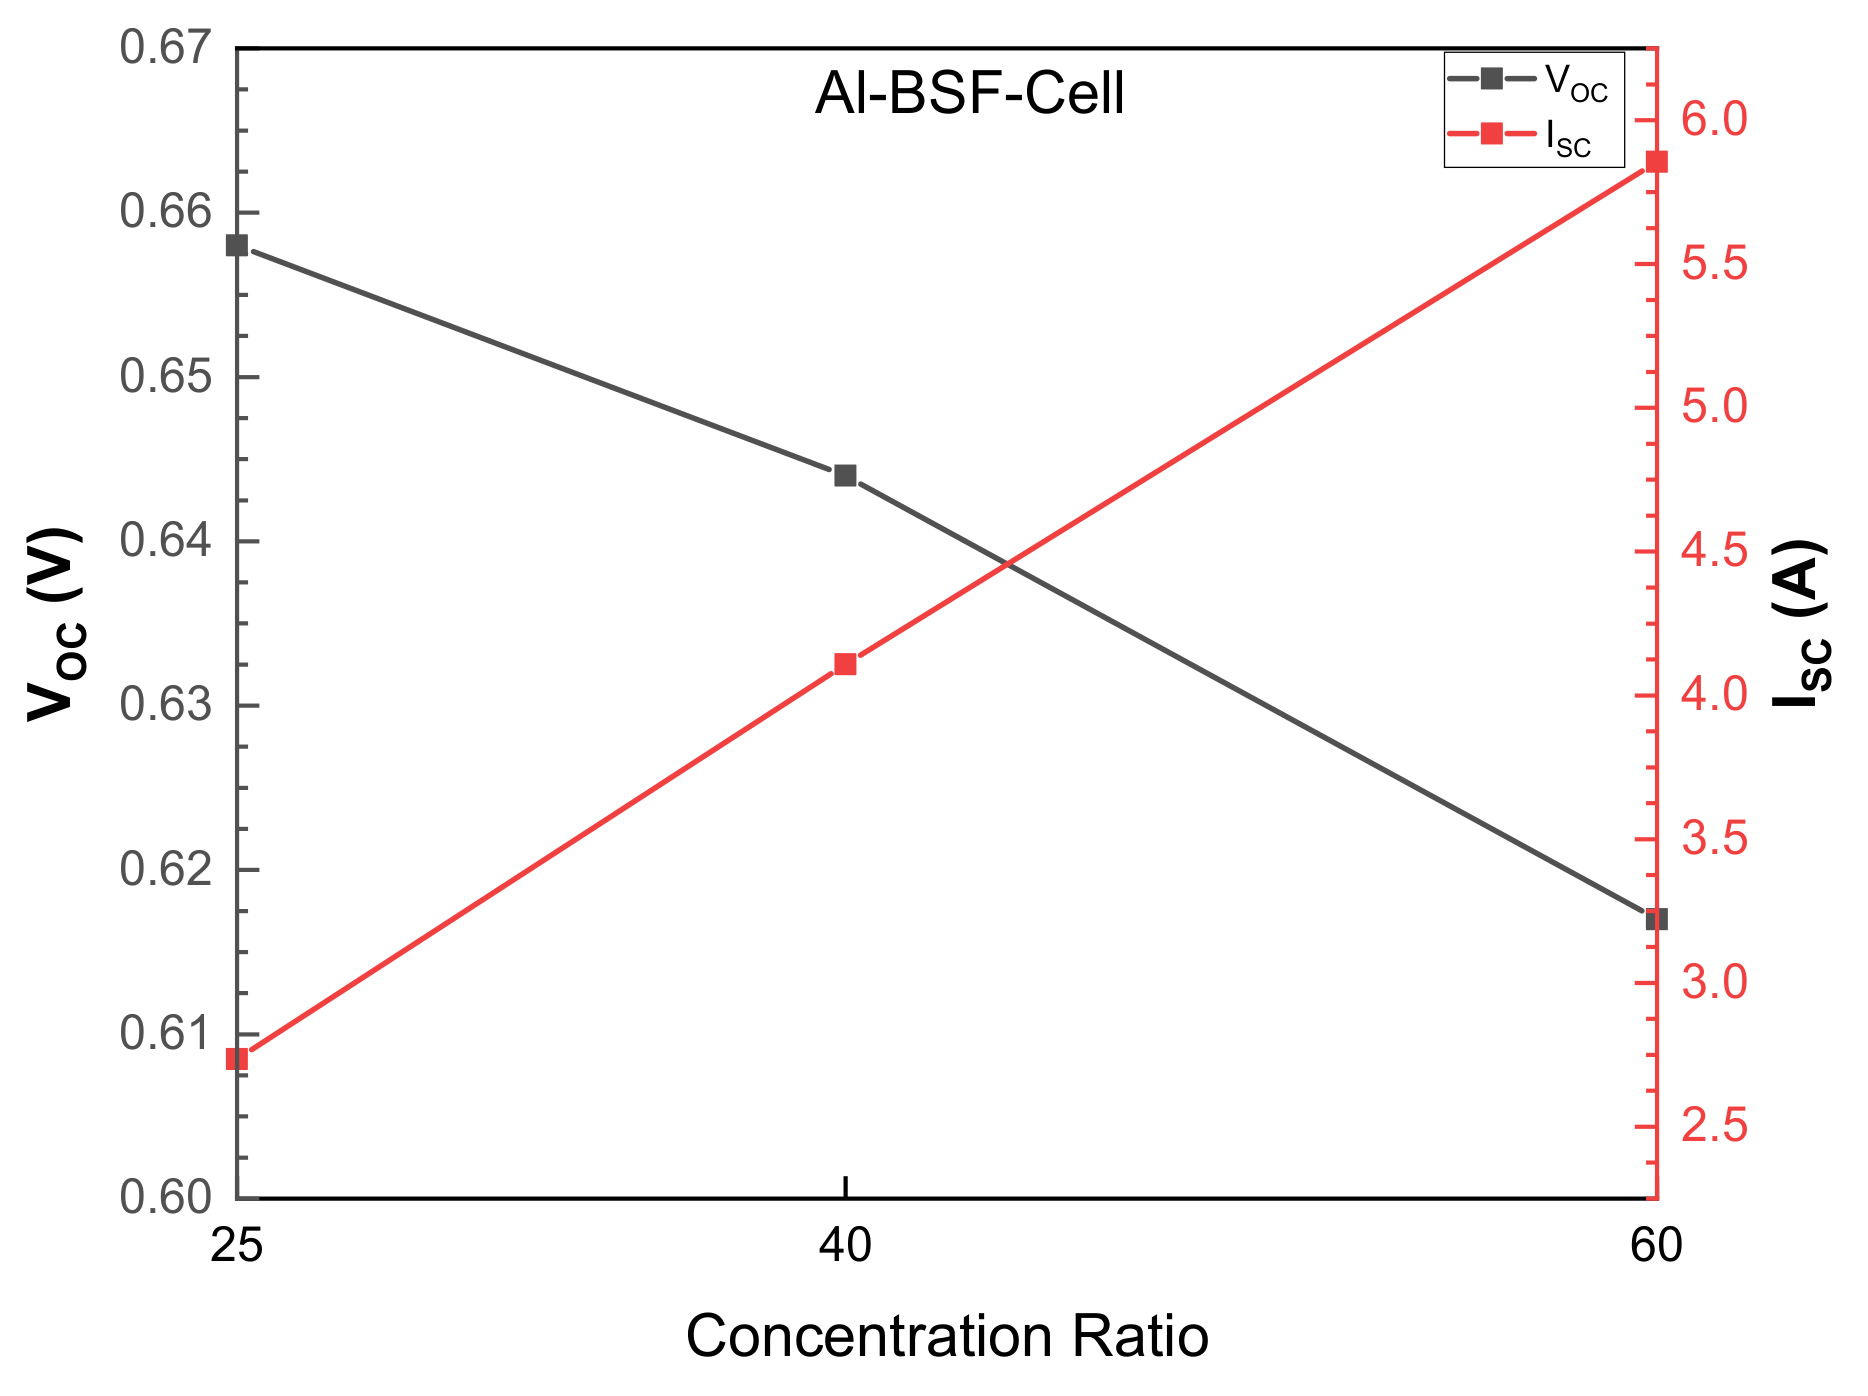
6.3. High-Flux Solar Simulator Tests
6.3.1. Solar Simulator Test at METU
6.3.2. Solar Simulator Test at Graz University of Technology
7. Discussion
7.1. Discrepancies between Simulation and Test Results
- Optimizing metal printing quality: Precision in metal contacts is to be ensured to reduce electrical losses.
- Reducing various resistances: Sources of electrical resistance within the cell structure are to be minimized and design improvements and material enhancements should be implemented to decrease resistance.
- Improving Fill Factor (FF): Cell design is to be adjusted to effectively use space and enhance current flow and a balance between resistances is to be fine-tuned for the best FF.
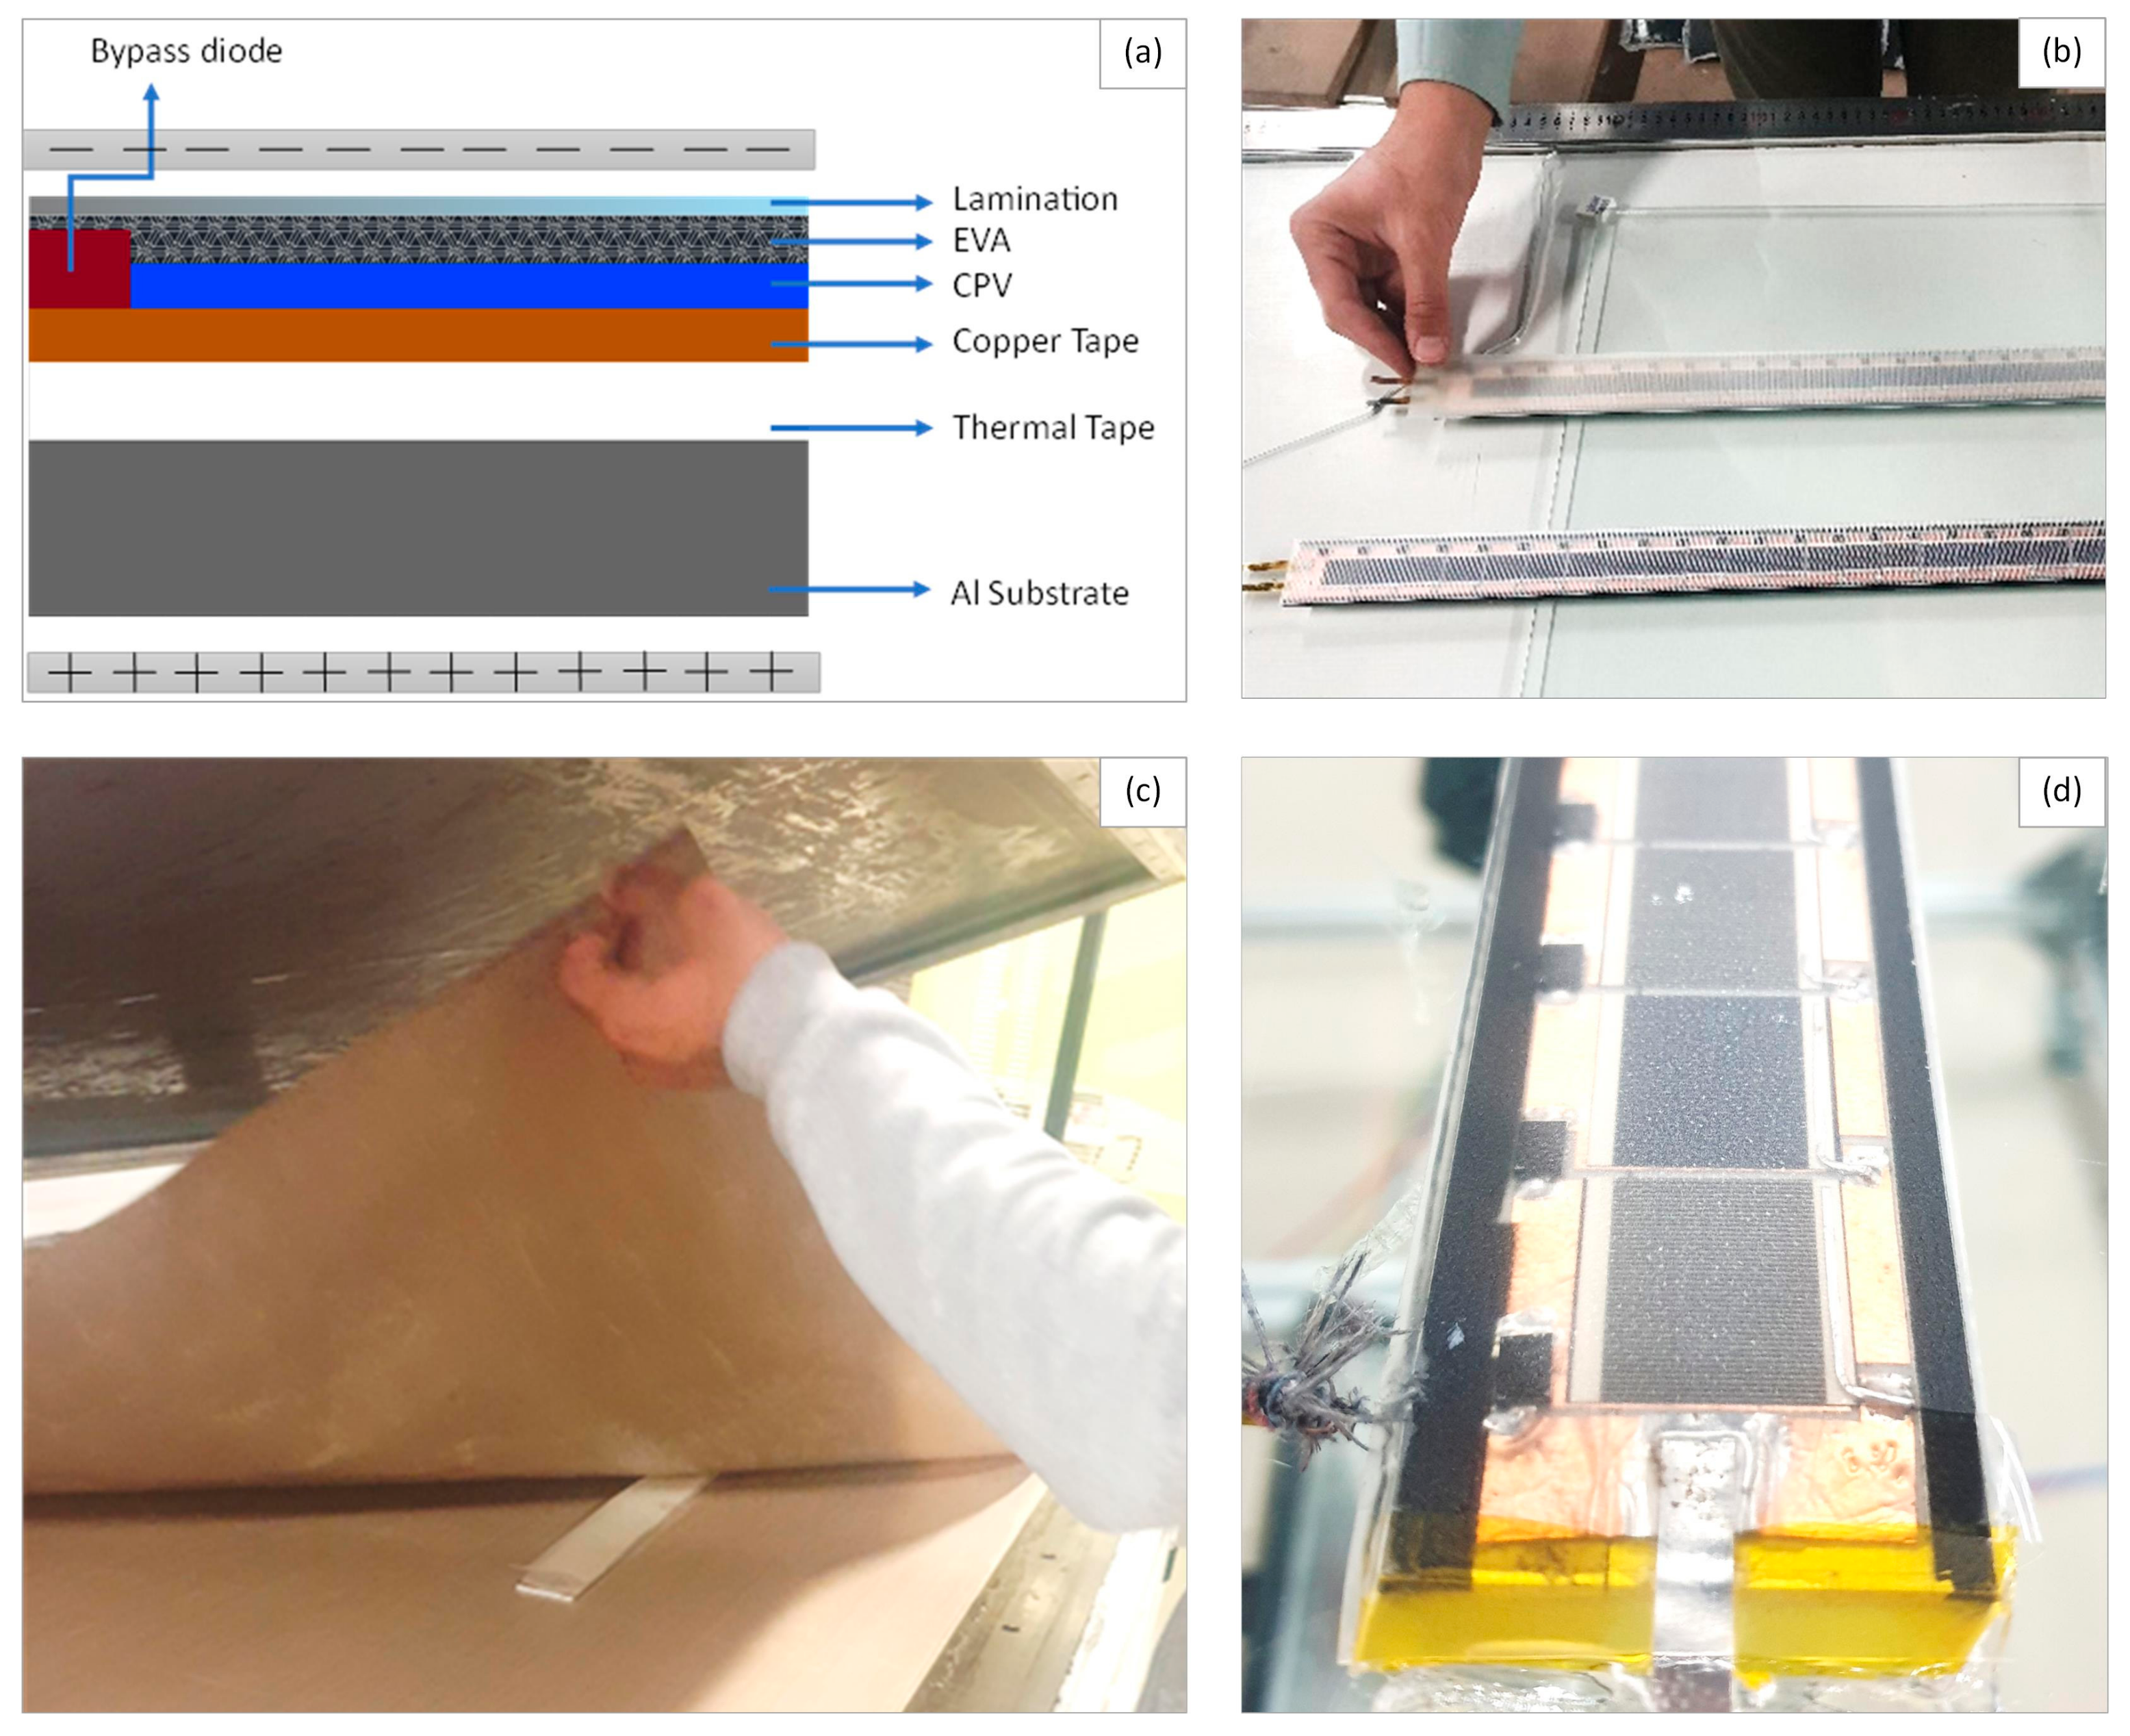
7.2. Challenges in Manufacturing
7.3. Finger Printing Issues
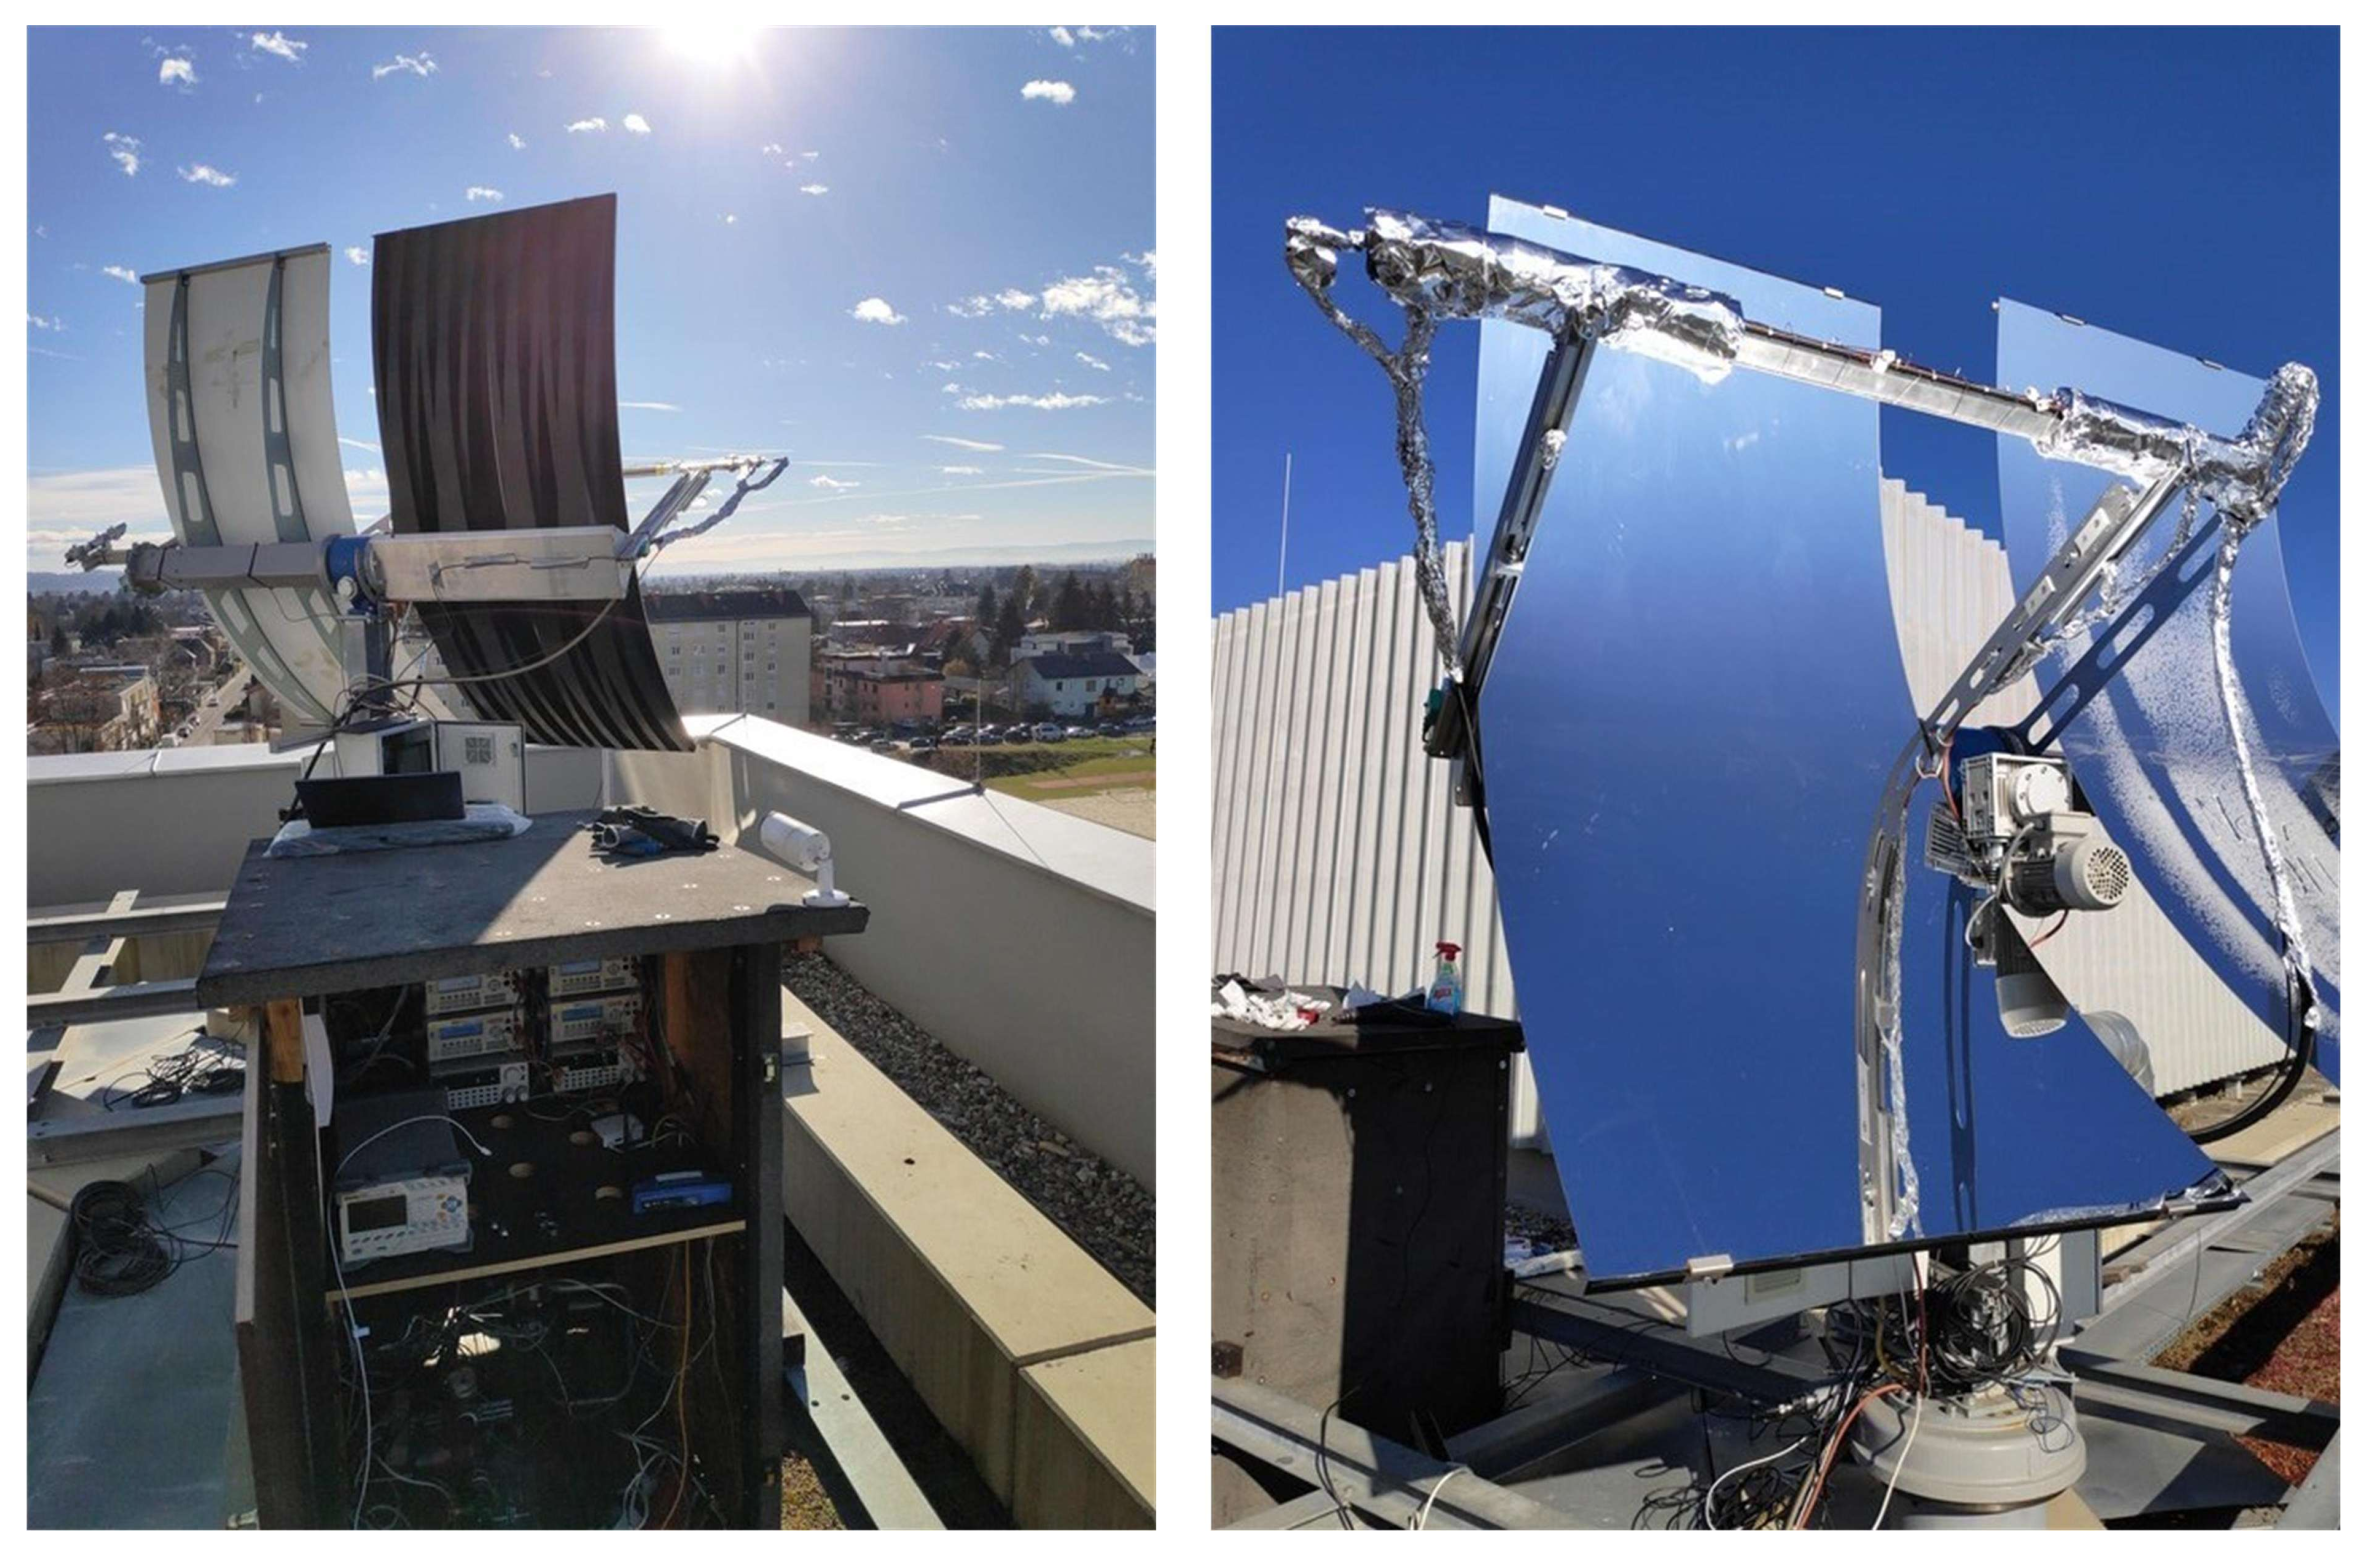
7.4. Module Assembly and Test Setup
8. Conclusions
Author Contributions
Funding
Data Availability Statement
Acknowledgments
Conflicts of Interest
Nomenclature
| Al–BSF | aluminum back surface field |
| CAM | co-generation absorber module |
| CPV | concentrated solar photovoltaic |
| CPV-T | concentrated photovoltaic and thermal hybrid system |
| CSP | concentrated solar power |
| c-Si | crystalline silicon |
| ECV | electrochemical capacitance voltage |
| EQE | external quantum efficiency |
| FF | fill factor |
| FPV | flat-plate photovoltaic |
| GPVL | ODTÜ-GÜNAM photovoltaic line |
| HTF | heat transfer fluid |
| JSC | saturation current |
| LID | light-induced degradation |
| PERC | passive emitter rear contact |
| PV | photovoltaic |
| RCH | characteristic resistance |
| RS | series resistance |
| RSH | shunt resistance |
| RC | contact resistance |
| TLM | transmission line method |
| TUG | Graz University of Technology |
| VOC | open-circuit voltage |
References
- Alexander, B.J.; Richardson, T.F. Concentrating Solar Power Data and Directions for an Emerging Solar Technology; Nova Science Publishers Inc.: Hauppauge, NY, USA, 2012. [Google Scholar]
- Whitaker, C.M.; Dostalek, F.J. Performance of the EPRI high concentration photovoltaic module. In Proceedings of the Conference Record of the Twenty-Second IEEE Photovoltaic Specialists Conference, Las Vegas, NV, USA, 7–11 October 1991; Volume 1, pp. 512–517. [Google Scholar] [CrossRef]
- Papis-Frączek, K.; Sornek, K. A Review on Heat Extraction Devices for CPVT Systems with Active Liquid Cooling. Energies 2022, 15, 6123. [Google Scholar] [CrossRef]
- Aydin, E.; Tuncel, B.; Akinoglu, B.G. A Concentrating Mini Solar Power System to Overcome the Market Share. In Proceedings of the 2020 2nd International Conference on Photovoltaic Science and Technologies, PVCon, Ankara, Turkey, 30 November–2 December 2020. [Google Scholar] [CrossRef]
- Youssef, W.B.; Maatallah, T.; Menezo, C.; Nasrallah, S.B. Assessment viability of a concentrating photovoltaic/thermal-energy cogeneration system (CPV/T) with storage for a textile industry application. Sol. Energy 2018, 159, 841–851. [Google Scholar] [CrossRef]
- Felsberger, R.; Buchroithner, A.; Gerl, B.; Schweighofer, B.; Wegleiter, H. Design and testing of concentrated photovoltaic arrays for retrofitting of solar thermal parabolic trough collectors. Appl. Energy 2021, 300, 117427. [Google Scholar] [CrossRef]
- Turkey’s First Concentrated Solar Power Built in Southern City—HELIOSCSP. Available online: https://helioscsp.com/concentrated-solar-power-csp-technologies-status-and-analysis/ (accessed on 7 December 2023).
- Concentrated Solar Power Had a Global Total Installed Capacity of 6451 MW in 2019. Available online: http://en.cnste.org/html/news/2020/0204/613.html (accessed on 7 December 2023).
- Quaschning, V. Technical and economical system comparison of photovoltaic and concentrating solar thermal power systems depending on annual global irradiation. Sol. Energy 2004, 77, 171–178. [Google Scholar] [CrossRef]
- Felsberger, R.; Buchroithner, A.; Gerl, B.; Schweighofer, B.; Preßmair, R.; Mitter, T.; Wegleiter, H. Optical performance and alignment characterization of a parabolic trough collector using a multi-junction CPV solar cell. Sol. Energy 2022, 239, 40–49. [Google Scholar] [CrossRef]
- Felsberger, R.; Buchroithner, A.; Gerl, B.; Wegleiter, H. Conversion and Testing of a Solar Thermal Parabolic Trough Collector for CPV-T Application. Energies 2020, 13, 6142. [Google Scholar] [CrossRef]
- Al-Maliki, W.A.K.; Khafaji, H.Q.A.; Wahhab, H.A.A.; Al-Khafaji, H.M.H.; Alobaid, F.; Epple, B. Advances in Process Modelling and Simulation of Parabolic Trough Power Plants: A Review. Energies 2022, 15, 5512. [Google Scholar] [CrossRef]
- Green, M.A. Solar Cells: Operating Principles, Technology, and System Applications. 1982. Available online: https://ui.adsabs.harvard.edu/abs/1982ph...book.....G/abstract (accessed on 7 December 2023).
- Ceballos, M.A.; Pérez-Higueras, P.J.; Fernández, E.F.; Almonacid, F. Tracking-Integrated CPV Technology: State-of-the-Art and Classification. Energies 2023, 16, 5605. [Google Scholar] [CrossRef]
- Renno, C.; Petito, F. CPV System Optical Performance Evaluation by Means of Direct Experimental Measurement Procedure. Energies 2024, 17, 1288. [Google Scholar] [CrossRef]
- El Himer, S.; El Ayane, S.; El Yahyaoui, S.; Salvestrini, J.P.; Ahaitouf, A. Photovoltaic Concentration: Research and Development. Energies 2020, 13, 5721. [Google Scholar] [CrossRef]
- Renno, C.; Perone, A.; D’agostino, D.; Minichiello, F. Performance Evaluation of a Linear CPV/T System in Different Working Conditions. Energies 2023, 16, 2115. [Google Scholar] [CrossRef]
- Liu, Y.; Hu, P.; Zhang, Q.; Chen, Z. Thermodynamic and optical analysis for a CPV/T hybrid system with beam splitter and fully tracked linear Fresnel reflector concentrator utilizing sloped panels. Sol. Energy 2014, 103, 191–199. [Google Scholar] [CrossRef]
- Segev, G.; Kribus, A. Performance of CPV modules based on vertical multi-junction cells under non-uniform illumination. Sol. Energy 2013, 88, 120–128. [Google Scholar] [CrossRef]
- Lokeswaran, S.; Mallick, T.K.; Reddy, K.S. Design and analysis of dense array CPV receiver for square parabolic dish system with CPC array as secondary concentrator. Sol. Energy 2020, 199, 782–795. [Google Scholar] [CrossRef]
- Baig, H.; Heasman, K.C.; Mallick, T.K. Non-uniform illumination in concentrating solar cells. Renew. Sustain. Energy Rev. 2012, 16, 5890–5909. [Google Scholar] [CrossRef]
- Malik, M.Z.; Shaikh, P.H.; Zhang, S.; Lashari, A.A.; Leghari, Z.H.; Baloch, M.H.; Memon, Z.A.; Caiming, C. A review on design parameters and specifications of parabolic solar dish Stirling systems and their applications. Energy Rep. 2022, 8, 4128–4154. [Google Scholar] [CrossRef]
- Tawfik, M.; Tonnellier, X.; Sansom, C. Light source selection for a solar simulator for thermal applications: A review. Renew. Sustain. Energy Rev. 2018, 90, 802–813. [Google Scholar] [CrossRef]
- Mellor, A.; Domenech-Garret, J.L.; Chemisana, D.; Rosell, J.I. A two-dimensional finite element model of front surface current flow in cells under non-uniform, concentrated illumination. Sol. Energy 2009, 83, 1459–1465. [Google Scholar] [CrossRef]
- Despeisse, M.; Ballif, C.; Faes, A.; Lachowicz, A. Metallization and Interconnection for Silicon Heterojunction Solar Cells and Modules. Photovolt. Int. 2015, 30, 1–5. [Google Scholar]
- Tepner, S.; Lorenz, A. Printing technologies for silicon solar cell metallization: A comprehensive review. Prog. Photovolt. Res. Appl. 2023, 31, 557–590. [Google Scholar] [CrossRef]
- Mono p-Type Cells. Available online: https://www.heraeus.com/en/hpt/products_solutions_photovoltaics/silver_pastes/ptype_cells.html#tabs-307820-9 (accessed on 10 January 2024).
- G173-03; Standard Tables for Reference Solar Spectral Irradiances: Direct Normal and Hemispherical on 37° Tilted Surface. ASTM International: West Conshohocken, PA, USA, 2020.
- Compass. Available online: https://compass.astm.org/document/?contentCode=ASTM%7CG0173-03R20%7Cen-US&proxycl=https%3A%2F%2Fsecure.astm.org&fromLogin=true (accessed on 11 December 2023).
- AM1.5G; Standard Solar Spectrum. ASTM International: West Conshohocken, PA, USA, 2020.
- Almora, O.; Cabrera, C.I.; Garcia-Cerrillo, J.; Kirchartz, T.; Rau, U.; Brabec, C.J. Quantifying the Absorption Onset in the Quantum Efficiency of Emerging Photovoltaic Devices. Adv. Energy Mater. 2021, 11, 2100022. [Google Scholar] [CrossRef]
- pv-Tools: TLM-SCAN+. Available online: http://www.pv-tools.de/products/tlm-scan/start-tlm.html (accessed on 8 December 2023).
- Urban, T.; Miiller, M.; Heitmann, J. Full Analysis of Series Resistance Components and Their Degradation in Temperature Cycling of PERC Solar Cells. AIP Conf. Proc. 2022, 2487, 100003. [Google Scholar] [CrossRef]
- Spi-Cell Tester?—Eternalsun Spire—PDF Catalogs|Technical Documentation|Brochure. Available online: https://pdf.directindustry.com/pdf/eternalsun-spire/spi-cell-tester/63104-605568.html (accessed on 10 January 2024).
- Buchroithner, A.; Gerl, B.; Felsberger, R.; Wegleiter, H. Design and operation of a versatile, low-cost, high-flux solar simulator for automated CPV cell and module testing. Sol. Energy 2021, 228, 387–404. [Google Scholar] [CrossRef]
- Santos, D.; Azgın, A.; Castro, J.; Kizildag, D.; Rigola, J.; Tunçel, B.; Turan, R.; Preßmair, R.; Felsberger, R.; Buchroithner, A. Thermal and fluid dynamic optimization of a CPV-T receiver for solar co-generation applications: Numerical modelling and experimental validation. Renew. Energy 2023, 211, 87–99. [Google Scholar] [CrossRef]


| Property | Value | Unit |
|---|---|---|
| Finger sheet resistance | 0.2 | mohm/sq |
| Finger contact resistance | 1 | mohm-cm2 |
| Emitter sheet resistance | 50 | ohm/sq |
| Finger width | 40 | m |
| Busbar width | 2 | mm |
| Wafer Length | Wafer Width | Finger Number | JSC | VOC | Fill Factor | Efficiency |
|---|---|---|---|---|---|---|
| (cm) | (cm) | - | (mA/cm2) | (mV) | (%) | (%) |
| 5 | 2 | 100 | 2261.6 | 730.4 | 81.6 | 22.5 |
| Irradiance (kW/m2) | VOC (V) | ISC (A) | FF (%) | Efficiency (%) | Cell Temperature (°C) |
|---|---|---|---|---|---|
| 25.5 | 0.658 | 2.735 | 0.752 | 16.6 | 26 |
| 40 | 0.644 | 4.108 | 0.730 | 15.1 | 31 |
| 60 | 0.617 | 5.855 | 0.698 | 13.1 | 35 |
| 80 | 0.587 | 7.533 | 0.661 | 11.4 | 38 |
| 101 | 0.552 | 9.053 | 0.640 | 9.9 | 43 |
| 111 | 0.529 | 9.362 | 0.724 | 10.1 | 44 |
| Concentration Ratio (kW/m2) | VOC (V) | ISC (A) | Efficiency (%) | Cell Temperature (°C) | Temperature Coefficient (%(Abs)/K) |
|---|---|---|---|---|---|
| 61 | 0.612 | 5.896 | 12.9 | 35 | - |
| 61 | 0.579 | 5.930 | 11.8 | 51 | −0.0698 |
| 61 | 0.540 | 5.937 | 10.2 | 70 | −0.0801 |
| 61 | 0.521 | 5.920 | 9.7 | 80 | −0.0579 |
| VOC (V) | ISC (A) | FF (%) | Efficiency (%) | Temperature (°C) | |
|---|---|---|---|---|---|
| ODTÜ-GÜNAM | 0.681 | 4.984 | 69.8 | 10.5 | 25 |
| TUG | 0.617 | 5.855 | 69.7 | 13.1 | 35 |
Disclaimer/Publisher’s Note: The statements, opinions and data contained in all publications are solely those of the individual author(s) and contributor(s) and not of MDPI and/or the editor(s). MDPI and/or the editor(s) disclaim responsibility for any injury to people or property resulting from any ideas, methods, instructions or products referred to in the content. |
© 2024 by the authors. Licensee MDPI, Basel, Switzerland. This article is an open access article distributed under the terms and conditions of the Creative Commons Attribution (CC BY) license (https://creativecommons.org/licenses/by/4.0/).
Share and Cite
Aydin, E.; Buchroithner, A.; Felsberger, R.; Preßmair, R.; Azgın, A.; Turan, R.; Keçeci, A.E.; Bektaş, G.; Akinoglu, B. Development of Low-Cost c-Si-Based CPV Cells for a Solar Co-Generation Absorber in a Parabolic Trough Collector. Energies 2024, 17, 2890. https://doi.org/10.3390/en17122890
Aydin E, Buchroithner A, Felsberger R, Preßmair R, Azgın A, Turan R, Keçeci AE, Bektaş G, Akinoglu B. Development of Low-Cost c-Si-Based CPV Cells for a Solar Co-Generation Absorber in a Parabolic Trough Collector. Energies. 2024; 17(12):2890. https://doi.org/10.3390/en17122890
Chicago/Turabian StyleAydin, Elsen, Armin Buchroithner, Richard Felsberger, Rupert Preßmair, Ahmet Azgın, Rasit Turan, Ahmet Emin Keçeci, Gence Bektaş, and Bulent Akinoglu. 2024. "Development of Low-Cost c-Si-Based CPV Cells for a Solar Co-Generation Absorber in a Parabolic Trough Collector" Energies 17, no. 12: 2890. https://doi.org/10.3390/en17122890