Article

The Role of Clean Coal Technologies in the Development of Renewable Energy Sources

by
Aurelia Rybak
1,
Aleksandra Rybak
2,* and
Jarosław Joostberens
1
1
Faculty of Mining, Safety Engineering and Industrial Automation, Silesian University of Technology, 44-100 Gliwice, Poland
2
Department of Physical Chemistry and Technology of Polymers, Faculty of Chemistry, Silesian University of Technology, 44-100 Gliwice, Poland
*
Author to whom correspondence should be addressed.
Energies 2024, 17(12), 2892; https://doi.org/10.3390/en17122892
Submission received: 11 May 2024 / Revised: 10 June 2024 / Accepted: 11 June 2024 / Published: 13 June 2024

Abstract

:
The article presents research on the synergistic impact of clean coal technologies and renewable energy sources on the energy mix in Poland. The main causes of problems that inhibit the development of renewable energy sources and ways to eliminate them are presented. A factor that may undermine the development of renewable energy potential is access to critical raw materials such as rare earth elements. Clean coal technologies will make it possible to survive the transition period for coal-based energy mixes. The CCT solution described in this article will enable the acquisition of rare earth elements necessary for the development of renewable energy sources. The ability to meet the demand for REEs based on elements recovered from fly ash is examined. For this purpose, an analysis of wind electricity production capacities was carried out and a forecast until 2030 was created. A program was written using machine learning and the Gompretz sigmoid model. Based on the forecast, the level of demand for REEs was determined and compared with the supply obtained from fly ash. The authors propose an alternative source of REEs and analyze the relationship between demand and supply of this source.

1. Introduction

Poland’s energy security has so far been based on coal. From 1985 to 2018, the contribution of coal to electricity production in Poland was not lower than 130 TWh per year. In 2019, this share dropped for the first time in 35 years to 120 TWh. The reason for this state of affairs is certainly the European Union’s climate policy and Poland’s Energy Policy. These documents assume the so-called decarbonization of the energy sector. This means that the EU will achieve carbon neutrality by 2050. Coal is to be replaced by renewable energy sources in this process. These provisions are included in the European Green Deal, as well as in the RED (Renewable Energy Directive) [1]. Implementing decarbonization in Poland will require a special amount of work and investment due to the specific nature of the country’s energy mix. Figure 1 presents primary energy consumption in Poland in 2022. It should be noted that coal plays the dominant role. This is mainly due to Poland’s favorable geographical location in terms of access to coal resources.
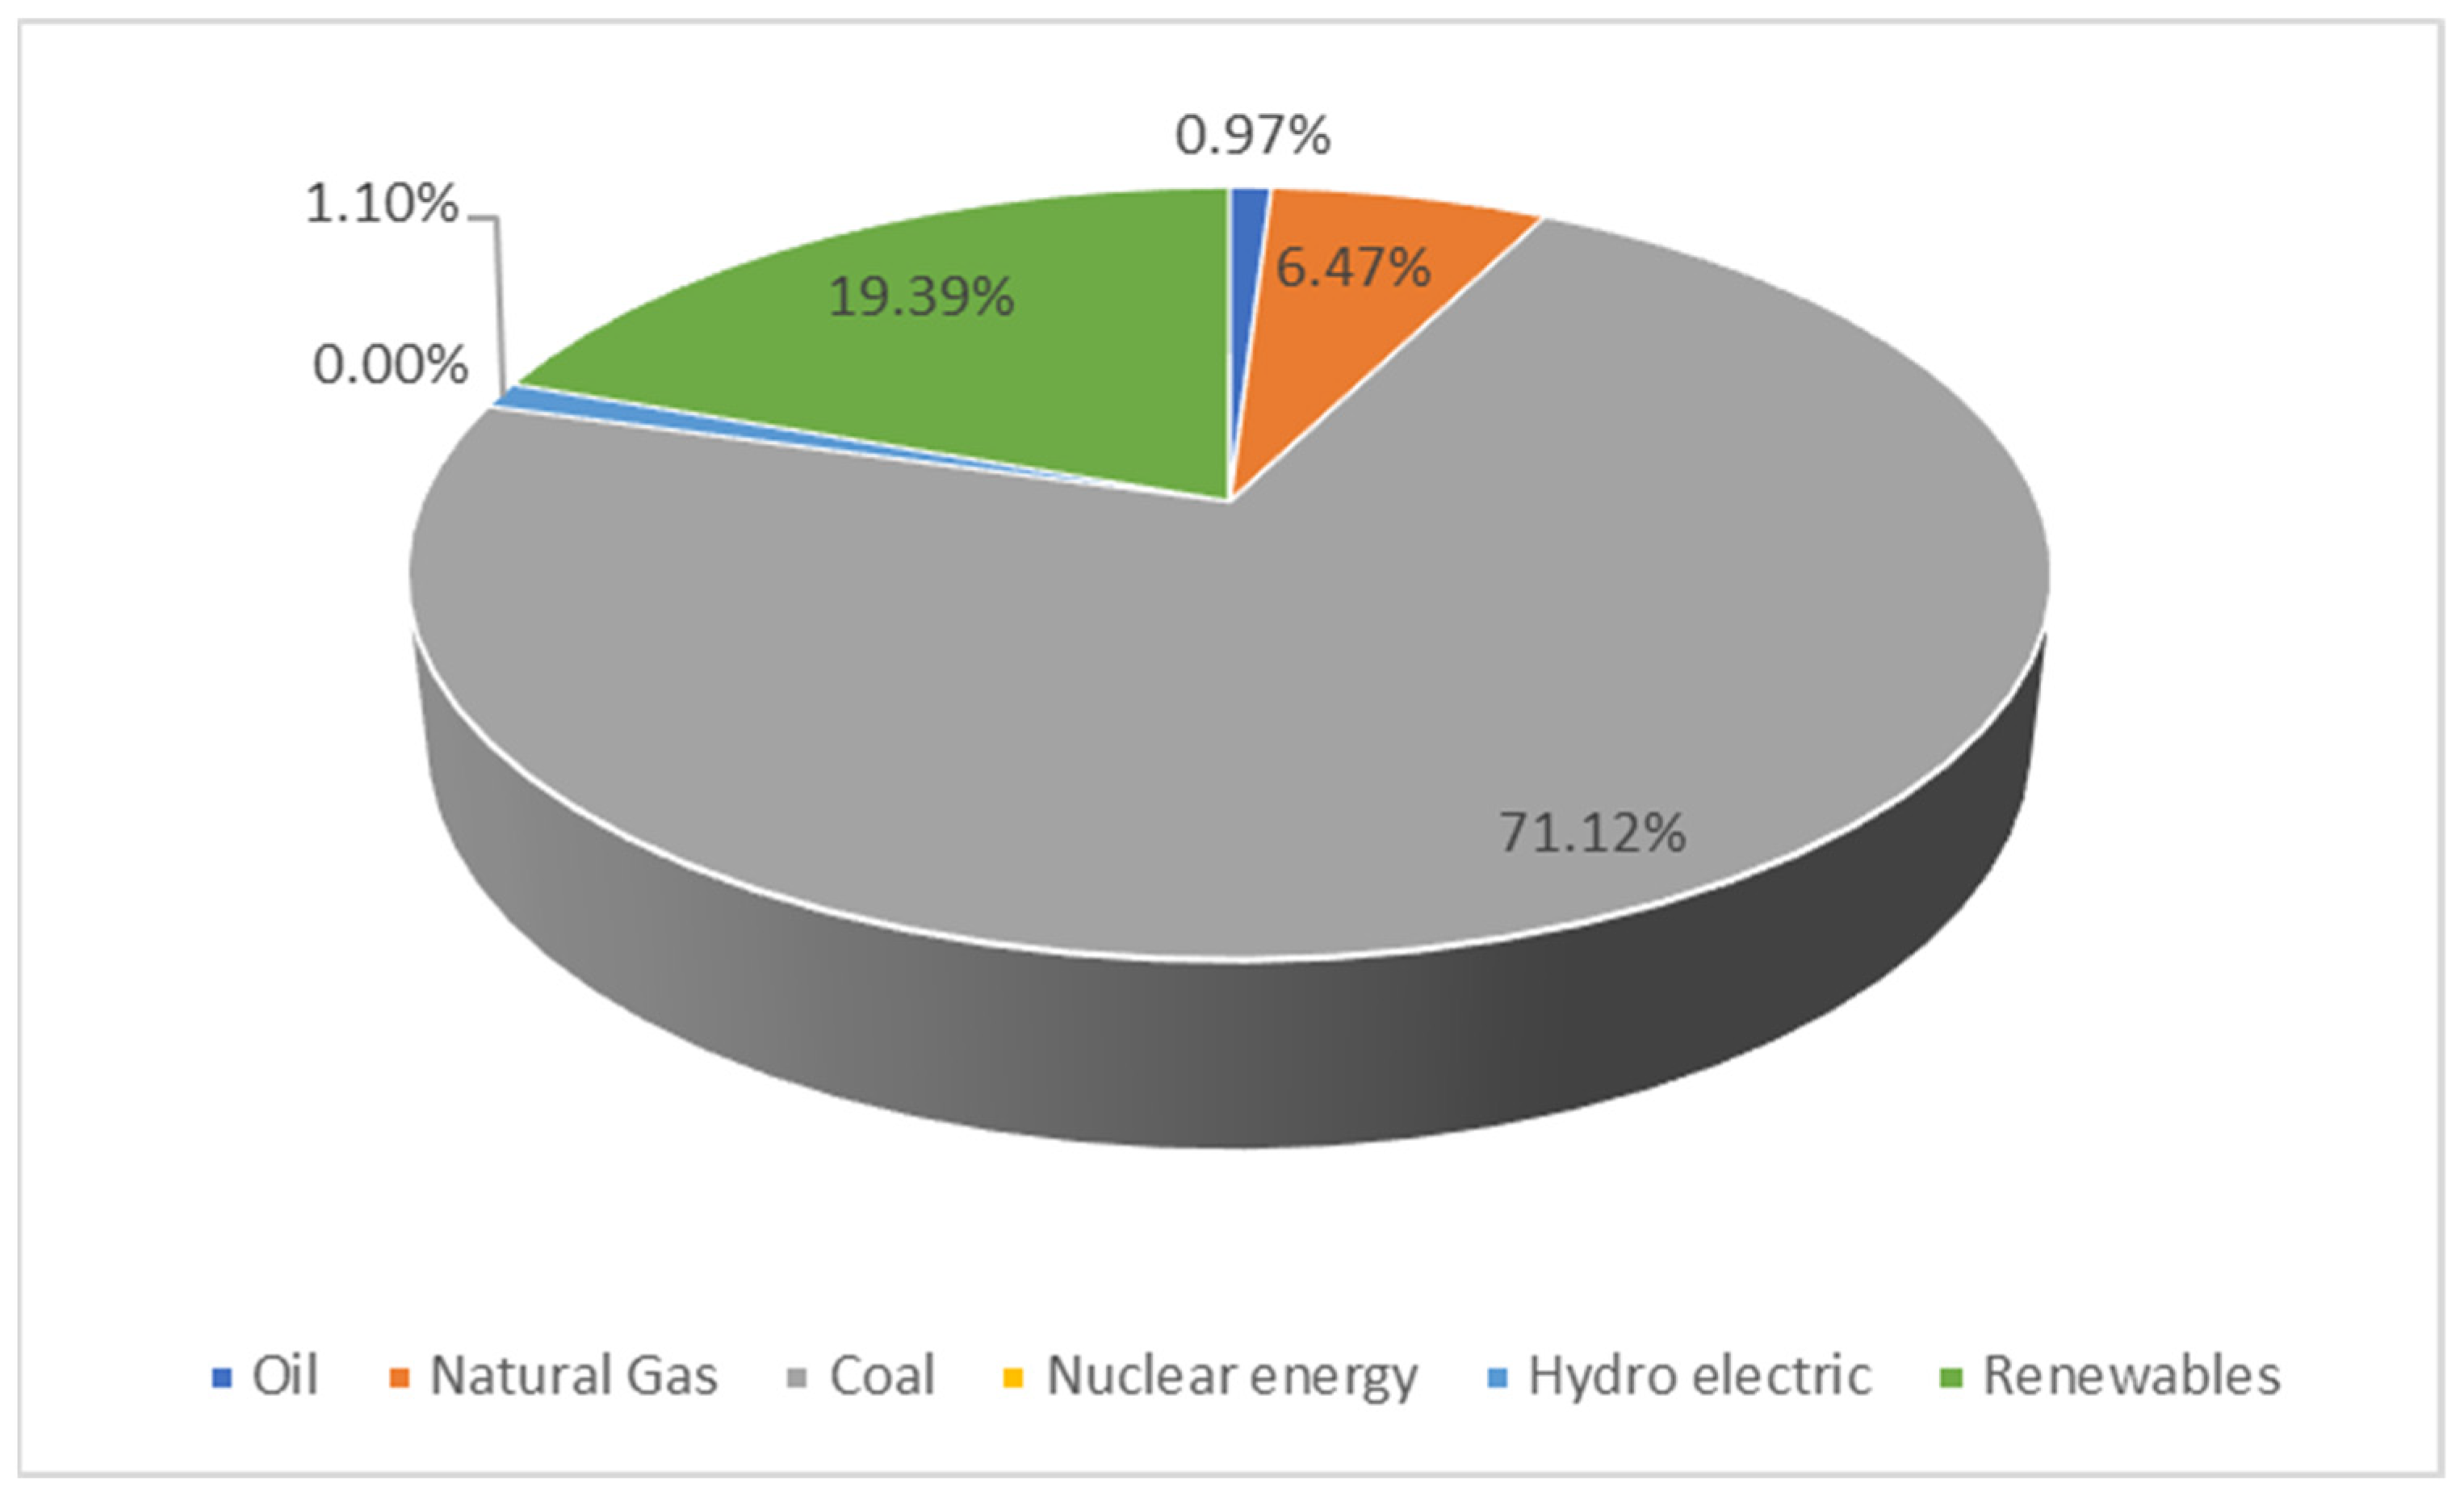
This has naturally shaped the energy system, and easy access to coal fuel influenced decisions to build subsequent coal-fired power plants. Figure 2 presents the structure of energy carriers used in the electricity production process. Once again, coal is of key importance, in this case with a share of over 70%. At the same time, attention should be paid to the share of renewable energy sources (RESs). In both cases it is small, 9% in the case of demand for primary energy and 19% in the case of electricity production. Despite the RES share level in 2022, it should be mentioned that this share is growing very dynamically every year, and in 2007 it was close to zero [3].
However, in order for renewable energy sources (RESs) to take over the role of coal in the energy generation structure, it is necessary to intensively develop them further. This is not an easy task and it will require many support mechanisms, both from the EU, Member States and the private sector. Renewable energy technology is still not perfect and requires technical and organizational development. Some of the problems that hinder the development of renewable energy sources are as follows:
  • Investments necessary to build the capacity to a level that could take over the role of coal.
  • Access to the materials necessary to build this capacity.
  • Storage of the obtained wind and solar energy and using it when needed.
  • Ensuring stable and uninterrupted operation of the power grid.
Fossil fuels can help to solve all of these issues. For Poland, coal is the obvious choice in this case, but used only in combination with clean coal technologies (CCTs).
Clean coal technologies (CCTs) are technological solutions whose purpose is to increase the efficiency of the coal mining, combustion and processing operations [4,5]. It is assumed that the most effective way is to implement a three-stage technology for introducing clean coal technologies in accordance with the Clean Coal Strategy (CCS) [6]. This strategy can be supplemented with a fourth level, which takes into account the use of waste from the energy production process for the development of renewable energy sources (Figure 3). Gaseous waste, mainly CO2, and solid waste such as fly ash can constitute a reservoir of materials necessary to develop renewable energy sources.

1.1. Membrane Techniques

Membrane techniques are a clean coal technology that will allow for the separation of greenhouse gases and the acquisition of key elements that are essential during the production of renewable energy technologies.
The membrane is a layer that is designed to separate two phases of a feed. Due to its properties, the membrane acts as a passive or active barrier that allows transport between the other two phases. Depending on the type of feed, various membranes can be used, the properties of which enable, for example, the separation of harmful gases such as greenhouse gases from the feed, or the acquisition of valuable rare earth metals [7]. The authors conduct research on membranes that enable obtaining the following:
-
greenhouse gases, mainly CO2 from gases produced during the combustion of hard coal,
-
rare earth elements recovered from fly ash generated in the combustion of hard coal.
Mixed matrix membranes, i.e., combinations of a polymer matrix with nanotubes, have been used for greenhouse gas separation [8,9]. The membranes were subjected to numerous modifications, which enabled their efficiency to be increased. The separation process can take place in various ways, for example by diffusion through the membrane, by taking advantage of differences in the solubility of elements in a solution, or by adsorption on the surface of membranes. The air passing through the membrane is divided into two streams: permeate, which is a mixture of gases free of harmful greenhouse gases, and retentate, e.g., CO2. The retentate should be captured and stored for further use. To speed up the search for membranes with the highest efficiency, a computer program was written that allows us to check the properties and performance of the membrane before its physical implementation [10]. For this purpose, mathematical models were used, such as the Maxwell, Bruggeman or Felske models. The use of these models also allowed for verification of the industrial suitability of a given membrane. The Bruggeman model is presented below as an example:
( P r ) 1 / 3 λ d m 1 λ d m P r = ( 1 Φ ) 1
where
Pr—relative permeability of components,
λdm—Pd/Pm permeability ratio,
Φ—volume fraction of filler particles.
A similar process occurs in the case of membranes used for REE (rare earth element) recovery. After passing through the membrane, the separated REEs are purified and concentrated [11]. This makes it possible to obtain the desired chemical compounds. The created computer programs were used to analyze the obtained experimental results and select optimal membranes and sorbents. For this purpose, pseudo-first-order, pseudo-second-order Lagergren, intramolecular diffusion, chemisorption-diffusion and Boyd models were used to investigate various mechanisms.
Additionally, in order to describe the equilibrium partition of REE ions between the liquid and solid phases (adsorbent) for different initial concentrations, appropriate adsorption isotherms were used. For this purpose, the REE_isotherm application was created, which is based on three models: Langmuir, Freundlich and Dubinin–Radushkevich [12,13,14].
An example diffusion-chemisorption model is presented below [15]:
t 0.5 q t = 1 K D C + 1 q e t 0.5
where:
K D C —diffusion-chemisorption constant
q e —adsorption capacity of metal ions at equilibrium state (mg/g)
q t —adsorption capacity of metal ions at time t
t —time (min)
The presented technological solutions will firstly make it possible to keep coal in Poland’s energy mix, and additionally provide valuable substances whose use can accelerate the development of renewable energy sources.
As part of the work carried out on the recovery of REEs from synthetic coal fly ash extracts, selective adsorption membranes were created based on modified chitosan (Schiff’s base) with the addition of a polymer imprinted with an appropriate REE ion, in this case Pr. The obtained experimental data were analyzed using two computer applications, namely REE 2.0 and REE_isotherm 1.0.
Adsorption membranes based on a complex polymer matrix imprinted with praseodymium ions were obtained by casting from a polymer solution. In the first synthesis, a Schiff base based on chitosan was synthesized, from which a solution was prepared in acetic acid, an appropriate amount of praseodymium nitrate (III) was added to it, and then stirred. In the second synthesis, an ion-imprinted copolymer was obtained in the process of copolymerization of the complex of Pr(III), 5,7-dichloroquinoline-8-ol and 4-VP, and styrene-DVB as a monomer and cross-linking agent. The obtained polymer was crushed and dried in an oven at 60 °C for 5 h. In the last stage, 30 wt% praseodymium-imprinted polymer was added to the obtained solution of modified chitosan and dispersed using a mechanical homogenizer, then mixed using a magnetic mixer and ultrasound. After adding the glutaraldehyde solution, it was mixed, poured onto a leveled PTFE Petri dish and the solvent was evaporated at 27 °C in a vacuum dryer. Then, the membrane was washed with water and leached with HCl solution to remove REE ions and obtain specific cavities. The last step was to immerse the membrane in a 1 M sodium hydroxide solution. The obtained membranes were stored in deionized water before use. The membranes thus obtained were subjected to Pr ion adsorption tests, taking into account the influence of pH on the adsorption process, kinetic tests, adsorption isotherms, selectivity tests and reuse of the tested adsorption materials. In this way, the basic parameters were determined, such as qt, i.e., the amount of Pr ions adsorbed at time t [mg/g], adsorption capacity at equilibrium qe [mg/g], Kd, i.e., the partition coefficient and selectivity coefficients k. In turn, experiments related to the reuse of adsorption materials consisted in repeating five subsequent sorption-desorption cycles after regenerating the adsorption membrane using HCl.
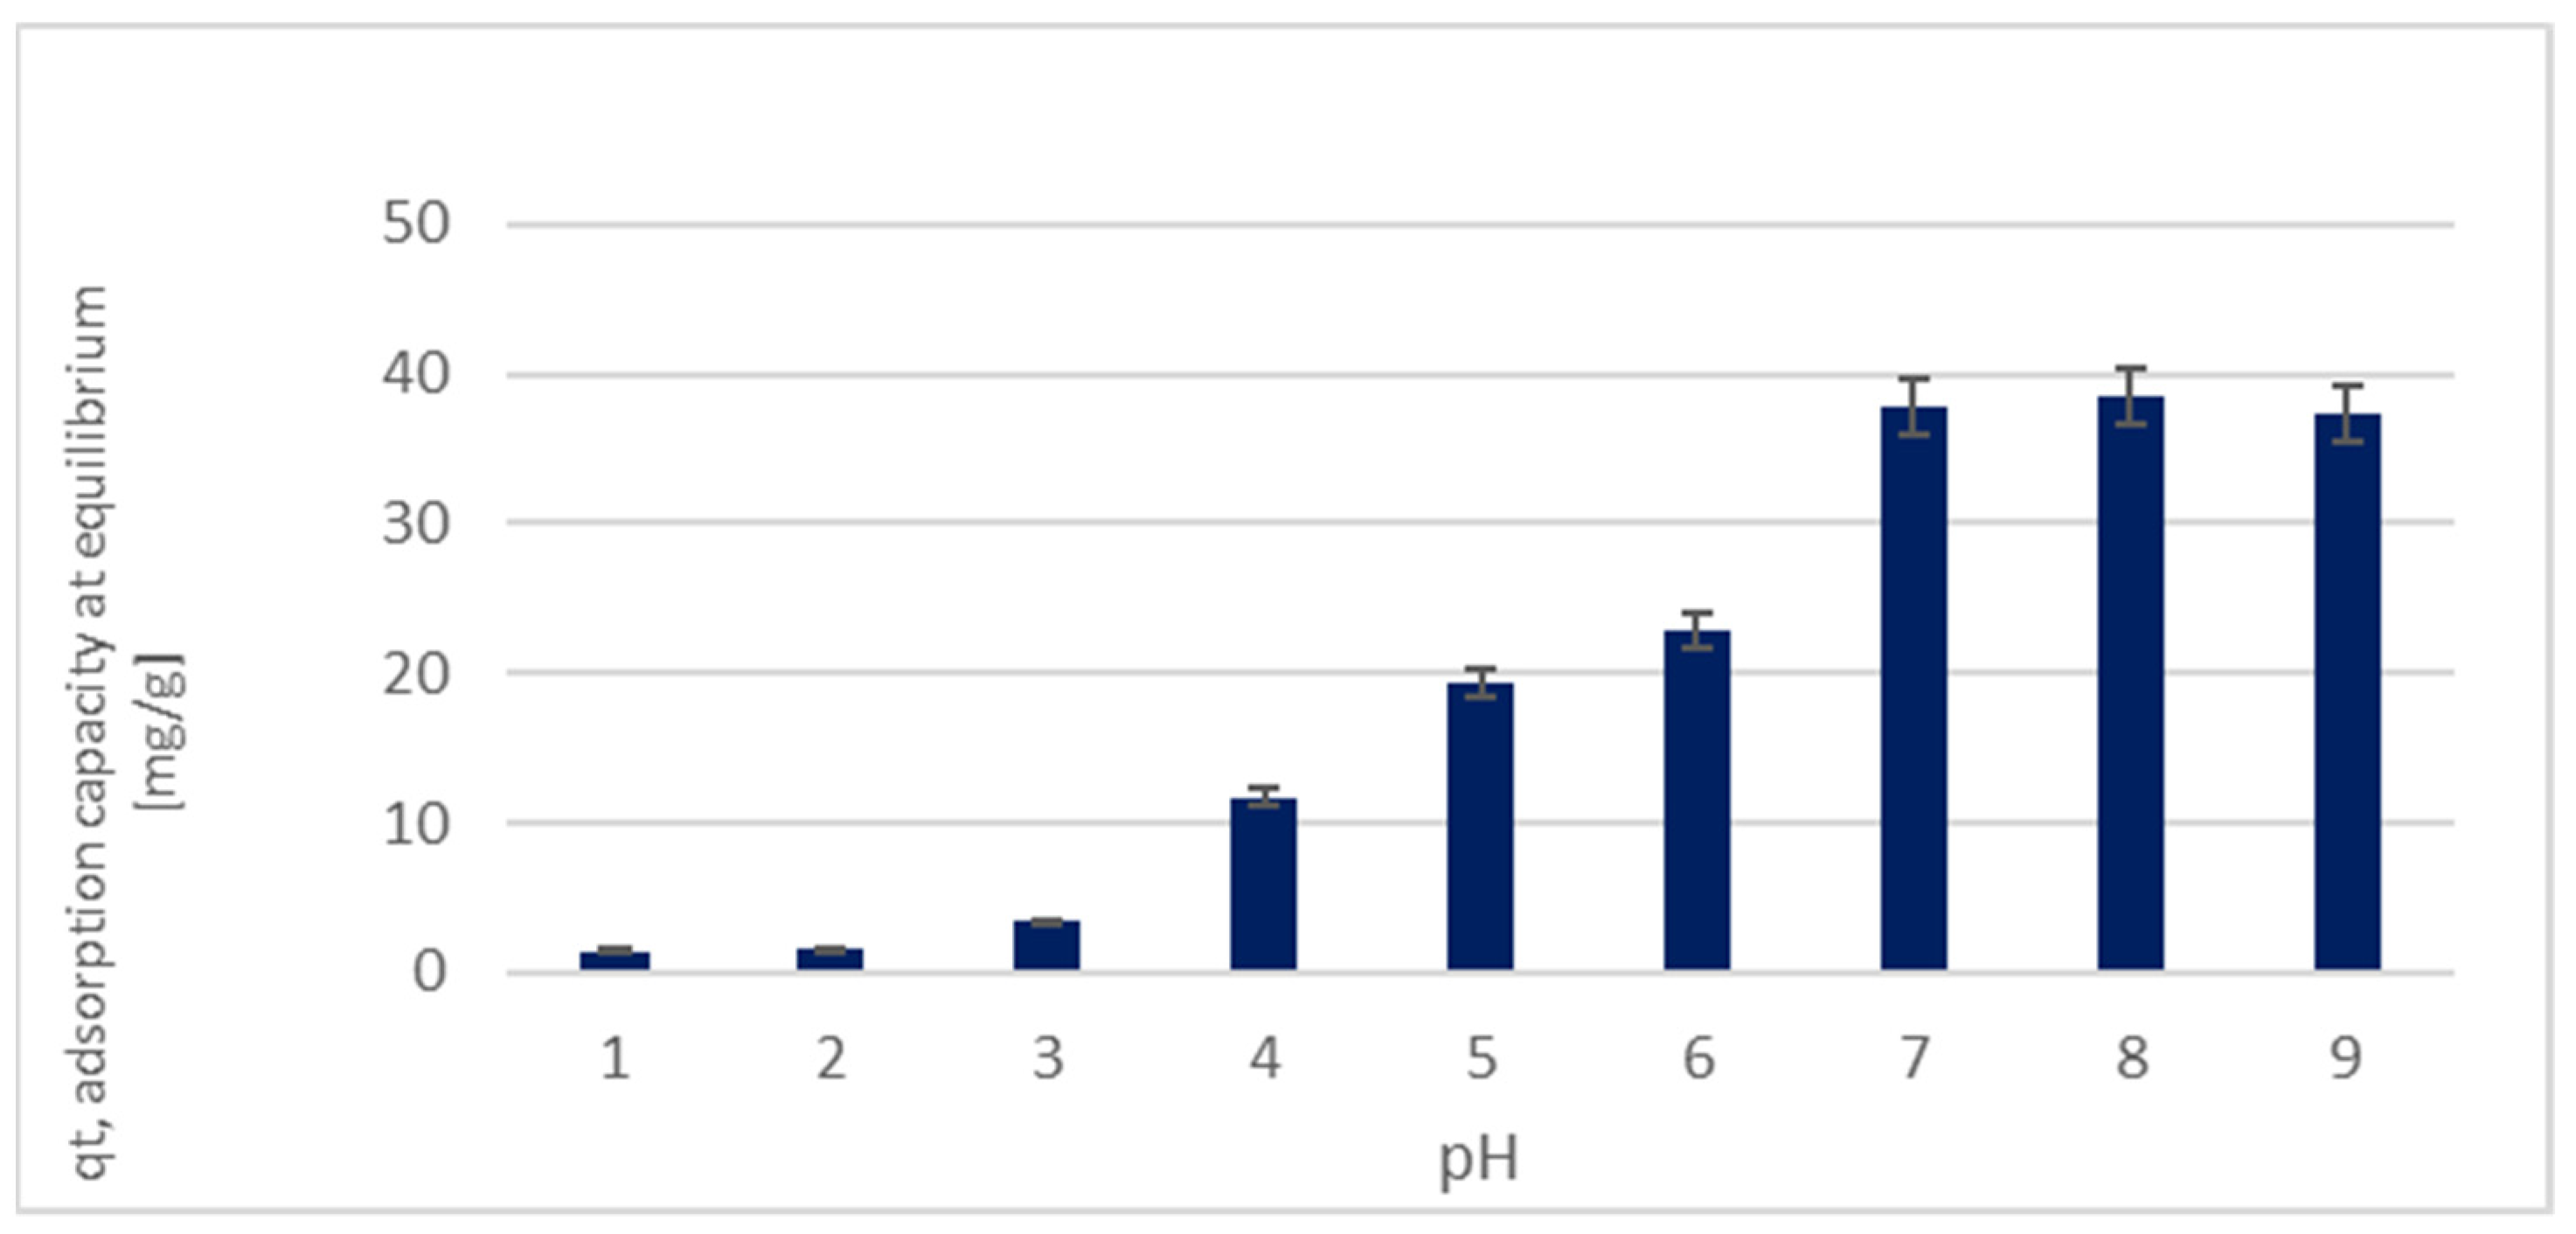
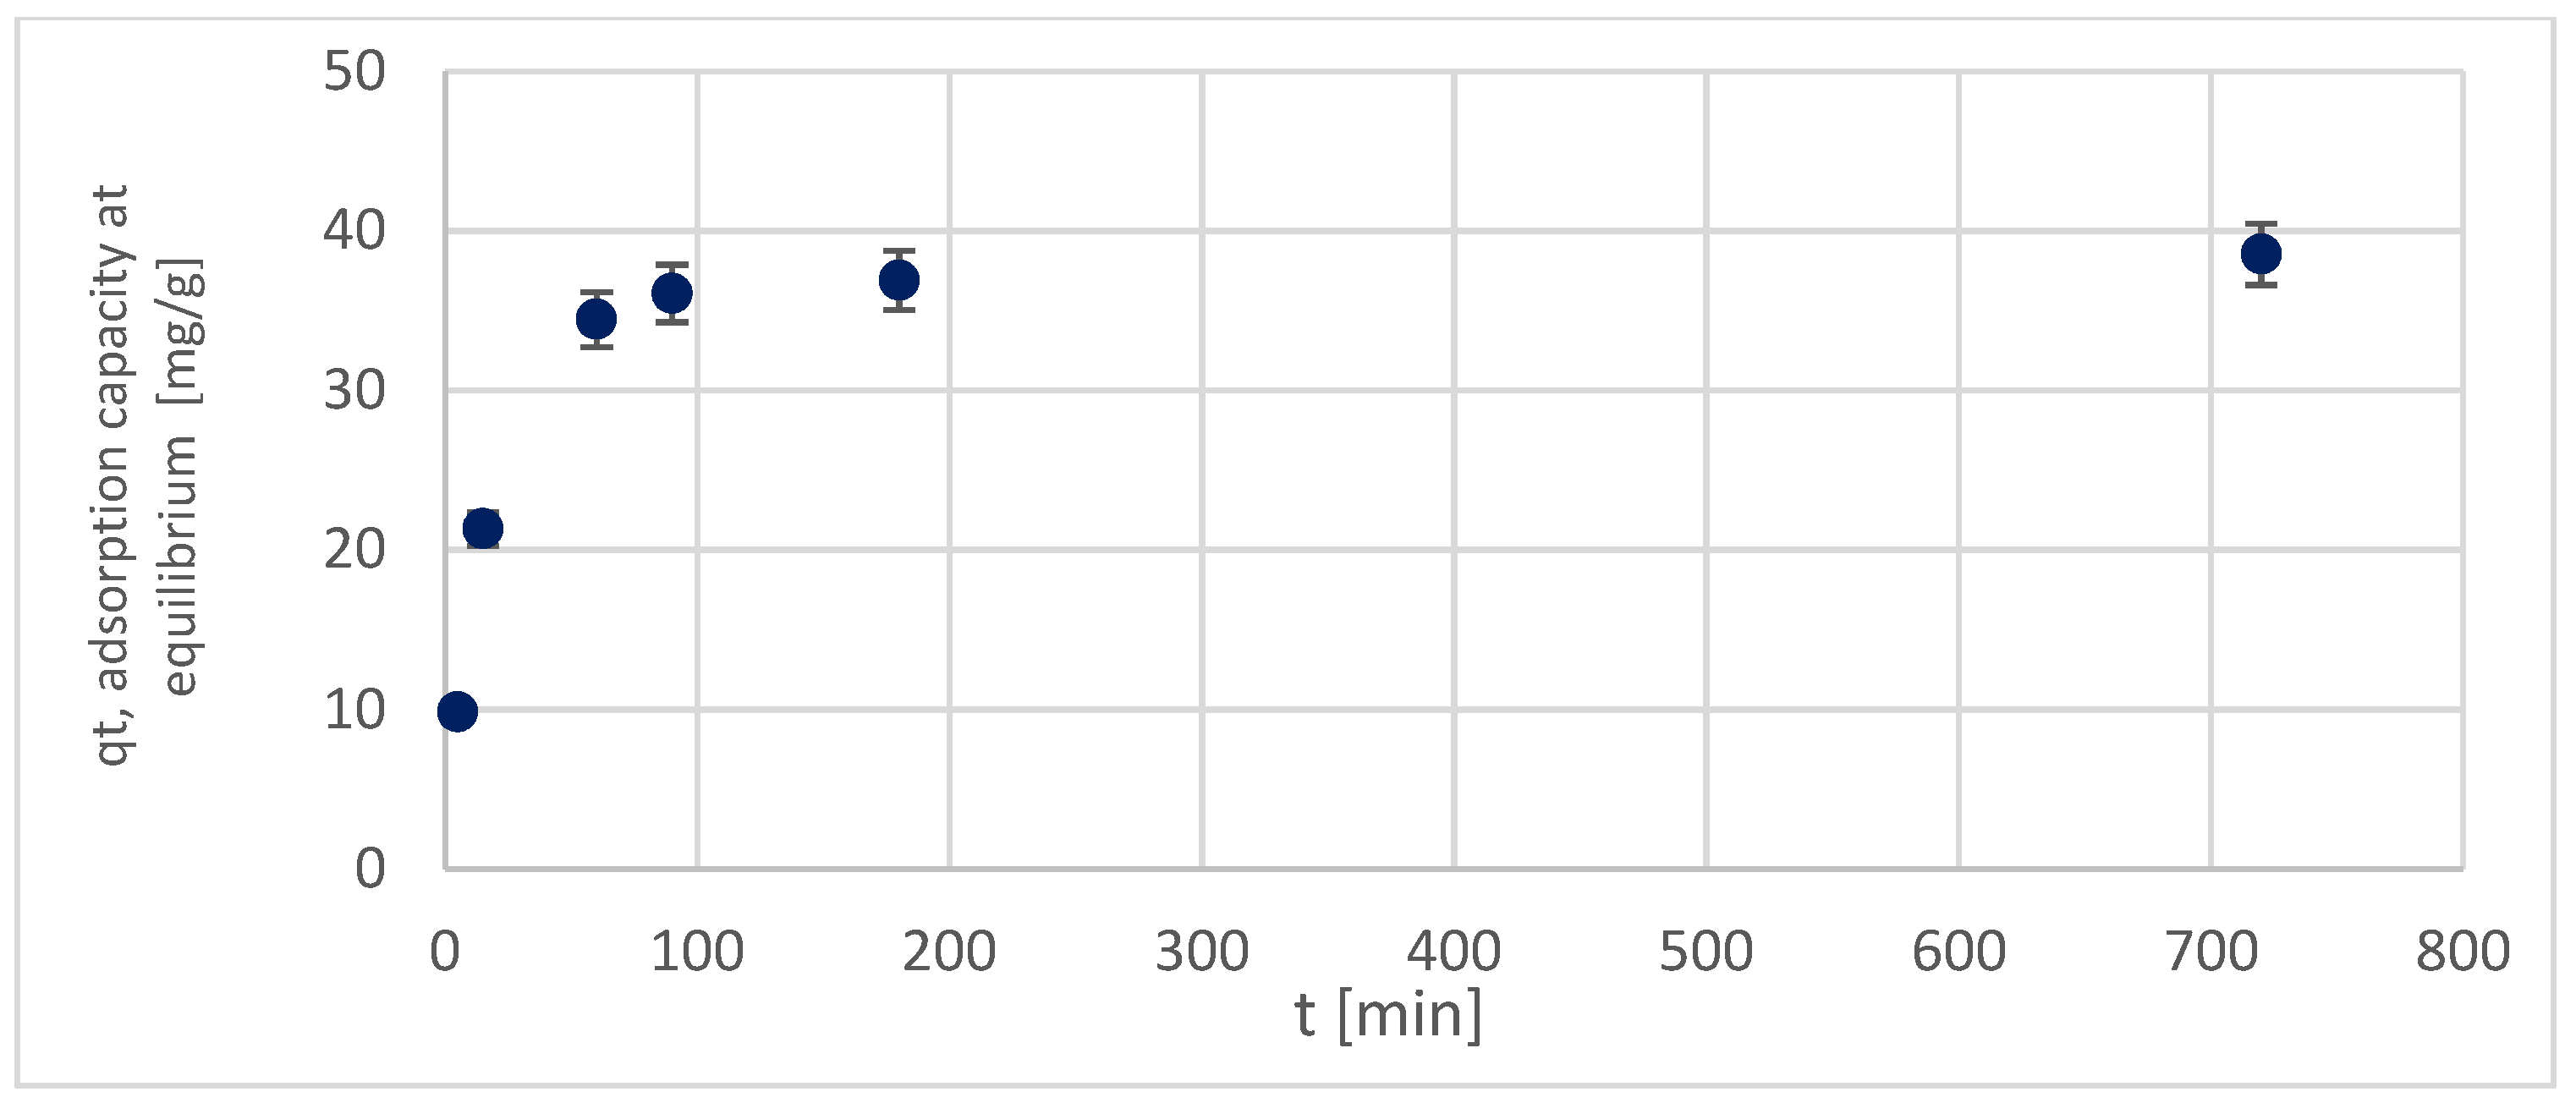
The influence of pH on the adsorption process (Figure 4) was tested for the range between 2.0 and 9.0 and pH = 7.5 was selected as optimal for further research, taking into account the possibility of the precipitation of Pr hydroxides in an alkaline environment. The study of the adsorption kinetics of Pr ions on the synthesized material (Figure 5) showed that changes in adsorption capacity over time were characterized by two main stages, namely a fast initial stage in which over 80% of praseodymium ions were adsorbed within the first 90 minutes and the slow second stage of reaching the equilibrium state. The adsorption process can be controlled by several mechanisms, which were analyzed using the REE 2.0 application. The obtained results are presented in Table 1.
It was found that the experimental data showed the best fit to the pseudo-second-order Lagergren model, which indicates the presence of chemical coordination processes of praseodymium ions in the structure of the tested membrane. Moreover, the good fit to the Elovich model (R2 > 0.85) also indicates the existence of chemisorption, and the differences between the experimental qe values and those obtained from simulations were much smaller for the pseudo-second-order Lagergren model and the chemisorption-diffusion model (R2 > 0, 95). In the case of the intraparticle model, multilinear curves were found (R2 < 0.61), which may indicate the influence of two or more mechanisms on the adsorption process. The plots obtained from the Boyd model were non-linear and none of them passed through the origin, indicating that adsorption is mainly controlled by the diffusion of Pr ions through the liquid film surrounding the adsorbent. In turn, the calculated De value corresponds to values characteristic of chemisorption systems.
Based on the analysis of experimental data using the second computer application, it was found that a much better fit was obtained for the Langmuir model (R2 = 0.848), which indicates a uniform distribution of ion binding sites on the adsorbent surface and exhibits single-layer adsorption features (Table 2). The Dubinin–Radushkevich model is also suitable for describing experimental data (R2 = 0.958) and is an excellent tool for distinguishing between chemical and physical adsorption of metal ions. Three characteristic parameters of this model, namely qm, the KDR [mol2/kJ2] and the average adsorption energy E [kJ/mol] were calculated. As we can see, the value of qm is lower than that determined using the Langmuir model, the value of E, i.e., 122.188 [kJ/mol], is characteristic of the chemisorption process (above 80 kJ/mol). Thus, considering the above-mentioned information, it can be concluded that the binding sites are evenly distributed on the surface of the sorbent, the ion adsorption is mono-layer, and the affinity of the sorbent to praseodymium ions is high.
The next stage of the research was the analysis of selectivity for praseodymium ions towards competitive ions in the form of Nd, Gd, Dy and Y, and matrix ions (Na, Mg, Ca, Al, Fe and Si), which are usually present in coal fly ash extracts. The selectivity of the tested materials was assessed using the Kd parameter, i.e., the distribution coefficient and selectivity coefficients k (Table 3). It was found that the obtained Kd value (1824.529 mL/g) indicates the high efficiency of the tested membrane in recovering praseodymium ions. This may be due to the chelation mechanism (amine groups have the ability to coordinate Pr3+ ions) and the synergy of the steric effect of imprinting cavities for Pr3+ ions (the size of the cavities obtained is specific for individual REE ions), showing a strong adsorption interaction with the analyzed ions.
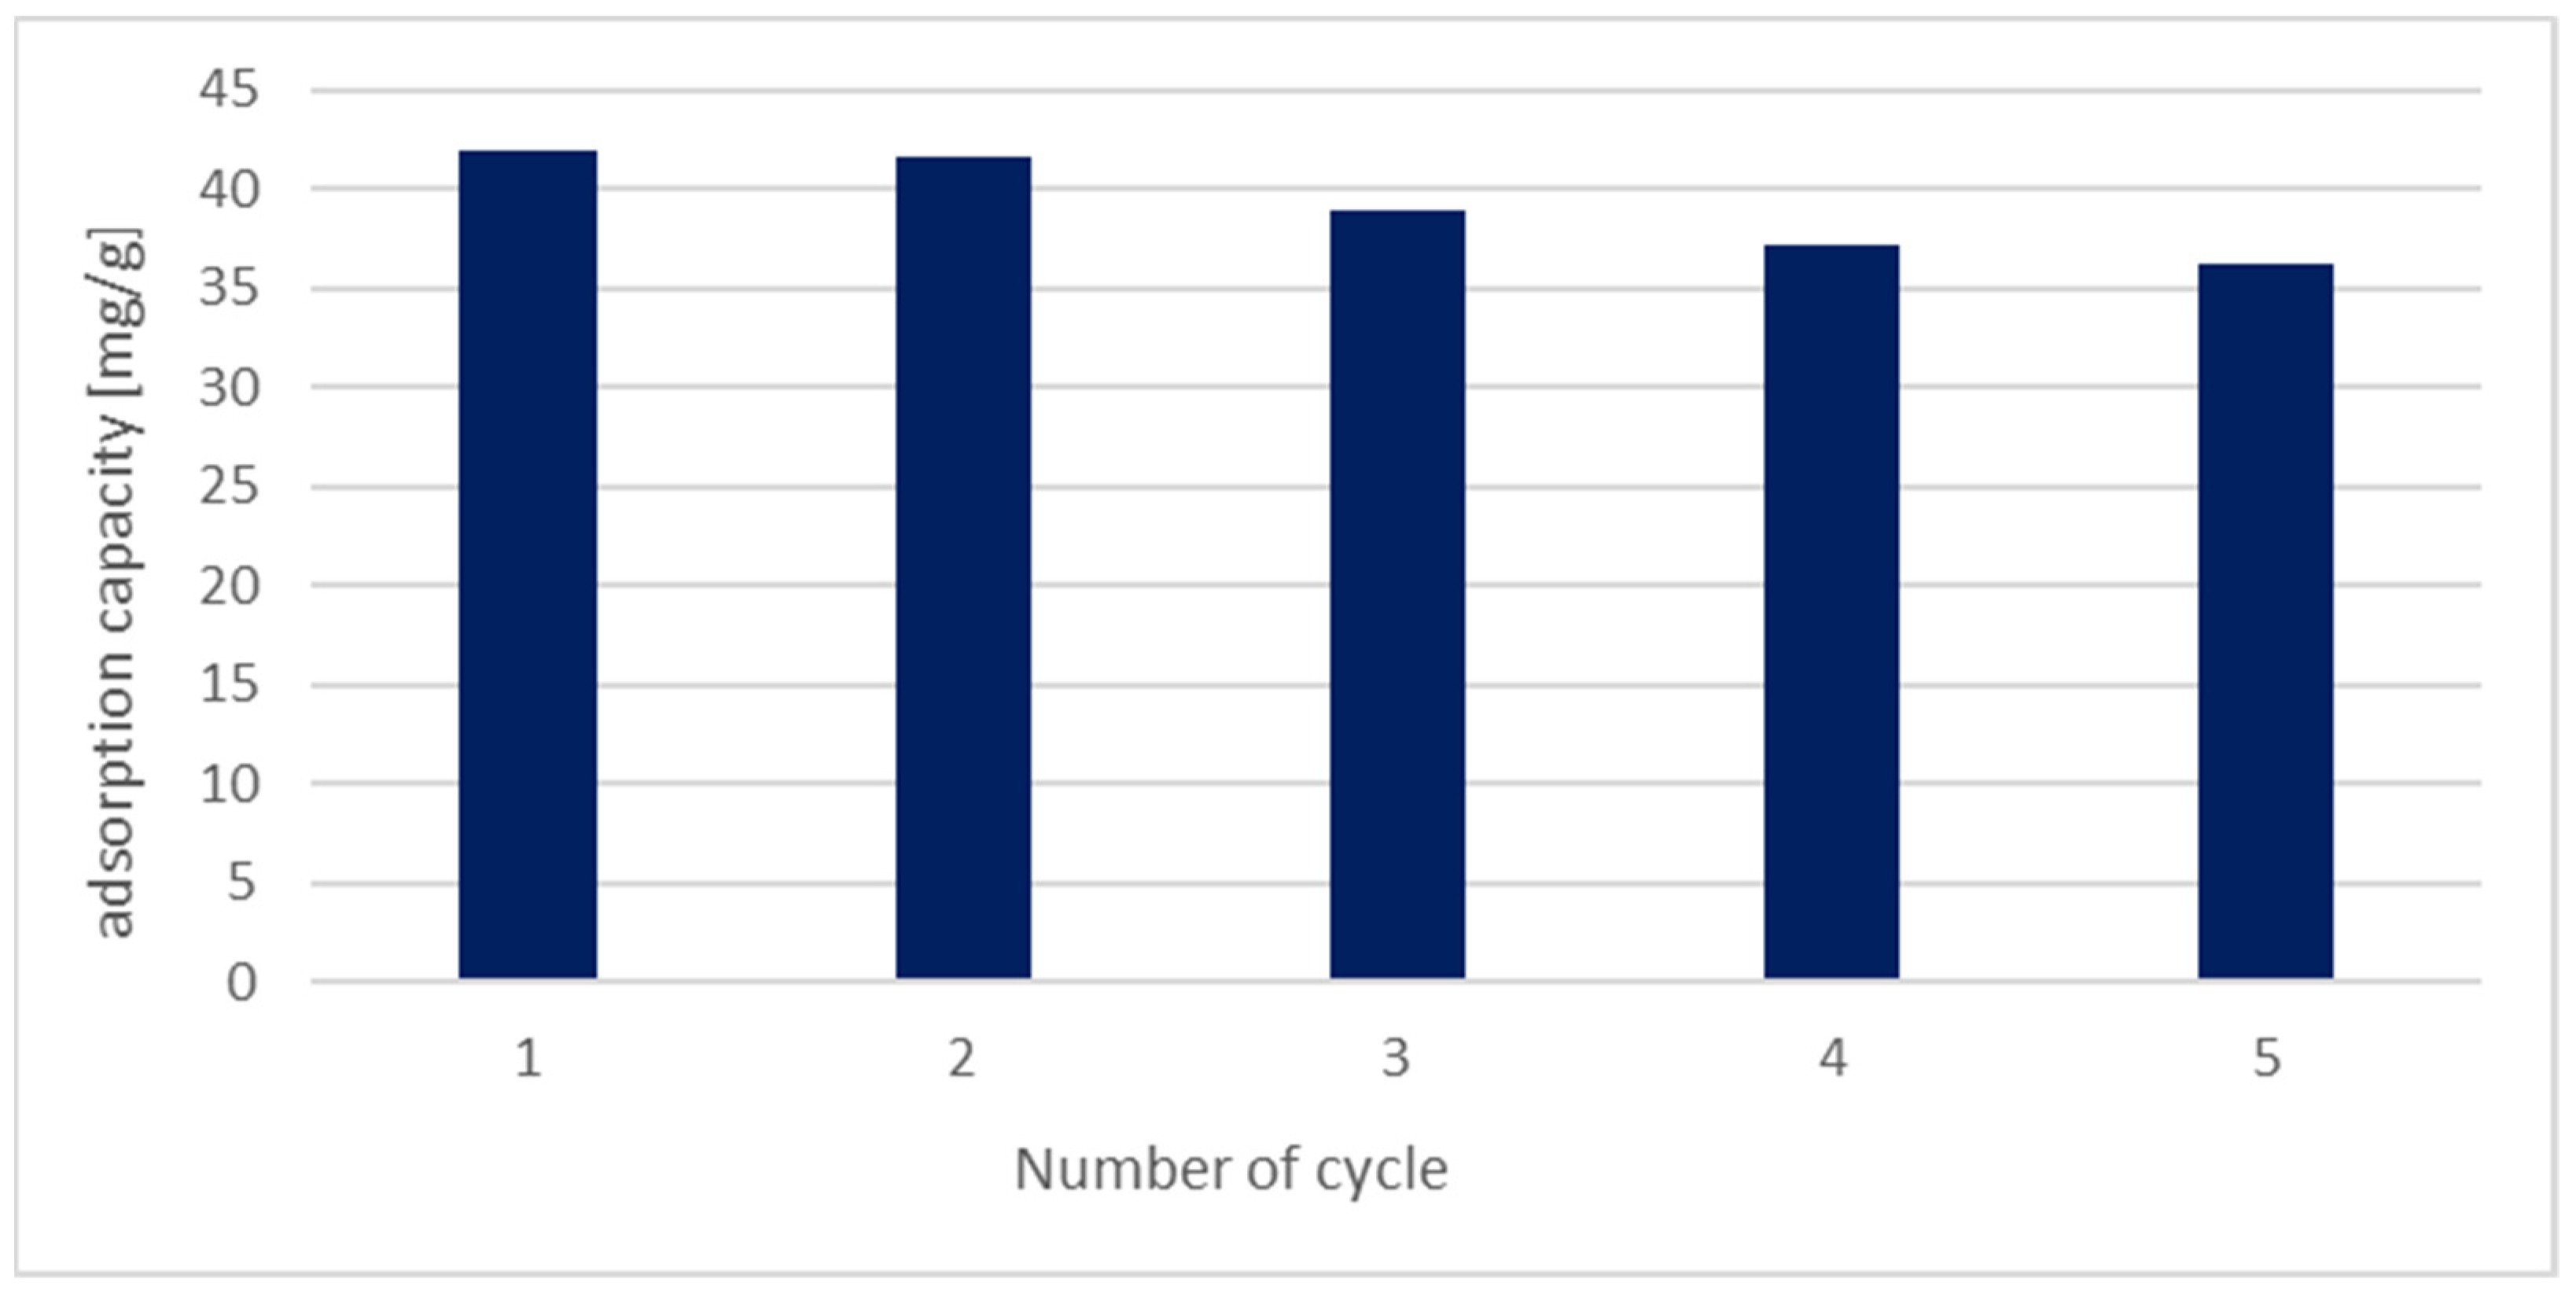
However, the results of reuse tests of the analyzed adsorption material based on PrIIPs are presented in Figure 6 and a slight decrease in adsorption capacity was found after the first cycle and 85% of the value from one cycle after all five adsorption–desorption cycles. This indicates the possibility of potentially using the synthesized IIPs as adsorbents for the recovery of praseodymium ions. Moreover, the recovery of Pr3+ ions from the solution using the analyzed membrane was 81.73%.

1.2. The Impact of CCT on the Development of Renewable Energy Sources

The authors’ proposed solutions to all the problems that delay and inhibit the development of renewable energy sources are mentioned in the previous section.

1.2.1. The Use of CO2 for Energy Production

CO2 recovered using membrane techniques can be used in energy storage technologies. Currently, a project enabling the use of industrial carbon dioxide in a closed circuit is being developed. CO2 is compressed in liquefied form and stored in tanks until it is expanded again in the turbine. The efficiency of the installation is approximately 75% [16]. This type of warehouse has an advantage over alternative solutions, mainly due to the availability of materials and the ease of finding construction locations. Carbon dioxide can also be used in the process of obtaining geothermal energy, where it successfully replaces water used as an energy carrier in a closed-circuit installation [17]. CO2 can also serve as an additional factor supporting a geothermal system based on a water installation. In this case, the gas serves to increase the water pressure in the geothermal reservoir [18].

1.2.2. Fly Ash as a Source of REEs

The rare earth elements (REEs) are a group of 17 metals including yttrium, scandium, promethium, samarium, terbium, cerium, neodymium, praseodymium, gadolinium, holmium, erbium, thulium, lanthanum, ytterbium, lutetium, europium and dysprosium [19]. REEs are metals without which technological development would be impossible. This applies to both renewable energy sources and technological achievements that accompany people in everyday life and without which it would be impossible to lead life as we know it. They are used in the production of high-intensity lighting, automotive catalytic converters, magnets, cameras, lasers, cell phones, computers, X-ray machines, magnetic resonance imaging equipment, nuclear reactors, medicine and many other technologies [20,21].
Taking into account the subject of the research conducted here, the most important consideration is the role of rare earth elements in the energy transformation. Because the demand for REEs is huge and constantly growing, and the sources are limited, they have been placed by the European Union on the list of critical raw materials [22]. Limited access to REEs means that their prices are very high and tend to increase rapidly [23]. Almost the entire demand for REEs in the EU is covered by elements imported from China, which dominates the market for these raw materials [24,25]. Even though REE deposits are also located in India, Brazil, Russia, the United States and Australia, approximately 90% of imports to the EU come from China [26]. Such a large share of one source in the supply of raw materials poses a threat to the EU’s energy security. It is believed that in order to properly diversify the supply of raw materials, the share of one source should not exceed 30% [27]. Therefore, it seems necessary to look for new sources of REEs. The problem deepens when REEs’ contribution to energy transition is taken into account. 30% of REEs produced in 2020 were used in the production of permanent magnets and 15% in the production of electric vehicles. In total, 10% of the magnets made were used in the production of wind turbines [28]. Due to the further development of renewable energy sources, it is estimated that in 2030 the number of electric vehicles sold will increase by ten times and the number of wind turbines will double. Since this development is a global trend, there may soon be a shortage of elements on the market, without which the expansion of renewable energy sources will be impossible. Therefore, it is necessary to look for alternative sources of obtaining REEs. Since the Polish energy system is still based on coal, Poland has access to large amounts of fly ash. This constitutes a waste product of the coal combustion process in the production of electricity and heat. REEs are contained in coal, but their amount is usually so small that it is economically unjustifiable to obtain REEs from this raw material. Ashes, in turn, are a concentration of substances that have not been degraded during the combustion of organic matter. REEs are present in ashes resulting from the combustion of Polish coal in the following amounts: light REEs—neodymium, lanthanum, cerium, praseodymium—0.03% and heavy elements 0.015% [29]. Such concentrations make the REE separation process profitable, as does the fact that it eliminates the need to mine REE-rich ores, and also provides many elements at the same time, which is usually not the case during traditional mining.

1.2.3. Stability of the Power System

Renewable energy sources such as wind turbines or photovoltaics are characterized by variable efficiency and lack of continuity of operation. Their effectiveness depends directly on weather conditions and, in the case of photovoltaics, also on the time of day. Due to the growing share of renewable energy sources in Poland’s energy mix, this lack of stability has an increasingly negative impact on the energy system. The unbalanced demand and supply of renewable energy is mainly due to the fact that solar energy is supplied during the day and increased demand for energy occurs in the evening. Additionally, the amount of renewable energy investments is not evenly distributed throughout the country; there are areas with a large amount of investments and those where their amount is negligible. Therefore, in the near future it will be necessary to put emphasis on increasing the flexibility of energy networks, as well as building energy storage facilities to store it until it is needed.
Therefore, renewable energy alone cannot ensure unwavering access to electricity, which in turn is one of the pillars of energy security. Energy should be available at the required time, quantity and place to ensure energy security. Therefore, it is necessary to stabilize the energy system, which is currently only possible through the use of conventional energy sources.
The authors aimed to verify the development of one of the renewable energy sources—wind energy—and the suitability of fly ash for the development of this source. Wind energy is the second largest source of renewable energy in Poland. Land farms and their further development were taken into account because all wind energy obtained in Poland comes from onshore farms, so the analyzed time series concerned only this energy source. Poland’s Energy Policy until 2040 (PEP2040) assumes the development of offshore wind energy. By 2030, their installed capacity is expected to be approximately 6 GW, and by 2040—11 GW. First, an electricity production capacities forecast was built for up to 2030, i.e., until the year when offshore farms are to be added to the energy mix. A machine programming algorithm using the Gompretz model was used to build the forecast. In the next step, it was calculated how many REEs would be needed to build the designated wind turbine potential. It was also determined how many REEs could be recovered from fly ash per year and this amount was related to the RES demand for REEs. The model used in the written computer program is described below.

2. Materials and Methods

The Gompretz model is an example of one of the sigmoid models [30]. The model makes it possible to describe data whose growth is the slowest in the initial phase of the analysis period, then the dependent variable increases dynamically, and as it approaches the upper asymptote, the growth rate stabilizes. The model was created in 1825 by Benjamin Gompretz to describe the mortality of the human population. Then it was used primarily in medicine and biology [31]. The model describes asymmetric data growth with fixed inflection points. It has been modified many times and comes in many varieties. The research used a type I model described by the following equation [32]:
y t = A × e e k ( t t m )
where:
A —upper asymptote of the y function,
t —time,
k —growth rate coefficient,
t m —the time at which the function inflects.
The accuracy of the model and the forecast results obtained using the model were determined using the coefficient of determination and the Mean Absolute Percentage Error (MAPE) [33,34].
R 2 = i = 1 n ( y t ^ y ) i = 1 n ( y t y ¯ )
M A P E = i = 1 n e t / y t n
where:
y t —value of the explained variable in period t,
y t ^ —forecast value,
n—number of observations,
e t —forecast error.

3. Results and Discussion

The Gompretz Estimation program was written to build the sigmoid model. The volume of wind energy production in the years 1998–2022 was introduced into the program as a dependent variable. The program builds the Gompretz model based on the initial parameter values entered by the user. Then, the program optimizes the initial value of the parameters A, k and tm by minimizing the square of the model residuals, i.e., the differences between the empirical and theoretical values. After determining the optimal parameters, the program determines the forecast of the explained variable, the coefficient of determination and the MAPE error. The program uses machine learning (ML). For this purpose, the Apache Commons Math Library [35] was used. Supervised machine learning was implemented, which means that the program also received information about the expected model output. ML makes it possible to find relationships within input data [36]. Once a pattern is found, it can be used to predict future states of the explained variable—the model output. Thanks to the use of machine learning, the program can optimize the parameters of the Gompretz model without directly programming them.
The sigmoid model is a special type of mathematical model that does not require the introduction of a stationary variable as the dependent variable [37]. The analyzed time series contains an upward trend, the pace of which is slow in the initial phase; then, after the inflection point the amount of energy produced using wind technology accelerates significantly. The authors decided to maintain the trend of the time series so that this important feature of the analyzed data could be taken into account. In this case, the time series could also be described by other models, e.g., exponential. However, the sigmoid model made it possible to determine the upper asymptote towards which the time series tends. Therefore, it provides more reliable results considering, among other factors, the capabilities of the energy network and the variability and uncertainty of wind energy production. In addition, in 2023, the installed capacity of onshore wind farms in Poland was 8.6 GW, which already exceeded the assumptions of the Polish Energy Policy until 2040, and it is energy policy that determines the direction and pace of the country’s energy transformation.
Optimization of the model parameters showed that the inflection point of the Gompretz function in the analyzed case fell in 2012. It was a breakthrough year in which the function changed the growth dynamics from slowed down to accelerated. This type of trend is typical, among others, for time series related to the development of technology. Figure 7 presents the time series of empirical data and theoretical wind energy production volumes obtained using the Gompretz model.
The model was properly selected because the MAPE was approximately 5% and the coefficient of determination was 97%. Due to the fact that a sigmoidal model was used, the rest of the time series was not analyzed for normality of distribution. For this class of models, there is no need to maintain this condition with respect to model errors [38]. The forecast indicates that by 2030 approximately 10 GW of installed capacity of onshore wind farms will be available in Poland.
The REE Demand program written by the authors was used, into which the obtained forecast until 2030 was entered. The program allowed for determining the demand for REEs necessary to produce the expected annual wind energy generation potential, based on data on the REE demand of wind turbines from [39]. The following elements were taken into account: Nd, Dy, Pr and Tb. Additionally, the program determines the REE recovery from the annual production of fly ash, the amount of MW that can be built on their basis and the value of REEs recovered from Polish ashes.
Figure 8 presents the calculation results. For the obtained amount of GW of wind energy, annual increases in the installed power potential were calculated. Then, annual demand for individual REEs was calculated based on data on wind energy demand. The program also determined the amount of REE recovery from fly ash produced annually in Poland.
It can be seen that the demand in all cases is lower than the recovery of REEs. The charts also include the assumption of building the installed capacity of offshore wind energy, consistent with the Polish Energy Policy. It was assumed that the 6 GW to be built by 2030 would be built systematically and proportionally in the years 2022–2030. The green data series in the charts represents the total annual REE demand for offshore and onshore wind energy. Research on clean coal technology in the form of membrane techniques has shown that they are highly effective, and their efficiency is over 80%. Therefore, the membranes used would enable the acquisition of the rare earth elements necessary during Poland’s energy transition. The REEs obtained from fly ash would constitute a source that would cover 100% of the REE demand from renewable energy sources. In the years 2020–2030, in the case of Nd, the demand of onshore farms would be covered on average six times, Pr 12 times, Tb five and Dy 10 times.
Despite the fact that the research is currently in the laboratory phase, a simplified economic analysis of membrane production was performed.
The following cost categories were adopted in the economic analysis:
  • Materials necessary to produce membrane modules, including chitosan, reagents needed for its modification and praseodymium nitrate.
  • Other operating costs, including labor costs, energy, depreciation, logistics, R&D, administration, taxes, external services, etc.
The cost of producing a membrane with an area of approximately 28 cm2 was calculated and then scaled to a membrane module with an area of 7 m2. The cost of materials used in production was estimated at USD 5000. Additionally, it was assumed that other operating costs typically amount to approximately 30% of total costs in the chemical industry [40]. The total cost of producing a membrane module is approximately USD 7000. Therefore, it is within the USD 5000–USD 1000 range of market prices for membrane modules. However, it should be taken into account that these modules can be used by energy clusters connecting mines, power plants and REE recovery units. Therefore, operating costs typically incurred during the extraction of REE ores will be eliminated. It is assumed that one membrane module will be able to process 100 Mg of coal ash per year, and the recovery of REEs obtained from one Mg is worth approximately USD 600 [23]. This is an income of approximately USD 60,000/year.
Carrying out the energy transition in Poland is inevitable [41]. Firstly, it results from the country’s obligations towards the EU, but above all it should be implemented for the benefit of citizens. The energy transition should provide many advantages. First of all, it is intended to counteract climate change and improve air quality, making the country independent from imported energy carriers, thereby increasing the level of energy security and enabling sustainable development. However, these goals can only be achieved by adapting the way of carrying out the transition to the conditions prevailing in a given country. In the case of Poland, in order to achieve positive results from the energy transformation, it is possible to use natural resources such as coal and the co-products generated during its combustion.

4. Conclusions

Developing the potential of renewable energy sources to a level that allows them to take over the role of coal requires time, investment and commitment from both the state and the private sector. This process could be facilitated and accelerated with the support of clean coal technologies.
Firstly, they would constitute a key factor stabilizing the energy network. The lack of stable operation of the energy system is one of the main problems related to the large share of RESs in energy mixes. The stable operation of the energy system is one of the pillars of the country’s energy security. CCT could also support renewable energy sources by providing the resources necessary for the development of wind energy. As the authors’ analysis showed, REEs obtained from fly ash would provide access to the materials necessary to build the production capacities for both onshore and offshore wind farms in the perspective of 2030. Additionally, they would facilitate the construction of battery energy storage facilities. CO2 obtained thanks to CCT can also be used to build energy storage facilities. Energy storage is crucial for ensuring energy security and providing energy at the time and in the amount that is needed at a given moment. Developing a diverse energy mix also has a huge impact on national security. Additionally, the surplus of recovered REEs over wind energy demand may be a source of financing for building the potential of renewable energy sources and clean coal technologies. The surplus ranges from 20% (Tb) to 70% (Pr) depending on the metal. In total, in 2030, the surplus of REE production can generate revenue of EUR 25 million (taking into account current REE prices). Additionally, a simplified financial analysis of the membrane module production process showed that it is economically justified.
To make the proposed coexistence of CCT and RESs possible, it will be necessary to modify Poland’s energy policy. Currently, the policy only briefly mentions clean coal technologies. The role of public opinion on CCT and renewable energy sources and the benefits that can be derived from their use is also important.

Author Contributions

Conceptualization, A.R. (Aleksandra Rybak), A.R. (Aurelia Rybak) and J.J.; methodology, A.R. (Aleksandra Rybak), A.R. (Aurelia Rybak) and J.J.; software, A.R. (Aleksandra Rybak) and A.R. (Aurelia Rybak); formal analysis, A.R. (Aleksandra Rybak) and A.R. (Aurelia Rybak); writing—original draft preparation, A.R. (Aleksandra Rybak), A.R. (Aurelia Rybak) and J.J.; validation, A.R. (Aurelia Rybak); visualization, A.R. (Aurelia Rybak) and A.R. (Aleksandra Rybak); investigation, A.R. (Aleksandra Rybak), A.R. (Aurelia Rybak) and J.J.; and funding acquisition, A.R. (Aleksandra Rybak). All authors have read and agreed to the published version of the manuscript.

Funding

The research leading to these results has received funding from the Norway Grants 2014–2021 via the National Centre for Research and Development. Grant number NOR/SGS/MOHMARER/0284/2020-00.

Data Availability Statement

The data presented in this study are available on request from the corresponding author. The data are not publicly available due to the extremely large size.

Conflicts of Interest

The authors declare no conflicts of interest.

References

  1. European Commission. Renewable Energy Directive-Targets and Rules. Available online: https://energy.ec.europa.eu/topics/renewable-energy/renewable-energy-directive-targets-and-rules/renewable-energy-directive_en (accessed on 1 April 2024).
  2. Energy Institute. Statistical Review. Available online: https://www.energyinst.org/statistical-review (accessed on 11 May 2024).
  3. Eurostat. Eurostat Database. Available online: https://ec.europa.eu/eurostat/data/database (accessed on 1 April 2024).
  4. Wnukowski, D. Clean Coal Technologies: A Green Impulse for the Polish Energy Sector; Bulletin No. 32 (1144); Polish Institute of International Affairs: Warsaw, Poland, 2014.
  5. Chen, W.; Xu, R. Clean coal technology development in China. Energy Policy 2010, 38, 2123–2130. [Google Scholar] [CrossRef]
  6. Blaschke, W.; Nycz, N. Clean coal-preparation barriers in Poland. Appl. Energy 2003, 74, 343–348. [Google Scholar] [CrossRef]
  7. Brunetti, A.; Scura, F.; Barbieri, G.; Drioli, E. Membrane technologies for CO2 separation. J. Membr. Sci. 2010, 359, 115–125. [Google Scholar] [CrossRef]
  8. Ismail, A.F.; Goh, P.S.; Sanip, S.M.; Aziz, M. Transport and separation properties of carbon nanotube-mixed matrix membrane. Sep. Purif. Technol. 2009, 70, 12–26. [Google Scholar] [CrossRef]
  9. Zhao, Y.; Jung, B.T.; Ansaloni, L.; Ho, W.W. Multiwalled carbon nanotube mixed matrix membranes containing amines for high pressure CO2/H2 separation. J. Membr. Sci. 2014, 459, 233–243. [Google Scholar] [CrossRef]
  10. Rybak, A.; Rybak, A.; Sysel, P. Modeling of gas permeation through mixed-matrix membranes using novel computer application MOT. Appl. Sci. 2018, 8, 1166. [Google Scholar] [CrossRef]
  11. Liu, P.; Zhao, S.; Xie, N.; Yang, L.; Wang, Q.; Wen, Y.; Chen, H.; Tang, Y. Green Approach for Rare Earth Element (REE) Recovery from Coal Fly Ash. Environ. Sci. Technol. 2023, 57, 5414–5423. [Google Scholar] [CrossRef] [PubMed]
  12. Ragadhita, R.I.S.T.I.; Nandiyanto, A.B.D. Curcumin adsorption on zinc imidazole framework-8 particles: Isotherm adsorption using Langmuir, Freundlich, Temkin, and Dubinin-Radushkevich models. J. Eng. Sci. Technol. 2022, 17, 1078–1089. [Google Scholar]
  13. Ulfa, M.; Iswanti, Y. Ibuprofen adsorption study by Langmuir, Freundlich, Temkin and Dubinin-Radushkevich models using nano zinc oxide from mild hydrothermal condition. IOP Conf. Ser. Mater. Sci. Eng. 2020, 833, 012096. [Google Scholar] [CrossRef]
  14. Hu, Q.; Zhang, Z. Application of Dubinin–Radushkevich isotherm model at the solid/solution interface: A theoretical analysis. J. Mol. Liq. 2019, 277, 646–648. [Google Scholar] [CrossRef]
  15. Sutherland, C.; Venkobachar, C. A diffusion-chemisorption kinetic model for simulating biosorption using forest macro-fungus, fomes fasciatus. Int. Res. J. Plant Sci. 2010, 1, 107–117. [Google Scholar]
  16. Energy Dome. Available online: https://energydome.com (accessed on 2 May 2024).
  17. Zhong, C.; Xu, T.; Gherardi, F.; Yuan, Y. Comparison of CO2 and water as working fluids for an enhanced geothermal system in the Gonghe Basin, northwest China. Gondwana Res. 2023, 122, 199–214. [Google Scholar] [CrossRef]
  18. Liu, Y.; Hou, J.; Zhao, H.; Liu, X.; Xia, Z. A method to recover natural gas hydrates with geothermal energy conveyed by CO2. Energy 2018, 144, 265–278. [Google Scholar] [CrossRef]
  19. Castor, S.B.; Hedrick, J.B. Rare earth elements. Ind. Miner. Rocks 2006, 7, 769–792. [Google Scholar]
  20. Hardwerlibre.com. Available online: https://hardwerlibre.com (accessed on 2 May 2024).
  21. Fernandez, V. Rare-earth elements market: A historical and financial perspective. Resour. Policy 2017, 53, 26–45. [Google Scholar] [CrossRef]
  22. European Commission. COM/2023/160. Available online: https://eurlex.europa.eu/legalcontent/EN/TXT/?uri=CELEX%3A52023PC0160 (accessed on 1 May 2024).
  23. Rybak, A.; Rybak, A. Characteristics of some selected methods of rare earth elements recovery from coal fly ashes. Metals 2021, 11, 142. [Google Scholar] [CrossRef]
  24. Park, S.; Tracy, C.L.; Ewing, R.C. Reimagining US rare earth production: Domestic failures and the decline of US rare earth production dominance–Lessons learned and recommendations. Resour. Policy 2023, 85, 104022. [Google Scholar] [CrossRef]
  25. Theodosopoulos, V. The Geopolitics of Supply: Towards a new EU approach to the security of supply of critical raw materials. Policy 2020, 5, 1–10. [Google Scholar]
  26. Hurst, C.A. China’s ace in the hole: Earth rare elements. Jt. Force Q. 2010, 59, 121. [Google Scholar]
  27. Rybak, A. Poland’s Energy Mix and Energy Security of the Country. World Sci. News 2019, 128, 402–415. [Google Scholar]
  28. Depraiter, L.; Goutte, S. The role and challenges of rare earths in the energy transition. Resour. Policy 2023, 86, 104137. [Google Scholar] [CrossRef]
  29. Wdowin, M.; Franus, M. Analysis of fly ashes in terms of obtaining rare earth elements from them. Energy Policy 2014, 17, 369–380. [Google Scholar]
  30. Gompertz, B. On the nature of the function expressive of the law of human mortality, and on a new mode of determining the value of life contingencies. Philos. Trans. R. Soc. Lond. B Biol. Sci. 1825, 182, 513–585. [Google Scholar]
  31. Tjørve, K.M.C.; Tjørve, E. The use of Gompertz models in growth analyses, and new Gompertz-model approach: An addition to the Unified-Richards family. PLoS ONE 2017, 12, e0178691. [Google Scholar] [CrossRef] [PubMed]
  32. Cao, L.; Shi, P.-J.; Li, L.; Chen, G. A New Flexible Sigmoidal Growth Model. Symmetry 2019, 11, 204. [Google Scholar] [CrossRef]
  33. Liantoni, F.; Agusti, A. Forecasting bitcoin using double exponential smoothing method based on mean absolute percentage error. JOIV Int. J. Inform. Vis. 2020, 4, 91–95. [Google Scholar] [CrossRef]
  34. Saunders, L.J.; Russell, R.A.; Crabb, D.P. The coefficient of determination: What determines a useful R2 statistic? Investig. Ophthalmol. Vis. Sci. 2012, 53, 6830–6832. [Google Scholar] [CrossRef]
  35. Apache Commons Math. Available online: https://commons.apache.org/proper/commons-math/javadocs/api-3.6.1/org/apache/commons/math3/fitting/SimpleCurveFitter.html (accessed on 1 May 2024).
  36. Zhou, Z.H. Machine Learning; Springer Nature: Berlin/Heidelberg, Germany, 2021. [Google Scholar]
  37. de Wiljes, J.; Putzig, L.; Horenko, I. Discrete nonhomogeneous and nonstationary logistic and Markov regression models for spatiotemporal data with unresolved external influences. Commun. Appl. Math. Comput. Sci. 2014, 9, 1–46. [Google Scholar] [CrossRef]
  38. Liu, X. A Multi-Indexed Logistic Model for Time Series. Ph.D. Dissertation, East Tennessee State University, Johnson City, TN, USA, 2016. [Google Scholar]
  39. Carrara, S.; Alves Dias, P.; Plazzotta, B.; Pavel, C. Raw Materials Demand for Wind and Solar PV Technologies in the Transition Towards a Decarbonised Energy System; Publications Office of the European Union: Luxembourg, 2020; Volume 10, p. 160859. [Google Scholar]
  40. Grupa Azoty. Available online: https://raport2014.grupaazoty.com/2014/pl/finanse/podsumowanie/struktura-koszt%C3%B3w-rodzajowych/index.html (accessed on 8 June 2024).
  41. Manowska, A.; Bluszcz, A.; Chomiak-Orsa, I.; Wowra, R. Towards Energy Transformation: A Case Study of EU Countries. Energies 2024, 17, 1778. [Google Scholar] [CrossRef]
Figure 1. Share of individual energy sources in primary energy consumption, Poland 2022 [2].
Energies 17 02892 g001
Figure 2. Share of individual energy carriers in electricity production, Poland 2022 [2].
Energies 17 02892 g002
Figure 3. CCS strategy diagram supplemented with level 4. Source: own elaboration.
Energies 17 02892 g003
Figure 4. The effect of pH on the adsorption capacity of Pr ions. Source: own.
Energies 17 02892 g004
Figure 5. Changes of adsorption capacity over time for synthesized membrane. Source: own.
Energies 17 02892 g005
Figure 6. Changes of adsorption capacity during five adsorption–desorption cycles for synthesized membrane. Source: own calculation.
Energies 17 02892 g006
Figure 7. Empirical data and forecast of wind energy production volumes until 2030. Source: own calculation.
Energies 17 02892 g007
Figure 8. Wind energy demand and supply of REEs obtained from fly ash, source: own.
Energies 17 02892 g008
Table 1. Comparison of characteristic kinetic parameters from the pseudo-first and pseudo-second order Lagergren, Elovich kinetic model and intraparticle diffusion model, diffusion-chemisorption, and the Boyd model.
REE IonModelqeK1K2abKpxiKDCDeR2
[mg/g][min−1][gmg−1min−1][mgg−1 min−1/2][mg/g][m2/min]
PrI pseudo-order13.2060.012 0.473
II pseudo-order44.248 0.004 0.995
Elovich 6.0145.561 0.856
Intraparticle 1.30214.908 0.610
Diffusion-chemisorption49.751 9.842 0.953
Boyd 7.872 × 10−120.499
qe—adsorption capacity at equilibrium state; K1 and K2—rate constant of I and II pseudo-order; a and b—Elovich parameters; Kp—intraparticle diffusion rate; xi—intercept; KDC—diffusion chemisorption rate; and De—diffusion coefficient.
Table 2. Adsorption equilibrium constants for Langmuir, Freundlich and Dubinin–Radushkevich isotherm equations (at 25 °C, pH = 7.5).
REE IonModelqmKLKF1/nKDRER2
[mg/g] [L/mg][mg/g][mol2 kJ−2][kJ/mol]
PrLangmuir54.6450.147 0.848
Freundlich 12.3340.310 0.672
Dubinin–Radushkevich39.411 3.349 × 10−5122.1880.958
qm—maximum sorption capacity; KL—Langmuir sorption constant; KF—Freundlich constant; KDR—Dubinin–Radushkevich constant; and E = (1/(2K)0.5).
Table 3. Kd and k values of analyzed membrane using synthetic equivalents of fly ash extracts.
REEKd [mL/g]k Pr/Ndk Pr/Dyk Pr/Gdk Pr/Yk Pr/Nak Pr/Mgk Pr/Cak Pr/Alk Pr/Fek Pr/Si
Pr1824.52929.8435.3437.6042.841012.25505.30910.88606.71700.31650.17
Nd61.154
Dy51.627
Gd48.523
Y42.592
Na1.802
Mg3.611
Ca2.003
Al3.007
Fe2.605
Si2.806
Kd—distribution coefficient, and k—selectivity coefficients.
Disclaimer/Publisher’s Note: The statements, opinions and data contained in all publications are solely those of the individual author(s) and contributor(s) and not of MDPI and/or the editor(s). MDPI and/or the editor(s) disclaim responsibility for any injury to people or property resulting from any ideas, methods, instructions or products referred to in the content.