Article

Analyzing the Influence of Energy Consumption and Economic Complexity on Carbon Emissions: Evidence from Malaysia

1
Department of Economics, Faculty of Economics and Management Sciences, International Islamic University Malaysia, Kuala Lumpur 53100, Malaysia
2
Department of Economics, College of Business Administration, Princess Nourah bint Abdulrahman University, P.O. Box 84428, Riyadh 11671, Saudi Arabia
3
Polytechnic Institute of Australia, 33 Castlereagh Street, Sydney 2000, Australia
*
Author to whom correspondence should be addressed.
Energies 2024, 17(12), 2900; https://doi.org/10.3390/en17122900
Submission received: 17 April 2024 / Revised: 5 June 2024 / Accepted: 11 June 2024 / Published: 13 June 2024

Abstract

:
Due to increasing energy consumption, there has been a significant expansion in worldwide trade, leading to the emergence of severe environmental issues. This situation is further compounded by the non-negotiable requirement to simultaneously mitigate environmental degradation and achieve economic progress. To ensure a healthier future, it is imperative to identify and address the factors that contribute to environmental contamination. The purpose of this study is to examine how Malaysia’s carbon dioxide (CO2) emissions are affected by energy consumption, economic growth, and the economic complexity index (ECI). Time series data from 1997 to 2020 are used in this study, along with the autoregressive distributed lag model. The environmental Kuznets curve theory holds true in Malaysia, according to the study’s findings, and energy use has a negative impact on CO2 emissions. There is also evidence suggesting that a higher ECI is linked with increased levels of CO2 emissions over a prolonged period. Malaysia’s main export, electrical and electronic goods, generates substantial CO2 emissions during the manufacturing process. The outcomes of this research have important ramifications for environmental strategies concerning the mitigation of CO2 emissions. The electrical and electronics industries can implement energy-efficient technologies and practices in manufacturing processes. This would include upgrading to more efficient machinery, optimizing production schedules, and reducing idle times. It is also crucial to work with governments and industry bodies to advocate for policies that support sustainable manufacturing practices.

1. Introduction

Greater energy efficiency, better environmental results, and faster economic growth are the goals of any nation [1]. Most carbon emissions, according to recent studies, are caused by developing nations’ rapid economic progress. Since the beginning of industrialization in the 1970s, energy consumption has skyrocketed, resulting in a surge in global trade and serious environmental problems. Complicating matters is that there can be no compromise on either environmental protection or economic advancement. Therefore, for a healthier future, it is vital to identify the elements contributing to environmental contamination and act accordingly. Important macroeconomic variables that influence environmental deterioration include economic development and the consumption of fossil fuels.
Malaysia ranked 4th in Southeast Asia and 36th overall in 2019 with a gross domestic product (GDP) of 365 billion US dollars ($) [2]. Malaysia’s GDP is expected to rise from $107 billion in 2004 to $341.6 billion in 2030, with an annual growth rate of 4.6% [3]. This begs the crucial question: has Malaysia’s economic advancement boosted its environmental sustainability? In recent years, the Malaysian economy’s energy consumption has been steadily increasing (Figure 1), and it is highly dependent on the use of non-renewable energy (RE) sources (Figure 2) to meet this expanding demand, which increases carbon dioxide (CO2) emissions (Figure 3) and degrades the environment.
Furthermore, Malaysia pledged to achieve net-zero emissions by 2050 and a 45 percent decrease in emission levels by 2030 during the Glasgow COP26 summit. Significant reductions in energy usage are necessary to meet these challenging targets [4]. It has been discovered that there is a curvilinear relationship between environmental pollution and economic progress, with a reversed U-shaped pattern [5]. In the initial phases of economic growth, environmental pollution grows with income levels according to the environmental Kuznets curve (EKC), but after a certain threshold, it drops [6]. The related argument is that as the economy grows, pollution will rise until a certain point, after which it will begin to fall. Many scholars have been inspired by this, which has resulted in a significant upsurge of empirical studies investigating the environmental effects of economic expansion.
Recently, a few studies have examined how the ECI affects CO2 emissions in both developed and developing countries. An analysis of the organizational features of the global commerce network is the foundation of the ECI, which was first developed by Hidalgo and Hausmann [7] and expanded by Hausmann et al. [8]. It is meant to shed light on the widening gap in national incomes. To determine the economic complexity and product diversity of nations, this approach is used to assess their trading interactions with one another. Hausmann et al. [9] stated that “economic complexity reflects the knowledge embedded within an economy’s productive structure”. Researchers can predict and understand future income levels, economic growth, and greenhouse gas emissions by utilizing the ECI.
Malaysia’s ECI jumped from 0.0085 in 1997 to 1.17 (https://atlas.cid.harvard.edu/rankings, accessed on 5 January, 2024) in 2020, placing the country 22nd among the world’s most complex economies. This indicates that Malaysia has a diverse and sophisticated export portfolio, which is linked to higher ECI ratings. This is promising for the country’s export income, economic resilience, and prospects for sustainable growth. Figure 4 reports Malaysia’s total exports in 2022, showcasing the diverse range of products shipped.
Malaysia’s exports climbed by $119 billion in five years, from $259 billion in 2017 to $378 billion in 2022. The largest exports ($78.9 billion) were integrated circuits, followed by refined petroleum ($38.5 billion), petroleum gas ($19.5 billion), palm oil ($17.7 billion), and crude petroleum ($10.2 billion). The materials used in integrated circuit production, such as silicon wafers, metals, and chemicals, may require energy-intensive extraction, refining, and processing, which can contribute to CO2 emissions [10]. Regarding palm oil’s contribution to Malaysian exports, deforestation occurs in the country because of palm oil production, which also contributes to climate change.
Although Malaysia is ascending the complexity ladder at a faster pace than other countries, it still demonstrates a modest level of economic complexity compared to other countries. Therefore, there are still possibilities for diversification in Malaysia’s export basket. Concerning the decision for Malaysia to increase its ECI, it is essential to consider the potential trade-offs, particularly regarding environmental impacts such as CO2 emissions. Therefore, it is imperative that the effects of the ECI on Malaysia’s environmental quality be assessed, and if there are effects, we must determine how we may effectively address environmental challenges using the ECI. The EKC hypothesis is tested in Malaysia against a wide range of variables, including foreign direct investment, population density, freight transport, economic prosperity, natural gas, nuclear energy, trade openness, and urbanization, among many others [11,12,13,14,15,16,17,18]. Nevertheless, research into the EKC theory has not yet focused on economic complexity as a metric for organizational changes in the economy; this complexity may stand in for technological know-how in product production. As far as we are aware, this is the first research to look at the connection between Malaysia’s ECI, per capita GDP, energy use, and CO2 emissions. This study has two objectives as a result. The effects of energy consumption, economic growth, and ECI on CO2 emissions in Malaysia are first examined. Secondly, it examines the validity of the EKC theory within the Malaysian context by examining the ECI within the EKC model.
The outcome of the current research has noteworthy environmental strategy implications for CO2 reduction. First, the EKC theory was confirmed in Malaysia from 1997 to 2020. The quick economic shift from an agricultural to a service and manufacturing sector has improved the country’s living standard, consumption, and per capita income. The EKC theory suggests that early development can promote pollution and environmental degradation. Malaysia has enacted environmental laws to address these issues.
This investigation uses the autoregressive distributed lag (ARDL) methodology established by Shin et al. [19]. To measure the consistency of the ARDL model, augmented Dickey-Fuller (ADF) [20] and Phillips-Perron (PP) unit root tests [21] are carried out. The next section of this paper examines the previous research and theories that have been proposed. The third section discusses the methods and materials utilized in the current research, followed by the study’s results and discussion. Policy recommendations and the conclusion are presented in Section 5 and Section 6, respectively.

2. Literature Review

Numerous studies have tested models using the EKC to explore the factors influencing environmental collisions [22,23,24,25]. In the meantime, a few studies have used the environment’s carrying capacity approach, represented by the IPAT model, which was recognized to decay carbon emissions into the products of diverse factors [26,27,28]. IPAT denotes the environmental impact (I) owing to the population (P), the level of per capita affluence (A), and the level of technology in an economy (T). Since energy consumption and economic complexity are significant sources of carbon emissions, both theories address our research purpose. We used the EKC in this study as this theory states that when an economy first begins to flourish, the environment will become worse, but the environmental quality will begin to improve once the country’s income level reaches a peak. One can observe an inverted U-shaped curve in the EKC [5,6]. The literature linking economic growth, complexity of the economy, energy consumption, and environmental pollution is assessed in the next part in order to determine the present research gap.

2.1. Economic Growth and Environmental Pollution

Multiple empirical studies have shown that rising economies produce more CO2. Numerous studies have been taken into consideration, encompassing several countries, variables, and study methods. Odugbesan and Adebayo [29] conducted a study in Nigeria using time series data from 1981 to 2016. They discovered that economic growth and CO2 emissions in Nigeria had a positive association using the ARDL, FMOLS, and DOLS methodologies. Similarly, Adebayo et al. [30] observed that CO2 emissions in Mexico were directly impacted by economic growth. This was determined by applying the ARDL, FMOLS, and DOLS estimators to annual data from 1971 to 2016. In addition, Adebayo and Kalmaz [31] found that Egypt’s CO2 emissions and economic development were positively correlated when applying the ARDL, FMOLS, and DOLS methodologies to data from 1971 to 2014. Conversely, Teng et al. [32] described that for Organization for Economic Co-operation and Development (OECD) countries, economic development had a positive impact on CO2 emissions between 1985 and 2018. Additionally, Nondo and Kahsai [33] noted that from 1970 to 2016, economic expansion had a positive impact on CO2 emissions in South Africa. Similar findings from other Malaysian research have established a direct correlation between GDP and CO2 emissions [12,14,34]. In addition, the EKC hypothesis has been discussed in the literature on both developing and established nations to determine whether it is valid. For instance, Asici [35] derived interesting findings from analyzing the EKC for CO2 emissions in low-, medium-, and high-income countries. He also stated that, in comparison to low- or high-income countries, middle-income countries see a more favorable effect of economic growth on environmental deprivation. Typically, high-income countries are found on the right side of the EKC, which is a measure of the negative association between income and ecological deprivation. Yet the EKC theory is unconvincing when applied to developing countries. New research has established the EKC for CO2 emissions in both poor and rich countries [36,37,38]. Consequently, research testing the EKC theory in both advanced and emerging countries has shown contradictory results.

2.2. Economic Complexity and Environmental Pollution

Recent research has explored the connection between the ECI and environmental pollution. Can and Gozgor [39] analyzed carbon emissions in France from 1964 to 2014 to investigate the EKC theory and found an indirect link between CO2 emissions and the ECI, indicating that ECI levels over a specific threshold resulted in decreased CO2 pollution. Using panel quantile regression, Doğan et al. [40] examined 55 countries’ ECI and CO2 emissions from 1971 to 2014 and found support for the EKC. There was a strong negative correlation between economic complexity and environmental consequences throughout the study period. Despite successful CO2 emissions reductions in high-income countries, the study found that lower- and middle-income economies had worsened environmental deterioration because of economic complexities.
Ahmed et al. [41] evaluated the influences of energy intensity, economic growth, and economic complexity on environmental quality in India using 1970–2017 time series data. In their study, they utilized the augmented autoregressive distributed lag (AARDL) method to analyze the data, and they found that if the economic complexity increased, the environmental quality was degraded in India. Similarly, Laverde-Rojas et al. [42] showed that a developing country such as Colombia does not yet benefit from increased economic complexity. Bucher et al. [43] applied the Fourier autoregressive distributed lag (FARDL) model to explore the impact of Turkey’s economically complex economy on environmental sustainability from 1995 to 2020. The study considered factors including GDP, energy consumption, the ECI, and CO2 emissions. Economic complexity in Turkey helped to slow environmental degradation. Moreover, both rising energy use and GDP contributed to worsening environmental conditions. If Turkey’s economy continues to rely on fossil fuels, it will have a more difficult time reaching its objective of zero net emissions by 2053. The authors recommended that lawmakers expand energy, environmental, and economic policies by providing financial incentives and establishing technical assistance programs to encourage green technology research and information sharing. They also proposed that the government could impose stringent environmental regulations.
Kirikkaleli et al. [44] examined the 10 most complicated economies in the world from 1998 to 2017 and how electricity usage and the ECI affected them. Panel auto-regressive distributed lag and a panel vector error correction model that fully modified ordinary least squares were used. In addition to environmental impacts, other macroeconomic factors were considered, such as trade, real GDP per capita, the ECI, power use, environmental impact, and electricity usage. They showed that over time, the use of electricity added to the carbon footprint. Trade openness and the ECI also contributed to better environmental performance in the long run.

2.3. Energy Consumption and Environmental Contamination

Karasoy and Akçay [45] adopted the ARDL method to study the effects of trade and non-RE and RE use on environmental deterioration using data collected from Turkey from 1965 to 2016. Their research showed that emissions increased over time due to trade and non-RE consumption, even though RE adoption reduced emissions in the short and long terms. Both the short-term effects of trading and the longer-term effects of using non-RE sources were linked to increased CO2 emissions. The researchers recommended strengthening current laws, creating new rules and incentives to foster the use of hydropower, and boosting the implementation of green energy sources to reduce pollution.
Using ARDL analysis, Sarkodie and Adams [46] examined the correlation between pollution levels from 1971 to 2017 and factors such as energy (aggregated and disaggregated), economic advancement, urbanization, and South Africa’s political institutions’ quality. The results showed that a country’s ability to handle the economic, social, and governance impacts of climate change is highly dependent on its well-functioning political institutions. According to the results, the government should try to foster a political climate that is supportive of employing clean, modernized energy sources and push for decarbonization regulations if it wants to improve environmental quality.
Idowu and Adeneye [47] investigated a panel of eight Organization of the Petroleum Exporting Countries (OPEC) and nine highly industrialized countries over the period 1985 to 2020 to see how industrialization affected carbon releases through energy consumption. The researchers discovered that the combined short- and long-term effects of industrialization and energy consumption had no discernible impact on the carbon emissions of OPEC members. On the other hand, short-term carbon emissions were positively and significantly impacted by both economic growth and foreign direct investment. Nonetheless, the study found that the relationship between energy industrialization and energy use had a positive and considerable influence on carbon emissions in highly industrialized nations. Assi et al. [48] examined the link among worldwide trade, environmental quality, and the use of green energy in the Nordic region between 2001 and 2018, employing the dynamic common correlated effect model. Environmental quality was found to have positive relationships with green energy and global trade. Khan et al. [49] also found that environmental quality in Pakistan decreased due to green energy, technological advancement, and globalization. Grounded in the factors mentioned above, the following hypotheses are proposed:
Null Hypothesis (H0): 
Economic complexity and energy consumption do not influence CO2 emissions in Malaysia.
Alternative Hypothesis (Ha): 
Economic complexity and energy consumption have a crucial influence on CO2 emissions in Malaysia.

3. Methodology

In this section, we discuss the data definition, empirical models, and estimation methods employed in this study.

3.1. Data Definition

For the years 1995–2021, CO2 emissions in Malaysia (in metric tons per capita) are utilized as the dependent variable. In our regressions, we include as independent variables GDP per capita (in constant $ prices), squared real GDP per capita (in constant 2010 $ prices), the ECI, and energy consumption per capita (kilogram of oil equivalent per capita). For each of these variables, the logarithmic form is employed, and the World Development Indicator, the Atlas Database, and the Global Footprint Network are the primary sources of pertinent annual data.

3.2. Empirical Model and Estimation Methods

This study employs a popular EKC model, which includes GDP, GDP squared, and energy consumption (EC) as factors influencing CO2 emissions. This article suggests that the ECI, in addition to GDP and energy usage, could be essential in calculating CO2 emissions. Hence, the empirical model for the EKC hypothesis can be expressed as follows:
C O 2 = f ( G D P , G D P 2 , E C , E C I )
CO2 is the level of carbon emissions, GDP is the gross domestic product, EC is energy consumption, and ECI is the economic complexity index.
The logarithmic form of the function in Equation (1) is as follows:
log C O 2 t = β 1 + β 2 ln G D P t + β 3 ln G D P t 2 + β 4 ln E C t + β 5 ln E C I + ε t
In Equation (2), Ln CO2t is CO2 emissions in log form at time t; lnGDPt and ln GDP2t are the log forms of GDP and the square root of GDP at time t, respectively. In economic modeling, taking the logarithm of GDP squared emphasizes growth rates, stabilizes variance, and makes nonlinear relationships more tractable. Therefore, it has tangible economic significance and can provide a better understanding of how economic variables are related, particularly when proportional changes and growth rates are more relevant than absolute values. ln ECt is the log form of energy consumption at time t, and lnECIt is the log form of economic complexity index at time t. Lastly, ε t represents the error term. The hypothesis, following the EKC theory, is that β 2 > 0 and β 3 < 0 . In addition, EC is positively correlated with increases in CO2 emissions [50,51]. However, when the economic complexity of industrialized countries, such as Malaysia, increases, their export baskets become more complex, leading to a decline in CO2 emissions. Hence, it is also hypothesized that β4 > 0 and β 5 < 0 .
Unit root testing is performed to check the stationarity of the variables. Whether the data are integrated at I (0) or I (1), we use ADF and PP unit root tests to evaluate the stationarity characteristics of all the variables. Cointegration testing must be conducted before the ARDL technique is used to guarantee that the variables have a long-run association. The ARDL limits test must first be used to demonstrate the long-term linkage between the variables in Equation (2). The null hypothesis of the ARDL F-bounds test is that no variables cointegrate. However, the alternative hypothesis clarifies the existence of cointegration. The long-term relationship may be established if the F-statistic is higher than the crucial values. If the lower limit value is higher than the predicted F-statistics, there cannot be a long-term relationship between the variables. Pesaran et al. [52] state that if the estimated F-statistics are in the center of the upper and lower bounds, it is not possible to draw a firm conclusion. The ARDL bounds test Equation (3) is provided below to evaluate the long-term relationships between the variables, which are based on the cointegration assumptions:
Δ ( ln C O 2 ) t = β 1 + β 2 ln C O 2 t 1 + β 3 ln G D P t 1 + β 4 ln G D P t 1 2 + β 5 ln E C t 1 + β 6 ln E C I t 1 + i 1 p α 1 Δ ln C O 2 t i + i = 1 p α 2 Δ ln G D P t i + i = 1 p α 3 Δ ln G D P t i 2 + i = 1 p α 4 Δ ln E C t i + i = 1 p α 5 Δ ln E C I t i + u t
The dependent variable must have an integrated order of 1, and cointegration among the variables must be established using bound testing to ensure that this method is applied successfully. Alternatively, the remaining series can display a combination of 0 and 1 integrating orders [52]. In the event that a sustained correlation is found between the variables, the subsequent error correction model (4) will be applied:
Δ ( ln C O 2 ) t = β 1 + β 2 ln C O 2 t 1 + β 3 ln G D P t 1 + β 4 ln G D P t 1 2 + β 5 ln E C t 1 + β 6 ln E C I t 1 + i 1 p α 1 Δ ln C O 2 t i + i = 1 p α 2 Δ ln G D P t i + i = 1 p α 3 Δ ln G D P t i 2 + i = 1 p α 4 Δ ln E C t i + i = 1 p δ Δ ln E C I t i + u t
where ECT is an error correction term and δ is its coefficient. The rate at which the dependent variable regains its initial equilibrium after a shock to the system is shown by this coefficient. This research also uses a battery of diagnostic tests. For instance, the normality of the residual is checked by the Jarque-Bera test and serial correlation using the Breusch-Godfrey Lagrange multiplier (LM) test. The Breusch-Pagan-Godfrey test result identifies heteroscedasticity. The stability of the model is evaluated by employing the Ramsey reset test at the end to verify its adequacy.

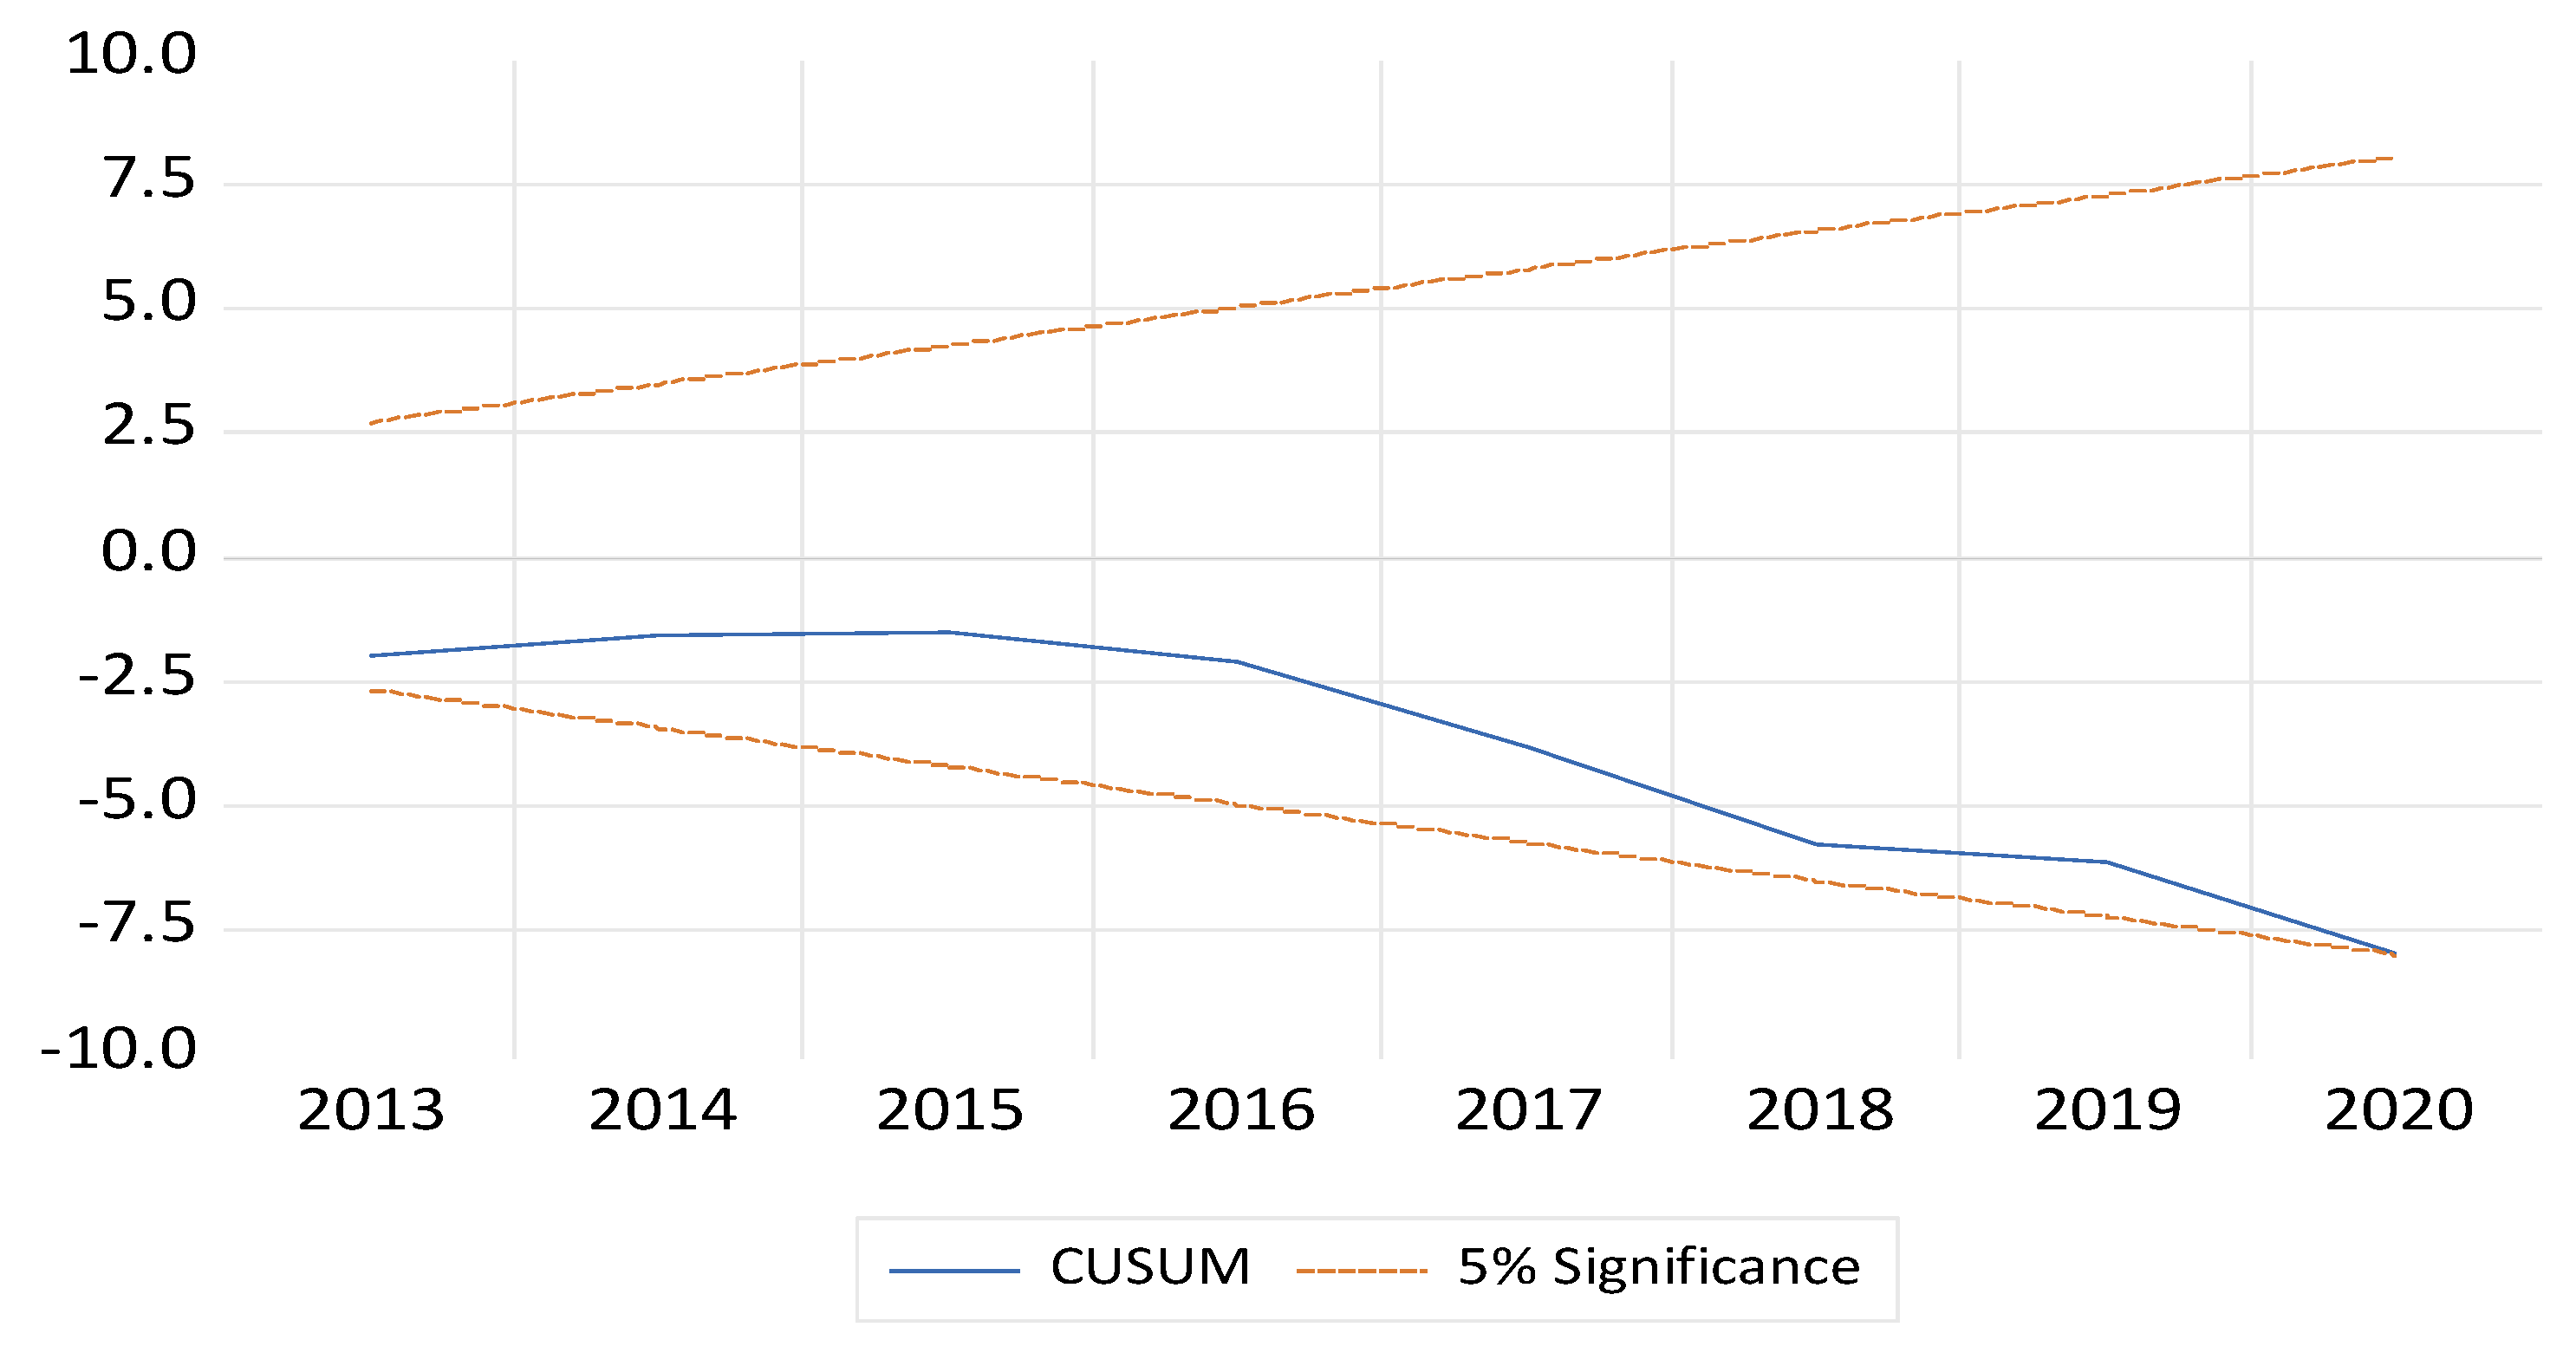
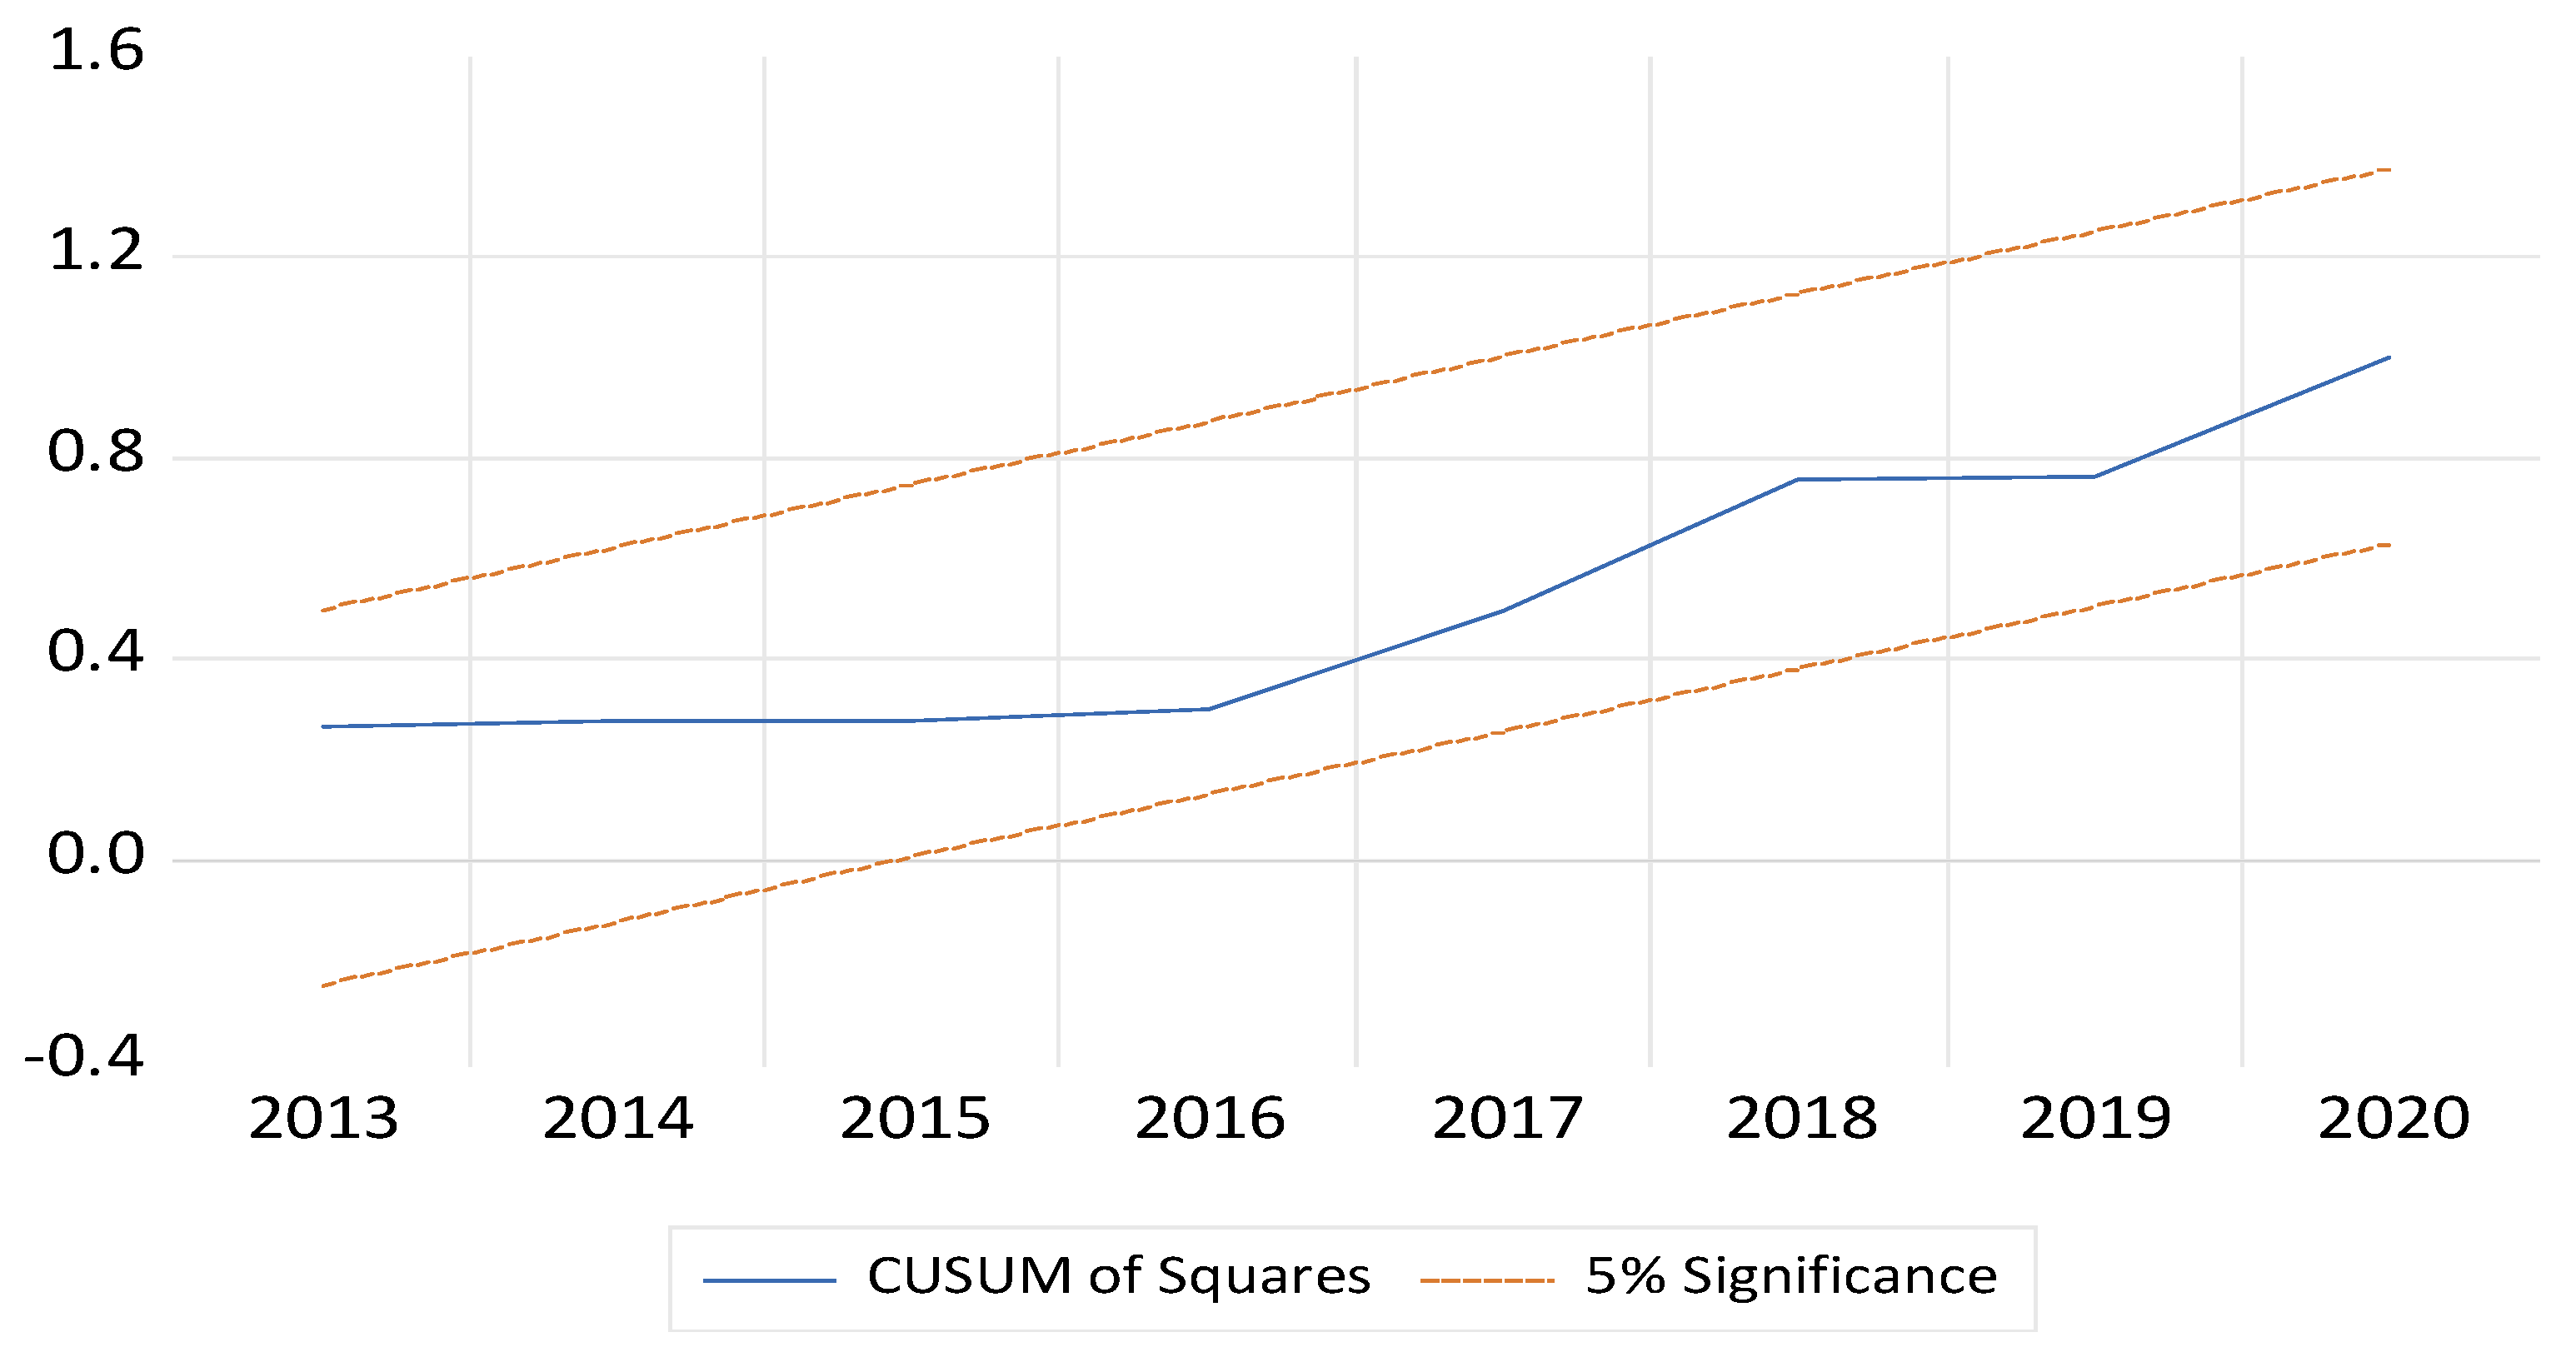
4. Results and Discussion

Table 1 displays the results of the descriptive statistics and the correlation matrices. The findings show that, owing to its small standard deviation, GDP exhibits the least amount of variability across all data points when contrasted with the other variables. Among all data indicators, GDP squared demonstrates the greatest volatility due to its significant standard deviation. Examining skewness and kurtosis further confirms that the variables do not adhere to a normal distribution. In addition, the results reveal that CO2 exhibits slightly negative skewness and the ECI exhibits moderate skewness, whereas GDP, GDP squared, and CE exhibit positive skewness. According to the correlation matrices in Table 1, multicollinearity is not an issue. Meeting this criterion is necessary to proceed with the regression analysis.
Table 2 displays the results of the ADF and PP unit root tests, which reveal that all of the selected variables—aside from lnCO2 and lnECI—are non-stationary at level. It is observed that lnGDP, lnGDP2, and lnEC display stationarity with an integration degree (I) of 1 after the initial discrepancies. We can now move forward with implementing the ARDL regression model. A long-term relationship between the dependent and explanatory variables must be established before moving on to the last stage of the ARDL method’s implementation. To identify long-run cointegration, the ARDL bounds testing method is employed [52]. The outcomes of the cointegration analysis are stated in Table 3. The F-statistics value is significant at the 1% level, which endorses the long-run cointegration of CO2, GDP, GDP squared, the ECI, and EC.
Table 4 presents the ARDL model’s results, which display some intriguing trends. In both the long and short runs, the GDP coefficient is positive and statistically significant at the 1% level. In both the short and long terms, the coefficient of squared GDP per capita is negative and statistically significant at the 1% level. Therefore, during the study period, the findings of the study provided support for the EKC hypothesis in Malaysia. This study’s findings are consistent with those of [12,13,14], all of which supported the EKC theory in Malaysia at the time of their research. Furthermore, in line with the guiding principles of the EKC theory, Malaysia’s economic growth strategy prioritizes sustainability, allowing the country to work toward cleaner growth goals. The last several decades have seen massive structural changes and economic growth in Malaysia. Agriculture and resource exploitation, which are often linked with greater environmental degradation, were initially the economic backbone of the country. As the nation transitioned from a manufacturing sector to a service-oriented economy, Malaysia’s environmental impact might have declined in accordance with the EKC pattern. Moreover, environmental legislation has been enacted in Malaysia to address environmental issues. Investing in pollution control technology and enforcing stricter environmental legislation are some examples of environmental protection. With Malaysia’s booming income, environmental conservation, especially improving future air and water quality, will become a priority. It is crucial to keep up with technological advances. Owing to its recent investments in RE and better technology, Malaysia can reduce its environmental impact.
The results of the ARDL model also indicate that EC causes a 0.98% rise in CO2 in the long run and a 0.43% increase in CO2 in the short run, demonstrating a positive relationship between carbon emissions and EC. As a result of using more energy from fossil fuels such as oil, coal, and gas, Malaysia’s CO2 emissions may have increased because of the country’s rapid economic development. Eighteen percent of the increasing CO2 emissions in the world are caused by the energy and housing industries, and this greatly endangers ecology and human health [19]. One way to tackle this problem, according to this study, is to promote RE and combine clean energies.
In addition, the coefficient of the ECI is found to be direct and significant, indicating that a 1% rise in the ECI increases CO2 by 0.18% in the short run and 0.22% in the long run. The ECI outperforms conventional measures of human capital, competitiveness, and governance as a predictor of income per capita increase [9]. The empirical findings further show that the ECI is crucial for controlling environmental contaminants in Malaysia. Being a party to both the Paris Agreement and the United Nations (UN) Environment Program puts pressure on Malaysia to do something about the environment. There may be outside pressure on government authorities to address pollution and climate change. Therefore, Malaysian businesses and politicians should take advantage of the country’s reduced pollution levels while developing a more sophisticated export basket. The production of commodities, however, results in increased CO2 emissions; yet these goods can be imported. To add to this, the Malaysian economy would benefit from a more in-depth examination of the environmental degradation scale across all industries and, ideally, individual firms to draw these conclusions.
In addition, both the coefficients of the EC and the ECI are inelastic. The finding that the coefficient of EC is inelastic concerning CO2 emissions, for instance, may imply that a rise in energy consumption may result in a less proportional increase in CO2 emissions. In a similar vein, the ECI’s inelastic coefficient suggests that CO2 emissions rise at a slower rate than the ECI itself as the system becomes more complicated. Understanding inelastic coefficients is critical for policymakers as they reveal the degree to which variables respond to changes in other variables. In this instance, this implies that lowering CO2 emissions might necessitate more substantial actions than just making the economy more complicated or cutting energy usage. Additionally, several studies have demonstrated a clear connection between ecological degradation and economic complexity. In their analysis of 55 countries divided into three incomes (high, middle, and lower middle), Dogon et al. [40] found that economic complexity deteriorated the environment. Among European Union member states with low or medium incomes, a comparable pattern was noted by Can and Gozgor [39]. A study by Fan et al. [25] uncovered that economic complexity increased pollution at the initial stage, but it then reduced pollution at the second stage, such as squared economic complexity, confirming the EKC hypothesis in BRICS-T economies. These results imply that as countries reorganize their production systems in pursuit of industrialization, environmental quality may decrease during the early to middle stages of development. In contrast, Can and Gozgor [39] found that higher-quality manufactured items could be environmentally beneficial. With R2 and adjusted R2 values of 0.997 and 0.9973, respectively, the ARDL model demonstrated a high level of fitness. This means that changes in the dependent variable accounted for 99% of the variance in the independent variables. A negative coefficient of about 0.67% suggested a correction in reaction to shocks from the previous year, and ECT was also statistically significant at the 1% level.
Several diagnostic checks, including the cointegration test, are carried out in the current research to measure the model’s performance. The diagnostic tests are executed by utilizing the log transformation of the time series data shown in Table 4 to investigate the estimates’ accuracy. The results of the LM test propose that the data are unconnected due to the lack of serial correlation. The Jarque-Bera test results indicate that the series follows a normal distribution, while the Breusch-Pagan-Godfrey test reveals no evidence of regression errors in the test for heteroscedasticity. In addition, there are no specification errors in the regression based on the Ramsey RESET examination. Consequently, the model does not contain any instances of improper specification. The logarithmic version of the variables contains time series data that does not exhibit serial correlation or heteroscedasticity according to the diagnostic tests. Since the residual follows a normal distribution, the stability test is successful in passing the model. The model’s representation of a linear relationship is also statistically significant, as shown by the fact that the F-statistical probability is 0.0000. In addition, the CUSUM and CUSUMSQ tests are utilized in this investigation to ascertain the presence of a stable link over an extended period. The regression coefficients and residuals are examined using those tests. At the 5% level of significance, the blue line is inside the red lines in Figure 5 and Figure 6, showing that the parameters of the models are stable.

5. Policy Implications

This article confirms the EKC theory by showing that GDP per capita, squared GDP per capita, EC, and the ECI are important factors influencing emissions in Malaysia. With a larger coefficient than all other variables combined, GDP stands out as impacting CO2 emissions the most. The data show that CO2 emissions rose in direct proportion to GDP, reached the maximum point, and then declined over the long run, forming an inverted U-shaped GDP as the output variable. Energy consumption and CO2 emissions were positively correlated over time, which is consistent with earlier studies in Malaysia [11,14,15]. In addition, the study uncovered an unrecorded occurrence in the literature: increasing CO2 emissions in Malaysia over the long run were a result of increased economic complexity, as seen in the export basket’s inclusion of more sophisticated commodities.
The findings of this research have noteworthy environmental strategy implications for CO2 reduction. First, the EKC theory was confirmed in Malaysia from 1997 to 2020. The quick economic transition from an agricultural to a service and manufacturing economy improved the country’s living standards, consumption, and per capita income. The EKC theory suggests that early development can promote pollution and environmental degradation. Malaysia has enacted environmental laws to address these issues. Environmental protection, pollution control technology investments, and stricter environmental legislation are examples. Malaysia’s booming income will increasingly move toward environmental conservation, improving future air and water quality. Technical advances are vital. With its recent investments in RE and better technology, Malaysia can lessen its environmental effects. These technologies will become more accessible and affordable, encouraging industries to adopt greener manufacturing techniques and reduce pollution.
This structural adjustment could improve environmental quality by redirecting the economic focus from resource-intensive sectors. Being a party to both the Paris Agreement and the UN Environment Program puts pressure on Malaysia to do something about the environment. There may be outside pressure on government authorities to address pollution and climate change. Furthermore, given Malaysia’s reliance on non-RE, the government should prioritize RE. Possible benefits include tax incentives and investments in RE technology. Malaysia has been attempting to diversify its sources of power, but the majority of its electricity still comes from natural gas and coal, both of which increase energy consumption and CO2 emissions. The two main fuels used to generate electricity in Malaysia are coal and natural gas.
Despite the increased usage of natural gas as a power plant fuel, coal-fired power plants still make a significant impact, especially during peak demand periods. Fossil fuel combustion increases emissions of greenhouse gases due to the release of CO2 into the environment. According to the World Bank’s 2020 report, in 2021, RE sources accounted for a significantly smaller percentage of Malaysia’s total energy consumption (4%). There is an immediate need for the government of Malaysia to tackle the environmental impacts of fossil fuel consumption by prioritizing energy efficiency and the transition to green energy sources. The use of green energy bases and state-of-the-art energy-saving technologies might be part of the solution to diversify the energy mix and lessen the country’s dependence on fossil fuels. The third point is that this research shows that CO2 emissions are much higher in economically complex economies, as evinced in Malaysia. According to [7], the ECI outperforms the more conventional measures of governance, human capital, and competitiveness when it comes to predicting rising income per capita.
In addition, the empirical data demonstrated that the ECI is vital for controlling environmental toxins in Malaysia. A total of 593.5 billion Malaysian ringgit, or 38.3% of Malaysia’s exports in 2022, were electrical and electronic (E&E) items. Specifically, electrical circuits constituted 22.03% of the total exports in 2022. Considerable energy is typically consumed during the manufacturing of electronic components and gadgets, which is a process including smelting, refining, and chemical synthesis. The combustion of fossil fuels, such as coal or natural gas, which supply massive amounts of power for these processes, releases CO2 into the atmosphere. To produce heat and power, many E&E industrial operations rely on fossil fuels. If fossil fuels are used as a backup or when demand is strong, CO2 could still be emitted even if some of the energy comes from renewable sources. To make electrical devices, it is conventional to use components sourced from all over the world, linking them to intricate global supply chains. There can be significant emissions from the transportation of raw materials, components, and finished goods, especially when these items are transported over great distances in vehicles or ships powered by fossil fuels. In addition, oil and gas in Malaysia constituted 19.2% of the total exports in 2022 (Figure 4). The extraction, processing, and utilization of oil and gas are also important sources of greenhouse gases, including CO2.
The adoption of energy-efficient technologies and processes can reduce electricity consumption. Upgrading machinery, optimizing production processes, and improving facility management can add considerably to energy savings. The enlargement of carbon capture and storage (CCS) technologies and investment in clean energy are key measures to address climate change [53]. Although CCS has the potential to reduce CO2 emissions, Malaysia has not executed any CCS projects; it only conducted a scoping study in 2010. The government may introduce an emissions trading program that more truly represents the cost to the environment to overcome the mispricing of fossil fuels caused by externalities. Palm oil, which constitutes 3.84% of Malaysia’s total exports, may be contributing to climate change, deforestation, and biodiversity loss. Hence, Malaysia may promote sustainable sourcing practices in supply chains to reduce societal and environmental impacts. The government might impose stricter regulations and certification programs to ensure the ethical sourcing and distribution of goods, such as palm oil.
Several policy measures are recommended for Malaysia’s government based on the study’s practical implications. Several measures should be taken to promote green technologies, provide encouragement for clean energy, encourage green export exercises, and raise consciousness of the hazards of growing CO2 emissions. These initiatives can support economic expansion and ecological preservation while also improving the environment, promoting low-carbon growth, and reducing CO2 emissions in Malaysia [54,55]. By carrying out these procedures, Malaysia may promote its green development and support global efforts to mitigate climate change.

6. Conclusions

One of the most urgent modern concerns facing the world is climate change, which is strongly correlated with the extent of environmental degradation. Levels of CO2 emissions serve as the standard by which other environmental indicators are evaluated for their impact on global warming. In this regard, our study examines the causes of environmental degradation by using a novel variable: the ECI. To that end, our research investigates the years 1997–2020 in Malaysia to determine if the EKC hypothesis holds, and the results indicate that the EKC hypothesis does hold in Malaysia. Furthermore, the conclusion supports both hypotheses of this study. Energy consumption significantly and directly affects CO2 emissions in Malaysia, and over time, a higher ECI significantly and indirectly affects CO2 emissions in Malaysia.
Our outcomes reveal that the ECI and GDP per capita have a direct and negative link with CO2 emissions in Malaysia. Malaysia’s economy is diversified, with a strong emphasis on manufacturing, especially in the E&E sector, as well as significant contributions from the petroleum and gas industries. Not only is palm oil still a vital export good for the nation, but it also dominates the global market for rubber goods. These exports contribute significantly to Malaysia’s economic growth and its trade relations with major global economies. First, encouraging local production of green energy might help create a green ecosystem while simultaneously supplying the country’s energy needs, particularly for the manufacturing and residential sectors. The government can think about suggesting tax breaks for investments made in the generation of green energy to encourage this. Secondly, businesses that are interested in green products could be given incentives by the government. This approach may lessen the impact of commercial accomplishments on the environment. Lastly, commercial tax exclusions on eco-friendly export commodities could offer an effective approach for attaining mutual economic advancement and environmental protection. Though Malaysia is a heavily industrialized country, it is not considered a major polluter by world measures. Nevertheless, it is facing unique challenges in limiting its carbon footprint and has a responsibility to take proactive measures to become a more environmentally friendly nation.
Fortunately, Malaysia has made considerable advancements in expanding its cutting-edge expertise, for example, in energy proficiency improvements, carbon appraisal schemes, and green energy sources, and has been deeply involved in determining global climate policies in international climate concession situations. Perhaps the government could offer different incentives for businesses, such as imposing taxes on non-RE sources and providing tax breaks or subsidies for businesses that enthusiastically implement green energy sources to invest in eco-friendly/greener exercises, extensively reducing CO2 emissions, and refining environmental implementation.
Additionally, Malaysia should develop sustainable export strategies in light of the significant impact that exports have on greenhouse gas emissions. This can be accomplished by encouraging eco-friendly export methods across the nation. Utilizing advanced technologies and optimizing production systems may drastically lessen the environmental footprint linked to exports. Moreover, Malaysia can minimize the environmental impact of its export activities by implementing sustainable packaging and transportation methods. Increasing production and energy consumption can be effectively mitigated by incorporating environmental considerations into export-oriented industries. By securing the implementation of green practices, Malaysia may draw in environmentally conscious investors, partners, and customers; create new avenues for revenue generation; and ensure a better and cleaner future for its citizens.
There are a few limitations to this study. Owing to the limited available time series data, using panel countries and testing the theory in one area could provide useful results. Second, instead of depending only on the ARDL method, it is worth considering the use of other analytical tools, such as the STIRPAT and LMDI models, in future studies. A stronger evaluation of the topic would result from this. Finally, the unique effects of CO2 emissions from homes and businesses in the area should be distinguished and studied.

Author Contributions

Conceptualization, R.A. and M.D.M.; methodology, R.A. and M.S.; software, R.A.; validation, H.A. and M.S.; formal analysis, M.D.M. and M.S.; investigation, R.A. and M.D.M.; resources, Y.B.M. and H.A.; data curation, R.A., M.S. and M.D.M.; writing—original draft preparation, R.A. and Y.B.M.; writing—review and editing, M.S. and H.A.; visualization, R.A. and H.A.; funding acquisition, H.A. All authors have read and agreed to the published version of the manuscript.

Funding

This research was funded by Princess Nourah bint Abdulrahman University Researchers Supporting Project number (PNURSP2024R548), Princess Nourah bint Abdulrahman University, Riyadh, Saudi Arabia.

Institutional Review Board Statement

Not applicable.

Informed Consent Statement

Not applicable.

Data Availability Statement

The data that support the findings of this study are openly available on request and were downloaded from https://databank.worldbank.org/source/world-developmentindicators, accessed on 3 January 2024; https://atlas.cid.harvard.edu/rankings, accessed on 5 January 2024.

Acknowledgments

The authors extend their appreciation to Princess Nourah bint Abdulrahman University Researchers Supporting Project number (PNURSP2024R548), Princess Nourah bint Abdulrahman University, Riyadh, Saudi Arabia.

Conflicts of Interest

The authors declare that they have no conflicts of interest.

References

  1. Hatmanu, M.; Cautisanu, C.; Iacobuta, A.O. On the relationships between CO2 emissions and their determinants in Romania and Bulgaria. An ARDL approach. Appl. Econ. 2022, 54, 2582–2595. [Google Scholar] [CrossRef]
  2. World Bank. World Development Indicators (WDI); Data Series by the World Bank Group; The World Bank: Washington, DC, USA, 2021; Available online: https://databank.worldbank.org/source/world-development-indicators (accessed on 11 May 2024).
  3. Gan, P.Y.; Li, Z. An econometric study on long-term energy outlook and the implications of renewable energy utilization in Malaysia. Energy Policy 2008, 36, 890–899. [Google Scholar] [CrossRef]
  4. United Nations Framework Convention on Climate Change. Statement by Mr. Tuan Ibrahim Tuan Man Honourable Minister of Environment and Water. 2021. Available online: https://unfccc.int/sites/default/files/resource/MALAYSIA_cop26cmp16cma3_HLS_EN.pdf (accessed on 11 May 2024).
  5. Grossman, G.M.; Krueger, A.B. Environmental Impacts of a North American Free Trade Agreement; NBER Working Papers 3914; National Bureau of Economic Research Inc.: Cambridge, MA, USA, 1991. [Google Scholar]
  6. Panayotou, T. Empirical Tests and Policy Analysis of Environmental Degradation at Different Stages of Economic Development; ILO Working Papers 992927783402676; International Labour Organization: Genève, Switzerland, 1993. [Google Scholar]
  7. Hidalgo, C.A.; Hausmann, R. The building blocks of economic complexity. Proc. Natl. Acad. Sci. USA 2009, 106, 10570–10575. [Google Scholar] [CrossRef] [PubMed]
  8. Hausmann, R.; Hidalgo, C.A.; Bustos, S.; Coscia, M.; Simoes, A. The Atlas of Economic Complexity: Mapping Paths to Prosperity; MIT Press: Cambridge, MA, USA, 2014. [Google Scholar]
  9. Hausmann, R.; Hidalgo, C.; Bustos, S.; Coscia, M.; Simoes, A.; Yildirim, M.A. The Atlas of Economics Complexity—Mapping Paths to Prosperity; Center for International Development, Harvard University: Cambridge, MA, USA, 2011. [Google Scholar]
  10. Swart, J.; Brinkmann, L. Economic complexity and the environment: Evidence from Brazil. In Universities and Sustainable Communities: Meeting the Goals of the Agenda 2030; Springer International Publishing: New York, NY, USA, 2020; pp. 3–45. [Google Scholar]
  11. Azlina, A.A.; Mustapha, N.N. Energy, economic growth and pollutant emissions nexus: The case of Malaysia. Procedia-Soc. Behav. Sci. 2012, 65, 1–7. [Google Scholar] [CrossRef]
  12. Begum, R.A.; Sohag, K.; Abdullah SM, S.; Jaafar, M. CO2 emissions, energy consumption, economic and population growth in Malaysia. Renew. Sustain. Energy Rev. 2015, 41, 594–601. [Google Scholar] [CrossRef]
  13. Ali, U.; Guo, Q.; Kartal, M.T.; Nurgazina, Z.; Khan, Z.A.; Sharif, A. The impact of renewable and non-renewable energy consumption on carbon emission intensity in China: Fresh evidence from novel dynamic ARDL simulations. J. Environ. Manag. 2022, 320, 115782. [Google Scholar] [CrossRef] [PubMed]
  14. Raihan, A.; Tuspekova, A. Toward a sustainable environment: Nexus between economic growth, renewable energy use, forested area, and carbon emissions in Malaysia. Resour. Conserv. Recycl. Adv. 2022, 15, 200096. [Google Scholar] [CrossRef]
  15. Sharif, A.; Sofuoglu, E.; Kocak, S.; Anwar, A. Can green finance and energy provide a Glimmer of hope towards a sustainable environment in the midst of chaos? Evidence from Malaysia. Renew. Energy 2024, 223, 119982. [Google Scholar] [CrossRef]
  16. Shafique, M.; Azam, A.; Rafiq, M.; Luo, X. Evaluating the relationship between freight transport, economic prosperity, urbanization, and CO2 emissions: Evidence from Hong Kong, Singapore, and South Korea. Sustainability 2020, 12, 10664. [Google Scholar] [CrossRef]
  17. Azam, A.; Rafiq, M.; Shafique, M.; Zhang, H.; Yuan, J. Analyzing the effect of natural gas, nuclear energy and renewable energy on GDP and carbon emissions: A multi-variate panel data analysis. Energy 2021, 219, 119592. [Google Scholar] [CrossRef]
  18. Shafique, M.; Azam, A.; Rafiq, M.; Luo, X. Investigating the nexus among transport, economic growth and environmental degradation: Evidence from panel ARDL approach. Transp. Policy 2021, 109, 61–71. [Google Scholar] [CrossRef]
  19. Shin, Y.; Yu, B. An ARDL Approach to an Analysis of Asymmetric Long-Run Cointegrating Relationships; Leeds University Business School: Leeds, UK, 2004. [Google Scholar]
  20. Dickey, D.A.; Fuller, W.A. Distribution of the estimators for autoregressive time series with a unit root. J. Am. Stat. Assoc. 1979, 74, 427–431. [Google Scholar]
  21. Phillips, P.C.; Perron, P. Testing for a unit root in time series regression. Biometrika 1988, 75, 335–346. [Google Scholar] [CrossRef]
  22. Makarov, I.; Alataş, S. Production-and consumption-based emissions in carbon exporters and importers: A large panel data analysis for the EKC hypothesis. Appl. Energy 2024, 363, 123063. [Google Scholar] [CrossRef]
  23. Mohamed, E.F.; Abdullah, A.; Jaaffar, A.H.; Osabohien, R. Reinvestigating the EKC hypothesis: Does renewable energy in power generation reduce carbon emissions and ecological footprint? Energy Strategy Rev. 2024, 53, 101387. [Google Scholar] [CrossRef]
  24. Chopra, R.; Rehman, M.A.; Yadav, A.; Bhardwaj, S. Revisiting the EKC framework concerning COP-28 carbon neutrality management: Evidence from Top-5 carbon embittering countries. J. Environ. Manag. 2024, 356, 120690. [Google Scholar] [CrossRef]
  25. Fan, L.; Usman, M.; Haseeb, M.; Kamal, M. The impact of financial development and energy consumption on ecological footprint in economic complexity-based EKC framework: New evidence from BRICS-T region. In Natural Resources Forum; Blackwell Publishing Ltd.: Oxford, UK, 2024. [Google Scholar]
  26. Fang, P. Short-term carbon emission prediction method of green building based on IPAT model. Int. J. Glob. Energy Issues 2023, 45, 1–13. [Google Scholar]
  27. Poumanyvong, P.; Kaneko, S. Does urbanization lead to less energy use and lower CO2 emissions? A cross-country analysis. Ecol. Econ. 2010, 70, 434–444. [Google Scholar] [CrossRef]
  28. Li, K.; Lin, B. Impacts of urbanization and industrialization on energy consumption/CO2 emissions: Does the level of development matter? Renew. Sustain. Energy Rev. 2015, 52, 1107–1122. [Google Scholar] [CrossRef]
  29. Odugbesan, J.A.; Adebayo, T.S. The symmetrical and asymmetrical effects of foreign direct investment and financial development on carbon emission: Evidence from Nigeria. SN Appl. Sci. 2020, 2, 1982. [Google Scholar] [CrossRef]
  30. Adebayo, T.S.; Awosusi, A.A.; Adeshola, I. Determinants of CO2 emissions in emerging markets: An empirical evidence from MINT economies. Int. J. Renew. Energy Dev. 2020, 9, 411–422. [Google Scholar] [CrossRef]
  31. Adebayo, T.S.; Kalmaz, D.B. Determinants of CO2 emissions: Empirical evidence from Egypt. Environ. Ecol. Stat. 2021, 28, 239–262. [Google Scholar] [CrossRef]
  32. Teng, J.Z.; Khan, M.K.; Khan, M.I.; Chishti, M.Z.; Khan, M.O. Effect of foreign direct investment on CO2 emission with the role of globalization, institutional quality with pooled mean group panel ARDL. Environ. Sci. Pollut. Res. Int. 2021, 28, 5271–5282. [Google Scholar] [CrossRef] [PubMed]
  33. Nondo, C.; Kahsai, M.S. The impact of energy intensity, urbanisation, industrialisation, and income on CO2 emissions in South Africa: An ARDL bounds testing approach. Afr. J. Econ. Sustain. Dev. 2020, 7, 307–330. [Google Scholar]
  34. Zhang, L.; Li, Z.; Kirikkaleli, D.; Adebayo, T.S.; Adeshola, I.; Akinsola, G.D. Modelling CO2 emissions in Malaysia: An application of Maki cointegration and wavelet coherence tests. Environ. Sci. Pollut. Res. 2021, 28, 26030–26044. [Google Scholar]
  35. Aşıcı, A.A. Economic growth and its impact on the environment: A panel data analysis. Ecol. Indic. 2013, 24, 324–333. [Google Scholar] [CrossRef]
  36. Htike, M.M.; Shrestha, A.; Kakinaka, M. Investigating whether the environmental Kuznets curve hypothesis holds for sectoral CO2 emissions: Evidence from developed and developing countries. Environ. Dev. Sustain. 2021, 24, 12712–12739. [Google Scholar] [CrossRef]
  37. Le, H.P.; Ozturk, I. The impacts of globalization, financial development, government expenditures, and institutional quality on CO2 emissions in the presence of environmental Kuznets curve. Environ. Sci. Pollut. Res. 2020, 27, 22680–22697. [Google Scholar] [CrossRef] [PubMed]
  38. Kong, Y.; Khan, R. To examine environmental pollution by economic growth and their impact on an environmental Kuznets curve (EKC) among developed and developing countries. PLoS ONE 2019, 14, e0209532. [Google Scholar] [CrossRef]
  39. Can, M.; Gozgor, G. The impact of economic complexity on carbon emissions: Evidence from France. Environ. Sci. Pollut. Res. 2017, 24, 16364–16370. [Google Scholar] [CrossRef]
  40. Doğan, B.; Saboori, B.; Can, M. Does economic complexity matter for environmental degradation? An empirical analysis for different stages of development. Environ. Sci. Pollut. Res. 2019, 26, 31900–31912. [Google Scholar] [CrossRef]
  41. Ahmed, Z.; Can, M.; Sinha, A.; Ahmad, M.; Alvarado, R.; Rjoub, H. Investigating the role of economic complexity in sustainable development and environmental sustainability. Int. J. Sustain. Dev. World Ecol. 2022, 29, 771–783. [Google Scholar] [CrossRef]
  42. Laverde-Rojas, H.; Guevara-Fletcher, D.A.; Camacho-Murillo, A. Economic growth, economic complexity, and carbon dioxide emissions: The case of Colombia. Heliyon 2021, 7, e07188. [Google Scholar] [CrossRef] [PubMed]
  43. Bucher, F.; Scheu, L.; Schröpf, B. Economic Complexity and Environmental Pollution: Evidence from the Former Socialist; No. 218; BGPE Discussion Paper; Friedrich-Alexander-Universität Erlangen-Nürnberg: Erlangen, Germany, 2022. [Google Scholar]
  44. Kirikkaleli, D.; Sofuoğlu, E.; Abbasi, K.R.; Addai, K. Economic complexity and environmental sustainability in eastern European economy: Evidence from novel Fourier approach. Reg. Sustain. 2023, 4, 349–358. [Google Scholar] [CrossRef]
  45. Karasoy, A.; Akçay, S. Effects of renewable energy consumption and trade on environmental pollution: The Turkish case. Manag. Environ. Qual. Int. J. 2018, 30, 437–455. [Google Scholar] [CrossRef]
  46. Sarkodie, S.A.; Adams, S. Renewable energy, nuclear energy, and environmental pollution: Accounting for political institutional quality in South Africa. Sci. Total Environ. 2018, 643, 1590–1601. [Google Scholar] [CrossRef] [PubMed]
  47. Idowu, K.A.; Adeneye, Y.B. Inequality and economic growth: An analysis of 8-Panels. J. Econ. Public Financ. 2017, 3, 173–187. [Google Scholar] [CrossRef]
  48. Assi, A.F.; Isiksal, A.Z.; Tursoy, T. Highlighting the connection between financial development and consumption of energy in countries with the highest economic freedom. Energy Policy 2020, 147, 111897. [Google Scholar] [CrossRef]
  49. Khan, M.K.; Khan, M.I.; Rehan, M. The relationship between energy consumption, economic growth and carbon dioxide emissions in Pakistan. Financ. Innov. 2020, 6, 1–13. [Google Scholar] [CrossRef]
  50. Chien, F.; Hsu, C.C.; Zhang, Y.; Tran, T.D.; Li, L. Assessing the impact of green fiscal policies and energy poverty on energy efficiency. Environ. Sci. Pollut. Res. 2022, 29, 4363–4374. [Google Scholar] [CrossRef]
  51. Alam, M.B.; Hossain, M.S. Investigating the connections between China’s economic growth, use of renewable energy, and research and development concerning CO2 emissions: An ARDL Bound Test Approach. Technol. Forecast. Soc. Chang. 2024, 201, 123220. [Google Scholar] [CrossRef]
  52. Pesaran, M.H.; Shin, Y.; Smith, R.J. Bounds testing approaches to the analysis of level relationships. J. Appl. Econom. 2001, 16, 289–326. [Google Scholar] [CrossRef]
  53. Madzaki, H.; Ghani, W.A.W.A.K.; Yaw, T.C.S.; Rashid, U.; Muda, N. Carbon dioxide adsorption on activated carbon hydrothermally treated and impregnated with metal oxides. J. Kejuruter. 2018, 30, 31–38. [Google Scholar]
  54. Ahmed, S.; Ahmed, K.; Ismail, M. Predictive analysis of CO2 emissions and the role of environmental technology, energy use and economic output: Evidence from emerging economies. Air Qual. Atmos. Health 2020, 13, 1035–1044. [Google Scholar] [CrossRef]
  55. Yin, Q.; Wang, Y.; Xu, Z.; Wan, K.; Wang, D. Factors influencing green transformation efficiency in China’s mineral resource-based cities: Method analysis based on IPAT-E and PLS-SEM. J. Clean. Prod. 2022, 330, 129783. [Google Scholar] [CrossRef]
Figure 1. Energy demand in Malaysia from 2015 to 2021. Source: Malaysia energy information hub, Energy commission, 2023.
Energies 17 02900 g001
Figure 2. Fossil Fuel Consumption per Capita in Malaysia. Source: World Bank. Produced by the authors.
Energies 17 02900 g002
Figure 3. CO2 emissions per capita in Malaysia. Source: World Bank. Produced by the authors.
Energies 17 02900 g003
Figure 4. Total exports in Malaysia in 2022. Source: https://atlas.cid.harvard.edu/rankings.
Energies 17 02900 g004
Figure 5. Cumulative sum of recursive residuals (CUSUM).
Energies 17 02900 g005
Figure 6. Cumulative sum of squares of recursive residual (CUSUM square).
Energies 17 02900 g006
Table 1. Descriptive statistics of the variables and the correlation matrices.
lnCO2lnECIlnGDPlnGDP2lnEC
Mean8.261−0.3443.90315.2383.028
Median8.284−0.0693.89515.1682.964
Maximum8.4300.0514.04616.3693.439
Minimum8.017−2.2353.76914.2102.764
Std. Dev.0.1290.6290.0850.6680.215
Skewness−0.420−2.1170.1510.1750.775
Kurtosis1.9716.4631.7671.7732.276
Jarque-Bera1.76829.9311.6101.6272.929
Probability0.4130.0000.4470.4430.231
Sum198.271−8.25793.666365.72372.671
Sum Sq. Dev.0.3839.1150.16810.2571.059
Observations2424242424
Correlation matrix
lnCO21.0000
lnECI0.79831.0000
lnGDP0.96200.69751.0000
lnGDP20.96000.69321.00001.0000
lnEC0.75850.51490.87620.87961.0000
Table 2. Results of unit root tests.
VariablesADF Test StatisticPP Test Statistic
Level1st DifferenceLevel1st Difference
lnCO2−2.43 **−6.23 **−0.55−5.41
lnGDP−0.08−6.12 **0.02−6.61 **
lnGDP2−0.06−5.94 **0.04−6.19 **
lnEC−1.44−4.26 **−1.43−4.28 **
lnECI−2.15 **−5.44 **−9.40 **−4.02 **
(**) represent 5% levels of significance.
Table 3. Results of the Cointegration Test.
Empirical Model l n C O 2 = ( l n G D P , l n G D P 2 ,   l n E C ,   l n E C I )
Optimum lag length2, 1, 0, 0, 0
F-statistics9.967 ***
Significance levelLower bound (0)Upper bound I (1)
1%4.45.72
2.50%3.895.07
5%3.474.57
10%3.034.06
(***) represent 10% levels of significance.
Table 4. Results of the ARDL model.
VariablesCoefficientStd Errort-StatisticProb
LnGDP2.0710.4464.6340.007 **
D(lnGDP)59.0516.9623.4820.005 **
LnGDP2−0.2150.064−3.4290.001 **
D(LnGDP2)−7.4582.164−3.4450.005 **
LnEC0.9780.4102.3680.037 **
D(LnEC)0.4290.2511.7090.112
lnECI0.1820.0543.3930.006 **
D(lnECI)0.2240.0892.5050.029 **
ECT(−1)−0.6670.183−6.2200.0001 *
R20.991 Adjusted R20.983
Diagnostic test statisticst-testp-value
Lagrange multiplier test1.4690.302
Jarque–Bera test1.190.546
Breusch–Pagan–Godfrey test0.7130.726
(*) and (**) represent 1% and 5% levels of significance, respectively.
Disclaimer/Publisher’s Note: The statements, opinions and data contained in all publications are solely those of the individual author(s) and contributor(s) and not of MDPI and/or the editor(s). MDPI and/or the editor(s) disclaim responsibility for any injury to people or property resulting from any ideas, methods, instructions or products referred to in the content.

