Abstract
The reduction of energy demand in buildings is one of the key challenges in contemporary construction. To this end, the application of structural and material partitioning solutions that provide a high level of thermal insulation and the employment of technical installations with high energy performance have become widespread. However, there are a number of other factors that can reduce energy demand. These include the optimal use of heat gains from solar radiation. An aspect that is often discussed in the literature is the overheating of buildings due to excessive heat gains from solar radiation. This article is a case study showing the impact of the orientation of a single-family passive house on its heating energy demand. The building under consideration is located in Central Europe. External climate parameters measured directly at the site during experimental examinations were used for the calculations. This paper adopts six calculation options, considering the different orientations of the glazed façade. As the simulations showed, the effect of solar radiation on the energy demand between two extreme options of glazing orientation, that is south and north-facing orientation, reached 4.7% of the annual energy demand for heating, while for the option corresponding to the actual location of the building and the option involving south-facing windows, the difference was 0.3%, respectively.
1. Introduction
Enhancing the energy performance of buildings is currently one of the key issues being considered to reduce energy consumption in many countries and to reduce greenhouse gas emissions. In 2023, the European Parliament introduced an amendment to the Energy Performance Improvement Directive [1], according to which buildings account for 40% of total energy consumption within the European Union. Hence, there is a further need to develop energy-efficient technologies in construction and optimise current solutions.
The concept of energy-efficient construction is implemented in many forms. One of these is passive construction, which is characterised by highly insulated partitions, the use of mechanical ventilation with heat recovery, and optimised body, interior, and equipment design. This makes better use of external and internal heat gains. Attention to detail and the joining of partition elements so as to eliminate thermal bridges are also important. The energy demand for heating in a passive house should not exceed 15 kWh/m2K over the course of a year [2]. As stated in [3], the recommended orientation of the main glazing in the building should be south in order to maximise heat gains.
Therefore, besides the development of construction and material solutions and the application of highly efficient technical devices to maintain the microclimate parameters used in energy-efficient buildings, it is also important to analyse other factors, such as the influence of a building’s orientation with respect to the cardinal directions on the management of solar radiation gains. There is a lot of research on heat gain management, but in terms of its reduction in warm climates (subtropical and tropical, or equatorial), the main problem is the high energy consumption for the purpose of cooling various types of buildings, both residential and public. This issue can be found, inter alia, in publications [4,5,6]. The problem of overheating in buildings, especially those with high energy efficiency parameters, may also concern cold climates in the summer. Passive buildings, in particular, should use passive cooling methods, which, in cases of insufficient protection against excessive heat gains, may lead to their overheating. This was described in [7], where overheating occurred in 72% of the analysed apartments located in the United Kingdom. The analysis of factors potentially exacerbating the risk of overheating is described in [8]. However, in the context of the analysis presented in this article, it is primarily important to examine the impact of solar gains on reducing energy consumption on heating, which is a basic challenge in buildings located in temperate climates. This issue is addressed in various articles. In [9], the authors point out that the optimum window position is the centre of the façade in relation to height. However, the difference in energy consumption between the most extreme options considering the orientation of the windows with respect to the cardinal directions and their positioning in the façade is 30 kWh/year, which represents 1% of total energy consumption. The analysis was conducted for a single-family house in a temperate climate (Vancouver, Canada). In [10], on the other hand, the authors show that in a small office building located in Serbia, the difference in energy demand for heating due to its location can reach 13.73%. Another example reported in [11] is a commercial building in Poitiers, France, where the authors analysed the optimum shape and impact of the window location on energy consumption. The authors identified a building based on a square projection as the optimum shape, while the savings in energy demand for heating relative to the extreme options, i.e., north and south, were estimated at 22.2%. Another example of the analysis of building shape and orientation on the energy demand of a building is presented in [12]. In this case, student houses were analysed. Simulations were performed for a location in Hamburg, Germany. According to the author, of the eight cases analysed, only three showed significant differences of up to 8%. In [13], having analysed 81 house designs, the authors recorded and observed that the higher the energy standard of the building, the smaller the impact of its orientation on energy consumption.
The analysis of energy consumption in buildings is supported by specialised computer software that allows the simulation of many different calculation options for the facilities under consideration. In the research described in this article, WUFI®Plus software [14] was used for simulation calculations. The software enables thermal-moisture and energy consumption calculations to be conducted in the building, considering the partition structure, technical equipment of the building, internal gains, and solar radiation gains, with shading calculated at each time step. It is successfully used in contemporary and historical buildings as well as in production buildings. Examples include the studies presented in the following articles [15,16,17,18].
2. Materials and Methods
2.1. Building under Examination
A single-family passive house, which was constructed using timber-frame technology, was analysed. The building frame was made of wood. The building was constructed as part of a prefabrication process, where walls and ceilings were prefabricated in a manufacturing facility and then transported to the final location of the building, Boruszowice in southern Poland (Figure 1). Also, during the prefabrication stage, window and door joinery was installed to avoid assembly errors. The basic geometrical dimensions are a length of 10.58 m, a width of 7.77 m, and a height of 8.02 m, respectively. The building’s usable area is 119.9 m2. The building has two storeys (ground and first floor) and a non-usable attic. The building is permanently inhabited by a family of five.
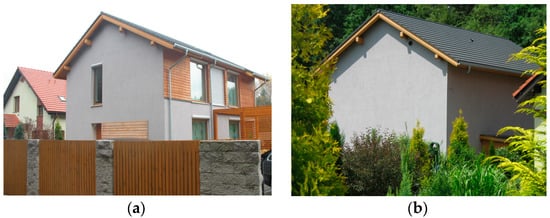
Figure 1.
South-east and south-west façades (a), north-east and north-west façades (b).
The analysed building is certified to meet passive house requirements. The functional layout has also been arranged in a manner typical of passive houses. The south-east façade, which has the largest volume of glass, is where the residents spend most of their time: the living room, office, and bedrooms. The north-east and north-west façades have no glazing. In this part of the building, the technical rooms and hygiene and sanitary facilities are located (Figure 2).
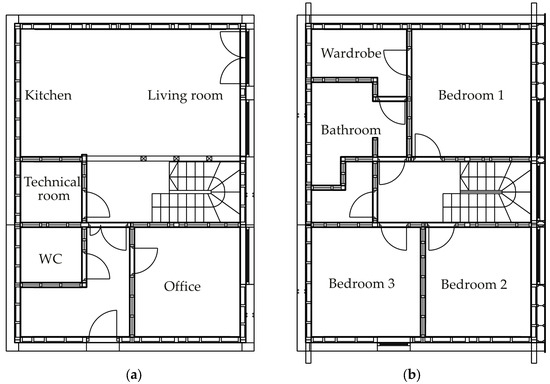
Figure 2.
Layout of the rooms in the building. Ground floor (a), first floor (b).
The windows used in the building are timber-framed, while the glazing is a composite 3-pane construction with argon-filled chambers. The solar energy transmittance for this glazing unit is 0.54 [-]. However, the reference heat transfer coefficient for the windows used in the building is 0.68 W·m−2·K−1. On the south-east façade of the building, the window area is 23.76 m2, while the area of the window providing extra light to bedroom 3 on the south-west façade is 2.29 m2. The total window area of the building is 26.05 m2.
The wall structure consists of a 16 cm thick timber frame filled with mineral wool and stiffened on both sides with chipboard, with an additional 25 cm thick thermal insulation layer on the external side. The building is available in 8 external wall options, which differ in the type of materials used, i.e., structure stiffening boards (OSB or Fermacell chipboard), external thermal insulation (polystyrene foam, mineral wool, and wood wool), and vapour-barrier foil (standard vapour-barrier foil, Vario foil). Details of the structure, including a description of the options and a hygrothermal analysis of the partitions, are described in [19]. The value of the heat transfer coefficient through partitions is similar in all options and amounts to 0.08 W·m−2·K−1. The building is settled on a reinforced concrete slab, which was made on a 40 cm layer of perimetric slabs, insulating the building from the ground. The attic of the building has a 20 cm thick timber structure filled with mineral wool. It is also additionally insulated with a 30 cm layer of mineral wool.
The building has been equipped with a ground heat pump powering the heating system and a domestic hot water system, as well as a mechanical ventilation system with heat recovery. Protection against excessive heat gain from solar radiation includes external blinds on each window and roof overhangs that partially shade the windows on the upper floor. In addition, the ventilation system is connected to a ground heat exchanger, which helps to optimise maximum and minimum temperatures entering the building. The analysis of thermal comfort for the building in question throughout the period of one year is presented in article [20].
2.2. Experimental Investigation
The building under analysis was constructed in 2010 as an experimental facility for passive building research under operating conditions. Experimental investigation began in 2011 when the building was equipped with a total of 158 sensors to measure a number of various parameters. Among other things, the hygrothermal parameters of partitions and selected rooms were recorded, and the energy consumption of the entire building and individual technical systems (ground source heat pump, heat recovery unit, heating system circulation pumps) was monitored. Other research has been described in [21]. This article, on the other hand, attempts to answer the question of how the location of a passive house in relation to the cardinal directions affects its energy demand for heating. External climate data, which were recorded directly at the building during the research, will be used for these analyses.
2.3. Measurement of External Climate Parameters
A meteorological station was located on the plot where the building under study is located (Figure 3). It recorded the following climate parameters: air temperature, relative humidity, total and diffused radiation, and wind speed and direction.
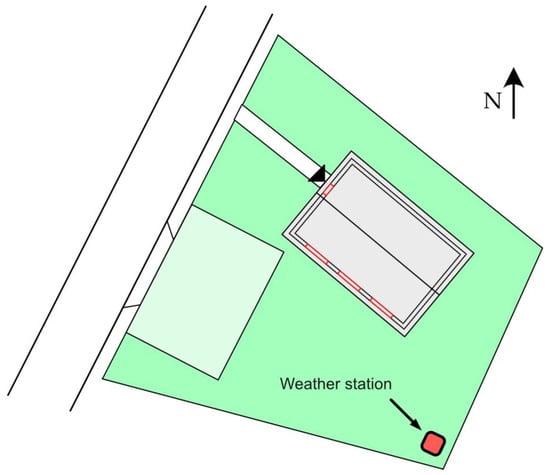
Figure 3.
Location of the building within the plot.
Air temperature and humidity measurements were performed using an integrated sensor (LB-710R). Its basic measurement parameters for temperature are as follows:
- -
- measurement accuracy: 0.1 °C
- -
- measurement range: −40–85 °C
- -
- resolution: 0.1 °C
Whereas the relative humidity parameters are as follows:
- -
- measurement accuracy: 2%
- -
- measurement range: 0–100%
- -
- resolution: 0.1%
The CMP3 sensor (LAB-EL, Warsaw, Poland) was used to measure total solar radiation; its basic parameters are as follows:
- -
- sensitivity: 5–15 μV/(W/m2)
- -
- resistance: 30–100 Ω
- -
- response time: (95%) 18 s
- -
- measurement range: 0–2000 W/m2
In turn, the LP PYRA12 AC DeltaOhm sensor (LAB-EL, Warsaw, Poland) was used to measure diffused radiation:
- -
- sensitivity: 10 μV/(W/m2)
- -
- resistance: 33–45 Ω
- -
- response time: 28–30 s
- -
- measurement range: 0–2000 W/m2
- -
- shading ring diameter: 570 mm
Wind speed and direction were measured with the integrated lb-747 sensor. The basic parameters for wind speed measurement are as follows:
- -
- range: 0.5–90 m/s
- -
- accuracy: 2%
- -
- resolution: 0.1 m/s
The wind direction measurement parameters, on the other hand, are as follows:
- -
- range: 0–360°
- -
- accuracy: 3%
All measurements were recorded at an interval of 1 or 6 min, depending on the capabilities of the respective data logger, while for further computer calculations and analyses, the measured data were averaged to hourly values due to the need for such a time step in the simulation programme that was used. The installed station at the test facility is shown in Figure 4.
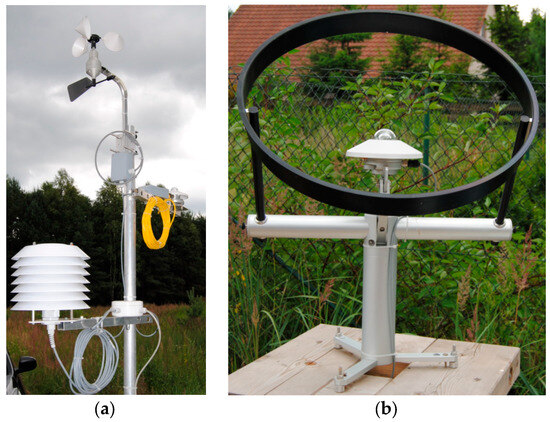
Figure 4.
Meteorological mast equipped with sensors for temperature, humidity, wind speed and direction, and total radiation (a). Pyranometer—measurement of diffuse radiation (b).
The analysed period was characteristic of significant variability in external air temperatures. The lowest temperature recorded was −28.2 °C, while the highest temperature was 36.2 °C. The average annual temperature was 8.4 °C. The course of the recorded measurements is shown in Figure 5. For external relative humidity, the lowest recorded value was 16.5%, and the highest was 96.9%. The average external relative humidity was 79.8%. The course of the recorded relative humidity measurements is shown in Figure 6.
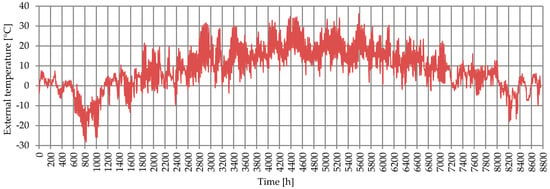
Figure 5.
External air temperature measurement.
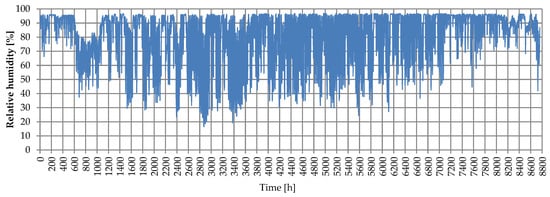
Figure 6.
External relative humidity measurement.
During the period under consideration, the prevailing winds came from a southerly and south-easterly direction, accounting for 30.6% and 22.4% of all recorded measurements, respectively. The wind speed fluctuated between 0 and 3.01 m/s, with an average value of 0.49 m/s. The annual measurement of wind direction is shown in Figure 7, while the wind speed for the analysed period is shown in Figure 8.
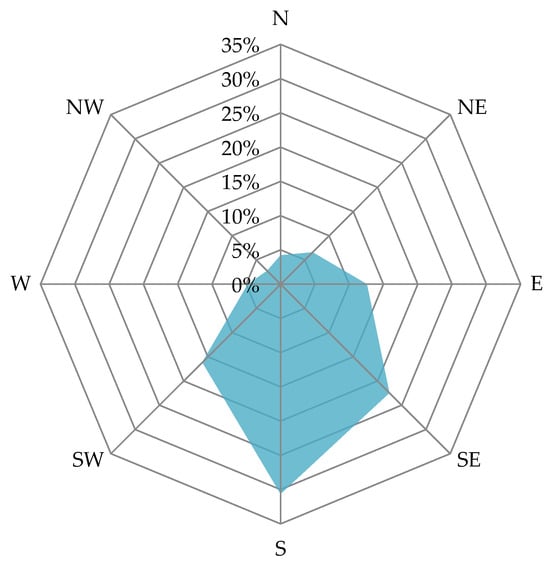
Figure 7.
Wind direction measurement.
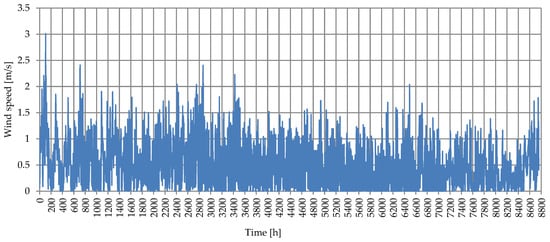
Figure 8.
Wind speed measurement.
The values of total radiation recorded during the experiments reached values of up to 890 W/m2, while the highest measurement of diffused radiation was 377 W/m2. The full course of total and diffuse radiation is shown in Figure 9.
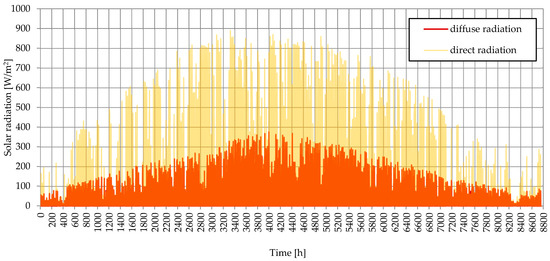
Figure 9.
Measurement of solar radiation.
A period of one measurement year was selected for the analysis, based on which a file in *.wac format was prepared with the above-mentioned climate parameters, which was then used as part of further simulations. The recorded measurements were saved at 1 or 6 min intervals, depending on the recording equipment used. Due to the required 1 h time step in further simulation calculations, the measured data were averaged to hourly values.
2.4. Simulations
For the purposes of simulating energy demand in the context of heating, a three-dimensional model of the building was developed in the SketchUp graphics program, and then the prepared model was implemented into WUFI®Plus 3.5, where the material data of the partitions, the technical systems with which the building was equipped (the central heating system, the mechanical ventilation system with heat recovery), and the external climate data measured during the study were entered (Figure 10).

Figure 10.
The process of creating a building model to simulate energy consumption.
In the case study, 6 calculation options were conducted, considering the different locations of the building in relation to the cardinal directions. The first calculation option assumed a location according to the actual south-west orientation of the building. This option also allowed the developed calculation model to be compared to the actual measurements of energy consumption in the building, as described in the article [21]. Subsequent calculation options assumed a different building orientation: south, south-east, east, and west. The calculations for the north-east and north-west orientations were omitted due to their contradiction with the assumptions of passive construction, where it is important to make the best use of solar radiation gains. For comparison purposes only, calculations were made for the least favourable option where solar radiation is lowest, i.e., exposure of windows to the north. The options analysed are shown in Figure 11.
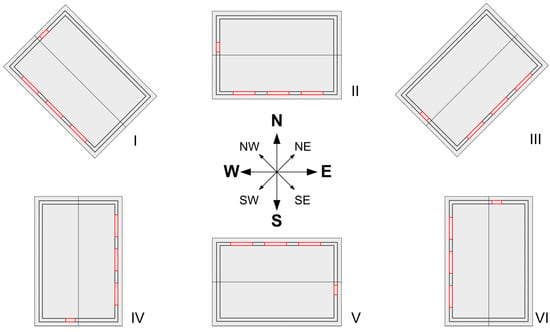
Figure 11.
Building location options analysed.
3. Results and Discussion
The energy consumption calculations started with option I, which corresponds to the actual location of the building, in which all the windows are oriented towards the south-west. In this case, the annual energy demand for heating was 3471.1 kWh. This value is close to the values measured during the experimental research, where the annual energy demand of the building for heating was 3554.8 kWh. Another option for calculation II was to orient the main glazed façade to the south. In this case, the calculated annual energy requirement of the building for heating, as expected, was the lowest of those analysed, i.e., 3461 kWh. In option III, with the windows facing south-east, the energy demand was 3520.6 kWh, while in option IV, eastern, it was 3577.4 kWh, and in option VI, western, it was 3533.8 kWh. Option V was the most unfavourable; with the windows facing north, the energy demand for heating was 3633.4 kWh. A summary of the results for the options analysed can be found in Figure 12.
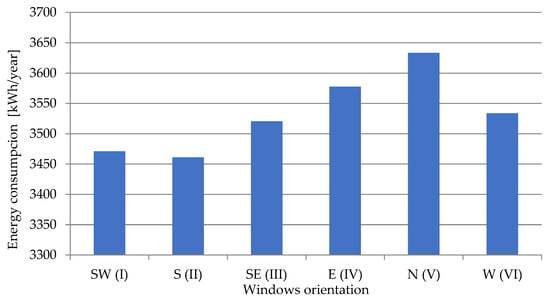
Figure 12.
Annual energy consumption for heating as part of the options analysed.
In the building analysed, the difference in annual energy demand for heating between the extreme cases, i.e., orientation of the glazing of the building to the south (II) and north (V) sides, was 171 kWh/year, which is 4.7%. The scenario with glazing on the north façade is not feasible due to the requirements and assumptions for passive houses, which dictate that glazing on the north side should be reduced or even completely abandoned. However, this option is intended to show the differences in energy demand at the extremes. On the other hand, a comparison of the actual option with windows facing south-west (I) with the southern option (II), the most optimal, showed the smallest difference amongst the analysed cases of 10.1 kWh/year, which constitutes 0.3%. In contrast, the difference between options (II) and (III) was 59.6 kWh/year. Considering other options, (IV) and (VI), the differences with respect to the southern façade (II) were 116.4 kwh/year and 72.8 kWh/year, respectively. (Figure 13) shows the difference in energy demand as a percentage for the options analysed.
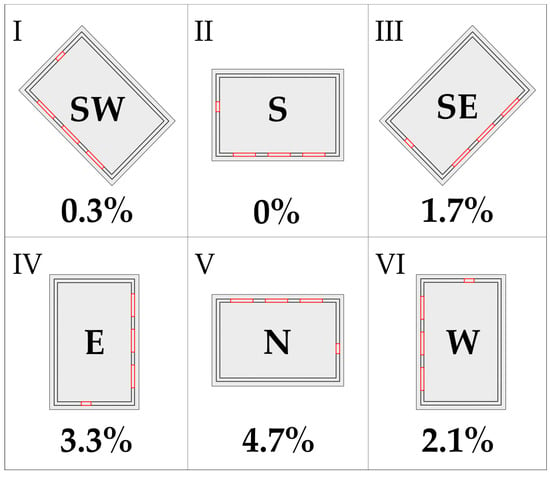
Figure 13.
Increase in energy demand for heating in relation to south orientation.
4. Conclusions
The simulations, based on climate data measured during the experimental examinations and validated with actual energy consumption measurements, allowed a meaningful determination of the impact of alternative glazing orientations on heating energy consumption in a single-family passive house. They showed that changing the orientation of the glazing in the test facility would have a small impact on the energy consumption for heating the building. A south-facing orientation is indicated as the optimum design direction, where the main glazing should be directed; however, a ±45° rotation of the façade from the south direction resulted in less than a 2% increase in energy demand, while increasing the range of rotation to 90° increased energy demand by a maximum of 3.3%. The observed values are lower than those in the cited research [10,11]. However, what needs to be emphasised is the different characteristics and purposes of these buildings, which makes a direct comparison difficult. Calculations have shown that the orientation of the glazing in a passive house has a limited impact on the annual heating energy demand, which confirms the conclusion found in [13]. In practice, this may allow for more freedom when designing the location of this type of building on plots that may have constraints that prevent the windows from being perfectly south-facing. However, it should be noted that, in some cases, these small differences in a building’s heating needs can make the difference between meeting passive house requirements, so an analysis of the impact of a building’s orientation relative to the cardinal directions on solar radiation gain management should be considered in detail when designing a passive house.
Funding
This research was supported by the European Union/European Regional Development Fund “Passive house for everyone”. Operational Program Innovative Economy, Action 1.4 Support for goal-oriented projects of priority axis 1: Research and development of modern technologies, and action 4.1 Support for the implementation of R&D results of priority axis 4: Investments in innovative projects (2012).
Data Availability Statement
The original contributions presented in the study are included in the article, further inquiries can be directed to the author.
Acknowledgments
We give special gratitude to the house’s inhabitants, the Pawliczek family, for their friendly attitude and great endurance shown during the many years of investigation.
Conflicts of Interest
The author declares no conflicts of interest. The funders had no role in the design of the study; in the collection, analysis, or interpretation of data; in the writing of the manuscript; or in the decision to publish the results.
References
- The European Parliament and the Council of the European Union. Directive (EU) 2023/995 of the European Parliament and of the Council of 13 September 2023 Amending Directive 2010/31/EU on the Energy Performance of Buildings and Directive 2012/27/EU on Energy Efficiency; The European Parliament and the Council of the European Union: Brussels, Belgium, 2023. [Google Scholar]
- Passive House Institute (PHI). Available online: https://passivehouse.com (accessed on 4 March 2024).
- Internationale Passive House Asscotation (IPHA). Available online: https://passivehouse-international.org (accessed on 4 March 2024).
- Lahmar, I.; Cannavale, A.; Martellotta, F.; Zemmouri, N. The Impact of Building Orientation and Window-to-Wall Ratio on the Performance of Electrochromic Glazing in Hot Arid Climates: A Parametric Assessment. Buildings 2022, 12, 724. [Google Scholar] [CrossRef]
- Kabanshi, A.; Choonya, G.; Ameen, A.; Liu, W.; Mulenga, E. Windows of Opportunities: Orientation, Sizing and PV-Shading of the Glazed Area to Reduce Cooling Energy Demand in Sub-Sahara Africa. Energies 2023, 16, 3834. [Google Scholar] [CrossRef]
- Alwetaishi, M.; Benjeddou, O. Impact of Window to Wall Ratio on Energy Loads in Hot Regions: A Study of Building Energy Performance. Energies 2021, 14, 1080. [Google Scholar] [CrossRef]
- Tabatabaei Sameni, S.M.; Gaterell, M.; Montazami, A.; Ahmed, A. Overheating investigation in UK social housing flats built to the Passivhaus standard. Build. Environ. 2015, 92, 222–235. [Google Scholar] [CrossRef]
- Goncalves, V.; Ogunjimi, Y.; Heo, Y. Scrutinizing modeling and analysis methods for evaluating overheating risks in passive houses. Energy Build. 2021, 343, 110701. [Google Scholar] [CrossRef]
- Kim, S.; Zadeh, P.A.; Staub-French, S.; Froese, T.; Cavka, B.T. Assessment of the Impact of Window Size, Position and Orientation on Building Energy Load Using BIM. Procedia Eng. 2016, 145, 1424–1431. [Google Scholar] [CrossRef]
- Vasov, M.; Stevanovic, J.; Bogdanovic, V.; Ignjatovic, M.; Ranđelović, D. Impact of orientation and building envelope characteristics on energy consumption case study of office building in city of Nis. Therm. Sci. 2018, 22, 1499–1509. [Google Scholar] [CrossRef]
- Lapisa, R. The effect of building geometric shape and orientation on its energy performance in various climate regions. Int. J. GEOMATE 2019, 16, 113–119. [Google Scholar] [CrossRef]
- Mokrzecka, M. Influence of building shape and orientation on heating demand: Simulations for student dormitories in temperate climate conditions. E3S Web Conf. 2018, 44, 00117. [Google Scholar] [CrossRef]
- Morrissey, J.; Moore, T.; Horne, R.E. Affordable passive solar design in a temperate climate: An experiment in residential building orientation. Renew. Energy 2011, 36, 568–577. [Google Scholar] [CrossRef]
- WUFI-Wärme Und Feuchte Instationär. Available online: https://wufi.de/en (accessed on 9 March 2024).
- Nawalany, G.; Sokołowski, P.; Michalik, M. Experimental Study of Thermal and Humidity Conditions in a Historic Wooden Building in Southern Poland. Buildings 2020, 10, 118. [Google Scholar] [CrossRef]
- Sokołowski, P.; Nawalany, G. Analysis of Energy Exchange with the Ground in a Two-Chamber Vegetable Cold Store, Assuming Different Lengths of Technological Break, with the Use of a Numerical Calculation Method—A Case Study. Energies 2020, 13, 4970. [Google Scholar] [CrossRef]
- Nawalany, G.; Sokołowski, P.; Lendelová, J.; Žitňák, M.; Jakubowski, T.; Atilgan, A. Numerical Analysis of the Heat Exchange Model with the Ground on the Example of a Complex of Industrial Halls. Energy Build. 2023, 300, 113689. [Google Scholar] [CrossRef]
- Sadłowska-Sałęga, A.; Radoń, J. Feasibility and limitation of calculative determination of hygrothermal conditions in historical buildings: Case study of st. Martin church in Wiśniowa. Build. Environ. 2020, 186, 107361. [Google Scholar] [CrossRef]
- Radoń, J.; Wąs, K.; Flaga-Maryanczyk, A.; Schnotale, J. Experimental and theoretical study on hygrothermal long-term performance of outer assemblies in lightweight passive house. J. Build. Phys. 2018, 41, 299–320. [Google Scholar] [CrossRef]
- Wąs, K.; Radoń, J.; Sadłowska-Sałęga, A. Thermal Comfort—Case Study in a Lightweight Passive House. Energies 2022, 15, 4687. [Google Scholar] [CrossRef]
- Wąs, K.; Radoń, J.; Sadłowska-Sałęga, A. Maintenance of Passive House Standard in the Light of Long-Term Study on Energy Use in a Prefabricated Lightweight Passive House in Central Europe. Energies 2020, 13, 2801. [Google Scholar] [CrossRef]
Disclaimer/Publisher’s Note: The statements, opinions and data contained in all publications are solely those of the individual author(s) and contributor(s) and not of MDPI and/or the editor(s). MDPI and/or the editor(s) disclaim responsibility for any injury to people or property resulting from any ideas, methods, instructions or products referred to in the content. |
© 2024 by the author. Licensee MDPI, Basel, Switzerland. This article is an open access article distributed under the terms and conditions of the Creative Commons Attribution (CC BY) license (https://creativecommons.org/licenses/by/4.0/).