

The Impact of the Location of a Passive Frame House on Its Energy Demand for the Purpose of Heating—A Case Study

Abstract
:1. Introduction
2. Materials and Methods
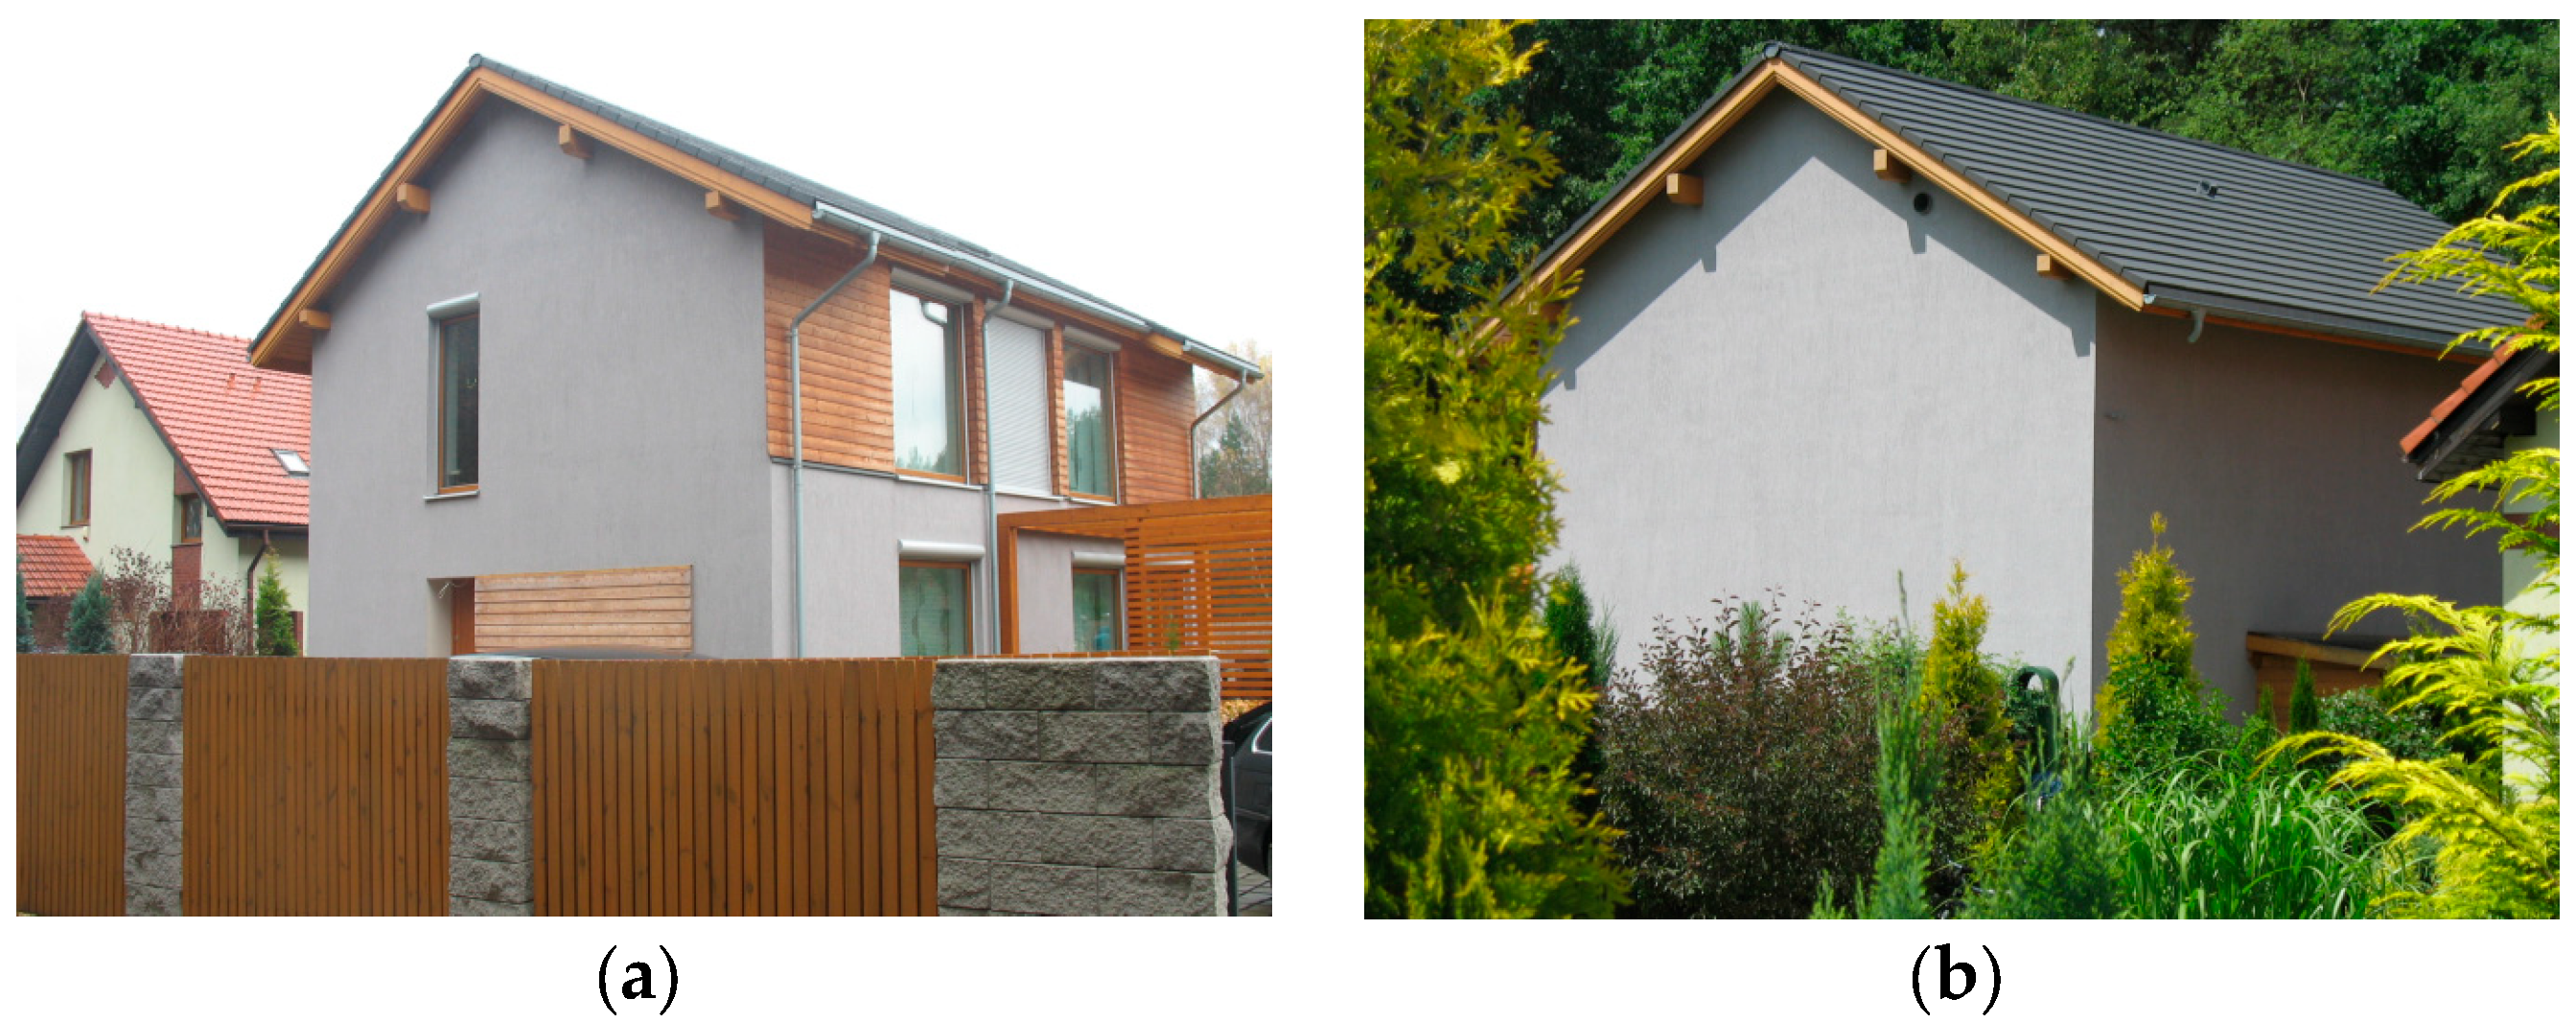
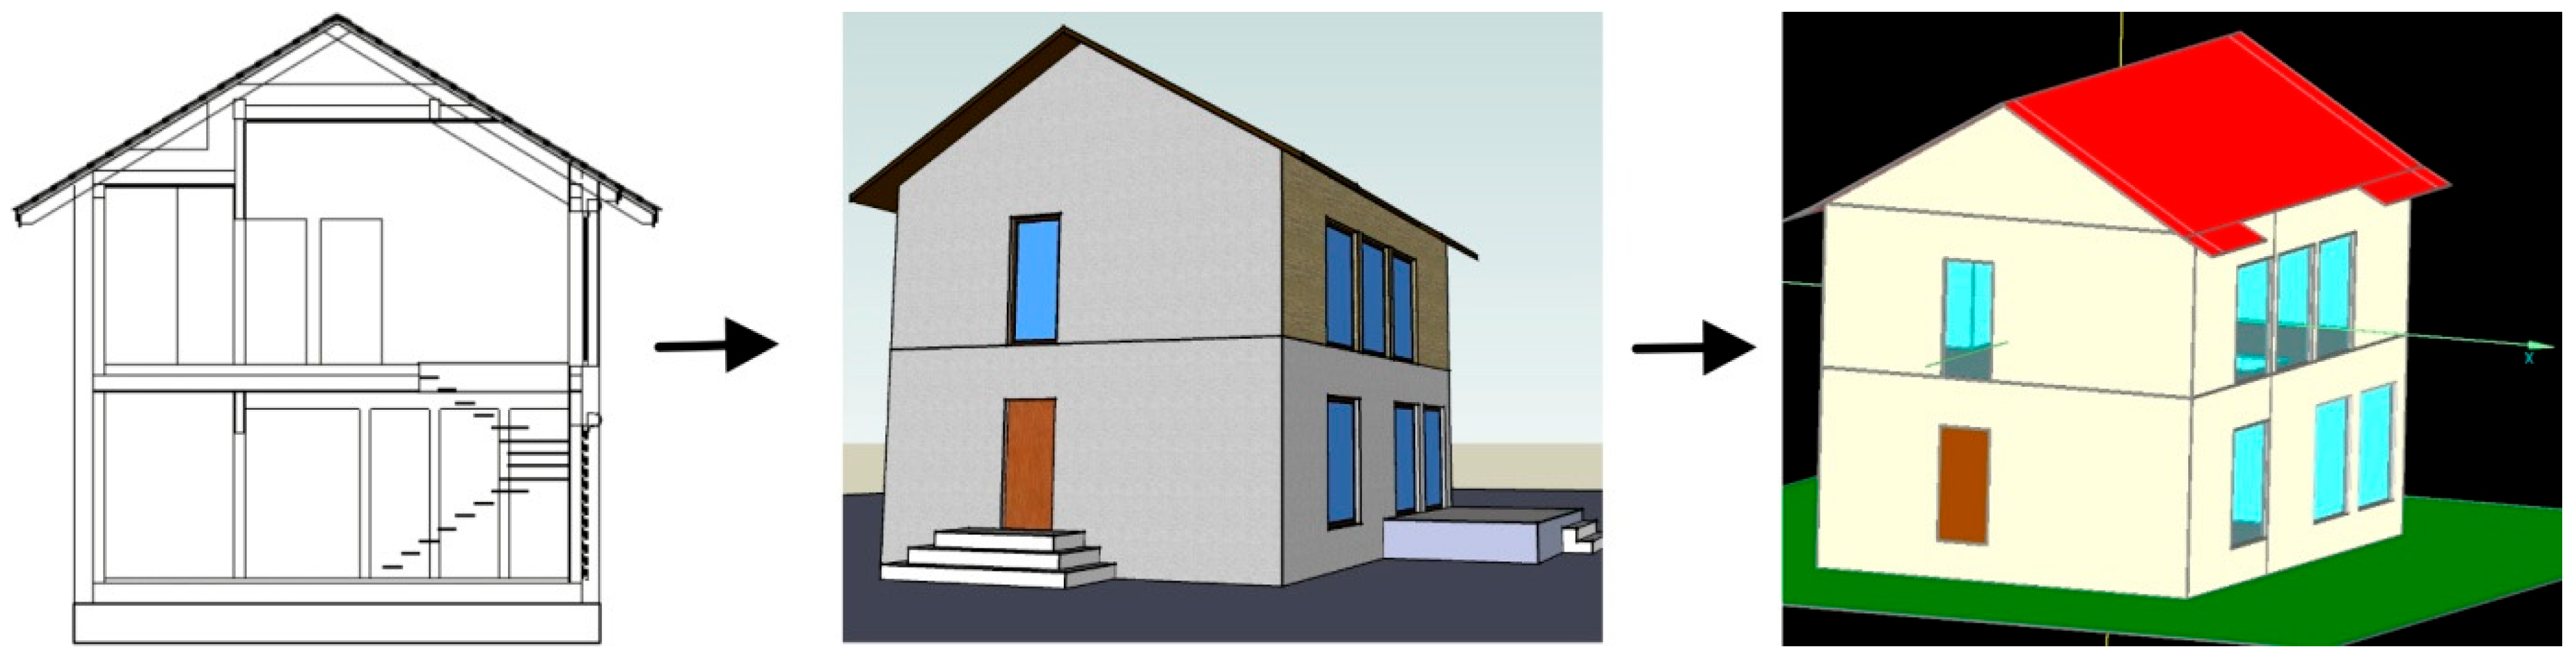
2.1. Building under Examination
2.2. Experimental Investigation
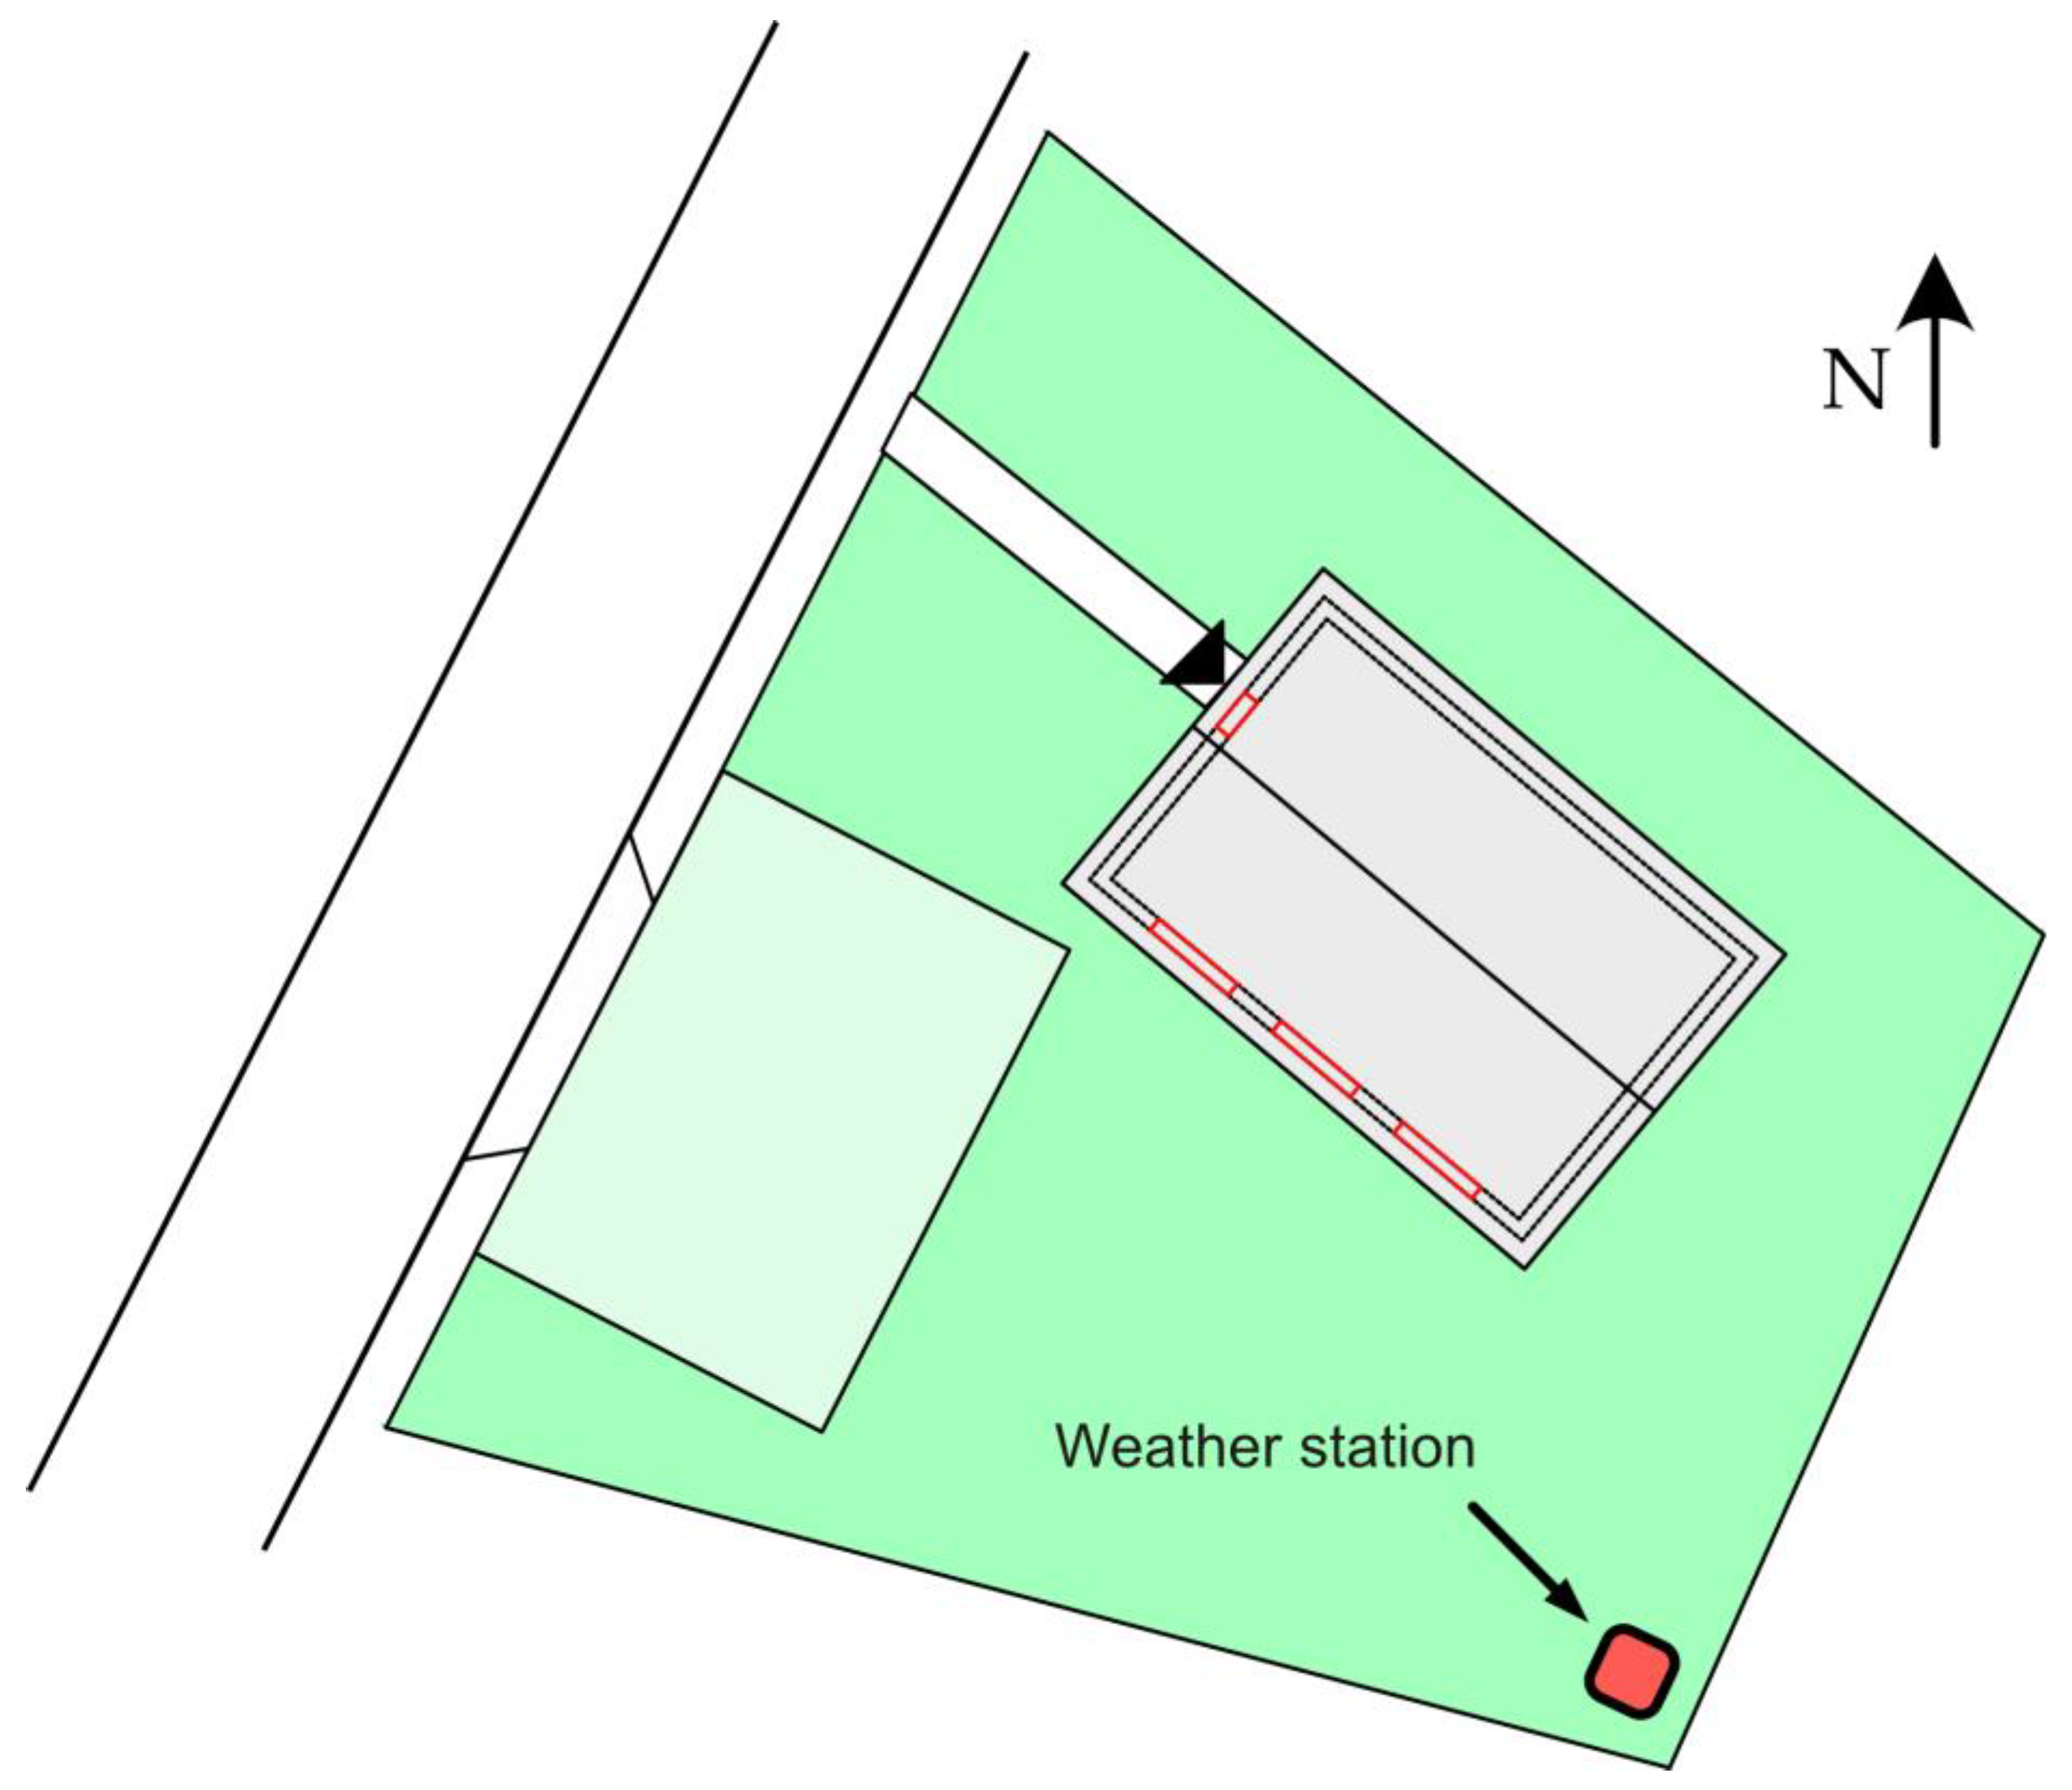
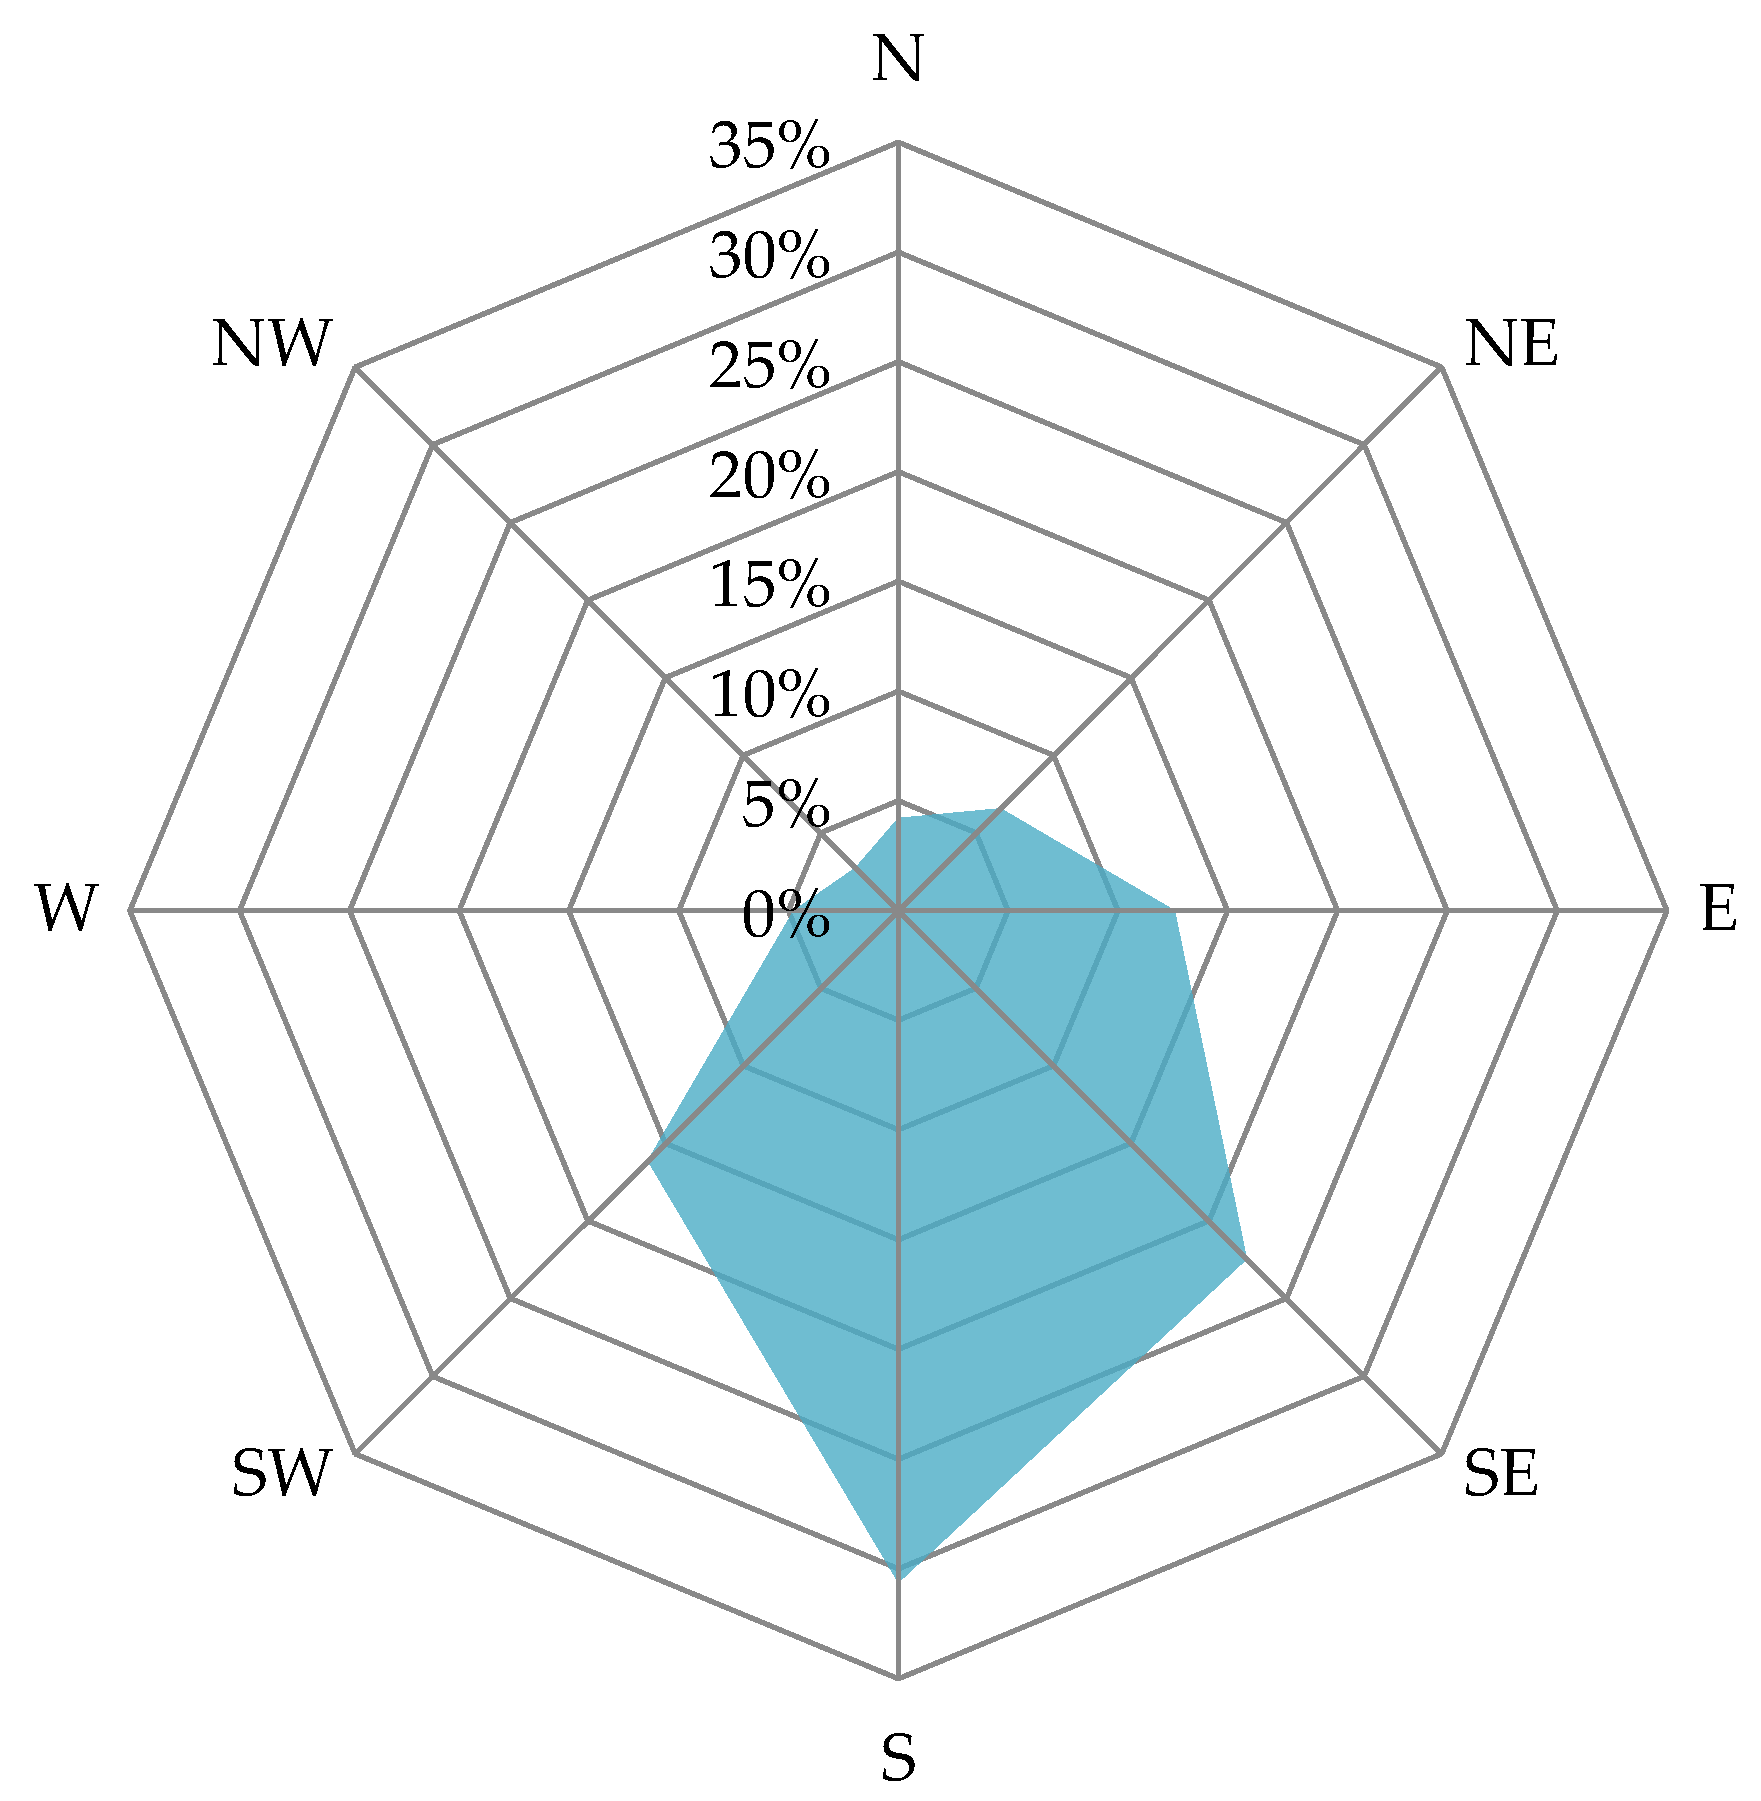
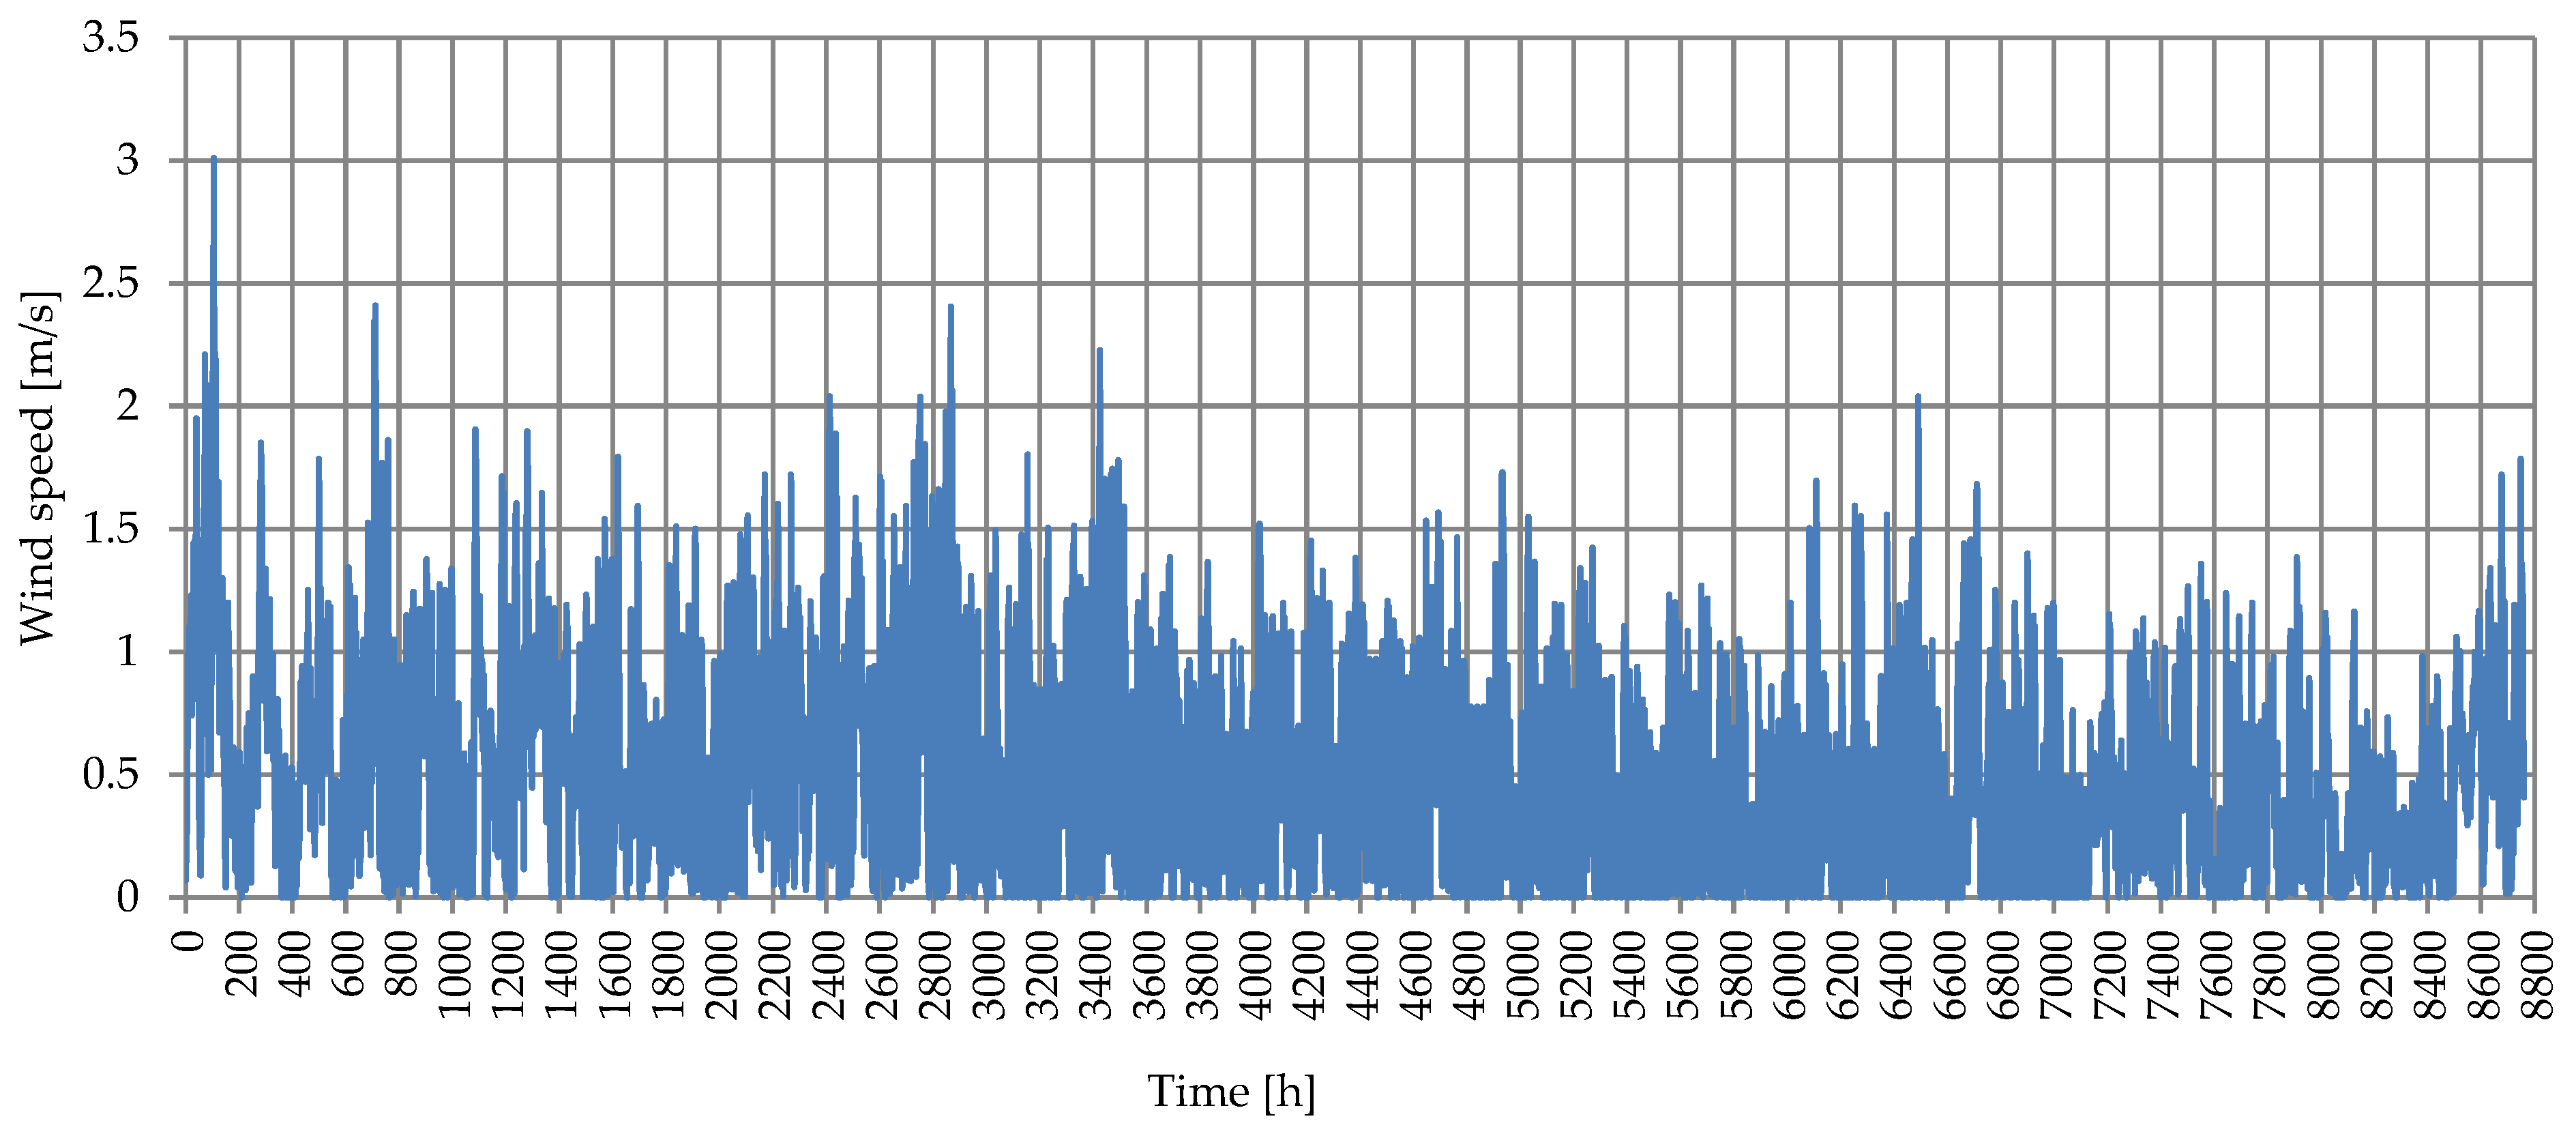
2.3. Measurement of External Climate Parameters
- -
- measurement accuracy: 0.1 °C
- -
- measurement range: −40–85 °C
- -
- resolution: 0.1 °C
- -
- measurement accuracy: 2%
- -
- measurement range: 0–100%
- -
- resolution: 0.1%
- -
- sensitivity: 5–15 μV/(W/m2)
- -
- resistance: 30–100 Ω
- -
- response time: (95%) 18 s
- -
- measurement range: 0–2000 W/m2
- -
- sensitivity: 10 μV/(W/m2)
- -
- resistance: 33–45 Ω
- -
- response time: 28–30 s
- -
- measurement range: 0–2000 W/m2
- -
- shading ring diameter: 570 mm
- -
- range: 0.5–90 m/s
- -
- accuracy: 2%
- -
- resolution: 0.1 m/s
- -
- range: 0–360°
- -
- accuracy: 3%
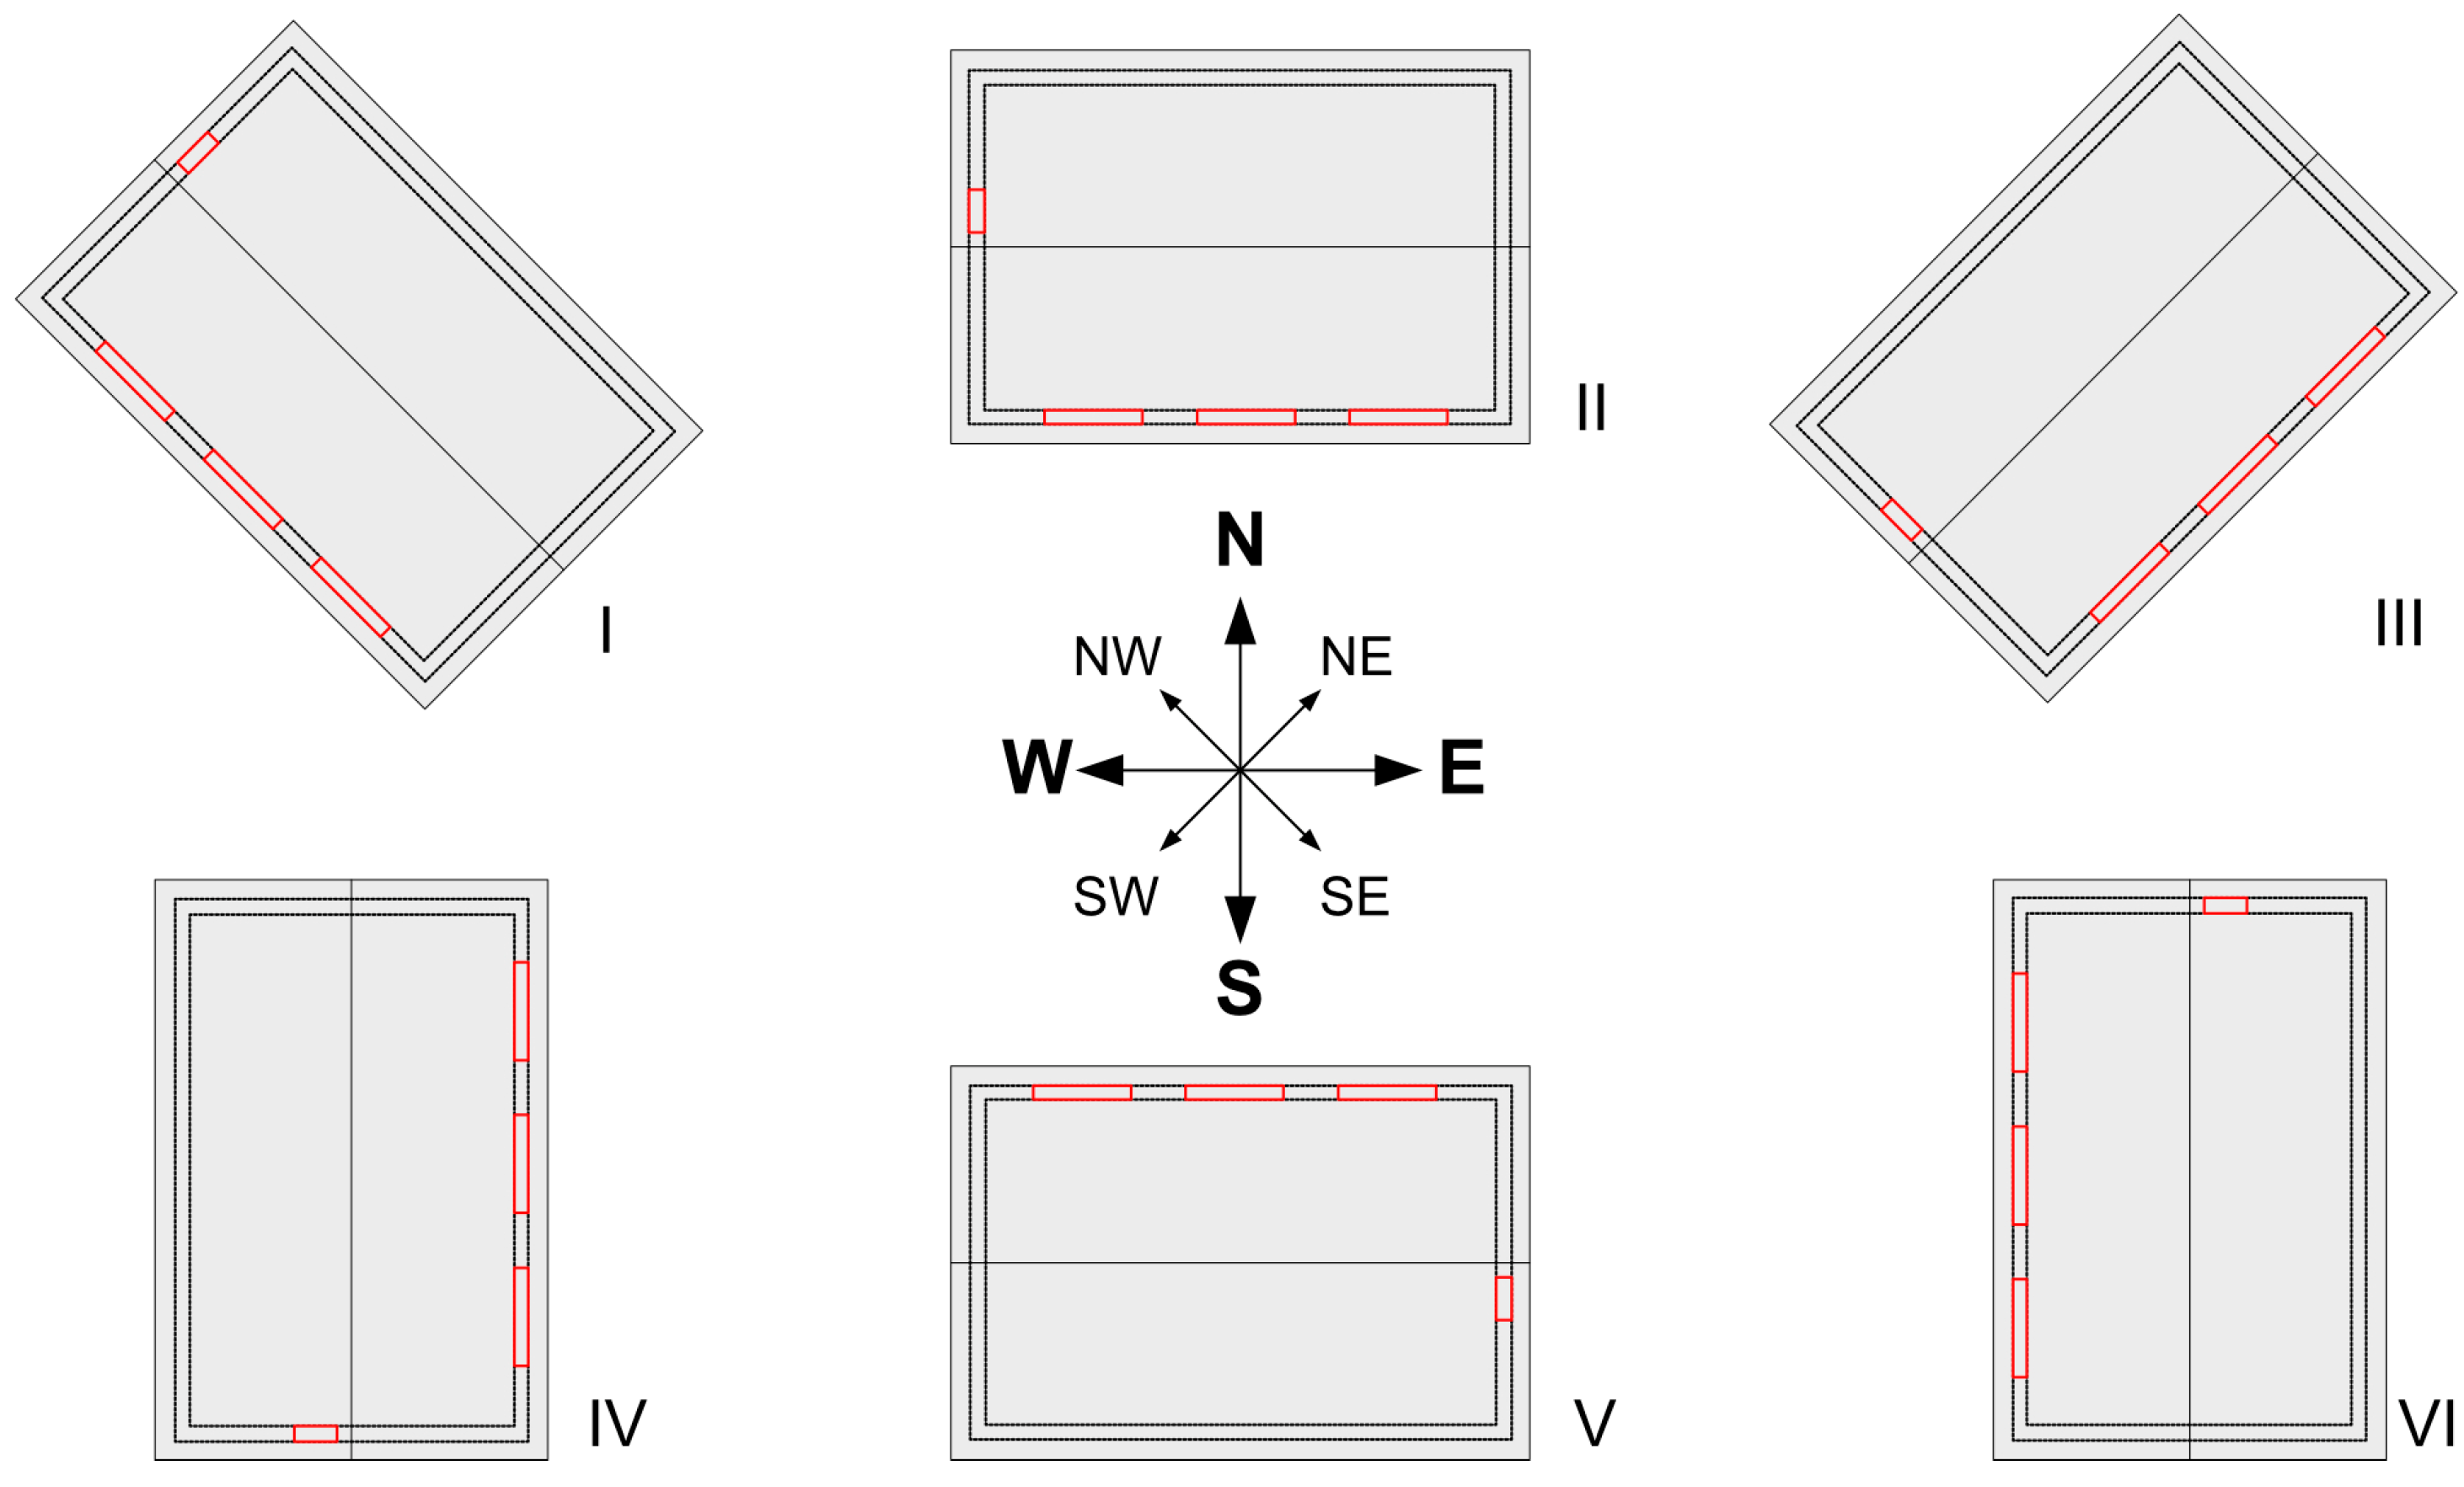
2.4. Simulations
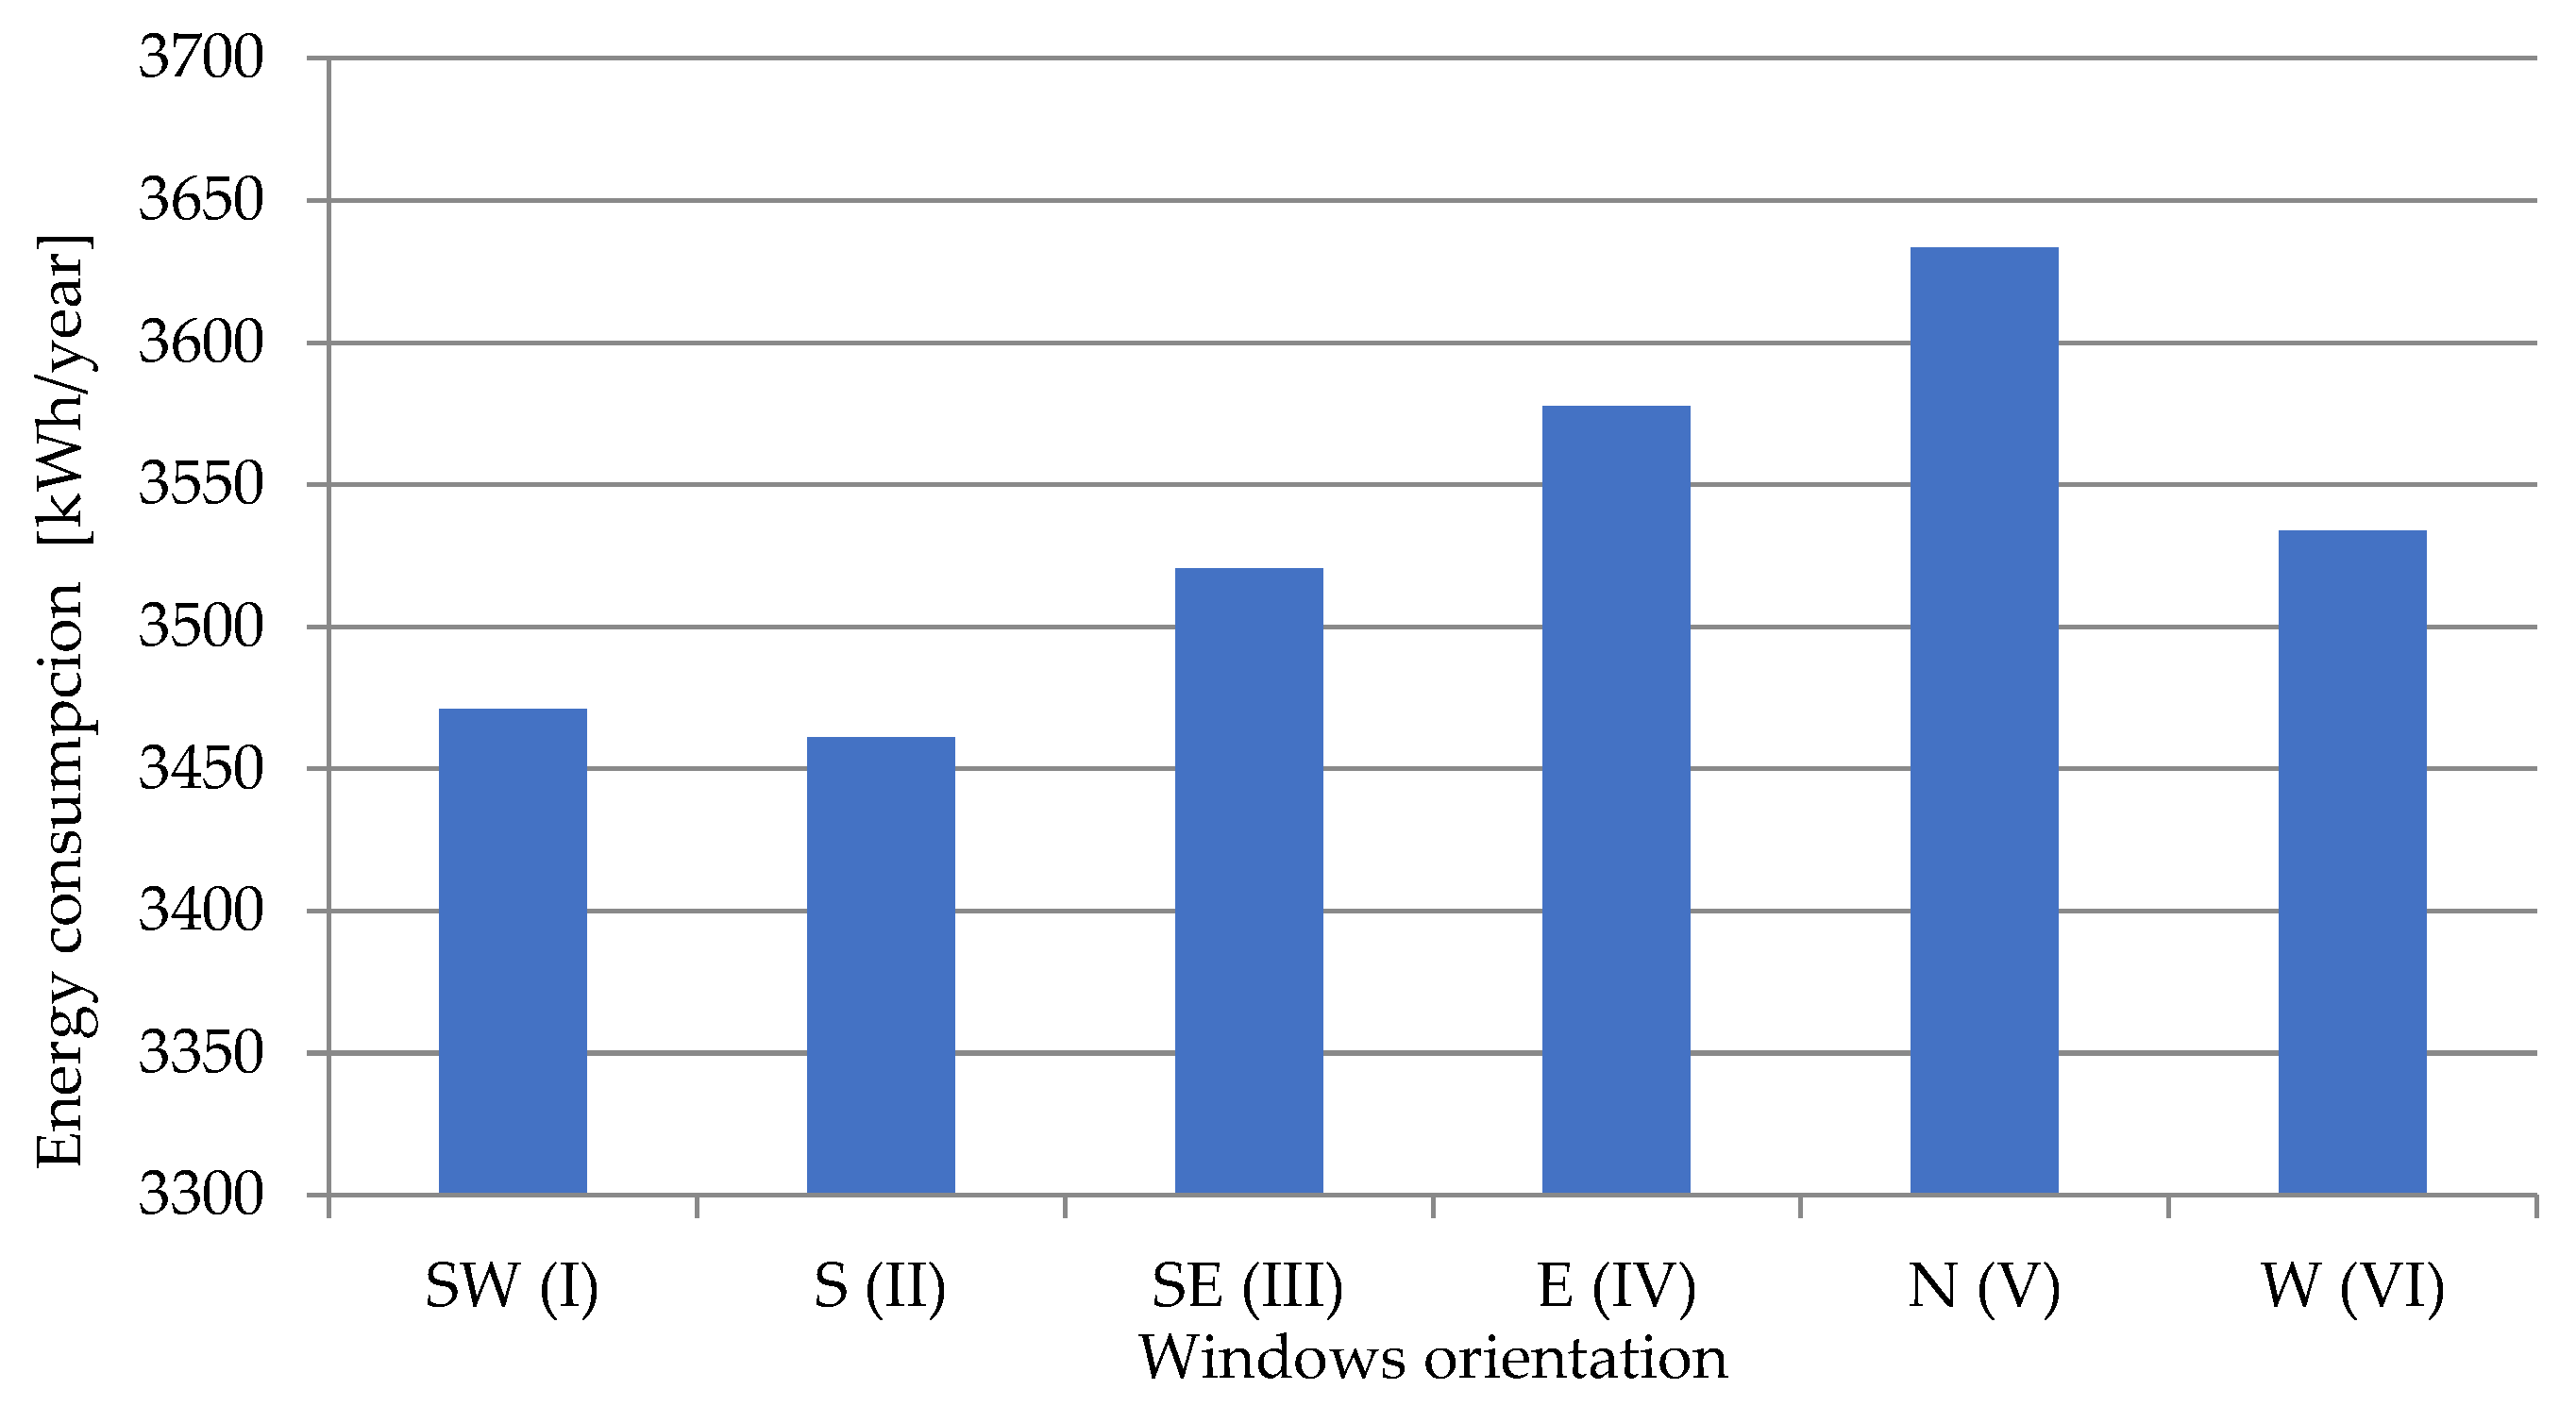
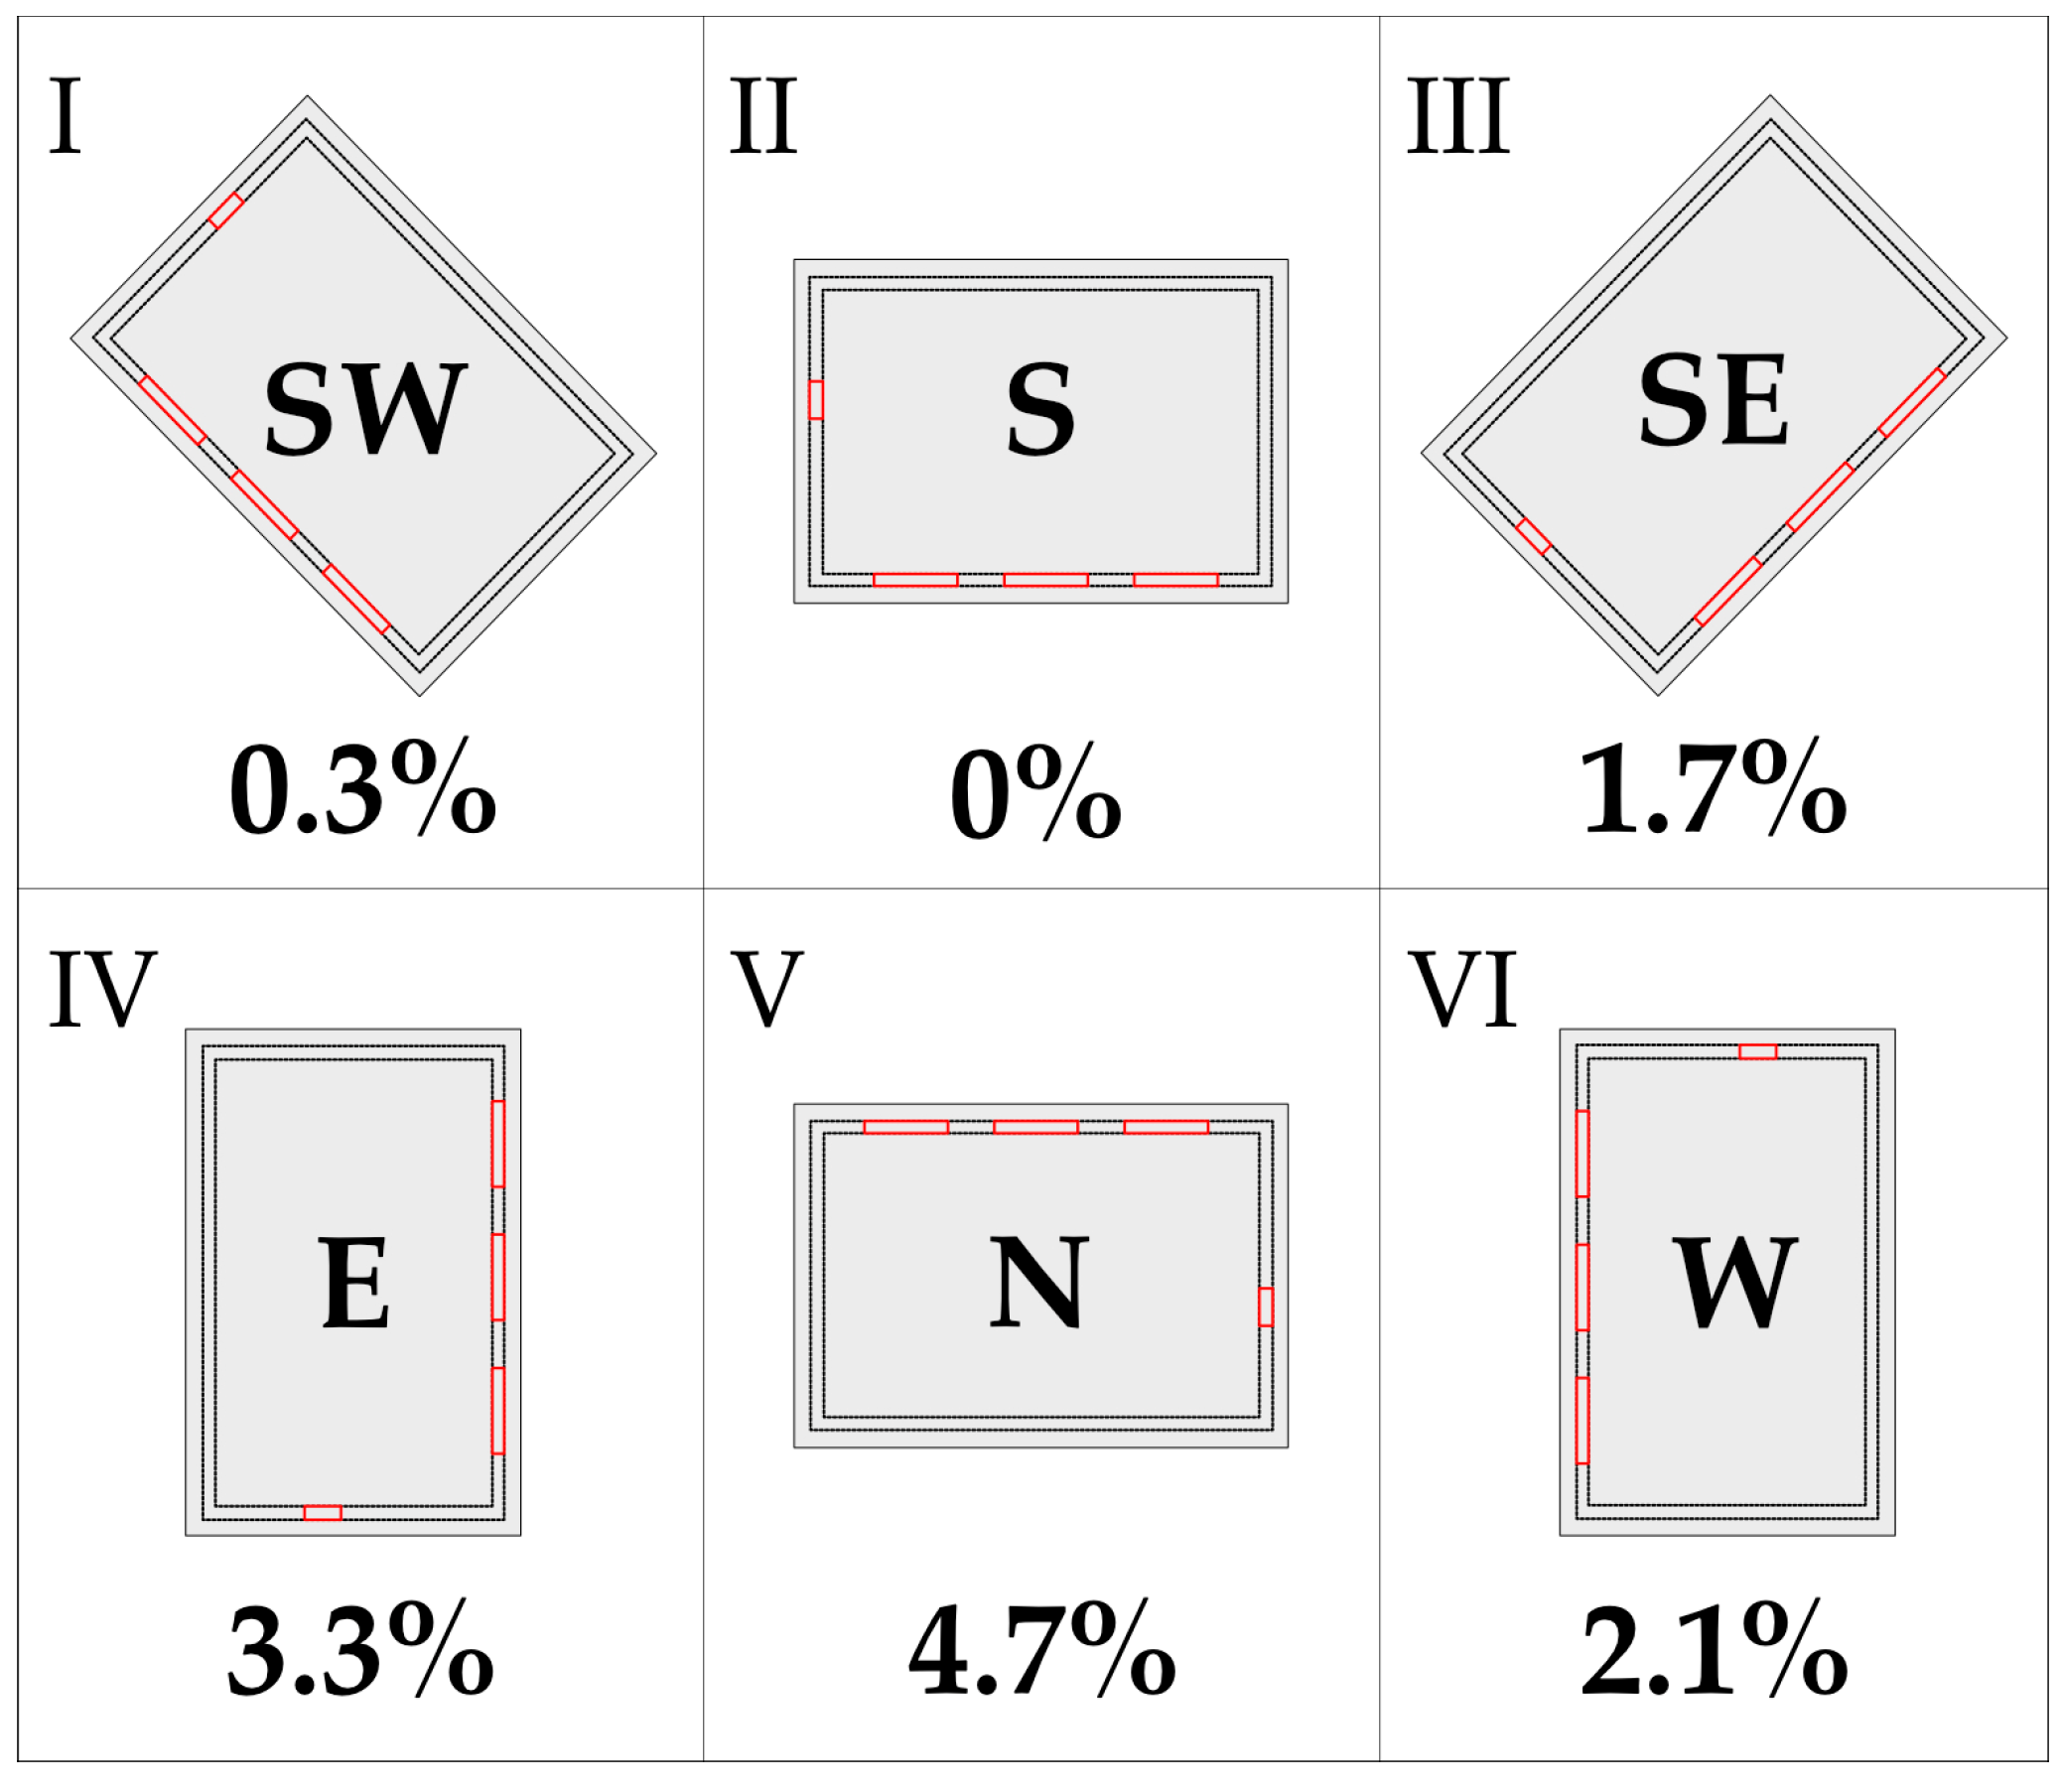
3. Results and Discussion
4. Conclusions
Funding
Data Availability Statement
Acknowledgments
Conflicts of Interest
References
- The European Parliament and the Council of the European Union. Directive (EU) 2023/995 of the European Parliament and of the Council of 13 September 2023 Amending Directive 2010/31/EU on the Energy Performance of Buildings and Directive 2012/27/EU on Energy Efficiency; The European Parliament and the Council of the European Union: Brussels, Belgium, 2023. [Google Scholar]
- Passive House Institute (PHI). Available online: https://passivehouse.com (accessed on 4 March 2024).
- Internationale Passive House Asscotation (IPHA). Available online: https://passivehouse-international.org (accessed on 4 March 2024).
- Lahmar, I.; Cannavale, A.; Martellotta, F.; Zemmouri, N. The Impact of Building Orientation and Window-to-Wall Ratio on the Performance of Electrochromic Glazing in Hot Arid Climates: A Parametric Assessment. Buildings 2022, 12, 724. [Google Scholar] [CrossRef]
- Kabanshi, A.; Choonya, G.; Ameen, A.; Liu, W.; Mulenga, E. Windows of Opportunities: Orientation, Sizing and PV-Shading of the Glazed Area to Reduce Cooling Energy Demand in Sub-Sahara Africa. Energies 2023, 16, 3834. [Google Scholar] [CrossRef]
- Alwetaishi, M.; Benjeddou, O. Impact of Window to Wall Ratio on Energy Loads in Hot Regions: A Study of Building Energy Performance. Energies 2021, 14, 1080. [Google Scholar] [CrossRef]
- Tabatabaei Sameni, S.M.; Gaterell, M.; Montazami, A.; Ahmed, A. Overheating investigation in UK social housing flats built to the Passivhaus standard. Build. Environ. 2015, 92, 222–235. [Google Scholar] [CrossRef]
- Goncalves, V.; Ogunjimi, Y.; Heo, Y. Scrutinizing modeling and analysis methods for evaluating overheating risks in passive houses. Energy Build. 2021, 343, 110701. [Google Scholar] [CrossRef]
- Kim, S.; Zadeh, P.A.; Staub-French, S.; Froese, T.; Cavka, B.T. Assessment of the Impact of Window Size, Position and Orientation on Building Energy Load Using BIM. Procedia Eng. 2016, 145, 1424–1431. [Google Scholar] [CrossRef]
- Vasov, M.; Stevanovic, J.; Bogdanovic, V.; Ignjatovic, M.; Ranđelović, D. Impact of orientation and building envelope characteristics on energy consumption case study of office building in city of Nis. Therm. Sci. 2018, 22, 1499–1509. [Google Scholar] [CrossRef]
- Lapisa, R. The effect of building geometric shape and orientation on its energy performance in various climate regions. Int. J. GEOMATE 2019, 16, 113–119. [Google Scholar] [CrossRef]
- Mokrzecka, M. Influence of building shape and orientation on heating demand: Simulations for student dormitories in temperate climate conditions. E3S Web Conf. 2018, 44, 00117. [Google Scholar] [CrossRef]
- Morrissey, J.; Moore, T.; Horne, R.E. Affordable passive solar design in a temperate climate: An experiment in residential building orientation. Renew. Energy 2011, 36, 568–577. [Google Scholar] [CrossRef]
- WUFI-Wärme Und Feuchte Instationär. Available online: https://wufi.de/en (accessed on 9 March 2024).
- Nawalany, G.; Sokołowski, P.; Michalik, M. Experimental Study of Thermal and Humidity Conditions in a Historic Wooden Building in Southern Poland. Buildings 2020, 10, 118. [Google Scholar] [CrossRef]
- Sokołowski, P.; Nawalany, G. Analysis of Energy Exchange with the Ground in a Two-Chamber Vegetable Cold Store, Assuming Different Lengths of Technological Break, with the Use of a Numerical Calculation Method—A Case Study. Energies 2020, 13, 4970. [Google Scholar] [CrossRef]
- Nawalany, G.; Sokołowski, P.; Lendelová, J.; Žitňák, M.; Jakubowski, T.; Atilgan, A. Numerical Analysis of the Heat Exchange Model with the Ground on the Example of a Complex of Industrial Halls. Energy Build. 2023, 300, 113689. [Google Scholar] [CrossRef]
- Sadłowska-Sałęga, A.; Radoń, J. Feasibility and limitation of calculative determination of hygrothermal conditions in historical buildings: Case study of st. Martin church in Wiśniowa. Build. Environ. 2020, 186, 107361. [Google Scholar] [CrossRef]
- Radoń, J.; Wąs, K.; Flaga-Maryanczyk, A.; Schnotale, J. Experimental and theoretical study on hygrothermal long-term performance of outer assemblies in lightweight passive house. J. Build. Phys. 2018, 41, 299–320. [Google Scholar] [CrossRef]
- Wąs, K.; Radoń, J.; Sadłowska-Sałęga, A. Thermal Comfort—Case Study in a Lightweight Passive House. Energies 2022, 15, 4687. [Google Scholar] [CrossRef]
- Wąs, K.; Radoń, J.; Sadłowska-Sałęga, A. Maintenance of Passive House Standard in the Light of Long-Term Study on Energy Use in a Prefabricated Lightweight Passive House in Central Europe. Energies 2020, 13, 2801. [Google Scholar] [CrossRef]


Disclaimer/Publisher’s Note: The statements, opinions and data contained in all publications are solely those of the individual author(s) and contributor(s) and not of MDPI and/or the editor(s). MDPI and/or the editor(s) disclaim responsibility for any injury to people or property resulting from any ideas, methods, instructions or products referred to in the content. |
© 2024 by the author. Licensee MDPI, Basel, Switzerland. This article is an open access article distributed under the terms and conditions of the Creative Commons Attribution (CC BY) license (https://creativecommons.org/licenses/by/4.0/).
Share and Cite
Wąs, K. The Impact of the Location of a Passive Frame House on Its Energy Demand for the Purpose of Heating—A Case Study. Energies 2024, 17, 2944. https://doi.org/10.3390/en17122944
Wąs K. The Impact of the Location of a Passive Frame House on Its Energy Demand for the Purpose of Heating—A Case Study. Energies. 2024; 17(12):2944. https://doi.org/10.3390/en17122944
Chicago/Turabian StyleWąs, Krzysztof. 2024. "The Impact of the Location of a Passive Frame House on Its Energy Demand for the Purpose of Heating—A Case Study" Energies 17, no. 12: 2944. https://doi.org/10.3390/en17122944