Comparison between Direct and Indirect Heat Flux Measurement Techniques: Preliminary Laboratory Tests
Abstract
:1. Introduction
2. Aim and Scope
3. Experimental Apparatus
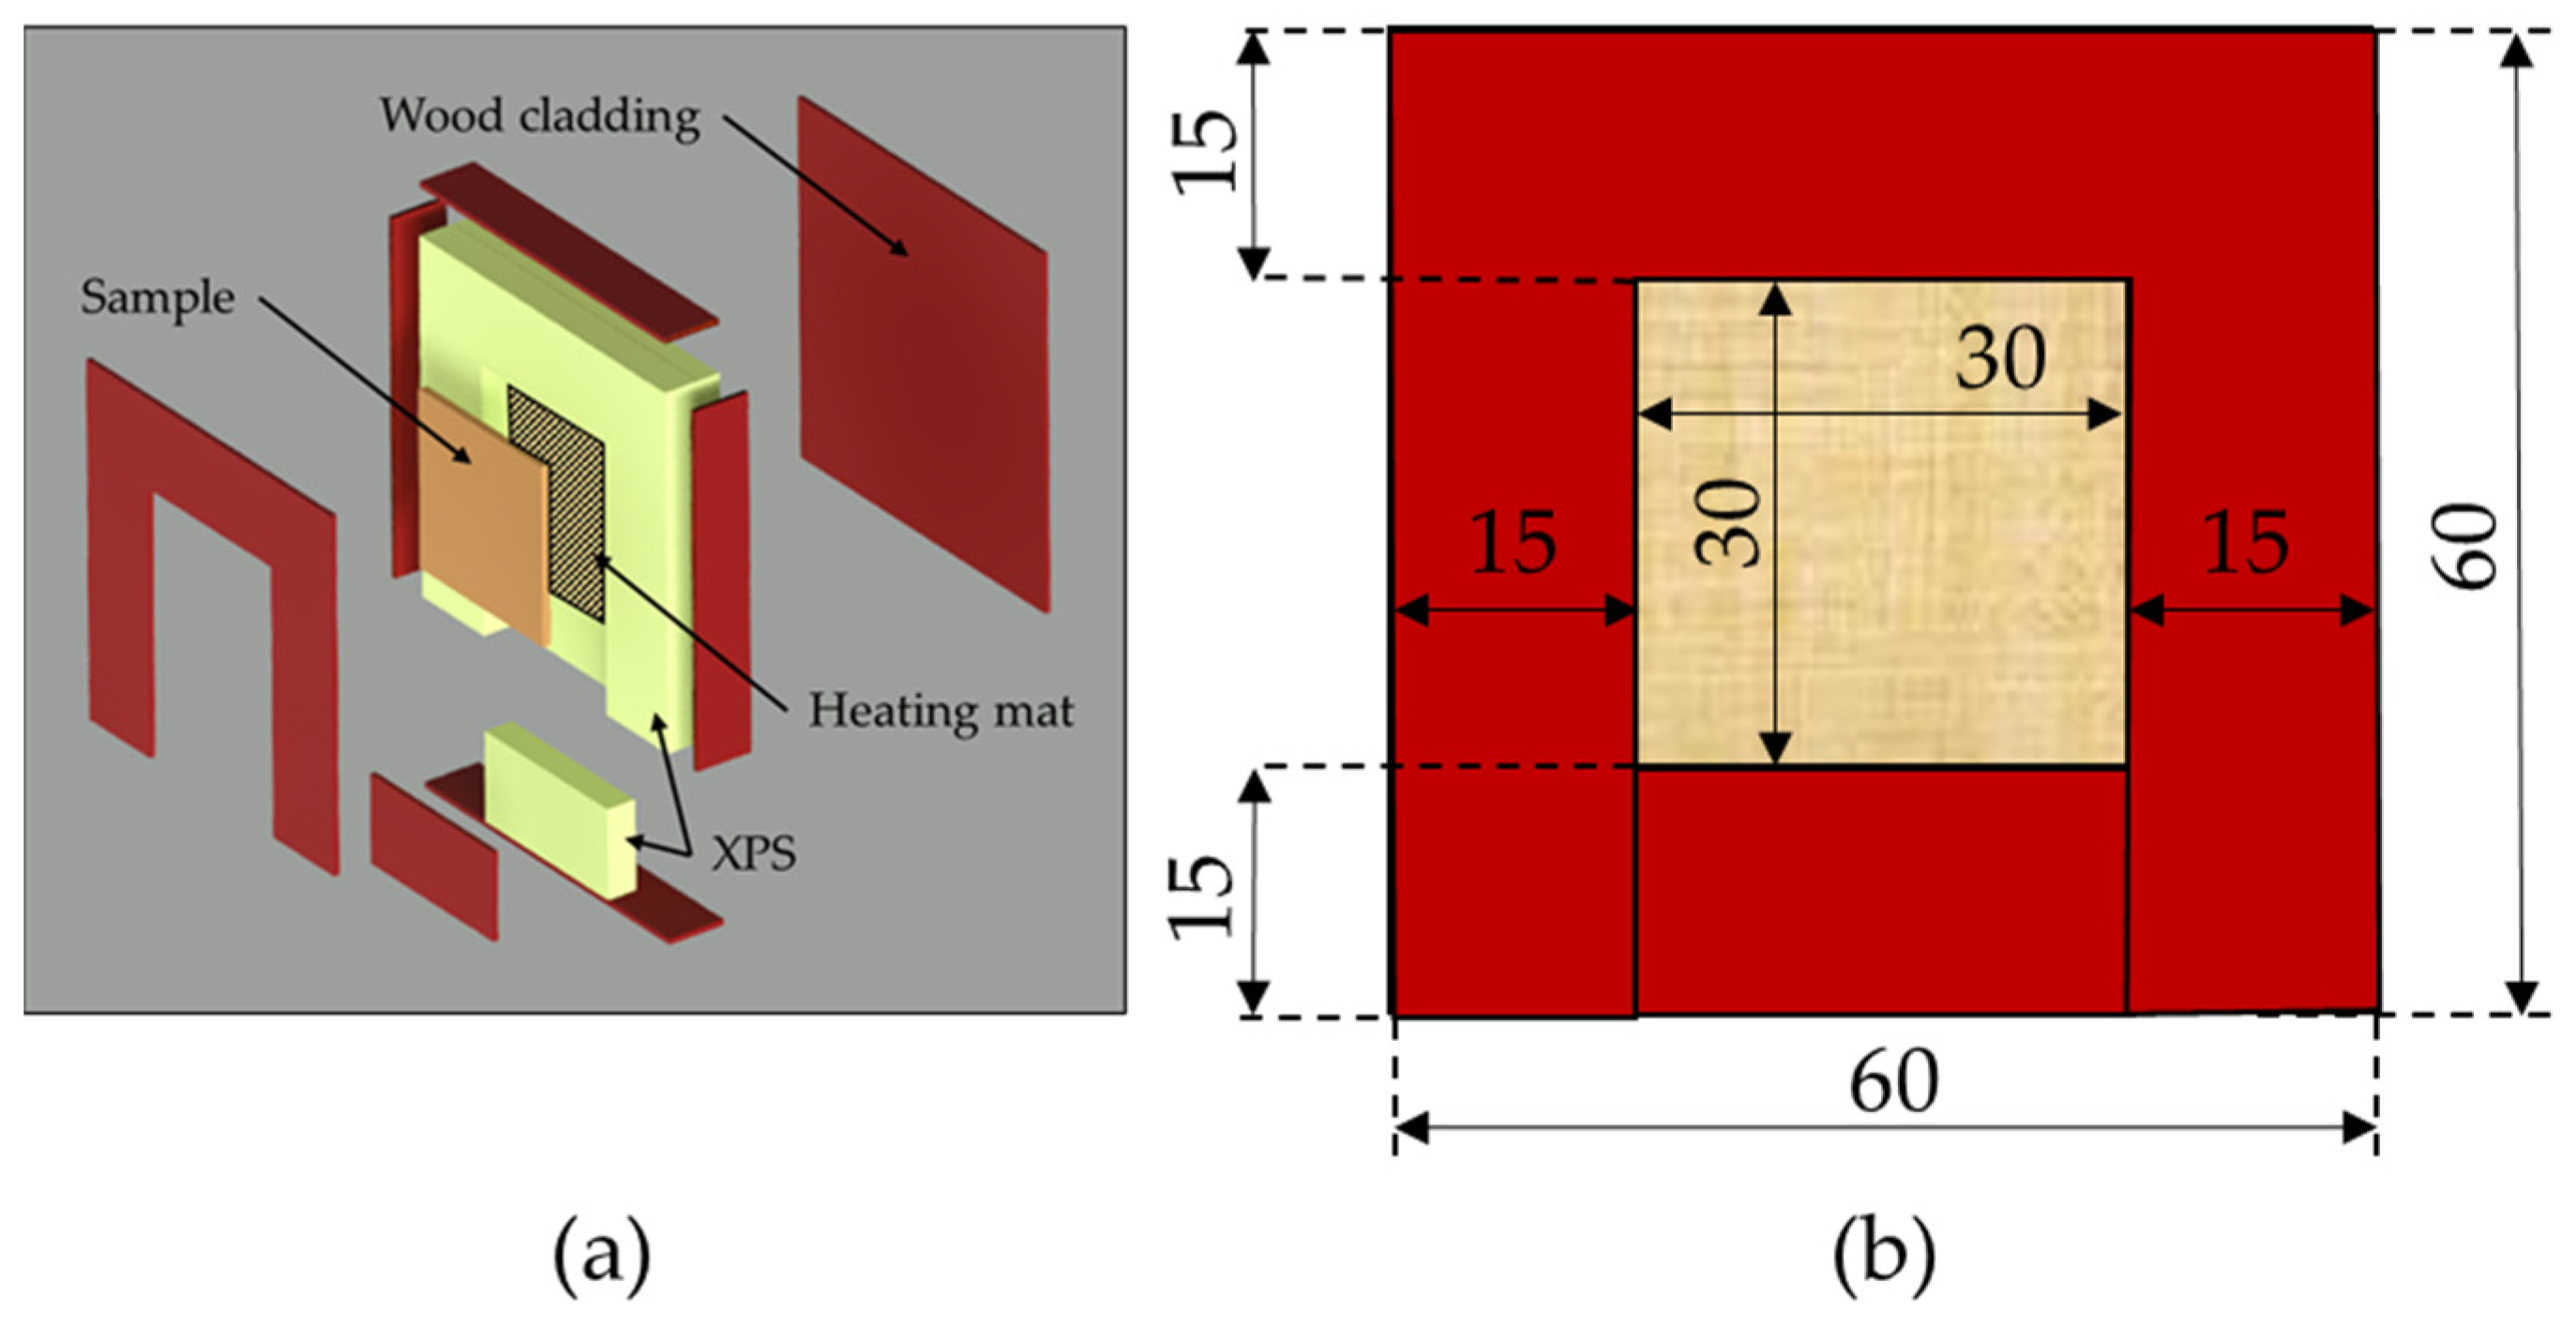
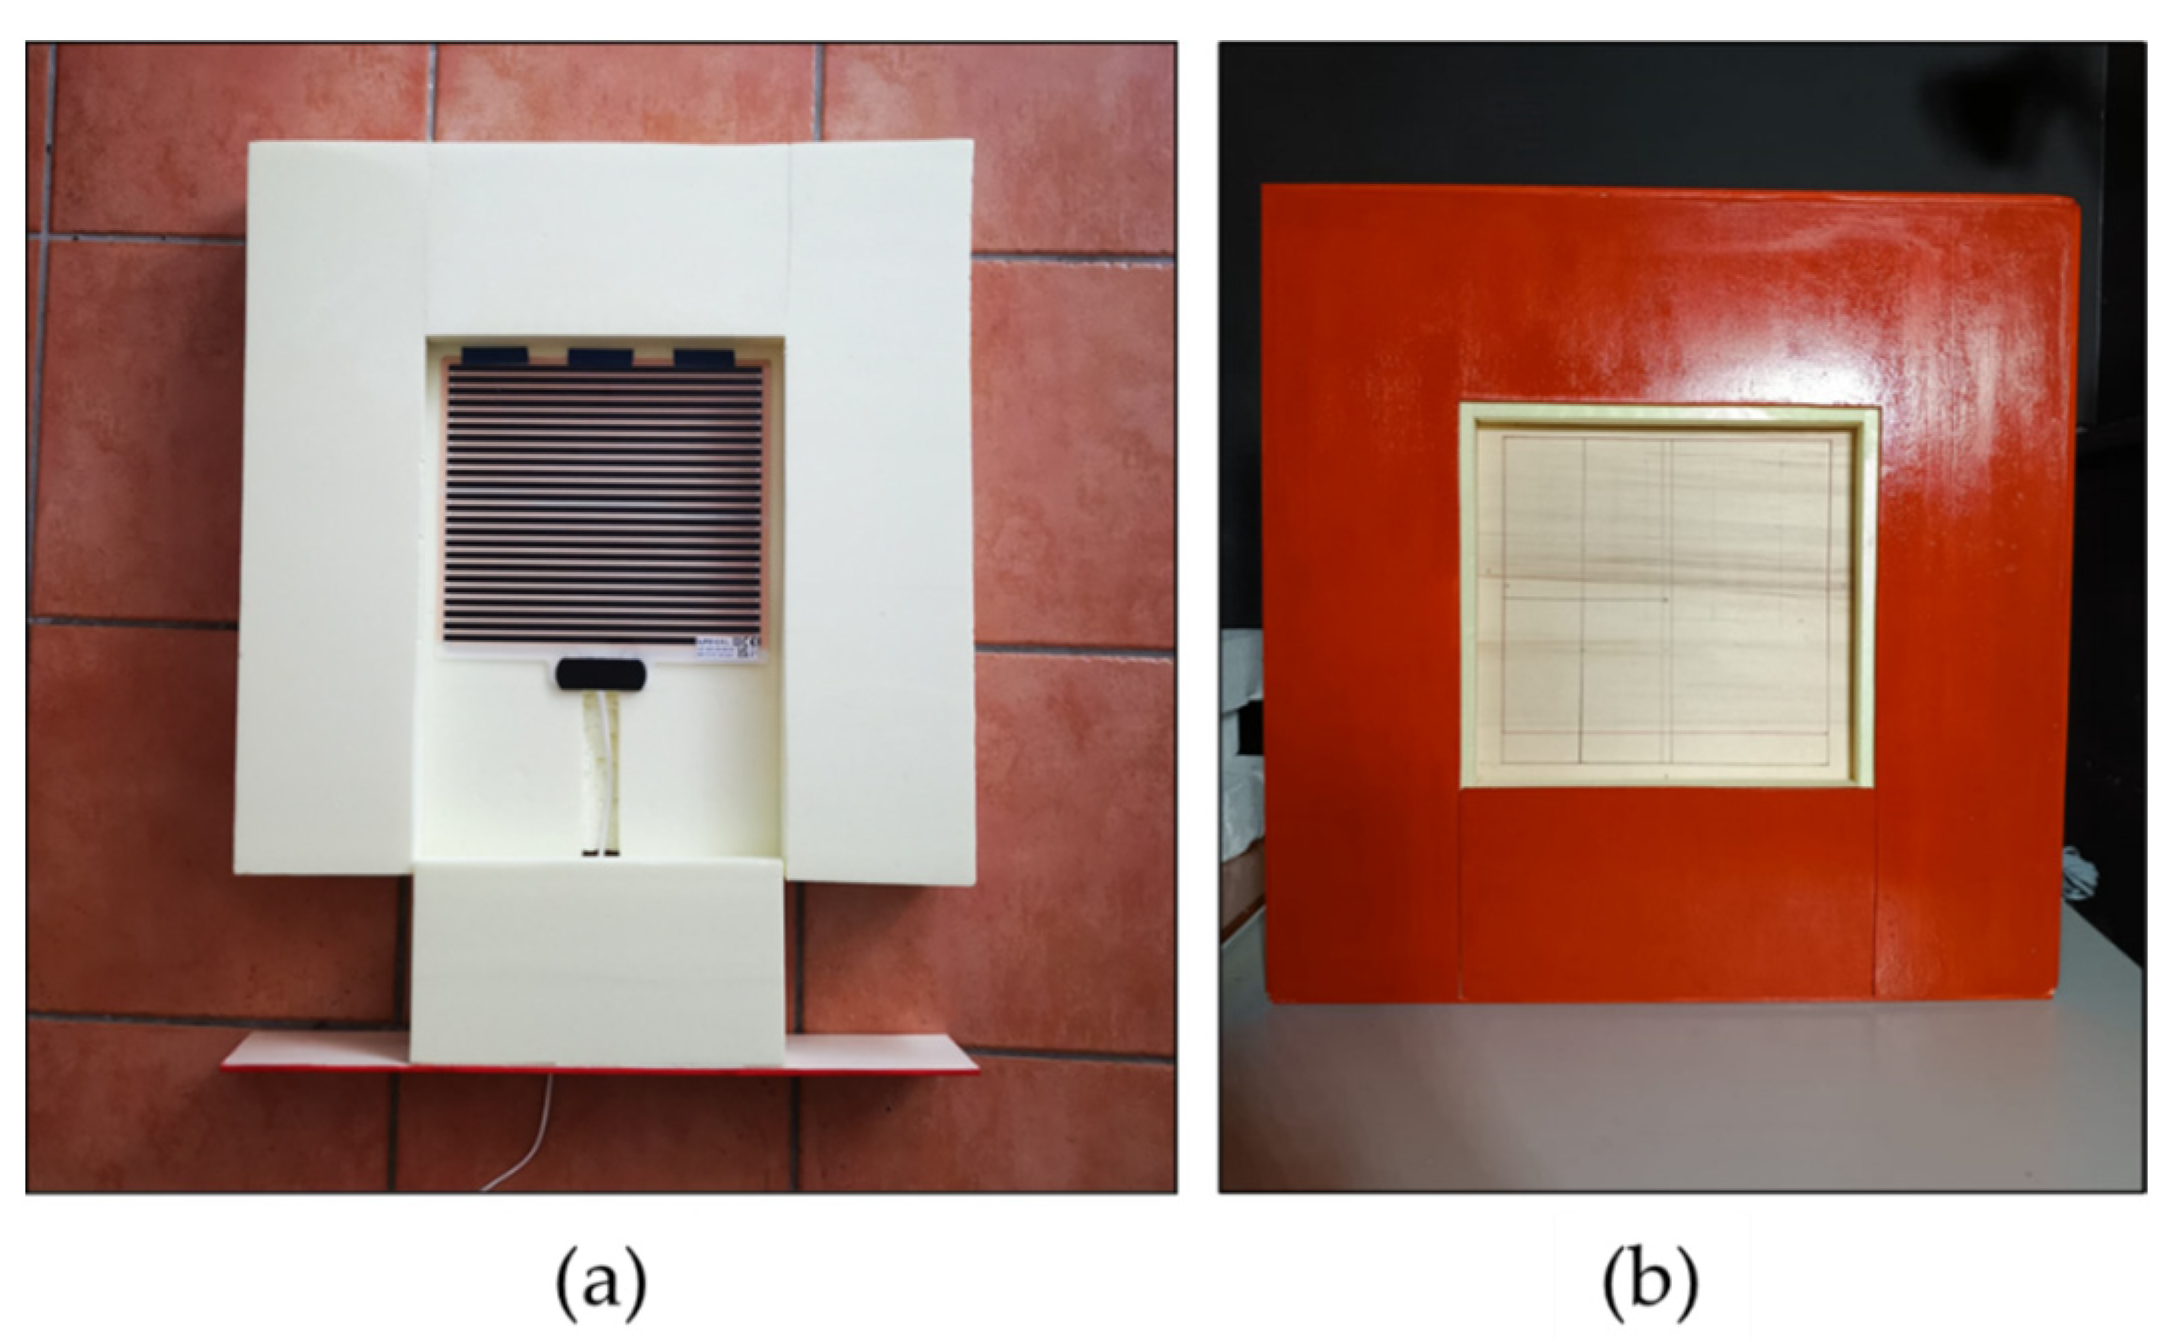
3.1. Insulating System Construction
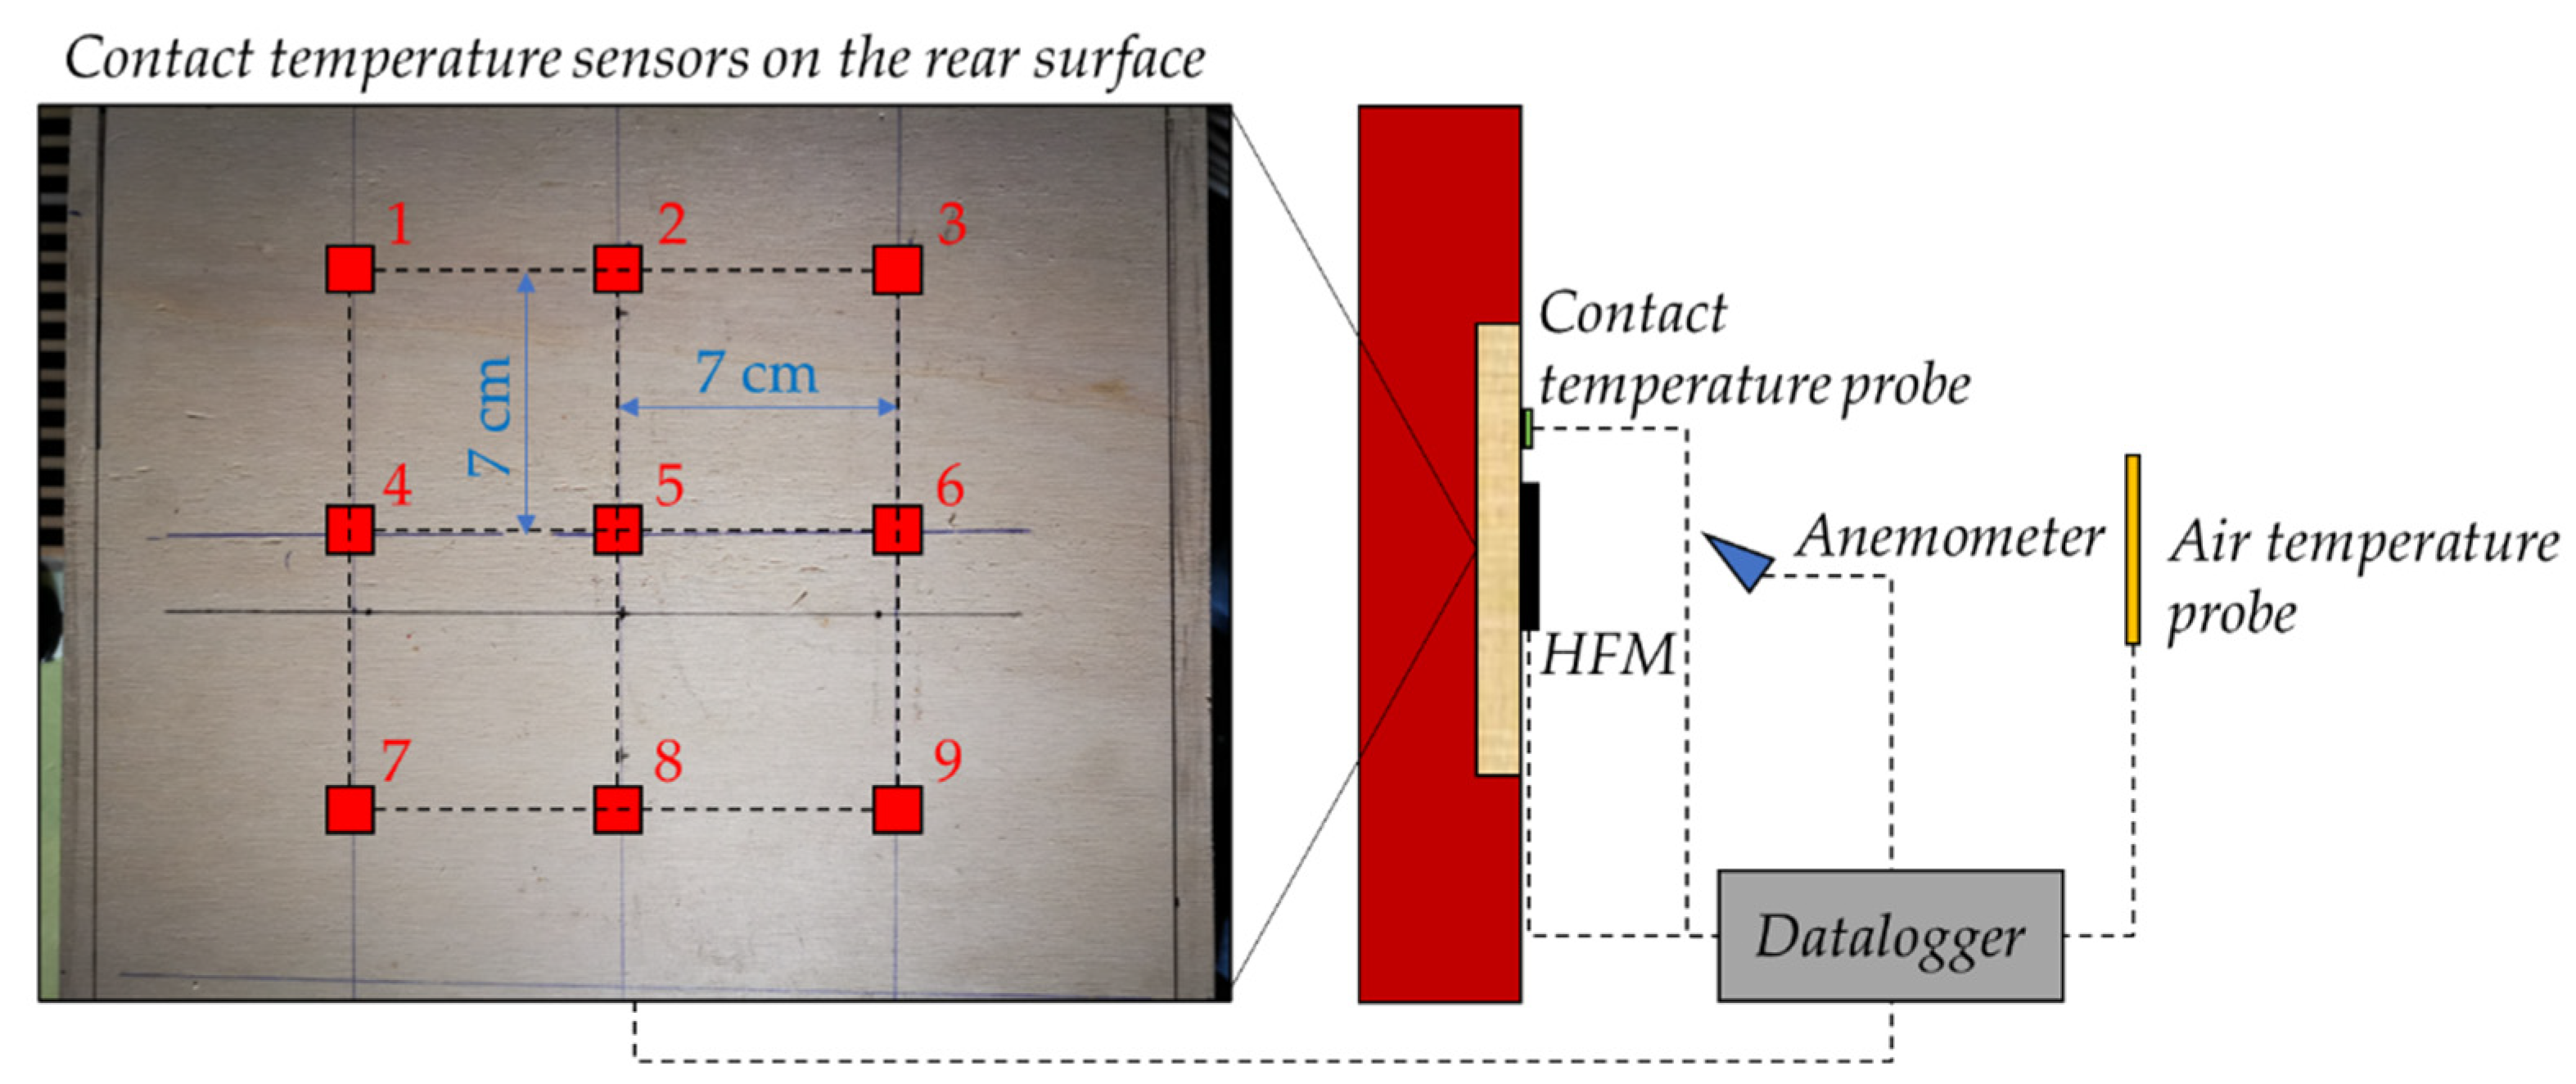
3.2. Experimental Setup
4. Methodology
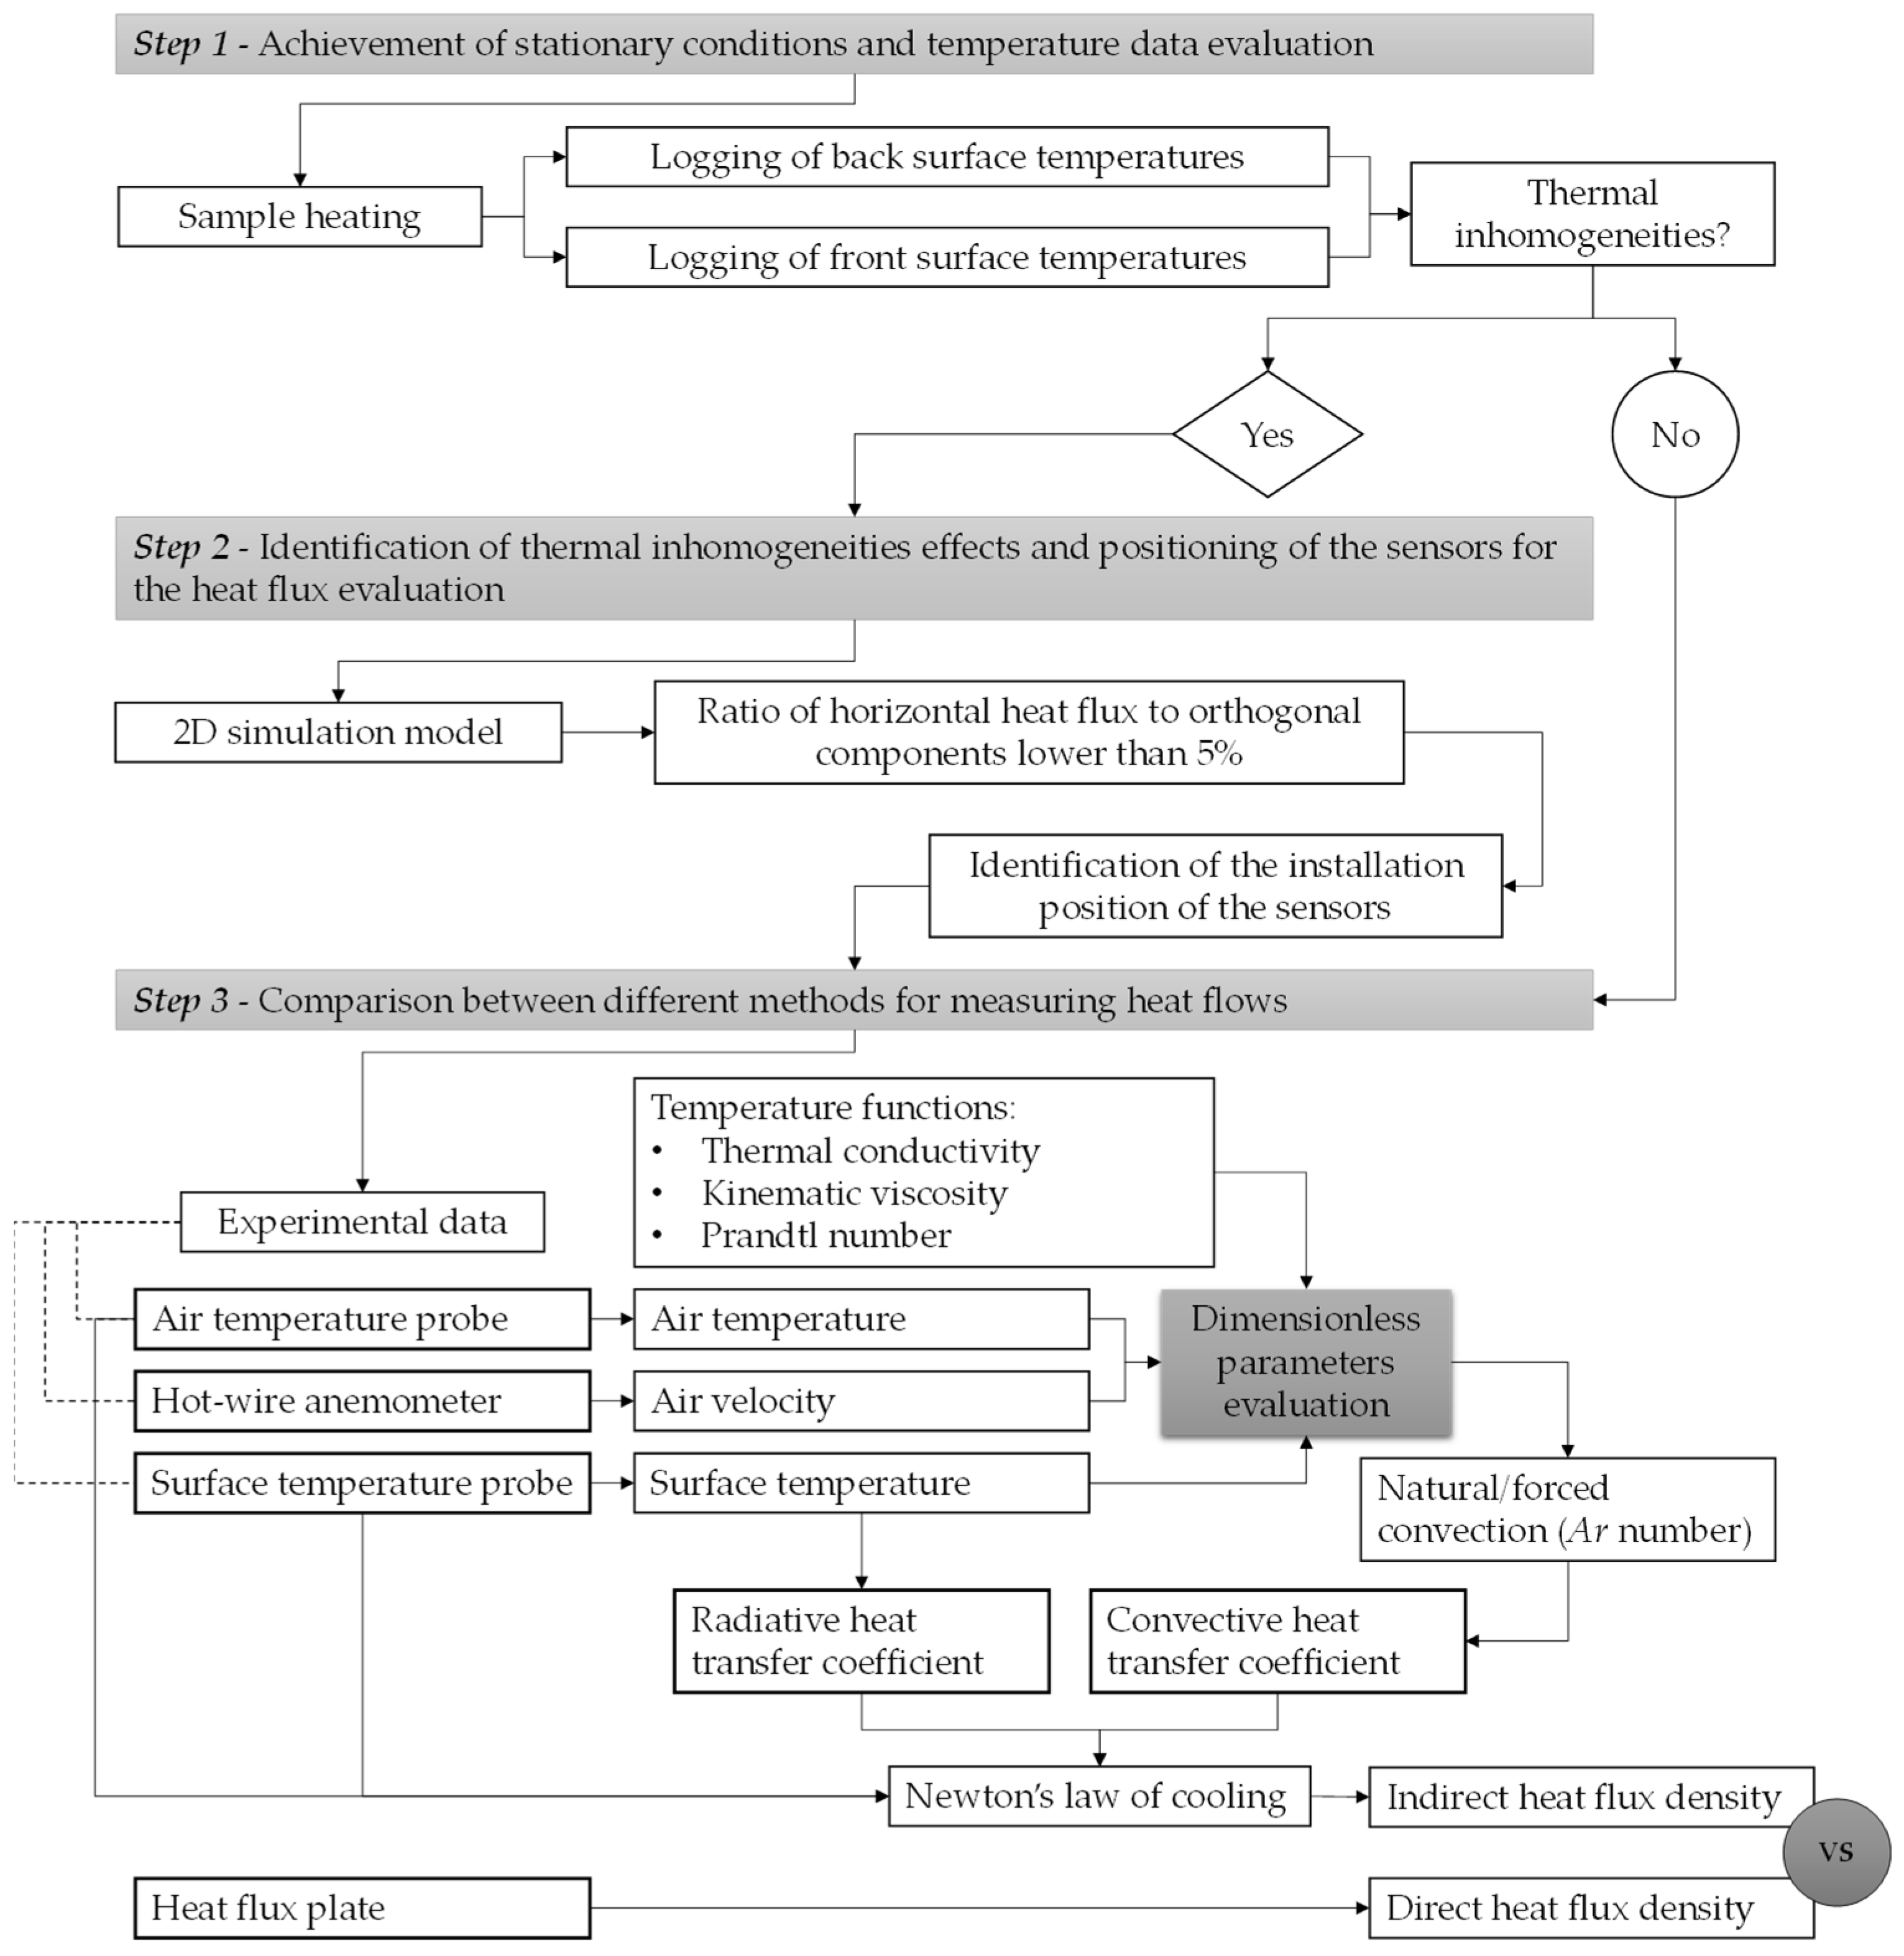
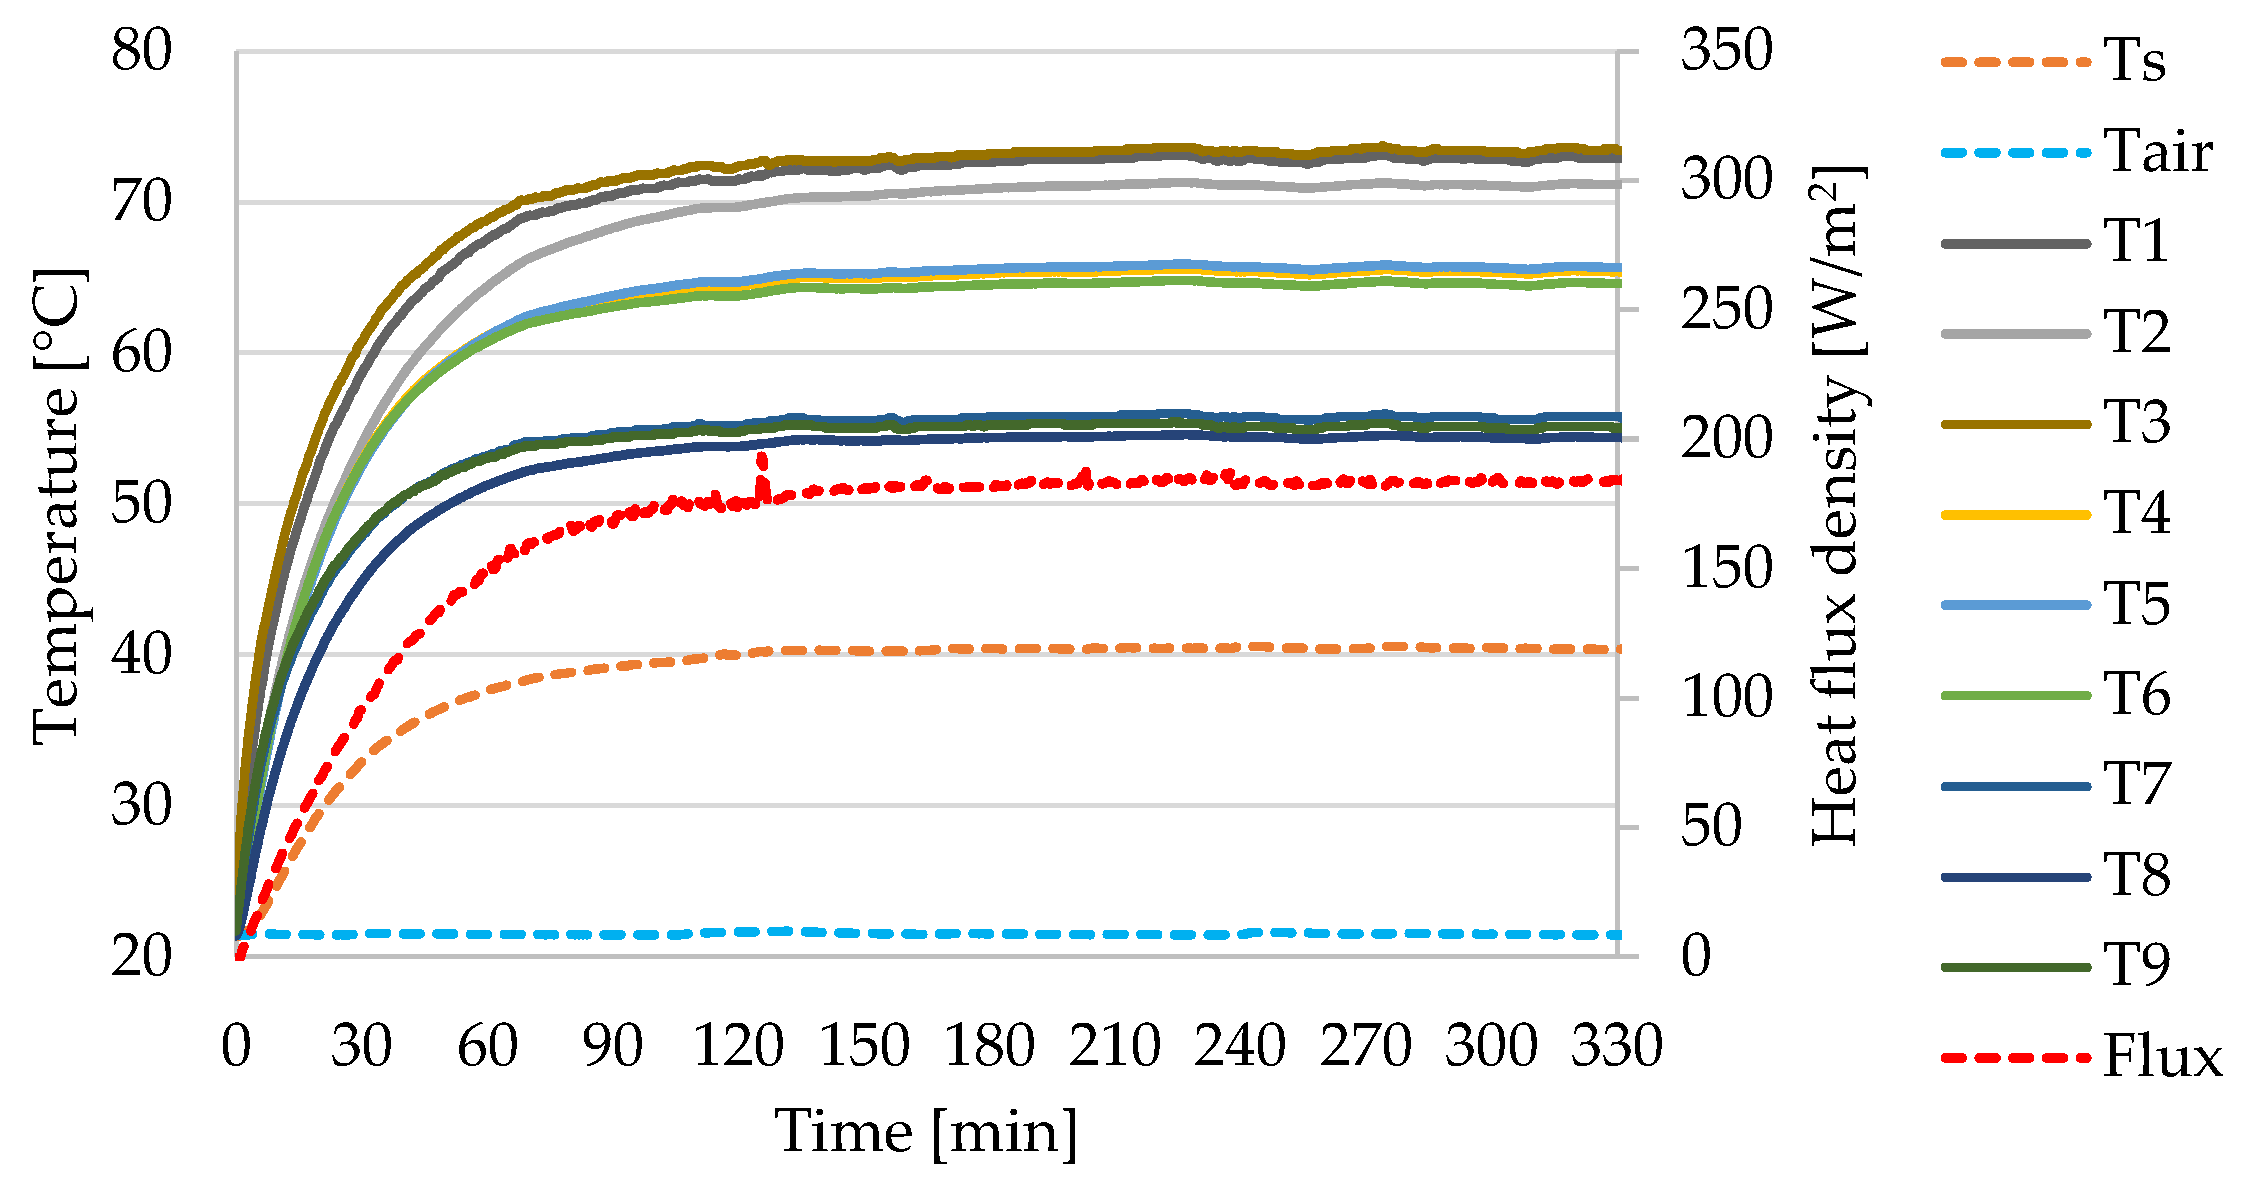
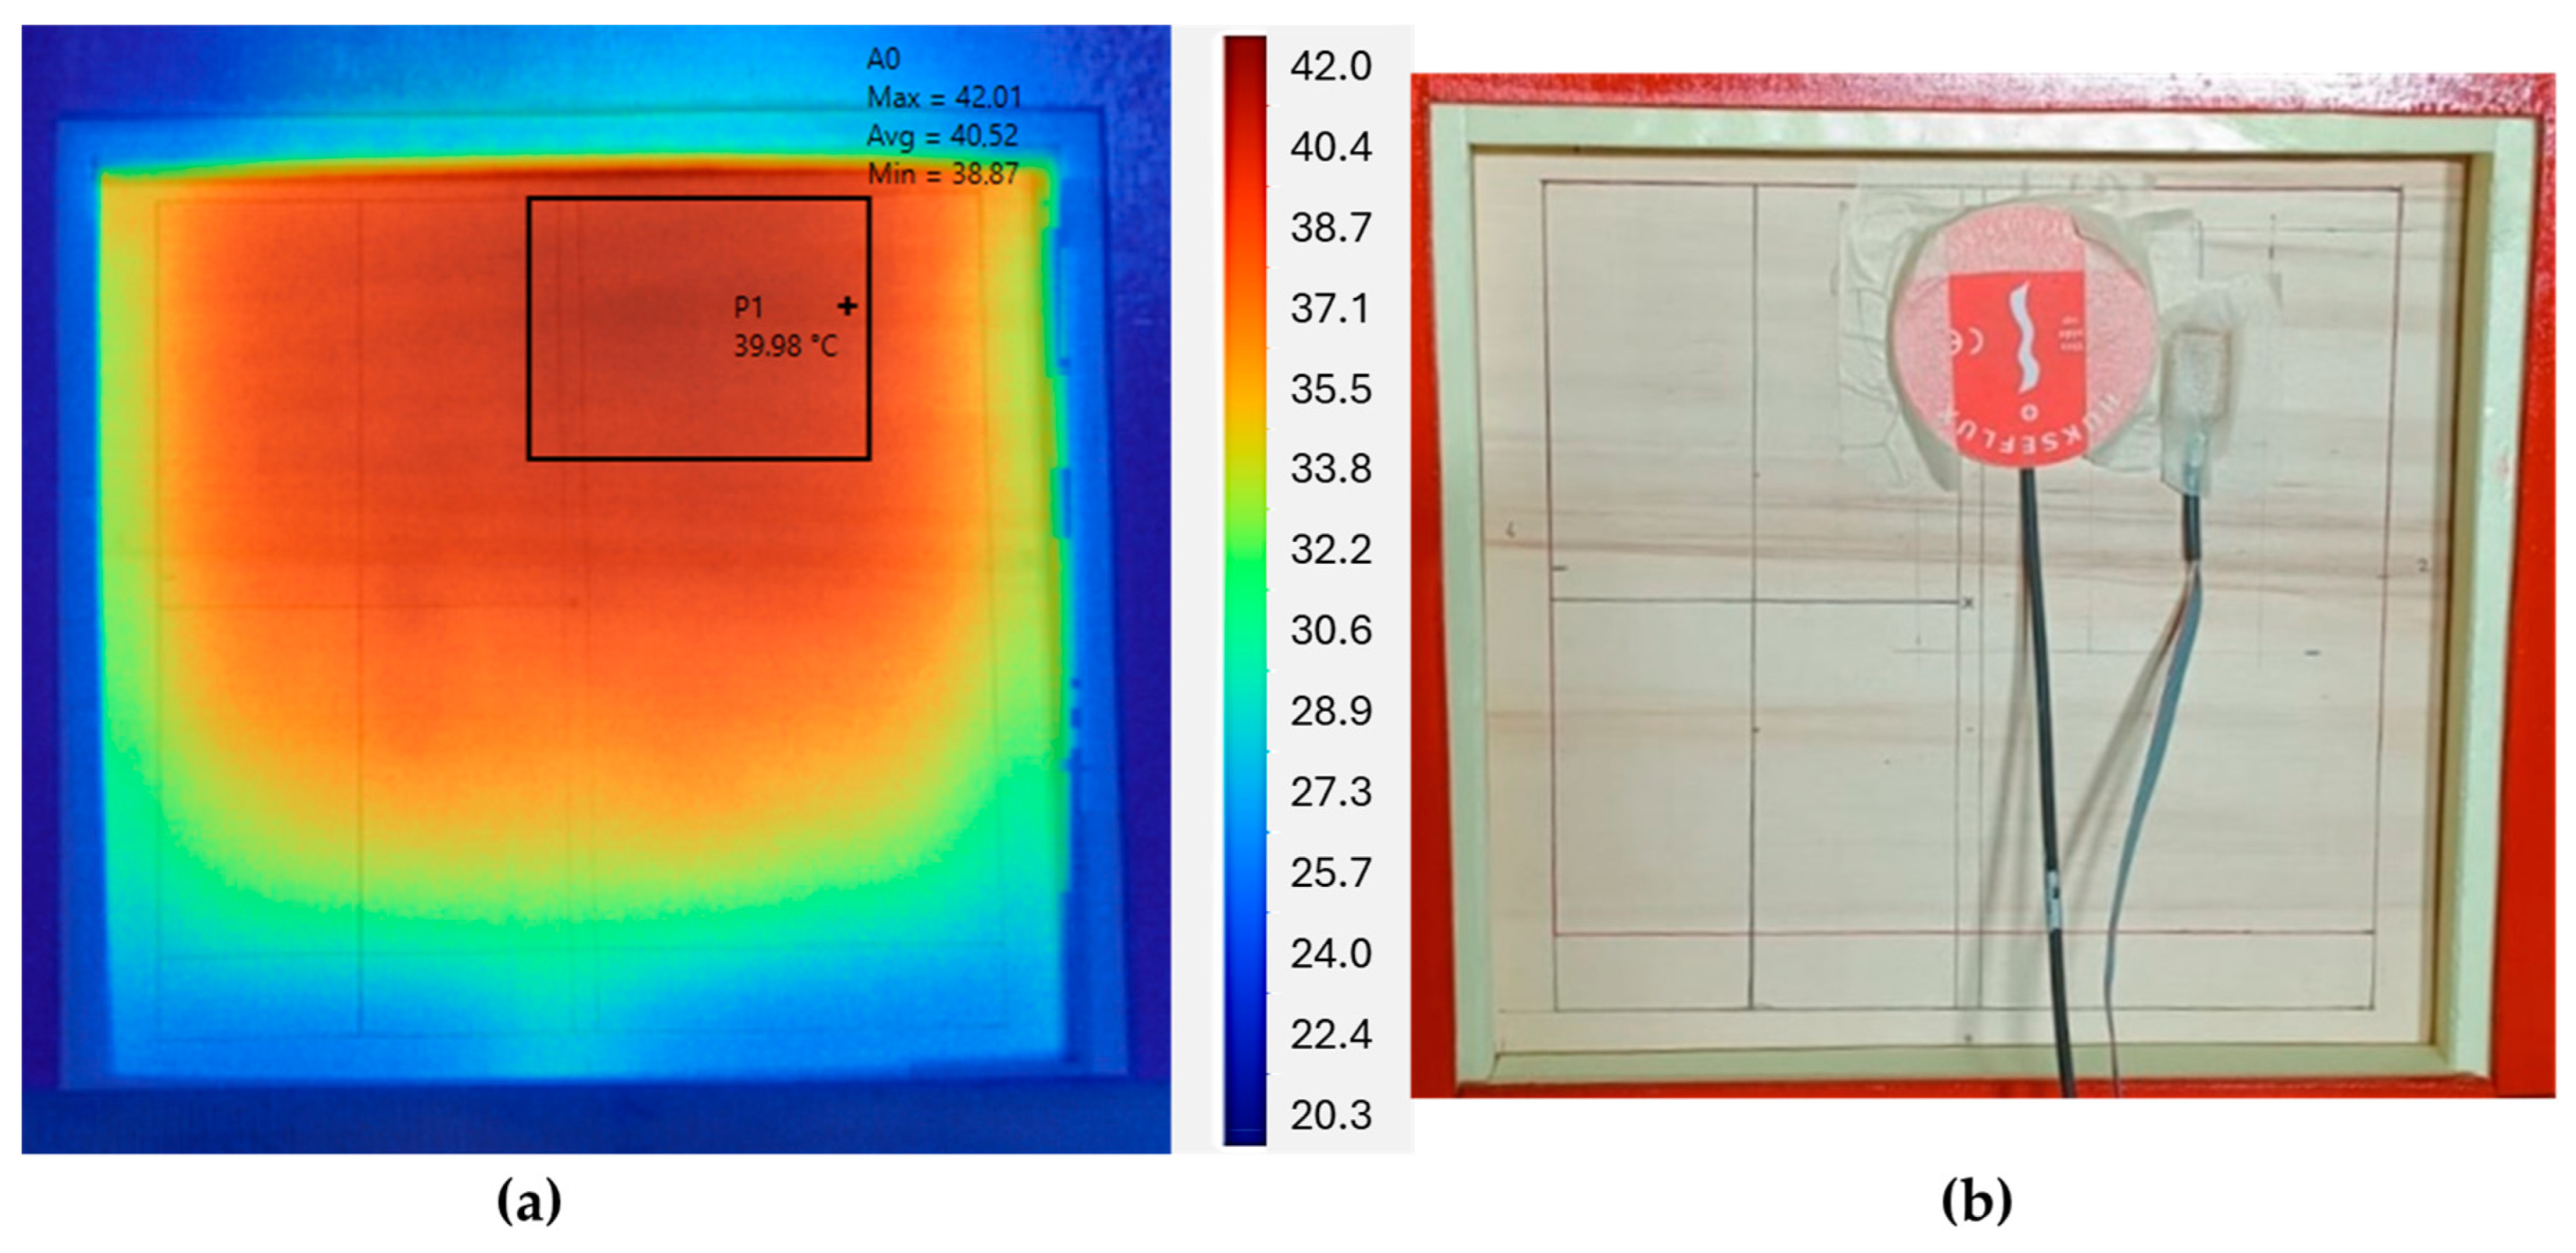
- Achievement of stationary conditions and temperature data evaluation: During this step, the sample was heated through the heating mat until steady-state conditions were reached. During the heating phase, the surface temperature probes, mounted on the rear part of the sample, recorded data while the thermal imaging camera, placed in front of the apparatus, monitored the free surface. To correctly measure the surface temperatures by means of infrared thermography, the so-called reflected temperature and the emissivity (ε) of the sample need to be quantified. Therefore, the reflector-based approach was employed, and the reflected temperature was evaluated by constructing a reflector with a crumpled and then flattened aluminum sheet applied to a piece of cardboard. The diffuse reflector was positioned on the free surface of the sample and its temperature was measured by setting ε = 1 in the camera, obtaining a reflected temperature of 21.60 °C. Subsequent comparisons between the surface temperature values, acquired via a contact temperature sensor, and the infrared camera outcomes enabled the determination of the sample’s emissivity (ε). Starting from an emissivity equal to 1, the ε in the thermal imaging camera was gradually lowered until the temperature measured through the contact sensor had become the same as that measured by the infrared camera. An emissivity of 0.84 was thus obtained.
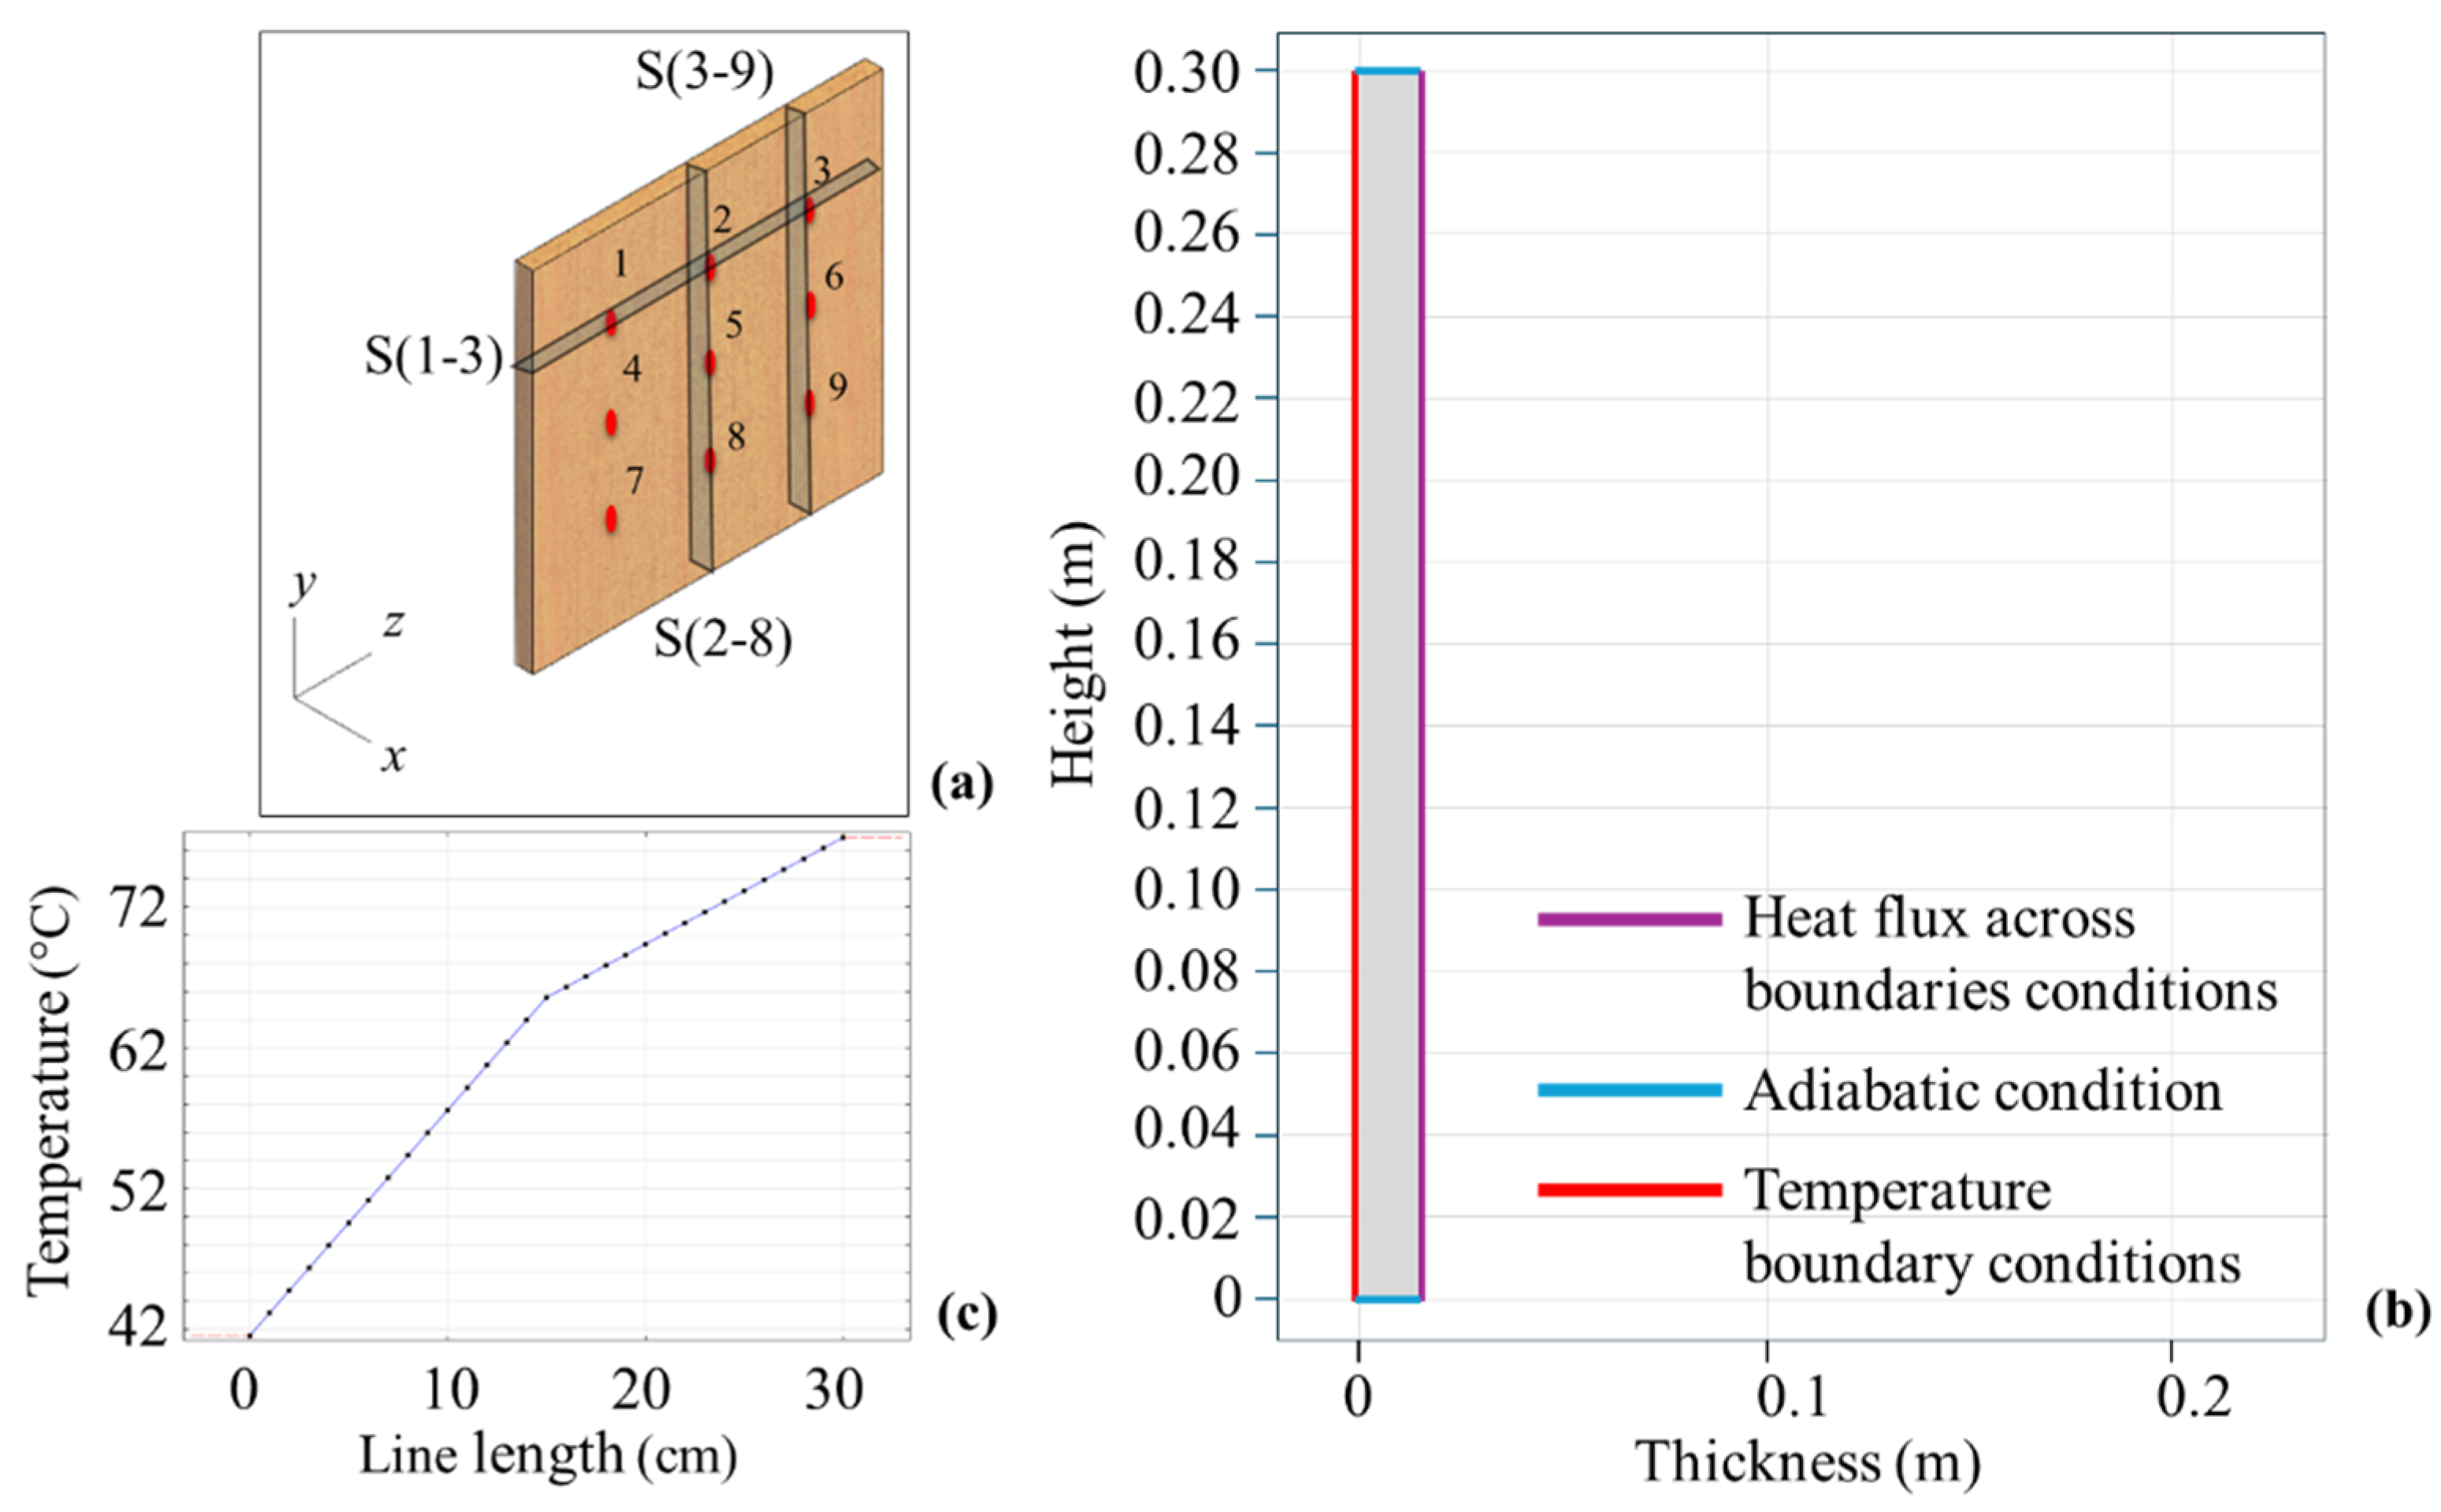
- Identification of thermal inhomogeneities effects and positioning of the sensors for the heat flux evaluation: The effects of thermal non-uniformities must be assessed in relation to the deviation of the heat flux from one-dimensional conditions. This condition can affect the results, and the magnitude of the possible heat flux distortions can be analyzed by creating a bidimensional simulation model. Here, Comsol Multiphysics was used, and different 2D models of the sample were created, considering the back surface temperature sensors, due to the experimented thermal inhomogeneities. The thermal image obtained through the infrared camera was processed to evaluate the temperature distribution on the sample, thus identifying the hottest part and the zones characterized by reduced thermal inhomogeneity. The experimental investigation revealed specific areas of the wooden sample with higher temperatures than others. Consequently, the sections shown in Figure 4a were modeled, where S(1–3) identifies the section associated with the sensors 1, 2 and 3, S(2–8) identifies the section associated with the sensors 2, 5 and 8, and finally, S(3–9) identifies the section associated with the sensors 3, 6 and 9. Figure 4b shows the thermal boundary conditions set in the models in terms of the heat flux, temperatures and adiabatic conditions. The temperature differences among the 9 points and their spatial distribution allowed us to calculate a temperature difference per centimeter (∆T/cm), which was used for calculating the temperature distributions along the Y and Z axes (see Figure 4c). A thermal conductivity of the poplar wood equal to 0.12 W/mK was preliminarily assigned, then adjusted to 0.09 W/mK [38]. A heat flux across boundaries condition was set for the free surface of the sample, with a preliminary total heat transfer coefficient of 7.69 W/m2K, then changed to 9.67 W/m2K. It is worth observing that these changes were performed within an initial iterative process based on the experimental data. Once the model was completed, the consistency of the analysis was associated with the ratio between the horizontal heat flux component (x component) and the other ones (y and z components). The requirement applied in this study was that these ratios must be less than 5% [39].
- Comparison between different methods for measuring heat flows: During this step, the direct and the indirect heat fluxes were compared. One approach involved the direct application of a conventional heat flux sensor (HFS) on the sample, while the other approach entailed determining the total heat transfer coefficient for the subsequent application of Newton’s cooling law within the indirect method (hereinafter defined as THM). After achieving steady-state conditions, the convective heat transfer coefficient was determined by analyzing the dimensionless groups using the surface and air temperatures and air velocities [40]. Aiming at evaluating the impact of the anemometer position, the experimental data were acquired, considering different positions of the measuring instrument. Distances from 5 to 9 cm were investigated, considering changes equal to 1 cm. Due to the spherical protecting structure of the anemometer, which does not allow the sensor to be brought close to the sample, smaller distances have not been verified. However, the theory of heat transfer by convection (dimensional group approach) specifies evaluating the free stream velocity of the fluid (therefore, at a distance such as to be outside the boundary layer).
5. Results and Discussion
6. Conclusions
Author Contributions
Funding
Data Availability Statement
Conflicts of Interest
Nomenclature
| hc | Convective heat transfer coefficient [W/m2K] |
| hr | Radiative heat transfer coefficient [W/m2K] |
| htot | Total heat transfer coefficient [W/m2K] |
| q | Heat flux density [W/m2] |
| Tair | Air temperature [K, °C] |
| Tm | Average thermodynamic temperature [K] |
| w | Uncertainty in the independent variable |
| x | Independent variable |
| Acronym | |
| HFM | Heat flow meter |
| HFS | Heat flux sensor |
| THM | Thermometric |
| Dimensionless numbers | |
| Ar | Archimedes [-] |
| Gr | Grashof [-] |
| Nu | Nusselt [-] |
| Pr | Prandtl [-] |
| Ra | Rayleigh [-] |
| Re | Reynolds [-] |
| Greek symbols | |
| ε | Emissivity [-] |
| σ | Stefan–Boltzmann constant [W/m2K4] |
References
- De Cristo, E.; Evangelisti, L.; Battista, G.; Guattari, C.; De Lieto Vollaro, R.; Asdrubali, F. Annual Comparison of the Atmospheric Urban Heat Island in Rome (Italy): An Assessment in Space and Time. Buildings 2023, 13, 2792. [Google Scholar] [CrossRef]
- Carvalho, J.P.; Bragança, L.; Mateus, R. Sustainable Building Design: Analysing the Feasibility of BIM Platforms to Support Practical Building Sustainability Assessment. Comput. Ind. 2021, 127, 103400. [Google Scholar] [CrossRef]
- Le, D.L.; Salomone, R.; Nguyen, Q.T. Circular Bio-Based Building Materials: A Literature Review of Case Studies and Sustainability Assessment Methods. Build Environ. 2023, 244, 110774. [Google Scholar] [CrossRef]
- Qu, D.; Cheng, L.; Bao, Y.; Gao, Y.; Zheng, X.; Qin, G. Enhanced Optical Absorption and Solar Steam Generation of CB-ATO Hybrid Nanofluids. Renew. Energy 2022, 199, 509–516. [Google Scholar] [CrossRef]
- Bao, Y.; Huang, A.; Zheng, X.; Qin, G. Enhanced Photothermal Conversion Performance of MWCNT/SiC Hybrid Aqueous Nanofluids in Direct Absorption Solar Collectors. J. Mol. Liq. 2023, 387, 122577. [Google Scholar] [CrossRef]
- Gan, V.J.L.; Deng, M.; Tse, K.T.; Chan, C.M.; Lo, I.M.C.; Cheng, J.C.P. Holistic BIM Framework for Sustainable Low Carbon Design of High-Rise Buildings. J. Clean. Prod. 2018, 195, 1091–1104. [Google Scholar] [CrossRef]
- Yang, Z.; Zhu, C.; Zhu, Y.; Li, X. Blockchain Technology in Building Environmental Sustainability: A Systematic Literature Review and Future Perspectives. Build. Environ. 2023, 245, 110970. [Google Scholar] [CrossRef]
- Hafez, F.S.; Sa’di, B.; Safa-Gamal, M.; Taufiq-Yap, Y.H.; Alrifaey, M.; Seyedmahmoudian, M.; Stojcevski, A.; Horan, B.; Mekhilef, S. Energy Efficiency in Sustainable Buildings: A Systematic Review with Taxonomy, Challenges, Motivations, Methodological Aspects, Recommendations, and Pathways for Future Research. Energy Strategy Rev. 2023, 45, 101013. [Google Scholar] [CrossRef]
- Abdallah, M.; El-Rayes, K. Optimizing the Selection of Building Upgrade Measures to Minimize the Operational Negative Environmental Impacts of Existing Buildings. Build. Environ. 2015, 84, 32–43. [Google Scholar] [CrossRef]
- Hubbert, M.K. Nuclear Energy and the Fossil Fuels; Shell Development Company, Exploration and Production Research Division: Houston, TX, USA, 1956. [Google Scholar]
- Azkorra-Larrinaga, Z.; Erkoreka-González, A.; Martín-Escudero, K.; Pérez-Iribarren, E.; Romero-Antón, N. Thermal Characterization of a Modular Living Wall for Improved Energy Performance in Buildings. Build. Environ. 2023, 234, 110102. [Google Scholar] [CrossRef]
- Lucchi, E. Thermal Transmittance of Historical Brick Masonries: A Comparison among Standard Data, Analytical Calculation Procedures, and in Situ Heat Flow Meter Measurements. Energy Build. 2017, 134, 171–184. [Google Scholar] [CrossRef]
- Nardi, I.; de Rubeis, T.; Perilli, S. Ageing Effects on the Thermal Performance of Two Different Well-Insulated Buildings. Energy Procedia 2016, 101, 1050–1057. [Google Scholar] [CrossRef]
- Antonyová, A.; Korjenic, A.; Antony, P.; Korjenic, S.; Pavlušová, E.; Pavluš, M.; Bednar, T. Hygrothermal Properties of Building Envelopes: Reliability of the Effectiveness of Energy Saving. Energy Build. 2013, 57, 187–192. [Google Scholar] [CrossRef]
- Staszczuk, A.; Kuczyński, T. The Impact of Wall and Roof Material on the Summer Thermal Performance of Building in a Temperate Climate. Energy 2021, 228, 120482. [Google Scholar] [CrossRef]
- García de Diego, M.D.L.; Gómez Muñoz, G.; Román López, E. Towards New Energy Accounting in Residential Building. Inf. Constr. 2015, 67, m028. [Google Scholar] [CrossRef]
- Teni, M.; Krstić, H.; Kosiński, P. Review and Comparison of Current Experimental Approaches for In-Situ Measurements of Building Walls Thermal Transmittance. Energy Build. 2019, 203, 109417. [Google Scholar] [CrossRef]
- Evangelisti, L.; Scorza, A.; De Lieto Vollaro, R.; Sciuto, S.A. Comparison between Heat Flow Meter (HFM) and Thermometric (THM) Method for Building Wall Thermal Characterization: Latest Advances and Critical Review. Sustainability 2022, 14, 693. [Google Scholar] [CrossRef]
- Bienvenido-Huertas, D.; Moyano, J.; Marín, D.; Fresco-Contreras, R. Review of in Situ Methods for Assessing the Thermal Transmittance of Walls. Renew. Sustain. Energy Rev. 2019, 102, 356–371. [Google Scholar] [CrossRef]
- Swain, A.; Das, M.K. Flow Boiling of Distilled Water over Plain Tube Bundle with Uniform and Varying Heat Flux along the Height of the Tube Bundle. Exp. Therm. Fluid Sci. 2017, 82, 222–230. [Google Scholar] [CrossRef]
- Sun, C.-Z.; Liu, L.; Li, Y.-X.; Zhu, J.-L. Research on the Falling Film Flow and Heat Transfer Characteristics of FLNG Spiral Wound Heat Exchanger under Sea Conditions. Pet Sci. 2022, 19, 1276–1290. [Google Scholar] [CrossRef]
- Xue, W.; Wang, Y.; Liang, Y.; Wang, T.; Ren, B. Efficient Hydraulic and Thermal Simulation Model of the Multi-Phase Natural Gas Production System with Variable Speed Compressors. Appl. Therm. Eng. 2024, 242, 122411. [Google Scholar] [CrossRef]
- Ohlsson, K.E.A.; Olofsson, T. Quantitative Infrared Thermography Imaging of the Density of Heat Flow Rate through a Building Element Surface. Appl. Energy 2014, 134, 499–505. [Google Scholar] [CrossRef]
- Fokaides, P.A.; Kalogirou, S.A. Application of Infrared Thermography for the Determination of the Overall Heat Transfer Coefficient (U-Value) in Building Envelopes. Appl. Energy 2011, 88, 4358–4365. [Google Scholar] [CrossRef]
- Nardi, I.; Lucchi, E.; de Rubeis, T.; Ambrosini, D. Quantification of Heat Energy Losses through the Building Envelope: A State-of-the-Art Analysis with Critical and Comprehensive Review on Infrared Thermography. Build. Environ. 2018, 146, 190–205. [Google Scholar] [CrossRef]
- Tejedor, B.; Casals, M.; Gangolells, M. Assessing the Influence of Operating Conditions and Thermophysical Properties on the Accuracy of In-Situ Measured U -Values Using Quantitative Internal Infrared Thermography. Energy Build. 2018, 171, 64–75. [Google Scholar] [CrossRef]
- Roque, E.; Vicente, R.; Almeida, R.M.S.F.; Mendes da Silva, J.; Vaz Ferreira, A. Thermal Characterisation of Traditional Wall Solution of Built Heritage Using the Simple Hot Box-Heat Flow Meter Method: In Situ Measurements and Numerical Simulation. Appl. Therm. Eng. 2020, 169, 114935. [Google Scholar] [CrossRef]
- Asdrubali, F.; Baldinelli, G. Thermal Transmittance Measurements with the Hot Box Method: Calibration, Experimental Procedures, and Uncertainty Analyses of Three Different Approaches. Energy Build. 2011, 43, 1618–1626. [Google Scholar] [CrossRef]
- Andújar Márquez, J.; Martínez Bohórquez, M.; Gómez Melgar, S. A New Metre for Cheap, Quick, Reliable and Simple Thermal Transmittance (U-Value) Measurements in Buildings. Sensors 2017, 17, 2017. [Google Scholar] [CrossRef]
- Evangelisti, L.; Barbaro, L.; De Cristo, E.; Guattari, C.; D’Orazio, T. Towards an Improved Thermometric Method: Convective and Radiative Heat Transfer for Heat Flux Measurement through an Indirect Approach. Therm. Sci. Eng. Prog. 2024, 49, 102479. [Google Scholar] [CrossRef]
- ISO 6946:2017; Building Components and Building Elements Thermal Resistance and Thermal Transmittance Calculation Methods. ISO: Geneva, Switzerland, 2017.
- Peng, C.; Wu, Z. In Situ Measuring and Evaluating the Thermal Resistance of Building Construction. Energy Build. 2008, 40, 2076–2082. [Google Scholar] [CrossRef]
- Cesaratto, P.G.; De Carli, M.; Marinetti, S. Effect of Different Parameters on the in Situ Thermal Conductance Evaluation. Energy Build. 2011, 43, 1792–1801. [Google Scholar] [CrossRef]
- Meng, X.; Yan, B.; Gao, Y.; Wang, J.; Zhang, W.; Long, E. Factors Affecting the in Situ Measurement Accuracy of the Wall Heat Transfer Coefficient Using the Heat Flow Meter Method. Energy Build. 2015, 86, 754–765. [Google Scholar] [CrossRef]
- Hoffmann, C.; Geissler, A. The Prebound-Effect in Detail: Real Indoor Temperatures in Basements and Measured versus Calculated U-Values. Energy Procedia 2017, 122, 32–37. [Google Scholar] [CrossRef]
- Trethowen, H. Measurement Errors with Surface-Mounted Heat Flux Sensors. Build. Environ. 1986, 21, 41–56. [Google Scholar] [CrossRef]
- Bienvenido-Huertas, D. Assessing the Environmental Impact of Thermal Transmittance Tests Performed in Façades of Existing Buildings: The Case of Spain. Sustainability 2020, 12, 6247. [Google Scholar] [CrossRef]
- Çavuş, V.; Şahin, S.; Esteves, B.; Ayata, Ü. Determination of Thermal Conductivity Properties in Some Wood Species Obtained from Turkey. Bioresources 2019, 14, 6709–6715. [Google Scholar] [CrossRef]
- Guattari, C.; Evangelisti, L.; Gori, P.; Asdrubali, F. Influence of Internal Heat Sources on Thermal Resistance Evaluation through the Heat Flow Meter Method. Energy Build. 2017, 135, 187–200. [Google Scholar] [CrossRef]
- Bergman, L.; Lavine, S.; Incropera, P.; Dewitt, P. Fundamentals of Heat and Mass Transfer, 7th ed.; John Wiley & Sons: Hoboken, NJ, USA; ISBN 13 978-0470-50197-9.
- Fluid Properties Calculator. Available online: http://www.mhtl.uwaterloo.ca/old/onlinetools/airprop/airprop.html (accessed on 8 April 2024).
- Holman, J.P. Experimental Methods for Engineers, 8th ed.; McGraw-Hill Series in Mechanical Engineering; McGraw Hill Higher Education: New York, NY, USA, 2012. [Google Scholar]


| Sensor/Measurement Instrument | Manufacturer | Model | Measuring Range | Resolution |
|---|---|---|---|---|
| Heat flux sensor | Hukseflux | HFP01 | −2000 to 2000 W/m2 | 60 × 10−6 V/(W/m2) |
| Surface temperature sensor | LSI | EST124 | −60 to +80 °C | 0.01 °C |
| Air temperature sensor | LSI | EST033 | −50 to 70 °C | 0.01 °C |
| Hot-wire anemometer | TESTO | 0628 0152 | 0 to 5 m/s | 0.01 m/s |
| Thermal imaging camera | Fluke | Ti480 PRO | −10 to 1000 °C | 0.1 °C |
| Anemometer Distance [cm] | Heat Flux HFM [W/m2] | Surface Temperature [°C] | Air Velocity [m/s] | Air Temperature [°C] |
|---|---|---|---|---|
| 5 | 180.34 ± 0.37 | 40.27 ± 0.01 | 0.08 ± 0.01 | 21.57 ± 0.02 |
| 6 | 182.33 ± 0.34 | 40.39 ± 0.01 | 0.08 ± 0.01 | 21.50 ± 0.01 |
| 7 | 183.78 ± 0.23 | 40.43 ± 0.01 | 0.08 ± 0.01 | 21.45 ± 0.01 |
| 8 | 182.89 ± 0.15 | 40.44 ± 0.01 | 0.07 ± 0.01 | 21.55 ± 0.01 |
| 9 | 183.47 ± 0.13 | 40.42 ± 0.01 | 0.08 ± 0.01 | 21.48 ± 0.01 |
| Anemometer Distance [cm] | Gr | Pr | Re | Ar | Ra | Nu (Equation (1)) | Nu (Equation (2)) | Nu (Equation (3)) |
|---|---|---|---|---|---|---|---|---|
| 5 | 6.27 × 10⁷ | 7.14 × 10⁻¹ | 1.40 × 10³ | 3.42 × 101 | 4.47 × 10⁷ | 3.82 × 101 | 4.28 × 101 | 4.82 × 101 |
| 6 | 6.33 × 10⁷ | 7.14 × 10⁻¹ | 1.42 × 10³ | 3.41 × 101 | 4.52 × 10⁷ | 3.83 × 101 | 4.29 × 101 | 4.84 × 101 |
| 7 | 6.36 × 10⁷ | 7.14 × 10⁻¹ | 1.43 × 10³ | 3.39 × 101 | 4.54 × 10⁷ | 3.84 × 101 | 4.29 × 101 | 4.84 × 101 |
| 8 | 6.33 × 10⁷ | 7.14 × 10⁻¹ | 1.37 × 10³ | 3.58 × 101 | 4.51 × 10⁷ | 3.83 × 101 | 4.29 × 101 | 4.84 × 101 |
| 9 | 6.34 × 10⁷ | 7.14 × 10⁻¹ | 1.42 × 10³ | 3.37 × 101 | 4.53 × 10⁷ | 3.84 × 101 | 4.29 × 101 | 4.84 × 101 |
| Anemometer Distance [cm] | Total THM Equation (1) [W/m2K] | Total THM Equation (2) [W/m2K] | Total THM Equation (3) [W/m2K] | Total HFM [W/m2K] |
|---|---|---|---|---|
| 5 | 8.72 ± 0.01 | 9.12 ± 0.01 | 9.60 ± 0.01 | 9.64 ± 0.01 |
| 6 | 8.73 ± 0.01 | 9.13 ± 0.01 | 9.62 ± 0.01 | 9.65 ± 0.02 |
| 7 | 8.74 ± 0.01 | 9.13 ± 0.01 | 9.62 ± 0.01 | 9.68 ± 0.01 |
| 8 | 8.73 ± 0.01 | 9.13 ± 0.01 | 9.62 ± 0.01 | 9.68 ± 0.01 |
| 9 | 8.74 ± 0.01 | 9.13 ± 0.01 | 9.62 ± 0.01 | 9.69 ± 0.01 |
| Anemometer Distance [cm] | Heat Flux HFM [W/m2] | Heat Flux THM Equation (1) [W/m2] | Heat Flux THM Equation (2) [W/m2] | Heat Flux THM Equation (3) [W/m2] |
|---|---|---|---|---|
| 5 | 180.34 ± 0.37 | 163.11 ± 0.52 | 170.60 ± 0.54 | 179.64 ± 0.56 |
| 6 | 182.33 ± 0.34 | 164.99 ± 0.24 | 172.51 ± 0.24 | 181.67 ± 0.25 |
| 7 | 183.78 ± 0.23 | 165.83 ± 0.17 | 173.37 ± 0.18 | 182.59 ± 0.19 |
| 8 | 182.89 ± 0.15 | 165.05 ± 0.55 | 172.58 ± 0.57 | 181.74 ± 0.60 |
| 9 | 183.47 ± 0.13 | 165.45 ± 0.36 | 172.99 ± 0.38 | 182.18 ± 0.39 |
Disclaimer/Publisher’s Note: The statements, opinions and data contained in all publications are solely those of the individual author(s) and contributor(s) and not of MDPI and/or the editor(s). MDPI and/or the editor(s) disclaim responsibility for any injury to people or property resulting from any ideas, methods, instructions or products referred to in the content. |
© 2024 by the authors. Licensee MDPI, Basel, Switzerland. This article is an open access article distributed under the terms and conditions of the Creative Commons Attribution (CC BY) license (https://creativecommons.org/licenses/by/4.0/).
Share and Cite
Evangelisti, L.; Barbaro, L.; Guattari, C.; De Cristo, E.; De Lieto Vollaro, R.; Asdrubali, F. Comparison between Direct and Indirect Heat Flux Measurement Techniques: Preliminary Laboratory Tests. Energies 2024, 17, 2961. https://doi.org/10.3390/en17122961
Evangelisti L, Barbaro L, Guattari C, De Cristo E, De Lieto Vollaro R, Asdrubali F. Comparison between Direct and Indirect Heat Flux Measurement Techniques: Preliminary Laboratory Tests. Energies. 2024; 17(12):2961. https://doi.org/10.3390/en17122961
Chicago/Turabian StyleEvangelisti, Luca, Leone Barbaro, Claudia Guattari, Edoardo De Cristo, Roberto De Lieto Vollaro, and Francesco Asdrubali. 2024. "Comparison between Direct and Indirect Heat Flux Measurement Techniques: Preliminary Laboratory Tests" Energies 17, no. 12: 2961. https://doi.org/10.3390/en17122961
APA StyleEvangelisti, L., Barbaro, L., Guattari, C., De Cristo, E., De Lieto Vollaro, R., & Asdrubali, F. (2024). Comparison between Direct and Indirect Heat Flux Measurement Techniques: Preliminary Laboratory Tests. Energies, 17(12), 2961. https://doi.org/10.3390/en17122961


