Article

Combined Effect of Pressure and Temperature on Nitrogen Reduction Reaction in Water

by
Giuseppe Tranchida
1,2,
Rachela G. Milazzo
1,*,
Salvatore A. Lombardo
1 and
Stefania M. S. Privitera
1
1
Institute for Microelectronics and Microsystems, National Research Council (CNR-IMM), Strada VIII, 5, 95121 Catania, Italy
2
Department of Chemical Sciences, University of Catania, Viale Andrea Doria, 6, 95125 Catania, Italy
*
Author to whom correspondence should be addressed.
Energies 2024, 17(12), 2963; https://doi.org/10.3390/en17122963
Submission received: 16 April 2024 / Revised: 10 June 2024 / Accepted: 12 June 2024 / Published: 17 June 2024
(This article belongs to the Special Issue Advances in Photovoltaic and Renewable Energy Engineering)

Abstract

:
The synthesis of ammonia starting from nitrogen and using electrochemical processes is considered an interesting strategy to produce ammonia in a sustainable way. However, it requires not only the development of efficient catalysts for nitrogen reduction but also the optimization of the operating conditions of the employed electrochemical devices. In this work, we optimize the kinetics and the thermodynamics of the electrocatalytic nitrogen reduction reaction in water by developing a pressurized H-cell that may operate at temperatures up to 80 °C. Ni foam with low Au loading (0.08 mg cm−2) has been adopted as a catalyst at the cathode. Ammonia has been produced during chronoamperometry experiments in a saturated N2 atmosphere and measured by the indophenol blue method. The effect of voltage, temperature, and pressure has been studied. The nitrogen reduction experiments have been repeated under saturated Ar. To remove contributions due to environmental contamination, we determined the net value as the difference between the produced ammonia in N2 and in Ar. The ammonia yield increases by increasing the temperature and the pressure. The best results have been obtained by using the combined effects of temperature and pressure. Operating at 5 bar of saturated N2 and 75 °C, a production rate of 6.73 μg h−1·cm−2 has been obtained, a value corresponding to a 5-fold enhancement, compared to that obtained under ambient conditions and room temperature.

1. Introduction

Ammonia is an essential chemical feedstock currently produced mainly through the Haber–Bosch process, converting nitrogen and hydrogen to ammonia at high temperature (300–500 °C) and pressure (200–300 atm) [1,2]. Such a process has contributed to about 1–2% of CO2 yearly emissions. The electrocatalytic N2 reduction reaction (e-NRR) could represent an interesting sustainable alternative to synthesize ammonia from nitrogen and water under mild conditions [3,4,5]. However, the e-NRR process is not easily obtained because of the inherent inertness of nitrogen molecules, the low solubility of N2 in water, and the competing hydrogen evolution reaction (HER), which requires only two electrons, in contrast with the multiple electron transfer (six electrons) necessary for electrochemical ammonia synthesis [6,7,8].
Many catalysts have been studied to improve nitrogen reduction performance, but the overall efficiency and production yield remain quite low to meet the practical requirements. Among the others, noble metal nanostructured catalysts are considered very promising since they are characterized by a large number of active sites and good conductivity [9,10,11,12]. In particular, for nitrogen electroreduction, it has been proposed that the d orbitals of the noble metals may interact with the lone pair electrons of N2, resulting in a weakening of the N2 triple bond, and it has been proven that the nitrogen reduction on gold surfaces occurs through an associative mechanism during which the hydrogenation of N atoms and the breaking of the triple N2 bonds occur simultaneously [1,13]. Such a mechanism may lower the energy barrier for the formation and stabilization of N2H2* intermediates on the catalyst surface [14]. Although the adoption of suitable electrocatalysts may have positive effects on the NRR process, the effectiveness of electrochemical ammonia synthesis depends on the cooperative development of both catalysts and electrochemical cell devices. Indeed, since low nitrogen adsorption on the catalyst and poor solubility in water are regarded as potential limiting steps, a promising approach includes the adoption of a pressurized electrocatalytic environment and increased temperature to favor the kinetics and the thermodynamic driving forces. Recently, positive cooperation of metal single-atom (SA) catalysts (Rh, Ru, and Co on graphdiyne) has been demonstrated with a pressurized membrane-separated electrolysis system. Under pressurized conditions of 55.7 bar of N2, the Rh SA catalyst displayed a NH3 yield rate of 74.15 μg h−1·cm−2, a value 7.3-fold higher than that obtained at ambient conditions [15]. However, the combined role of temperature and pressure in mild conditions (pressure < 10 bar) on e-NRR has not been studied in the literature. In order to investigate the synergistic effect of pressure and temperature, in this paper we developed a pressurized H-cell with two compartments operating in the range 1–8 bar and at temperatures between 25 °C and 80 °C. The most commonly adopted electrochemical cells for e-NRR are H-cells, which include two compartments separated by a membrane, with N2 supplied by bubbling into the cathode side. The advantage of the use of a two-compartment liquid–liquid cell is the reduction of product crossover and the possibility to quantify ammonia production from liquid samples of the electrolyte [16], although it is limited by the low solubility of nitrogen gas in water [17]. The approach proposed in this paper, employing a pressurized H-cell, allows to increase the solubility of N2 in water and is effective in enhancing both the chemical kinetics and thermodynamic process and providing indications about the dependence of e-NRR on temperature and pressure in mild conditions. By adopting electroless deposited gold on Ni foam as an electrocatalyst for NRR, an ammonia yield rate of 6.73 μg h−1·cm−2 was achieved at 5 bar, operating at 75 °C.

2. Materials and Methods

2.1. Electrodes

Gold has been deposited by spontaneous galvanic displacement [18] on a 2.5 cm × 2.5 cm nickel foam electrode purchased from Merck Life Science s.r.l. (Milano, Italy) (thickness 1.6 mm with a porosity of 95% and 20 pores per linear cm). Before the deposition, the Ni foam was pretreated in acetone at 60 °C with sonication and then in a 0.01 M HCl solution at 60 °C for 30 min, to remove the native oxide. After cleaning, the Ni Foam substrate was placed for 120 s into the deposition solution containing 1 mM KAuCl4 and 0.01 M HCl at room temperature and under ambient light. The deposition has been performed by stirring the solution at 600 rpm and by adding isopropyl alcohol (C3H8O, IPA, Merck Life Science s.r.l. Milano, Italy) at a concentration of 5%. After deposition, the electrode was abundantly rinsed in deionized water and dried in air. The resulting Au loading is 0.08 mg cm−2, as determined by the thickness of the Au layer (100 nm) and adopting a procedure described in a previous work [19].
For the anode electrode, Pt has been electrodeposited in a solution containing 1 mM of K2PtCl6 and 10 mM of HCl with a current of 2 mA cm−2 on carbon felt (Freundeberg, Weinheim, Germany).

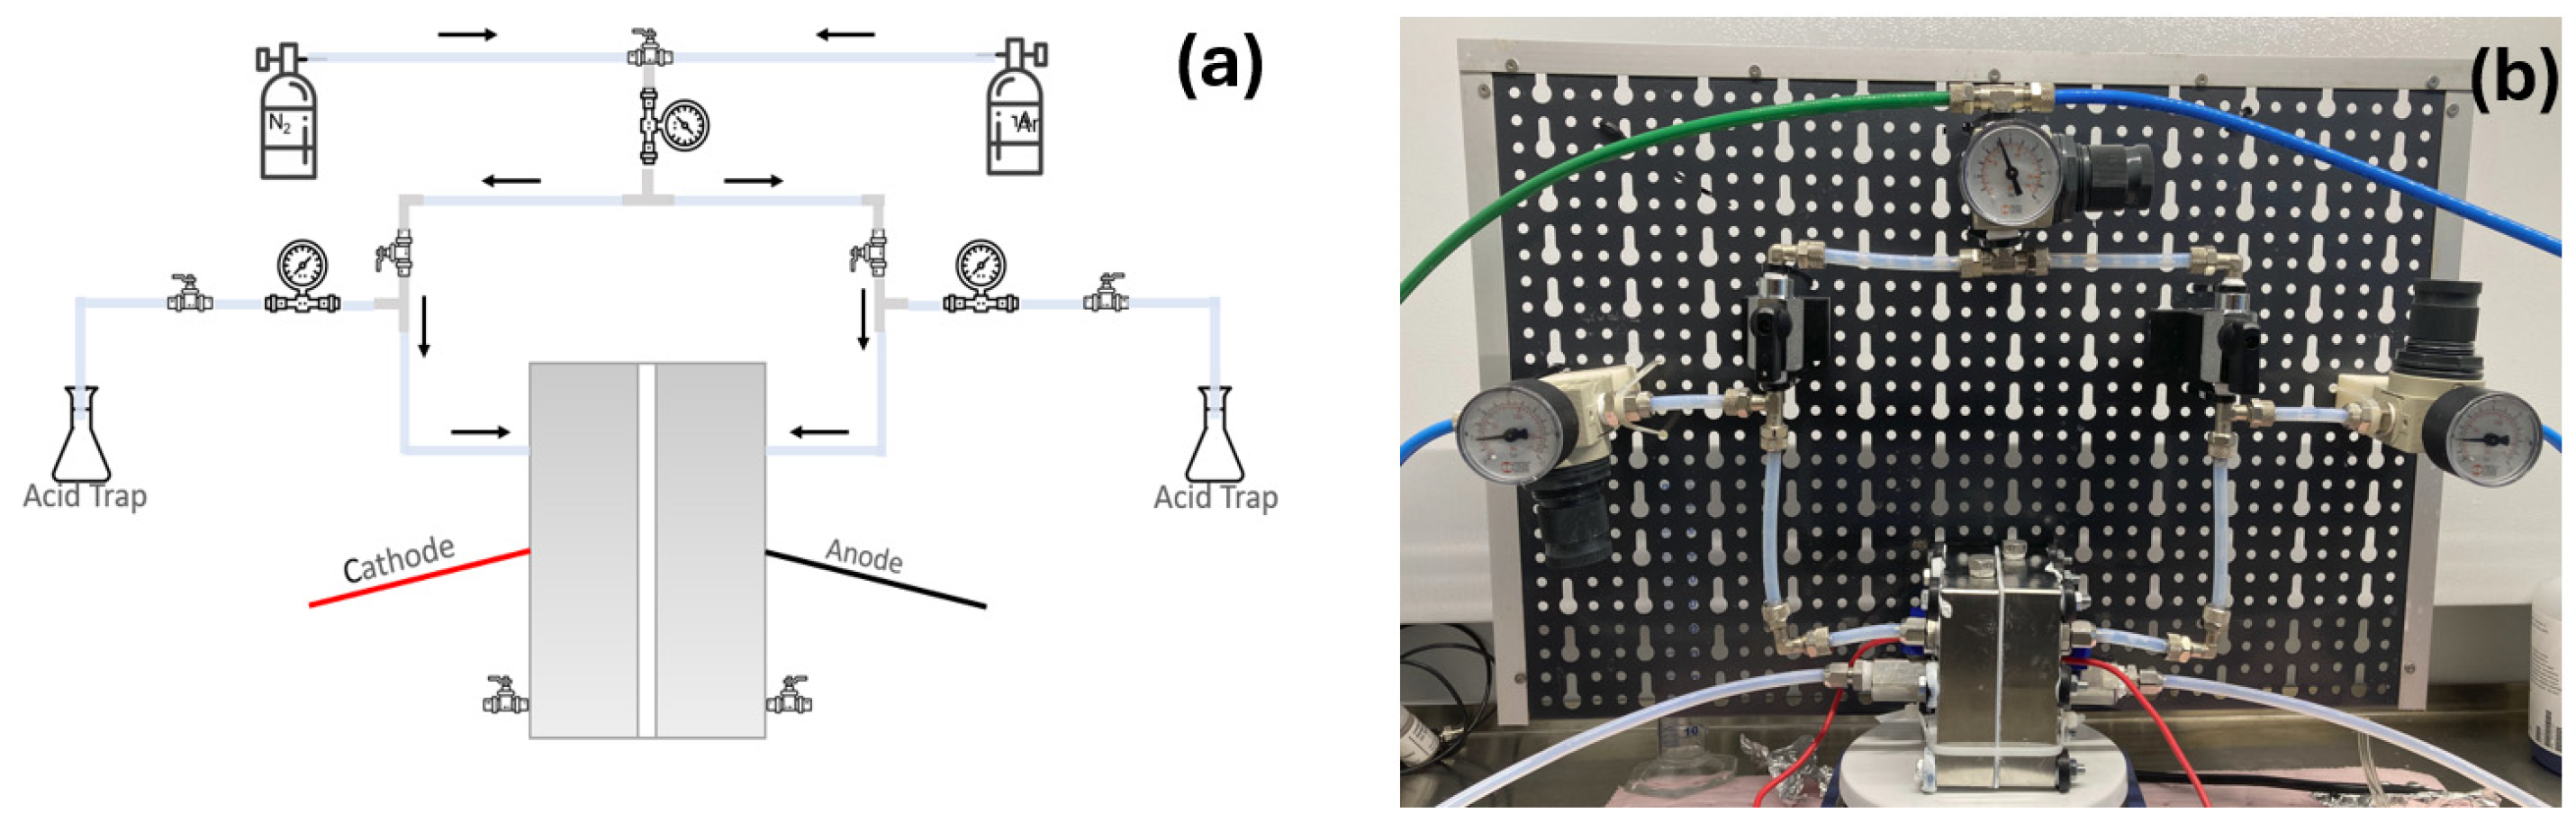
2.2. Pressurized Electrochemical H-Cell

A pressurized electrochemical cell with two separate compartments for anode and cathode has been designed and manufactured. The system is shown in Figure 1. The cell is made of stainless steel and can be loaded with 25 mL of electrolyte in each compartment, with the cathode and anode sides separated by a Zirfon PERL membrane purchased by Agfa [20,21]. Either Ar or N2 gas can be introduced on both sides of the cell, and the pressure value is selected through a valve on top of the system. The pressurized H-cell operates in static conditions, and after the ammonia synthesis, the gas can be collected on the two lateral branches. The collected gas is bubbled through an acidic trap (1 mM H2SO4) in order to trap gaseous ammonia. The liquid electrolyte is drained by the two valves at the bottom of the cell. After each ammonia synthesis experiment, ammonia is measured in both the acidic trap and in the electrolyte.
Linear sweep voltammetry curves were recorded in a two-electrode configuration using N2 or Ar with a scan rate of 30 mV s−1 and at different pressures and temperatures. Chronoamperometry measurements were conducted at controlled potentials at different temperatures, pressures, and times.

2.3. Electrochemical Ammonia Synthesis

The protocol adopted to avoid external contaminations during the ammonia synthesis experiments has been reported in [22] and consists of (i) washing the electrodes in water at 35 °C while stirring for 30 min before chronoamperometry measurements; (ii) adopting high purity N2 and Ar gases (Nippon Gases 99.9999% with <0.5 ppm of oxygen); (iii) measuring the ammonia in the cell filled with the electrolyte before the experiment (@open circuit); (iv) starting the experiment only if the concentration of NH3 does not exceed 10−6 M; (v) determining the amount of produced ammonia after the chronoamperometry by subtracting the initial amount (ΔNH3); (vi) executing Ar-saturated control experiments in the same conditions (bias, temperature, and pressure); (vii) determining the net ammonia as the difference between the ammonia produced under an N2-saturated atmosphere and that produced under an Ar saturated atmosphere. The last step (vii) eliminates possible contributions in the water other than N2, such as nitrates and nitrites, that could be reduced to ammonia. The electrolyte adopted for the experiment is 0.1 M Na2SO4.

2.4. Ammonia Detection

The concentration of the produced ammonia after each test was detected by the indophenol blue method, as described by Di Zhu et al. [23]. The standard addition method has been adopted. Sodium hydroxide (NaOH Thermo Fisher Scientific, Waltham, MA, USA), trisodium citrate dihydrate (Na3C6H5O7·2H2O Alfa Aesar ≥ 99.0%), salicylic acid (C7H6O3 Alfa Aesar 99%), sodium pentacyanonitrosylferrate (III) dihydrate (Na2[(Fe(CN)5NO] 2H2O Alfa Aesar 98+%), ammonium chloride (NH4Cl granular, Alfa Aesar 99.5%), sodium hypochlorite solutions (NaClO, Alfa Aesar 11–15%) were used. An UV-Vis spectrophotometer (Cary 5000 UV-Vis-NIR, Agilent Technologies, Santa Clara, CA, USA) was used to measure the solution’s absorbance at a wavelength of 655 nm. A calibration curve was plotted to quantify the amount of NH3 produced using standard ammonia chloride solutions ranging from 0.15 to 0.015 μg mL−1 in Na2SO4 electrolyte solution. Figure S1 shows a typical absorption spectrum of standard ammonia solutions and a calibration curve.

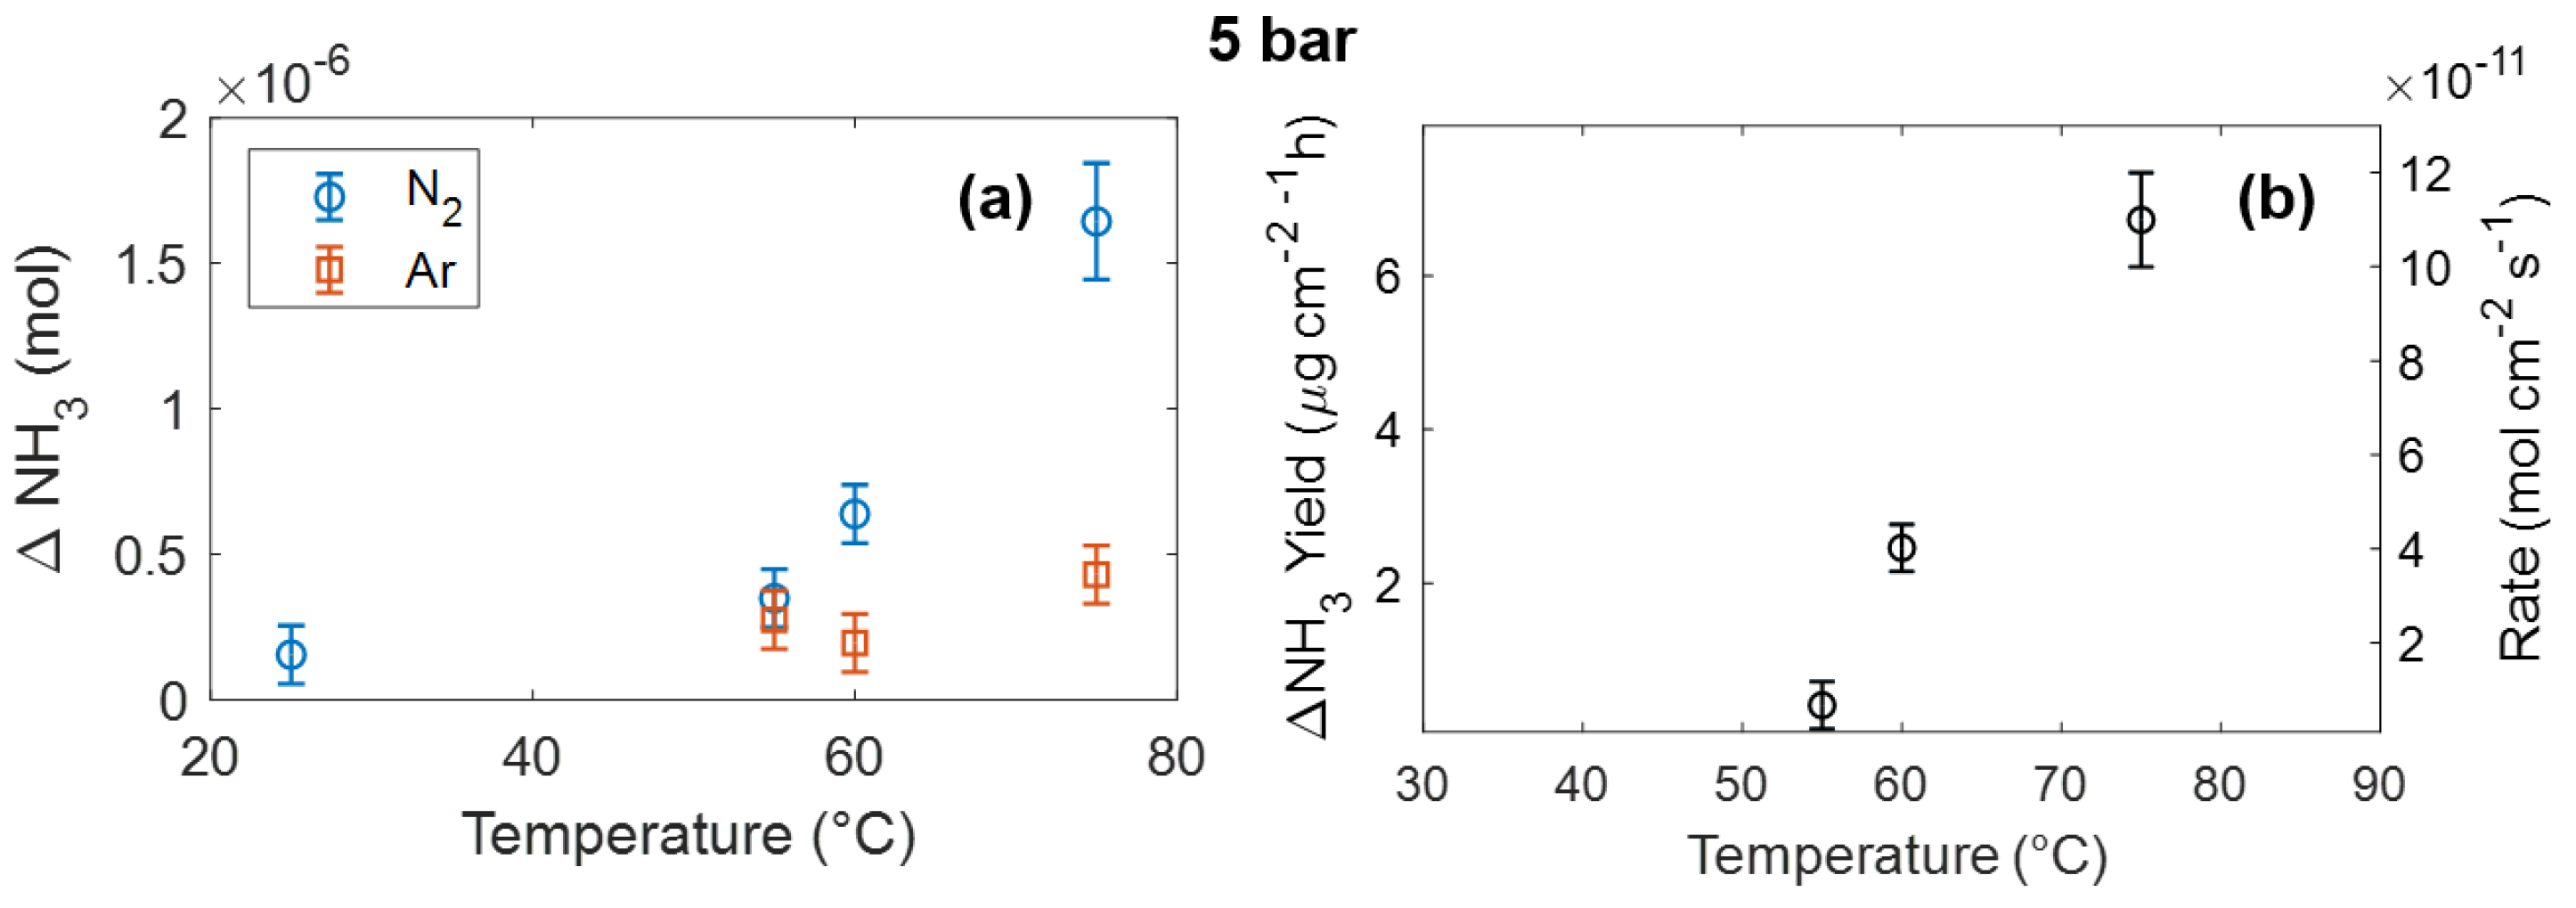
3. Results and Discussion

Figure 2a shows the linear sweep voltammetry (LSV) curves measured at atmospheric pressure at different temperatures.
The large current increase observed at voltages larger than 2.5 V at 25 °C corresponds to the water splitting reaction. As is known, the voltage required for water splitting decreases when the temperature increases. The effect of pressure is shown in Figure 2b. Curves have been acquired at a constant temperature of 55 °C, varying the N2 pressure. The voltage required for water splitting increases as the pressure increases. The same result is also obtained at different temperatures (see Figure S2).
After testing the cell operation, we proceeded with the electrochemical ammonia synthesis by chronoamperometry (CA). Figure 3a,b show the CA curves acquired in saturated N2 at 5 bar and 55 °C at different voltages and the ammonia moles measured before and after the chronoamperometry, respectively. The produced ammonia ΔNH3 = NH3 (after CA) − NH3 (before CA) is shown as a function of voltage in Figure 3c. The same experiment has also been conducted under Ar pressure in the same conditions. The produced ammonia using Ar is also reported in Figure 3c, showing that a small amount of ammonia is produced even under an Ar atmosphere. This is mainly due to residual air in the cell and/or possible contamination in the gas, electrolyte, or within the cell. To remove this contribution, we determined the net ammonia from the nitrogen reduction reaction as the difference between the produced ammonia in N2 and in Ar. The net ammonia rate as a function of voltage is reported in Figure 3d.
Considering the dependence as a function of pressure and temperature, as shown in Figure 2, we varied temperature and pressure, properly choosing the voltage in order to have the maximum ammonia production. Figure 4 shows the dependence of ammonia yield on temperature. Chronoamperometry experiments have been performed at 5 bar at different temperatures. The ammonia produced in a nitrogen or argon atmosphere is shown in Figure 4a. It is clear that in the case where the CA is performed in N2, the ammonia production strongly depends on temperature, while there is no large variation under an Ar atmosphere. From ΔNH3, the net ammonia yield has been evaluated, as reported in Figure 4b. The yield exhibits an activated temperature dependence with an activation energy of about 1 eV.
In order to better study the effect of pressure, the same experiment has been repeated at 1.5 bar. Results are shown in Figure 5. In this case (1.5 bar), by increasing the temperature from 35 °C to 75 °C, the ammonia production rate is increased only by a factor of 2, while the adoption of both high temperature (75 °C) and pressure (5 bar) produces an increase in the ammonia production rate by a factor of 5.
After testing the system as a function of pressure and temperature, we have evaluated the physical stability by SEM analyses performed after usage at pressures of up to 5 bar and temperatures of up to 60 °C (Figure S3). The electrochemical stability of NRR has been evaluated by repeating the chronoamperometry four times at the same voltage of 2.1 V, 1.5 bar, and 60 °C, while increasing the time. The results are reported in Figure S4 and show a linear increase in ammonia production as a function of time. The corresponding NH3 production yield shows negligible reduction as a function of time.
The underlying mechanisms governing the observed improvement with the combined increase in temperature and pressure can be explained by considering the two overall reactions occurring in the pressurized cell. One is water splitting, which produces hydrogen and oxygen from water according to the reaction:
2H2O(l) ⇌ 2H2(g) + O2(g)
At 1 bar and 278 K, the splitting of water is a non-spontaneous process since the change in Gibbs free energy ΔGws is positive and equal to +237 kJ mol−1. This value corresponds to a water electrolysis voltage
Ews = ΔGws/(nF) = 1.229 eV
where n is the number of electrons transferred per formula conversion (n = 2) and F is the Faraday constant (F = 96,500 C mol−1). The value of Ews is calculated at 25 °C and 1 bar and corresponds to the voltage at which a perfectly efficient cell would operate without any loss. The temperature increase represents an advantageous factor for water splitting since it decreases the energy required for electrolysis. Values of ΔGws versus temperature have been calculated using values available in the NIST Chemistry WebBook [24,25] and are reported in the Supplementary Materials (Figure S5).
Since the water splitting reaction produces 3 moles of gaseous products, according to the Le Chatelier principle, the water splitting reaction is not favored by the pressure increase. This explains the increase in voltage observed as the pressure increases (Figure 2b).
The other overall reaction occurring in the cell, in which we are interested, is ammonia formation through nitrogen reduction in water. This is described by the following reaction:
N2(g) + 3H2O(l) ⇌ 2NH3(aq) + 3/2O2(g)
Unlike ammonia formation from nitrogen and hydrogen gas (N2(g) + 3H2(g) ⇌ 2NH3(g)) adopted in the Haber–Bosch process, which is characterized by a negative values of Gibbs free energy, in the case of ammonia synthesis in water, the reaction requires energy and is advantaged by the temperature increase. As shown in Figure S5, ΔGamm decreases more rapidly as a function of temperature compared to ΔGws, therefore indicating that the temperature increase is more advantageous for ammonia synthesis in water. Moreover, the overall reaction of ammonia production in an aqueous solution involves 1 mole of gas as a reagent and produces 1.5 moles of gas (O2). It is therefore expected to be less sensitive to pressure. So, the combined effect of temperature and pressure turns out to be effective in (i) delivering more N2 at the electrode surface area, (ii) improving the ammonia rate production, and, at the same time, (ii) impeding the HER.
The effectiveness of the proposed approach is confirmed by comparing the results with those reported in the literature for pressurized cells. In the case of Rh SA on graphydine adopted as catalyst for NRR [15], the ammonia production rate at 10 bar is increased only by a factor of 1.7, while a pressure of 30 bar is required to increase the rate by a factor of 3.75. The combined increase in both temperature (75 °C) and pressure (5 bar), adopted in this work, produces an increase in the ammonia production rate by more than a factor of 5, while keeping the overall temperature and pressure conditions in a mild operating range. The value of 6.73 μg h−1 cm−2 obtained in the pressurized cell at 75 °C and 5 bar, corresponding to 84 µg h−1 mgcat−1 (Au loading 0.08 mg cm−2), compares also very well with the results reported in literature for room temperature and pressure adopting gold on Ni foam, reporting values of 29.4 µg h−1 mgcat−1 for nanoporous Au [26] or 30.83 μg h−1 mgcat−1 for single atom Au catalysts onto nanoporous MoSe2 [27].

4. Conclusions

In summary, we have studied the effect of temperature and pressure on the nitrogen reduction reaction in an aqueous environment, demonstrating that kinetics and thermodynamic processes can be regulated by adopting a pressurized H-cell operating in a water-based electrolyte at a moderate pressure (1–6 bar) and temperature. The increase in both temperature and pressure is effective in producing a significant boost in NRR activity by delivering more N2 molecules at the porous electrode, increasing the NRR rate, and also alleviating the competition with hydrogen evolution. Under 5 bar of N2, at 75 °C, the obtained NH3 yield rate was 6.73 μg h−1 cm−2, more than 5-fold higher than obtained at ambient conditions. This improvement is better than what is achievable by only increasing the pressure.
The proposed study and findings provide a general approach and method that can be used as a valuable scheme to investigate the NRR process under mild temperature and pressure conditions and that can also be applied to different catalysts, therefore representing a step forward in the synthesis of ammonia through electrochemical processes.

Supplementary Materials

The following supporting information can be downloaded at: https://www.mdpi.com/article/10.3390/en17122963/s1, Figure S1: Calibration for ammonia measurements; Figure S2: Electrochemical measurements at different temperatures and pressures; Figure S3: SEM micrographs of the catalyst; Figure S4: Catalyst stability under NRR; Figure S5: Gibbs free energy for water splitting and ammonia synthesis in water.

Author Contributions

Conceptualization, S.M.S.P. and S.A.L.; methodology, G.T., R.G.M., S.M.S.P. and S.A.L.; software, G.T., R.G.M., S.M.S.P. and S.A.L.; validation, G.T., R.G.M., S.M.S.P. and S.A.L.; formal analysis, G.T., R.G.M. and S.M.S.P.; investigation, G.T., R.G.M. and S.M.S.P.; resources, S.M.S.P. and S.A.L.; data curation, G.T., R.G.M., S.M.S.P. and S.A.L.; writing—original draft preparation, S.M.S.P.; writing—review and editing, S.M.S.P. and R.G.M.; supervision, S.M.S.P. and S.A.L.; project administration, S.M.S.P.; funding acquisition, S.M.S.P. All authors have read and agreed to the published version of the manuscript.

Funding

This research was funded by the European project TELEGRAM. The TELEGRAM project has received funding from the European Union’s Horizon 2020 Research and Innovation program, under grant agreement No. 101006941.

Data Availability Statement

The data of this study are available from the corresponding author upon reasonable request.

Conflicts of Interest

The authors declare no conflict of interest.

References

  1. Thamdrup, B. New Pathways and Processes in the Global Nitrogen Cycle. Annu. Rev. Ecol. Evol. Syst. 2012, 43, 407–428. [Google Scholar] [CrossRef]
  2. Liu, H. Ammonia synthesis catalyst: 100 years: Practice, enlightenment and challenge. Chin. J. Catal. 2014, 35, 1619–1640. [Google Scholar] [CrossRef]
  3. Shipman, M.A.; Symes, M.D. Recent progress towards the electrosynthesis of ammonia from sustainable resources. Catal. Today 2017, 286, 57–68. [Google Scholar] [CrossRef]
  4. Kyriakou, V.; Garagounis, I.; Vasileiou, E.; Vourros, A.; Stoukides, M. Progress in the Electrochemical Synthesis of Ammonia. Catal. Today 2017, 286, 2–13. [Google Scholar] [CrossRef]
  5. Singh, A.R.; Rohr, B.A.; Schwalbe, J.A.; Cargnello, M.; Chan, K.; Jaramillo, T.F.; Chorkendorff, I.; Nørskov, J.K. Electrochemical Ammonia Synthesis—The Selectivity Challenge. ACS Catal. 2017, 7, 706–709. [Google Scholar] [CrossRef]
  6. Ouyang, L.; Liang, J.; Luo, Y.; Zheng, D.; Sun, S.; Liu, Q.; Hamdy, M.S.; Sun, X.; Ying, B. Recent Advances in Electrocatalytic Ammonia Synthesis. Chin. J. Catal. 2023, 50, 6–44. [Google Scholar] [CrossRef]
  7. Shafiq, F.; Yang, L.; Zhu, W. Recent progress in the advanced strategies, rational design, and engineering of electrocatalysts for nitrate reduction toward ammonia. Phys. Chem. Chem. Phys. 2024, 26, 11208–11216. [Google Scholar] [CrossRef]
  8. Wonsang, J.; Hwang, Y.J. Material strategies in the electrochemical nitrate reduction reaction to ammonia production. Mater. Chem. Front. 2021, 5, 6803–6823. [Google Scholar]
  9. Rao, X.; Liu, M.; Chien, M.; Inoue, C.; Zhang, J.; Liu, Y. Recent progress in noble metal electrocatalysts for nitrogen-to-ammonia conversion. Renew. Sustain. Energy Rev. 2022, 168, 112845. [Google Scholar] [CrossRef]
  10. Santhosh, C.R.; Sankannavar, R. A comprehensive review on electrochemical green ammonia synthesis: From conventional to distinctive strategies for efficient nitrogen fixation. Appl. Energy 2023, 352, 121960. [Google Scholar] [CrossRef]
  11. Arroyo-Caire, J.; Diaz-Perez, M.A.; Lara-Angulo, M.A.; Serrano-Ruiz, J.C. A Conceptual Approach for the Design of New Catalysts for Ammonia Synthesis: A Metal—Support Interactions Review. Nanomaterials 2023, 13, 2914. [Google Scholar] [CrossRef] [PubMed]
  12. Zhao, R.; Xie, H.; Chang, L.; Zhang, X.; Zhu, X.; Tong, X.; Wang, T.; Luo, Y.; Wei, P.; Wang, Z.; et al. Recent progress in the electrochemical ammonia synthesis under ambient conditions. EnergyChem 2019, 1, 100011. [Google Scholar] [CrossRef]
  13. Skúlason, E.; Bligaard, T.; Gudmundsdóttir, S.; Studt, F.; Rossmeisl, J.; Abild-Pedersen, F.; Vegge, T.; Jónsson, H.; Nørskov, J.K. A Theoretical Evaluation of Possible Transition Metal Electro-Catalysts for N2 Reduction. Phys. Chem. Chem. Phys. 2011, 14, 1235–1245. [Google Scholar] [CrossRef] [PubMed]
  14. Gruber, N.; Galloway, J.N. An Earth-System Perspective of the Global Nitrogen Cycle. Nature 2008, 451, 293–296. [Google Scholar] [CrossRef] [PubMed]
  15. Zou, H.; Rong, W.; Wei, S.; Duan, L. Regulating kinetics and thermodynamics of electrochemical nitrogen reduction with metal single atom catalysts in a pressurized electrolyzer. Proc. Natl. Acad. Sci. USA 2020, 117, 29462–29468. [Google Scholar] [CrossRef] [PubMed]
  16. Bi, W.; Shaigan, N.; Malek, A.; Fatih, K.; Gyenge, E.; Wilkinson, D.P. Strategies in cell design and operation for the electrosynthesis of ammonia: Status and prospects. Energy Environ. Sci. 2022, 15, 2259–2287. [Google Scholar] [CrossRef]
  17. Kolen, M.; Ripepi, D.; Smith, W.A.; Burdyny, T.; Mulder, F.M. Overcoming Nitrogen Reduction to Ammonia Detection Challenges: The Case for Leapfrogging to Gas Diffusion Electrode Platforms. ACS Catal. 2022, 12, 5726–5735. [Google Scholar] [CrossRef] [PubMed]
  18. Tranchida, G.; Milazzo, R.G.; Leonardi, M.; Scalese, S.; Farina, R.A.; Lombardo, S.; Privitera, S.M.S. Ultra-Low Loading of Gold on Nickel Foam for Nitrogen Electrochemistry. Nanomaterials 2023, 13, 2850. [Google Scholar] [CrossRef] [PubMed]
  19. Milazzo, R.G.; Privitera, S.M.S.; D’Angelo, D.; Scalese, S.; Di Franco, S.; Maita, F.; Lombardo, S. Spontaneous galvanic displacement of Pt nanostructures on nickel foam: Synthesis, characterization and use for hydrogen evolution reaction. Int. J. Hydrogen Energy 2018, 43, 7903–7910. [Google Scholar] [CrossRef]
  20. Leonardi, M.; Tranchida, G.; Corso, R.; Milazzo, R.G.; Lombardo, S.A.; Privitera, S.M.S. Role of the Membrane Transport Mechanism in Electrochemical Nitrogen Reduction Experiments. Membranes 2022, 12, 969. [Google Scholar] [CrossRef]
  21. Cai, X.; Iriawan, H.; Yang, F.; Luo, L.; Shen, S.; Shao-Horn, Y.; Zhang, J. Interaction of Ammonia with Nafion and Electrolyte in Electrocatalytic Nitrogen Reduction Study. J. Phys. Chem. Lett. 2021, 12, 6861–6866. [Google Scholar] [CrossRef] [PubMed]
  22. Tranchida, G.; Milazzo, R.G.; Leonardi, M.; Scalese, S.; Pulvirenti, L.; Condorelli, G.G.; Bongiorno, C.; Lombardo, S.; Privitera, S.M.S. Strategies to Improve the Catalytic Activity of Fe-Based Catalysts for Nitrogen Reduction Reaction. Int. J. Hydrogen Energy 2023, 48, 25328–25338. [Google Scholar] [CrossRef]
  23. Zhu, D.; Zhang, L.; Ruther, R.E.; Hamers, R.J. Photo-illuminated diamond as a solid-state source of solvated electrons in water for nitrogen reduction. Nat. Mater. 2013, 12, 836–841. [Google Scholar] [CrossRef] [PubMed]
  24. NIST Chemistry WebBook. NIST Standard Reference Database Number 69. Available online: https://webbook.nist.gov/chemistry/ (accessed on 10 January 2024).
  25. Vanderzee, C.; King, D.L. The enthalpies of solution and formation of ammonia. J. Chem. Thermodyn. 1972, 4, 675–683. [Google Scholar] [CrossRef]
  26. Wang, H.; Yu, H.; Wang, Z.; Li, Y.; Xu, Y.; Li, X.; Xue, H.; Wang, L. Electrochemical fabrication of porous Au film on Ni foam for nitrogen reduction to ammonia. Small 2019, 15, 1804769. [Google Scholar] [CrossRef]
  27. Chen, D.; Luo, M.; Ning, S.; Lan, J.; Peng, W.; Lu, Y.; Chan, T.; Tan, Y. Single-Atom Gold Isolated Onto Nanoporous MoSe2 for Boosting Electrochemical Nitrogen Reduction. Small 2022, 18, 2104043. [Google Scholar] [CrossRef]
Figure 1. (a) Schematic representation of the experimental setup and (b) our pressurized cell.
Energies 17 02963 g001
Figure 2. (a) Linear sweep voltammetry curves obtained at atmospheric pressure heating the cell at different temperatures. (b) Linear sweep voltammetry curves at 55 °C under different pressures.
Energies 17 02963 g002
Figure 3. (a) Chronoamperometry at different voltages under N2 5 bar at 55 °C. (b) Ammonia moles measured before and after the chronoamperometry voltage in N2. (c) Produced ammonia during chronoamperometry using 5 bar of N2 or Ar at 55 °C. (d) Net ammonia yield, calculated from the difference between ammonia produced using N2 and Ar.
Energies 17 02963 g003
Figure 4. (a) Produced ammonia as a function of temperature using a 5 bar N2 or Ar atmosphere. (b) Net ammonia yield, obtained by subtracting ammonia produced in Ar from that produced in N2.
Energies 17 02963 g004
Figure 5. (a) Produced ammonia as a function of temperature using a 1.5 bar N2 or Ar atmosphere. (b) Net ammonia yield, obtained by subtracting ammonia produced in Ar from that produced in N2.
Energies 17 02963 g005
Disclaimer/Publisher’s Note: The statements, opinions and data contained in all publications are solely those of the individual author(s) and contributor(s) and not of MDPI and/or the editor(s). MDPI and/or the editor(s) disclaim responsibility for any injury to people or property resulting from any ideas, methods, instructions or products referred to in the content.

