Article

Optimal Network Reconfiguration and Power Curtailment of Renewable Energy Sources to Eliminate Overloads of Power Lines

by
Paweł Pijarski
,
Candra Saigustia
,
Piotr Kacejko
*,
Adrian Belowski
and
Piotr Miller
Department of Power Engineering, Faculty of Electrical Engineering and Computer Science, Lublin University of Technology, Nadbystrzycka St. 38D, 20-618 Lublin, Poland
*
Author to whom correspondence should be addressed.
Energies 2024, 17(12), 2965; https://doi.org/10.3390/en17122965
Submission received: 31 May 2024 / Revised: 13 June 2024 / Accepted: 13 June 2024 / Published: 17 June 2024
(This article belongs to the Section F5: Artificial Intelligence and Smart Energy)

Abstract

:
The increasing number of renewable energy sources in power systems contributes to overloads of power lines in emergency situations. Lines made with relatively small cross-section cables, which in the past were designed for an operating temperature of 40 °C, are particularly exposed to overloads. Currently, they constitute the so-called “bottlenecks” in network capacity. This is manifested in the fact that when carrying out expert opinions aimed at examining the impact of a source on the network, computational analyses show overloads of its elements. This article proposes a methodology for eliminating these overloads. It involves the use of two methods at the same time, namely optimal network reconfiguration combined with minimisation of the total power curtailment in RE sources. The search for the optimal network configuration will also allow for minimising power curtailment in renewable energy sources, and thus reduce the costs of this type of operation. With such a tool, network operators will be able to achieve the effect of relieving the line load with the lowest possible cost of redistribution. Based on the IEEE 118 bus test network, calculations were performed that confirmed the effectiveness of the proposed approach. The operation of the proposed methodology is presented with the example of two selected network failure states. The novelty of the proposed solution lies in the simultaneous use of two methods of eliminating line overloads. This streamlines the entire process and improves its effectiveness.

1. Introduction

One of the challenges facing operators of high-voltage power grids saturated with renewable energy sources is eliminating existing overloads of power lines. Renewable energy (RE) sources have an increasing share in the total power balance the power systems. They are characterised by high dispersion and random generation, which is usually not correlated with peaks in power demand. This causes power flows of significant values from some areas towards others.
The specific operation of modern power systems is currently different from the conditions that existed a dozen or several dozen years ago. In the past, the function of distribution networks was practically only to deliver energy to consumers. These networks essentially performed a receiving function. Transmission networks, on the other hand, were used to transfer power from generators towards distribution networks or consumers powered by high voltage networks. With the development of dispersed generation (including mainly renewable energy), the number of these sources in the power grid increased rapidly. The level of dispersion has also increased. The advantages of this type of generation include, for example, reduced power losses, improved voltage conditions, lower environmental impact, and lower costs. In addition to the advantages, there were also some unfavourable phenomena, such as random generation in renewable energy sources, high uncertainty, periodic balance problems, possible voltage excesses and overloads of existing power lines and transformers. In networks containing lines made of relatively small cross-section cables, e.g., 120 mm2, 185 mm2 or even 240 mm2, designed for an operating temperature of 40 °C, periodic overloads of these elements may occur. This is particularly visible when carrying out expert opinions aimed at examining the impact of renewable energy sources on the power grid. During such analyses, it is necessary to take into account other sources that have already issued connection conditions and constitute the so-called generational background. Network operators use various calculation models in which they distinguish between the type of generation technology and the need to take into account sources with different generation factors in relation to their connection power when calculating. However, there are emergencies that result in line overloads. Sometimes there are several or a dozen overloads and their level varies. There are situations when the influence of the considered source is small, e.g., a few percent, or significant, a dozen, several dozen or even several hundred percent. When encountering such situations, current overloads should be eliminated as soon as possible. Since high and extra-high voltage networks have a grid structure (closed mesh), it is difficult to intuitively indicate an effective method or methodology that would eliminate all line overloads in any emergency. If one network element is turned off in an emergency, others may be overloaded. Power flows in emergency states sometimes differ significantly from those in normal conditions. As a result, some lines may become overloaded. The operator should immediately decide what countermeasure will be used to eliminate the resulting overloads. Currently, there are no appropriate methods to effectively deal with such situations. It is therefore necessary to search for and use advanced methods that will be able to effectively solve this problem not only during analysis but also in practice. To meet these expectations, the authors of this article proposed a methodology that is a combination of two methods, i.e., optimal reconfiguration of network operation and minimal power curtailment in selected RE sources. Using this approach, it will be possible to achieve the effect of relieving the line while minimising the costs associated with the necessary redistribution of power in RESs. A modified IEEE 118 bus test network was selected for calculations. Based on the selected emergency operating states of this network, appropriate calculations were made to demonstrate the effectiveness and efficiency of the proposed methodology.
The main goal of this article is to present a method for effectively eliminating power line congestions. In addition to the main goal, there are also specific goals, such as identifying the types of analyses in which the proposed solution will work best, identifying sources responsible for overloads and minimising the costs associated with power redistribution. Therefore, the authors tried to make the problems discussed multidimensional and the way of solving them effective and efficient.
This article consists of six points. The first one presents the problem under consideration. The second contains a literature review. The third section describes the proposed methodology. The fourth point contains a description of the test network. The fifth section presents the results of the obtained calculations and discussion. The sixth part contains conclusions and a summary.

2. Literature Review

The subject of this article is issues related to optimal network reconfiguration and power reduction in renewable energy sources, and it is aimed at eliminating overloads appearing in power lines. Overloads of existing power lines and transformers are a common phenomenon occurring as a result of the increasing number of renewable energy sources connected to the grid [1].
In the literature, there are attempts to solve this problem, and more and more often there is talk about the so-called congestion management, redispatching and curtailment power in RESs [2,3,4,5,6,7,8,9,10,11,12]. Another option to eliminate emerging overloads is to redistribute power. However, this is an undesirable activity for network operators, because any curtailment in power in RE sources requires them to incur quite significant costs. The possibility of redistributing power was introduced in 2019 as a result of a regulation of the European Parliament and the EU Council [13].
Various methods are used to analyse the problem with overloads, such as tracking power flows [14,15], classical or metaheuristic optimisation [16,17,18,19], and a hybrid combination of optimisation with machine learning [20,21]. The literature also includes the use of fuzzy logic and expert systems [22,23,24], as well as other modern methods [25].
Eliminating overloads appearing in power lines by redistributing the power of RE sources can be found in the literature in items [6,26,27,28,29,30,31,32,33,34,35,36,37,38]. For example, in [26], Fan and Huang proposed the use of the redispatch strategy to compensate the generation of renewable sources based on historical data. They checked the effectiveness of their proposed method through tests on a 39-node IEEE closed mesh. In [27], the authors proposed a method for the optimal selection of sources whose power is to be limited, and also proposed the use of the PSO algorithm to minimise deviations in the planned generator power. The effectiveness of the proposed method was also tested on a 39-node and 118-node test network. In [29], the authors used a novel metaheuristic Flower Pollination Algorithm (FPA) method to redistribute power to avoid line overload for optimal power limiting in RE sources. In [33], Verma and Mukherjee used the ant lion optimiser (ALO) algorithm for this purpose, and in [34], the Black Hole Algorithm (BHA) was used. The metaheuristic optimisation method was also used by Tapre, Singh and Paraskar using the Lion Algorithm (LA) [36,37]. In [6], for this purpose, Venkaiah and Kumar proposed a method based on Fuzzy Adaptive Bacterial Foraging (FABF), and tested their algorithm on a 30-node IEEE test network and on a real 75-node Indian system.
An interesting method of eliminating the occurrence of current overshoots is described in [14,15,39,40,41]. For this purpose, Liu and his team [14] and Jiandong with his team [15] used the method of tracking active power flows, as a result of which they appropriately reduced the generation of RE sources. In the works [39,40,41], a method based on sensitivity analysis and power flow was used. However, in [42], Liu and his team proposed the use of a method that involves reducing overloads by taking into account generation variability.
As mentioned earlier, congestion management plays an important role. The approach to congestion management is based on issuing commands by the system operator [43,44]. These commands may be based, among other things, on the need to use optimisation methods [16,17,18,45,46].
For example, in [45], Shandilya and his team proposed the use of optimisation to change the generation schedule and load shedding in order to alleviate existing line congestion, and they tested their proposed method, among others, on the 118-node IEEE test network. Abrantes and his team used nonlinear optimisation in [17,18]. In [16], the metaheuristic teaching–learning-based optimisation (TLBO) method was used. Verma tested the operation of her proposed method on two IEEE test systems, on a 30-node system and on a 57-node system, respectively. Balarman and his team used the metaheuristic Particle Swarm Optimisation (PSO) method [46]. Metaheuristic methods are used more and more often due to the very good ratio of their effectiveness to the simplicity of implementation. Various objective functions are used to eliminate overloads, such as maximising the total power generated by RESs [47,48] and minimising the power curtailment from such sources [49,50,51].
The role the distribution network must play is to provide reliable and stable power supply to the end user [52,53,54]. Network reconfiguration is a method that can play an important role in improving the operational reliability of the power system, and can also contribute to the safe operation of the system with a high degree of RES saturation [55,56,57], and it is also able to maintain permissible voltage values [58,59,60]. For example, in [60] Yoshida and his team used the PSO method in their work. Network reconfiguration is presented, among others, in [61,62], where, for example, in [61] the authors, including Jin and his team, propose a multi-level method of relieving the transmission network by using an active distribution network (ADN). When an overload occurs in the transmission network, an appropriate operational scheme for ADN is selected using a multi-level method. The ADN then assumes the appropriate operational state through reconfiguration and thus contributes to alleviating the existing congestion in the transmission network. In [62] Wang, Kang and Yang also focused on the transmission network, and in their work they proposed an optimisation scheme for the reconfiguration of the network topology in order to reduce power losses that occur when limiting RE sources. For the optimal reconfiguration of the network, Granelli and his team used, among others, the Genetic Algorithm [63].
The reconfiguration of a network operating in a closed system can be found in the works [64,65,66,67,68,69,70]. In [65], Li and his team proposed a loop reconfiguration optimisation model to reduce line congestion. In [66], changing the network topology was used to mitigate power system failure states. The authors proposed a method of sequential switching of lines depending on their impact on alleviating congestion. They checked the effectiveness of their method on two test systems, namely on the 24-node and 118-node IEEE closed test network. Shao and Vittal [67] also focused on the order of switches performed. They developed an algorithm to find the best line and busbar switching actions to alleviate congestion. They checked the results of their simulation on the 179-node WECC test network, and the results obtained show that this method can be successfully used to relieve line load. Ref. [68] presents an algorithm aimed at switching lines in order to reduce the overload that occurs as a result of line failure. Arya tested the proposed model on a 25-node test network. Also, in [69], Arya and team focused on alleviating the overloads that occur as a result of the disappearance of one of the lines. In [71], the decision to reconfigure the network is made based on an analysis of the N-1 criterion. Saharuddin and his team tested the effectiveness of their method on a 118-node IEEE network.
To sum up, there is a constant need to look for new methods to eliminate overloads occurring in the power system at the lowest possible costs for the operators and users. Occurring threats and dangers require a quick response to eliminate them. Taking all these aspects into account, it is reasonable to use more and more advanced methods and develop them in order to search for more and more optimal solutions to emerging problems. Table 1 presents a comparative summary of the advantages and disadvantages of the methods described in selected literature items.

3. Calculation Methodology

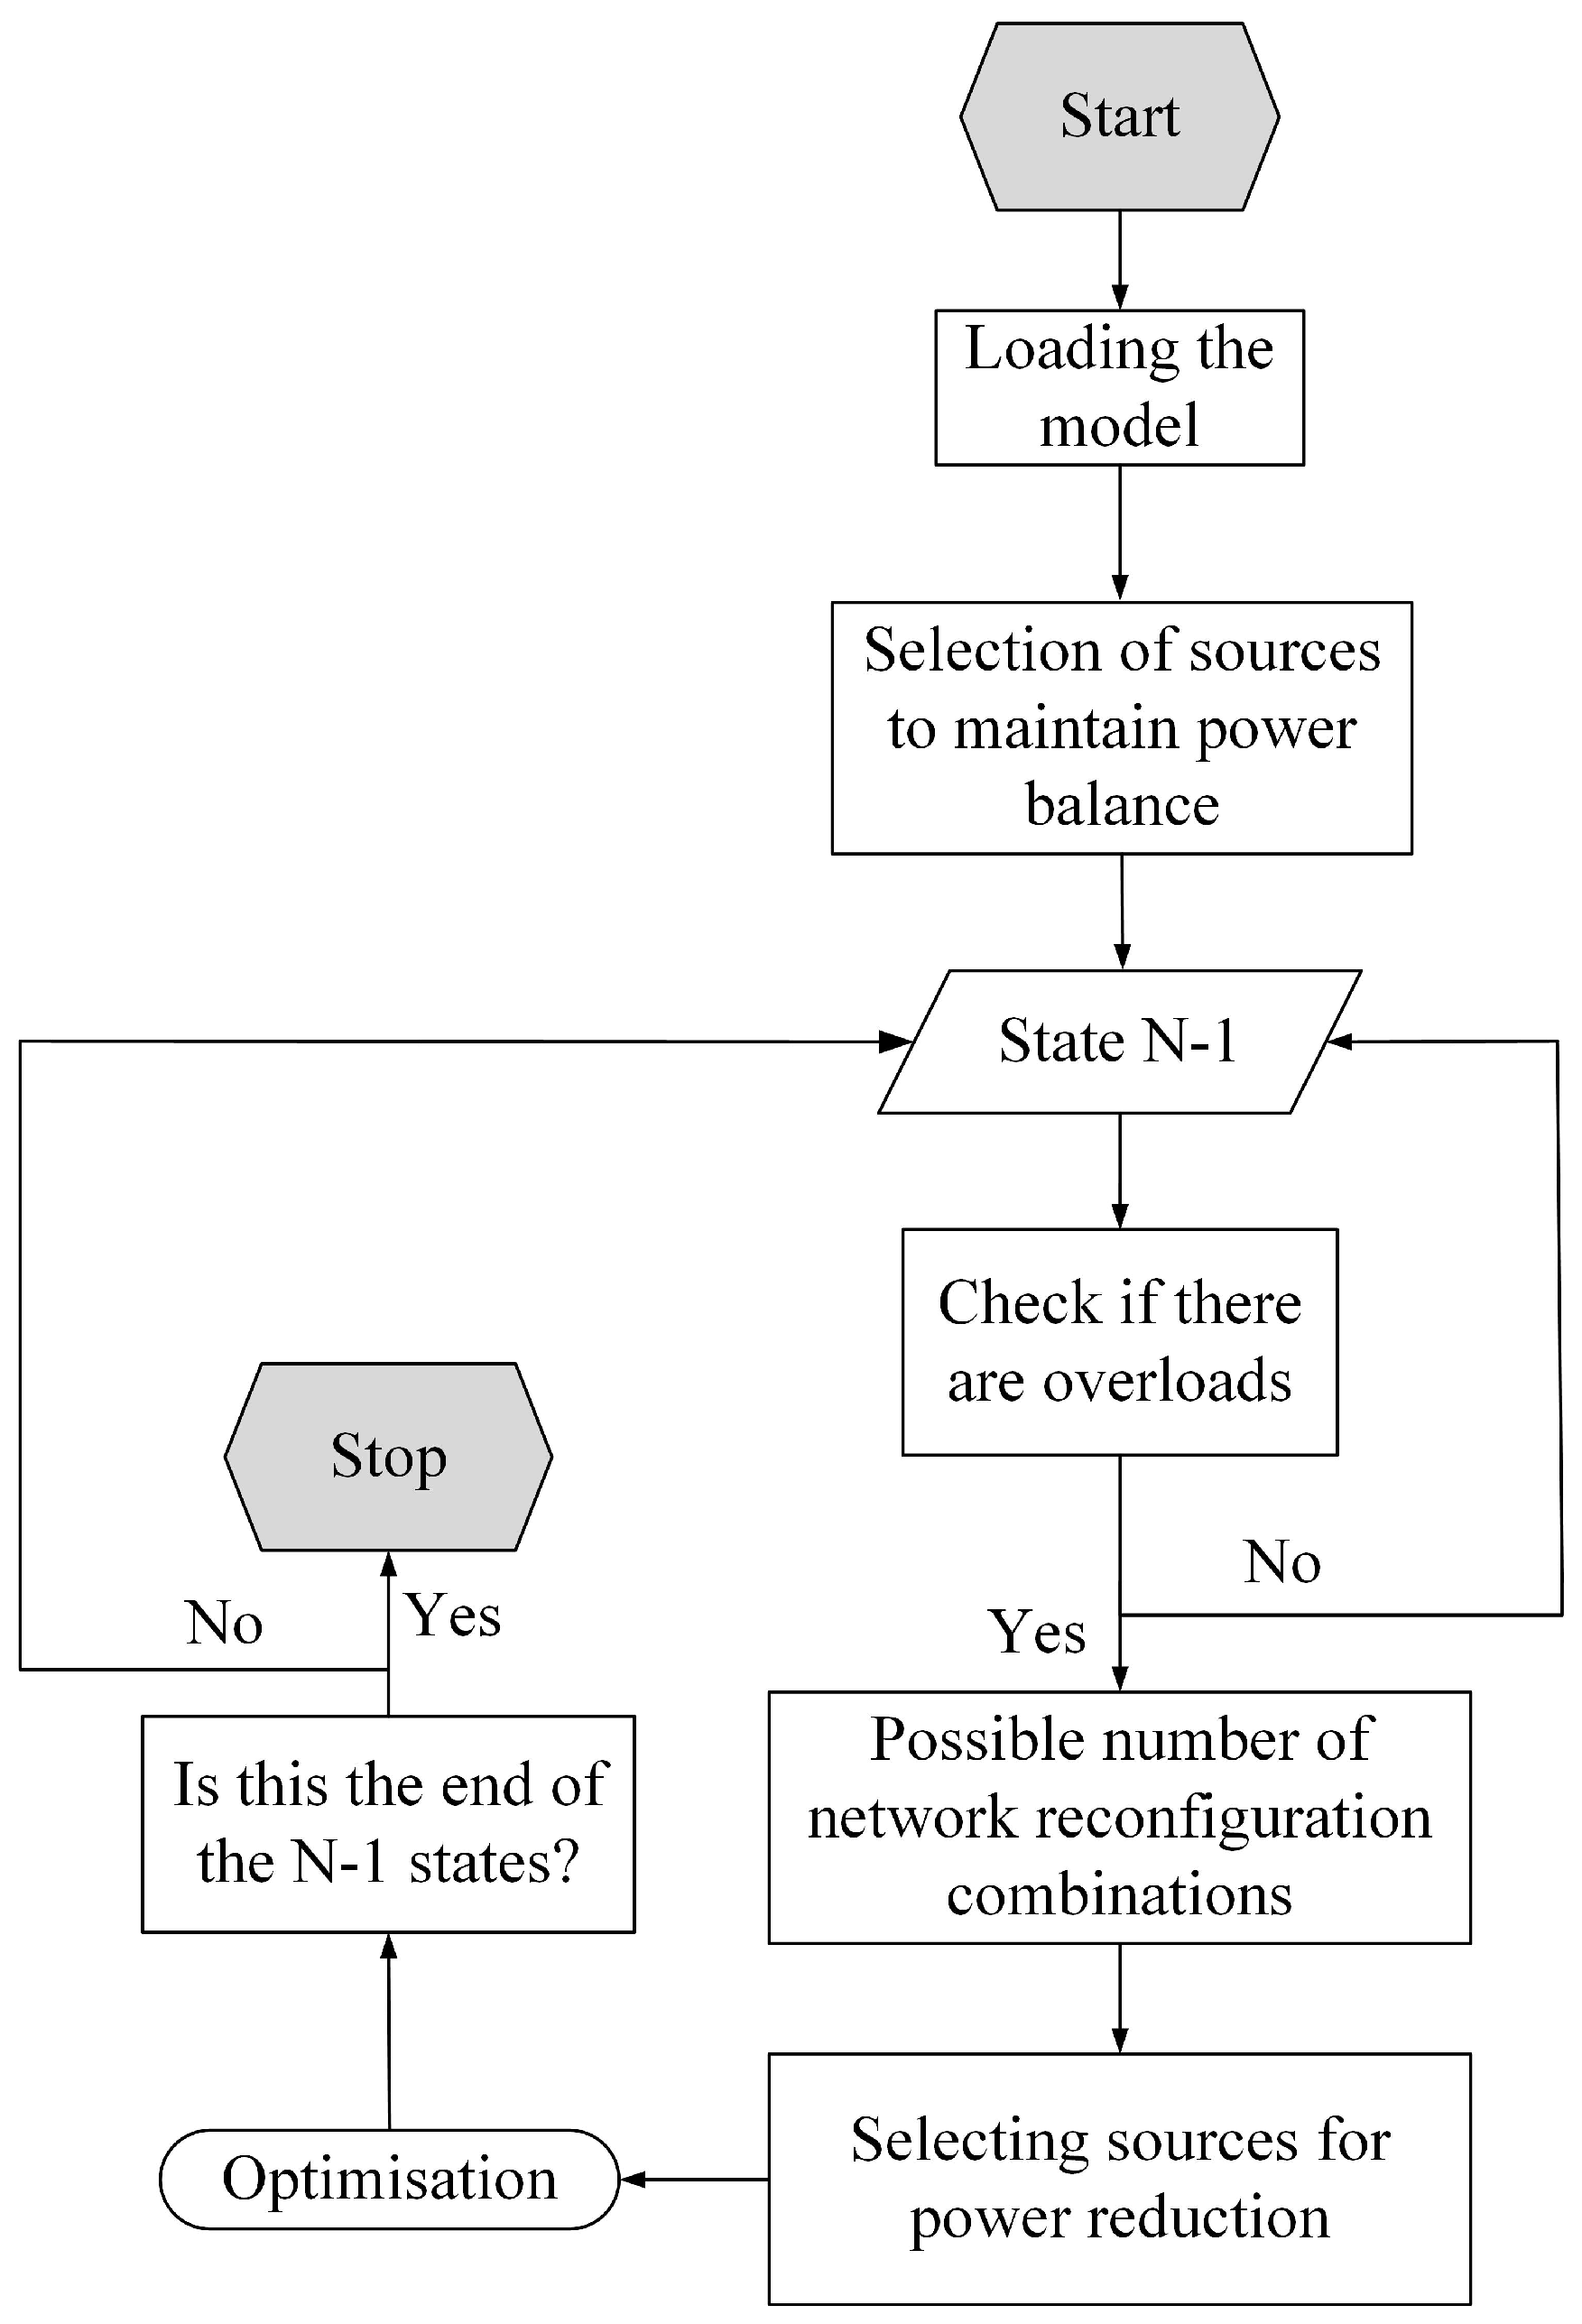
3.1. General Description

High-voltage power networks usually operate in a closed configuration (Figure 1). If a line is overloaded, the operator should take appropriate steps to relieve it. One way to relieve the line load may be a minimal power curtailment in the sources that are responsible for their occurrence. Therefore, this action consists in the so-called redistributing (or redispatching) of power generation in RESs and conventional sources ensuring the meeting of the power balance condition. This topic was considered by the authors, e.g., in [1]. In practice, however, the power curtailment in RESs should be minimal, so other methods should be sought that will allow for even smaller power curtailments in RESs. The solution may be based on the change of the structure of the network by disconnecting an appropriate number of lines or connectors located in switchboards (system connectors). These actions change the network configuration. Some overloaded lines may respond relatively poorly to changes in the level of power generated in selected network sources. This may be due to their specific location in the power system topology. Relieving the load on these lines may sometimes require a significant curtailment in generation in RESs. In such a case, it becomes necessary to use more ad hoc methods, e.g., turning off lines or system switches. To further increase the effectiveness of the line relief process, both methods (i.e., power curtailment in RESs and changing the network configuration) can be combined. Figure 1 shows a schematic diagram of a high-voltage network operating in a closed configuration. Overloaded lines are marked in red. The sources responsible for line overloads are marked in blue. Blue marks the lines that should be turned off so that the load shedding process is effective with minimal power curtailment in RESs.
The proposed methodology consists in searching for the optimal network operation configuration in such a way that the power limitation in RESs is minimal. A block diagram of the proposed methodology is shown in Figure 2. First, the computational model of the network is loaded. Sources responsible for fulfilling the power balance are selected. They are for the main conventional source. Then contingency analysis (N-1 states) is performed. This analysis involves switching off subsequent branches and checking whether there are any overloads. In a given emergency state (one element switched off), overloaded lines are identified. If overloads do not occur, the next failure state is analysed, i.e., another shutdown. If overloads occur, the number of possible outages of k lines out of all n lines is determined. The number of possible switchings is determined as a combination with repetitions. Then, the sources responsible for line overloads and at the same time subject to the process of power redistribution are selected. In the next step, optimisation calculations are performed using the selected metaheuristic method. This process is repeated until the N-1 states are exhausted.
The following sections briefly describe the AIG algorithm, the optimisation issue and the computational programs used.

3.2. Description of the AIG Algorithm

In this article, as part of the metaheuristic method, the Algorithm of the Innovative Gunner (AIG) [74], created by the authors of this article, was used. The use of a metaheuristic algorithm results from the specific nature of the optimisation task. During the calculation process, the task of determining power flows is solved, which includes non-linear equations. A divergent iterative process may occur during the computation. The objective function, described by Equation (4), contains two criteria characterised by the fact that the decision variables are both integer (number of switched off lines) and continuous (power generated in RESs). Charting the objective function on a three-dimensional graph is a difficult task due to the nature of the process of determining power flows and the different nature of decision variables. It is therefore difficult to say whether this function has one optimum or more. Taking this into account, classical methods are not suitable for this type of issue. For this reason, it was decided to use the metaheuristic method.
The operation of the AIG algorithm is briefly described below. This algorithm is distinguished by the fact that the method of generating new solutions in subsequent iterations (k + 1) is based on the relationship [74]:
x l k + 1 = x l k g l ξ
The AIG algorithm proposes the function g l ξ = g l 1 ξ 1 g l 2 ξ 2 g l p ξ p . Two multipliers were assumed (p = 2). This means that the next solution depends on the product of two functions gl1 and gl2, which have the same specific form:
x l k + 1 = x l k g l 1 ξ 1 g l 2 ξ 2
where x l k + 1 means new solution, x l k means the solution from the previous iteration, k means the iteration number, l means the number of the next solution vector taken from the considered population (the size of the population should be assumed at the beginning of the calculations), g l 1 ξ 1 = cos α , when α < 0 and g l 1 ξ 1 = ( cos α ) 1 , when α > 0 and g l 2 ξ 2 = cos β , when β < 0 and g l 2 ξ 2 = ( cos β ) 1 , when β > 0, α and β are correction angles drawn from the variable interval α max , α max and β max , β max using the normal distribution. The values of the angles αmax and βmax should be taken at the beginning of the calculations (the default value is 90°).
This method of generating subsequent solutions involves multiplicative modifications of solutions from previous iterations.
In most algorithms found in the literature (e.g., [75,76,77,78,79]), generating subsequent solutions involves an additive modification of the previous solution, according to the relationship:
x l k + 1 = x l k + Δ x l k
where Δ x l k is a general, symbolic designation of the modification of the next solution, appropriate for a given metaheuristic algorithm.
The operation of the AIG algorithm consists in creating new solutions in subsequent iterations, according to relationship (2), and then searching for the minimum of the objective function, described in the next section. Figure 3 shows the flow of the AIG algorithm.
The analyses performed in the works [74,80,81,82] prove the high effectiveness of the AIG algorithm. This algorithm was tested using objective functions from various scientific fields, e.g., mathematics, mechanics, electrical power engineering. The results obtained during test calculations allow us to claim that this algorithm can be successfully used to solve difficult problems occurring in the power system.

3.3. Description of the Optimisation Task

The optimisation problem under consideration is classified as a Special Optimal Power Flow (SOPF) type of task due to the form of the objective function Fobj, which includes two criteria taking into account the power curtailment in RESs and the change in network configuration:
F obj x = w 1 F 1 + w 2 F 2
The individual criterion functions F1 and F2 are described by the following relationships:
F 1 x = j = 1 N P G j j = 1 N P G max j
F 2 x = 1 j = 1 z l j z
An optimisation task that can be written in the form:
F obj x max
consists in searching for a vector x that provides the maximum of the function Fobj, with equality constraints g(x, y, z) = 0 and inequality constraints h(x, y, z) = 0, where:
x = [PG1,…, PGj, l1,… lj]—vector of active powers generated by the considered RES sources, for which the sum of powers is to be maximum and the number of outages, i.e., the number of operations related to the network reconfigurations configuration (vector of variables decision-making);
y = [PL1,…, PLi, QL1,…, QLi, PGn1,…, PGnn]—vector of loads and generated powers not subject to control (vector of independent variables);
z = [U1,…, Ui, δ1,…, δi, PGr1,…, PGrk]—vector of phasors of nodal voltages and power generated in nodes ensuring system balancing (vector of dependent variables);
w1, w2—weights whose values were assumed at the level (w1 = 1.0, w2 = 0), (w1 = 0.9, w2 = 0.1), (w1 = 0.8, w2 = 0.2), (w1 = 0.1, w2 = 0.9), which is explained later;
N—number of RESs where power curtailment is taken into account;
z—number of possible outages in the network (the article assumes that z = 4, which is consistent with the operators’ practice);
lj—number of different lines switched off in a given iteration.
The limitations in the optimisation process are:
  • Limitations of the vector of decision variables x, which are the minimum and maximum values of power generated in RESs and a finite number of possible cases of network configuration changes;
  • Limitations of the vector of dependent variables z, which are the permissible voltage values in the network nodes;
  • Equality constraints, which constitute the nodal power flow equations and the need to meet the power balance in the network;
  • Inequality equations that constitute the permissible capacities of power lines and transformers, as well as the value of exchange power with neighboring areas.
As mentioned earlier, the objective function is maximised. This means that a state is sought in which the total power re-education in RESs and the number of on/off operations will be minimal. It may turn out that eliminating existing branch overloads will be possible by reducing the power in the RESs and using various operational activities, but with a different number of changes, enabling the selected network configuration to be achieved. Therefore, the expected effect of this method is to find a real and practically applicable solution that will require minimum power limitation in the RESs and a minimum number of changes in the network (minimum number of branches switched off).
In each computational state of the optimisation process, the load flow (LF) task is solved using the Newton–Raphson method in order to clearly determine the values of the components of the vector of dependent variables z, i.e., the values of voltage modules and their angles. This is done in accordance with the general power flow equation:
0 = f LF ( x , y , z )
In general, it can be said that the power balance should be met in each node of the network.

3.4. Description of the Environment and Organisation of the Computational Process
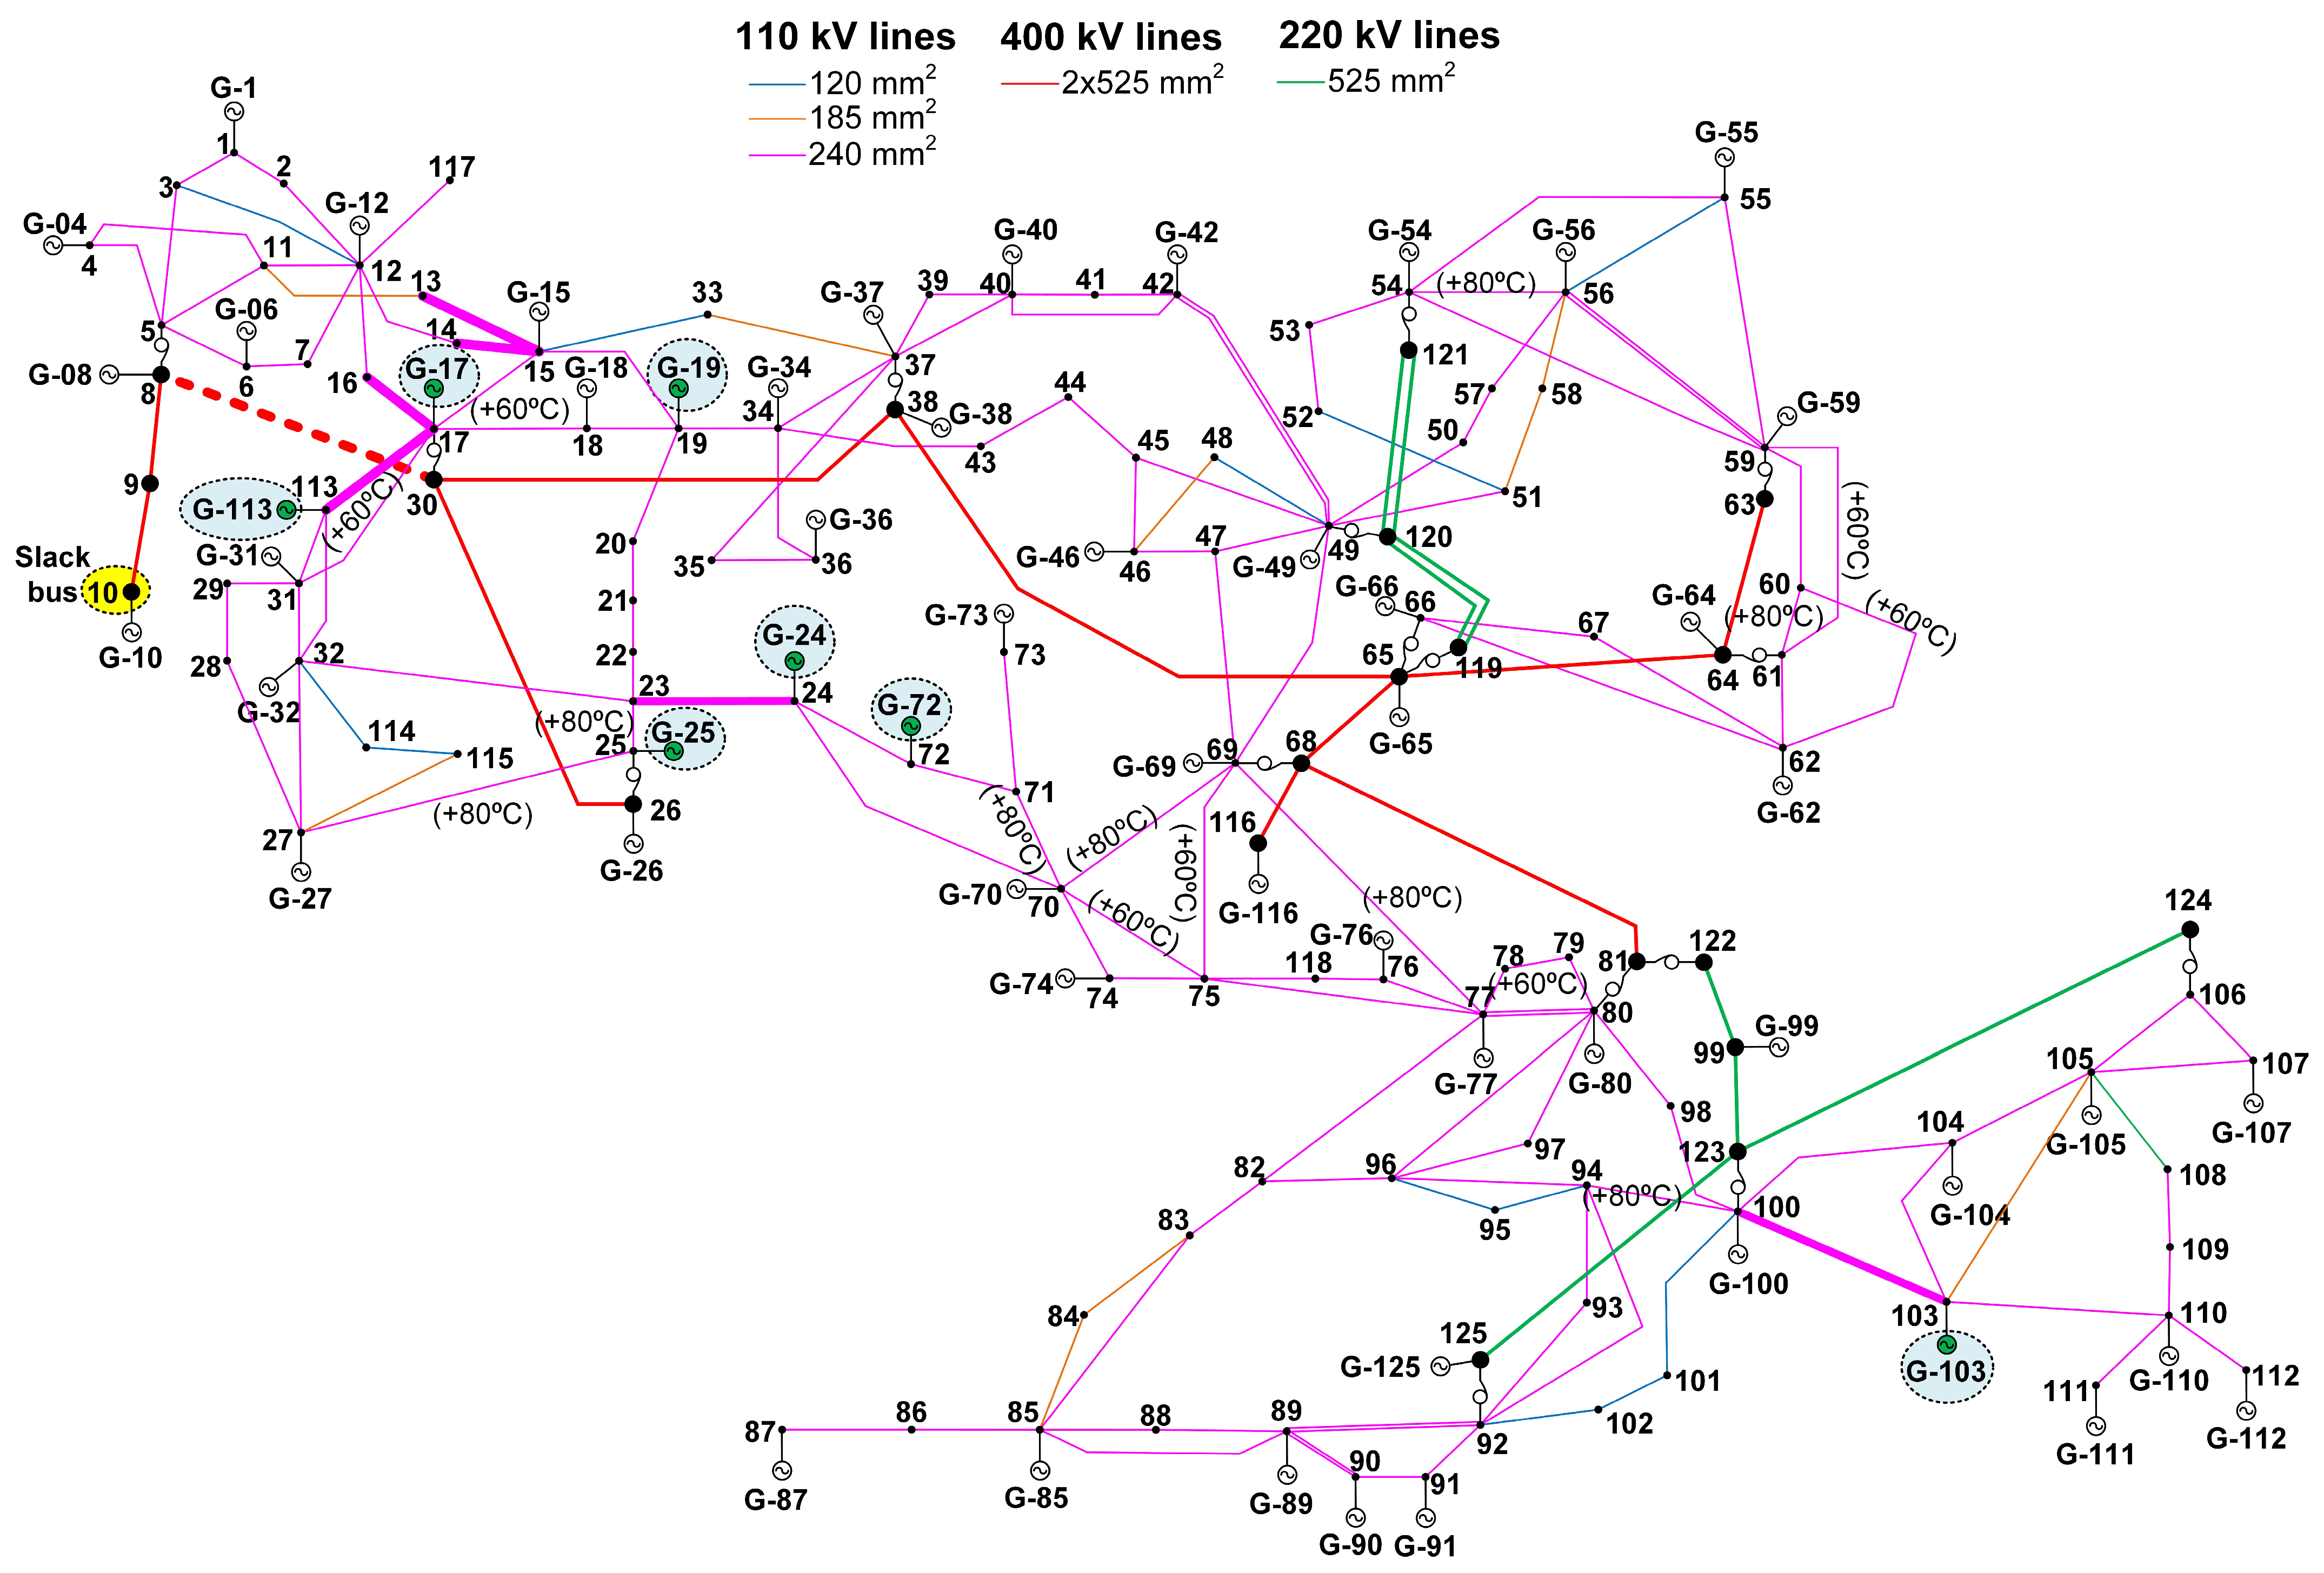
Calculations were performed using PowerWorld Simulator Version 22 and Matlab Version 2023R. The PowerWorld Simulator program is used to determine power flows. It also includes the SimAuto add-on, which allows remote connection to external applications, e.g., Matlab, in order to change the parameters of individual network elements (e.g., power values generated in RESs, turning off lines) or download power flow results (e.g., current values in lines, voltage values at nodes, etc.). The Matlab program allows one to create a script enabling one to solve the optimisation problem in question and use various mathematical functions contained in many toolboxes. The main script was written in Matlab. This script contains both an optimisation module and a module that makes it possible to connect to the PowerWorld program to exchange information on power flow results and optimisation results. Flow calculations are performed in PowerWorld Simulator, and optimisation calculations are performed in Matlab. During the optimisation process, appropriate data are exchanged between these applications in order to find the optimal value of the objective function described by the relationship (4). Figure 4 shows a block diagram of the computational process.
Using the possibility of combining two programs with each other significantly improves and speeds up obtaining results. The user can then focus only on the issue at hand and not on additional activities, such as creating software to determine power flows or creating their own mathematical functions.

4. Test Network

For calculations, a modified IEEE 118 bus test network [83] was used, which is presented in Figure 5. The basic IEEE network was modified in order to adapt its parameters to the parameters of networks operating in Poland. The voltage levels were adjusted to 400 kV, 220 kV and 110 kV, the number of generators was limited, and the cross-sections and load capacities of the line wires were changed (Table 2). The total network load value was adjusted to the load that occurs in the Polish power system.
In the presented network, there are 11 lines with a voltage of 400 kV marked in red in Figure 5 with a total length of 575 km, 8 lines with a voltage of 220 kV marked in green and a total length of 386 km, as well as 159 lines with a voltage of 110 kV and a total length of 3153 km. Most of the lines shown in Figure 5 were designed for a temperature of 40 °C. Some of them are adapted to higher temperatures, i.e., 60 °C or up to 80 °C. The load capacity of the line divided into wire cross-sections in winter and summer is presented in Table 1. The test network shown in Figure 5, after the described modification, corresponds to the specific operation of the network in Poland in terms of structure, load, voltage levels and length of line sections. On its basis, one of the problems that occurs in reality is described, namely overloading of power lines as a result of possible emergency states in a high-voltage power grid saturated with RES sources.

5. Calculations

The calculations considered two different emergency states in which several power lines were overloaded. The analysis of calculation cases is presented in Section 5.1 and Section 5.2.

5.1. First State of Emergency

In the first state of emergency, the 400 kV line between node 8 and node 30 was switched off as a result of the failure (marked with a dashed line in Figure 6). The considered computational scheme is shown in Figure 6.
After the 400 kV line was switched off, the following 110 kV lines were overloaded (marked with bold lines in Figure 6):
  • Between node 16 and node 17 by 36% above the permissible load capacity;
  • Between node 100 and node 103 by 35% above the permissible load capacity;
  • Between node 17 and node 113 by 26% above the permissible load capacity;
  • Between node 23 and node 24 by 10% above the permissible load capacity;
  • Between node 14 and node 15 by 4% above the permissible load capacity;
  • Between node 13 and node 15 by 3% above the permissible load capacity.
The lines mentioned are overloaded to varying degrees, from several to several dozen percent. Network operators in Poland believe that even a few percent line overload is significant and should be eliminated. It should also be noted that the indicated lines are located in different areas of the analysed IEEE-118 bus test network, which makes it much more difficult to eliminate their overloads. As part of the preliminary calculations, those sources were selected that were most responsible for the line overload. For this purpose, the method of tracking active power flows was used, which allows to determine those sources on which the load of overloaded lines depends most. These sources are detailed in Figure 6. They are connected at 110 kV nodes (G-24, G-72, G-19, G-17, G-25, G-113, G-103). The authors described this methodology, among others, in [1]; therefore, it will not be described in this article. The power generated in these sources, before optimisation, is presented in Table 3.
According to Equation (5), the number of sources N included in the optimisation task is 7. According to Equation (6), the maximum number of branches z, which can be turned off in the considered network state, included in the optimisation task is 4. The number of all network branches is 178. Excluding radial lines, transmission lines and lines turned off in an emergency state from this set, the total number of lines that can be turned off is 154. The number of possible combinations with repetitions for turning off 4 lines out of 154 can be determined from the following relationship:
C ¯ n k = ( n + k 1 ) ! k ! ( n 1 ) ! = 154 ! 4 ! ( 154 4 ) ! = 24,359,335
To sum up, the optimisation problem under consideration is characterised by the presence of continuous (7) and integer (4) decision variables. In the optimisation calculations, values of active power in the sources were sought to ensure that the limitations on their generation were as small as possible. By limiting the power in the RESs, it was necessary to increase the generation in the sources responsible for the power balance in the network. The sources that were responsible for meeting the power balance conditions were G-08, G-100, G-26, G125, G-65, G-64, G-38, G-99, G-49, G-59 and G-116. Power is distributed to individual sources in relation to their maximum values.
Three calculation cases were considered as part of the calculations:
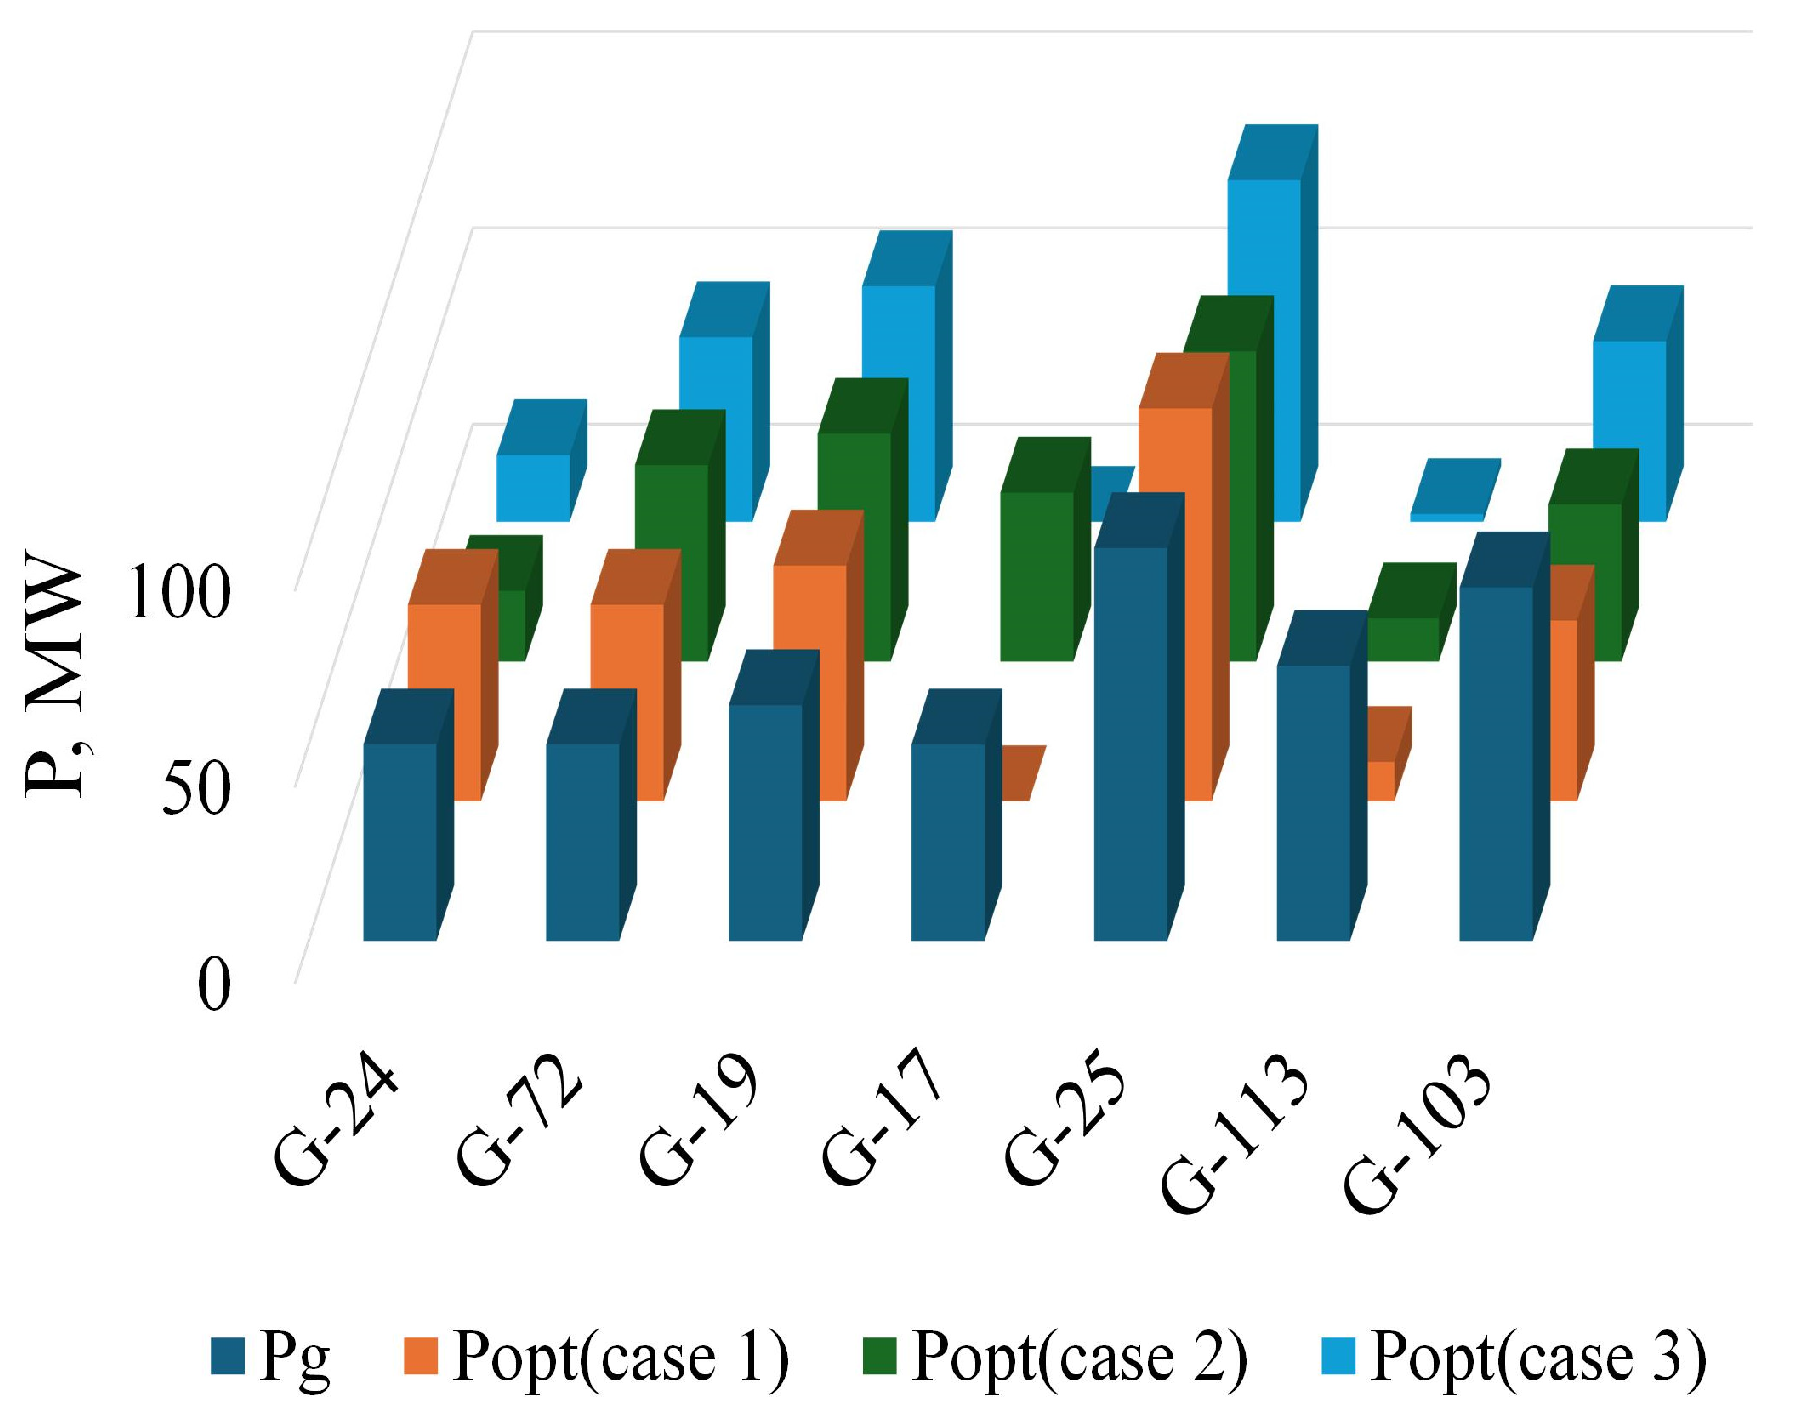
  • Case 1—the weights w1 and w2, appearing in Equation (4), were set at the level w1 = 1 and w2 = 0, respectively. This means that only the minimisation of power limitations in RES plays an important role. However, the number of switched off branches (maximum 4) does not matter, because the term at F2 is then equal to zero.
  • Case 2—weights w1 and w2, appearing in Equation (4), were set at the level w1 = 0.9 and w2 = 0.1, respectively. This means that both minimising power constraints in the RES and the number of switched off branches play an important role.
  • Case 3—weights w1 and w2, appearing in Equation (4), were set at w1 = 0.8 and w2 = 0.2, respectively. This also means that both the minimisation of power constraints in the RES and the number of switched off branches play an important role, with the weight value w2 increased and w1 decreased.
In the first calculation case (case 1), it turns out that the number of switched off branches is 4. These are 110 kV lines between nodes 11–12, 34–43, 23–32 and 25–27. The power in RES after optimisation is presented in Table 4.
In the second calculation case (case 2), it turns out that the number of switched off branches is 2. These are 110 kV lines between nodes 4–11 and 11–12. The power in RES after optimisation is presented in Table 5.
In the third computational case (case 3), it turns out that the number of switched off branches is 0. The power in RES after optimisation is presented in Table 6.
The assumed weight values correspond to various situations, but by changing the weight w2 to 0.2 or higher, the calculation results indicated the number of excluded branches was equal to zero. This means that only power maximisation in RESs was taken into account (with no switched off lines). The results differed only at lower values of weight w2 and higher values of weight w1. If only function F2 is taken into account as the objective function, then there is no solution. This means that changing the network structure is not sufficient to eliminate line congestion. Therefore, the search for the number of switched off branches should be combined with power curtailment in the RES. If the weights w1 and w2 take the value w1 = 0 and w2 = 1.0, respectively, then the result is the number of switched off branches equal to zero, but this does not mean a minimal curtailment in the power generated in RESs. Therefore, the value of the weight w1 should be different from zero.
Figure 7 shows the optimal values of power generated in RESs for individual calculation cases (case 1, case 2, case 3).
Figure 8 shows the values of power limited in RESs for individual calculation cases (case 1, case 2, case 3).
In case 1 and case 2, in addition to limiting the power in the sources, the optimisation also results in a different number of switched off 110 kV lines. It should be noted that, depending on the weight values, either four lines (case 1) or two (case 2) are switched off. It is worth pointing out that the line 11–12 was indicated in both cases.
In case 3, due to the dominant role of the objective function F1 (formula (4)), the optimisation result is only limited power in RESs. No line is switched off in this case.
Figure 9 shows the course of the best values of the objective function (in individual iterations) for the considered computational cases (case 1, case 2, case 3).
Based on Figure 9, it can be seen that despite the very large number of possible solutions, the algorithm finds a solution after approximately 3000 iterations.

5.2. Second State of Emergency

In the second state of emergency, the 400 kV line between node 38 and node 30 was switched off as a result of failure (marked with a dashed line in Figure 10). The considered computational scheme is shown in Figure 10.
After the 400 kV line between node 38 and node 30 was switched off, the following 110 kV lines were overloaded (marked with bold lines in Figure 10):
  • Between node 23 and node 24 by 55% above the permissible load capacity;
  • Between node 17 and node 113 by 21% above the permissible load capacity;
  • Between node 33 and node 37 by 19% above the permissible load capacity;
  • Between node 15 and node 33 by 8% above the permissible load capacity;
  • Between node 94 and node 95 by 8% above the permissible load capacity.
Using the power flow tracking method, the sources responsible for line overloads were identified. These sources are marked in Figure 10. They are connected at nodes 110 kV (G-24, G-72, G-37, G-113, G-103). As in the previous emergency state, the sources that were responsible for meeting the power balance were G-08, G-100, G-26, G125, G-65, G-64, G-38, G-99, G-49, G-59 and G-116.
Two cases were considered as part of the calculations:
  • Case 1—weights w1 and w2, appearing in Equation (4), were set at w1 = 0.9 and w2 = 0.1, respectively. This means that both the minimisation of power limitations in the RES and the number of switched off branches play an important role.
  • Case 2—weights w1 and w2, appearing in Equation (4), were set at w1 = 0.1 and w2 = 0.9. This also means that both the minimisation of power constraints in the RES and the number of switched off branches play an important role.
In the first calculation case (case 1), it turns out that the number of switched off branches is equal to 4. These are 110 kV lines between nodes 15–33, 24–72, 24–70 and 94–100. The power in RES after optimisation is presented in Table 7.
In the second calculation case (case 2), it turns out that the number of disabled branches is 1. These are 110 kV lines between node 40 and node 42. The power in RES after optimisation is presented in Table 8.
The assumed weight values for individual criteria result from the fact that taking into account only one criterion does not eliminate line overloading. If only network re-configuration is used, overloads on all lines cannot be eliminated. The situation is similar when only power redistribution is used. In order for overloads to be effectively eliminated, both reconfiguration and power limiting must be applied to the RES. In case 1 and case 2, in addition to limiting the power in the sources, the optimisation also results in a different number of disabled 110 kV lines. It is worth noting that no line is repeated.
Figure 11 shows the course of the best values of the objective function (in individual iterations) for the considered computational cases (case 1, case 2).
Based on Figure 11, it can be seen that despite the very large number of possible solutions, the algorithm finds a solution after approximately 3000 iterations.
The duration of the calculations depends on the number of decision variables, the number of iterations, the size of the population, the size of the analysed network model and the computing capabilities of the computer. In the first approach, the assumed number of algorithm iterations was 10,000 and the population size was 16 (twice the number of decision variables). This gives a total of 160,000 possible results. However, it turned out that the algorithm finds a solution faster, i.e., after about 3000 iterations. Therefore, in the final version it was assumed that the maximum number of iterations will be 5000 and the population size will be 16. The time to obtain the result in the case of the IEEE 118 bus network is on average about one hour. Therefore, it is reasonable to look for other methods that will significantly shorten this time and enable the proposed methodology to be used online. The calculations were performed on a computer with a 13th Gen Intel Core i9 3.0 GHz processor, 64 GB RAM.
The most important conclusions from the analyses performed are as follows:
  • The combination of two different activities, such as network reconfiguration and redistribution of source power, allows for reduced power reduction in renewable energy sources. Smaller reduction of power in renewable energy sources means smaller financial compensation for investors resulting from redistribution. From the point of view of both network operators and investors, this is very beneficial.
  • The use of optimisation (especially metaheuristic) increases the efficiency of the entire computational process.
  • The use of an original, two-criteria objective function allows for flexible change of the meaning/importance of individual criteria. Depending on which action is important for the operator, the weight values may be changed accordingly.
  • The number of possible network configurations and the method of indicating sources responsible for line overloads can be freely changed.
  • Searching for new methods of eliminating line overloads and their implementation in practice contributes to avoiding overdimensioning of the network.
  • The proposed method can be activated as a result of network development and using power to connect new sources to the power grid.
In general, it can be said that the more possibilities of network reconfiguration there are, the smaller the total power limitation in RES. Each calculation case is different. This means that each emergency condition must be considered individually. Weights should be selected depending on the importance of a given criterion. The proposed method can be used when examining the impact of RES on the power grid.

6. Conclusions

The problem of congestion of high-voltage power lines appears especially in those networks in which large numbers and significant total power are planned to be connected. This article proposes a method for eliminating these overloads by simultaneously limiting the power in RESs and changing the network configuration. Both the curtailment of power generated in RESs and the change of network configuration are used in practice. Using these methods, the operator can deal with problems related to line overloads and maintaining power balance in the power grid. Optimal use of these methods allows for even greater effectiveness in practice. With such a tool, the grid operator will be able to constantly monitor the network operation and eliminate the previously mentioned problems with minimal power curtailment of RESs. This will also translate into minimising the costs of power redistribution
The novelty of this article is the method used for solving the problem of congestions caused by RES generation. The method combines two types of variables in the optimisation process. Therefore, the congestion reduction method can be defined as a multi-criteria method. This allows us to maximise the total power generated in the RESs selected for optimisation, while changing the network configuration. The power flow tracking method was used to identify sources responsible for line overloads. The combination of several advanced mathematical methods made it possible to solve one of the important problems of modern power engineering.
The article shows that classical methods and optimisation should rather be used when planning the development of the power system or when examining the impact of new sources on the power grid. The computation time is then of no importance. If we take emergency situations into account, methods should be used that will allow for quick response and immediate removal of the threat (eliminating line overloads). Therefore, it is necessary to look for other methods that will significantly shorten the time to obtain a solution. The authors intend to use selected methods based on artificial intelligence, e.g., machine learning, in future research. Perhaps a properly trained machine will be able to provide a solution very quickly. It will be possible to apply it to the on line analysis.
In future research, the authors intend to propose an extensive, comprehensive methodology, also taking into account a change in the method of typing RES for optimisation in each iteration. Additionally, various ways of dividing the power loss (in the optimisation process) into sources responsible for maintaining the power balance in the power system will be considered. Existing or planned energy-storage facilities will also be taken into account during the calculations. A broader approach to the problem under consideration will further increase the effectiveness of eliminating power line overloads and will contribute to increasing the flexibility of the network.

Author Contributions

Conceptualisation, P.P. and C.S.; methodology, P.P. and C.S.; software, P.P., C.S., P.K., A.B. and P.M.; validation, P.P., C.S., P.K., A.B. and P.M.; formal analysis, P.P., C.S., P.K. and A.B.; investigation, P.P., C.S., P.K., A.B. and P.M.; writing—original draft preparation, P.P., C.S. and A.B.; writing—review and editing, P.P., C.S., P.K., A.B. and P.M.; visualisation, P.P., C.S. and A.B.; supervision, P.P. and P.K. All authors have read and agreed to the published version of the manuscript.

Funding

This research received no external funding.

Data Availability Statement

The original contributions presented in the study are included in the article, further inquiries can be directed to the corresponding author.

Conflicts of Interest

The authors declare no conflicts of interest.

References

  1. Pijarski, P.; Kacejko, P. Elimination of Line Overloads in a Power System Saturated with Renewable Energy Sources. Energies 2023, 16, 3751. [Google Scholar] [CrossRef]
  2. Manohar, P.; Rajesh, P.; Shajin, F.H. A Comprehensive Review of Congestion Management in Power System. Int. J. Integr. Eng. 2022, 14, 346–362. [Google Scholar] [CrossRef]
  3. Pillay, A.; Karthikeyan, S.P.; Kothari, D.P. Congestion management in power systems—A review. Int. J. Electr. Power Energy Syst. 2015, 70, 83–90. [Google Scholar] [CrossRef]
  4. Yuan, C.; Hu, C.; Li, T. Review of Congestion Management Methods for Power Systems. IOP Conf. Ser. Earth Environ. Sci. 2019, 233, 032025. [Google Scholar] [CrossRef]
  5. Yusoff, N.I.; Zin, A.A.M.; Bin Khairuddin, A. Congestion management in power system: A review. In Proceedings of the 2017 3rd International Conference on Power Generation Systems and Renewable Energy Technologies (PGSRET), Johor Bahru, Malaysia, 4–6 April 2017; IEEE: Piscataway, NJ, USA, 2017; pp. 22–27, ISBN 978-1-5090-5353-7. [Google Scholar]
  6. Venkaiah, C.; Vinod Kumar, D.M. Fuzzy adaptive bacterial foraging congestion management using sensitivity based optimal active power re-scheduling of generators. Appl. Soft Comput. 2011, 11, 4921–4930. [Google Scholar] [CrossRef]
  7. Golden, R.; Paulos, B. Curtailment of Renewable Energy in California and Beyond. Electr. J. 2015, 28, 36–50. [Google Scholar] [CrossRef]
  8. Iioka, D.; Saitoh, H. Equitable Distribution of Wind and Photovoltaic Power Curtailment. IFAC-Pap. 2018, 51, 362–367. [Google Scholar] [CrossRef]
  9. Therapontos, P.; Aristidou, P. The Impact of RES Curtailment Strategies for Congestion Avoidance on the Dynamic Frequency Performance of Low-Inertia Systems. In Proceedings of the 2023 IEEE Belgrade PowerTech, Belgrade, Serbia, 25–29 June 2023; IEEE: Piscataway, NJ, USA, 2023; pp. 1–6, ISBN 978-1-6654-8778-8. [Google Scholar]
  10. Sun, R.; Liu, Y.; Zhu, H.; Azizipanah-Abarghooee, R.; Terzija, V. A network reconfiguration approach for power system restoration based on preference-based multiobjective optimization. Appl. Soft Comput. 2019, 83, 105656. [Google Scholar] [CrossRef]
  11. Vaidya, P.; Chandrakar, V.K. Congestion Management of Large Power Network with Static Synchronous Compensator. In Proceedings of the 2022 International Conference on Intelligent Technologies (CONIT), Hubli, India, 24–26 June 2022; IEEE: Piscataway, NJ, USA, 2022; pp. 1–5, ISBN 978-1-6654-8407-7. [Google Scholar]
  12. Goncalves, M.; Vale, Z.A. Evaluation of transmission congestion impact in market power. In Proceedings of the 2003 IEEE Bologna Power Tech Conference Proceedings, Bologna, Italy, 23–26 June 2003; IEEE: Piscataway, NJ, USA, 2003; pp. 438–443, ISBN 0-7803-7967-5. [Google Scholar]
  13. Regulation (EU) 2019/943; Regulation (EU) 2019/943 of the European Parliament and of the Council of 5 June 2019 on the Internal Market for Electricity. European Union: Brussels, Belgium, 2019.
  14. Ren, J.; Li, S.; Yan, M.; Guo, Y. Emergency control strategy for line overload based on power flow tracing algorithm. Power Grid Technol. 2013, 37, 392–397. [Google Scholar]
  15. Duan, J.D.; Cheng, W.J.; Xue, B. Line Overload Shedding Strategy Based on Improved Power Flow Tracking Algorithm. In Proceedings of the 2019 14th IEEE Conference on Industrial Electronics and Applications (ICIEA), Xi’an, China, 19–21 June 2019; IEEE: Piscataway, NJ, USA, 2019; pp. 2315–2320, ISBN 978-1-5386-9490-9. [Google Scholar]
  16. Verma, S.; Saha, S.; Mukherjee, V. Optimal rescheduling of real power generation for congestion management using teaching-learning-based optimization algorithm. J. Electr. Syst. Inf. Technol. 2018, 5, 889–907. [Google Scholar] [CrossRef]
  17. Abrantes, H.D.; Castro, C.A. New branch overload elimination method using nonlinear programming. In Proceedings of the 2000 Power Engineering Society Summer Meeting (Cat. No.00CH37134), Seattle, WA, USA, 16–20 July 2000; IEEE: Piscataway, NJ, USA, 2000; pp. 231–236, ISBN 0-7803-6420-1. [Google Scholar]
  18. Abrantes, H.D.; Castro, C.A. A New Efficient Nonlinear Programming-Based Method for Branch Overload Elimination. Electr. Power Compon. Syst. 2002, 30, 525–537. [Google Scholar] [CrossRef]
  19. Arini, M.E. Fast method to alleviate line overloads by corrective generation rescheduling and load shedding. Electr. Mach. Power Syst. 1997, 25, 355–370. [Google Scholar] [CrossRef]
  20. Arya, L.D.; Koshti, A. Anticipatory load shedding for line overload alleviation using Teaching learning based optimization (TLBO). Int. J. Electr. Power Energy Syst. 2014, 63, 862–877. [Google Scholar] [CrossRef]
  21. Rao, R.V.; Savsani, V.J.; Vakharia, D.P. Teaching–Learning-Based Optimization: An optimization method for continuous non-linear large scale problems. Inf. Sci. 2012, 183, 1–15. [Google Scholar] [CrossRef]
  22. Lenoir, L.; Kamwa, I.; Dessaint, L.-A. Overload Alleviation With Preventive-Corrective Static Security Using Fuzzy Logic. IEEE Trans. Power Syst. 2009, 24, 134–145. [Google Scholar] [CrossRef]
  23. Udupa, A.; Purushothama, G.; Parthasarathy, K.; Thukaram, D. A fuzzy control for network overload alleviation. Int. J. Electr. Power Energy Syst. 2001, 23, 119–128. [Google Scholar] [CrossRef]
  24. Hong, Y.-Y. An enhanced expert system with fuzzy reasoning for line flow control in power systems. Electr. Power Syst. Res. 1996, 39, 1–8. [Google Scholar] [CrossRef]
  25. Pijarski, P.; Belowski, A. Application of Methods Based on Artificial Intelligence and Optimisation in Power Engineering—Introduction to the Special Issue. Energies 2024, 17, 516. [Google Scholar] [CrossRef]
  26. Fan, M.; Huang, L. Generator Redispatch Control Strategy with Big Data for Power Systems with Renewable Energy. In Proceedings of the 2019 IEEE Power & Energy Society General Meeting (PESGM), Atlanta, GA, USA, 4–8 August 2019; IEEE: Piscataway, NJ, USA, 2019; pp. 1–5, ISBN 978-1-7281-1981-6. [Google Scholar]
  27. Dutta, S.; Singh, S.P. Optimal Rescheduling of Generators for Congestion Management Based on Particle Swarm Optimization. IEEE Trans. Power Syst. 2008, 23, 1560–1569. [Google Scholar] [CrossRef]
  28. Linnemann, C.; Echternacht, D.; Breuer, C.; Moser, A. Modeling optimal redispatch for the European Transmission grid. In Proceedings of the 2011 IEEE Trondheim PowerTech, Trondheim, Norway, 19–23 June 2011; IEEE: Piscataway, NJ, USA, 2011; pp. 1–8, ISBN 978-1-4244-8418-8. [Google Scholar]
  29. Sankaramurthy, P.; Chokkalingam, B.; Padmanaban, S.; Leonowicz, Z.; Adedayo, Y. Rescheduling of Generators with Pumped Hydro Storage Units to Relieve Congestion Incorporating Flower Pollination Optimization. Energies 2019, 12, 1477. [Google Scholar] [CrossRef]
  30. Saranya, R.; Balamurugan, K.; Karuppasamy, M. Artificial Bee Colony Algorithm Based Congestion Management in Restructured Power System. Indian J. Sci. Technol. 2015, 8, 171–178. [Google Scholar] [CrossRef]
  31. van den Bergh, K.; Couckuyt, D.; Delarue, E.; D’haeseleer, W. Redispatching in an interconnected electricity system with high renewables penetration. Electr. Power Syst. Res. 2015, 127, 64–72. [Google Scholar] [CrossRef]
  32. Wang, R.; Lasseter, R.H. Re-dispatching generation to increase power system security margin and support low voltage bus. IEEE Trans. Power Syst. 2000, 15, 496–501. [Google Scholar] [CrossRef]
  33. Verma, S.; Mukherjee, V. Optimal real power rescheduling of generators for congestion management using a novel ant lion optimiser. IET Gener. Transm. Distrib. 2016, 10, 2548–2561. [Google Scholar] [CrossRef]
  34. Nikoukar, J. Optimal Active Power Rescheduling of Generators for Congestion Management Based on Big Bang-Big Crunch Optimization Using New Definition of Sensitivity. Int. J. Eng. Adv. Technol. 2013, 3, 44–52. [Google Scholar]
  35. Tailor, T.K.; Kumar, Y.; Dubey, M. Congestion Management by Optimal Generation Rescheduling Using Sine Cosine Algorithm. Int. J. Eng. Technol. 2018, 7, 4962–4967. [Google Scholar]
  36. Tapre, P.C.; Singh, D.K.; Paraskar, S. Lion Algorithm: A Nature-Inspired Algorithm for Generation Rescheduling-Based Congestion Management. In Ambient Communications and Computer Systems; Perez, G.M., Tiwari, S., Trivedi, M.C., Mishra, K.K., Eds.; Springer: Singapore, 2018; pp. 3–15. ISBN 978-981-10-7385-4. [Google Scholar]
  37. Tapre, P.C.; Kumar Singh, D.; Paraskar, S. A Novel Algorithm for Generation Rescheduling Based Congestion Management. In Proceedings of the 2017 International Conference on Transforming Engineering Education (ICTEE), Pune, India, 13–16 December 2017; IEEE: Piscataway, NJ, USA, 2017; pp. 1–8, ISBN 978-1-5386-0824-1. [Google Scholar]
  38. Medicherla, T.; Billinton, R.; Sachdev, M.S. Generation Rescheduling and Load Shedding to Alleviate Line Overloads-System Studies. IEEE Trans. Power Appar. Syst. 1981; PAS-100, 36–42. [Google Scholar] [CrossRef]
  39. Yue, X.; Wang, T.; Gu, X.; Wang, J. Control strategy for line overload based on sensitivity and power flow entropy. Power Syst. Prot. Control 2017, 45, 58–66. [Google Scholar]
  40. Xu, Y.; Bi, J.; Fan, S. Line overload emergency control based on power sensitivity and minimized economic compensation. Power Autom. Equip. 2017, 37, 118–123. [Google Scholar]
  41. Chung, C.Y.; Wang, L.; Howell, F.; Kundur, P. Generation Rescheduling Methods to Improve Power Transfer Capability Constrained by Small-Signal Stability. IEEE Trans. Power Syst. 2004, 19, 524–530. [Google Scholar] [CrossRef]
  42. Liu, Z.; Wang, F.; Qiu, J.; Chen, F.; Lu, Z.; Chen, M.; Niu, Q.; Dong, X. Emergency Control Strategy for Line Overload Considering Power Source and Load Fluctuation. IOP Conf. Ser. Earth Environ. Sci. 2021, 687, 012124. [Google Scholar] [CrossRef]
  43. Kumar, A.; Srivastava, S.C.; Singh, S.N. Congestion management in competitive power market: A bibliographical survey. Electr. Power Syst. Res. 2005, 76, 153–164. [Google Scholar] [CrossRef]
  44. Papalexopoulos, A. (Ed.) Congestion management in a competitive environment. In Tutorial on Future Needs and Trends in Power System Computing; Columbus: Sydney, Australia, 1997. [Google Scholar]
  45. Shandilya, A.; Gupta, H.; Sharma, J. Method for generation rescheduling and load shedding to alleviate line overloads using local optimisation. IEE Proc. C Gener. Transm. Distrib. UK 1993, 140, 337–342. [Google Scholar] [CrossRef]
  46. Balaraman, S.; Kamaraj, N. Transmission congestion management using particle swarm optimization. J. Electr. Syst. 2011, 7, 54–70. [Google Scholar]
  47. Pijarski, P.D. Optymalizacja Heurystyczna W Ocenie Warunków Pracy I Planowania Rozwoju Systemu Elektroenergetycznego [Heuristic Optimization in the Assessment of Operating Conditions and Development Planning of the Power System]; Wydawnictwo Politechniki Lubelskiej [Lublin University of Technology Publishers]: Lublin, Poland, 2019; ISBN 978-83-7947-349-6. [Google Scholar]
  48. Burke, D.J.; O’Malley, M.J. Maximizing Firm Wind Connection to Security Constrained Transmission Networks. IEEE Trans. Power Syst. 2010, 25, 749–759. [Google Scholar] [CrossRef]
  49. Pijarski, P. Dynamic Fitting of Generation Level to Transmission Capacity of Overhead Lines. Ph.D. Thesis, Lublin University of Technology, Lublin, Poland, 2011. [Google Scholar]
  50. Kacejko, P.; Pijarski, P. Generation Level Matching to the Transmission Capability of Overhead Lines. Acta Energetica 2013, 1, 43–49. [Google Scholar] [CrossRef]
  51. Pijarski, P.; Kacejko, P. Change in the generation distribution under the emergency overload conditions in a transmis-sion power system. In Blackout and the National Power System, 2014 ed.; Lorenc, J., Demenko, A., Eds.; Scientific Publishers OWN: Poznań, Poland, 2014; pp. 225–235. ISBN 978-83-7712-100-9. [Google Scholar]
  52. Badran, O.; Mekhilef, S.; Mokhlis, H.; Dahalan, W. Optimal reconfiguration of distribution system connected with distributed generations: A review of different methodologies. Renew. Sustain. Energy Rev. 2017, 73, 854–867. [Google Scholar] [CrossRef]
  53. Bramm, A.; Eroshenko, S. Optimal Reconfiguration of Distribution Network with Solar Power Plants. In Proceedings of the 2021 Ural-Siberian Smart Energy Conference (USSEC), Novosibirsk, Russia, 13–15 November 2021; IEEE: Piscataway, NJ, USA, 2021; pp. 1–5, ISBN 978-1-6654-3316-7. [Google Scholar]
  54. Karthikeyan, S.P.; Raglend, I.J.; Kothari, D.P. A review on market power in deregulated electricity market. Int. J. Electr. Power Energy Syst. 2013, 48, 139–147. [Google Scholar] [CrossRef]
  55. Gao, J.; Yang, X.; Niu, X.; Xu, J.; Sun, Y. Optimal Network Reconfiguration Model of Distribution Network for Improving Reliability. In Proceedings of the 2022 IEEE 6th Conference on Energy Internet and Energy System Integration (EI2), Chengdu, China, 11–13 November 2022; IEEE: Piscataway, NJ, USA, 2022; pp. 3094–3098, ISBN 979-8-3503-4715-9. [Google Scholar]
  56. Fatima, R.; Butt, H.Z.; Li, X. Optimal Dynamic Reconfiguration of Distribution Networks. In Proceedings of the 2023 North American Power Symposium (NAPS), Asheville, NC, USA, 15–17 October 2023; IEEE: Piscataway, NJ, USA, 2023; pp. 1–6, ISBN 979-8-3503-1509-7. [Google Scholar]
  57. Zou, B.; Hu, Z.; Xu, Q.; Liu, H. Distributed Network Reconfiguration Scheme with Self-healing for Distribution Network. In Proceedings of the 2022 4th International Conference on Control and Robotics (ICCR), Guangzhou, China, 2–4 December 2022; IEEE: Piscataway, NJ, USA, 2022; pp. 183–187, ISBN 978-1-6654-8641-5. [Google Scholar]
  58. Conejo, A.J.; Milano, F.; Garcia-Bertrand, R. Congestion Management Ensuring Voltage Stability. IEEE Trans. Power Syst. 2006, 21, 357–364. [Google Scholar] [CrossRef]
  59. Yesuratnam, G.; Thukaram, D. Congestion management in open access based on relative electrical distances using voltage stability criteria. Electr. Power Syst. Res. 2007, 77, 1608–1618. [Google Scholar] [CrossRef]
  60. Yoshida, H.; Kawata, K.; Fukuyama, Y.; Takayama, S.; Nakanishi, Y. A particle swarm optimization for reactive power and voltage control considering voltage security assessment. IEEE Trans. Power Syst. 2000, 15, 1232–1239. [Google Scholar] [CrossRef]
  61. Jin, X.; Mu, Y.; Jia, H.; Wu, Q.; Jiang, T.; Wang, M.; Yu, X.; Lu, Y. Alleviation of overloads in transmission network: A multi-level framework using the capability from active distribution network. Int. J. Electr. Power Energy Syst. 2019, 112, 232–251. [Google Scholar] [CrossRef]
  62. Wang, K.; Kang, L.; Yang, S. A Coordination Optimization Method for Load Shedding Considering Distribution Network Reconfiguration. Energies 2022, 15, 8178. [Google Scholar] [CrossRef]
  63. Granelli, G.; Montagna, M.; Zanellini, F.; Bresesti, P.; Vailati, R.; Innorta, M. Optimal network reconfiguration for congestion management by deterministic and genetic algorithms. Electr. Power Syst. Res. 2006, 76, 549–556. [Google Scholar] [CrossRef]
  64. Hedman, K.W.; O’Neill, R.P.; Fisher, E.B.; Oren, S.S. Optimal Transmission Switching With Contingency Analysis. IEEE Trans. Power Syst. 2009, 24, 1577–1586. [Google Scholar] [CrossRef]
  65. Li, S.; Wang, L.; Gu, X.; Zhao, H.; Sun, Y. Optimization of loop-network reconfiguration strategies to eliminate transmission line overloads in power system restoration process with wind power integration. Int. J. Electr. Power Energy Syst. 2022, 134, 107351. [Google Scholar] [CrossRef]
  66. Müller, N.; Quintana, V.H. Line and shunt switching to alleviate overloads and voltage violations in power networks. IEE Proc. C Gener. Transm. Distrib. UK 1989, 136, 246–253. [Google Scholar] [CrossRef]
  67. Shao, W.; Vittal, V. Corrective Switching Algorithm for Relieving Overloads and Voltage Violations. IEEE Trans. Power Syst. 2005, 20, 1877–1885. [Google Scholar] [CrossRef]
  68. Arya, L.; Choube, S.; Kothari, D. Line switching for alleviating overloads under line outage condition taking bus voltage limits into account. Int. J. Electr. Power Energy Syst. 2000, 22, 213–221. [Google Scholar] [CrossRef]
  69. Arya, L.D.; Choube, S.C.; Mehta, K.S.; Pawar, K.N.; kothari, D.P. Post contingency line switching for overload alleviation or rotation. Electr. Mach. Power Syst. 1995, 23, 345–352. [Google Scholar] [CrossRef]
  70. Makram, E.B.; Thorton, K.P.; Brown, H.E. Selection of lines to be switched to eliminate overloaded lines using a Z-matrix method. IEEE Trans. Power Syst. 1989, 4, 653–661. [Google Scholar] [CrossRef]
  71. Saharuddin, N.; Zainal Abidin, I.; Mokhlis, H.; Abdullah, A.; Naidu, K. A Power System Network Splitting Strategy Based on Contingency Analysis. Energies 2018, 11, 434. [Google Scholar] [CrossRef]
  72. Faheem, M.; Kuusniemi, H.; Eltahawy, B.; Bhutta, M.S.; Raza, B. A lightweight smart contracts framework for blockchain-based secure communication in smart grid applications. IET Gener. Transm. Distrib. 2024, 18, 625–638. [Google Scholar] [CrossRef]
  73. Faheem, M.; Al-Khasawneh, M.A. Multilayer cyberattacks identification and classification using machine learning in internet of blockchain (IoBC)-based energy networks. Data Brief 2024, 54, 110461. [Google Scholar] [CrossRef] [PubMed]
  74. Pijarski, P.; Kacejko, P. A new metaheuristic optimization method: The algorithm of the innovative gunner (AIG). Eng. Optim. 2019, 51, 2049–2068. [Google Scholar] [CrossRef]
  75. Mirjalili, S.; Mirjalili, S.M.; Lewis, A. Grey Wolf Optimizer. Adv. Eng. Softw. 2014, 69, 46–61. [Google Scholar] [CrossRef]
  76. Mirjalili, S. Moth-flame optimization algorithm: A novel nature-inspired heuristic paradigm. Knowl.-Based Syst. 2015, 89, 228–249. [Google Scholar] [CrossRef]
  77. Kennedy, J.; Eberhart, R. Particle swarm optimization. In Proceedings of the ICNN’95—International Conference on Neural Networks, Perth, WA, Australia, 27 November–1 December 1995; IEEE: Piscataway, NJ, USA, 1995; pp. 1942–1948, ISBN 0-7803-2768-3. [Google Scholar]
  78. Yang, X.-S.; Deb, S. Cuckoo Search via Lévy flights. In Proceedings of the 2009 World Congress on Nature & Biologically Inspired Computing (NaBIC), Coimbatore, India, 9–11 December 2009; IEEE: Piscataway, NJ, USA, 2009; pp. 210–214, ISBN 978-1-4244-5053-4. [Google Scholar]
  79. Pham, D.T.; Ghanbarzadeh, A.; Koç, E.; Otri, S.; Rahim, S.; Zaidi, M. The Bees Algorithm—A Novel Tool for Complex Optimisation Problems. In Intelligent Production Machines and Systems; Elsevier: Amsterdam, The Netherlands, 2006; pp. 454–459. ISBN 9780080451572. [Google Scholar]
  80. Pijarski, P.; Kacejko, P. Voltage Optimization in MV Network with Distributed Generation Using Power Consumption Control in Electrolysis Installations. Energies 2021, 14, 993. [Google Scholar] [CrossRef]
  81. Kacejko, P.; Pijarski, P. Optimal Voltage Control in MV Network with Distributed Generation. Energies 2021, 14, 469. [Google Scholar] [CrossRef]
  82. Kacejko, P.; Miller, P.; Pijarski, P. Determination of Maximum Acceptable Standing Phase Angle across Open Circuit Breaker as an Optimisation Task. Energies 2021, 14, 8105. [Google Scholar] [CrossRef]
  83. KIOS Research Center. IEEE 118-Bus Modified Test System. Available online: https://www.kios.ucy.ac.cy/testsystems/index.php/ieee-118-bus-modified-test-system/ (accessed on 19 January 2023).
Figure 1. General diagram of the high-voltage network with overloaded lines and elements enabling their relief.
Energies 17 02965 g001
Figure 2. Block diagram of the proposed methodology.
Energies 17 02965 g002
Figure 3. General flowchart of the AIG algorithm [74].
Energies 17 02965 g003
Figure 4. General block diagram of the computational process.
Energies 17 02965 g004
Figure 5. Modified IEEE-118 bus test network [83].
Energies 17 02965 g005
Figure 6. First state of emergency—IEEE 118 network illustration.
Energies 17 02965 g006
Figure 7. Optimal power values in RESs for the three calculation cases considered.
Energies 17 02965 g007
Figure 8. Curtailed generation in RESs for the three calculation cases considered.
Energies 17 02965 g008
Figure 9. The course of the best values of the objective function for the three considered computational cases, (a) case 1, (b) case 2, (c) case 3.
Energies 17 02965 g009
Figure 10. Second state of emergency—IEEE 118 network illustration.
Energies 17 02965 g010
Figure 11. Changes of the best values of the objective function for the two considered computational cases, (a) case 1, (b) case 2.
Energies 17 02965 g011
Table 1. Comparison table.
Advantages and Disadvantages of Individual MethodsReferences
Pros
  • Including only those sources that are responsible for line congestion;
[1,6,27,30,32,34]
  • Combination of several methods which increases computational accuracy;
[1,6,30,34,72,73]
  • Research carried out on test networks of various sizes, which allows to better determine the effectiveness of the method;
[16,17,27,32,33,34,46,55]
  • Using available optimisation methods to determine the minimum operating point of the generator so that its output power can be quickly increased;
[30]
  • Comparison of several optimisation techniques in order to select the most effective one;
[2,33,37]
  • Taking into account random factors such as wind, sun, storms;
[42]
  • Using Artificial Intelligence to speed up computing time;
[16,46,72,73]
  • The simplicity of the method;
[7,15,17,35,42,72]
Cons
  • Long calculation time;
[1,6,27,32,33,34,55]
  • Avoiding the problem of system size—tests only on small networks;
[15,16,26,30,37,42,46]
  • Taking into account all sources for power curtailment, even those that do not have a significant impact on line congestion;
[8,16,17,18,35,42,49]
  • High cost of implementing the method.
[17,18,35,42,72,73]
Table 2. Permissible long-term load capacity of overhead line cables used in the IEEE-118 bus network.
Line Design Temperature °C
Cable Cross-Section, mm2+40 °C+60 °C+80 °C
Summer PeriodWinter PeriodSummer PeriodWinter PeriodSummer PeriodWinter Period
AAAAAA
120205405350475410475
185270535455630535630
240325625550735645735
5255151030875122010301220
2x525103020601750244020602440
Table 3. Power generated in RESs (before optimisation in MW), which has the greatest impact on overloaded lines.
RES Description
G-24G-72G-19G-17G-25G-113G-103
505060501007090
Table 4. Optimal values of power generated in 7 selected sources (case 1).
Lp.GeneratorGenerator Node Voltage,
kV
PG before
Optimisation,
MW
PG after
Optimisation,
MW
Curtailment
ΔPG
MW
1G-2411050500
2G-7211050500
3G-1911060600
4G-1711050050
5G-251101001000
6G-113110701060
7G-103110904644
Total470316154
Table 5. Optimal values of power generated in 7 selected sources (case 2).
Lp.GeneratorGenerator Node Voltage,
kV
PG before
Optimisation,
MW
PG after
Optimisation,
MW
Curtailment
ΔPG
MW
1G-24110501832
2G-7211050500
3G-1911060582
4G-1711050437
5G-251101007921
6G-113110701159
7G-103110904050
Total470299171
Table 6. Optimal values of power generated in 7 selected sources (case 3).
Lp.GeneratorGenerator Node Voltage,
kV
PG before
Optimisation,
MW
PG after
Optimisation,
MW
Curtailment
ΔPG
MW
1G-24110501733
2G-7211050473
3G-1911060600
4G-1711050050
5G-251101008713
6G-11311070268
7G-103110904644
Total470259211
Table 7. Optimal values of power generated in the seven selected sources (case 1).
Lp.GeneratorGenerator Node Voltage,
kV
PG before
Optimisation,
MW
PG after
Optimisation,
MW
Curtailment
ΔPG
MW
1G-2411050500
2G-7211050500
3G-371101501500
4G-10311090900
5G-113110705614
Total41039614
Table 8. Optimal values of power generated in 7 selected sources (case 2).
Lp.GeneratorGenerator Node Voltage,
kV
PG before
Optimisation,
MW
PG after
Optimisation,
MW
Curtailment
ΔPG
MW
1G-2411050149
2G-7211050437
3G-3711015015135
4G-10311090090
5G-113110704822
Total410107303
Disclaimer/Publisher’s Note: The statements, opinions and data contained in all publications are solely those of the individual author(s) and contributor(s) and not of MDPI and/or the editor(s). MDPI and/or the editor(s) disclaim responsibility for any injury to people or property resulting from any ideas, methods, instructions or products referred to in the content.

