Article

Smart System for Reducing Standby Energy Consumption in Residential Appliances

by
Andrei Cosmin Gheorghe
1,
Horia Andrei
1,
Emil Diaconu
2 and
Paul Cristian Andrei
3,*
1
Doctoral School of Engineering Valahia, University “Valahia” of Targoviste, 130004 Targoviste, Romania
2
Faculty of Electrical Engineering, Electronics and Information Technology, University “Valahia” of Targoviste, 130004 Targoviste, Romania
3
Faculty of Electrical Engineering, University “Politehnica” of Bucharest, 060042 Bucharest, Romania
*
Author to whom correspondence should be addressed.
Energies 2024, 17(12), 2989; https://doi.org/10.3390/en17122989
Submission received: 10 May 2024 / Revised: 14 June 2024 / Accepted: 15 June 2024 / Published: 18 June 2024

Abstract

:
Residential consumption represents one of the most important percentages of total electricity consumption. A considerable number of household appliances consume energy even when they are not in operation, i.e., they are in the so-called standby state, thus producing additional costs, which become significant over time. In this context, one method to solve this problem is to develop a smart system capable of severing the power connection to devices in standby mode, thereby conserving energy and reducing the energy costs. The first step in the design of this system consists of the identification and accurate measurement of the standby state, which was carried out for three of the most common household appliances. Then, by using an ESP32 microcontroller, a system was designed to manage the operation of a relay module based on the current consumption of the connected equipment. Control over the system was achieved through a web application that works across all devices equipped with a web browser, offering functionalities to adjust current value time delays and to manually switch the system on or off. Finally, the deployment of this system across the three appliances studied led to a reduction in the energy consumption in standby mode of 26.68 kWh per month.

1. Introduction

Over time, as power prices continue to rise, optimizing power consumption to reduce both energy usage and associated costs has become an increasingly significant concern. A prevalent feature of typical household appliances is their tendency to consume electricity even when in standby mode [1].
The slow progress in domestic energy conservation can be attributed to a lack of fundamental knowledge regarding energy consumption. Various households incorporate different energy sources into their daily lives, yet there is often confusion about the specific purposes for which each energy type is employed. Furthermore, the correlation between household characteristics and energy consumption is not widely understood [2,3]. Households play a crucial role in the global demand for energy, particularly in the realm of electricity. While reducing electric power consumption is vital for environmental and energy security concerns, electricity remains indispensable in our daily lives. According to Eurostat (2023), residential areas accounted for 27% of the final energy consumption in 2021, contributing to 29% of the total energy consumption in the EU. Notably, 24.7% of the overall energy consumption in the residential sector is attributed to electricity, a figure that can rise to as high as 73% in countries like Norway.
In the EU, electricity fulfills the entirety of the lighting and space-cooling needs, constituting 100% coverage. Moreover, 83.4% of electricity is utilized for other end-uses, encompassing 49.2% for kitchen-related activities. It is worth mentioning that many countries in the EU rely on electricity for essential functions such as lighting and air conditioning [4,5].
Several articles have suggested methods to decrease power consumption in households, focusing on predicting the energy usage of appliances through statistical distributions, machine learning, binary gray wolf optimization, and modeling on–off times. However, these studies do not explicitly demonstrate whether these approaches effectively reduce standby consumption [6,7,8]. In the context of reducing power consumption in residential buildings, solutions involving smart energy management systems have been proposed. These systems integrate into smart buildings or houses with the primary goal of optimizing power consumption by strategically turning appliances on or off, all while maintaining user comfort [9,10]. The applied method did not yield the anticipated improvements in reducing the power consumption of the appliances in standby mode.
Several studies suggest that one of the most important influencing factors for the energy consumption of a household is user behavior. Modifying the behavior of the user regarding energy usage leads to efficient energy consumption, thus saving money and reducing pollution in the environment [11,12,13,14]. Some authors have also suggested that appropriate electricity-saving measures can be achieved by identifying electrical household appliances that can have energy-saving properties and analyzing their behavior to raise consumer awareness [15]. It is not possible to draw any strong conclusions from the studies because it depends on the user to follow and respect the power-saving recommendations.
A previous study almost exclusively focused on determining the power consumption of common household appliances, including power consumption in standby mode without and with a system that automatically reduces standby power consumption [16,17,18].
This study presents a novel approach aimed at mitigating the standby power consumption of common household appliances. Initially, an assessment was conducted on the standby energy use of three different categories of household devices to establish a baseline. Currently, the system is in a proof-of-concept stage, functioning in a simplified setup that incorporates measurement instruments and a web-based application interface for configuration over a wireless network. Three specific appliances were selected for preliminary testing to verify their standby power consumption. Subsequently, the system was applied to these devices, utilizing a web application for wireless setup and activation. Measurements were taken before, during, and after the system’s activation to demonstrate its effectiveness in reducing power usage by disconnecting the appliances from the electrical grid when not in active use.
The study is structured into four main parts. Section 2 outlines the measurement system employed to evaluate the power usage of household devices, specifically in standby mode, and presents the design of the smart system used to decrease power consumption, including the description of the web application for setup and control. Section 3 discusses the findings, showcasing data collected before, during, and after the implementation of the system, providing clear evidence of its effectiveness in reducing standby power usage. Finally, Section 4 concludes the paper, offering insights into potential enhancements for the system in the future.

2. Materials and Methods

A common trait among typical household appliances is their consumption of energy even in standby mode. To accurately assess an appliance’s energy use over time, it is crucial to account for the power it consumes while not actively in use [19].

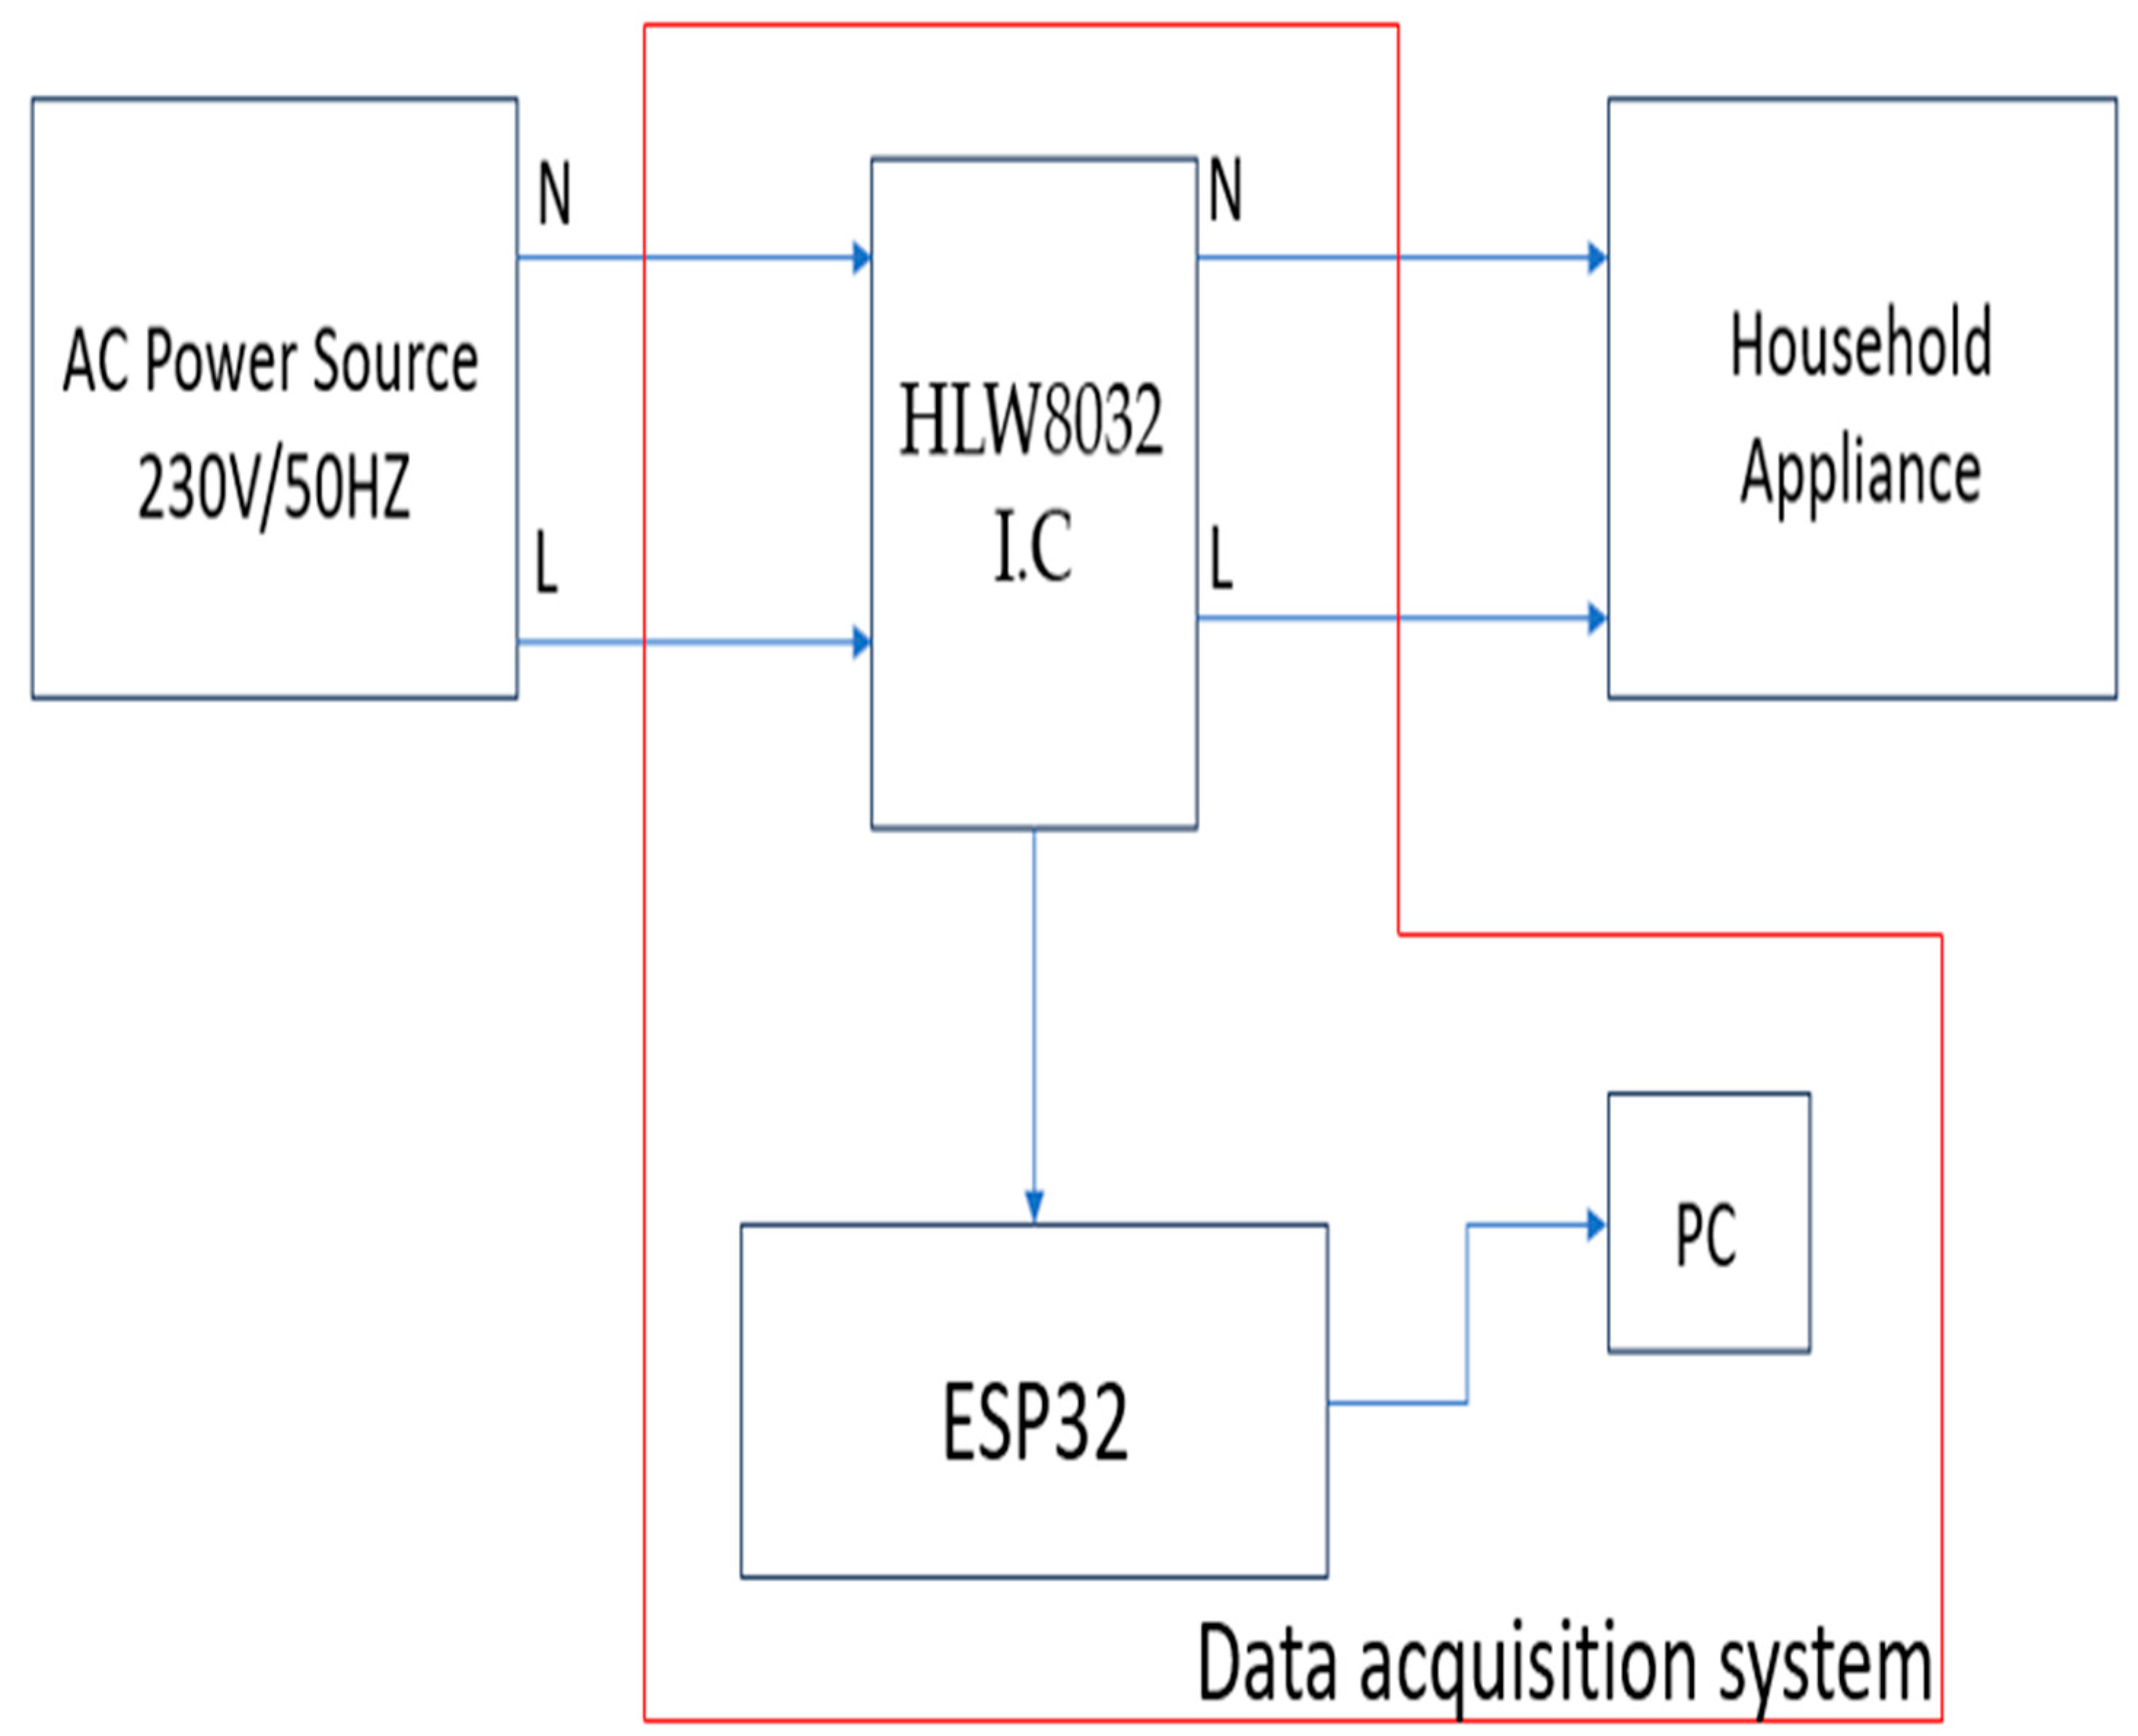
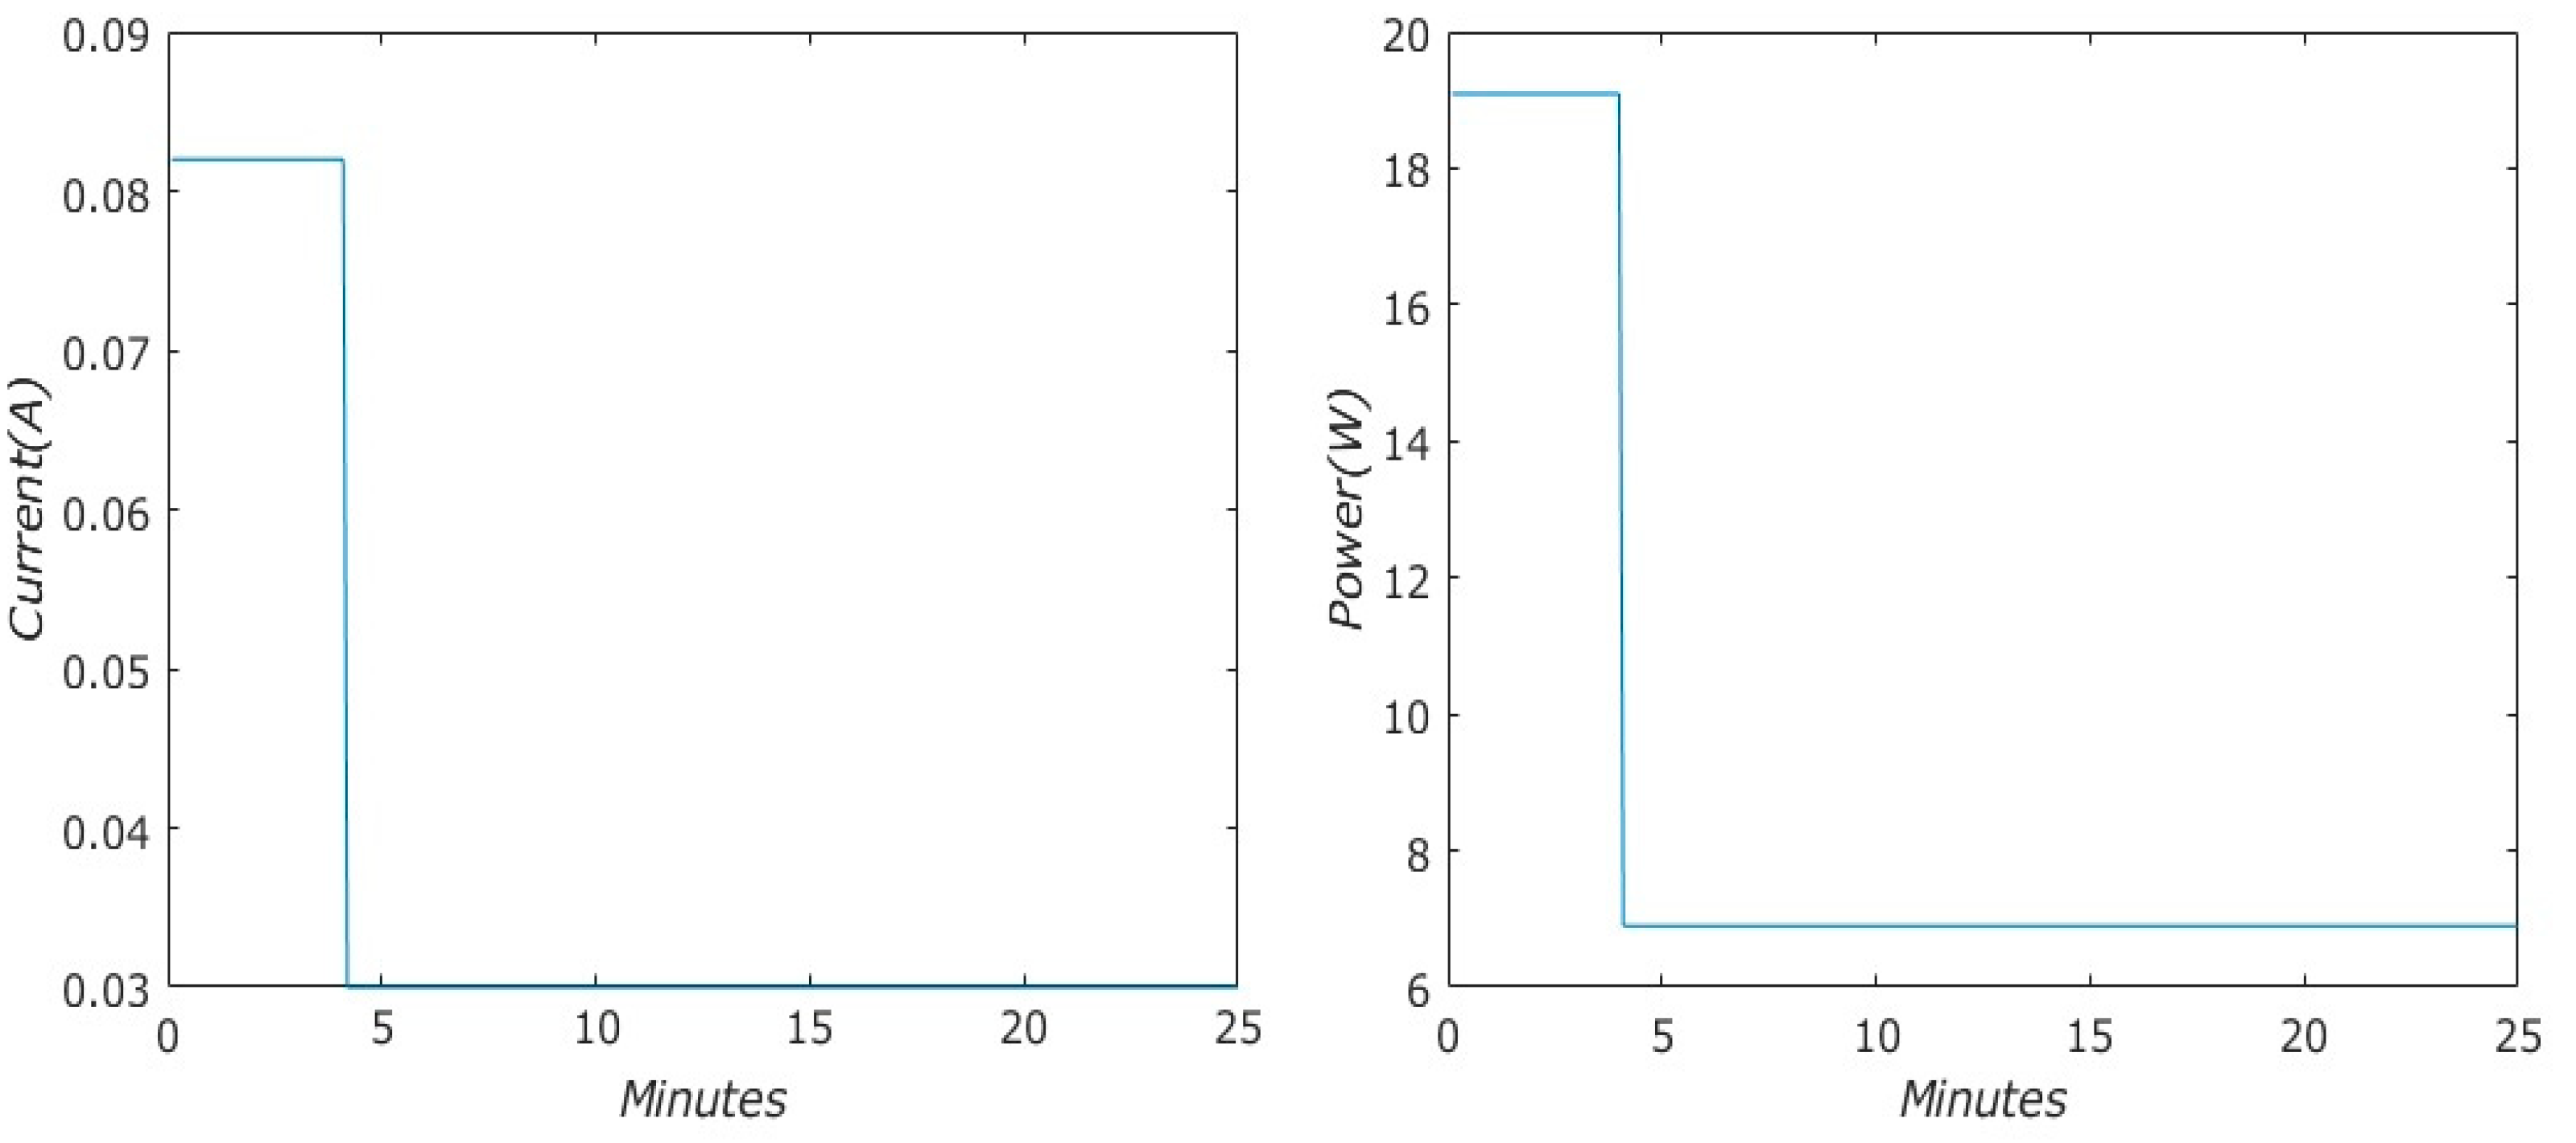
2.1. Standby Power Consumption Data Measurement

The quantification of the absorbed current and power consumption for three common residential appliances in standby mode was conducted through a dedicated data acquisition system (DAQ), as depicted in Figure 1.
The data acquisition system is built around a microprocessor-based development platform, specifically the Espressif Systems ESP32 DevKit V4 board that was sourced from Guangdong, China. This board collects data from the HLW8032 power measurement integrated circuit (IC) through a serial connection (UART) and relays it to a computer via a USB connection. As provided in the HLW8032 User Manual 3, the measurement errors are 0.2% for active power and 0.5% for effective current and voltage, which are specified in reference [20].
In order to validate the measurements made by the proposed HLW8032 system, a certified device, the Fluke 1738 Power Logger, was chosen. The Fluke 1738 Power Logger is an advanced instrument for energy and power quality analysis, designed for electrical professionals. It offers precise measurements for both three-phase and single-phase systems, with a high accuracy of ±(0.2% + 0.01%) for voltage and ±(1% + 0.02%) for current [21]. By analyzing the graphs of the time variations of the current and the power absorbed by a washing machine and a laptop made with Fluke and presented in Appendix A, one can see the similarity with those made with the DAQ system proposed in this article. By analyzing the graphs of the time variations of the current and the power absorbed by the same electrical household equipment—a washing machine and a laptop—made with Fluke, one can see the similarity with those accomplished with the DAQ system proposed in this article. Moreover, the measurements made with HLW8032 compared to those presented in previous articles [17,18] using the first version of the DAQ system showed identical values.
The data were then displayed and logged using the serial monitor function in Arduino IDE. The core of the power-monitoring setup is the Hiliwei Tech HLW8032 IC that was sourced from Guangdong, China, which excels in single-phase electrical energy measurement and is highlighted for its non-requirement for calibration. This feature makes it particularly useful in the design of various products like smart electricity meters and intelligent power sockets. The IC’s support components include power supply to an analog voltage chip, analog inputs for voltage and current sensing, and digital output. It also supports data transmission via serial communication and outputs high-frequency pulse data [22,23,24,25,26].
In Figure 2 is shown the electronic circuit of the data acquisition system. The image shows the power-monitoring circuit for a household load, integrating the HLW8032 energy-monitoring IC with the ESP32 DevKit V4. The circuit taps into a 220 V AC mains supply to power both the load and an AC-DC converter that steps down the voltage to 5 V for the IC. The 470 K resistors are used to create a voltage divider. They are connected between the live (L) and neutral (N) lines and the V2P pin of the HLW8032. Their function is to reduce the 220 V AC voltage from the electrical network to a lower level that can be safely fed into the HLW8032 for voltage measurement. The 1 mΩ resistor is used for current measurement. It is connected in series with the load, and its function is to create a small voltage drop proportional to the current passing through the load. This voltage drop is detected by the HLW8032 to measure the current. The 1 K resistors are used for load balancing and filtering. They are connected in series with capacitors (33nF) and the differential inputs (V1P and V1N) of the HLW8032. These resistors work together with the capacitors to filter high-frequency noise and stabilize the input signals to the HLW8032 for precise voltage and current measurements. An additional 470 K resistor, similar to the resistors in the voltage divider, is used to stabilize the circuit. This additional 470 K resistor is connected to the neutral line and ground. It ensures proper grounding and voltage stability at the measurement inputs. Capacitors, although not resistors, play a crucial role in filtering when used in series with the 1 K resistors. Their function is to filter noise and provide a stable DC signal for precise measurements by the HLW8032. This setup enables the smart monitoring and management of household electrical consumption. However, in the HLW8032 User Manual there are no data regarding the tolerance of the resistors, only those related to the working large-limit temperatures of −40 and 85 °C. Considering that the measurement errors of the current and active power specified in the User Manual are 0.5% and 0.2%, respectively, this indicates a good tolerance of the circuit elements used.
The circuit employs low-frequency sampling for data collection, resulting in root mean square (RMS) values for voltage and current readings. The precise mathematical equations shown below provided by the IC HLW8032 datasheet are used to calculate the values for the RMS ( V R M S ) voltage, as specified in Equation (1). Equation (1) defines the RMS ( V R M S ) voltage. It is calculated by dividing a voltage register value ( R e g v param ) by a voltage reference register value ( R e g v ) and then multiplying by a voltage coefficient ( C o e f f v ). This equation suggests that the IC provides a raw measurement that is scaled by the coefficient to obtain the actual RMS voltage. This approach ensures the accurate monitoring of power consumption, leveraging the HLW8032′s capabilities for precise energy measurement without the need for calibration, making it an invaluable asset in the development of smart power-monitoring solutions.
V R M S = R e g v param   R e g v C o e f f v
I R M S = R e g i pram   R e g i C o e f f i
C o e f f i = 1 R 1000 = 1 0.001 1000 = 1
P = R e g P paran   R e g P C o e f f v Coeff i
The chip dedicated to measuring power consumption utilizes Equation (2) through (4) for calculating RMS current and active power. Equation (2) defines the RMS current. Similar to the RMS voltage calculation, it divides a current register value ( R e g i pram   ) by a current reference register value ( R e g i ) and multiplies by a current coefficient ( C o e f f i ). This equation scales the raw measurement from the IC to calculate the actual RMS current. Equation (3) gives the current coefficient ( C o e f f i ), calculated as the reciprocal of a resistance value (R) multiplied by 1000. Since R is 0.001 Ω, C o e f f i becomes 1. This implies that there is a current shunt of 0.001 Ω used for current measurement. Equation (4) calculates the active power by taking a power register value ( R e g P paran   ), dividing it by a power reference register value ( R e g P ), and multiplying by both the voltage coefficient ( C o e f f v ) and the current coefficient ( C o e f f i ). Following these computations, it sends the data to the serial port with a baud rate of 4800, using a communication protocol that includes eight data bits, one parity bit, and one stop bit. Data transmission is scheduled at a consistent interval, with data being sent every 50 ms, amounting to a frequency of once per second [27].
This process is supported by software within the microcontroller, which is set up to routinely collect the power consumption data from the chip that samples electrical power. This setup allows for the real-time monitoring of power consumption, even at low levels, by leveraging the precise calculations of the chip to provide detailed insights into the energy usage patterns of connected devices. This method ensures an accurate and continuous stream of power usage data, essential for analyzing and optimizing energy consumption in various applications.
The equipment chosen for testing the system included a Beko washing machine (Beko WUE81436 sourced form Targoviste, Romania), a Lenovo Legion laptop (Lenovo 15ACH6H sourced from Bucharest, Romania), and an LG TV (LG 40UH630V sourced from Bucharest, Romania).

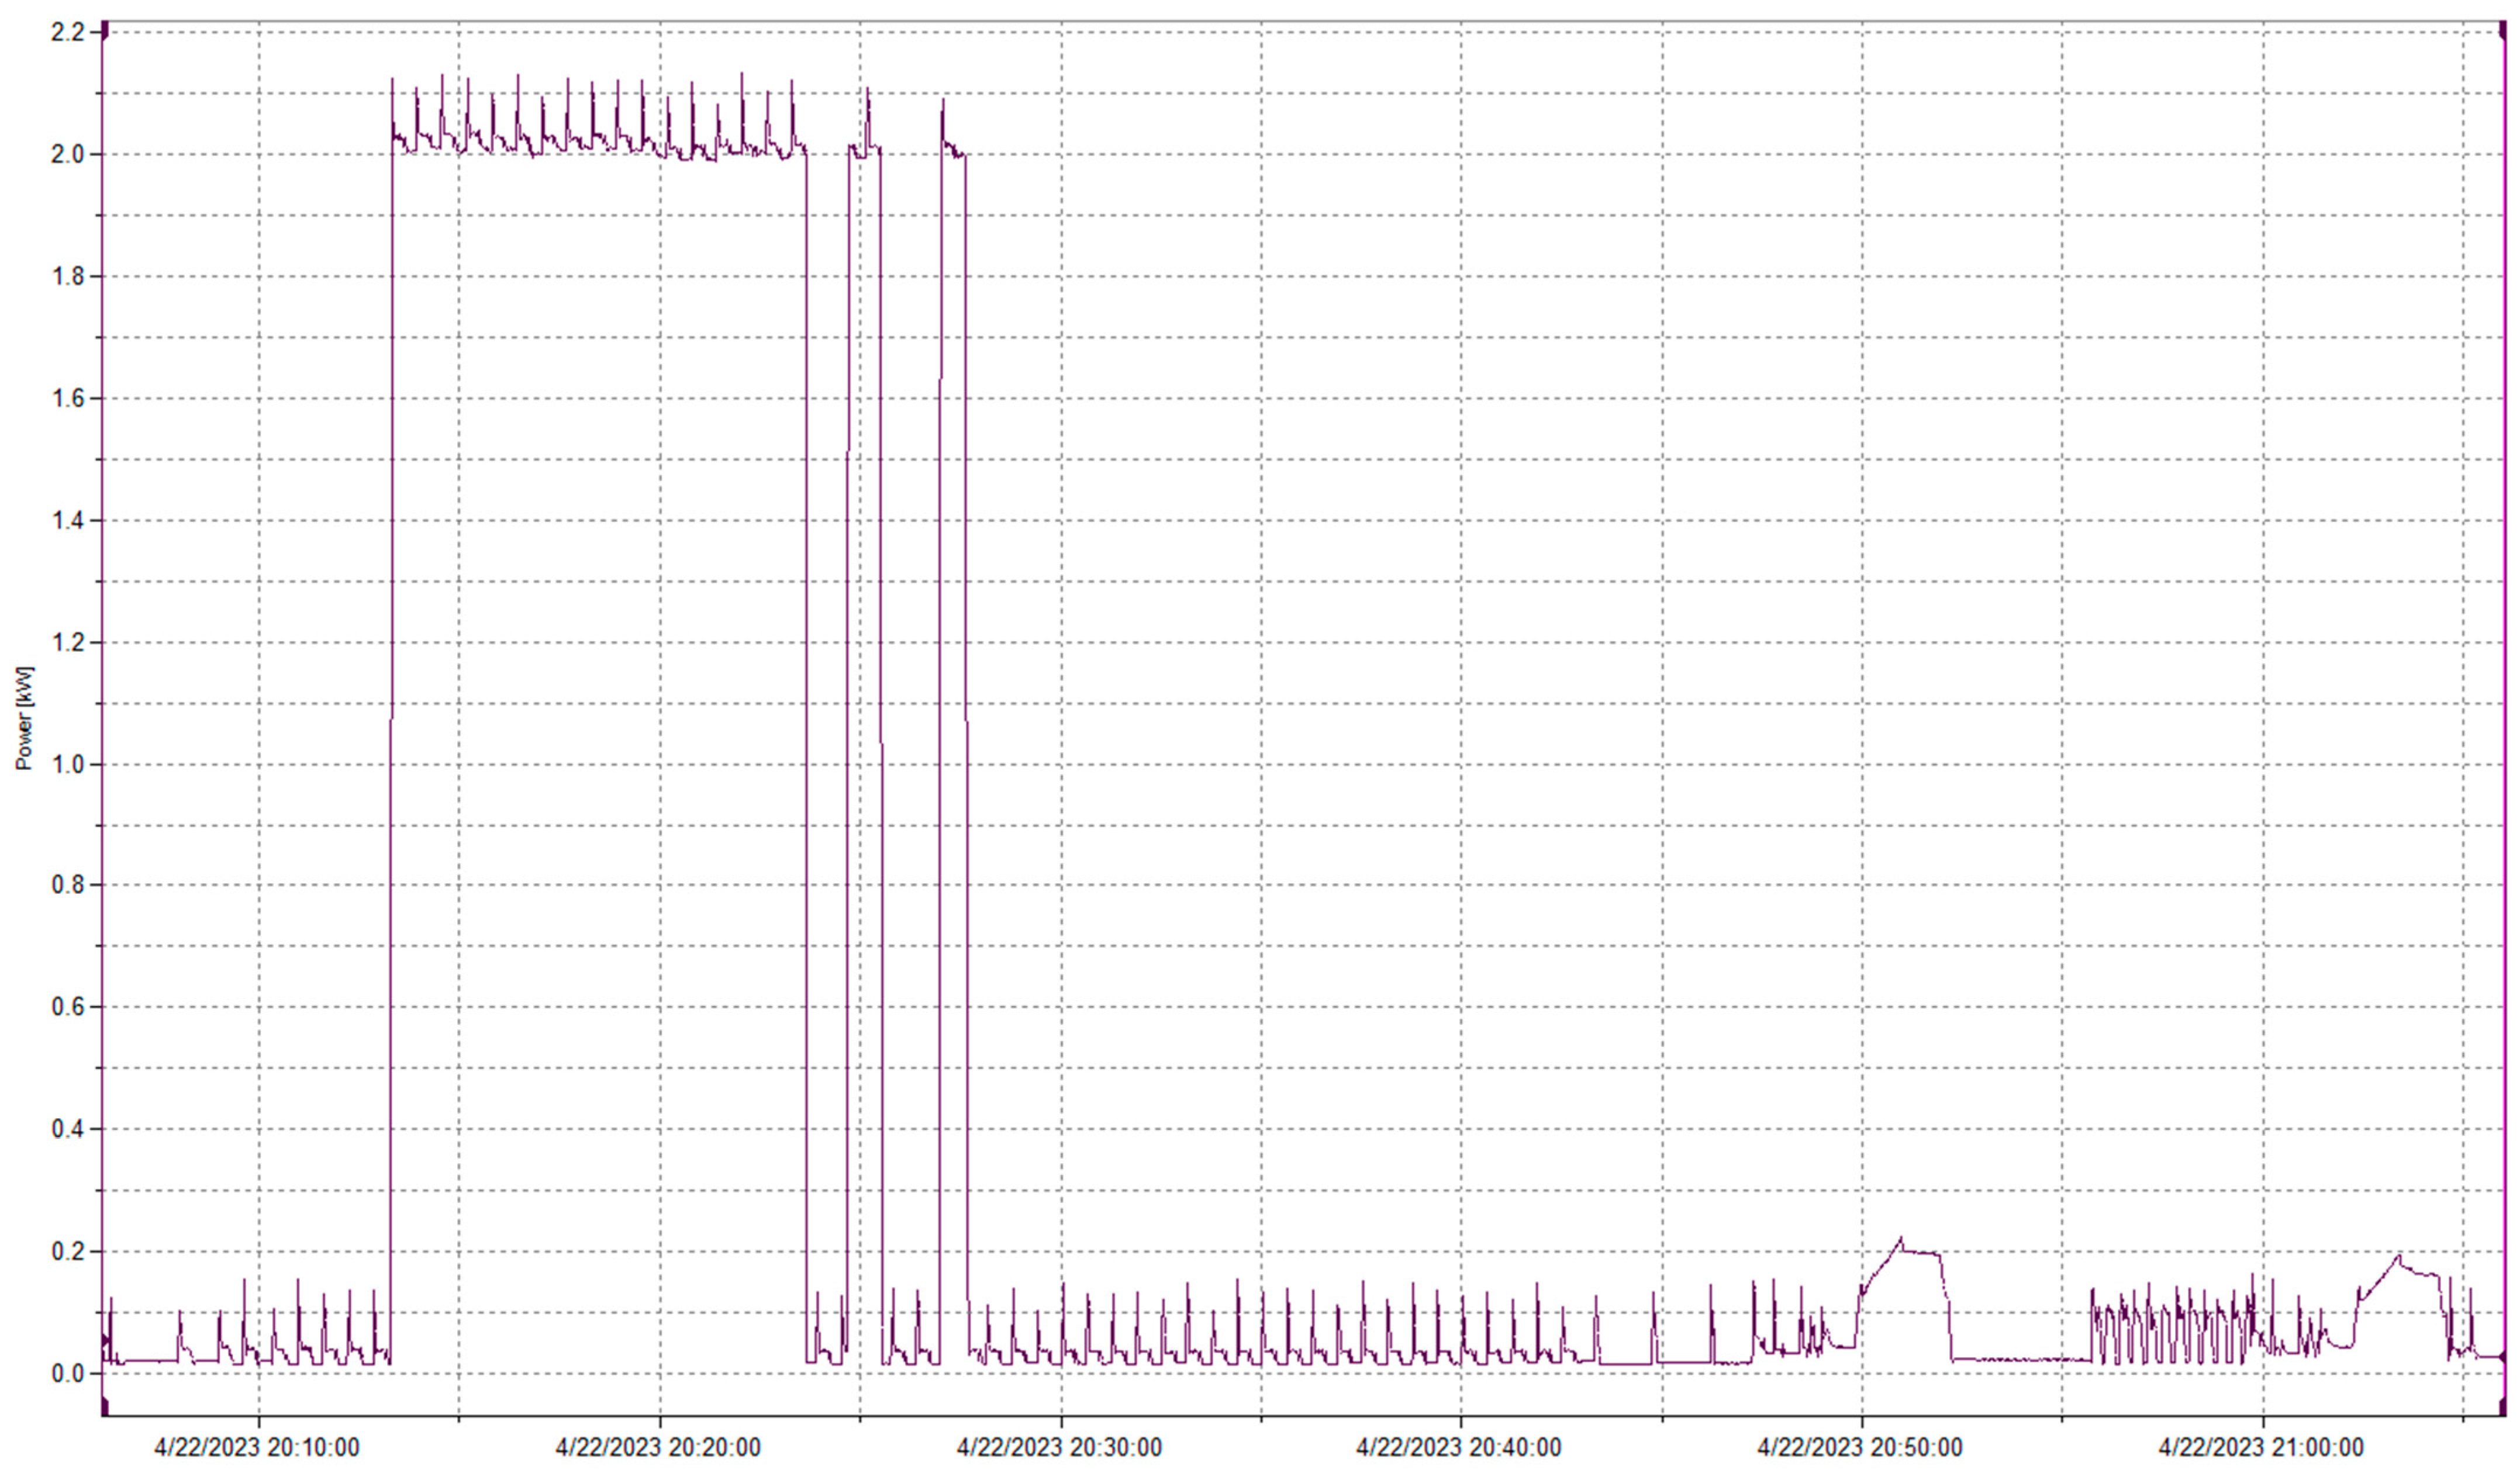
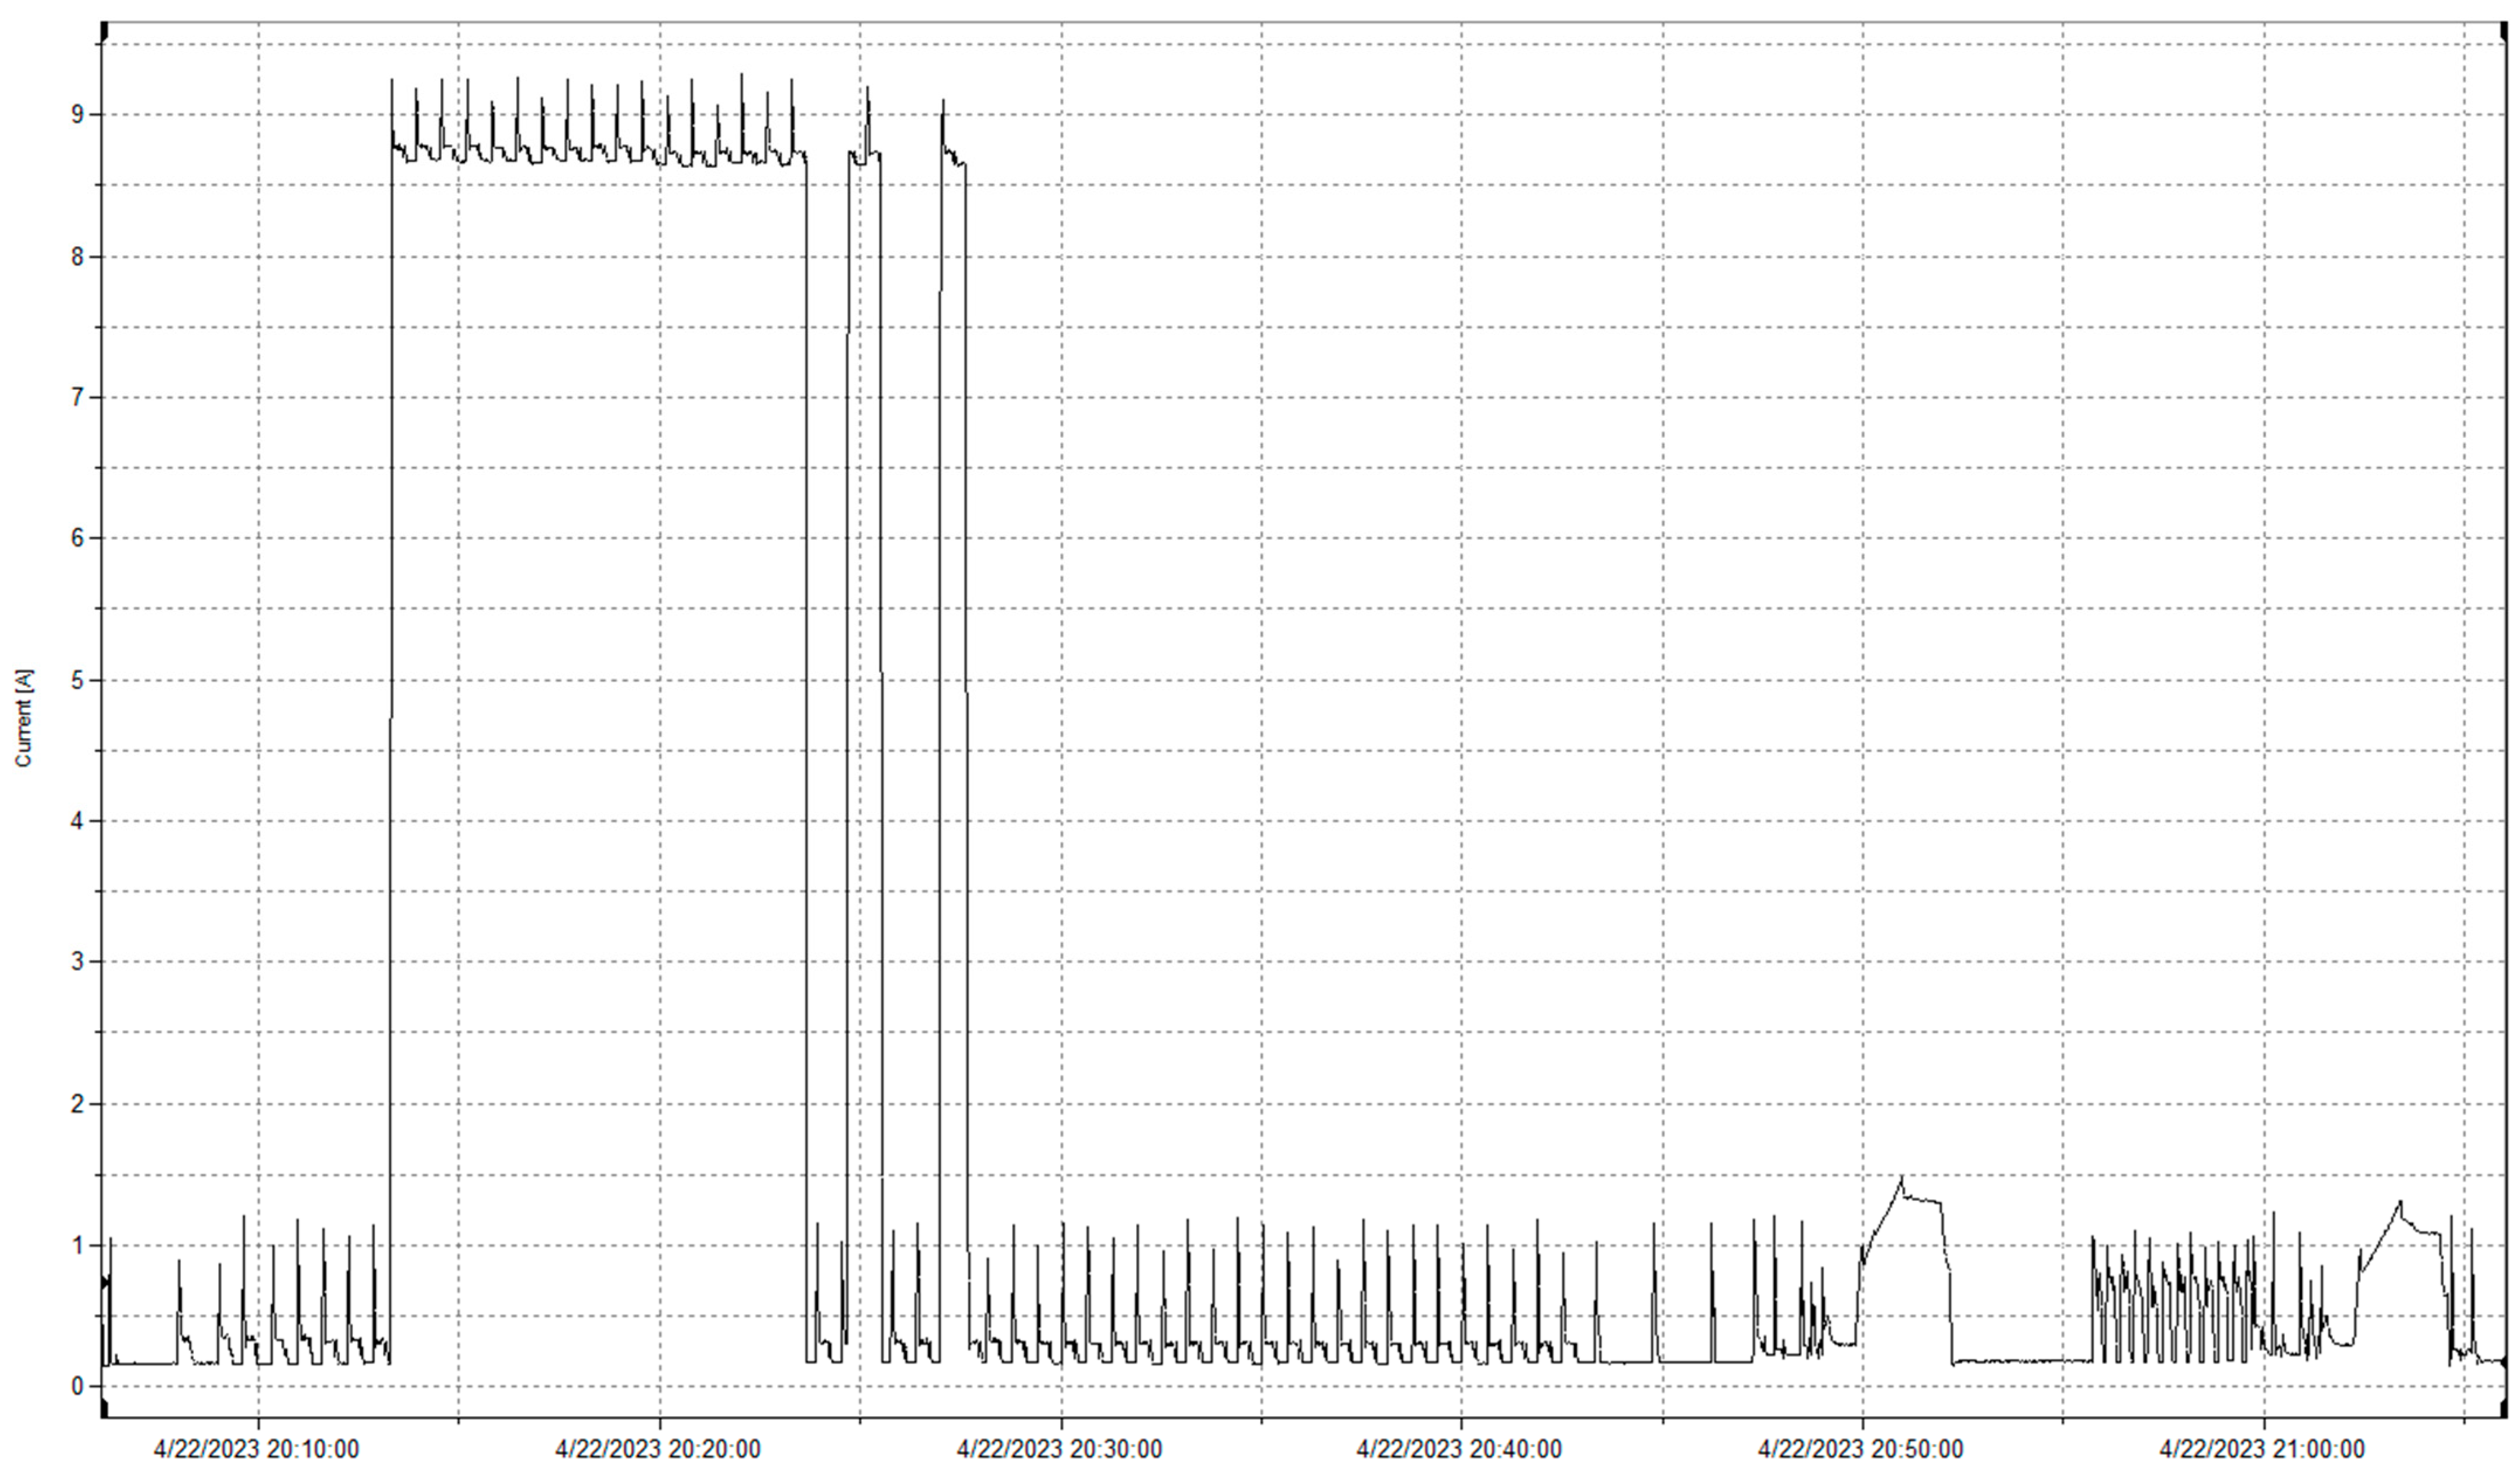
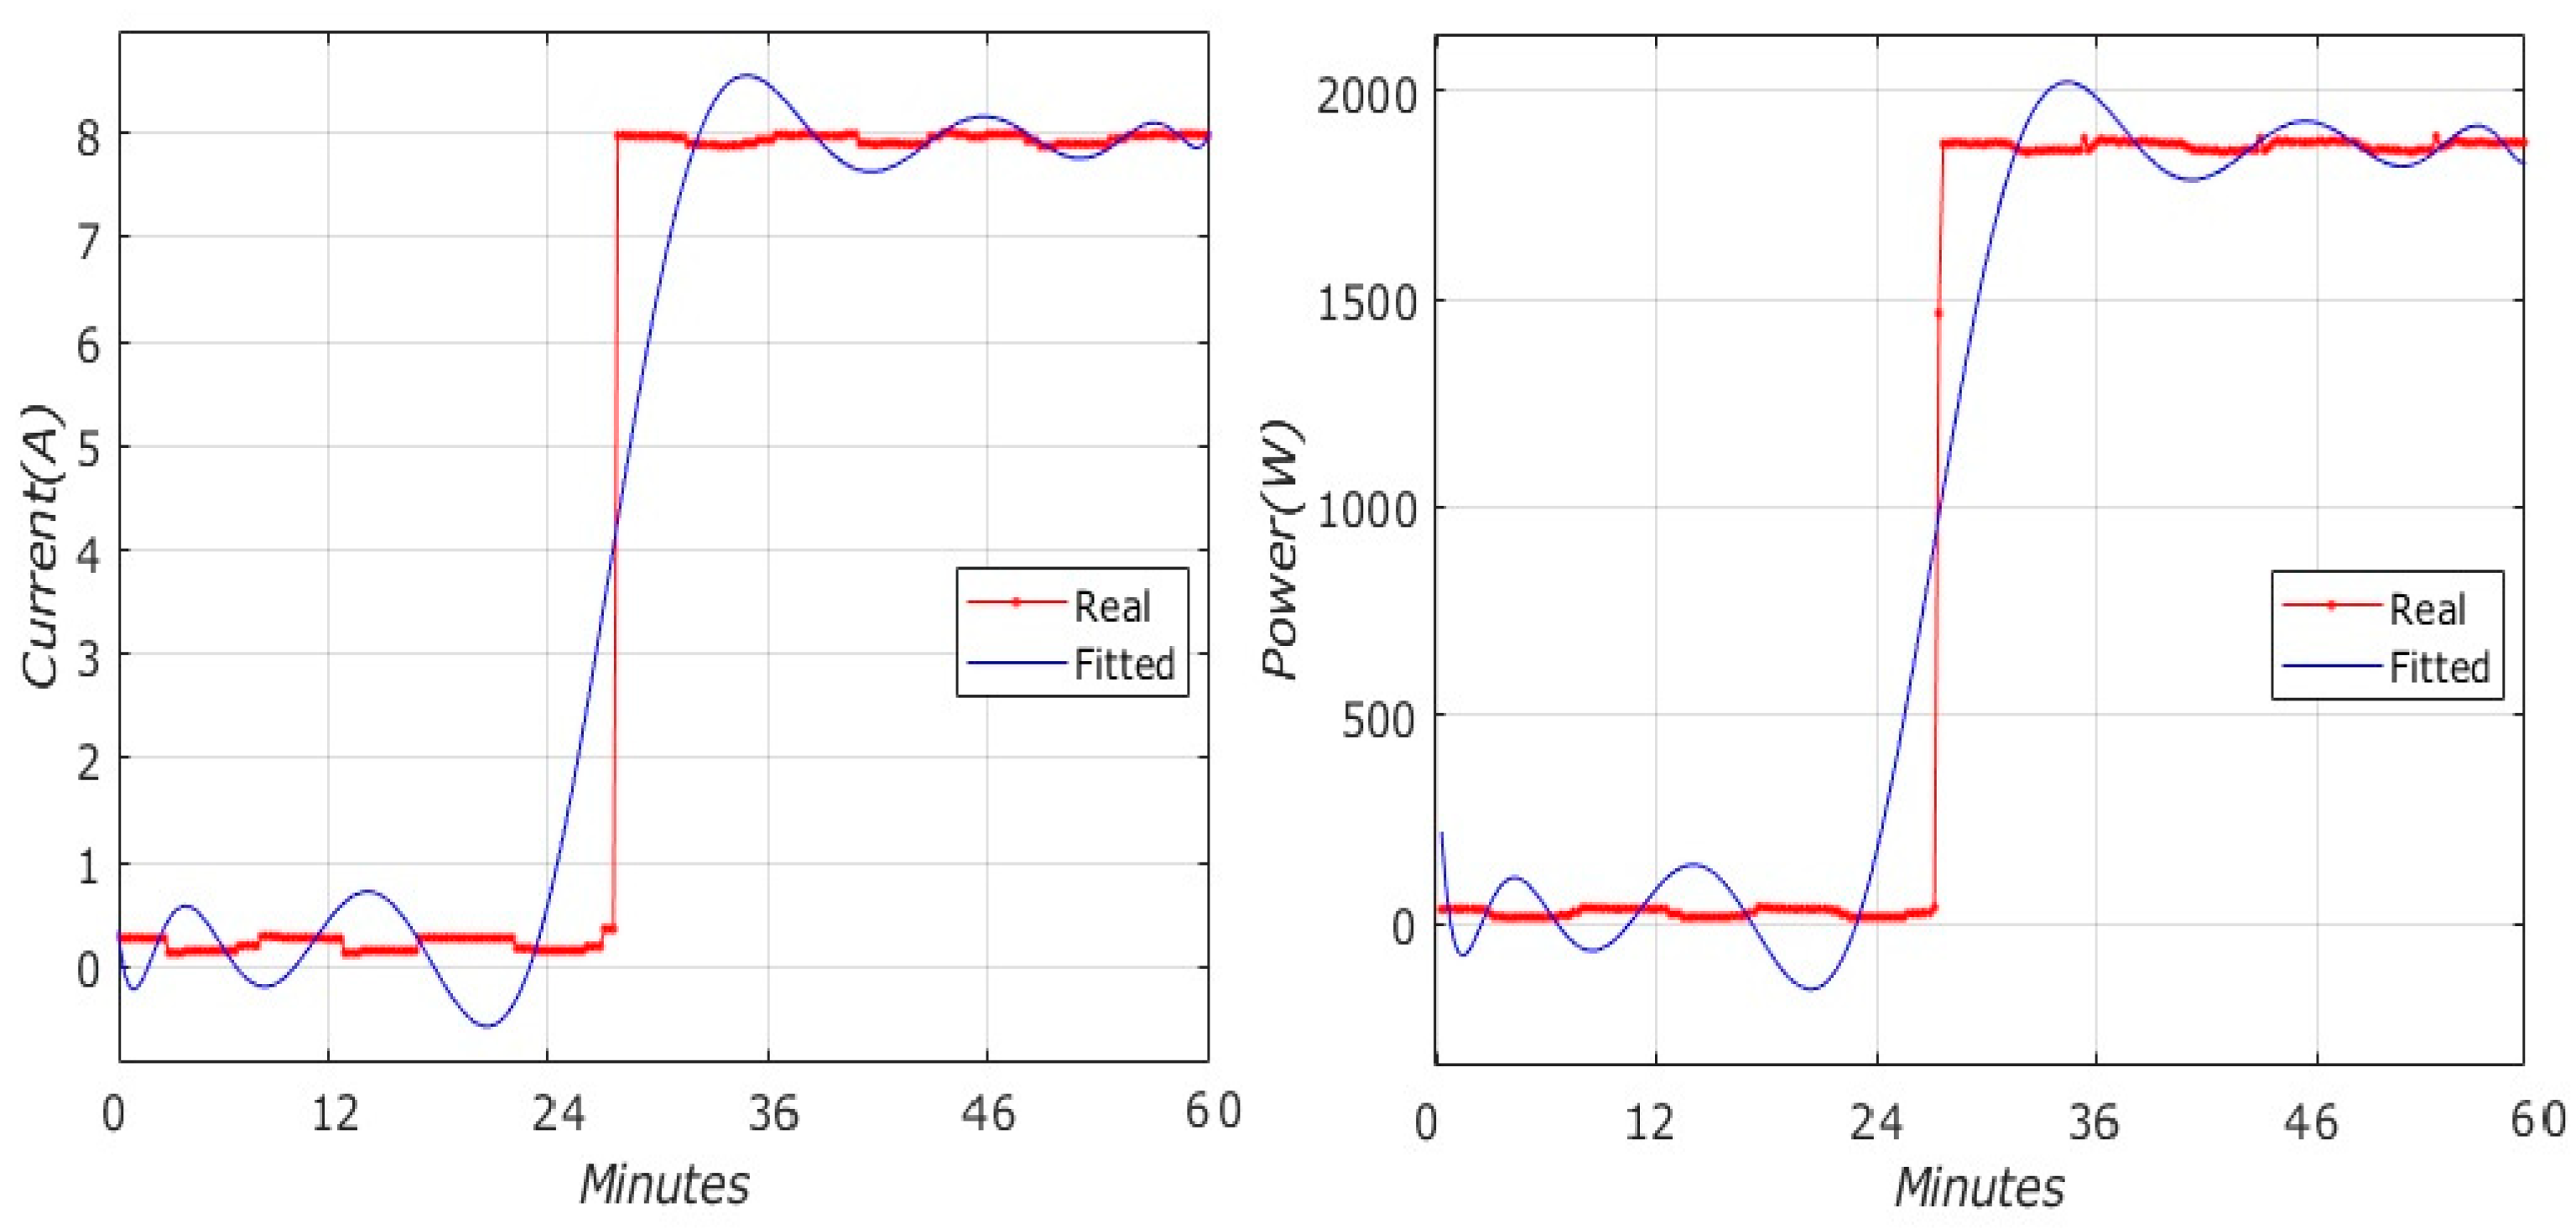
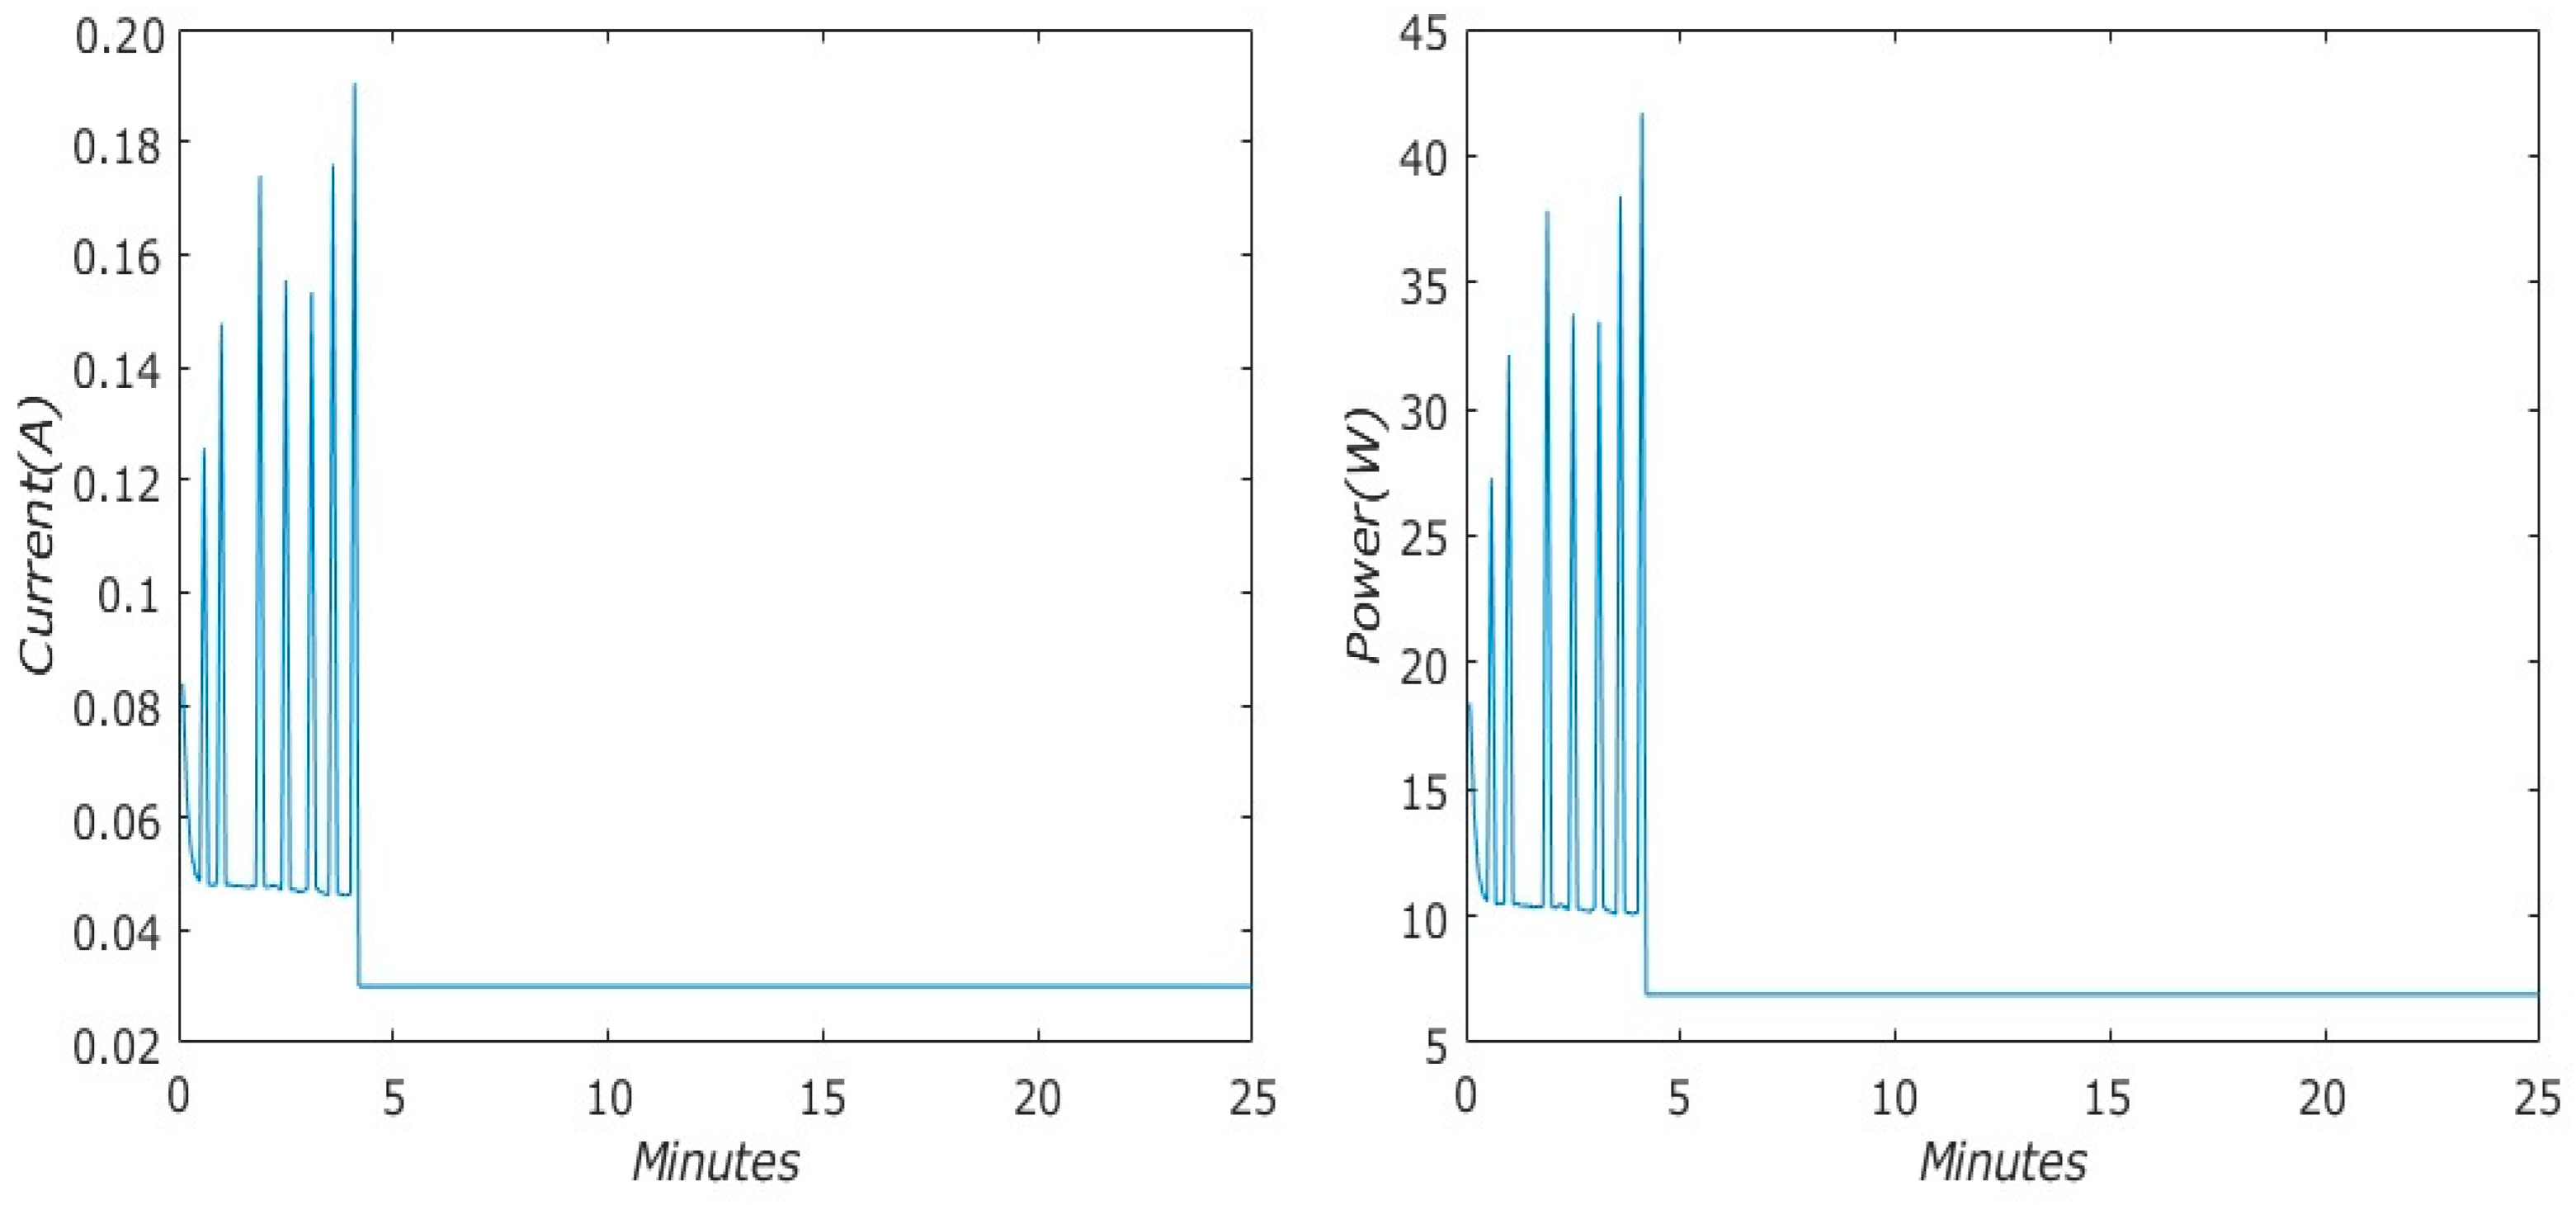
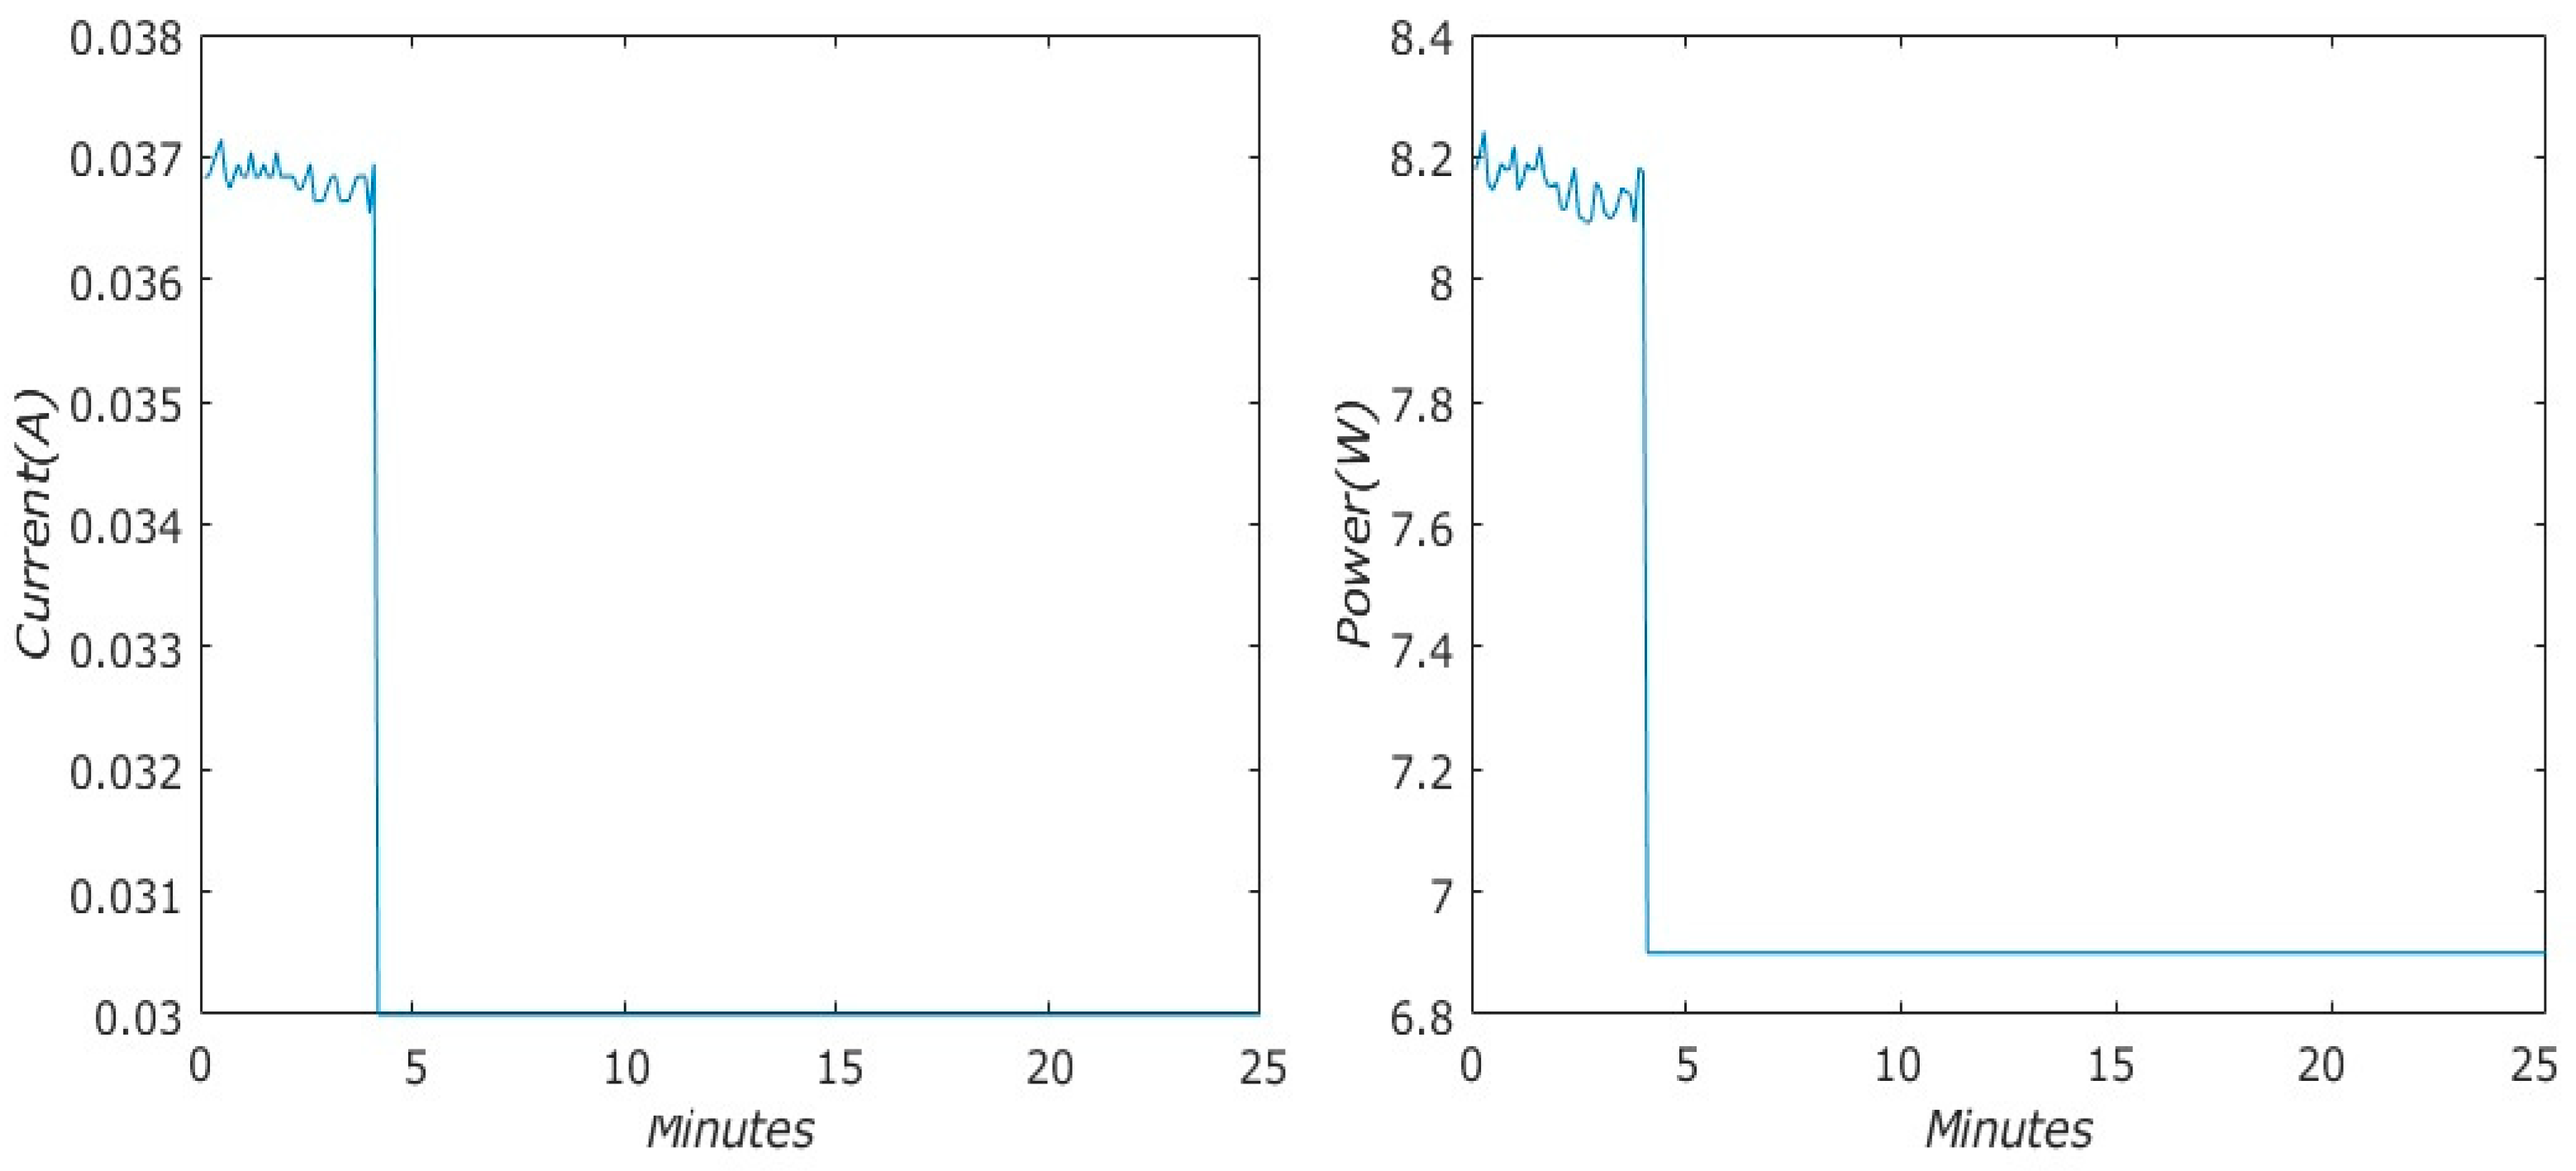
2.1.1. Data Measurement and MATLAB Interpolation of Washing Machine Current and Power Consumption

MATLAB can handle large datasets efficiently and supports parallel computing. This makes it suitable for high-performance computing tasks, where interpolations might need to be performed on large volumes of data. In order to validate the accuracy of the proposed data acquisition (DAQ) system, the washing machine’s normal operation mode was chosen to compare the obtained results with those presented in previous articles [17,18] which were achieved with another DAQ. The DAQ system mentioned in the previous articles was composed of two current sensors (LCSC ZHT103 that was sourced from Guangdong, China and Allegro Microsystem’s ACS712 that was sourced from Guangdong, China) and a voltage sensor (LCSC ZMPT101B that was sourced from Guangdong, China). The sensors were connected to a Texas Instruments ADS1115 ADC that was sourced from Guangdong, China that communicates with the Arduino Nano development board. The conclusion is that both regimes, the normal and the standby, showed similar results in terms of the measurements and polynomial approximations.
Figure 3 and Figure 4 depict the data measurements and MATLAB interpolation of absorbed current and power consumption for the washing machine in normal and standby operation modes. In each figure, the real data measurements are represented in red, while the MATLAB interpolation is depicted in blue.
The total energy consumption of the washing machine in normal mode for 1 h of operation is 1.11260 kWh. This value represents the amount of electrical energy consumed by the washing machine during one hour of typical usage in its normal operating mode.
The total energy consumption of the washing machine in standby mode for 1 h of operation is 0.01886 kWh. This value represents the amount of electrical energy consumed by the washing machine during one hour of typical usage in its standby mode.
In order to easily check the results of the polynomial regression, in Appendix B, we show the lines of code used in the MATLAB R2021b application and, in Appendix C, the numerical values of the measurements made with the proposed DAQ for the washing machine. Measurements were taken every 5 s, which ensures the correct acquisition of data, including those of the transition regimes. The obtained accuracy is that calculated by the MATLAB application.

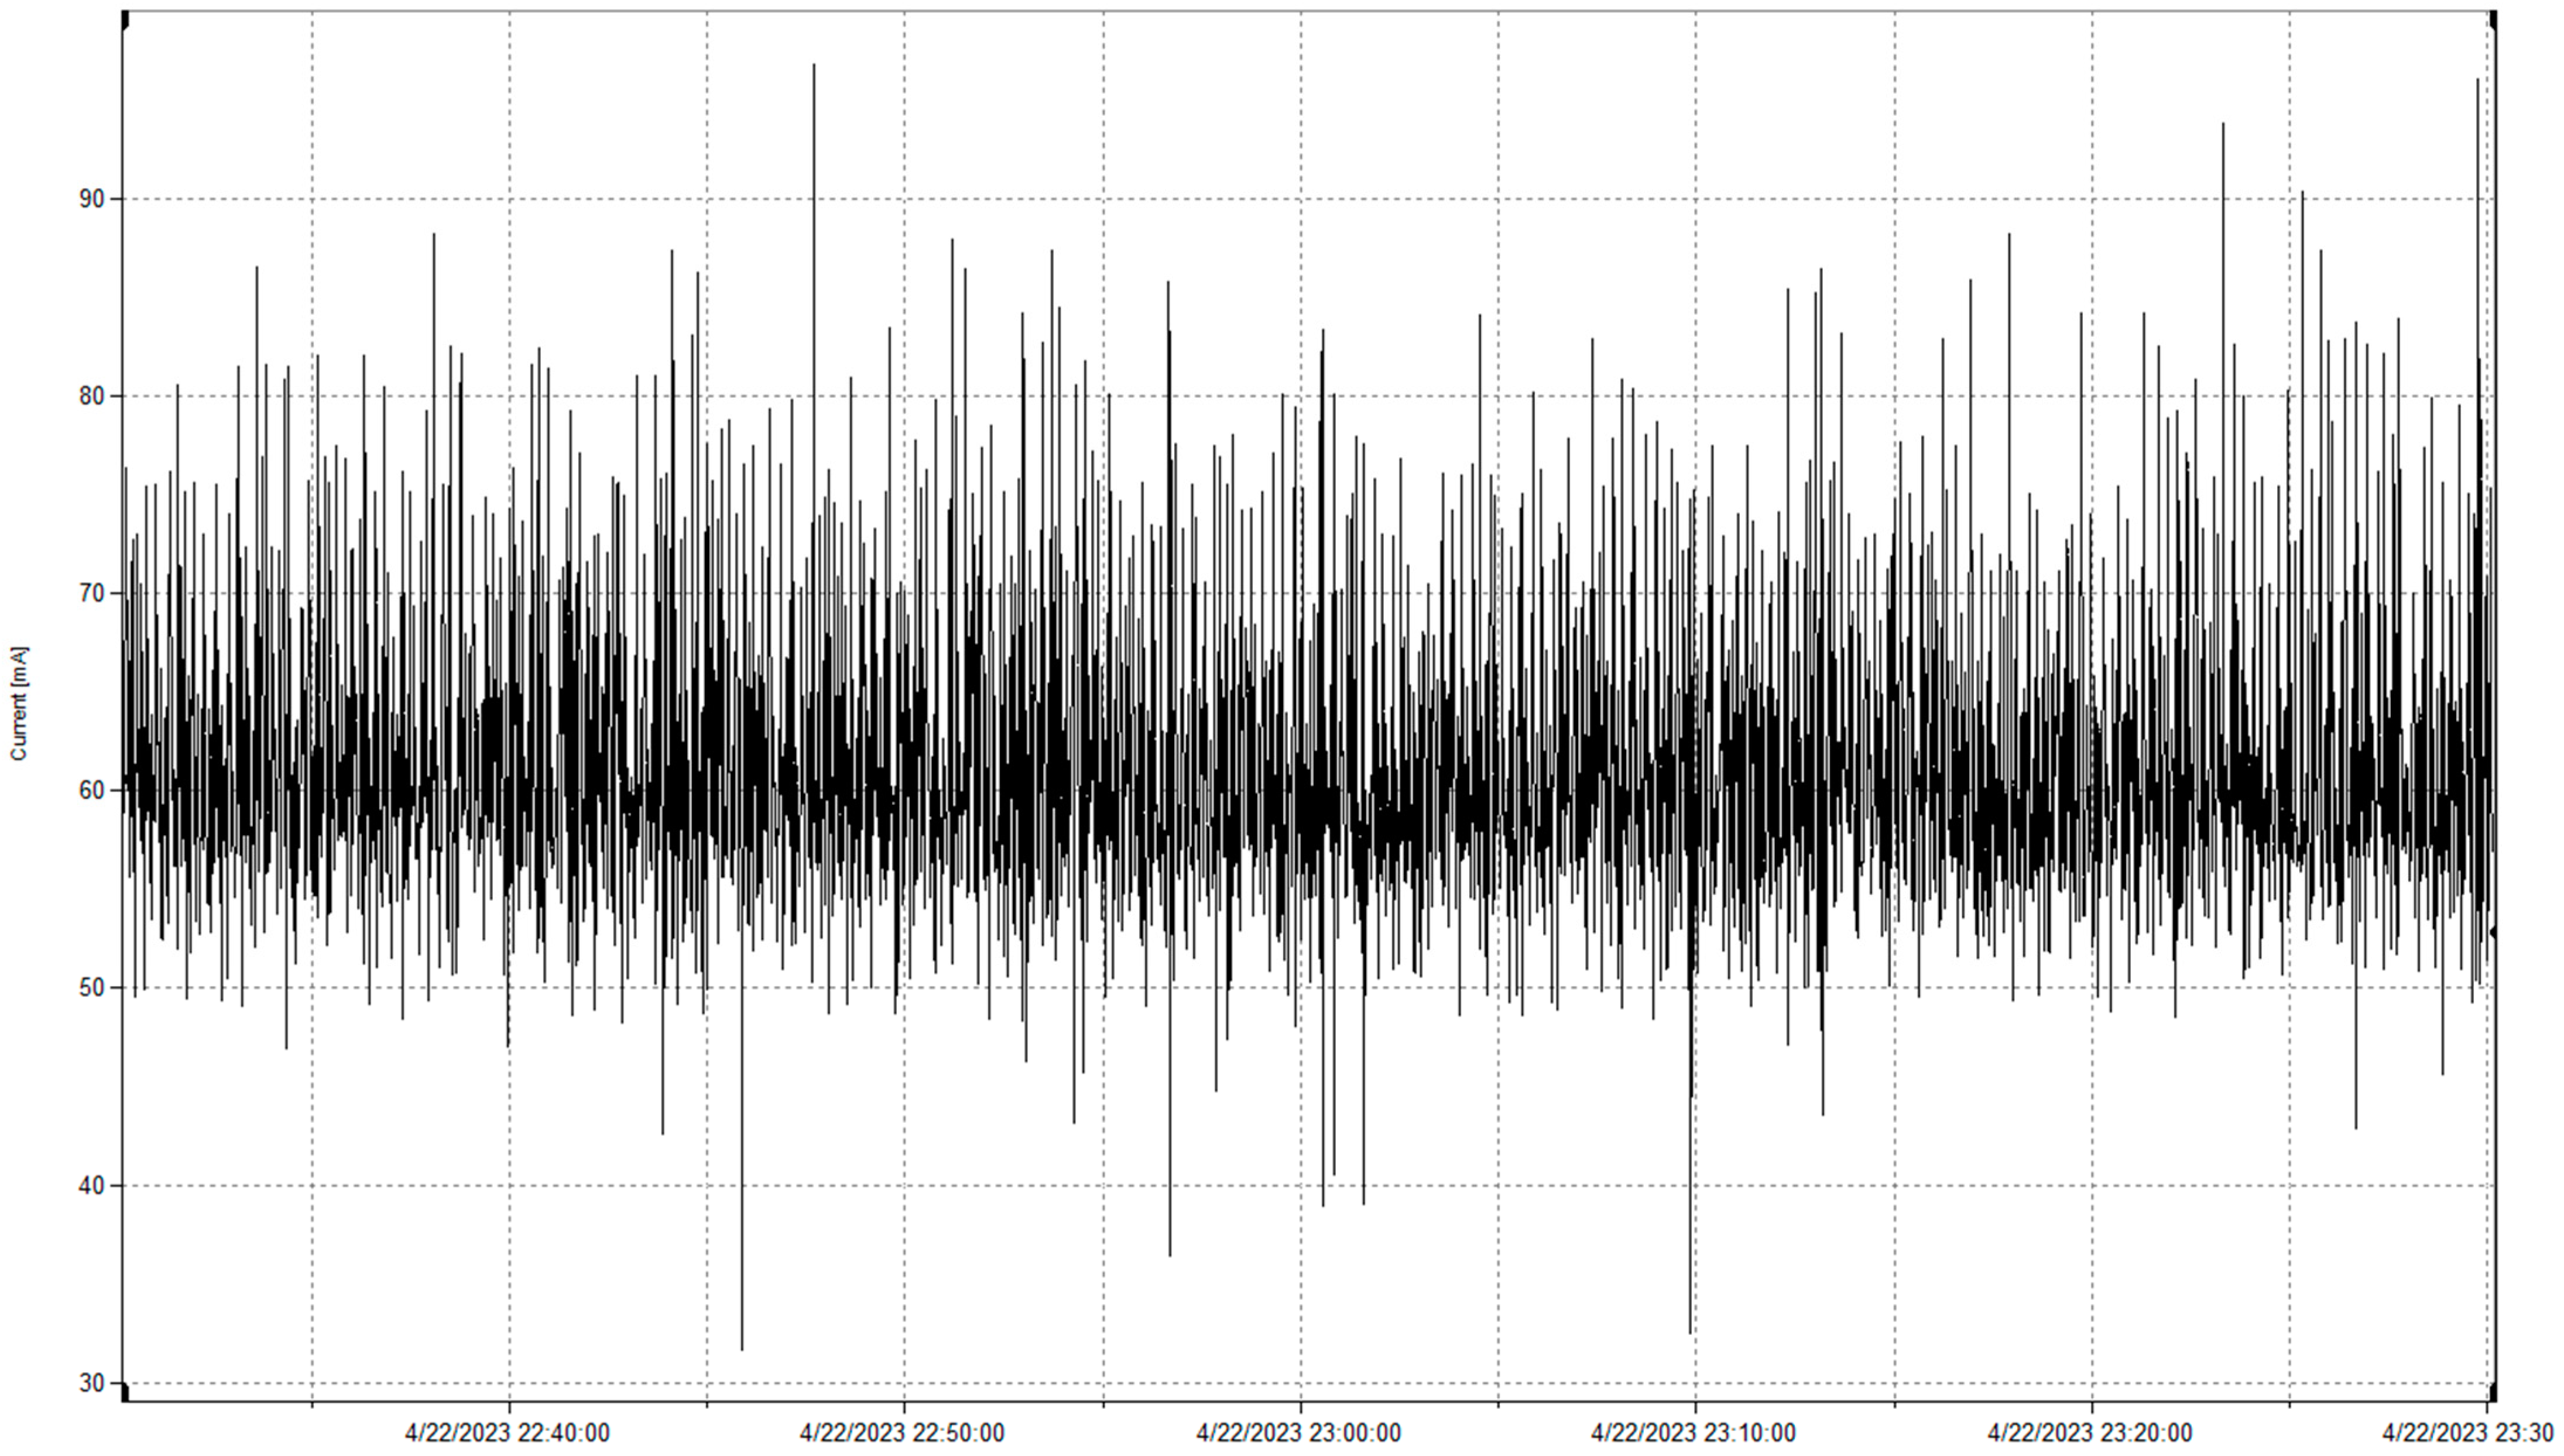
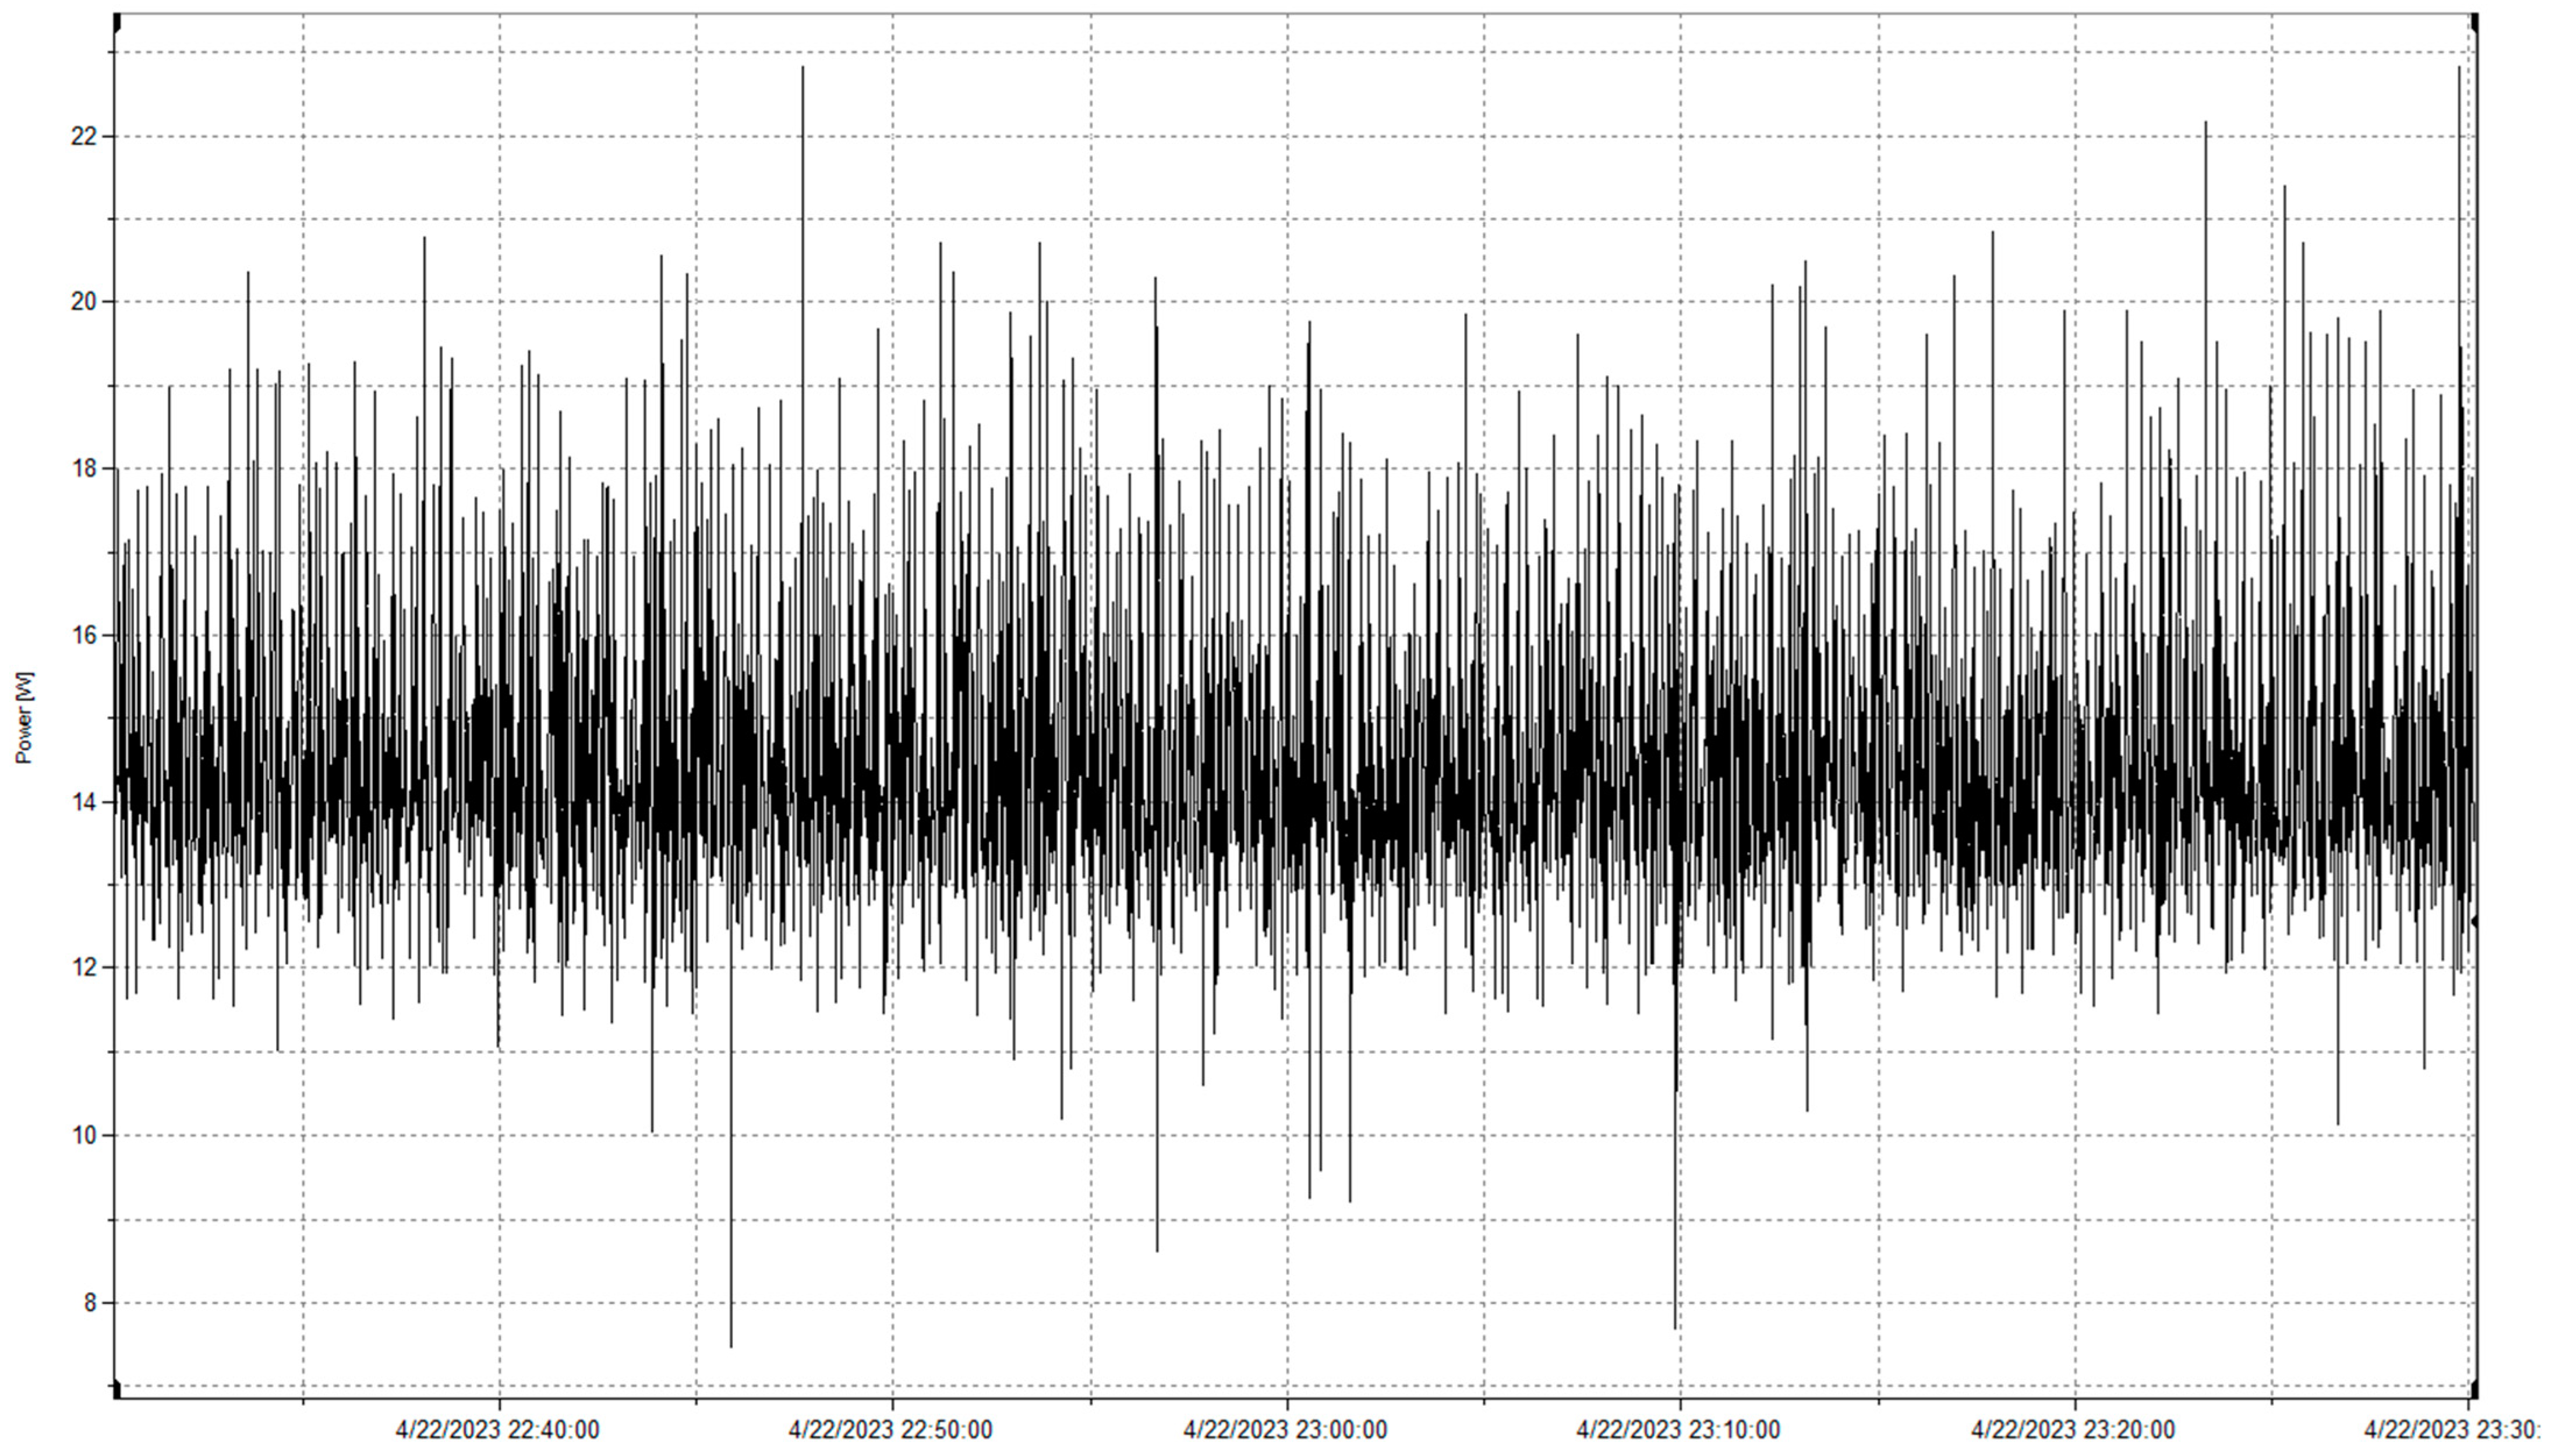
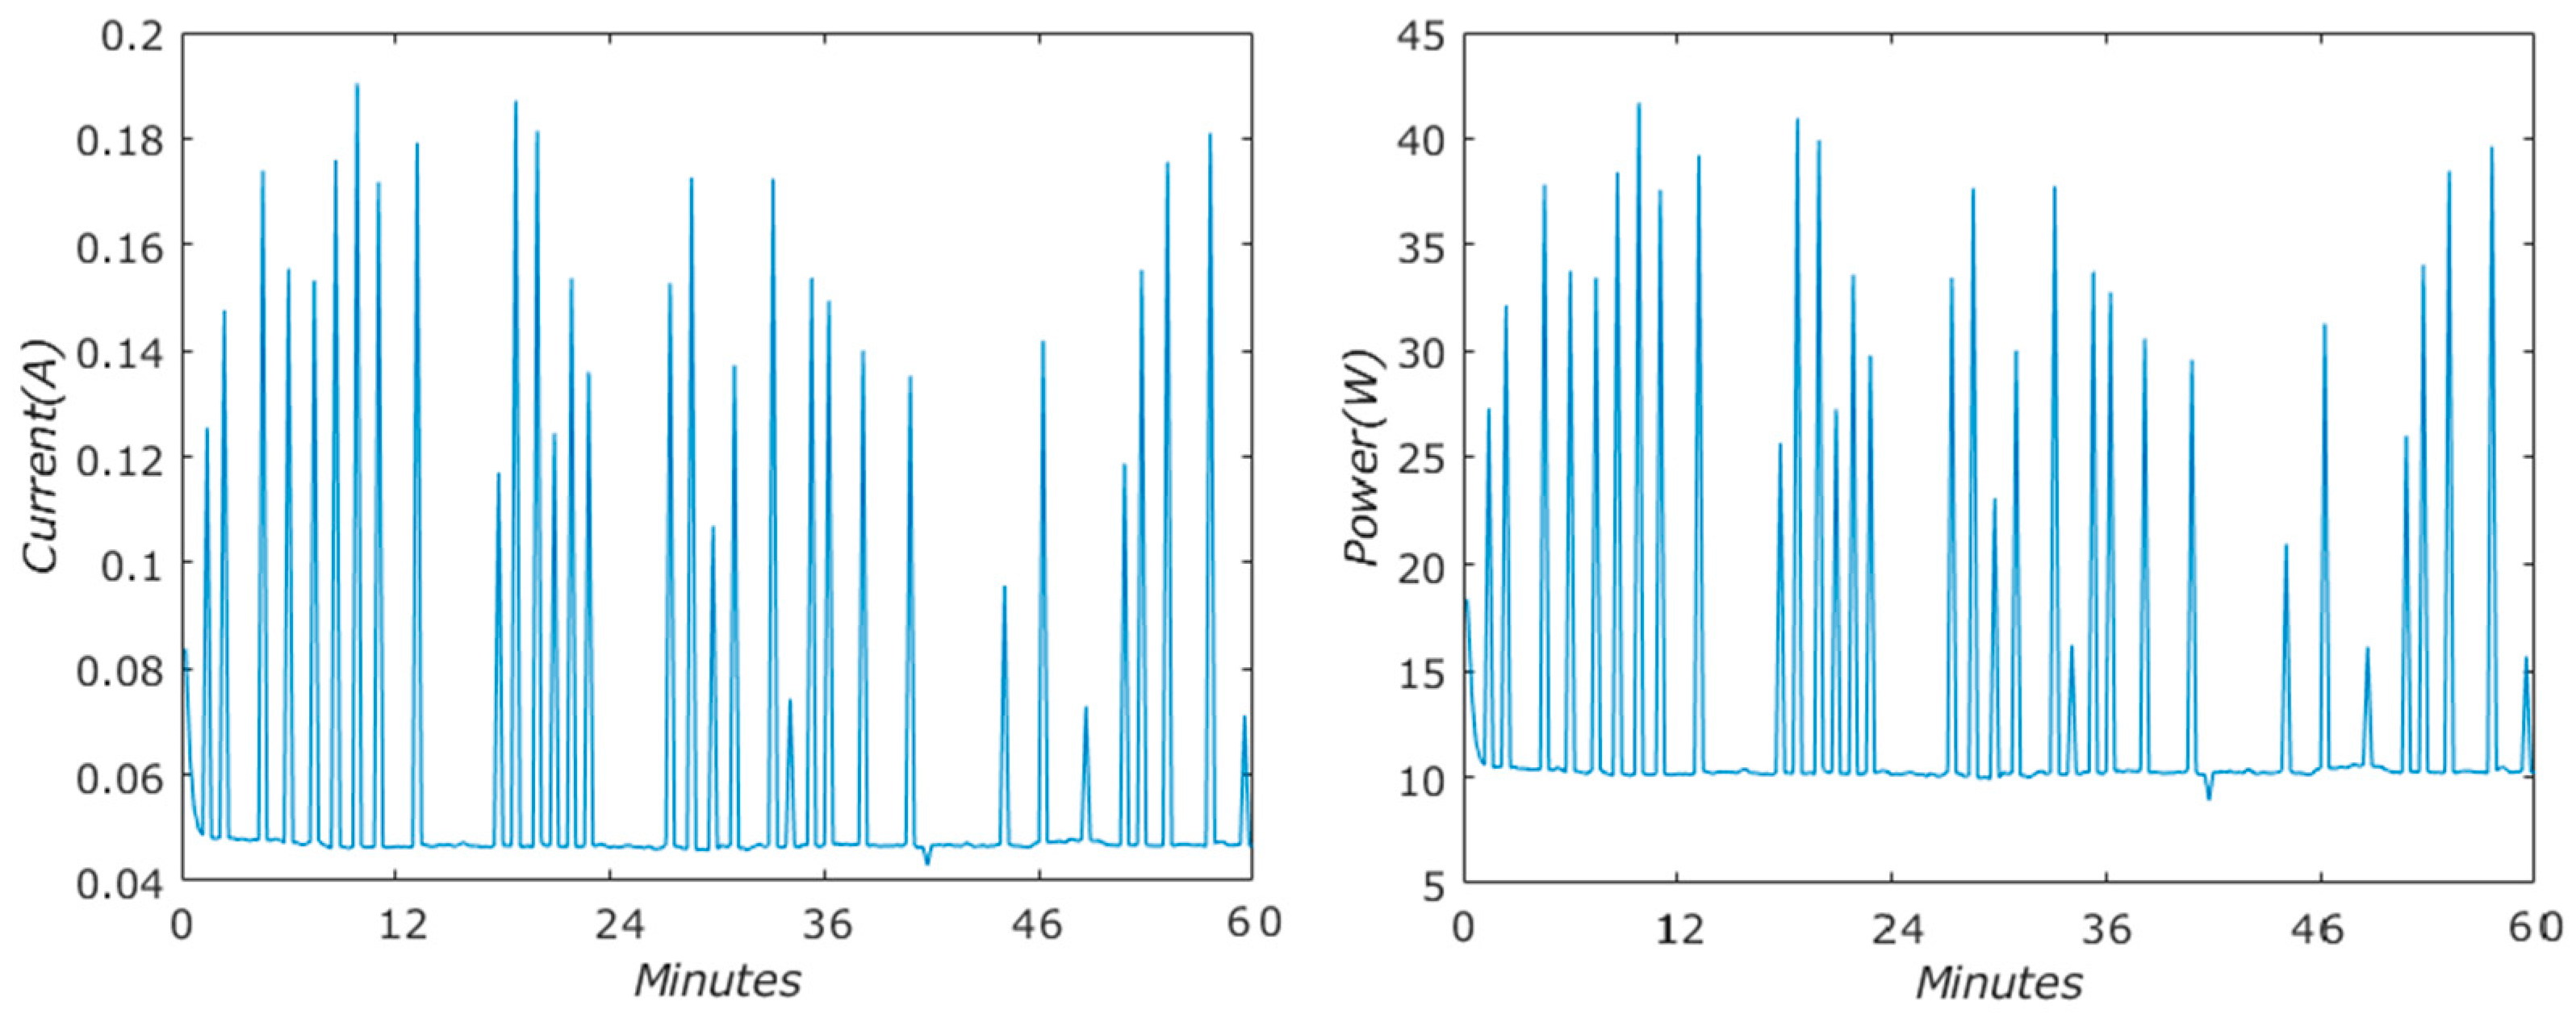
2.1.2. Data Measurement of Laptop Current and Power Consumption

The laptop’s standby mode power usage depicted in Figure 5 ranges from 10 W to 15 W, experiencing occasional surges from 20 W to 43 W due to the operating characteristics of the power supply. The cumulative energy consumption while in standby mode over the course of one hour amounts to 0.01373 kWh.
The standby mode of the laptop mentioned in this article refers to when the laptop is powered off and connected to the electrical network. It is important to note that, regardless of the standby mode of the laptop, whether it is in conventional standby mode, also known as sleep mode, or in hibernation mode, it is equipped with an internal battery that prevents data loss and ensures a smooth transition between operating modes. Measurements for the laptop in turned-off mode (i.e., connected to electrical network) were performed for the same laptop with the Fluke device and the results are similar, as shown in Appendix A.

2.1.3. Data Measurement of TV Current and Power Consumption

The TV’s standby mode power usage, depicted in Figure 6, varies from 7.9 W to 8.1 W. Over an hour in standby mode, its total energy consumption is 0.00815 kWh.

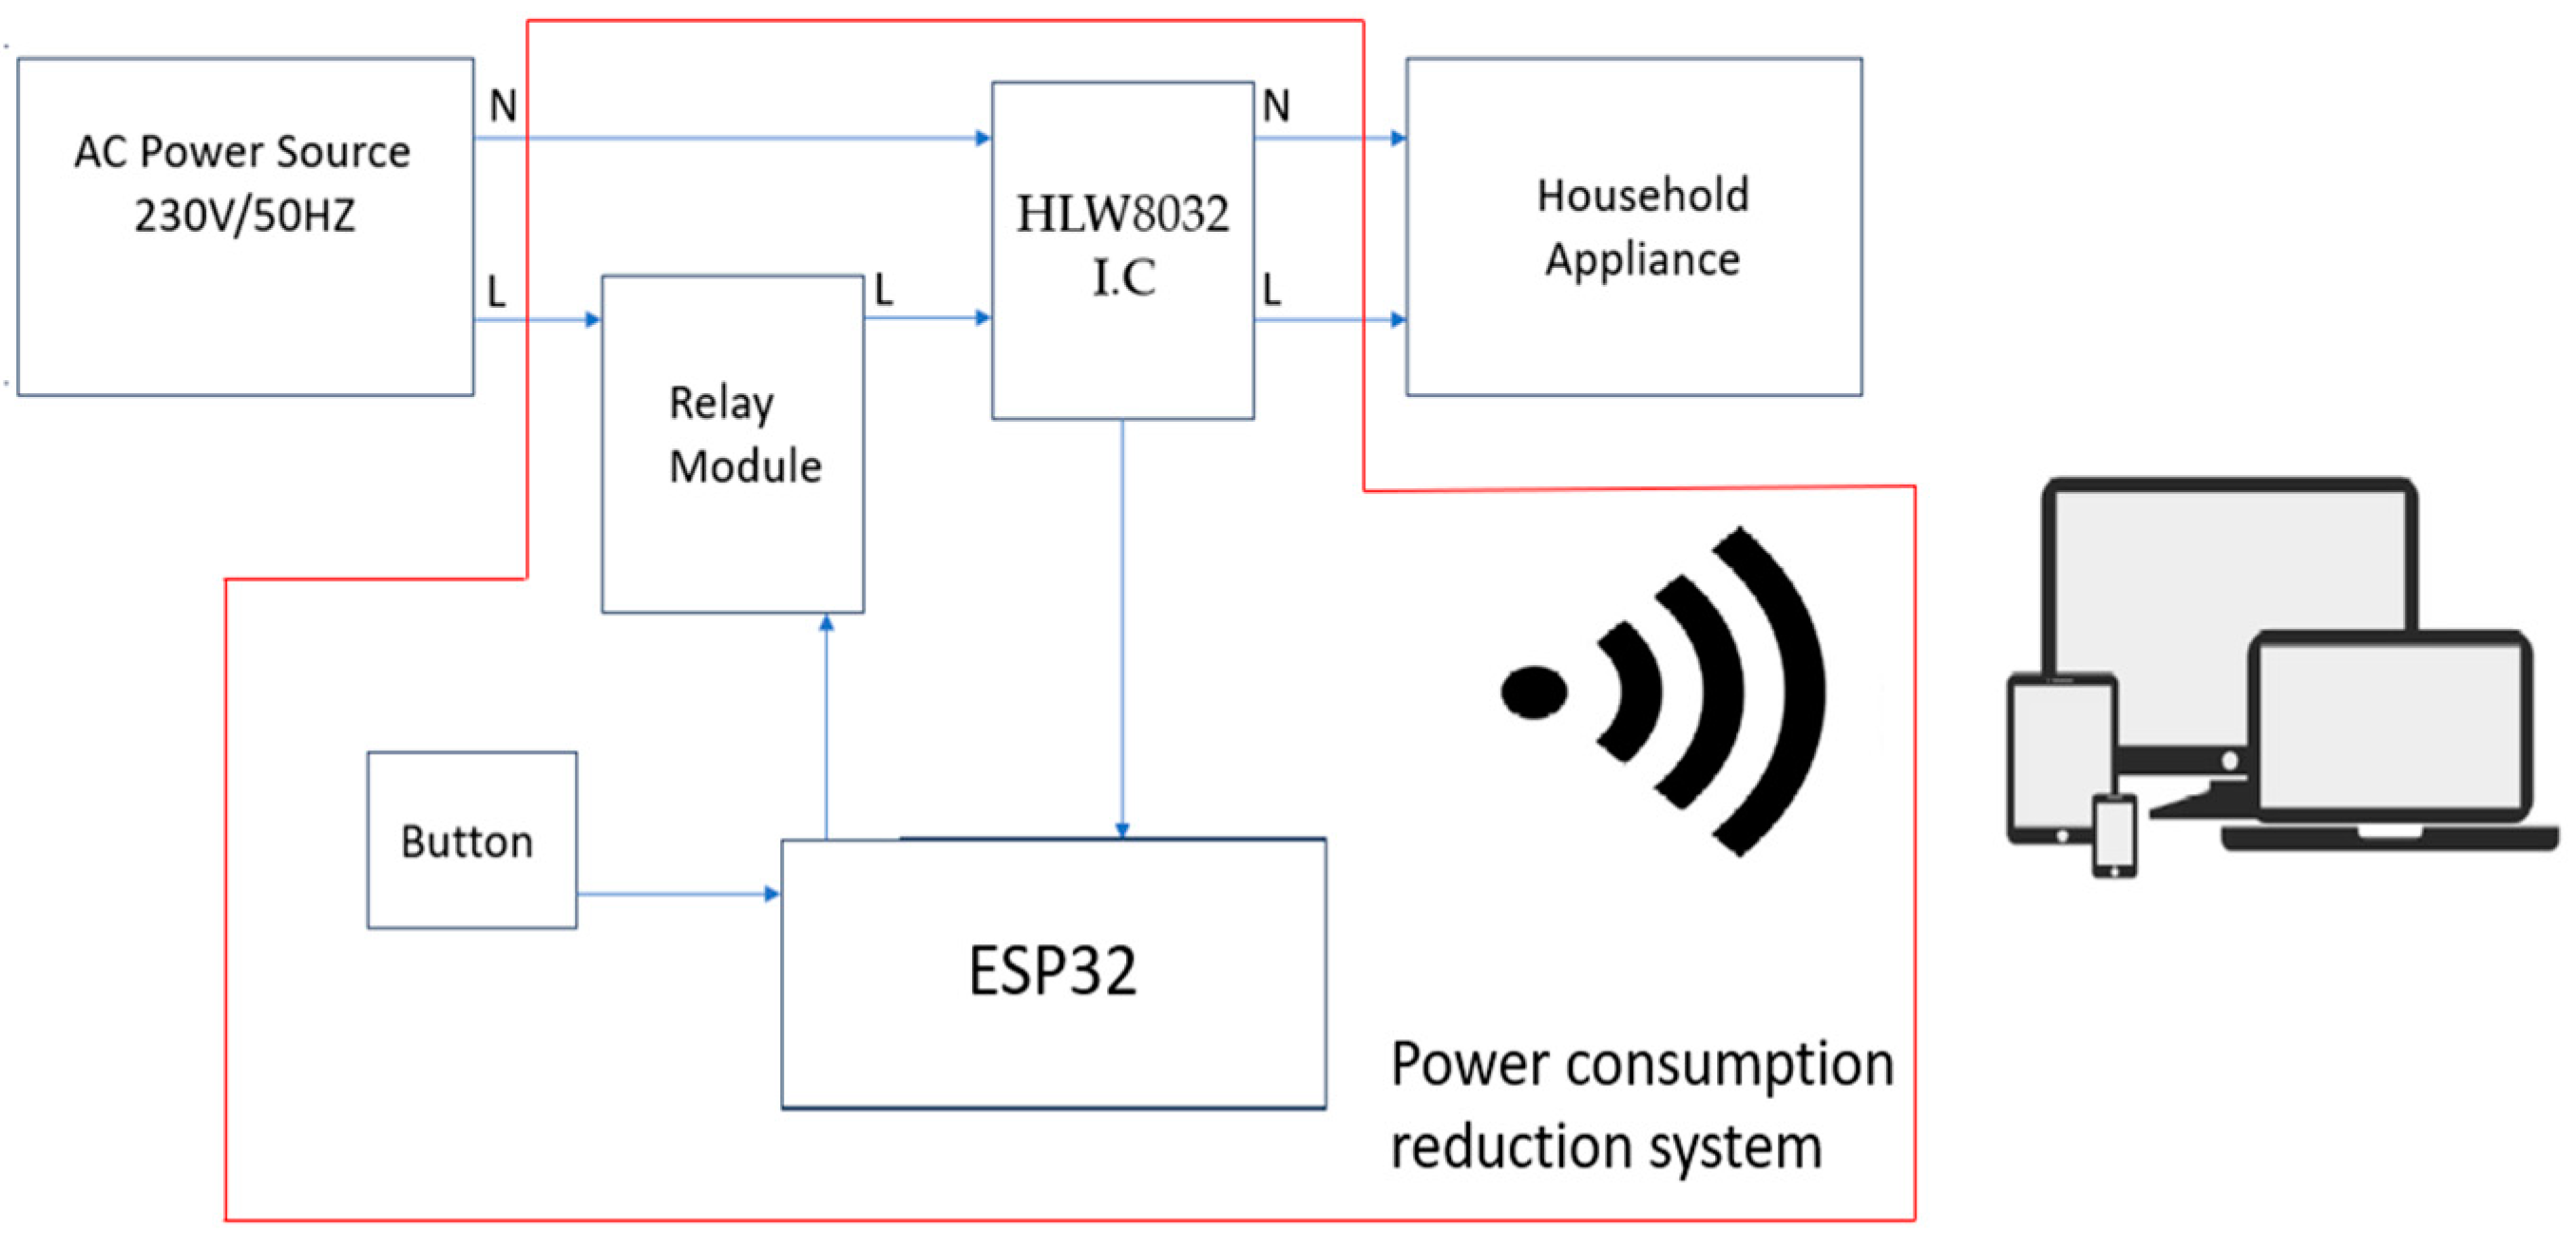
2.2. Proposed System for Power Consumption Reduction

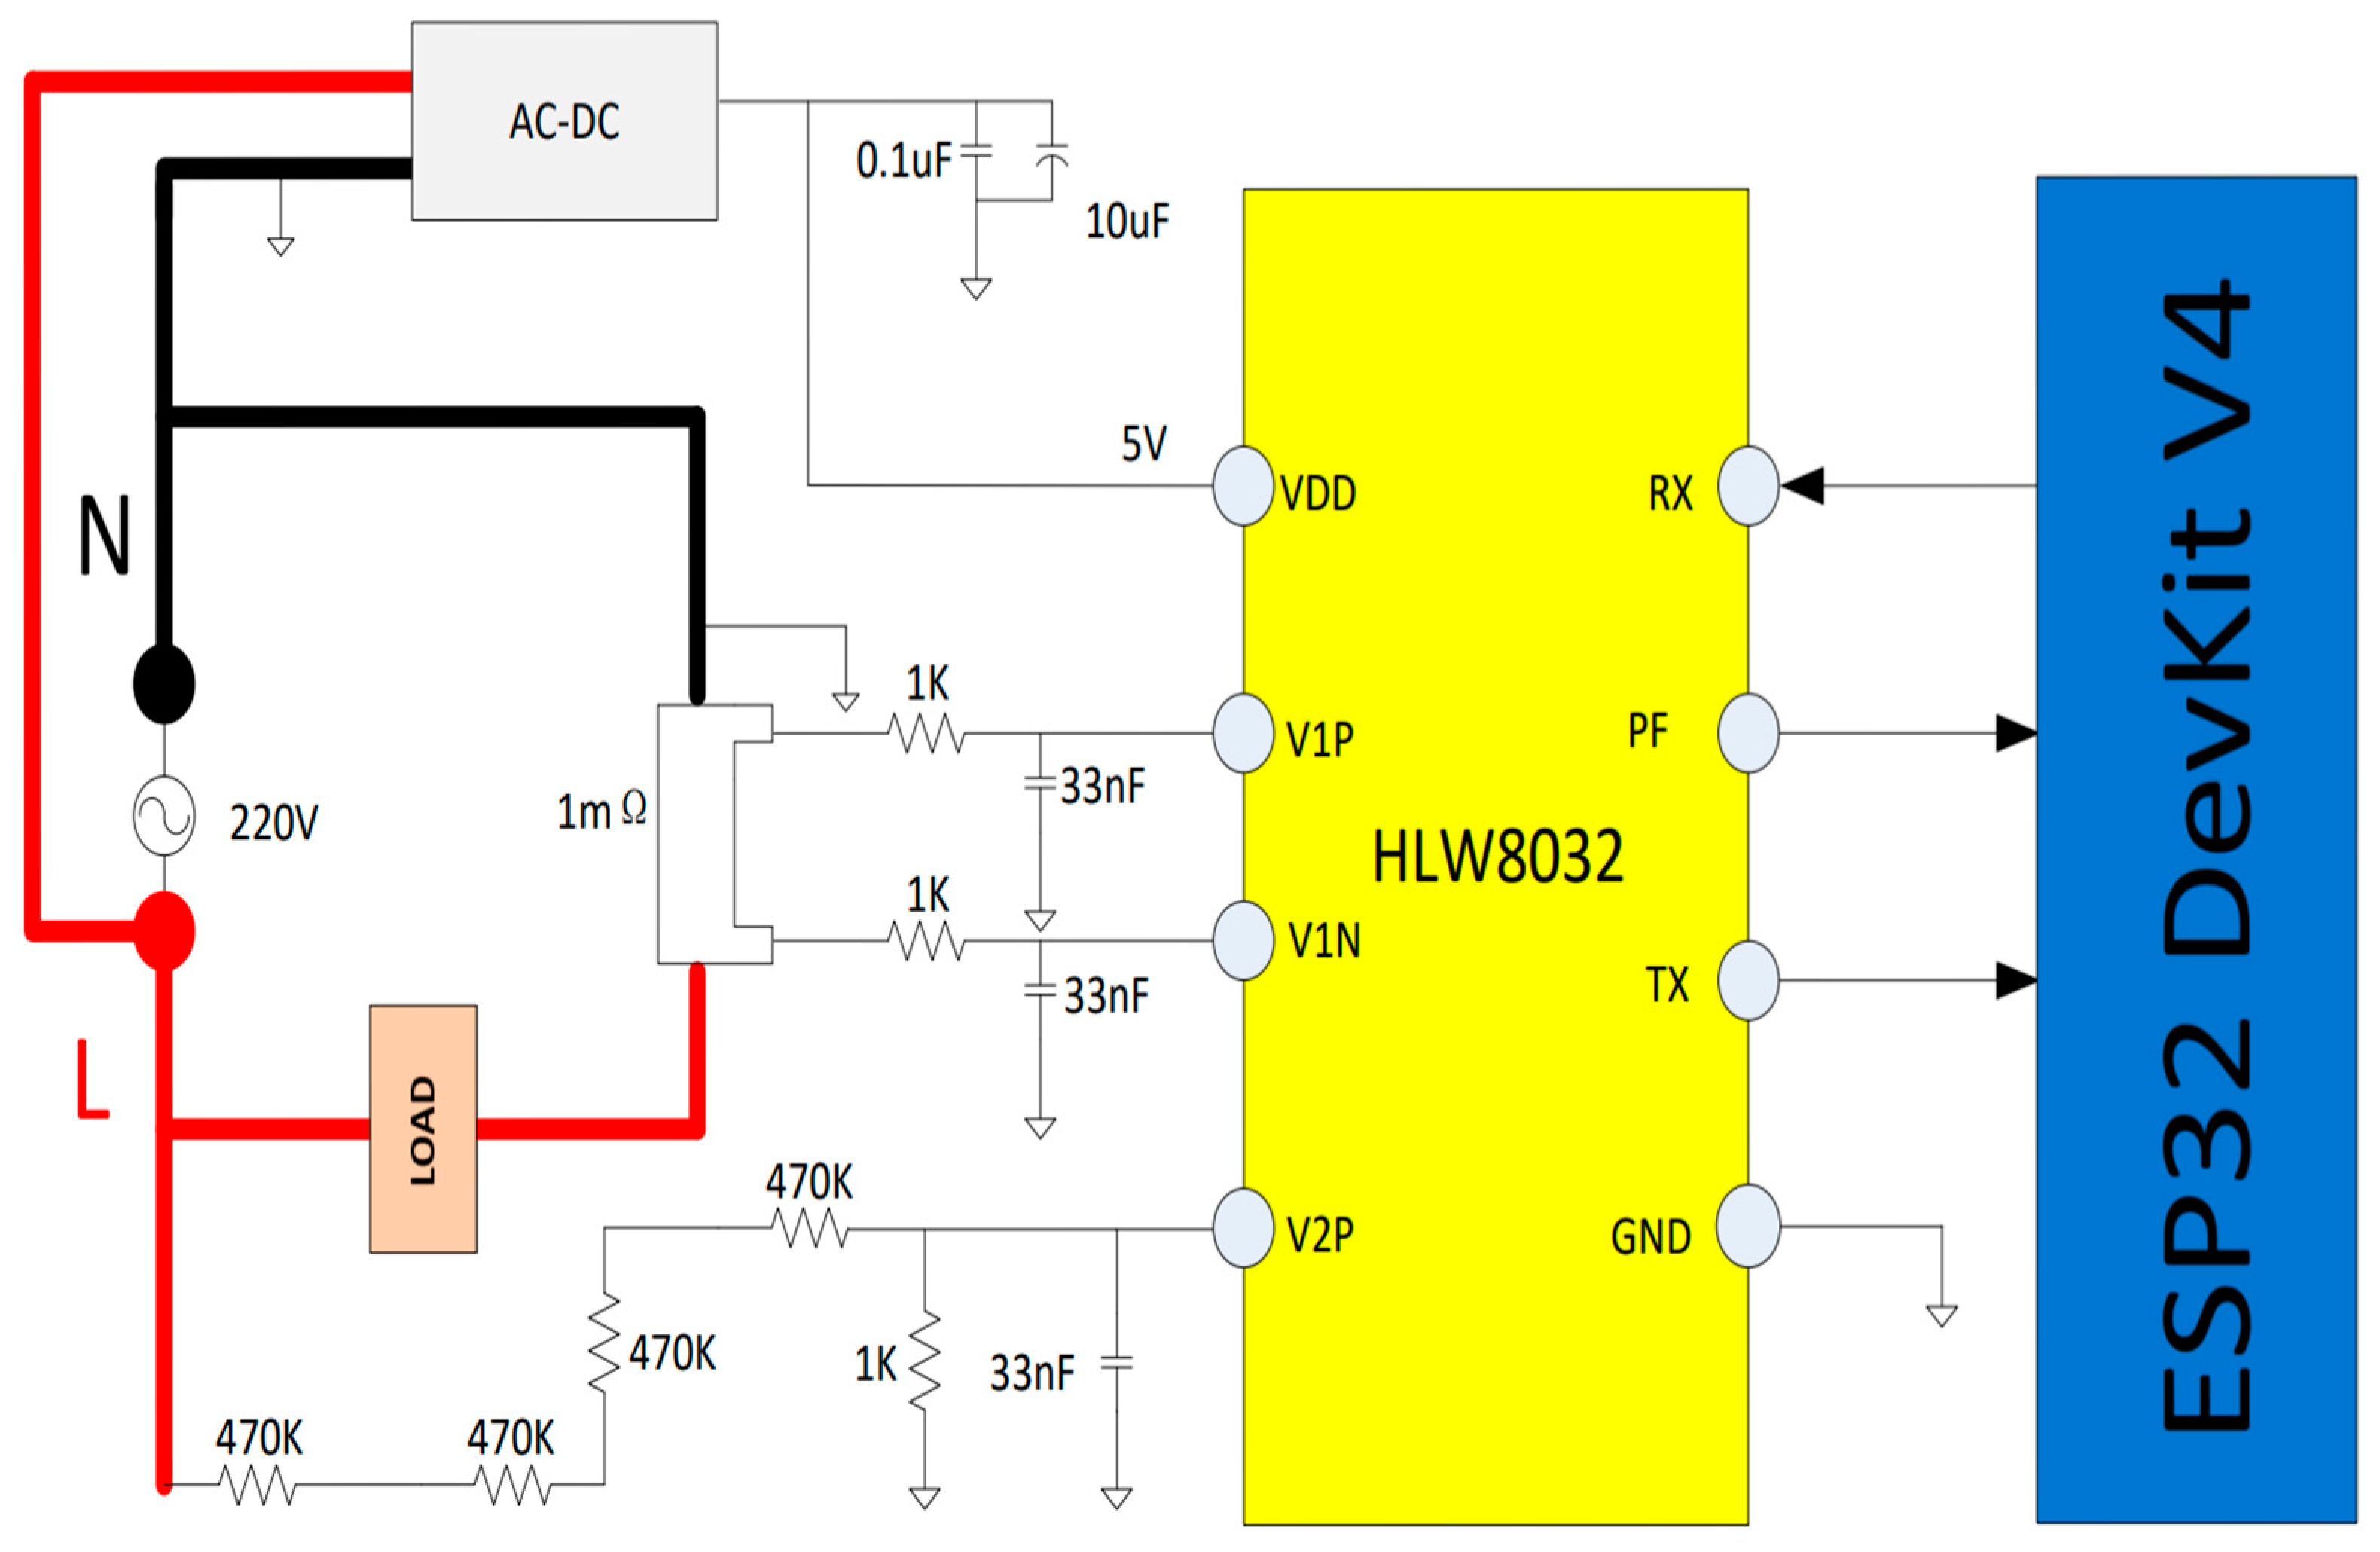
2.2.1. Hardware Architecture

The system’s development incorporates several key components alongside the ESP32 DevKit V4 development board. This setup includes a relay module rated for voltages up to 250 V and currents up to 10 A, a physical button for manual reset control, and the HLW8032 integrated circuit (IC). The enclosure for the system was design using AutoCAD 3D version 24.2, a tool commonly utilized for mechanical design, and was manufactured using 3D printing. The design of the printed circuit board (PCB) is achieved through Proteus, a dedicated circuit design software program.
Figure 7 outlines the schematic of our power reduction system. Key components, the relay module and HLW8032 IC, which is interconnected between the AC source and the household equipment, read the value of the absorbed current and interrupt the power connection when this value corresponds to standby mode. This read value of the absorbed current and the control of the relay are achieved by data measured and stored in the ESP32-based developing board. For the safety and resilience of the proposed system, ESP32 is equipped with a physical button used to reset the system. A web application enables direct wireless linkage to the system, serving as the primary interface for its configuration and management.
A short description of the hardware components of the proposed system is presented below.
(A)
ESP32 DevKit V4
The ESP32 DevKit V4 is a compact, versatile development board designed for IoT projects, powered by Espressif Systems’ ESP32 chip. It features a dual-core processor running up to 240 MHz, integrated Wi-Fi and Bluetooth 4.2 BLE for wireless connectivity, and comes equipped with 520 KB of SRAM and 4 MB of flash memory. The board offers numerous GPIO pins for connecting sensors and actuators, supports power through a micro-USB port or battery, and can be programmed using the ESP-IDF, Arduino IDE, or MicroPython. Its small size and breadboard-friendly design make it ideal for a wide range of applications, from wearable tech to smart home devices, catering to both beginners and professional developers [28].
(B)
Relay module
The single-channel relay module is a handy board designed for controlling high-voltage (up to 250 V AC) and high-current (up to 10 A) devices, like motors, solenoid valves, and lights. It is compatible with most 5 V microcontrollers currently available. This module features terminals (COM, NO, and NC) that can be easily connected or disconnected using screw terminals. Additionally, it includes an LED indicator to show the relay’s operational status [29,30].
(C)
HLW8032 IC
The HLW8032 is a highly accurate integrated circuit (IC) designed for electrical energy measurement in applications such as smart home devices, power management systems, and appliances requiring precise power consumption monitoring. It offers high-precision measurements of voltage, current, and power across a wide range, and features a serial interface for easy integration with microcontrollers. This low-power IC is notable for its energy efficiency, calibration capabilities, and support for external adjustments to enhance accuracy. Its compact design makes it ideal for space-constrained projects, positioning the HLW8032 as a versatile choice for developers aiming to incorporate detailed energy monitoring and management into their designs [31,32,33].

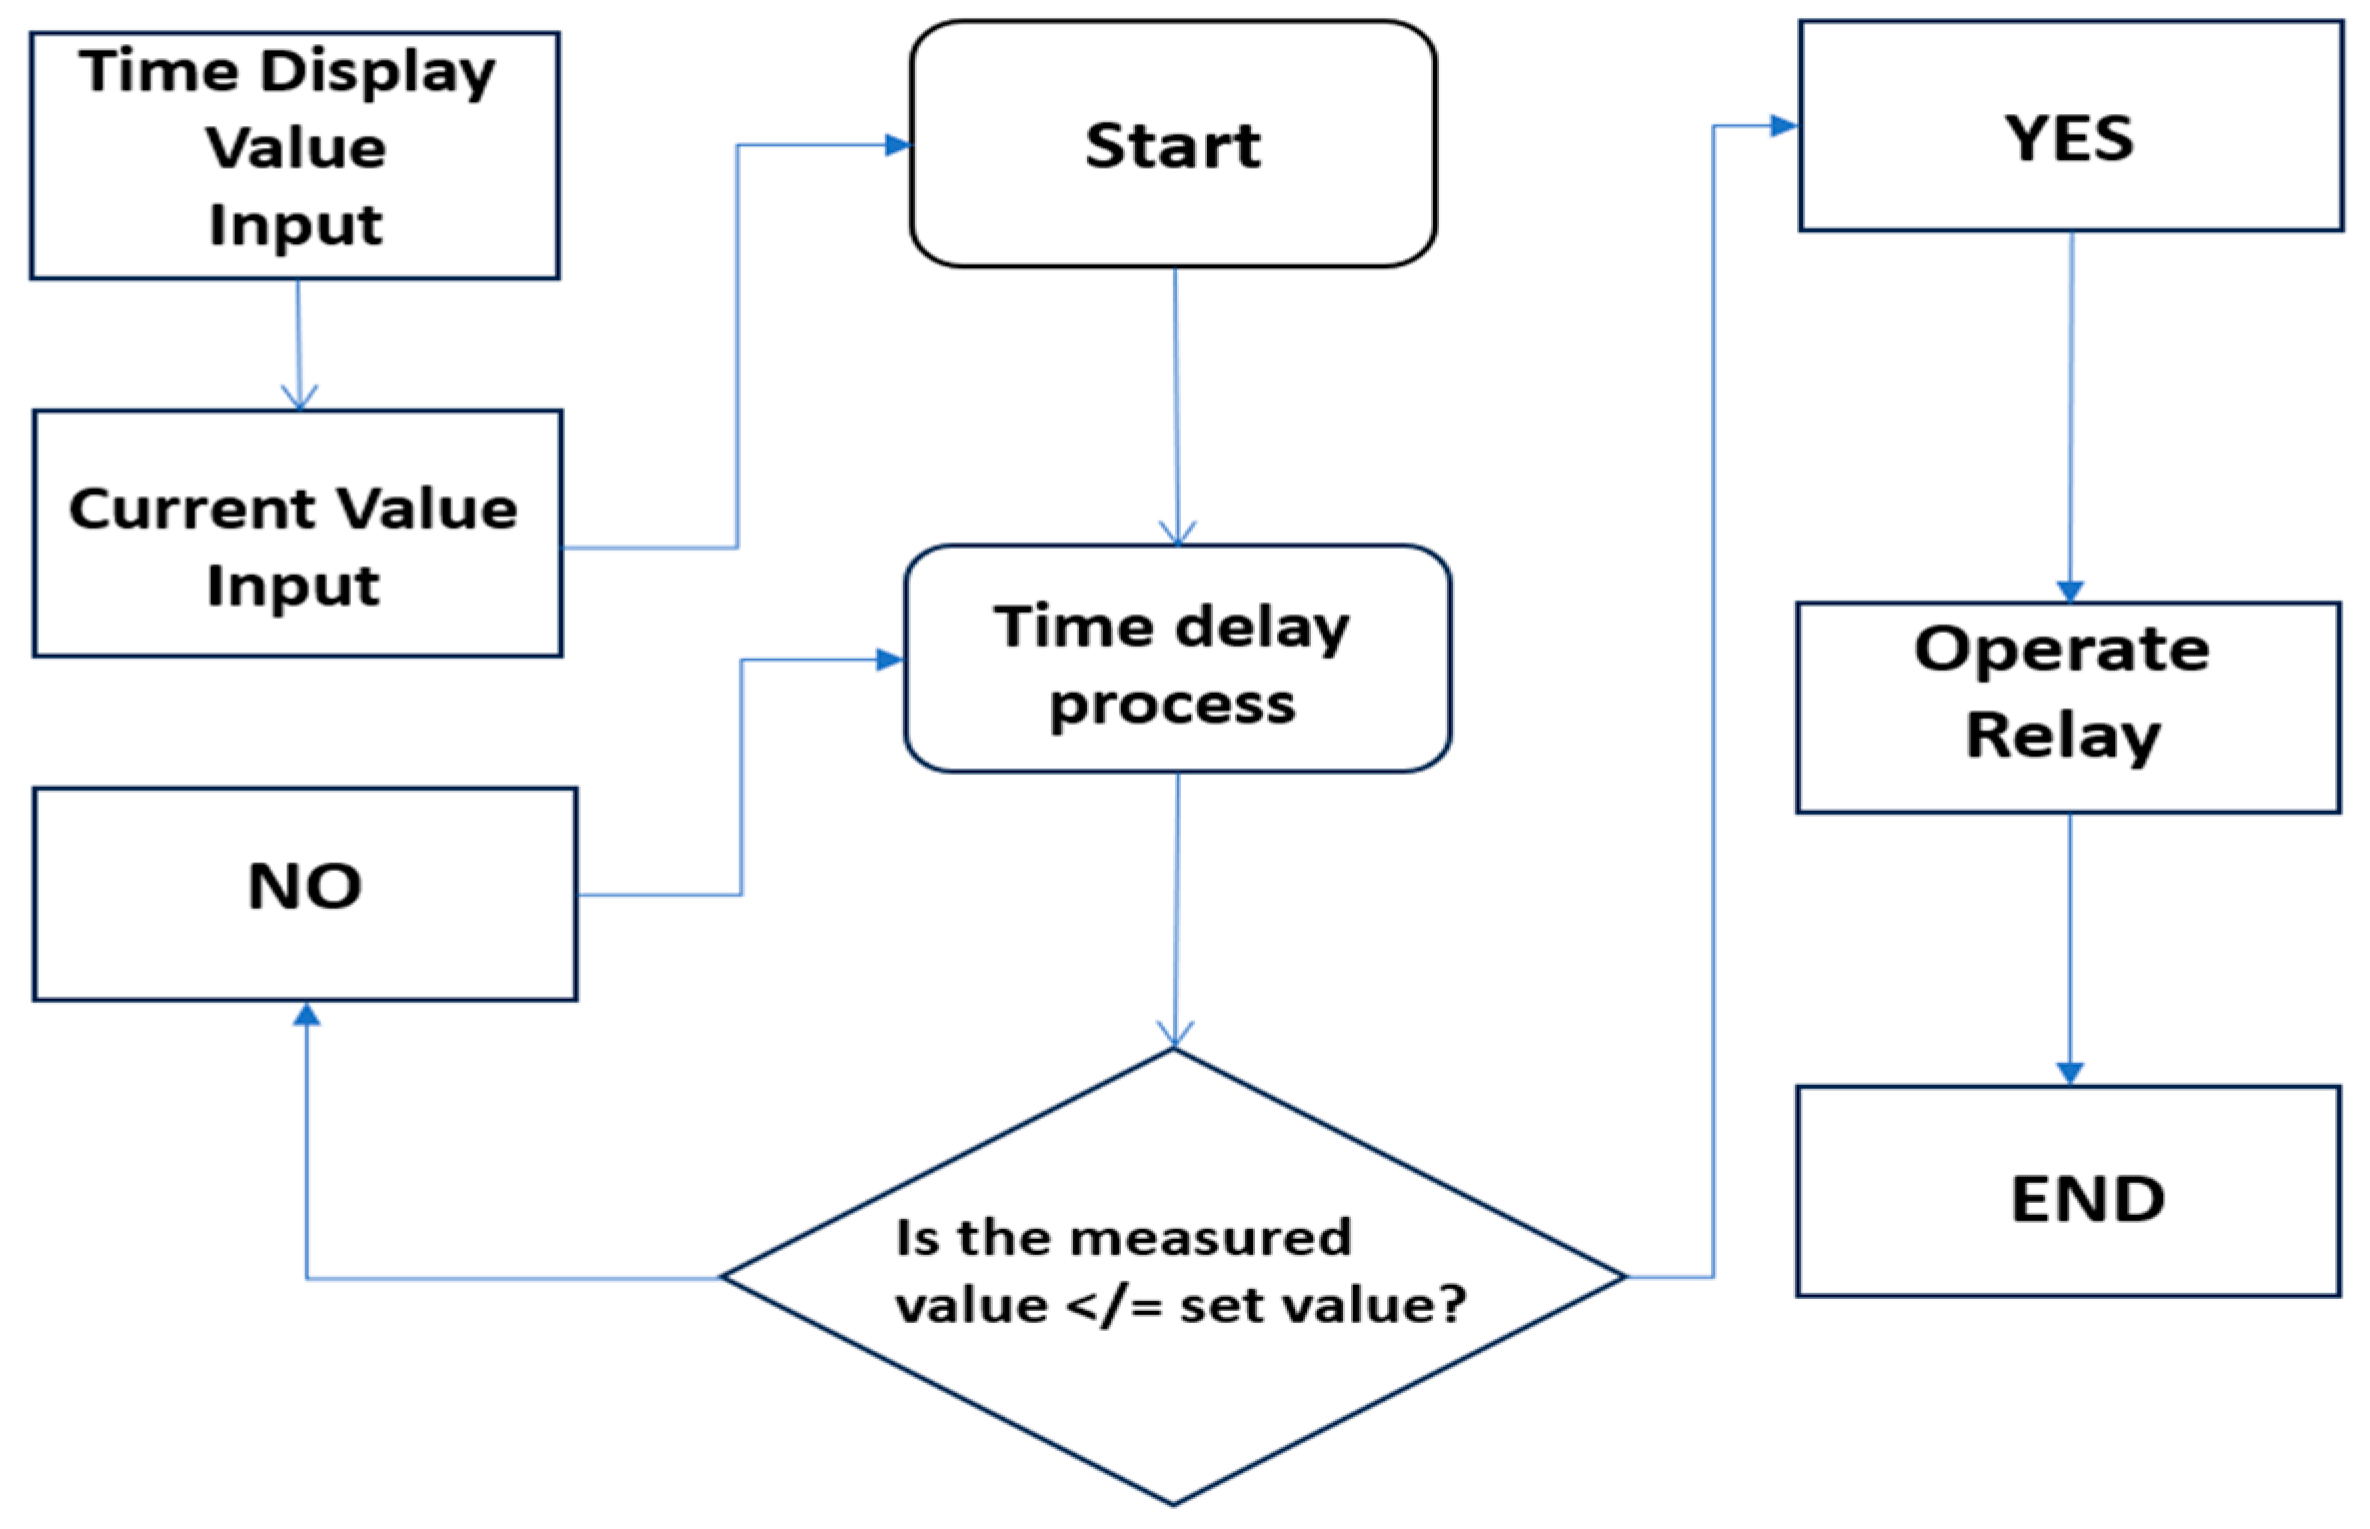
2.2.2. Software Flow Chart

Figure 8 presents a flow chart of the software application. When the equipment’s power draw matches the standby mode consumption level, the system triggers the relay to conserve energy. System adjustments and operation are handled through a web application, accessible on any device with a web browser and wireless connectivity. This application allows for the customization of delay periods, the setting of current parameters, and the ability to switch the system on or off. For testing purposes, the selected devices were those known to use power in standby mode: a washing machine, laptop, and TV.

2.2.3. Web Application

Figure 9 showcases the application designed for use on any device equipped with web browsing capabilities. To utilize this application, users must establish a wireless connection directly to the system, and then enter the default IP address, 192.168.4.1, into their web browser. This application enables users to set up and manage the system. It features two buttons for toggling the system on and off (1,2), displays indicating the system’s active status and the power consumption of connected appliances (3,4), and two buttons for adjusting the time and current settings (5,6). Additionally, there are two input fields for specifying the delay time and current threshold required for system activation (7,6).

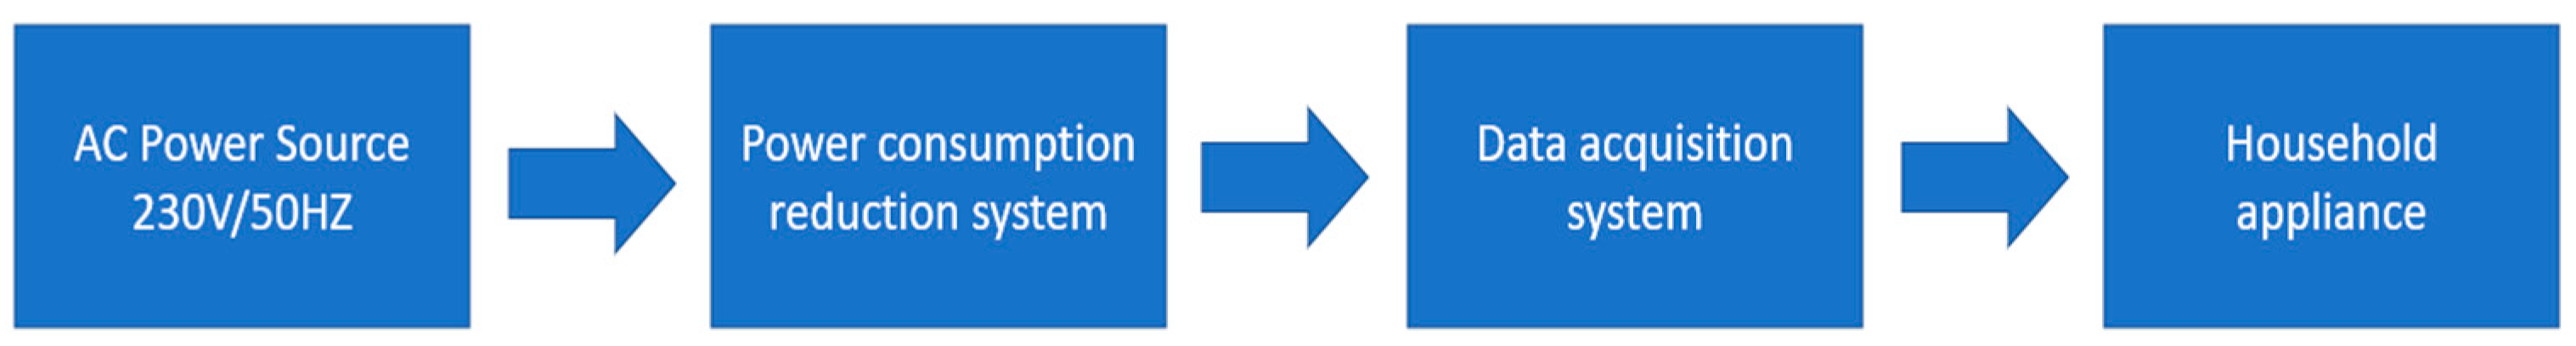
3. Results and Discussion

Figure 10 illustrates the positioning of the proposed system, which is strategically placed between the AC power source and the household appliance, accompanied by a data acquisition system to verify the effectiveness of the device’s operational principle. Obviously, the data acquisition system is the same as that shown in Figure 1, which was used to identify and measure the standby mode for the three common residential devices chosen.
The system is initially programmed with a default delay of 5 min. This means that it conducts checks every 5 min to determine whether the electricity flowing through the current sensor is equal to or less than the threshold specified via the web application. Users have the flexibility to modify the delay period to meet their specific needs. If the observed current aligns with or falls below the predetermined value, the system then disconnects the appliance from the power network, thereby preventing any standby power usage.
(A)
Beko washing machine (WUE81436
Figure 11 illustrates the current and power consumption of the washing machine equipped with the proposed energy-saving system. The system initiates a reading from the current sensor five minutes after activation. It then evaluates this reading against a predefined threshold and disconnects the power supply via a relay, if necessary, thereby conserving energy. During the initial five-minute period, the washing machine’s current and power consumption is notably low at 0.082 A and 19.09 W, respectively, and it decreases further to 0 A and 0 W, respectively, afterwards, until the system is either reset or turned off for regular operation. A recorded current and power consumption of 0.030 A and 6.9 W, respectively, is attributed to the data acquisition of the proposed systems.
(B)
Lenovo Legion laptop (15ACH6H)
Figure 12 illustrates the current and power consumption of the laptop equipped with the proposed energy-saving system. The system initiates a reading from the current sensor five minutes after activation. It then evaluates this reading against a predefined threshold and disconnects the power supply via a relay, if necessary, thereby conserving energy. During the initial five-minute period, the laptop’s current and power consumption is notably low at 0.050 A with regular spikes up to 0.190 A and 11.5 W, respectively, with regular spikes up to 43.7 W, and it decreases further to 0 A and 0 W, respectively, afterwards, until the system is either reset or turned off for regular operation. A recorded current and power consumption of 0.030 A and 6.9 W, respectively, is attributed to the data acquisition of the proposed system.
(C)
LG TV (40UH630V)
Figure 13 illustrates the current and power consumption of the TV equipped with the proposed energy-saving system. The system initiates a reading from the current sensor five minutes after activation. It then evaluates this reading against a predefined threshold and disconnects the power supply via a relay, if necessary, thereby conserving energy. During the initial five-minute period, the TV’s current and power consumption is notably low at 0.037 A and 8.51 W, respectively, and it decreases further to 0 A and 0 W, respectively, afterwards, until the system is either reset or turned off for regular operation. A recorded current and power consumption of 0.030 A and 6.9 W, respectively, is attributed to the data acquisition of the proposed system.
Table 1 presents a comparison of the standby power consumption of the evaluated devices without and with the proposed system. It is important to note that with the integration of the suggested system, standby power usage occurs just once before the system needs to be reset or deactivated for the equipment’s regular use. The initial standby energy consumption of the equipment is recorded at 0.00326 kWh. When considering the proposed system’s typical operational consumption, which adds an additional 4.968 kWh per month, the overall energy usage is decreased by 26.68 kWh per month, showcasing the efficiency of the proposed system in reducing energy consumption.
Recently, new EU regulations regarding the reduction of standby consumption were adopted, and the theme and proposals in this article are thus in line with these future concerns. The Commission Regulation (EU) 2023/826 sets strict requirements for the energy consumption of household and office electrical and electronic equipment in standby and off modes. This regulation is part of Directive 2009/125/EC aimed at improving the energy efficiency of products sold in the EU. Starting in 2025, devices must not consume more than 0.5 watts in standby or off mode, and 0.8 watts if they are in standby and displaying status or information. From 2027, these limits will be reduced to 0.5 watts in standby mode and 0.3 watts in off mode, while the maximum consumption for devices displaying status or information in standby mode will remain at 0.8 watts. For devices connected to the internet in networked standby mode, consumption limits range from 2 to 7 watts, depending on the product type, and will be progressively reduced to encourage increased energy efficiency [34].
Table 2 indicates that while the proposed system has reduced standby consumption, further improvements are necessary to meet future EU regulations, especially for certain appliances like washing machines.
Table 3 showcases the overall expenditure associated with the system, including the cost for producing the printed circuit board (PCB). Considering that the typical kWh price in Europe stands at approximately EUR 0.22, and the system facilitates a monthly saving of 26.68 kWh, the investment in the system is expected to be recouped within a span of 7 months. Due to the ESP32 limitation, the system supports only three energy-reading devices (HLW8032) via serial communication. An increased power consumption reduction can be achieved by adding more household appliances that have standby power consumption by choosing a more advanced developing board, thus reducing the recouped period.

4. Conclusions

The proposed system is designed to lower electricity usage by severing the connection between household devices and the power network as they transition to standby mode. Based on trials conducted with the three devices mentioned earlier, it has been observed that the system facilitates a reduction in energy consumption by 26.68 kWh per month. This demonstrates the system’s potential to significantly contribute to household energy savings and, consequently, to reductions in electricity bills and carbon footprints.
A notable challenge for the power consumption reduction system is its dependence on a home being electrically wired for smart technology. Each power socket or light must have its own circuit or fuse, which is essential for the individual monitoring and control of multiple appliances. This requirement can be seen as a limitation, as not all homes are currently equipped with such infrastructure. However, by integrating the system with the home’s fuse panel, the deployment costs can be minimized, making the system more accessible and feasible for widespread adoption.
Looking forward, the system’s evolution includes the incorporation of a Raspberry Pi 5, equipped with custom-developed software that leverages machine learning and neural networks. This advanced approach will enable the system to autonomously distinguish between a household device’s active and standby modes. Moreover, it will adapt to the user’s habits, learning from the household’s energy usage patterns over time. This not only enhances the system’s efficiency, but also moves towards a more seamless user experience.
The fully automated nature of the proposed upgrades means that users will no longer need to interact with an additional app to manage their energy consumption. Instead, the system will operate independently, making real-time decisions to optimize energy usage. This level of automation is crucial in modern smart homes, where convenience and efficiency are paramount.
The equipment chosen in this study represents only a portion of the household appliances that use energy in standby mode. The selected equipment studied here proved the utility of the proposed system and the achieved energy savings. As the system is improved, we will develop an application for all household appliances with standby consumption, which will fit into the structure of a smart home.
In addition to technological advancements, future research could focus on expanding the system’s compatibility with a broader range of devices and exploring integration with renewable energy sources, such as solar panels. This would further enhance the system’s sustainability benefits, offering a comprehensive solution for energy management in smart homes.
In conclusion, while the current system shows promising results in reducing energy consumption, the planned enhancements are poised to make it even more effective and user-friendly. By addressing the initial challenges and incorporating cutting-edge technology, the proposed system represents a significant step forward in the pursuit of smarter, more efficient energy usage in households.

Author Contributions

Conceptualization, A.C.G., H.A., E.D. and P.C.A.; methodology, A.C.G., H.A., E.D. and P.C.A.; software, A.C.G. and H.A.; validation, A.C.G. and H.A.; formal analysis, H.A.; investigation, A.C.G. and H.A.; resources, A.C.G.; data curation, H.A.; writing—original draft preparation, A.C.G., H.A. and P.C.A.; writing—review and editing, A.C.G., H.A. and P.C.A.; visualization, A.C.G., H.A. and P.C.A.; supervision, H.A. All authors have read and agreed to the published version of the manuscript.

Funding

This research received no external funding.

Data Availability Statement

The original contributions presented in the study are included in the article, further inquiries can be directed to the corresponding author.

Conflicts of Interest

The authors declare no conflicts of interest.

Appendix A. Data Acquisition Made by the Fluke 1738 Power Logger for a Washing Machine and Laptop

Figure A1. Washing machine power consumption in normal operation mode.
Energies 17 02989 g0a1
Figure A2. Washing machine current consumption in normal operation mode.
Energies 17 02989 g0a2
Figure A3. Laptop current consumption in standby mode.
Energies 17 02989 g0a3
Figure A4. Laptop power consumption in standby mode.
Energies 17 02989 g0a4

Appendix B. MATLAB Application Code

clc;clearall;close all;
warning off;
rawTable = readtable(‘power/currentfiles.xlsx’,‘Sheet’,‘Sheet1′);
data=rawTable.Header2;
Th1=0.00;
Th2=1000;
E = data
Th3=1;
Th4=1000;
E=E(Th3:Th4);
E=E(E>=Th1);
E=E(E<=Th2);
fprintf(‘Nr elements %d\n’,length(E));
fprintf(‘Min=%.6f\n’,min(E));
fprintf(‘Max=%.6f\n’,max(E));
fprintf(‘Avg=%.6f\n’,mean(E));
xVal=(1:length(E))’;
degree = 12
[p,s]=polyfit(xVal,E,degree);
R2=1—s.normr^2/norm(E-mean(E))^2;
EI=polyval(p,xVal);
fprintf(‘R2= %.6f\n’, R2);
fprintf(‘Polynomial values\n’);
fprintf(‘%e ‘,p);
fprintf(‘\n’);
figure(1)
plot(xVal, E, ‘-r.’)
hold on
plot(xVal, EI, ‘b-’)
legend(‘Real’,‘Fitted’,‘location’,‘best’)
xlabel(‘Minutes’, ‘FontName’, ‘Times New Roman’, ‘FontSize’, 12, ‘FontAngle’, ‘italic’);
ylabel(‘Power(W)’, ‘FontName’, ‘Times New Roman’, ‘FontSize’, 12, ‘FontAngle’, ‘italic’);
set(gca, ‘FontName’, ‘Verdana’, ‘FontSize’, 12);
grid on.

Appendix C. Data Acquisition for Washing Machine through Proposed System

Measurement
Frequency (Time)
Normal Operation Current ValuesNormal Operation Power ValuesStandby Operation Current ValuesStandby Operation Power Values
Every 5 s0.27360.060.08219.27
0.27360.060.08219.27
0.27360.060.08219.27
0.17438.280.08219.27
0.17438.280.08219.27
0.17438.280.08219.27
0.17438.280.08219.27
0.15433.880.08219.27
0.15433.880.08219.27
0.15433.880.08219.27
0.15433.880.08219.27
0.15433.880.08219.27
0.15433.880.08219.27
0.15433.880.08219.27
0.15433.880.08219.27
0.15433.880.08219.27
0.15433.880.08219.27
0.15433.880.08219.27
0.15433.880.08219.27
0.19242.680.08219.27
0.19242.680.08219.27
0.19242.680.08219.27
0.19242.680.08219.27
0.36179.420.08219.27
0.36179.420.08219.27
0.36179.420.08219.27
7.9811465.460.08219.27
7.9811872.420.08219.27
7.9811872.420.08219.27
7.9811873.690.08219.27
7.9771875.390.08219.27
7.9771874.110.08219.27
7.9771873.690.08219.27
7.9771870.730.08219.27
7.9771872.840.08219.27
7.9771872.840.08219.27
7.9771870.30.08219.27
7.9771874.110.08219.27
7.9771874.110.08219.27
7.9621876.240.08219.27
7.9621874.540.08219.27
7.9621874.110.08219.27
7.89718720.08219.27
7.8971864.830.08219.27
7.8971857.710.08219.27
7.8971855.220.08219.27
7.8921851.480.08219.27
7.8921854.390.08219.27
7.8921856.050.08219.27
7.8831855.630.08219.27

References

  1. Vasiliu, A.; Nedelcu, O.; Magdun, O.; Salisteanu, I.C. A study on theenergy consumption of the electrical and electronic household and officeequipment in standby and off-mode. Sci. Bull. Electr. Eng. Fac. 2021, 21, 26–30. [Google Scholar]
  2. Daragmeh, S.M.; Karslen, A.T.; Hameed, I.A. Heuristic Techniques for Reducing Energy Consumption of Household. In Proceedings of the 36th ECMS International Conference on Modelling and Simulation ECMS 2022, Ålesund, Norway, 30 May–3 June 2022. [Google Scholar]
  3. Matsumoto, S.; Mizobuchi, K.; Managi, S. Household energy consumption. Env. Econ Policy Stud. 2022, 24, 1–5. [Google Scholar] [CrossRef]
  4. Desiderio, R.J.; Del Rio, P. Analysing the drivers of the efficiency of households in electricity consumption. Energy Policy 2022, 164, 43–61. [Google Scholar]
  5. Eurostat. Energy Consumption in Households. 2023. Available online: https://ec.europa.eu/eurostat/news/euro-indicators (accessed on 28 March 2024).
  6. Villanueva, D.; San-Facundo, D.; Miguez-Garcia, E.; Fernandez-Otero, A. Modeling and Simulation of Household Appliances Power Consumption. Appl. Sci. 2022, 12, 3689. [Google Scholar] [CrossRef]
  7. Hubert, P.; Gerber, M.; Rumsch, A.; Paice, A. Prediction of domestic appliances usage based on electrical consumption. Energy Inform. 2018, 1, 16. [Google Scholar] [CrossRef]
  8. Moldovan, D.; Slowik, A. Energy consumption prediction of appliances using machine learning and multi-objective binary grey wolf optimization for feature selection. Appl. Soft Comput. 2021, 111, 103–121. [Google Scholar] [CrossRef]
  9. Chauhan, R.K.; Chaucan, K.; Badar, A. Optimization of electrical energy waste in house using smart appliances management System-A case study. J. Build. Eng. 2021, 2, 37–45. [Google Scholar] [CrossRef]
  10. Molla, T.; Khan, B.; Moges, B.; Alhelou, H.; Zamani, R.; Siano, P. Integrated energy optimization of smart home appliances with cost-effective energy management system. CSEE J. Power Energy Syst. 2019, 2, 249–258. [Google Scholar]
  11. Eirianki, M.; Varlamis, I.; Dahihande, J.; Jaiswal, A.; Pagar, A.A.; Thakare, A.T. Real-time recommendations for energy-efficient appliance usage in households. Front. Big Data 2022, 5, 1–21. [Google Scholar] [CrossRef] [PubMed]
  12. Alsalemi, A.; Himeur, Y.; Bensaali, F.; Amira, A.; Sardianos, C.; Varlamis, I.; Dimitrakopoulos, G. Achieving Domestic Energy Efficiency Using Micro-Moments and Intelligent Recommendations. IEEE Access 2020, 8, 15047–15055. [Google Scholar] [CrossRef]
  13. Codispoti, J.; Khamesi A., R.; Penn, N.; Silvestri, S.; Shin, E. Learning from non-experts: An interactive and adaptive learning approach for appliance recognition in smart homes. ACM Trans. Cyber-Phys. Syst. 2022, 6, 1–22. [Google Scholar] [CrossRef]
  14. Mursid, S.; Santaso, H. Analysis of the Effectiveness of the Utilization of Power Monitoring Devices in Reducing Electric Energy Consumption. J. Phys. Conf. Ser. 2019, 1364, 012055. [Google Scholar] [CrossRef]
  15. Rahman, K.A.; Leman, A.M.; Mubin, F.M.; Yusof, M.Z.M.; Harir, A.; Salleh, M.N.M. Energy Consumption Analysis Based on Energy Efficiency Approach: A Case of Suburban Area. In Proceedings of the MATEC Web Conference, Sarawak, Malaysia, 12 December 2016. [Google Scholar]
  16. Issi, F.; Kaplan, O. The Determination of Load Profiles and Power Consumptions of Home Appliances. Energies 2018, 11, 607. [Google Scholar] [CrossRef]
  17. Gheorghe, A.C.; Andrei, H.; Diaconu, E. Data measurement and modeling method of electrical parameters of basic household equipment. In Proceedings of the 14th International Conference on Electronics, Computers and Artificial Intelligence (ECAI), Ploiesti, Romania, 30 June 2022—1 July 2022. [Google Scholar]
  18. Gheorghe, A.C.; Andrei, H.; Diaconu, E. Système Intelligent Pour la Réduction de la Consommation Electrique en Veille Des Équipements Ménagers. Revue Roumaine des Sciences Techniques. Série Électrotech. Énerg. 2023, 68, 413–418. [Google Scholar] [CrossRef]
  19. Gheorghe, A.C.; Udroiu, I.; Stan, E. Electricity Consumption Measurement System Using ESP32. Sci. Bull. Electr. Eng. Fac. 2021, 21, 23–26. [Google Scholar] [CrossRef]
  20. ESP32 Datasheet. Available online: https://www.espressif.com/sites/default/files/documentation/esp32_datasheet_en.pdf (accessed on 14 December 2023).
  21. Fluke User Manual. Available online: https://dam-assets.fluke.com/s3fs-public/173x____umeng0200_0.pdf?2JZuc3jb6JoHuQ163Haf5bzCdt1HSMvE (accessed on 1 June 2024).
  22. HLW8032 Datasheet at JLCPCB. Available online: https://github.com/Khaalidi/HLW8032/blob/master/Docs/DS_HLW8032_EN_Rev1.5.pdf (accessed on 14 December 2023).
  23. Introduction to ESP32. Available online: https://www.electronicshub.org/getting-started-with-esp32/ (accessed on 16 December 2023).
  24. ESP32 for IoT: A Complete Guide. Available online: https://www.nabto.com/guide-to-iot-esp-32/ (accessed on 16 December 2023).
  25. Espressif ESP32 Development Board—Developer Edition. Available online: https://www.adafruit.com/product/3269 (accessed on 17 December 2023).
  26. HLW8032 ESP-IDF Component. Available online: https://github.com/ucukertz/IDF-HLW8032 (accessed on 17 December 2023).
  27. HLW8032 I.C Datasheet. Available online: https://www.lcsc.com/datasheet/lcsc_datasheet_2307271600_Hiliwei-Tech-HLW8032_C128023.pdf (accessed on 18 December 2023).
  28. ESP32-DevKitC V4 Getting Started Guide. Available online: https://docs.espressif.com/projects/esp-idf/en/v3.3/get-started/get-started-devkitc.html (accessed on 3 January 2024).
  29. What Is Relay and How It Works? Available online: https://www.electronicshub.org/what-is-relay-and-how-it-works/ (accessed on 4 January 2024).
  30. 5V Single-Channel Relay Module Description. Available online: https://www.theengineeringprojects.com/ (accessed on 10 January 2024).
  31. HLW8032 Energy Metering IC. Available online: https://www.dnatechindia.com/hlw-8032-single-phase-energy-meter-ic-buy-india.html (accessed on 20 January 2024).
  32. HLW8032 Energy Metering IC—SOIC-8 Package. Available online: https://sharvielectronics.com/product/hlw8032-energy-metering-ic-soic-8-package/ (accessed on 20 January 2024).
  33. A Lightweight Library for the HLW8032 SOP8 High Precision Energy Metering IC. Available online: https://github.com/Khaalidi/HLW8032 (accessed on 20 January 2024).
  34. (UE) 2023/826 Regulation. Available online: https://eur-lex.europa.eu/legal-content/RO/TXT/?uri=CELEX:32023R0826 (accessed on 28 May 2024).
Figure 1. Data acquisition system based on HLW8032 and ESP32 placed between the AC power source and the household appliance.
Energies 17 02989 g001
Figure 2. Electronic circuit diagram used for the HLW8032 IC and the connections to the ESP32 Devkit V4.
Energies 17 02989 g002
Figure 3. Current (left) and power (right) consumption (in red) of a washing machine in normal operation mode and MATLAB interpolation (in blue).
Energies 17 02989 g003
Figure 4. Current (left) and power (right) consumption (in red) of a washing machine in standby mode and MATLAB interpolation (in blue).
Energies 17 02989 g004
Figure 5. Current (left) and power (right) consumption of a laptop in standby mode (in blue).
Energies 17 02989 g005
Figure 6. Current (left) and power (right) consumption of TV in standby mode (in blue).
Energies 17 02989 g006
Figure 7. Smart system to reduce the power consumption placed between the AC power source and the household appliance.
Energies 17 02989 g007
Figure 8. Flow chart of proposed smart system that shown how the program functions.
Energies 17 02989 g008
Figure 9. Web application of proposed system that shows the monitoring and control graphical interface.
Energies 17 02989 g009
Figure 10. Block diagram of proposed system that shows how the proposed system and the DAQ is placed between the AC power source and the household appliance.
Energies 17 02989 g010
Figure 11. Washing machine current consumption in standby mode after system implementation (in blue).
Energies 17 02989 g011
Figure 12. Laptop current and power consumption in standby mode after system implementation (in blue).
Energies 17 02989 g012
Figure 13. TV current and power consumption in standby mode after system implementation (in blue).
Energies 17 02989 g013
Table 1. Household equipment power consumption in standby without and with the proposed system for different periods of time.
EquipmentStandby Consumption kWhStandby Consumption with System kWhStandby Consumption
kWh/Day
Standby Consumption with System kWh/DayStandby Consumptionk
Wh/Month
Standby Consumption with System kWh/Month
Washing machine0.021390.001780.51336-15.40080-
Laptop0.013730.001140.32952-10.21512-
Tv0.008150.000670.1956-6.0636-
Proposed system-----4.968
Total0.043270.003591.0384-31.651924.968
Table 2. Standby power consumption achieved with the implementation of the proposed system compared to future EU regulations.
Household Equipment with SystemStandby Consumption Achieved (kWh)Standby Consumption Regulation EU 2025 (kWh)Standby Consumption Regulation EU 2027 (kWh)
Washing machine0.00170.0005–0.00080.0003–00005
TV0.0011
Laptop0.0006
Table 3. Total cost of the proposed system based on parts and manufacturing/assembly.
PartsPrice (EUR)
ESP3220
Relay module3
HLW8032 IC5
PCB + Component assembly service (external service)10
Total (EUR)38
Disclaimer/Publisher’s Note: The statements, opinions and data contained in all publications are solely those of the individual author(s) and contributor(s) and not of MDPI and/or the editor(s). MDPI and/or the editor(s) disclaim responsibility for any injury to people or property resulting from any ideas, methods, instructions or products referred to in the content.

