Article

Experimental Study of Forced Imbibition in Tight Reservoirs Based on Nuclear Magnetic Resonance under High-Pressure Conditions

1
Research Institute of Exploration and Development, Xinjiang Oilfield Company, PetroChina, Karamay 834000, China
2
State Key Laboratory for Tunnel Engineering, China University of Mining and Technology (Beijing), Beijing 100083, China
3
China Railway Tianjin Metro, Tianjin 300450, China
4
School of Mechanical Science and Engineering, Northeast Petroleum University, Daqing 163318, China
*
Author to whom correspondence should be addressed.
Energies 2024, 17(12), 2993; https://doi.org/10.3390/en17122993
Submission received: 26 April 2024 / Revised: 6 June 2024 / Accepted: 11 June 2024 / Published: 18 June 2024

Abstract

:
This study utilizes nuclear magnetic resonance (NMR) techniques to monitor complex microstructures and fluid transport, systematically examining fluid distribution and migration during pressure imbibition. The results indicate that increased applied pressure primarily affects micropores and small pores during the initial imbibition stage, enhancing the overall imbibition rate and oil recovery. Higher capillary pressure in the pores strengthens the imbibition ability, with water initially displacing oil from smaller pores. Natural microfractures allow water to preferentially enter and displace oil, thereby reducing oil recovery from these pores. Additionally, clay minerals may induce fracture expansion, facilitating oil flow into the expanding space. This study provides new insights into fluid distribution and migration during pressure imbibition, offering implications for improved oil production in tight reservoirs.

1. Introduction

In the past decade, significant breakthroughs have been made in the development of unconventional oil and gas, mainly due to the development of hydraulic fracturing and horizontal drilling technologies [1,2]. Spontaneous imbibition is a process in which the wetting phase displaces the non-wetting phase in porous media under the action of capillary force. According to the movement direction of wetting phase and non-wetting phase, it can be divided into cocurrent and countercurrent spontaneous imbibition [3]. Spontaneous imbibition refers to the process in which water is automatically drawn into the core and drives out crude oil without pressure, while forced imbibition refers to the process in which water is forced into the core and drives out oil under pressure. The imbibition of conventional reservoirs has been studied extensively in recent years. A large number of studies have shown that imbibition in tight oil reservoirs is one of the important driving forces for crude oil recovery [4,5,6]. The spontaneous imbibition induced by capillary force is especially remarkable because the pore size is in micron or even nanometer range [7]. Production data from the field also show that shutting down the well for a while after fracturing allows the fracturing fluid to be fully absorbed in the reservoir, exerting the effect of imbibition suction to drive oil and improve recovery [8,9,10]. Studying multiphase flow is crucial for optimizing processes and ensuring safety across diverse scientific and engineering fields, including oil and gas extraction, chemical manufacturing, and environmental remediation. This understanding enables the efficient handling of complex interactions between different phases, leading to advancements in technology and improved operational outcomes.
In recent years, a large number of scholars have carried out experimental studies on imbibition. The traditional imbibition experiments are mainly mass and volume methods [11]. However, the experimental results of these two methods are easily influenced by artificial factors and cannot reflect the existence state of fluid in the core. The nuclear magnetic resonance (NMR) technique is a high-precision and high-efficiency detection tool. It has diverse applications across multiple disciplines, including medicine, chemistry, physics, and oil and gas development [12,13,14]. Li et al. [15] studied the effect of initial water saturation on spontaneous imbibition in tight gas reservoirs using NMR, which found that 90% of the residual gas is in pores with pore sizes greater than 1 μm. Yang et al. [16] combined physical simulation experiments combined with NMR, which found that the more hydrophilic the core, the higher the imbibition rate and recovery. Yang et al. [17] conducted spontaneous imbibition experiments of tight reservoirs and found through T2 spectroscopy that pores correspond to larger capillary pressures, which have a more effective imbibition and oil displacement effect. Farahani [18] studied the kinetics and spatial characteristics of thermally induced methane hydrate formation in synthetic and natural sediment samples using magnetic resonance imaging. Xiaomin [19] pointed out that NMR techniques provide qualitative and quantitative observations of macro-fractures, microfractures and micro- and nanoscale fractures in reservoirs. Hassanpouryouzband [20] reviewed the different properties of natural gas hydrates and their formation and dissociation kinetics. Cui, Xiaojun [21] extended several methods for measuring permeability and diffusivity with consideration of gas adsorption.
Due to the presence of confining pressure in the reservoir, the driving force of imbibition is not only capillary force, but also the pressure applied to the fluid. Several scholars have conducted studies on pressurized imbibition. Xu et al. [22] conducted imbibition and backflow experiments on sandstone samples, which found that the water that seeped into the core was mainly retained in the nano-micropores and nano-mesopores. Compared with spontaneous imbibition, forced imbibition significantly increased the recovery of cores and increased the retention of fracturing fluid. Wang et al. [23] found that the recovery and imbibition rate of core samples were positively correlated with pressure by imbibition experiments under different applied pressures. Jiang et al. [24] used the tight sandstone in Ordos Basin as a research object, which found that the final recovery rate of core samples increased when the surrounding pressure increased.
Currently, a large number of experimental studies on imbibition have been conducted mainly under atmospheric pressure. Although research on forced imbibition has achieved certain results, there is still a lack of understanding of factors such as pore structure and mineral composition of rock cores, as well as the impact of external pressure on imbibition. In this paper, the cores of four formations were selected to test their porosity, permeability, mineral composition, and other information. The device for the forced imbibition experiment was also designed, and imbibition experiments under different pressures were conducted. Our experiments were conducted to study the distribution and transport pattern of fluid during the imbibition process, which use the NMR detection.

2. Experimental Materials and Methods

2.1. Rock Samples and Fluids

The samples of tight oil reservoirs are taken from Ordos Basin, Songliao Basin and Junggar Basin, which are rich in tight oil and gas reservoir resources. Since the samples are taken from different areas and at different stratigraphic depths, the influence of different stratigraphic fractures as well as clay minerals can be observed. Cylinders of 2.5 cm in diameter are drilled from larger rock outcrops and machined and cut by wireline cutters into cylinders of about 50 mm in length, with the ends machined flat. The cores were dried at 105 °C after removal of residual oil until the quality no longer changed. We used a Vernier scale and balance to accurately measure the length, diameter, and quality of core samples. During the experiment, the core was subjected to a certain pressure environment for imbibition by external pressurization. The basic information is listed in Table 1, including the source, size, and saturated oil mass.
XRD analysis was carried out on rock fragments using a Rigaku D/Max-2500/PC-type X-ray diffractometer (Co Kα radiation,40 kV, 30 mA), which is made by the Rigaku Manufacture in the Woodlands, TX, USA, to study the effect of mineral composition on seepage results. The results of whole-rock mineral composition and clay mineral composition are shown in Figure 1. Sample WE is mainly composed of quartz and clay minerals, with 40% clay minerals. Sample QT is mainly composed of quartz, feldspar, and clay minerals at 26%, 34%, and 24%, respectively. Samples LC7 and UC7, on the other hand, are mainly composed of quartz and feldspar, both of which can reach 70%. However, their clay mineral content is less than 20%. According to Yang et al. [16], a moderate content of clay minerals (20.5–30.2%) can induce microfracture extension to mitigate reservoir damage, while a high content of clay minerals (36.8%) may disrupt matrix pore space and thus aggravate reservoir damage. The higher clay mineral content of WEH and QT can be used to analyze the effect of clay minerals on pore structure during percolation. The lower clay mineral content of samples LC7 and UC7 indicates that we can disregard the effect of their water absorption and swelling during percolation. Therefore, these samples can be used to analyze the pore size distribution and the effect of natural fractures on the percolation absorption.
The experimental fluids consist of high-purity (≥99%) deuterium water and kerosene. The basic properties of density, viscosity and surface tension are shown in Table 2. In this case, the density and viscosity of paraffin and deuterium water were measured under the ASTM standard, and the surface tension of the liquids was measured using a surface tension meter under the standard [25]. Since the NMR equipment could not distinguish the signals of kerosene and water, deuterium water with similar properties to water was selected as the imbibition solution to reduce the impact on the reservoir. The NMR signals are all from kerosene in the core. In the percolation experiments, deuterium water is used as a wetting fluid to displace the non-wetting fluid kerosene.

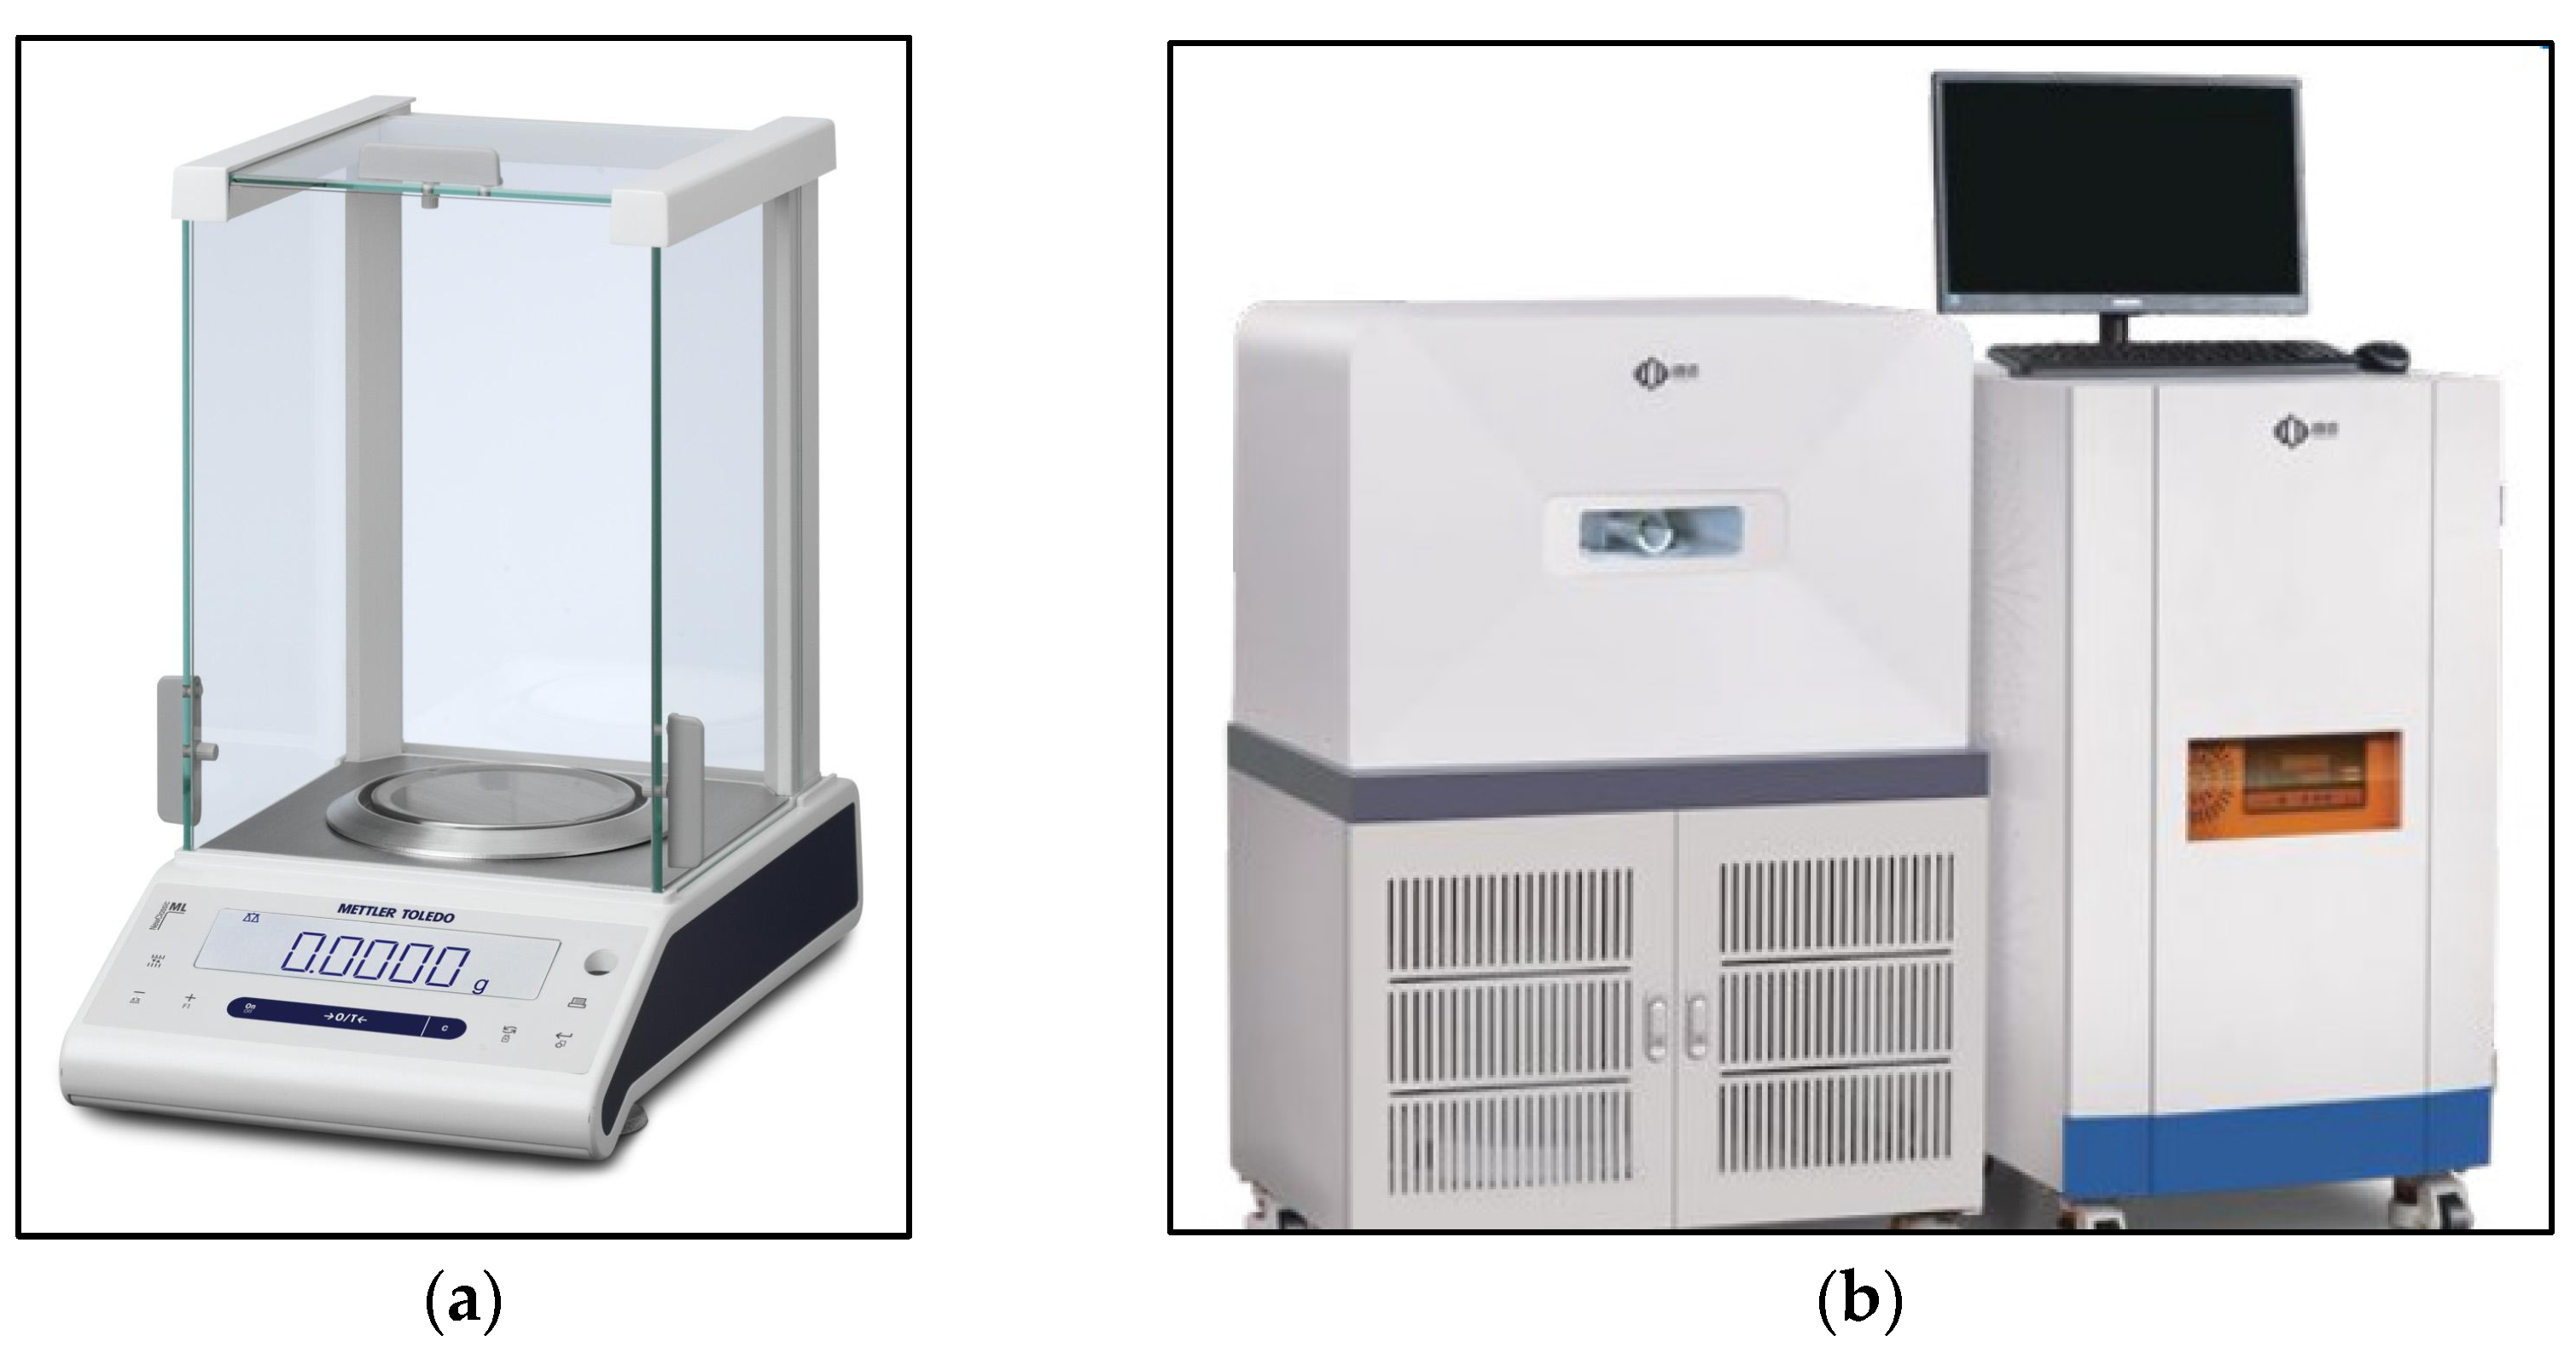
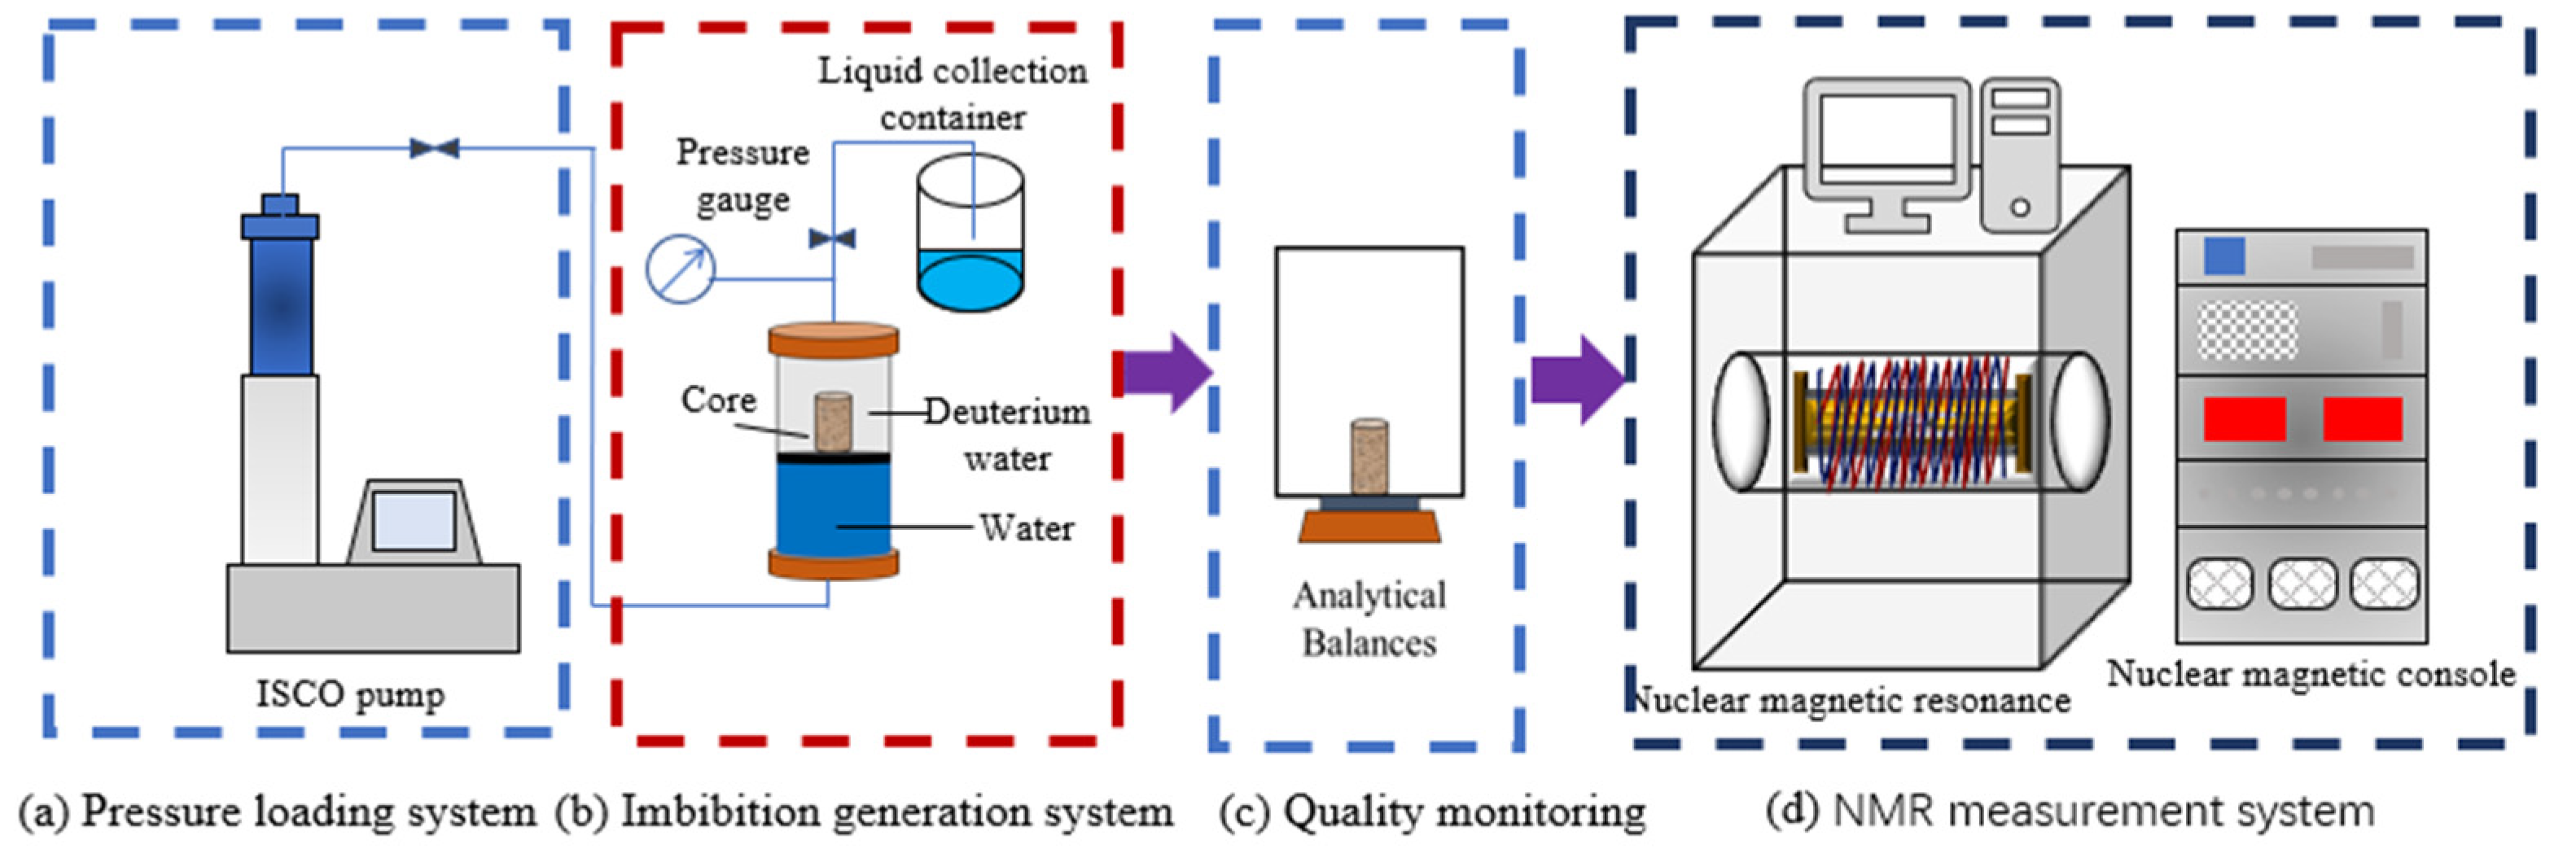
2.2. Experimental Apparatus

The device for testing the core mass in the experiment is a Mettler balance (model ME204E) with an accuracy of 0.0001 g and a range of 220 g, as shown in Figure 2a. The change in sample mass and the difference in oil–water density can be used to calculate the volume of imbibed water and discharged oil during imbibition.
The NMR instrument is provided by Suzhou Niumai Analytical Instruments Corporation (Suzhou, China), with the model number MiniMR-VTP and a magnetic field strength of 0.5 T, as shown in Figure 2b. The test temperature is 25 °C, the humidity is 40%, and the pressure is atmospheric pressure. NMR is a nondestructive testing method to analyze the physical characteristics of rocks by measuring the content of hydrogen elements within the rocks. The NMR T2 spectrum can reflect the pore structure and fluid distribution characteristics well. The higher the relaxation time T2, the larger the pore size of the fugitive fluid. The more fluid is presented in a certain pore size of the rock, the larger the T2 spectrum amplitude [26,27,28,29].
A forced imbibition experimental device consists of a pressurized pump, intermediate container, pressure gauge, iron pipeline, valve, etc. The upper part of the intermediate container piston is deuterium water, and the lower part of the water comes from the pressurized pump. The pressure applied in the vessel is read by a pressure gauge.

2.3. Experimental Procedures

In this study, the mass of core samples was measured under various pressurization conditions and correlated with NMR T2 spectra over time. The experimental procedure comprised several key steps:
(1)
Preparation and Cleaning: Initially, the tight reservoir samples were meticulously washed to remove residual oil. To effectively clean the cores and minimize the solvent’s impact on rock wettability, a 1:4 alcohol/benzene mixture was used. After washing, the sample mass was recorded.
(2)
Oil Saturation: The cleaned samples were then placed in a saturated oil device and evacuated for 2 to 3 h to eliminate any air. Subsequently, kerosene was injected at a pressure of 20 MPa, and the samples were left to saturate for 72 h.
(3)
Mass and T2 Measurement: Once the saturation period was complete, the mass and size of the oil-saturated samples were measured. These cores were then placed into deuterium water within the forced imbibition experimental apparatus. Pressure was applied using a pressurization pump. After a specified duration, the pressure was released, the core was removed, and its mass was measured. The T2 spectrum was then analyzed using an NMR instrument, which is provided by Suzhou Niumai Analytical Instruments Corporation (Suzhou, China).
(4)
Repetition and Analysis: This process (step 3) was repeated to observe changes in the T2 spectrum over immersion time, enabling the creation of a detailed plot depicting the variation in the T2 spectrum with time.
A schematic diagram illustrating the experimental procedure is provided in Figure 3. This methodical approach enabled a comprehensive understanding of fluid distribution and migration under applied pressure, shedding light on the imbibition mechanisms in tight reservoirs.

3. Experimental Results and Discussion

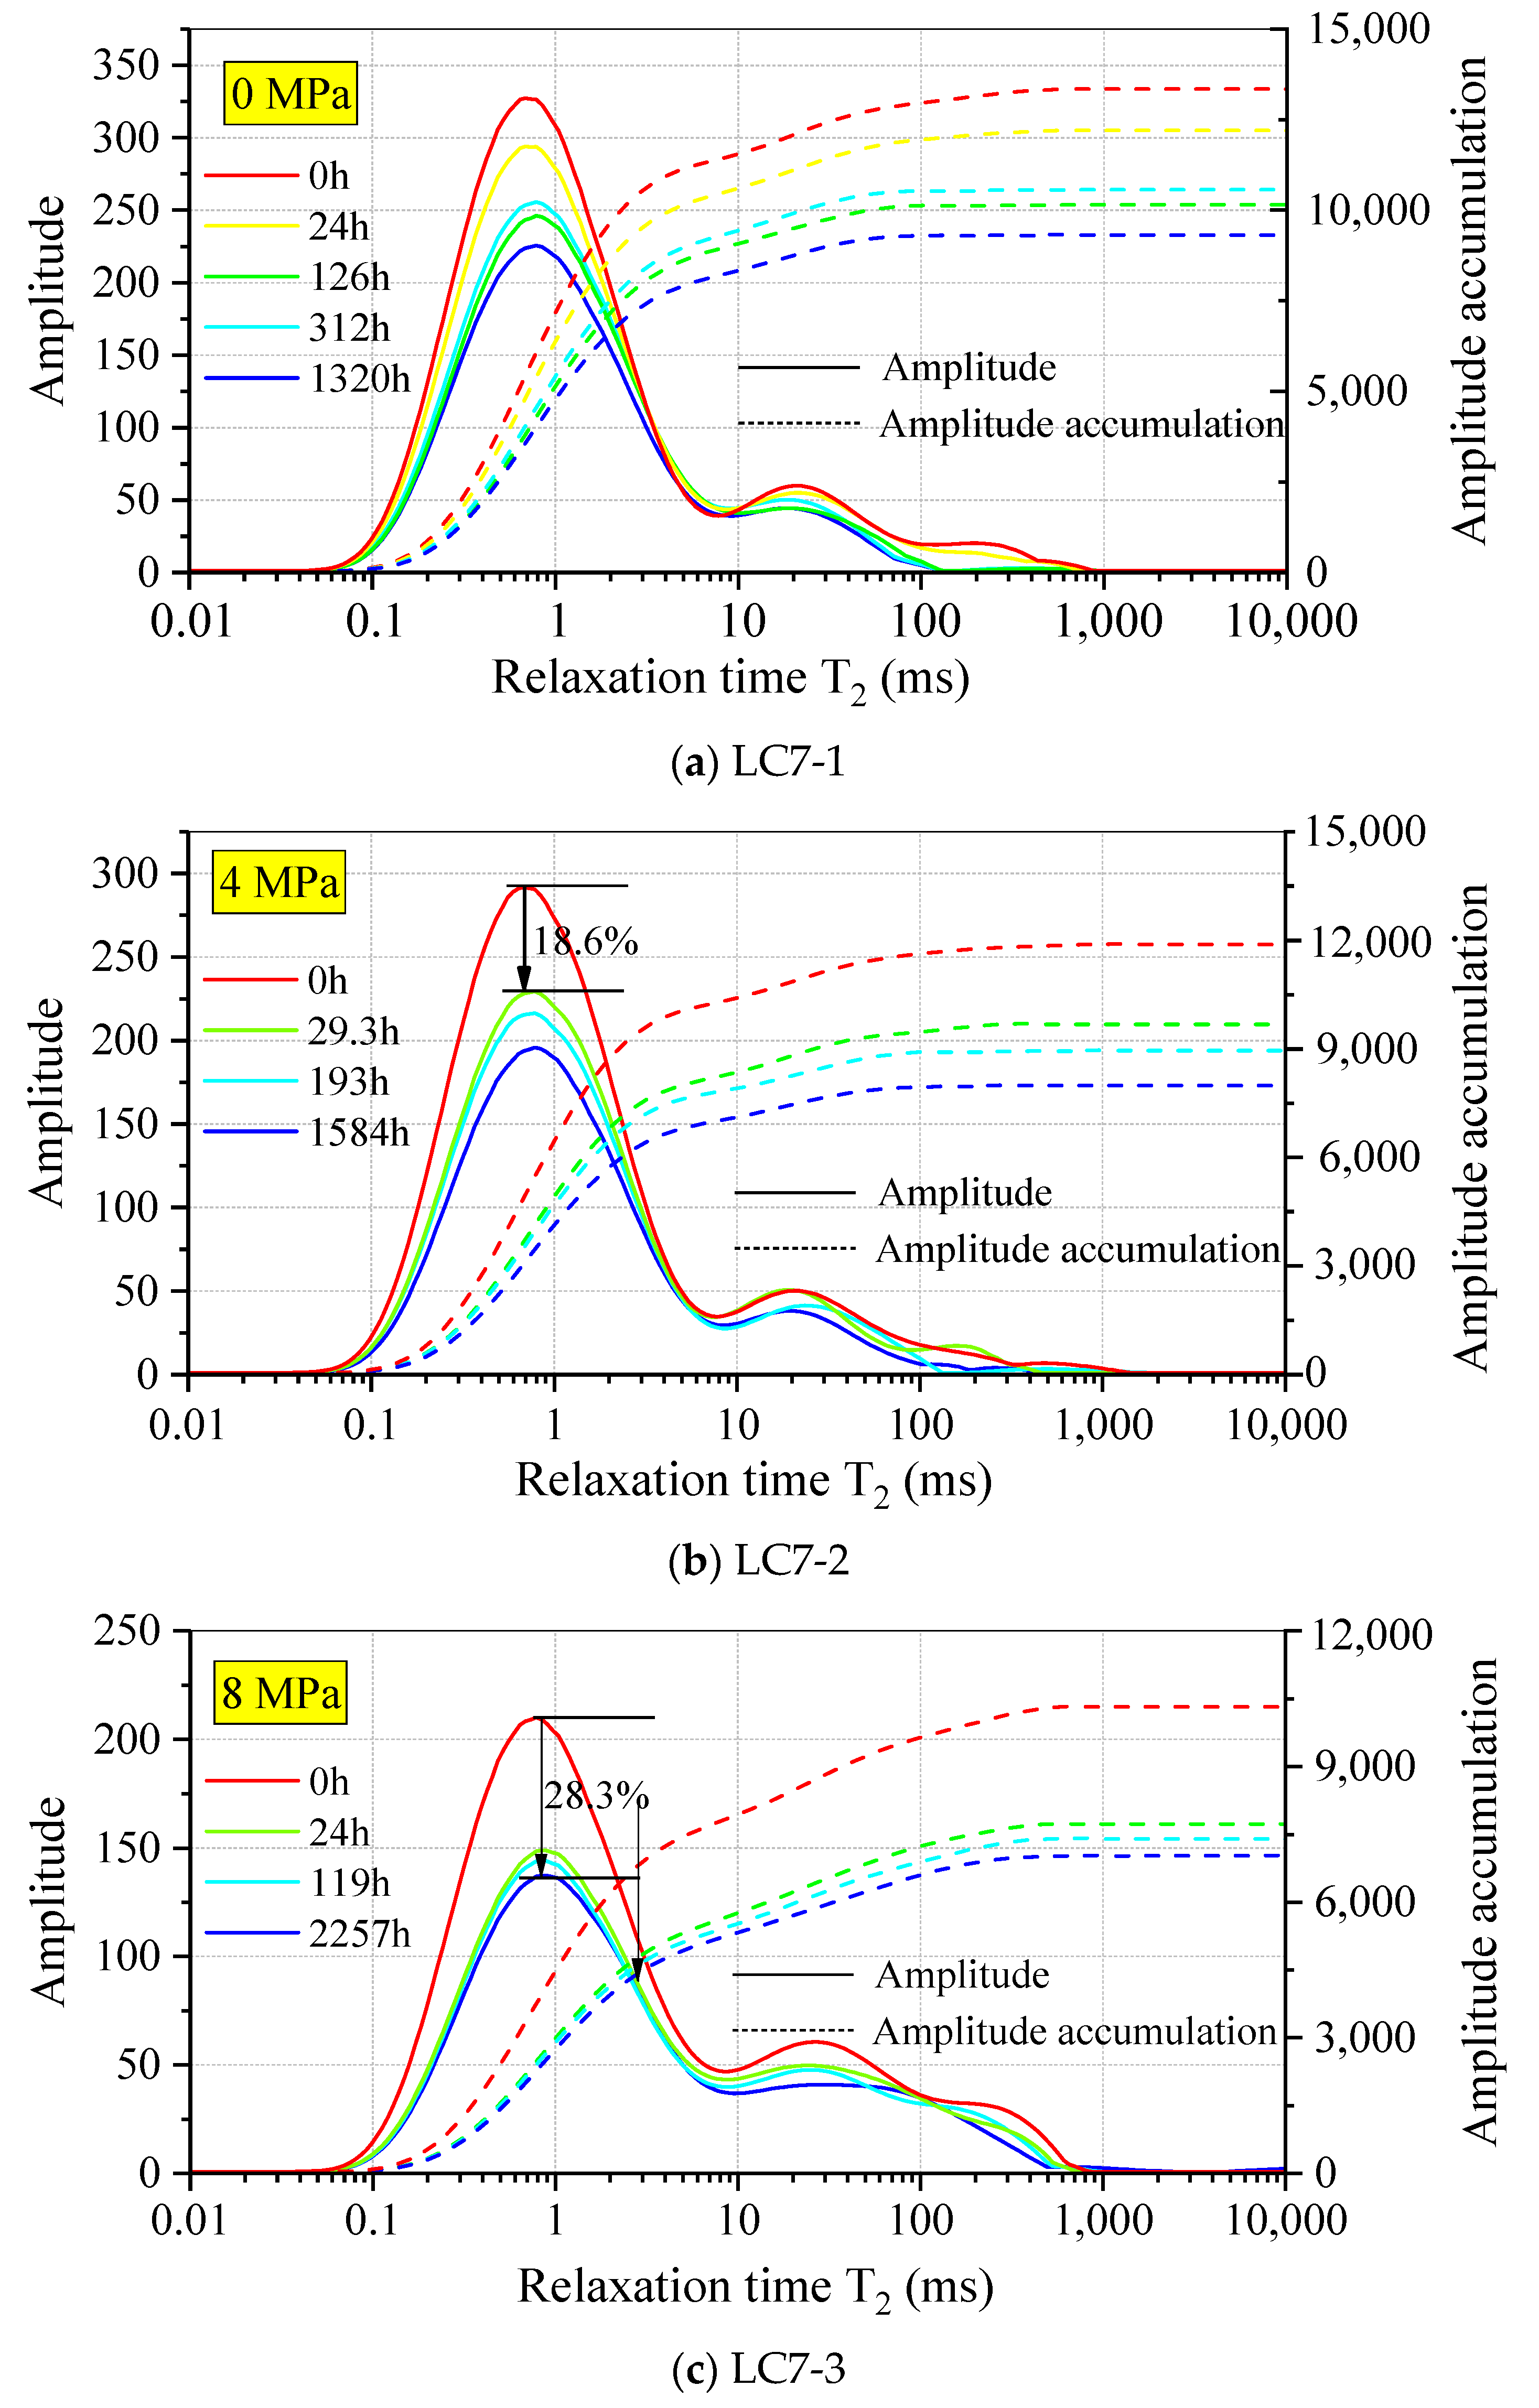
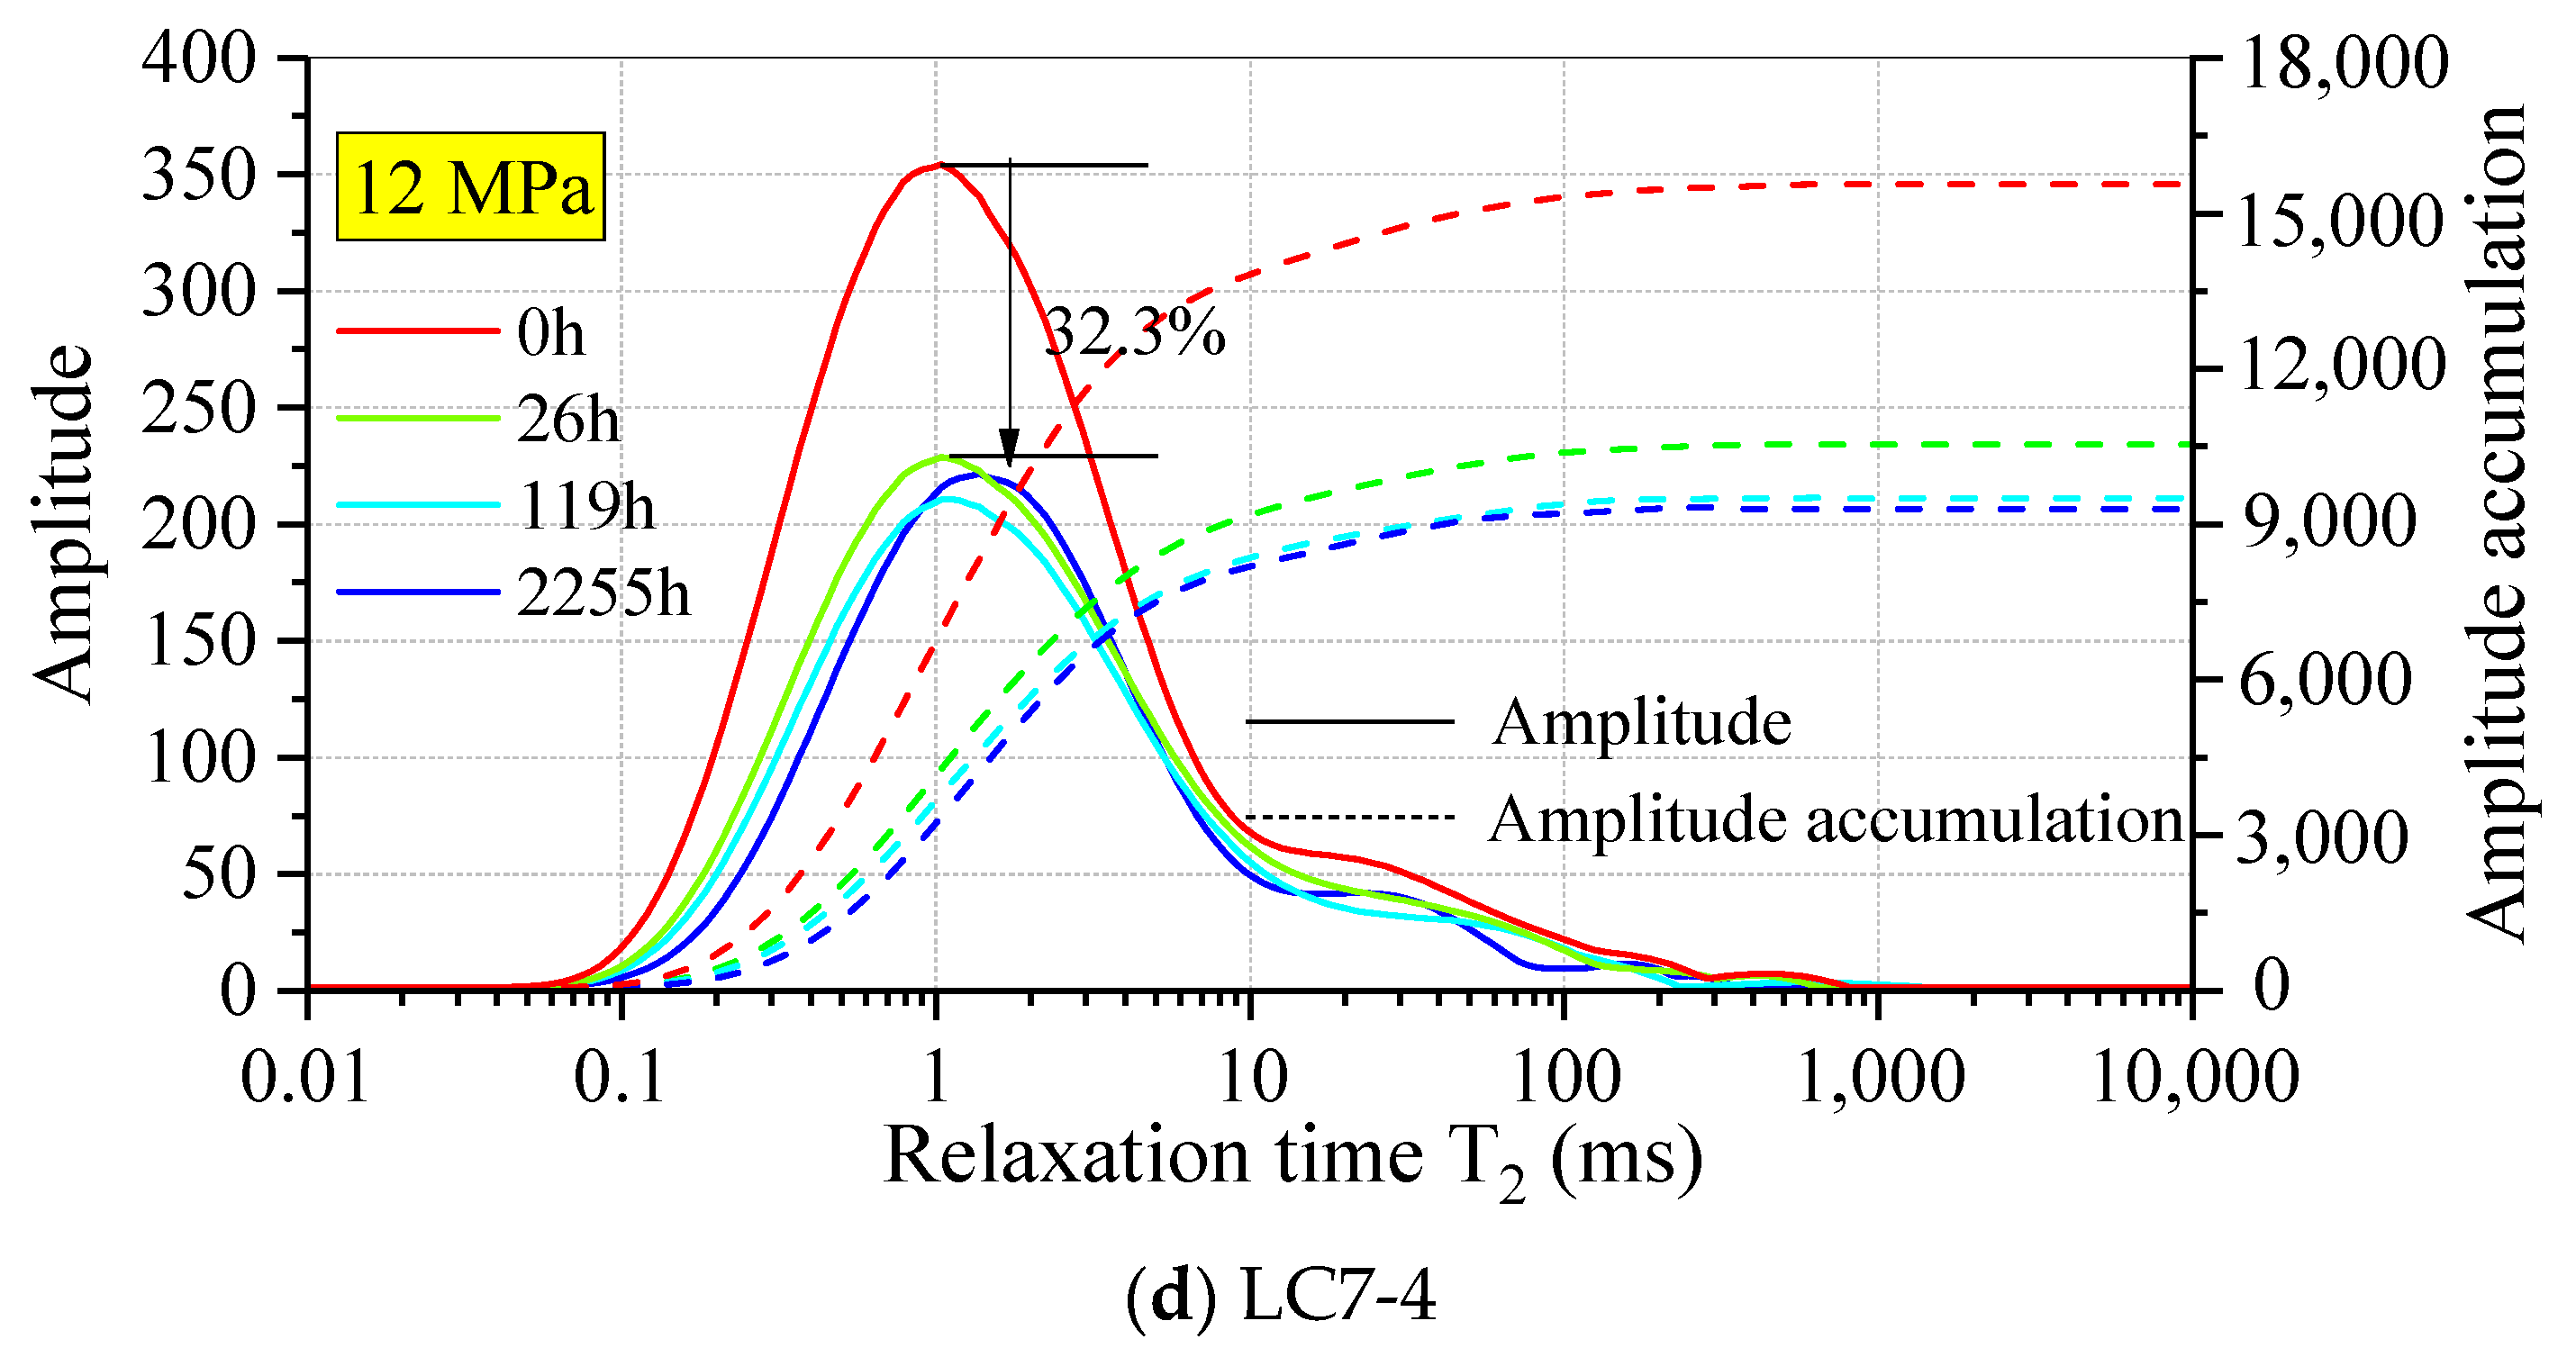
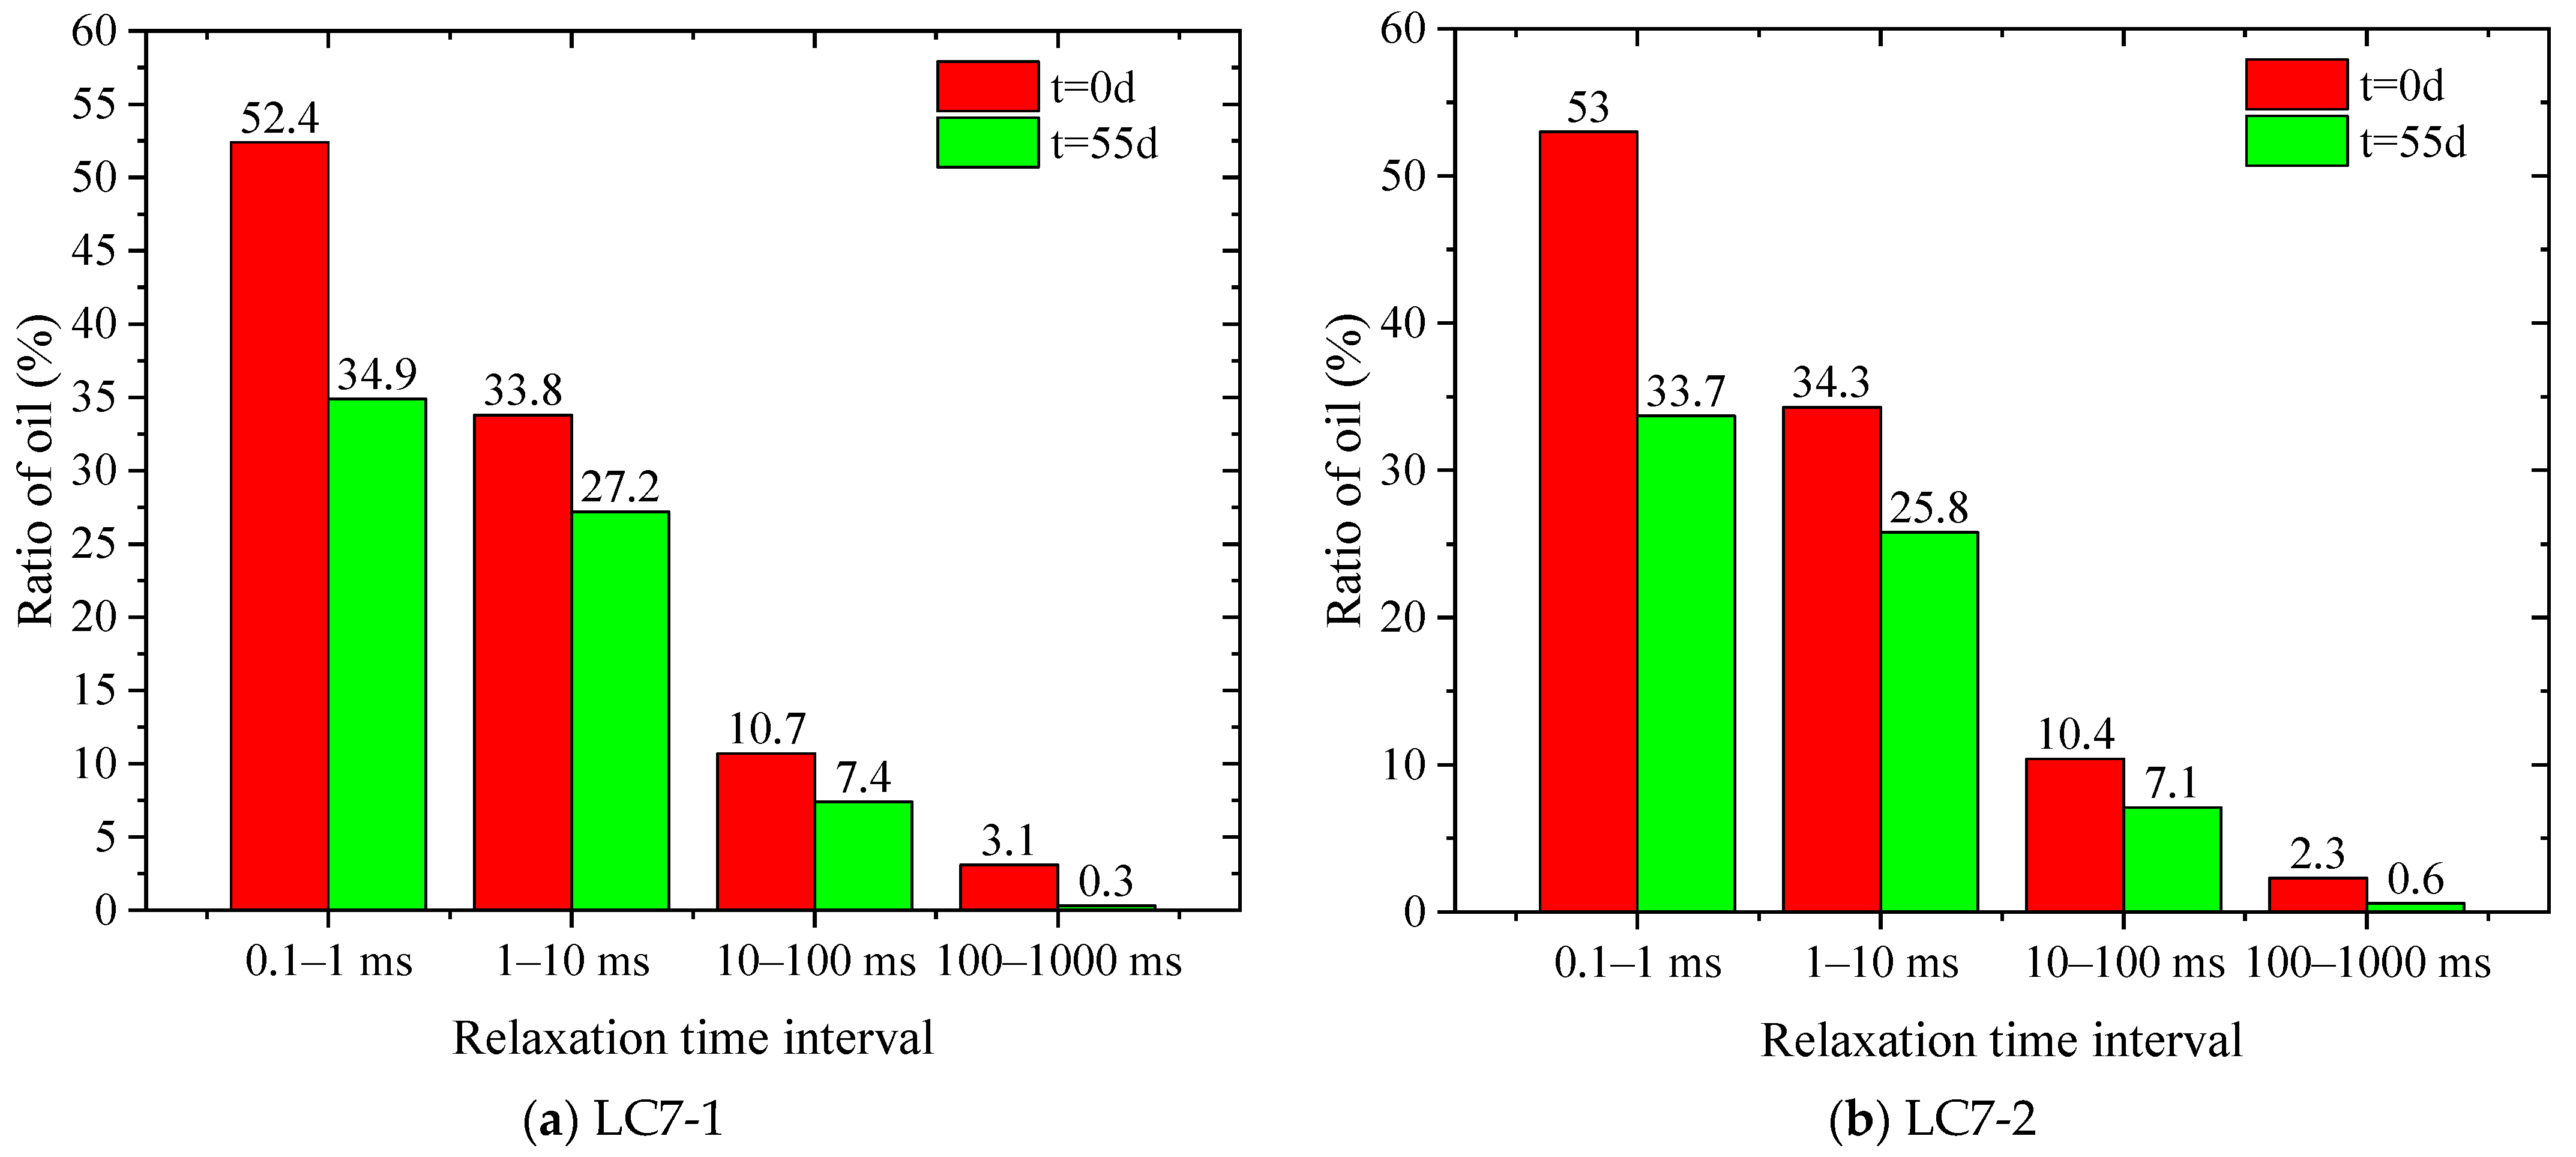
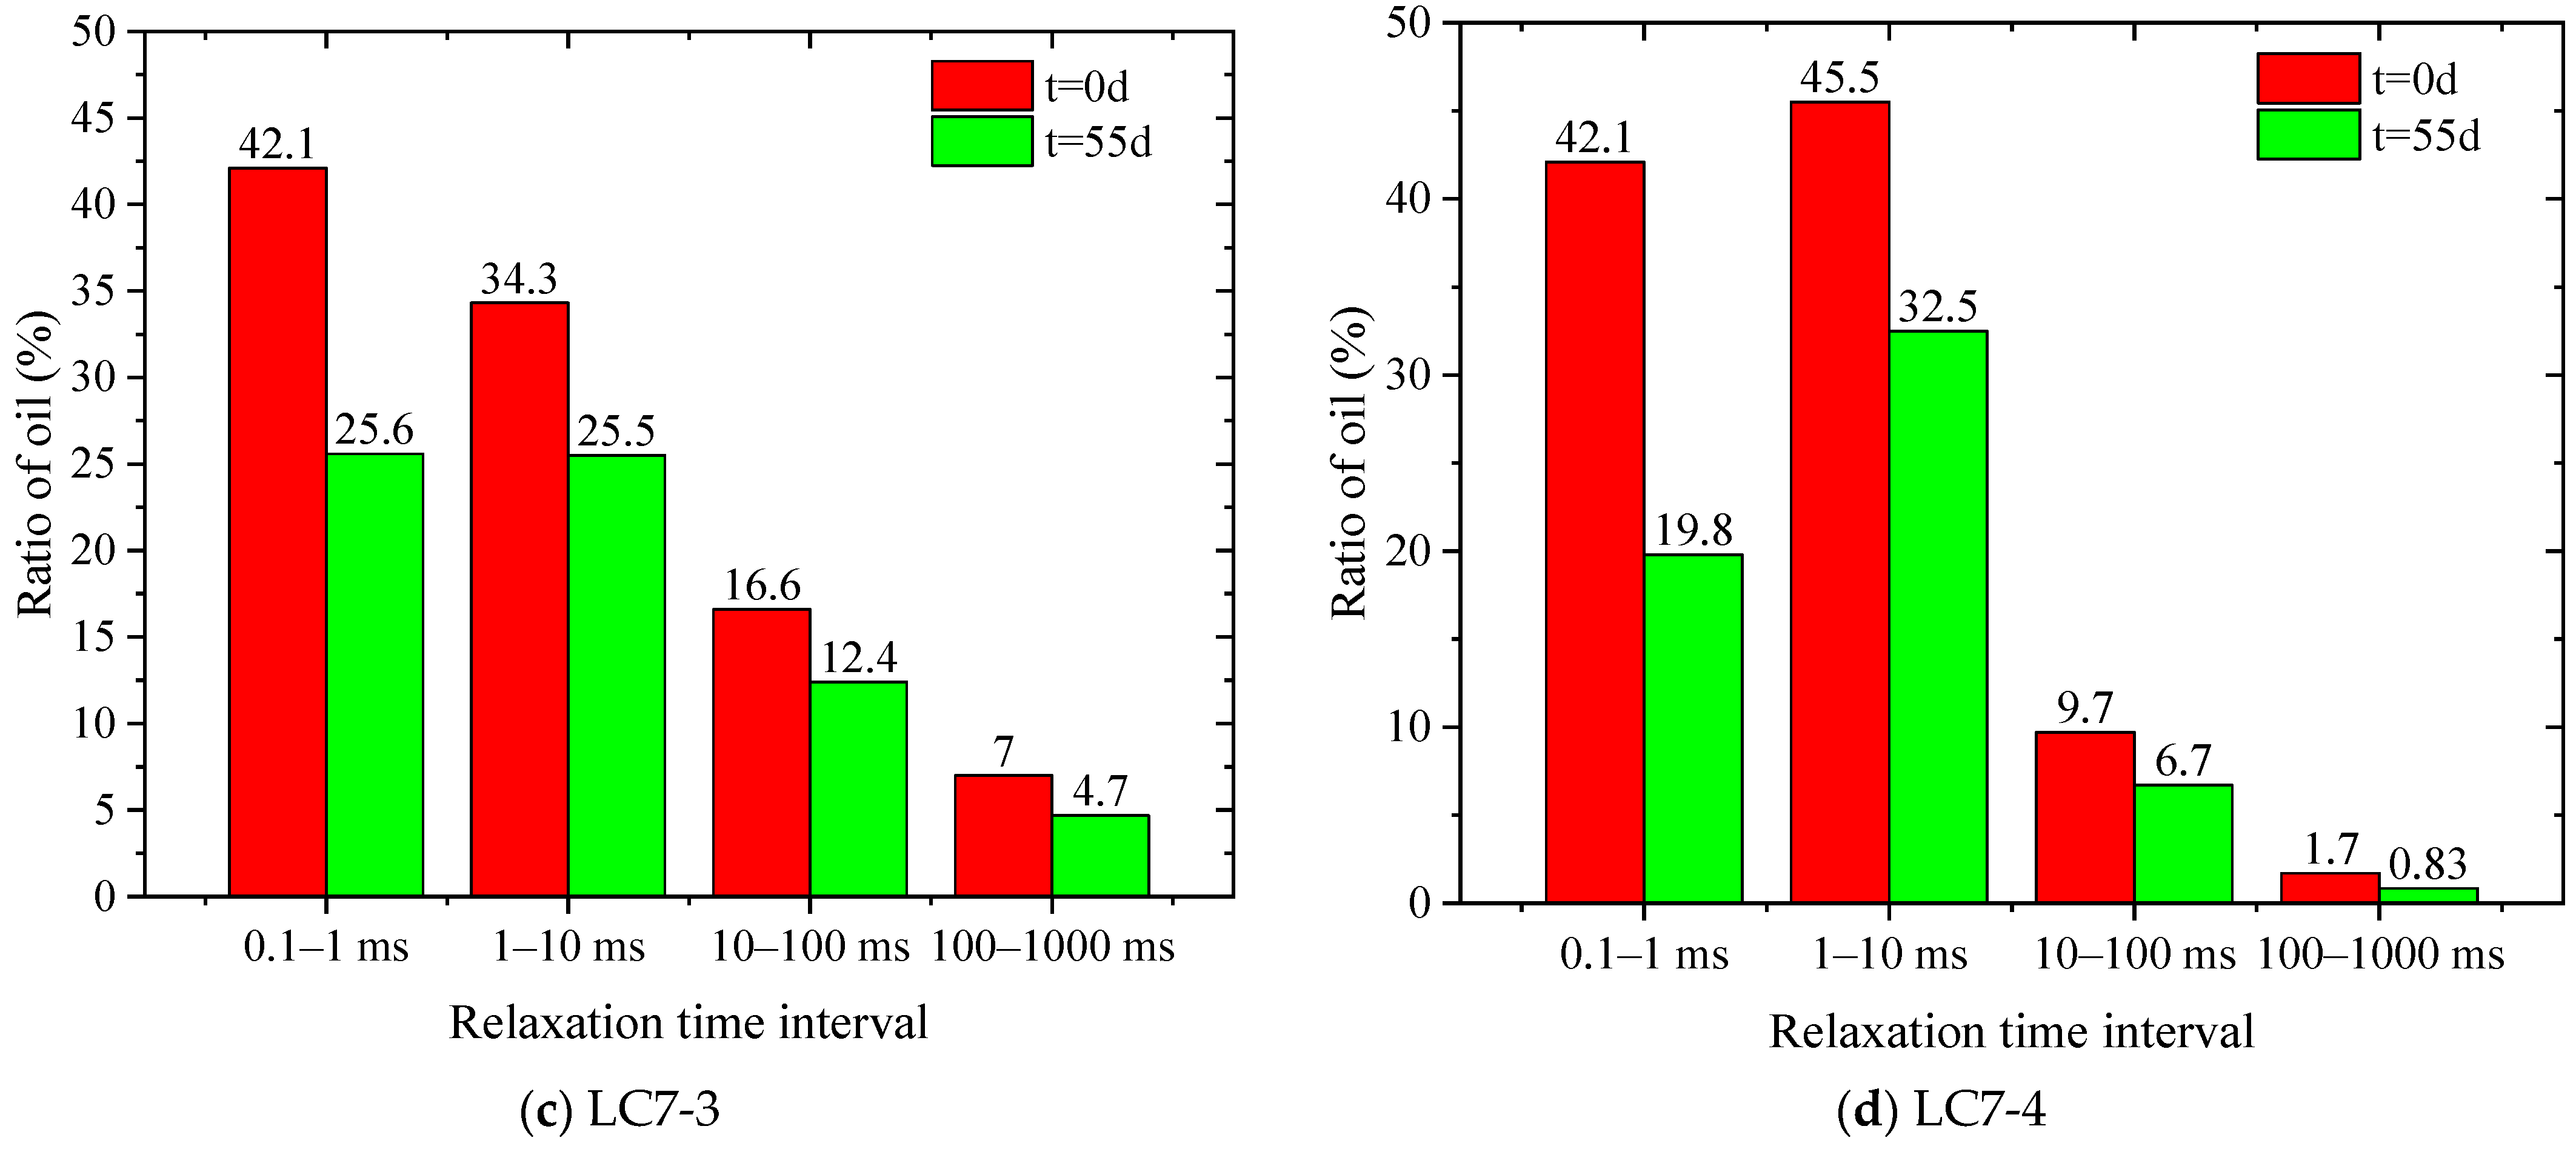
3.1. Effect of Applied Pressure on Oil Transport during Imbibition

According to Meng et al. [22], tight rock pores can be divided into micropores (<1 ms), small pores (1–10 ms), large pores (10–100 ms), and the larger pores (>100 ms). The larger pores and macropores mainly include matrix pores and microcracks. Figure 4 shows the T2 spectrum curves of samples LC7-1 to LC7-4 under different applied pressures. From the T2 spectrum, it can be seen that the sample is mainly composed of micropores and small pores. The T2 spectra in the first three groups all have bimodal characteristics, but the right bimodal characteristics are not obvious. The left peak T2 value is within the range of 0.02~9 ms, and the right peak T2 value is within the range of 9~714 ms. The relaxation time is between 0.1 and 10 ms, indicating that water absorption is mainly concentrated in nanopores and mesopores. The T2 spectrum formed under an external pressure of 12 MPa is characterized by a single peak. Its range is between 0.02 and 821 ms. By comparing the results of spontaneous imbibition, the amplitude shows a decreasing trend as the fluid enters. Obviously, as the external pressure increases, the amplitude also increases, and the curve in the later stage of imbibition tends to be more consistent, which is similar to the T2 spectrum characteristics of spontaneous imbibition. At 4 MPa, 8 MPa, and 12 MPa, the decrease amplitude is 18.6%, 28.3%, and 32.3%, respectively. And the reduction in micropores and small pores is significantly greater than that of large pores. This phenomenon may be attributed to the effect of external pressure, which reduces the contact angle between the core and the liquid. This reduction in contact angle leads to an increase in capillary pressure within the smaller pores, thereby enhancing their imbibition effect.
Figure 5 shows the imbibition recovery at different applied pressures. As the applied pressure increased, the overall imbibition recovery increased. The imbibition recovery at different pressures corresponds to 8.5%, 18.6%, 28.3%, and 32.3%, respectively. With increasing time, their corresponding recovery rates are 28.7%, 32.8%, 31.3%, and 39.8%. It is shown that with the increase in applied pressure, there is a positive correlation effect on the recovery rate, while for the late stage of imbibition, the effect is rather insignificant. In the initial stage of imbibition, the oil is mainly replaced by the water in the micropores and small pores for discharge, while the applied pressure mainly changes the imbibition rate by affecting the capillary pressure, which has the greatest effect on the micropores and small pores. Therefore, the overall imbibition rate can be improved. In the later stage of imbibition, the oil is mainly replaced through the large empty pores. The applied pressure has less influence on the large pores, and thus the change in imbibition recovery in the later stage is not obvious. It can be observed that the recovery rate at a pressure of 8 MPa is slightly lower than at 4 MPa. This variation can be attributed to the heterogeneity of the rock, as it is not possible to ensure uniform lithology across all samples. Despite this, the overall recovery rate exhibited an upward trend, indicating that increased pressure generally has a positive effect on recovery.

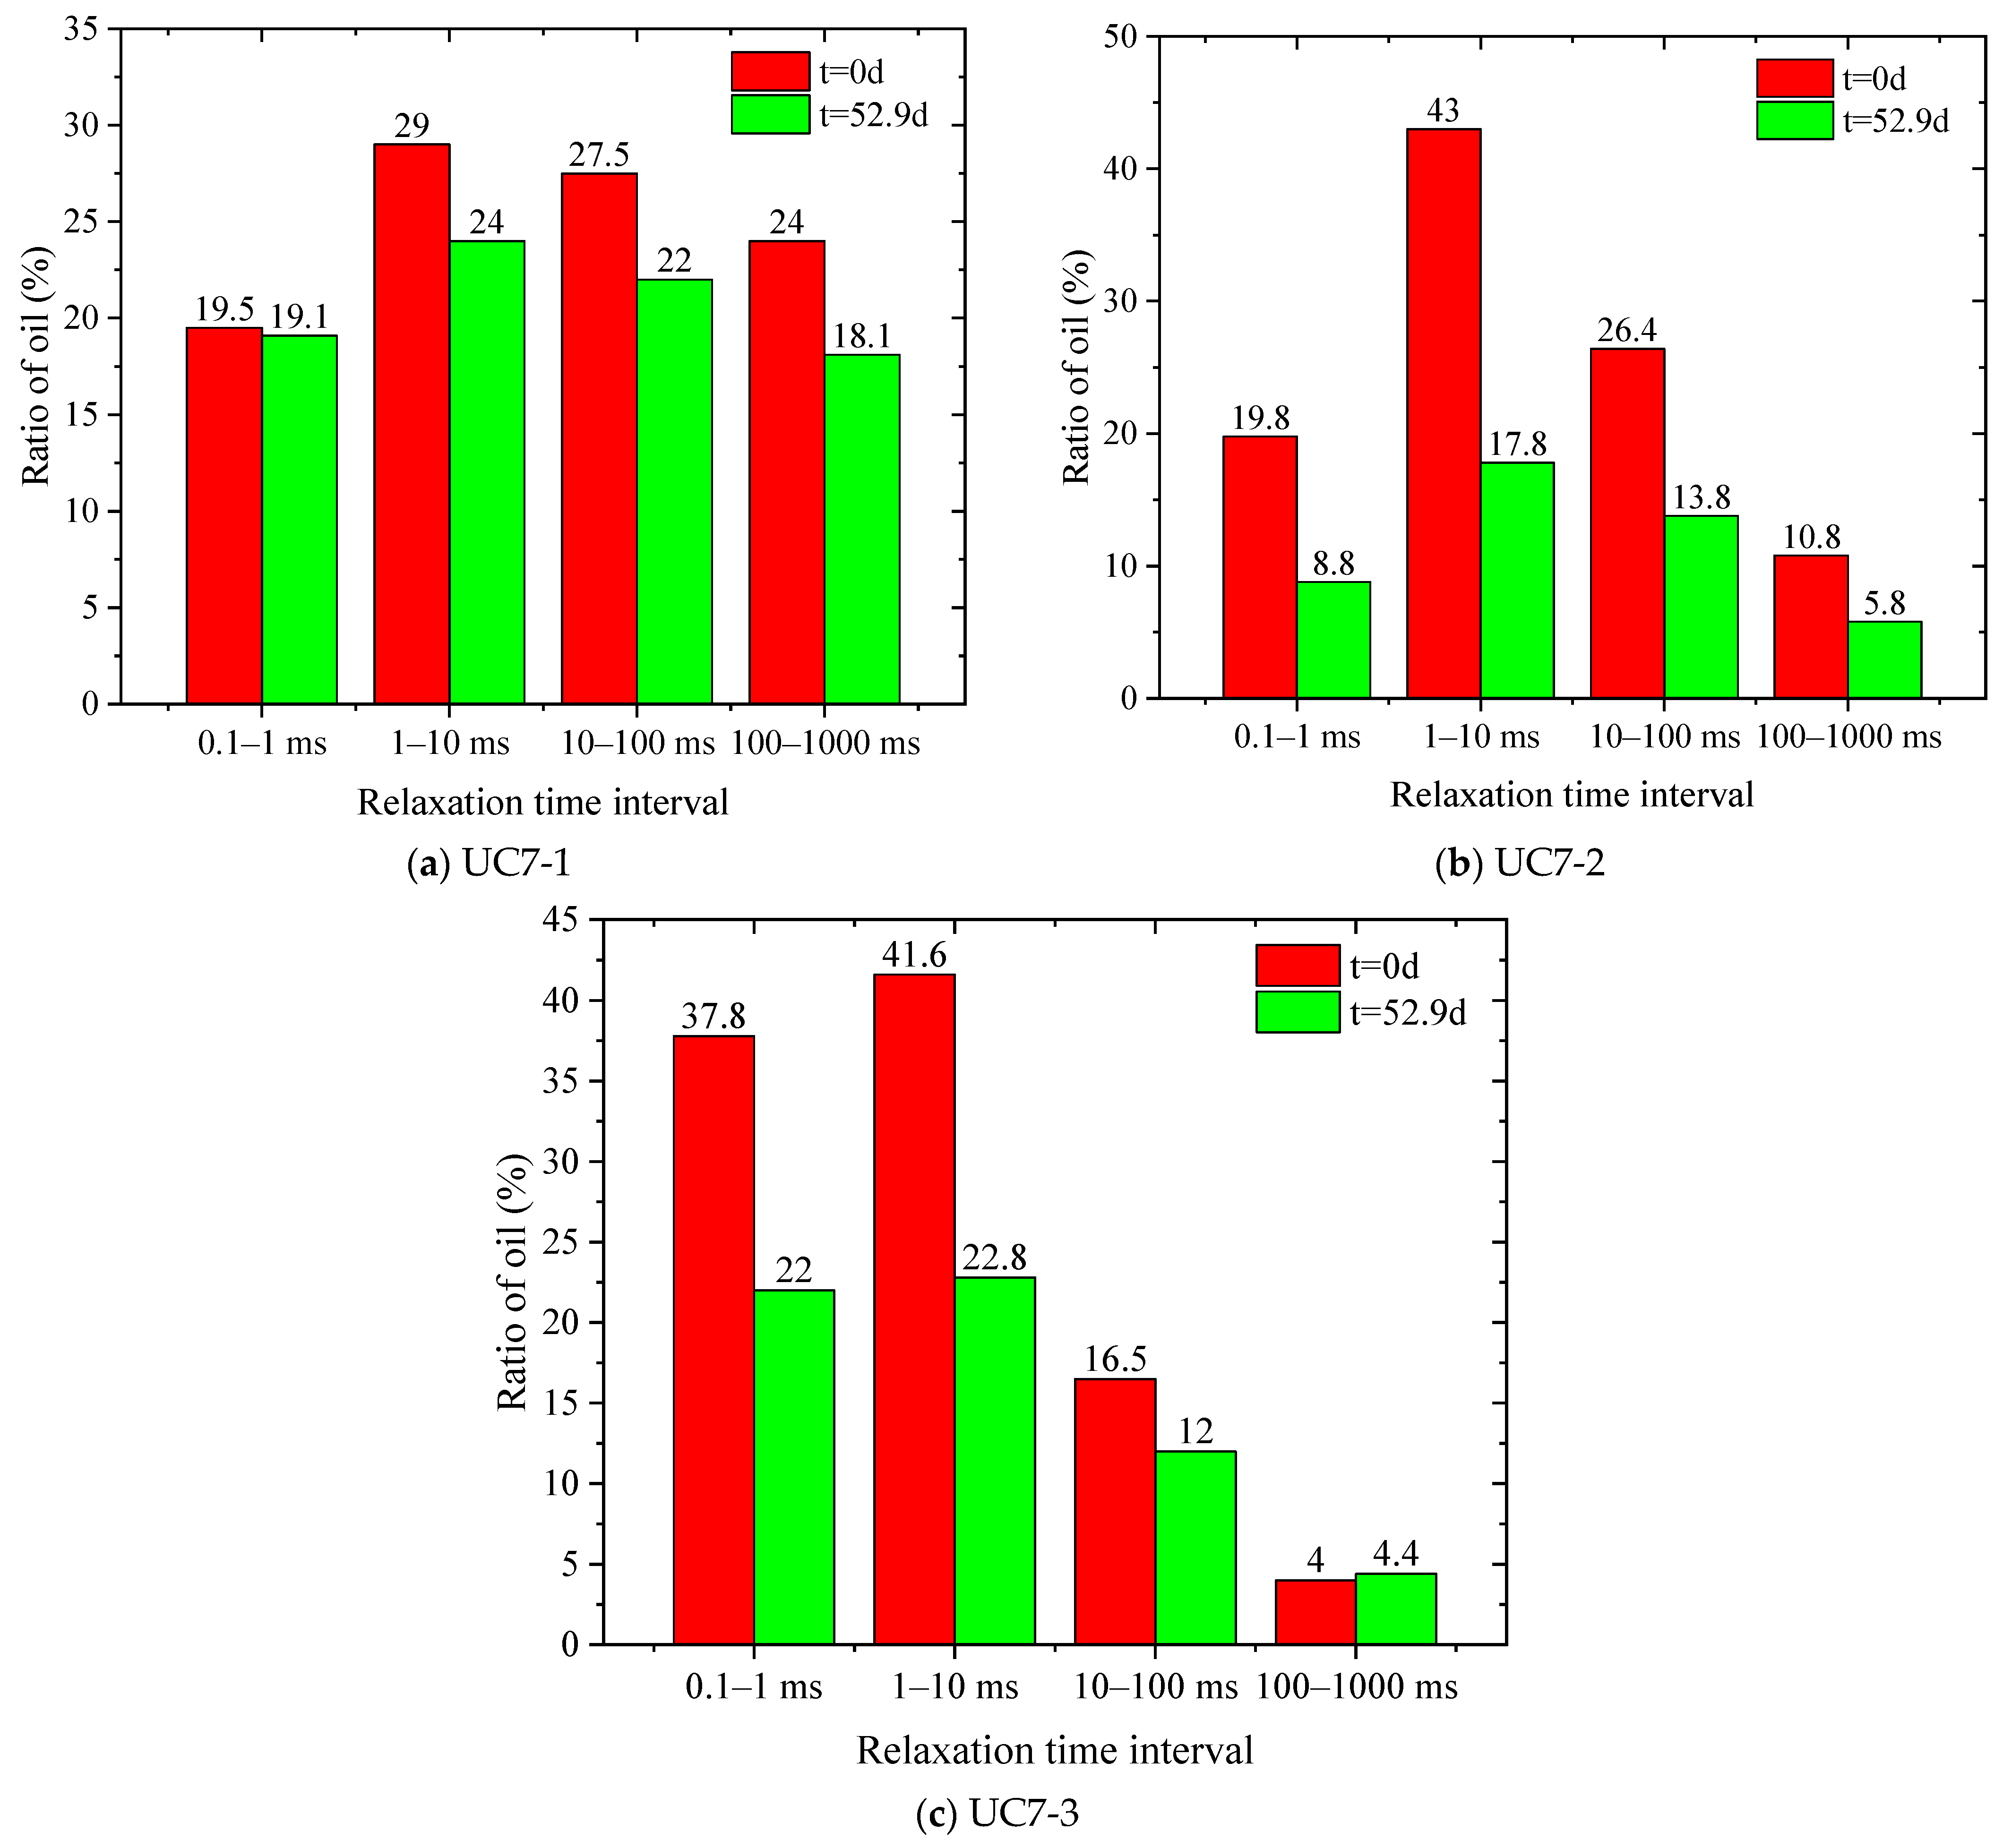
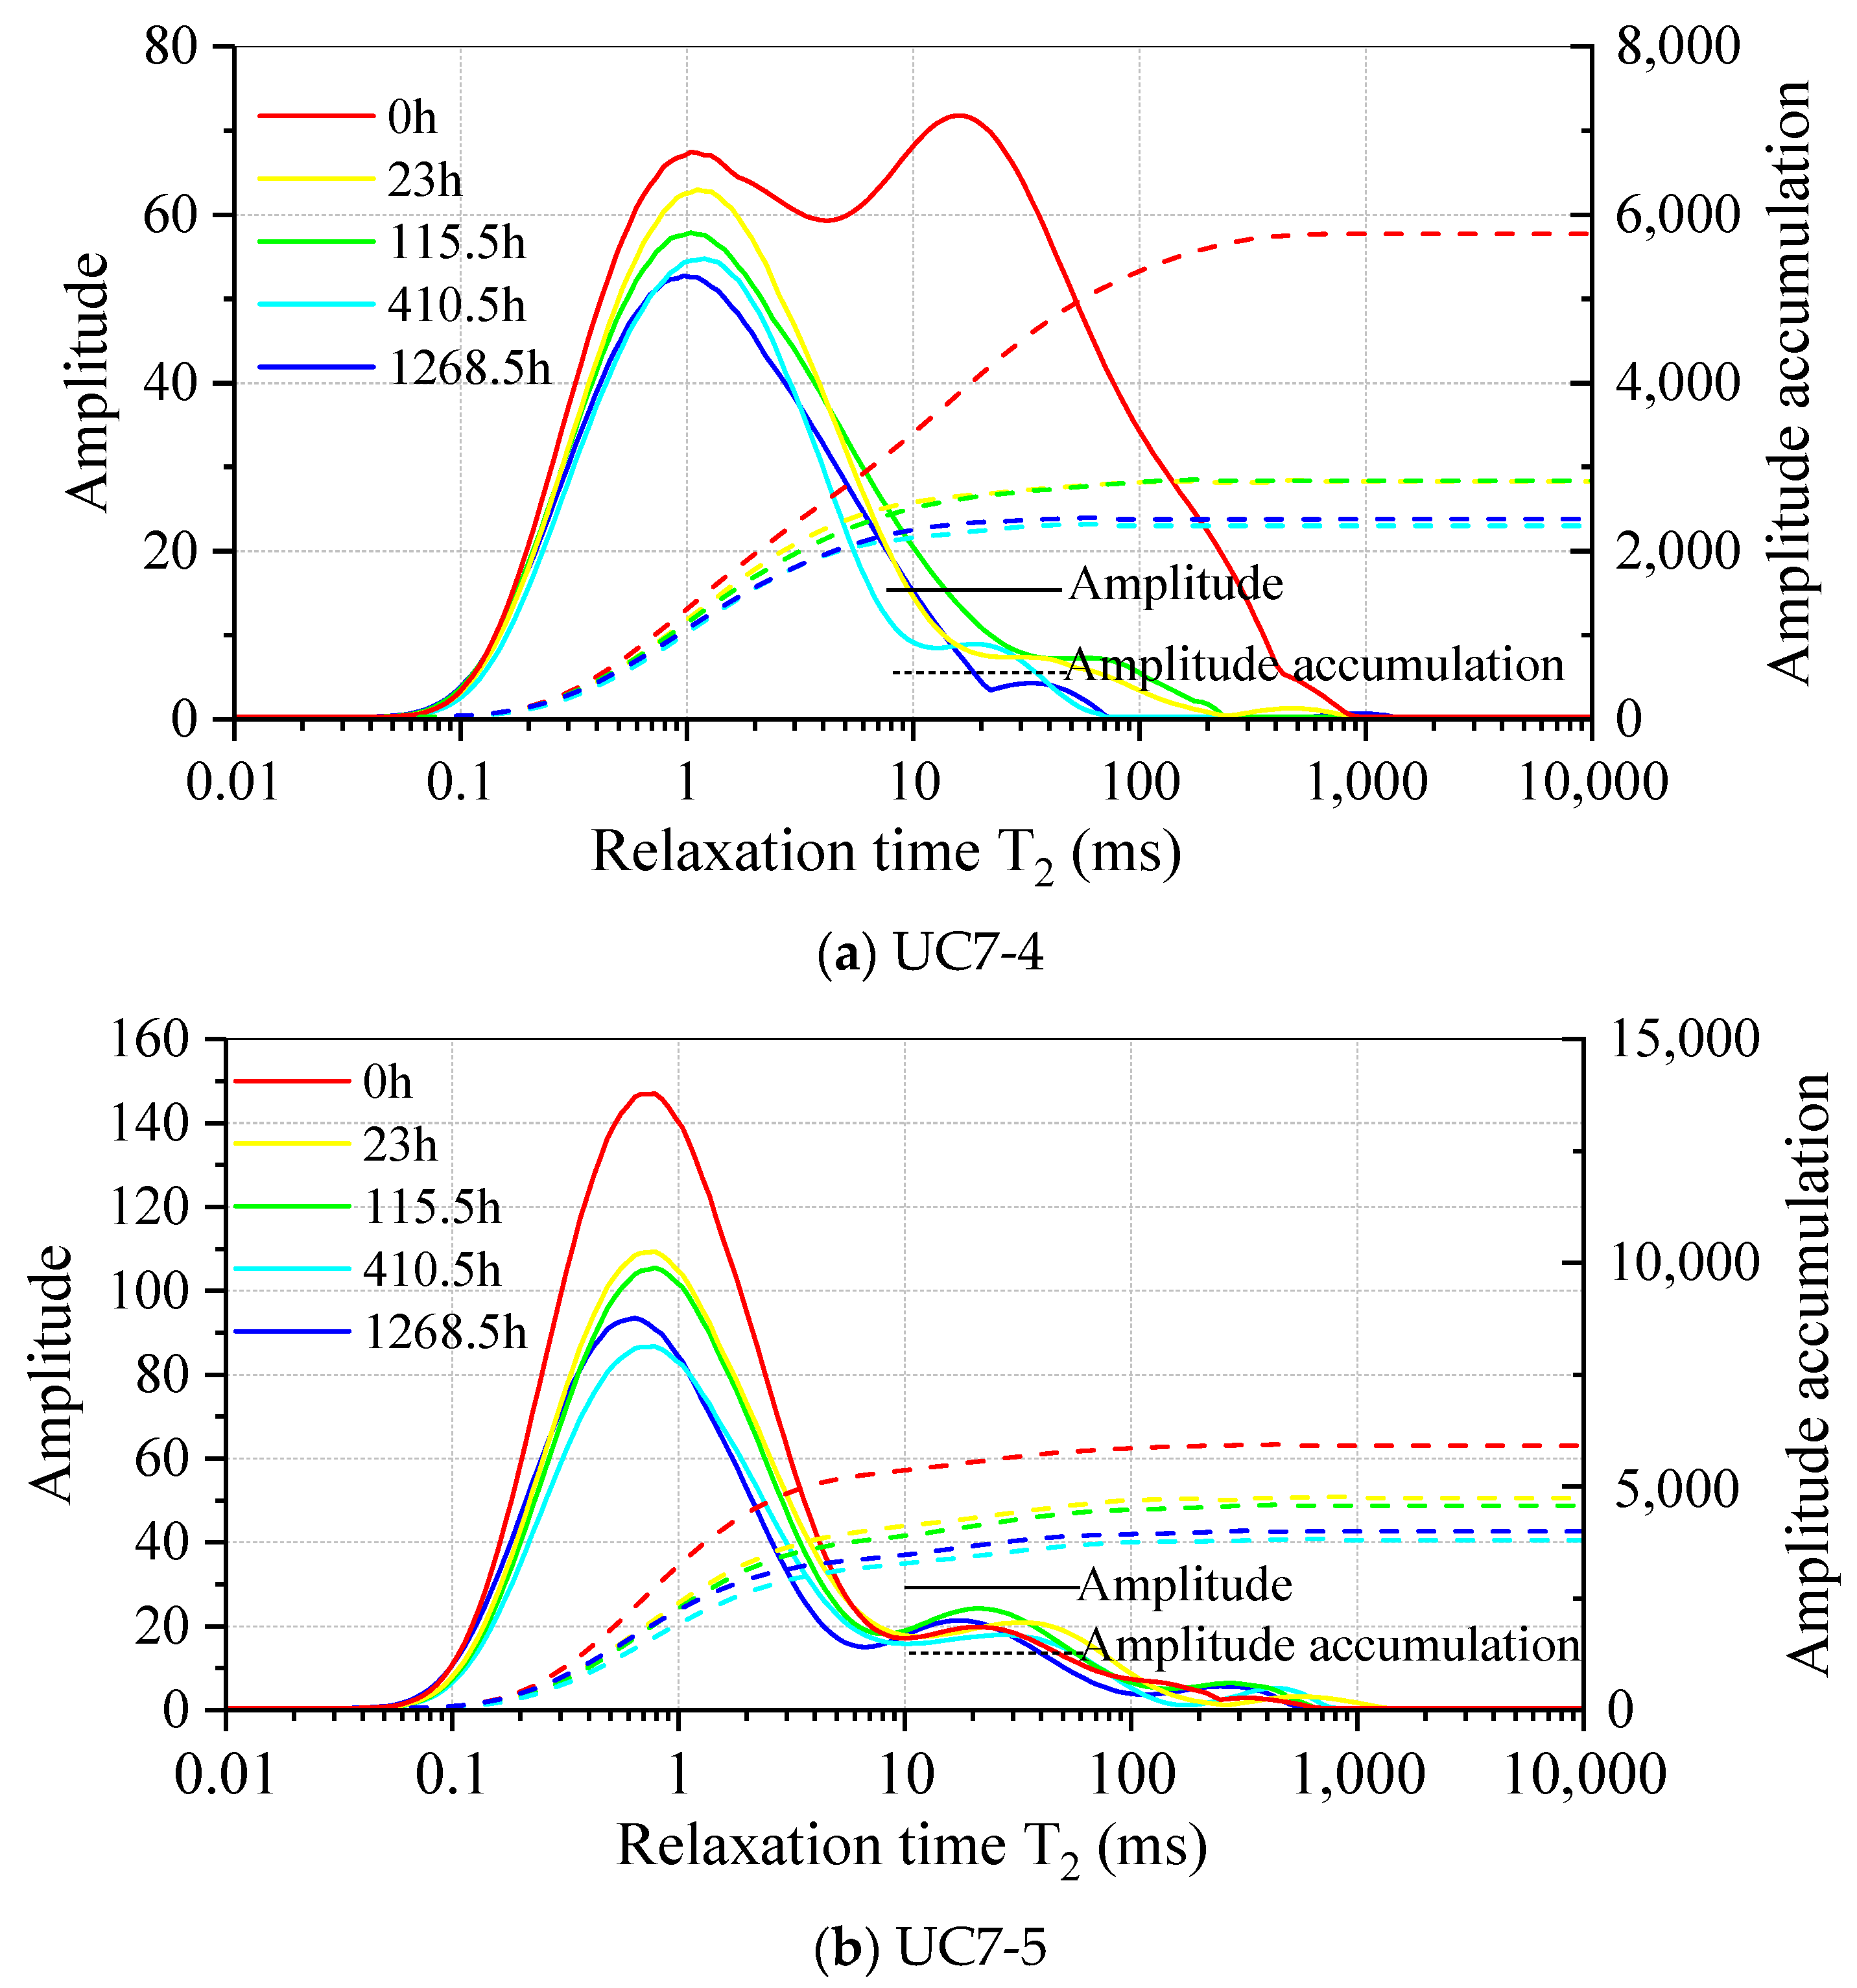
3.2. Effect of Pore Size Distribution on Imbibition

In this section, we discuss the influence of different pore sizes and their distributions on the pressure imbibition effect. Figure 6 shows the T2 spectral curves of UC7-1, UC7-2, and UC7-3 under an external pressure of 10 MPa. Both have the same T2 spectral characteristics, and the amplitudes corresponding to different apertures show a significant downward trend. The T2 spectrum of sample UC7-1 shows a three-peak distribution, with the left peak ranging from 0.07 to 50 ms, the middle peak ranging from 50 to 100 ms, and the right peak ranging from 100 to 700 ms. The T2 spectrum of UC7-2 shows a multimodal distribution, with the left peak ranging from 0.07 to 50 ms and the right peak ranging from 50 to 400 ms. The T2 spectrum of sample UC7-3 shows a single peak distribution, with a range of 0.07~10 ms. The amplitude accumulation curve also shows that the three samples have different pore size distribution characteristics. The pore distribution of UC7-1 is relatively uniform. In UC7-2 and UC7-3 samples, the oil in the pores of the former is mainly present in mesopores and larger pores, while the latter is mainly present in micropores and small pores. When the imbibition time exceeds 410 h, the cumulative curves of different T2 spectra basically overlap and do not change, and the curves remain within a certain range. It indicates the presence of residual oil in the pores, and the use of external pressure and capillary force alone cannot completely drain the oil, which may be related to the trapping effect of the narrow pore throat channels inside.
Figure 7 shows the variation in oil content in different pores. In Figure 7a, due to the uniform distribution of pores, the overall imbibition recovery rate is relatively average, while the recovery rate of micropores is relatively low. In Figure 7b, after 52 days of imbibition, the oil content in all pores decreases, but that in micropores and small pores is more significant. In Figure 7c, after 52 days of imbibition, the oil content in micropores and small pores significantly decreases, while the oil content in large pores increases. It indicates that under the action of capillary force, water preferentially displaces oil from micropores and flows into larger pores. The capillary force of micropores and small pores is greater, so the permeability of pores is stronger. Due to the larger micropores and smaller pore sizes of sample UC7-3, its capillary pressure is stronger and its permeability is stronger.

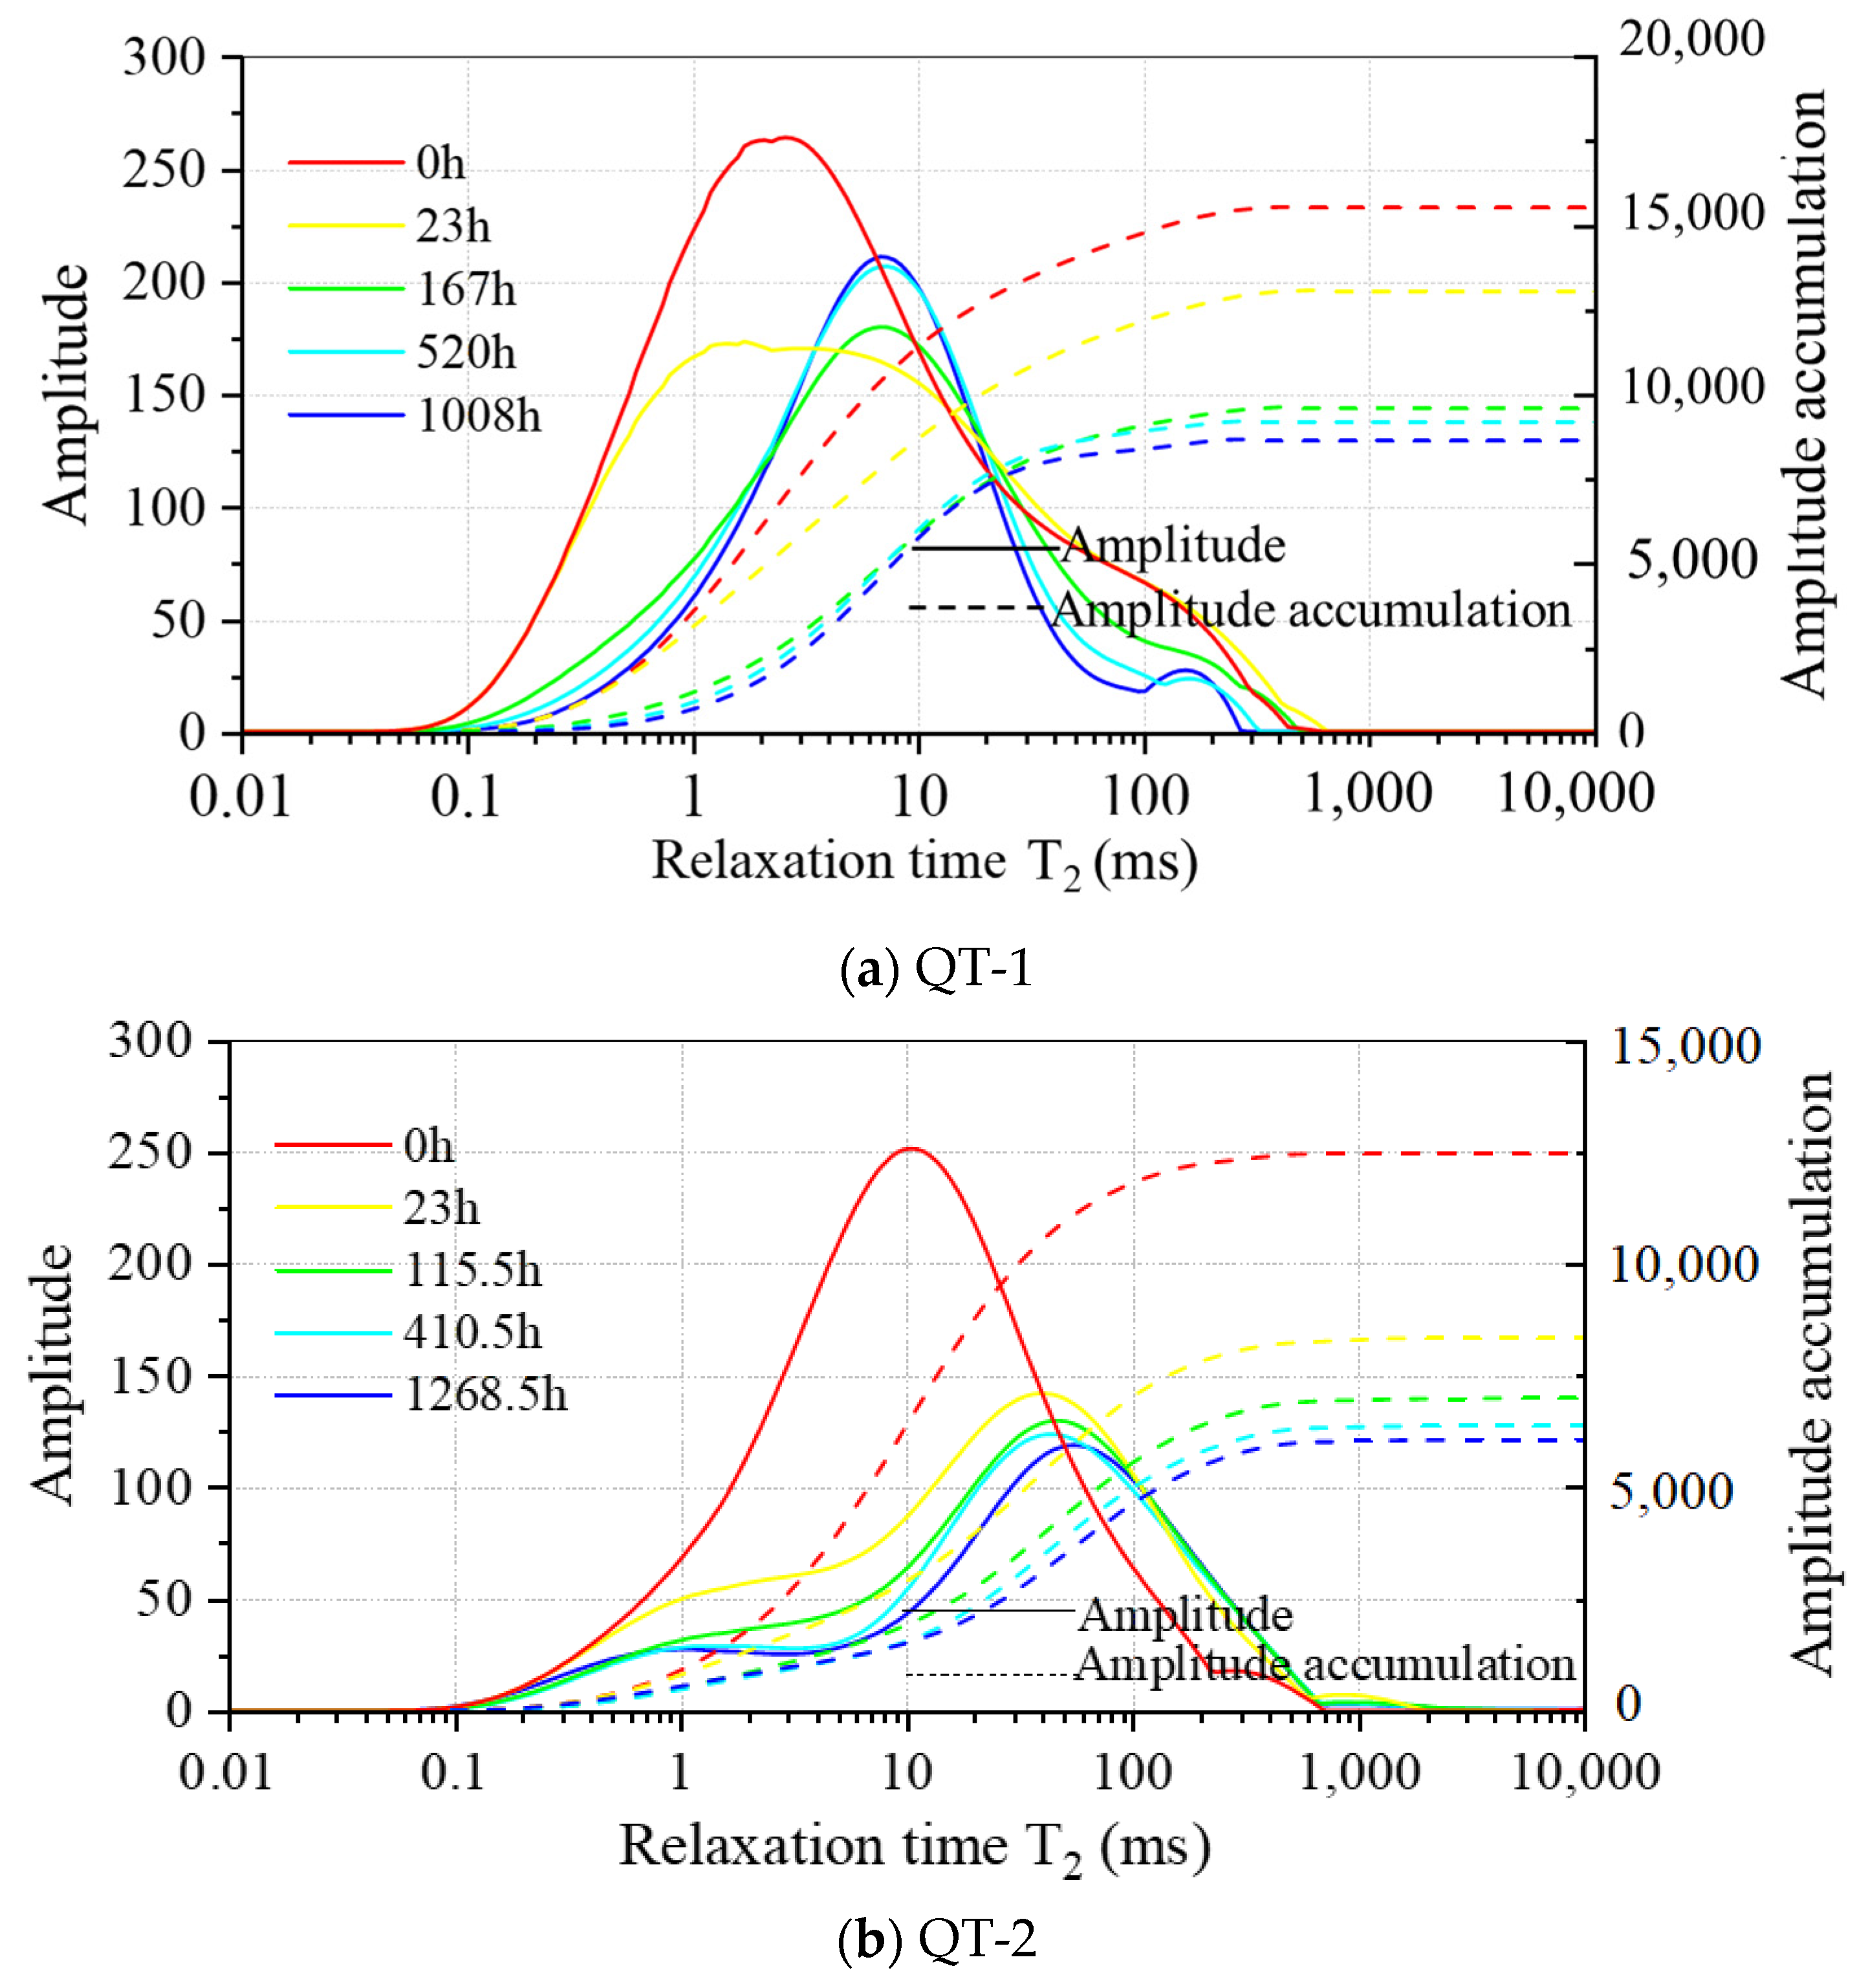
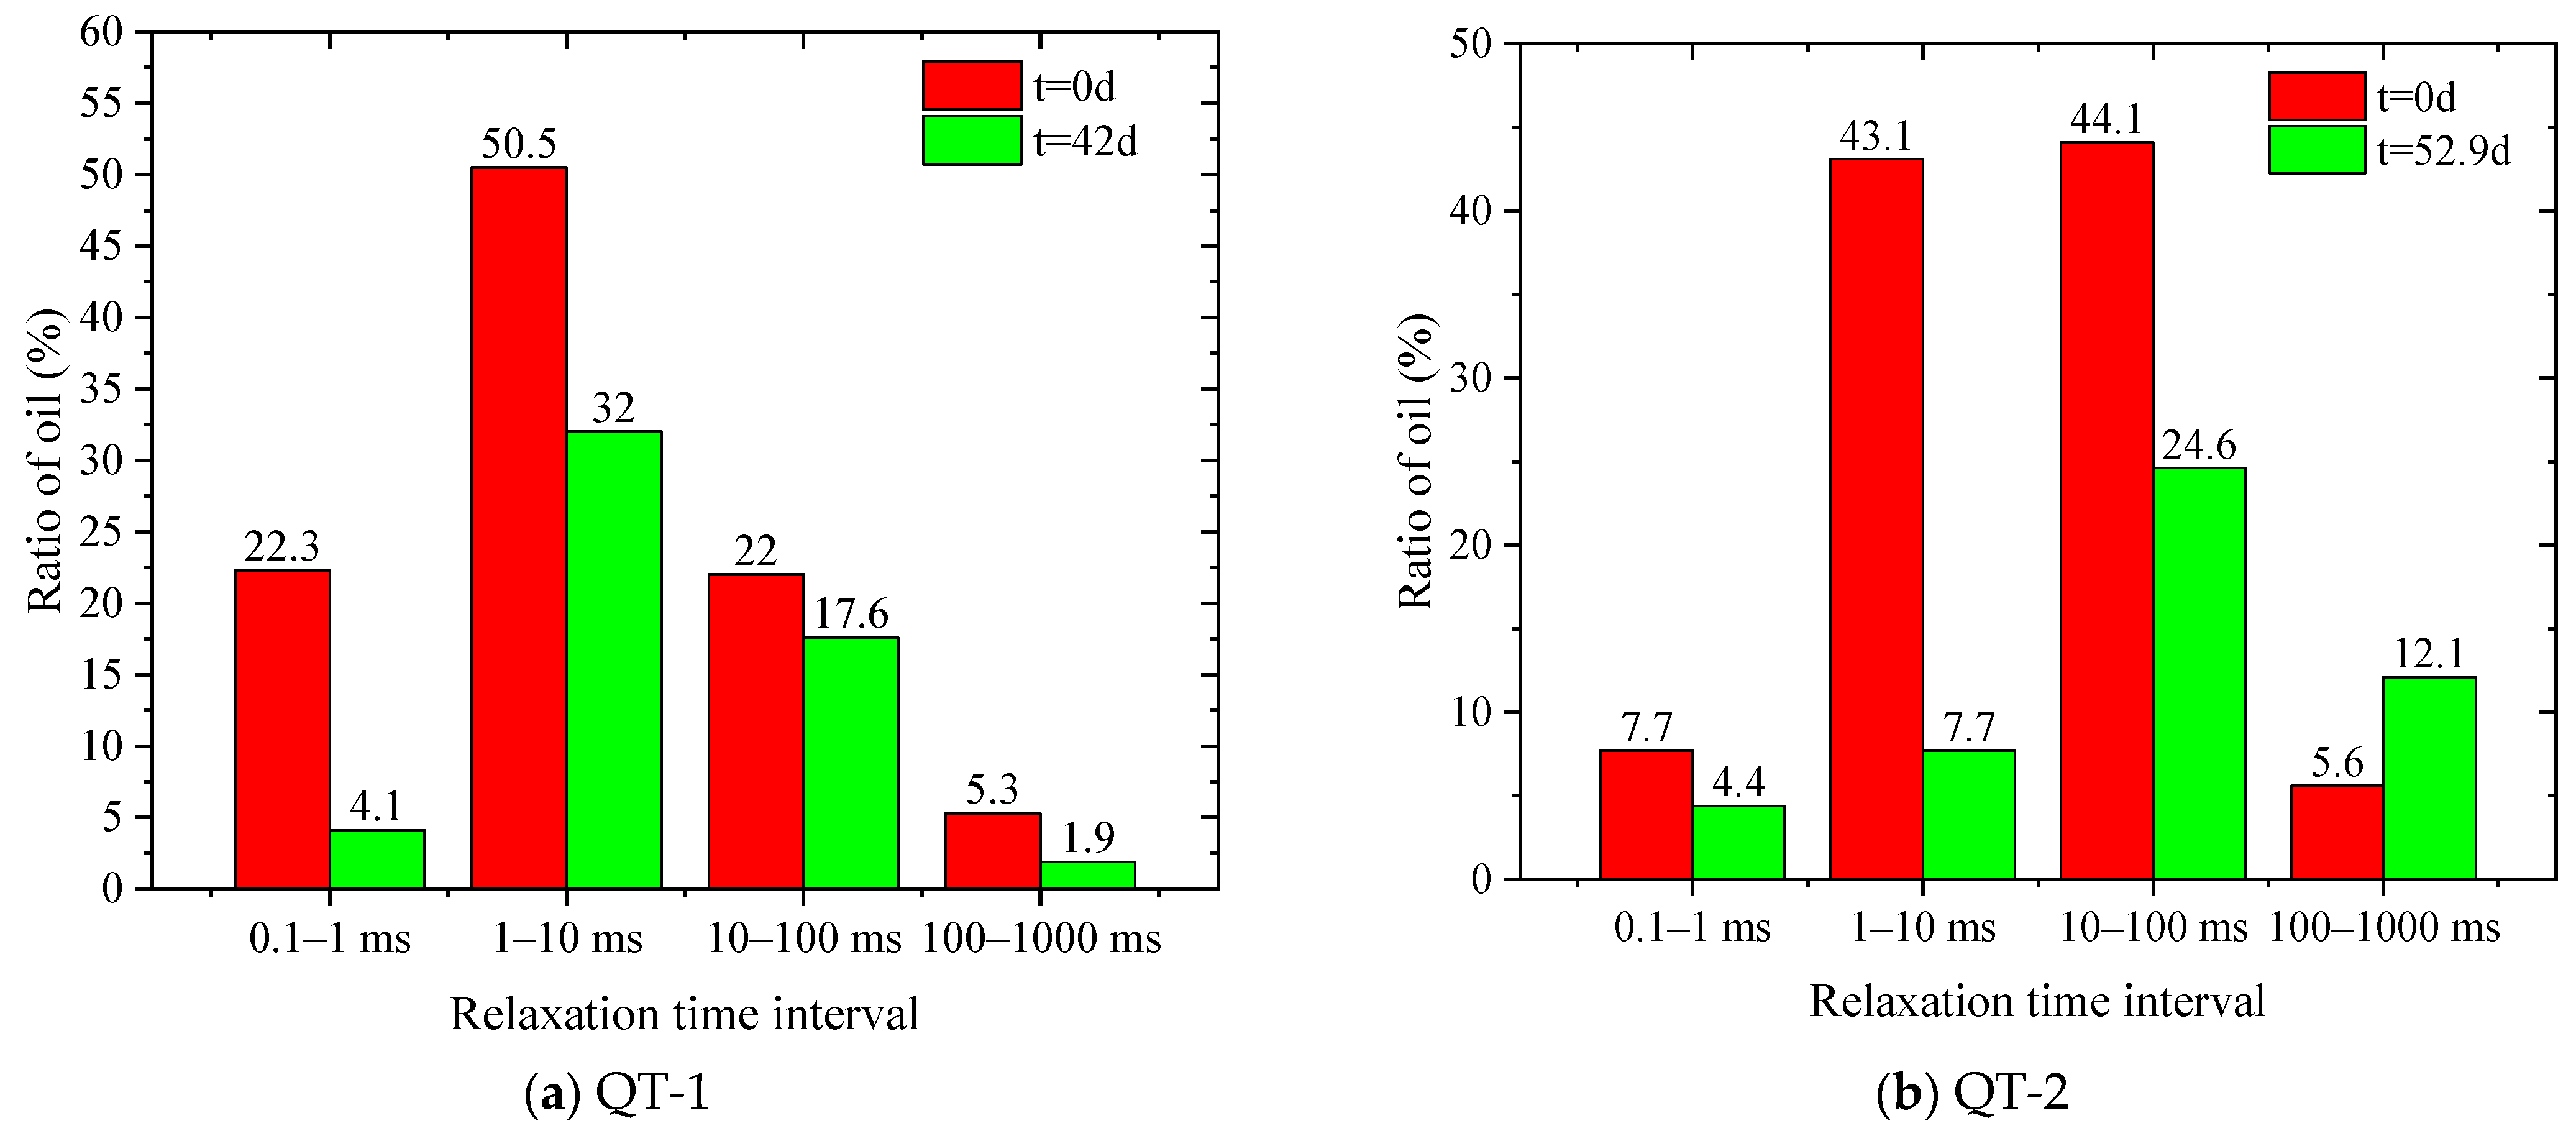
3.3. Effect of Natural Cracks on Imbibition Absorption

Figure 8 shows the T2 spectra of spontaneous and pressurized imbibition of samples UC7-5 and LC7-5. According to Yang [17], spontaneous imbibition samples are enveloped by microcracks and exhibit different characteristics of oil migration. The amplitude decrease rate of macropores and macropores is greater than that of micropores. Compared with micropores, microfractures are the main channels for oil and gas migration. The T2 spectrum distribution of UC7-5 sample under pressure imbibition is the same as that of spontaneous imbibition, with oil mainly distributed in larger pores (>10 ms) and also containing many microcracks, ranging from 0.05 to 1000 ms overall. LC7-5 contains fewer microcracks, and oil mainly exists in micropores. As the imbibition time increases, the amplitude of large pores in forced imbibition decreases significantly compared to spontaneous imbibition, and tends to stabilize in the later stage. From the T2 spectrum curve at the beginning of imbibition, it can be seen that the cracks in sample UC7-5 are mainly macropores, with more parts >10 ms. Perhaps due to the presence of more natural fractures, the residual oil saturation in the later stage of imbibition is higher.
Figure 9 shows the spontaneous imbibition of sample UC7-2 and the changes in oil content in different pores of samples UC7-4 and UC7-5 under the pressure of 10 MPa. Before imbibition, oil in sample UC7-5 mainly exists in micropores, small pores, and larger pores, accounting for 21.9%, 36%, and 33.8%, respectively. After 52.9 days of imbibition, the oil content in larger pores and macropores significantly decreases, while the oil content in micropores changes less. The oil recovery rate is significantly higher than that of micropores. In sample LC7-5, oil mainly exists in micropores and small pores, accounting for 53% and 37%, respectively. The obvious difference is that the recovery rates of larger and larger pores are significantly lower than those of sample UC7-5, and the recovery rates of micropores are higher. Perhaps due to the presence of natural microcracks, water preferentially enters the natural fractures to replace oil, reducing the oil recovery rate of the pores.

3.4. Effect of Crack Expansion on Imbibition Absorption

Figure 10 shows the T2 spectral curves of sample QT-1 spontaneous imbibition and QT-2 forced imbibition at 10 MPa. The T2 spectra formed by both have unimodal characteristics, with T2 values ranging from 0.07 to 900 ms. As the imbibition time increases, the amplitude shows a significant downward trend. Unlike the previous T2 spectrum curve, QT-1 shows a certain upward trend in the later stage of imbibition, and the cumulative curve distribution is relatively uniform. In the early stage of imbibition, the amplitude curve decreases, indicating that water enters the micropores and replaces oil. In the later stage of imbibition, cracks expand due to the expansion of clay minerals. The oil discharged from micropores enters the expanding fractures, causing the amplitude curves of large and larger pores to show an upward trend. The QT-2 amplitude curve also shows a certain upward trend, and the pressure causes the amplitude curve to move downwards to the right, which has a significant impact on the middle and late stages of imbibition.
Figure 11 shows the oil content changes in different pores of samples QT-1 and QT-2. Before imbibition, the oil content in micropores, small pores, large pores, and larger pores of sample QT-1 are 22.3%, 50.5%, 22%, and 5.3%, respectively. After 42 days of imbibition, the content is 4.1%, 32%, 17.6%, and 1.9%, respectively. Due to the upward trend of the amplitude curve in the later stage, the recovery rate in larger pores is relatively low. Before imbibition, the oil content in micropores, small pores, large pores, and larger pores of sample QT-2 is 7.7%, 43.1%, 44.1%, and 5.6%, respectively. After 52.9 days of imbibition, the contents are 4.4%, 7.7%, 24.6%, and 12.1%, respectively. It can be observed that the oil recovery rate is highest in small pores, while the oil recovery rate in large pores shows a negative value. During the imbibition process, cracks expand due to the expansion of clay minerals, causing the oil displaced from micropores and small pores to enter the newly generated cracks. Pressurization causes the overall recovery rate of the pores to shift towards the direction of the larger pores.

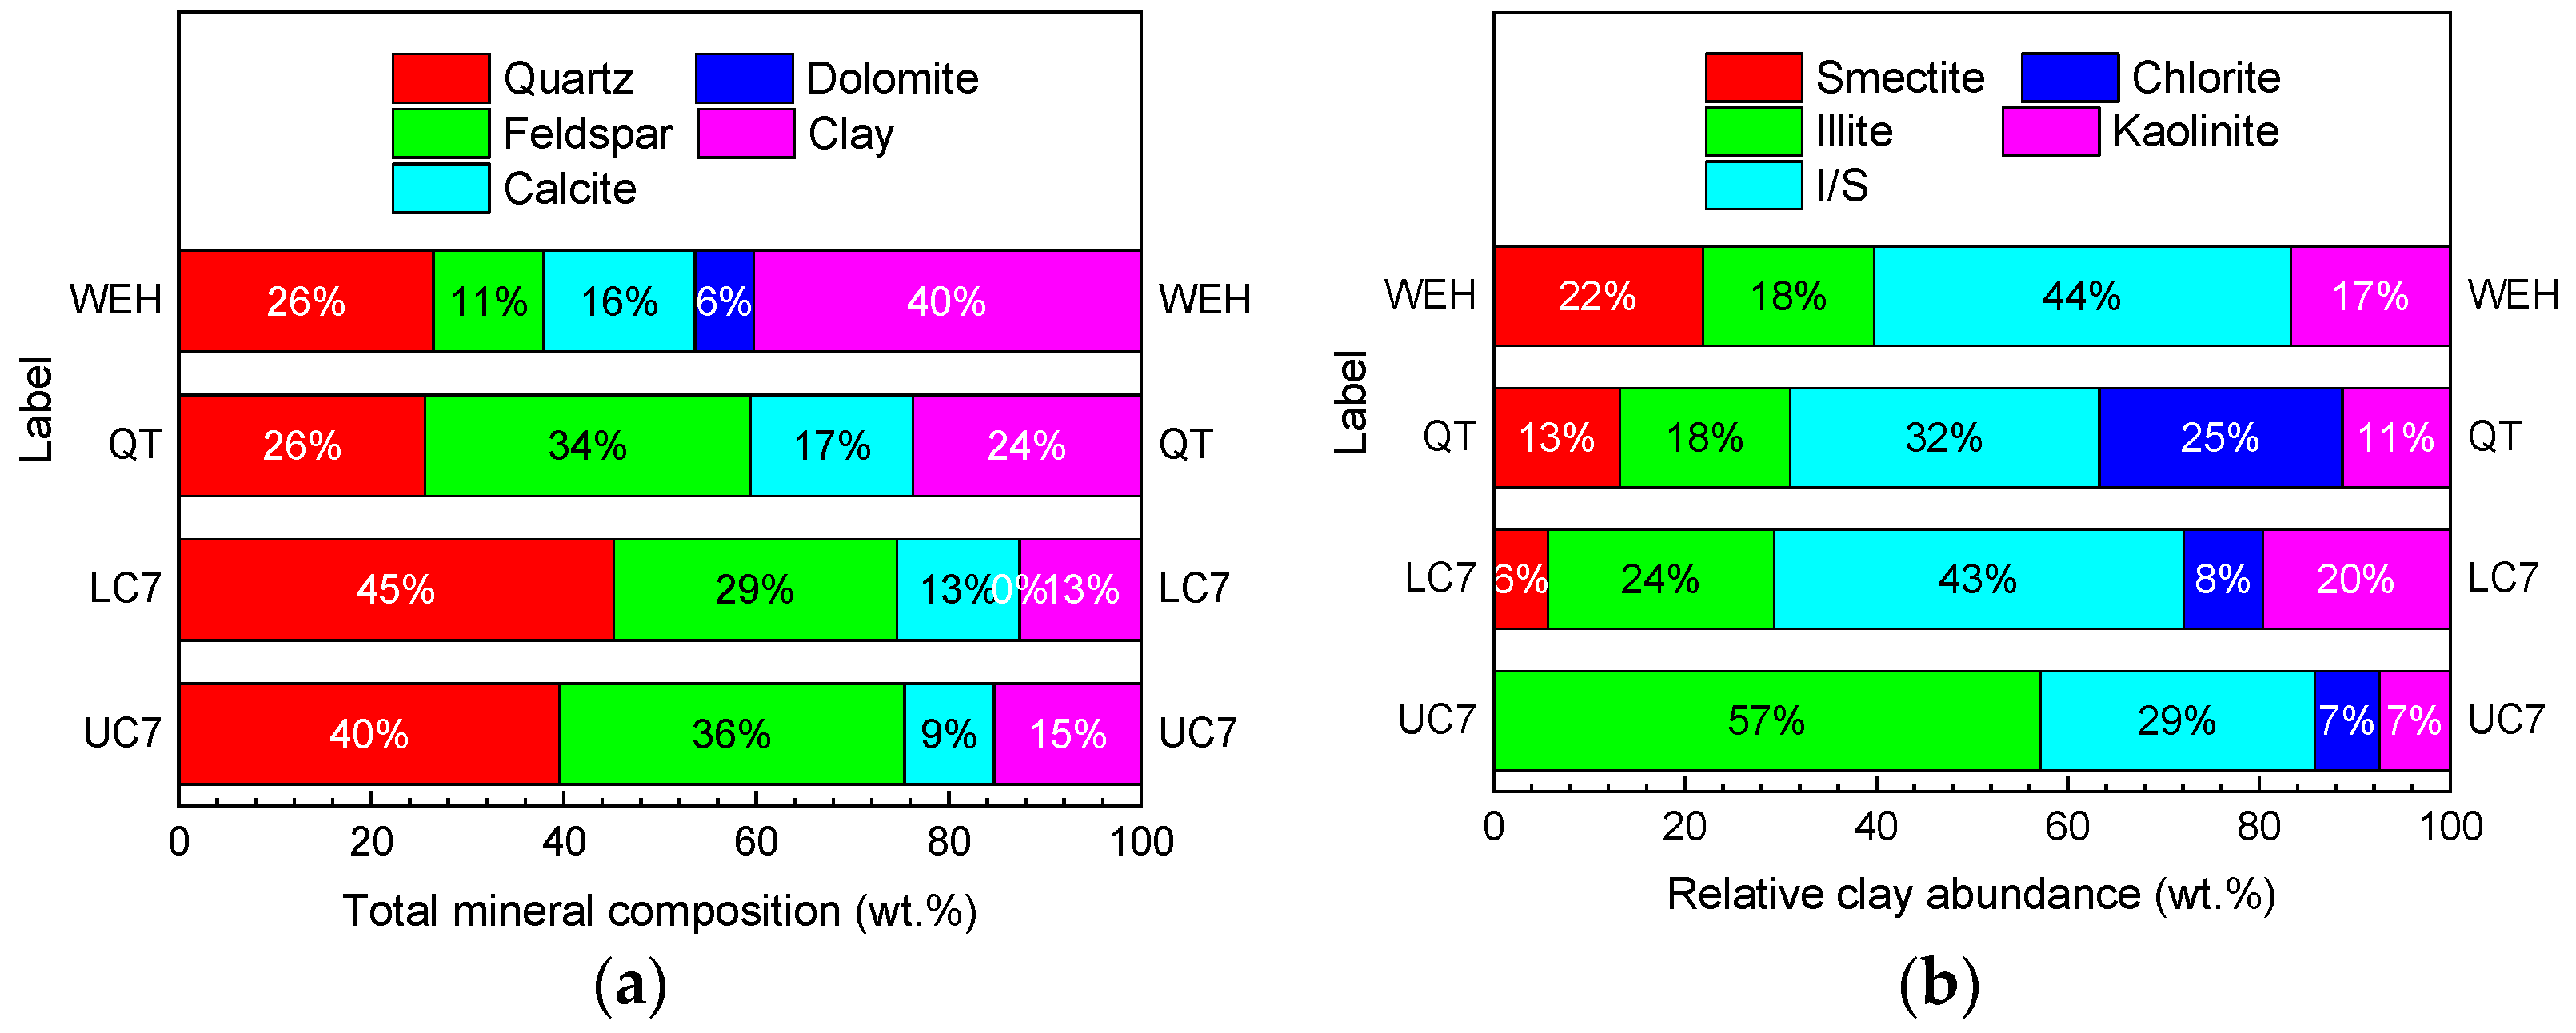
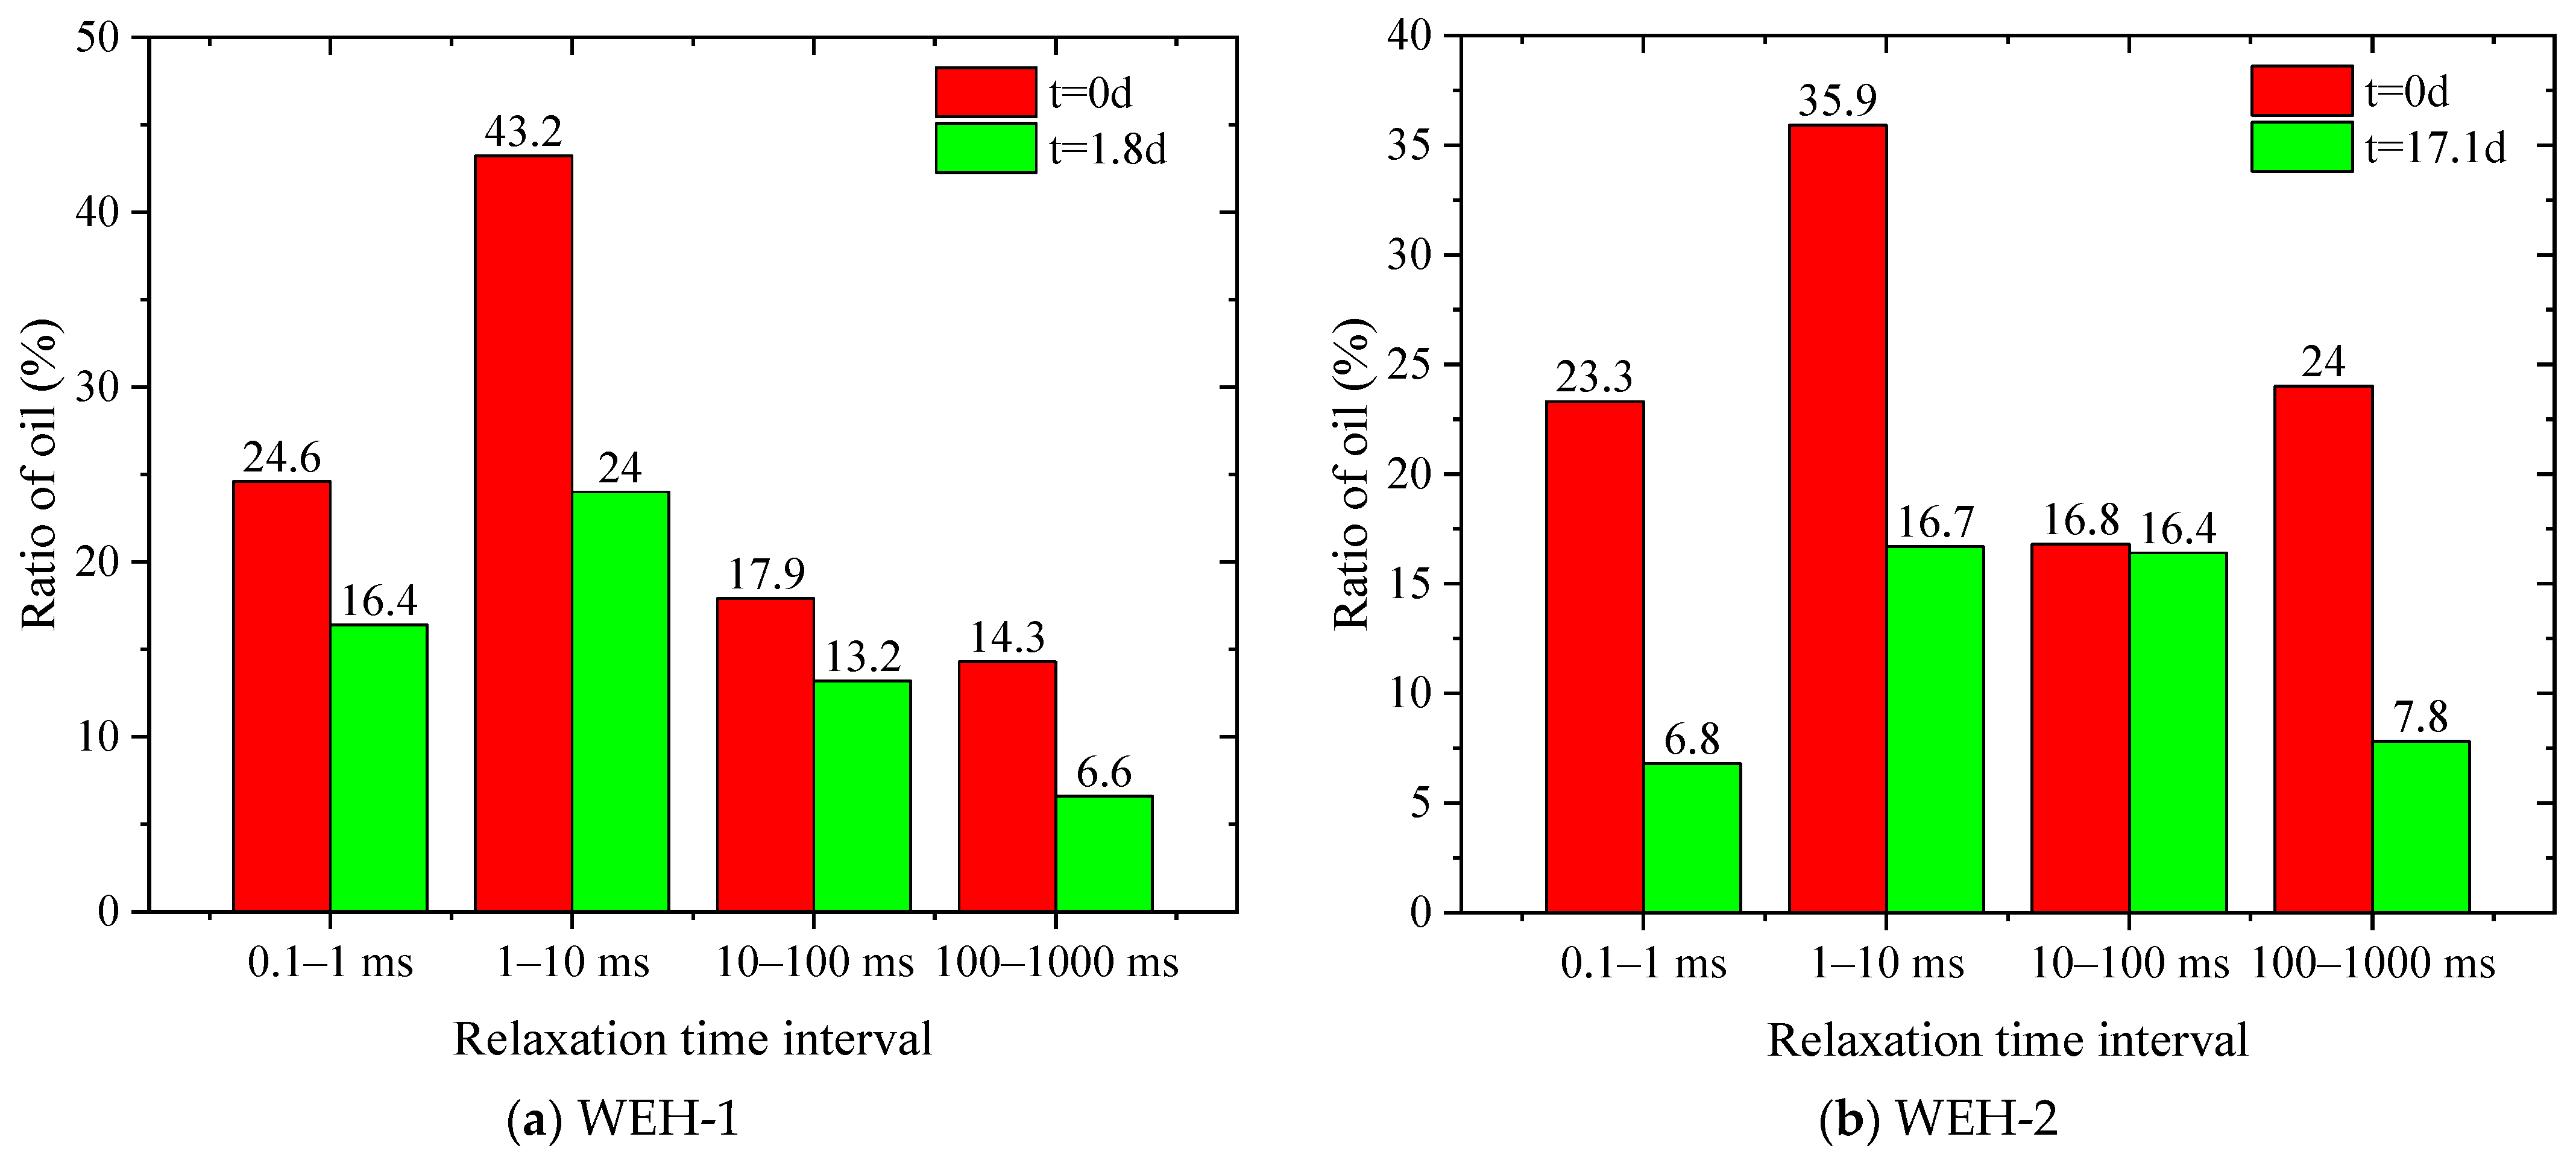
3.5. Effect of Clay Minerals on Imbibition

Figure 12 shows the T2 spectral curves of spontaneous imbibition of sample WEH-1 and forced imbibition of sample WEH-2. From the figure, it can be seen that the T2 spectra of WEH-1 and WEH-2 both exhibit bimodal characteristics. The left peak range of WEH-1 is 0.7~80 ms, the right peak range is 80~900 ms, the left peak range of WEH-2 is 0.7~80 ms, and the right peak range is 80~1000 ms. As the imbibition time increases, the amplitude curve shows a downward trend. The initial amplitude curve of sample WEH-1 is larger than that of sample WEH-2, and the oil content in micropores and small pores is higher.
Figure 13 shows the changes in oil content of WEH-1 and WEH-2 samples in different pore sizes. Before imbibition, the oil content in micropores, small pores, large pores, and larger pores of WEH-1 is 24.6%, 43.2%, 17.9%, and 14.3%, respectively. After 1.8 days of imbibition, its content is 16.4%, 24%, 13.2%, and 6.6%, respectively. In WEH-2, before imbibition, the oil content in micropores, small pores, large pores, and larger pores is 23.3%, 35.9%, 16.8%, and 24%, respectively. After 17.1 days of imbibition, its contents are 6.8%, 16.7%, 16.4%, and 7.8%, respectively. The oil content in micropores, small pores, and large pores decreased to varying degrees after seepage. However, compared to the QT, LC7, and UC7 samples, the reduction in saturated oil content was less pronounced, which can be attributed to the clay content in the core. Clay particles can migrate and block pore throats, thereby reducing the overall permeability of the rock. Additionally, clay minerals can alter the wettability of the rock surface. For instance, certain clays can render the rock surface more oleophilic, thereby diminishing the efficiency of water imbibition.

3.6. The Implications and Future Potential Studies

Studying the effects of pressure, pore size distribution, microfractures, fracture propagation, and clay minerals on fluid distribution and transport during imbibition is significant for enhanced oil recovery (EOR) for several reasons:
(1)
Improving oil recovery efficiency
A detailed understanding of pressure, pore size distribution, fracture expansion, and their effects on fluid transport can help optimize the design and operation of the EOR process. By combining the effects of these factors, EOR strategies can be tailored to specific reservoir conditions.
(2)
Reduced environmental impact
A better understanding of fluid distribution and transport can lead to more targeted EOR interventions, reducing the amount of water and chemicals required. This not only reduces operating costs, but also minimizes environmental impact.
(3)
Sustainability and economic efficiency
By optimizing the EOR process through a better understanding of these factors, more sustainable extraction methods can be found, extending the productive life of the field and improving its economic efficiency.
Future potential research may include the following:
(1)
Advanced Characterization Techniques:
Develop advanced imaging and characterization methods to better understand pore structures, microfractures, and mineral compositions at micro- and nanoscales.
(2)
Multiscale Modeling and Simulation:
Integrate data across different scales (micro, meso, macro) to create comprehensive models of fluid transport and distribution. Utilize machine learning and artificial intelligence to enhance predictive modeling capabilities.
(3)
Integration with Other Technologies:
Combine enhanced oil recovery (EOR) techniques with technologies such as carbon capture and storage (CCS) to improve overall efficiency and environmental outcomes. Explore the use of renewable energy sources to power EOR operations, thereby reducing the carbon footprint of oil recovery processes.
In summary, understanding the effects of pressure, pore size distribution, microfractures, fracture propagation, and clay minerals on fluid distribution and transport during imbibition is vital for optimizing oil recovery, improving reservoir management, minimizing environmental impact, and enhancing economic viability. Future studies aligned with this work will likely focus on advanced characterization, modeling, field trials, environmental sustainability, integration with other technologies, and economic assessments to further enhance the effectiveness and sustainability of EOR techniques.

4. Conclusions

In this study, we conducted forced imbibition experiments on tight reservoir samples. And by comparing the T2 spectrum curves of different samples and the changes in oil content in different pores, the distribution and migration patterns of fluids during the process of pressurized imbibition were studied. By studying the effects of external pressure, pore size distribution, microcracks, crack propagation, and clay minerals, the conclusions are as follows:
(1)
With the increase in external forces, the imbibition rate of micropores and small pores is positively correlated, accelerating the displacement rate of oil in them. The external pressure may increase the capillary pressure at the smaller pores, increasing the imbibition effect of the smaller pores, but the impact on the larger pores is not significant. Overall, with the increase in external pressure, the overall imbibition recovery rate will increase.
(2)
In tight reservoirs, without the influence of other factors, the smaller the pore size, the greater the capillary pressure, and the stronger the imbibition. Under capillary pressure, water will preferentially enter smaller pores to displace oil. The presence of residual oil in pores cannot be completely discharged by only applying external pressure and capillary force, which may be related to the trapping effect of the narrow pore throat channels inside.
(3)
Due to the presence of natural fractures, the residual oil saturation in the later stage of imbibition is relatively high. And it prioritizes the water entering the pores to replace the oil, reducing the oil recovery rate of the micropores.
(4)
During the imbibition process, the expansion of clay minerals in the sample causes cracks to expand, allowing the displaced oil to enter the newly generated cracks. And applying pressure causes the overall recovery rate of the pores to move towards the direction of the larger pores.
(5)
More clay minerals are more prone to induce fracture after imbibition and contact with water, causing damage to their microscopic pore structure. This in turn affects the subsequent imbibition results.

Author Contributions

Conceptualization, X.L.; Methodology, L.Y.; Software, D.S.; Investigation, B.L.; Resources, S.W. All authors have read and agreed to the published version of the manuscript.

Funding

This work is supported by the National Key Research and Development Program of China under grant (2022YFE0206700).

Data Availability Statement

The original contributions presented in the study are included in the article, further inquiries can be directed to the corresponding author.

Conflicts of Interest

Author Xiaoshan Li was employed by Xinjiang Oilfield Company. Authors Dezhi Sun and Bingjian Ling were employed by China Railway Tianjin Metro. The remaining authors declare that the research was conducted in the absence of any commercial or financial relationships that could be construed as a potential conflict of interest.

References

  1. Soeder, D.J. The successful development of gas and oil resources from shales in North America. J. Pet. Sci. Eng. 2018, 163, 399–420. [Google Scholar] [CrossRef]
  2. Guo, C.; Wei, M.; Liu, H. Study of gas production from shale reservoirs with multi-stage hydraulic fracturing horizontal well considering multiple transport mechanisms. PLoS ONE 2018, 13, e0188480. [Google Scholar] [CrossRef]
  3. Tian, W.; Wu, K.; Gao, Y.; Chen, Z.; Gao, Y.; Li, J. A Critical Review of Enhanced Oil Recovery by Imbibition: Theory and Practice. Energy Fuels 2021, 35, 5643–5670. [Google Scholar] [CrossRef]
  4. Andersen, P.Ø.; Evje, S.; Kleppe, H. A Model for Spontaneous Imbibition as a Mechanism for Oil Recovery in Fractured Reservoirs. Transp. Porous Media 2014, 101, 299–331. [Google Scholar] [CrossRef]
  5. Javaheri, A.; Habibi, A.; Dehghanpour, H.; Wood, J.M. Imbibition oil recovery from tight rocks with dual-wettability behavior. J. Pet. Sci. Eng. 2018, 167, 180–191. [Google Scholar] [CrossRef]
  6. Cheng, Z.; Ning, Z.; Yu, X.; Wang, Q.; Zhang, W. New insights into spontaneous imbibition in tight oil sandstones with NMR. J. Pet. Sci. Eng. 2019, 179, 455–464. [Google Scholar] [CrossRef]
  7. Wang, Y.; Liu, H.; Li, Y.; Wang, Q. Numerical Simulation of Spontaneous Imbibition Under Different Boundary Conditions in Tight Reservoirs. ACS Omega 2021, 6, 21294–21303. [Google Scholar] [CrossRef] [PubMed]
  8. Binazadeh, M.; Xu, M.; Zolfaghari, A.; Dehghanpour, H. Effect of Electrostatic Interactions on Water Uptake of Gas Shales: The Interplay of Solution Ionic Strength and Electrostatic Double Layer. Energy Fuels 2016, 30, 992–1001. [Google Scholar] [CrossRef]
  9. Yu, S. Post-frac evaluation of multi-stage fracturing on horizontal wells based on early flowback history. Pet. Drill. Tech. 2021, 49, 1–7. [Google Scholar]
  10. Chen, Z.; Liu, H.; Li, Y.; Shen, Z.; Xu, G. The current status and development suggestions for shale oil reservoir stimulation at home and abroad. Pet. Drill. Tech. 2021, 49, 1–7. [Google Scholar]
  11. Cai, J.; Li, C.; Song, K.; Zou, S.; Yang, Z.; Shen, Y.; Meng, Q.; Liu, Y. The influence of salinity and mineral components on spontaneous imbibition in tight sandstone. Fuel 2020, 269, 117087. [Google Scholar] [CrossRef]
  12. Zhou, H.; Zhang, Q.; Dai, C.; Li, Y.; Lv, W.; Wu, Y.; Cheng, R.; Zhao, M. Experimental investigation of spontaneous imbibition process of nanofluid in the ultralow permeable reservoir with nuclear magnetic resonance. Chem. Eng. Sci. 2019, 201, 212–221. [Google Scholar] [CrossRef]
  13. Wei, B.; Liu, J.; Zhang, X.; Xiang, H.; Zou, P.; Cao, J.; Bai, M. Nuclear Magnetic Resonance (NMR) mapping of remaining oil distribution during sequential rate waterflooding processes for improving oil recovery. J. Pet. Sci. Eng. 2020, 190, 107102. [Google Scholar] [CrossRef]
  14. Chen, T.; Yang, Z.; Ding, Y.; Luo, Y.; Qi, D.; Lin, W.; Zhao, X. Waterflooding Huff-n-puff in Tight Oil Cores Using Online Nuclear Magnetic Resonance. Energies 2018, 11, 1524. [Google Scholar] [CrossRef]
  15. Li, T.; Wang, Y.; Li, M.; Ji, J.; Chang, L.; Wang, Z. Study on the IMPacts of Capillary Number and Initial Water Saturation on the Residual Gas Distribution by NMR. Energies 2019, 12, 2714. [Google Scholar] [CrossRef]
  16. Yang, Z.; Liu, X.; Li, H.; Lei, Q.; Luo, Y.; Wang, X. Analysis on the influencing factors of imbibition and the effect evaluation of imbibition in tight reservoirs. Pet. Explor. Dev. Online 2019, 46, 779–785. [Google Scholar] [CrossRef]
  17. Yang, L.; Wang, S.; Tao, Z.; Leng, R.; Yang, J. The Characteristics of Oil Migration due to Water Imbibition in Tight Oil Reservoirs. Energies 2019, 12, 4199. [Google Scholar] [CrossRef]
  18. Farahani, M.V.; Guo, X.W.; Zhang, L.X.; Yang, M.Z. Effect of thermal formation/dissociation cycles on the kinetics of formation and pore-scale distribution of methane hydrates in porous media: A magnetic resonance imaging study. Sustain. Energy Fuels 2021, 5, 1567–1583. [Google Scholar] [CrossRef]
  19. Zhu, X.; Pan, R.; Zhu, S.; Wei, W. Research progress and core issues in tight reservoir exploration. Earth Sci. Front. 2018, 25, 141. [Google Scholar]
  20. Hassanpouryouzband, A.; Joonaki, E.; Farahani, M.V.; Takeya, S.; Ruppel, C.; Yang, J.H. Gas hydrates in sustainable chemistry. Chem. Soc. Rev. 2020, 49, 5225–5309. [Google Scholar]
  21. Cui, X.; Bustin, A.M.M.; Bustin, R.M. Measurements of gas permeability and diffusivity of tight reservoir rocks: Different approaches and their applications. Geofluids 2009, 9, 208–223. [Google Scholar] [CrossRef]
  22. Xu, G.; Jiang, Y.; Shi, Y.; Han, Y.; Wang, M.; Zeng, X. Experimental investigations of fracturing fluid flow back and retention under forced imbibition in fossil hydrogen energy development of tight oil based on nuclear magnetic resonance. Int. J. Hydrogen Energy 2020, 45, 13256–13271. [Google Scholar] [CrossRef]
  23. Wang, C.; Gao, H.; Gao, Y.; Fan, H. Influence of Pressure on Spontaneous Imbibition in Tight Sandstone Reservoirs. Energy Fuels 2020, 34, 9275–9282. [Google Scholar] [CrossRef]
  24. Jiang, Y.; Shi, Y.; Xu, G.; Jia, C.; Meng, Z.; Yang, X.; Zhu, H.; Ding, B. Experimental Study on Spontaneous Imbibition under Confining Pressure in Tight Sandstone Cores Based on Low-Field Nuclear Magnetic Resonance Measurements. Energy Fuels 2018, 32, 3152–3162. [Google Scholar] [CrossRef]
  25. SY/T 5370-1999; The Method for Measurement of Surface Tension & Interfacial Tension. State Bureau of Petroleum and Chemical Industry: Beijing, China, 1999.
  26. Li, C.; Li, C.; Hou, Y.; Shi, Y.; Wang, C.; Hu, F.; Liu, M. Well logging evaluation of Triassic Chang 7 Member tight reservoirs, Yanchang Formation, Ordos Basin, NW China. Pet. Explor. Dev. 2015, 42, 667–673. [Google Scholar] [CrossRef]
  27. Meng, M.; Ge, H.; Ji, W.; Wang, X. Research on the auto-removal mechanism of shale aqueous phase trapping using low field nuclear magnetic resonance technique. J. Pet. Sci. Eng. 2016, 137, 63–73. [Google Scholar] [CrossRef]
  28. Yang, L.; Wang, H.; Xu, H.; Guo, D.; Li, M. Experimental study on characteristics of water imbibition and ion diffusion in shale reservoirs. Geoenergy Sci. Eng. 2023, 229, 212167. [Google Scholar] [CrossRef]
  29. Yang, L.; Yang, D.; Zhang, M.-y.; Wang, S.; Su, Y.; Long, X. Application of nano-scratch technology to identify continental shale mineral composition and distribution length of bedding interfacial transition zone—A case study of Cretaceous Qingshankou formation in Gulong Depression, Songliao Basin, NE China. Geoenergy Sci. Eng. 2024, 234, 212674. [Google Scholar] [CrossRef]
Figure 1. The results of mineral composition analysis: (a) percentage of whole-rock mineral composition; (b) percentage of clay mineral composition; I/S represents the illite/smectite mixed layer.
Energies 17 02993 g001
Figure 2. The apparatus for the experiment: (a) analytical balance, (b) nuclear magnetic resonance analyzer.
Energies 17 02993 g002
Figure 3. The schematic diagram of the experimental process. (a) Pressure loading system. (b) Imbibition generation system. (c) Qua-monitoring. (d) NMR measurement system.
Energies 17 02993 g003
Figure 4. The T2 spectrum and recovery rates of imbibition of sample LC7-1, LC7-2, LC7-3, and LC7-4 at different applied pressures: (a) 0 MPa, (b) 4 MPa, (c) 8 MPa, (d) 12 MPa.
Energies 17 02993 g004aEnergies 17 02993 g004b
Figure 5. The imbibition recovery of different samples at different pressures on the first day and onwards.
Energies 17 02993 g005aEnergies 17 02993 g005b
Figure 6. The T2 spectra of different samples under 10 MPa forced imbibition: (a) UC7-1, (b) UC7-2, (c) UC7-3.
Energies 17 02993 g006
Figure 7. The changes in oil content in different pores of the sample: (a) UC7-1, (b) UC7-2, (c) UC7-3.
Energies 17 02993 g007
Figure 8. The T2 spectra of different samples under forced and spontaneous imbibition at 10 MPa: (a) UC7-4, (b) UC7-5.
Energies 17 02993 g008
Figure 9. The changes in oil content in different pores of the sample: (a) UC7-4, (b) UC7-5.
Energies 17 02993 g009
Figure 10. The T2 spectra of different samples under 10 MPa forced imbibition: (a) QT-1, (b) QT-2.
Energies 17 02993 g010
Figure 11. The changes in oil content in different pores of the sample: (a) QT-1, (b) QT-2.
Energies 17 02993 g011
Figure 12. The T2 spectra of different samples under 10 MPa forced imbibition: (a) QWEH-1, (b) WEH-2.
Energies 17 02993 g012
Figure 13. The changes in oil content in different pores of the sample: (a) WEH-1, (b) WEH-2.
Energies 17 02993 g013
Table 1. The physical properties of core samples.
LabelFormationPressure, MPaDiameter, cmLength, cmMass of Oil-Saturated Sample, g
LC7-1Lower Chang-702.504.1147.3395
LC7-242.504.1947.7744
LC7-382.515.4065.7224
LC7-4122.505.5465.4972
UC7-1Upper Chang-7102.494.0848.4081
UC7-2102.501.9523.3551
UC7-3102.506.4481.14
UC7-4102.493.1036.2698
UC7-5102.503.0235.1438
QT-1Quantou formation102.503.544.9562
QT-2102.523.6045.3792
WEH-1Wuerhe formation102.515.0257.4809
WEH-2102.504.31351.1658
Table 2. The basic properties of the experimental fluid (25 °C).
FluidDensity, g/cm3Viscosity, cpSurface Tension, mN/m
Deuterium water1.1070.9172.2
Kerosene0.811.3229
Disclaimer/Publisher’s Note: The statements, opinions and data contained in all publications are solely those of the individual author(s) and contributor(s) and not of MDPI and/or the editor(s). MDPI and/or the editor(s) disclaim responsibility for any injury to people or property resulting from any ideas, methods, instructions or products referred to in the content.

