Article

Techno-Economic Analysis of Hydrogen as a Storage Solution in an Integrated Energy System for an Industrial Area in China

1
Energy Development Research Institute, China Southern Power Grid, Guangzhou 510663, China
2
Guangzhou Institute of Energy Conversion, Chinese Academy of Sciences, Guangzhou 510640, China
3
Planning & Research Center for Power Grid, Yunnan Power Grid Corp., Kunming 650011, China
4
School of Energy Science and Engineering, University of Science and Technology of China, Hefei 230026, China
*
Authors to whom correspondence should be addressed.
Energies 2024, 17(13), 3074; https://doi.org/10.3390/en17133074
Submission received: 4 June 2024 / Revised: 13 June 2024 / Accepted: 17 June 2024 / Published: 21 June 2024
(This article belongs to the Special Issue Modeling Analysis and Optimization of Energy System)

Abstract

:
This study proposes four kinds of hybrid source–grid–storage systems consisting of photovoltaic and wind energy, and a power grid including different batteries and hydrogen storage systems for Sanjiao town. HOMER-PRO was applied for the optimal design and techno-economic analysis of each case, aiming to explore reproducible energy supply solutions for China’s industrial clusters. The results show that the proposed system is a fully feasible and reliable solution for industry-based towns, like Sanjiao, in their pursuit of carbon neutrality. In addition, the source-side price sensitivity analysis found that the hydrogen storage solution was cost-competitive only when the capital costs on the storage and source sides were reduced by about 70%. However, the hydrogen storage system had the lowest carbon emissions, about 14% lower than the battery ones. It was also found that power generation cost reduction had a more prominent effect on the whole system’s NPC and LCOE reduction. This suggests that policy support needs to continue to push for generation-side innovation and scaling up, while research on different energy storage types should be encouraged to serve the needs of different source–grid–load–storage systems.

1. Introduction

1.1. Research Background

With the rapid development of the global economy, energy shortages, global warming, and environmental impacts are becoming increasingly severe. In order to achieve carbon neutrality, many countries and regions are trying to promote greenhouse gas emission reduction in different aspects (such as in the agricultural sector, the power sector, the steel industry, the road transport sector, carbon tariff, etc.) [1,2,3,4,5]. These targets should be achieved in all economic sectors, but the power sector has long been expected to play a main role in the achievement of carbon emission reduction. In recent years, the EU adopted the 2030 Framework for Climate and Energy, aiming to meet a more secure, sustainable, and competitive energy system [6].
In response to climate change, China has set the ambitious goal of reaching a carbon dioxide emission peak by 2030 and carbon neutrality by 2060, committed to building a new low-carbon energy system for improving the utilization rate of clean energy and electric energy system efficiency [7]. As one of China’s most economically dynamic regions, the Guangdong–Hong Kong–Macao Greater Bay Area (GBA) carries a core responsibility for promoting national energy revolution under the context of global energy transition. In accelerating the transformation of energy production and consumption, establishing a clean, low-carbon, safe, and efficient modern energy system is an essential prerequisite for the construction of the GBA as a world-class urban cluster-based international first-class bay area. However, due to the geographical constraints shown in Figure 1, the GBA faces serious challenges in terms of energy reserve shortage, domestic energy transportation capabilities, supply chain channels, market risks, price fluctuations, and extreme weather conditions, which further weaken energy supply security and emergency reserve capabilities. The Guangdong province, with an average annual peak load growth rate of 11%, suffered its worst power shortage on record in 2021 and had to implement a 66-day orderly power rationing. On the other hand, the large expansion of renewable energy installations poses serious challenges to local thermal power grid operations and dispatching capacities due to their higher dependency on climate conditions. How to ensure a sustainable and stable energy supply in the context of large-scale clean energy installations is key to developing the GBA into a modern service industry with a high level of industrialization and internationalization.
A potential development trend in the future of power grids is a multi-level source–grid–load–storage system formed over various regions of different sizes, ranging from homes to communities, parks, and cities, aiming to integrate more sources generating renewable energy in various forms of small grids, which would, in turn, constitute a dominating large-scale grid, different from the conventional power grid. As key links in this source–grid–load–storage system, energy storage devices are still in diverse stages of development and utilization, with significant differences in their techno-economic levels and limitations. In accordance with the renewable energy and global carbon neutrality goal, hydrogen is considered to be a good energy storage option under long-term scenarios and a potential energy alternative for industries that are hard to electrify, due to its large reserves and long storage times. On the other hand, production challenges and cost effectiveness may make hydrogen not suitable for every case. Therefore, it is necessary to comprehensively evaluate the specific techno-economic characteristics of these solutions and provide a diversified reference basis for the selection of energy storage in source–grid–load–storage systems.

1.2. Literature Review

Different studies exist in the literature that investigate the feasibility of microgrids and/or grid-tied hybrid system for generating energy for various loads. On the power supply side, Koko investigated the optimal battery size for maximizing the return on investment of grid-connected solar energy system under local South African solar resource conditions [8]. In [9], the authors proposed a more economical and stable scheduling strategy by optimizing the generator output of a load storage system in rural Spanish power networks. Alsabry presented energy, economic, and environmental analyses of the possibilities of using alternative high-efficiency sources of heat and energy for a multi-family residential building located in Wroclaw, Poland, in the temperate climate characteristic of Central Europe [10]. In a research by the Islamic Azad University [11], a technical–environmental–economic study was conducted on the power and hydrogen supply of a hybrid system consisting of vertical-axis wind turbines, a power grid, and solar cells in the port of Abbas in southern Iran. The results show that the minimum price for providing the required hydrogen using the main grid was USD 0.496. According to [12], the researchers conducted a study on different renewable energy ratios of hybrid systems using solar, wind, and hydrogen power in two areas of the Karabuk province, Turkey. The study considered cost, environmental damage, and system structure, and the most suitable system was determined to be Eskipazar, with the levelized energy cost (LCOE) being USD 0.367. Zou employed a technique of economic evaluation for the calculation of normalized energy costs to analyze regional differences in the application of residential photovoltaic markets in five cities across different regions in China [13]. Kim analyzed the impacts of cold, heat, and electricity co-production on energy efficiency, economy, and the environment by building customers with or without photovoltaic systems [14]. According to [15,16], the researchers considered the technical and economic feasibility of biomass-containing photovoltaic systems in remote rural areas of Honduras and India. In a study conducted by [17], the impact of extensive renewable energy generation on power system dynamics was investigated from the perspective of a power system operator. The study extensively analyzed and deliberated upon the comprehensive inertial responses of smart loads, electric vehicles, energy storage technologies, and the management of wind farms during frequency deviation. Demirci examined the impact of urban expansion and relocation on 12 industrial cities in Turkey under different climate conditions and investigated the demand for supplying urban industrial facilities with either a pure grid or grid-connected/off-grid energy solutions, demonstrating that changes in the discount rates and grid expansion costs were determined by regional geography [18]. Deshmukh investigated the impact of grid-connected photovoltaic systems on energy loss reduction [19]. Amutha provided the optimal solution for the renewable-based electrification of a remote household in Tamil Nadu, Southern India, and compared it with a traditional grid extension using the HOMER software (HOMER Pro 3.16.2(3.16.8587.1355)) [20]. Based on the utilization of renewable energy resources and load data, previous studies proposed the development of source–grid–load–storage systems that rely on renewable energy for households in Kayseri, in Turkey, residential neighborhoods in Beijing, small villages in Nanyang, Henan, Urumqi, Tehran, and the Jammu-and-Kashmir province in Pakistan. These studies examined techno-economic feasibility, having optimal configurations to develop local optimal systems [21,22,23,24,25,26]. Kalamaras designed a renewable energy-based system to meet the electricity and heat demands of remote households on a Greek island away from the grid [27]. On the energy storage side, Bhimaraju investigated the optimal sizing of an integrated source–grid–load–storage system incorporating a pumped storage plant to determine the optimal combination with the objective of minimizing the levelized cost of energy [28]. Researchers from King Abdulaziz University investigated the performance of a hybrid energy storage system consisting of batteries and supercapacitors in a grid-connected mode [29]. Maatallah investigated the techno-economic feasibility of systems with and without battery energy storage elements [30]. Bhatt conducted a comparative study of a microgrid consisting of PV/wind/biogas with new Li-ion and secondary batteries, and the results obtained through HOMER-PRO showed that the grid optimization model with secondary batteries had a reduction in the NPC and COE of 36% and 35%, respectively, compared to new Li-ion batteries [31]. Khan investigated optimal energy storage technologies with a mix of lithium, lead acid, and vanadium batteries for residential and community source–grid energy storage system loads in less developed areas of India. Among the energy storage technologies considered, the one based on lead acid flow is suitable, whereas the optimal hybrid arrangement shows the lowest COE and NPC and the higher share of renewable energy [32]. Ekren designed and optimized a wind–solar hybrid energy charging station through the HOMER software. The optimal solution of this hybrid system included 44.4% wind and 55.6% solar energy and generated 843,150 kWh per year with a production cost of USD 0.064/kWh [33]. Nesamalar conducted an investigation to assess the sustainability of both the grid-connected and off-grid operation of a hybrid energy system [34] by analyzing various scheduling strategies, including cyclic charging and load following. Additionally, a sensitivity analysis was performed on the proposed hybrid energy system, considering fuel prices and proportional annual solar radiation as variables of interest. The findings of this study indicated that the optimal system design involved source–grid–load–storage with load-following scheduling. Ampah investigated the feasibility of using renewable energy in a coal mine in northern China by examining the excess electricity earmarked for the on-site production of hydrogen as a fuel source for hydrogen trucks [35]. Coal mining provided 215 MWh and 2.4 tons of electricity, and hydrogen-fuel-cell trucks were used to supply hydrogen to 100% of the mined coal for road transport. Agyekum compared the advantages and disadvantages of pumped storage and battery systems in the Ghanaian region using Shannon’s entropy-weighted and TOPSIS multi-criteria decision making methods [36]. To overcome harmful carbon emissions and form a low-carbon pathway, several novel energy systems have been investigated in the literature, with solar and wind energy as the main renewable sources and lithium-ion batteries, lead acid batteries, and hydrogen fuel cells explored for storage. Several tools and techniques have been proposed for their economic analysis and sizing, but HOMER has been selected by several researchers to size integrated energy systems due to its ability to simulate a large number of energy sources and predefined energy-scheduling strategies. Oltarzewska presented the results of energy simulations for single-family buildings located in selected cities—Warsaw (Poland), Madrid (Spain), Riga (Latvia), and Rome (Italy)—as a case study for different climate conditions and energy policies [37].
The aforementioned literature includes systematic research and analyses on source–grid–load–storage systems at the microgrid level. Promoting the integration of power sources, grids, loads, and storage systems at the township level according to local conditions is one of China’s important measures to achieve its carbon neutrality goals. Compared to regions such as the Inner Mongolia Autonomous Region and the Gansu province, which are endowed with renewable energy resources and far from load centers, the GBA faces more severe supply–demand imbalance issues in constructing source–grid–load–storage systems due to the scarcity of renewable energy resources. This paper takes Sanjiao Town, located in the GBA, as a case study, designing and analyzing the feasibility of constructing a source–grid–load–storage system, aiming to provide a reference and technical support for building a new type of electric power system in the GBA.
Previous studies focused on the feasibility of source–grid–load–storage systems to provide power security for remote, rural areas, islands, and other places far from large grids. Developed industrial areas with a double-development trend of continuous increase in their load level and renewable energy penetration rate will also face great challenges in the reliability and stability of their energy supply. Therefore, this study establishes an efficient, secure, and low-carbon energy system optimization model considering developed industrial clusters in city areas to provide a solution to the future energy supply problem in the GBA. Taking Sanjiao town as the research object, located in the central GBA region, with 179.816 billion kWh of electricity consumption, 90% of which is industrial usage, we attempted to explore the feasibility of adopting a source–grid–load–storage energy system in industrially developed cities with a high energy consumption demand.
The contributions of the current work to addressing this issue are as follows: A variety of town-level integrated systems of source–grid–load–storage including lithium batteries, sodium batteries, flow batteries, and hydrogen energy storage were constructed, and the HOMER-Pro software (HOMER Pro 3.16.2(3.16.8587.1355)) was applied to optimize the design of each system based on the balance principle of power supply and demand. Then, economic parameters such as the net present cost (NPC), the capital cost, operation and maintenance, and the levelized cost of energy (LCOE) were considered, aiming to explore the optimal energy storage technology for cities in developed regions, allowing them to meet their high energy consumption demand. Since the price and capacity of hydrogen production equipment are different from those of a typical battery, which may affect the overall performance of the source–grid–load–storage system, a sensitivity analysis of an integrated system with hydrogen energy storage was carried out, with the capital cost as a sensitive variable, to explore the future development direction of hydrogen energy storage systems.
The rest of this paper is organized as follows: the Section 2 narrates the building of the energy models and comprehensive evaluation models for this study; then, the Section 3 introduces the load demand and renewable resources of the case study case of Sanjiao town; comparative and sensitivity analyses of the optimization results and costs, respectively, are discussed in the Section 4; finally, the Section 5 summarizes the research results.

2. Methods

This study proposes a comprehensive system that can meet developed, industrial cities’ high demand for renewable energy sources with a high load capacity. Hydrogen production through water electrolysis is more capable of meeting the demand for long-term, large-scale, high-energy storage than conventional battery energy storage methods, which makes it an important strategy for future energy storage. In order to investigate the decisive role of hydrogen energy in the construction of new power systems, this study focuses on the technical and economic evaluation of a new power system incorporating different types of energy storage and a comparison among these storage solutions using various economic indicators, such as the LCOE.
In this paper, the HOMER-PRO software is used not only to obtain the optimal sizing of the new power system’s components but also for the economic and environmental evaluation of the hybrid system. The architectural framework of HOMER-PRO is shown in Figure 2. The optimization model’s input data include residential and industrial electricity loads, solar radiation, wind speed, installment costs, and maintenance costs. The design variables include the capacity of photovoltaic power generation, wind turbines, and fuel cells on the power generation side, the electricity price of the grid and the capacity of batteries and hydrogen storage tanks on the energy storage side, and the capacity of other pieces of equipment, such as converters and electrolyzers. Considering the technical constraints, the optimization design of the source–grid–load–storage integrated system for Sanjiao town was carried out with the optimal objective of minimizing the NPC.

2.1. Mathematical Model of the Energy System

2.1.1. Solar PV Power Output

Polycrystalline solar energy photovoltaics (PVs) were used as the power supply of the source–grid–load–storage system. The formula for the power output of the solar photovoltaic panel model is as follows:
P p v = Y p v × f p v × I t I 0 ,
where Ppv is the output power (kW); Ypv represents the output power under standard test conditions (kW); fpv is the derating factor; It signifies the magnitude of the solar shortwave radiation absorbed (kW·m−2); and I0 is the light intensity (kW·m−2).

2.1.2. Wind Power Output

The wind turbines are another significant form of power generation in a hybrid renewable energy system. The calculation process is carried out using the following equation:
U h u b = U a n e m × l n z h u b z 0 l n z a n e m z 0 ,
P W T G = 0   ,   U h u b < U S   o r   U h u b > U F P W T G , N × U h u b U S U N U S   , U S U h u b U F P W T G , S T P   , U S   < U h u b U F
where Uhub is the wind speed at the hub height (m·s−1); Uanem is the wind speed at the anemometer (m·s−1); zhub is the height of the hub; zanem is the height of the anemometer; z0 is the length of the Earth’s surface roughness; PWTG is the output power; PWTG,N is the rated power of the wind turbine; US is the cut-in wind speed; UN is the rated wind speed; and UF is the cut-out wind speed.

2.1.3. Hydrogen and Battery Storage

The stochasticity of renewable energy output indicates the undeniable need for energy storage components in new power systems. The energy storage group designed in the source–grid–load–storage system could help offer long-term energy management and short-term power balance. This study analyzed multiple configurations of different storage techniques, including batteries for hydrogen storage from electrolyzed water, vanadium flow batteries (VNM), lithium-ion batteries (Li), and sodium–sulfur batteries (NAS), to obtain the most suitable storage technology for city areas. The proposed systems also include a battery storage element to preserve the excess energy generated and discharge it when there is insufficient energy generation.
The charging and discharging states of the battery are shown in Equations (4) and (5):
P k b m = k Q 1 e k t + Q k c 1 e k t 1 e k t + c k t 1 + e k t ,
P k b m = k c Q m a x + k Q 1 e k t + Q k c 1 e k t 1 e k t + c k t 1 + e k t
where Q1 is the existing energy (kWh); Q is the total energy (kWh); Qmax is the overall capacity (kWh); c is the capacity ratio; k is the constant of energy storage rate (hours−1); and Δt is the length of a time step (hour).
Table 1 presents a comprehensive comparison of the financial metrics for various energy storage systems and their associated devices, including the prices—capital, replacement, and operational and maintenance (O&M) costs—and lifespans for components such as PV and wind systems, converters, and fuel cells [38,39]. The storage technologies included encompass hydrogen storage tanks and lithium-ion, vanadium redox, and sodium–sulfur batteries. Notably, the PV system has a capital, replacement, and O&M cost of 4200 CNY/kW, 3000 CNY/kW, and 100 CNY/kW-year, respectively, and a lifespan of 25 years. These data provide a quantitative basis for assessing the economic aspects of integrating different energy storage solutions.

2.2. Source–Grid–Load–Storage System Designs

In this paper, various models based on different system components are proposed and compared with the base model. The configuration with the lowest LCOE is considered the optimal configuration. Following Formulas (1)–(5), the schematic arrangement of the different source network load storage systems used for the HOMER simulation and the techno-economic analysis is shown in Figure 3.
The base scenario is the current stage of energy use, in which the load demand is met strictly by power purchase from the grid. Then, based on various forms of energy storage, different source–grid–load–storage models are proposed, including Case 1 (PV/WT/grid/VAM flow), Case 2 (PV/WT/grid/Li), Case 3 (PV/WT/grid/NAS), and Case 4 (PV/WT/grid/hydrogen and fuel cell). Additionally, Case 5 (PV/WT/Grid/Hydrogen) is introduced as a business case for Case 4 to compare the economic performance of different ways to utilize the hydrogen produced from renewable power. In this last case, the hydrogen produced is not used as storage but sold directly to nearby factories at the commercial hydrogen price. This solution would add additional revenue to Case 4 while avoiding the cost of fuel cells and the energy loss in hydrogen conversion, making it the economic case most attractive to investors.
The collaboration between photovoltaic arrays and wind turbines can enhance the renewable energy utilization rate of the town’s integrated source–grid–load–storage system. The external power grid provides a stable power supply to this system, equipped with batteries or hydrogen storage devices with appropriate capacities. The charging and discharging schedule can be adjusted according to the load and the output of wind and solar power, adjusting the power exchange between the power grid and the system, thus improving its flexibility and economic benefits.

2.3. Evaluation Indicators of the Source–Grid–Load–Storage System

2.3.1. Economic Evaluation Indicators

This study selects the LCOE as the economic evaluation indicator to more clearly demonstrate the correlation between the lifecycle cost and the power generation of the system, specifically the net present value of the lifetime cost divided by the present value of power generation over the lifetime of the system. In the optimization process, the LCOE is used to sort all the scenarios with different configurations and find the most economical one.
C L C O E = C A N N , T O T T E D × R D I S V × R D I S + C O M × R D I S E A N N , T O T ,
where CLCOE, CANN,TOT, and COM are the levelized cost of electricity, the total annual cost, and the operating cost of the system, respectively; EANN,TOT is the annual electricity consumption; RDIS is the discount rate; V is the salvage value; and TED is the depreciation.
The net present cost (NPC) is a core indicator for assessing the economic benefits of renewable energy systems throughout their lifecycle, reflecting the net difference between the costs and the revenues within the system’s lifespan, that is, the net cost value over the system’s entire lifecycle.
N P C = C × [ ( 1 + i ) n + 1 ] i ( 1 + i ) n
where n represents the lifespan of the energy system, with a value of 25 years, and i is the annual real interest rate, set at 8%.
In addition, the internal rate of return (IRR) and the return on investment (ROI) are also considered to evaluate each optimal configuration:
I R R = α + N P V α N P V α N P V β × α β ,
The NPV is the net present value, while α and β are the discount rate (α > β).
R O I = i = 0 p r o j C i , r e f C i R p r o j C c a p C c a p , r e f ,
Ci,ref and Ci are the nominal annual cash flow of the baseline system and the current system, respectively; Rproj is the age of the project; and Ccap and Ccap,ref are the construction costs of the current and baseline systems, respectively.
The initial capital cost of a component is the total installed cost of that component at the beginning of the project. The operation and maintenance (O&M) cost of a component is the cost associated with operating and maintaining that component. Payback is the number of years after which the cumulative cash flow of the difference between the current system and the base case system switches from negative to positive.

2.3.2. Energy Storage Performance Indicators

Energy storage performance is indeed a key factor, especially with the widespread adoption of renewable energy sources such as wind and solar. It not only provides real-time support to the grid and mitigates fluctuations in the energy supply due to uncertainties such as the weather, but also ensures the stable operation of the grid by storing excess power during valley hours and releasing it when demand increases. The energy in, the energy out, the storage losses, and the throughput of the energy storage system are evaluated and analyzed in order to measure the effect of the energy storage system in each optimal configuration.
Energy in is the total amount of energy charged to the storage (kWh), while energy out is the total amount discharged (kWh). Storage depletion is the difference in the storage state of charge (kWh/yr). The losses are the annual energy losses (in kWh/yr). The throughput is defined as the change in energy level, measured after the charging losses and before the discharging losses. The annual throughput is the amount of energy that cycles through the storage bank in one year.
At the same time, the economic cost of the energy storage system—the storage wear cost—is also used as one of the evaluation indicators, as the cost of cycling energy through the storage bank. HOMER calculates the storage wear cost using the following equation:
C b w = C r e p , b a t t N b a t t × Q l i f e t i m e × η r t
where Cbw is the replacement cost (CNY); Nbatt is the number of batteries; Qlifetime is the lifetime throughput (kWh); and ηrt is the storage roundtrip efficiency.

2.3.3. Environmental Assessment Indicators

The environmental protection evaluation indicator is related to whether the system can meet the development direction of the times, and it evaluates the system in terms of the proportion of renewable energy power generation, the average annual carbon emission, the average annual sulfur dioxide emission, and the average annual nitrogen oxide emission. To calculate the emissions of each pollutant associated with these net grid purchases, HOMER multiplies the net grid purchases (kWh) by the emission factor (g/kWh) for each pollutant.

3. Case Study

Sanjiao town is situated in the northeastern part of Zhongshan city, Guangdong province, with geographic coordinates of 113.42° N and 22.67° E. In 2021, the town’s total GDP amounted to 96.9 billion CNY. Sanjiao Town was chosen as the location basis for this study due to several reasons. First, it is a representative of Guangdong’s signature industry clusters, the electroplating and textile industries, which, respectively, amount to 11.2% and 10.6% of the province’s industrial added value. The purpose of this study was to explore a reproducible source–grid–load–storage energy system for industrial parks with similar industry clusters in Guangdong and its neighboring provinces, through the case study of Sanjiao town. Second, Sanjiao town’s commitment to energy transition marks its roadmap to an energy system with more renewable energy. Therefore, support from the local government and industry is readily available, with accessible energy-related data both on the town and industrial park levels, respectively, such as data on the energy consumption profile, grid dispatchment, renewable energy resources, and so on. Data reliability was crucial to the HOMER-Pro analysis in this study and, consequently, made the optimization results more reliable as well. Last but not least, Sanjiao town’s traditional industrial park urgently needs an upgrade of its energy supply structure to meet the future demand of a carbon-neutral town. The nearby factories would be great potential buyers of locally produced hydrogen, substituting coal or gas for industrial heating, thus making Case 5 a valid option for this town.

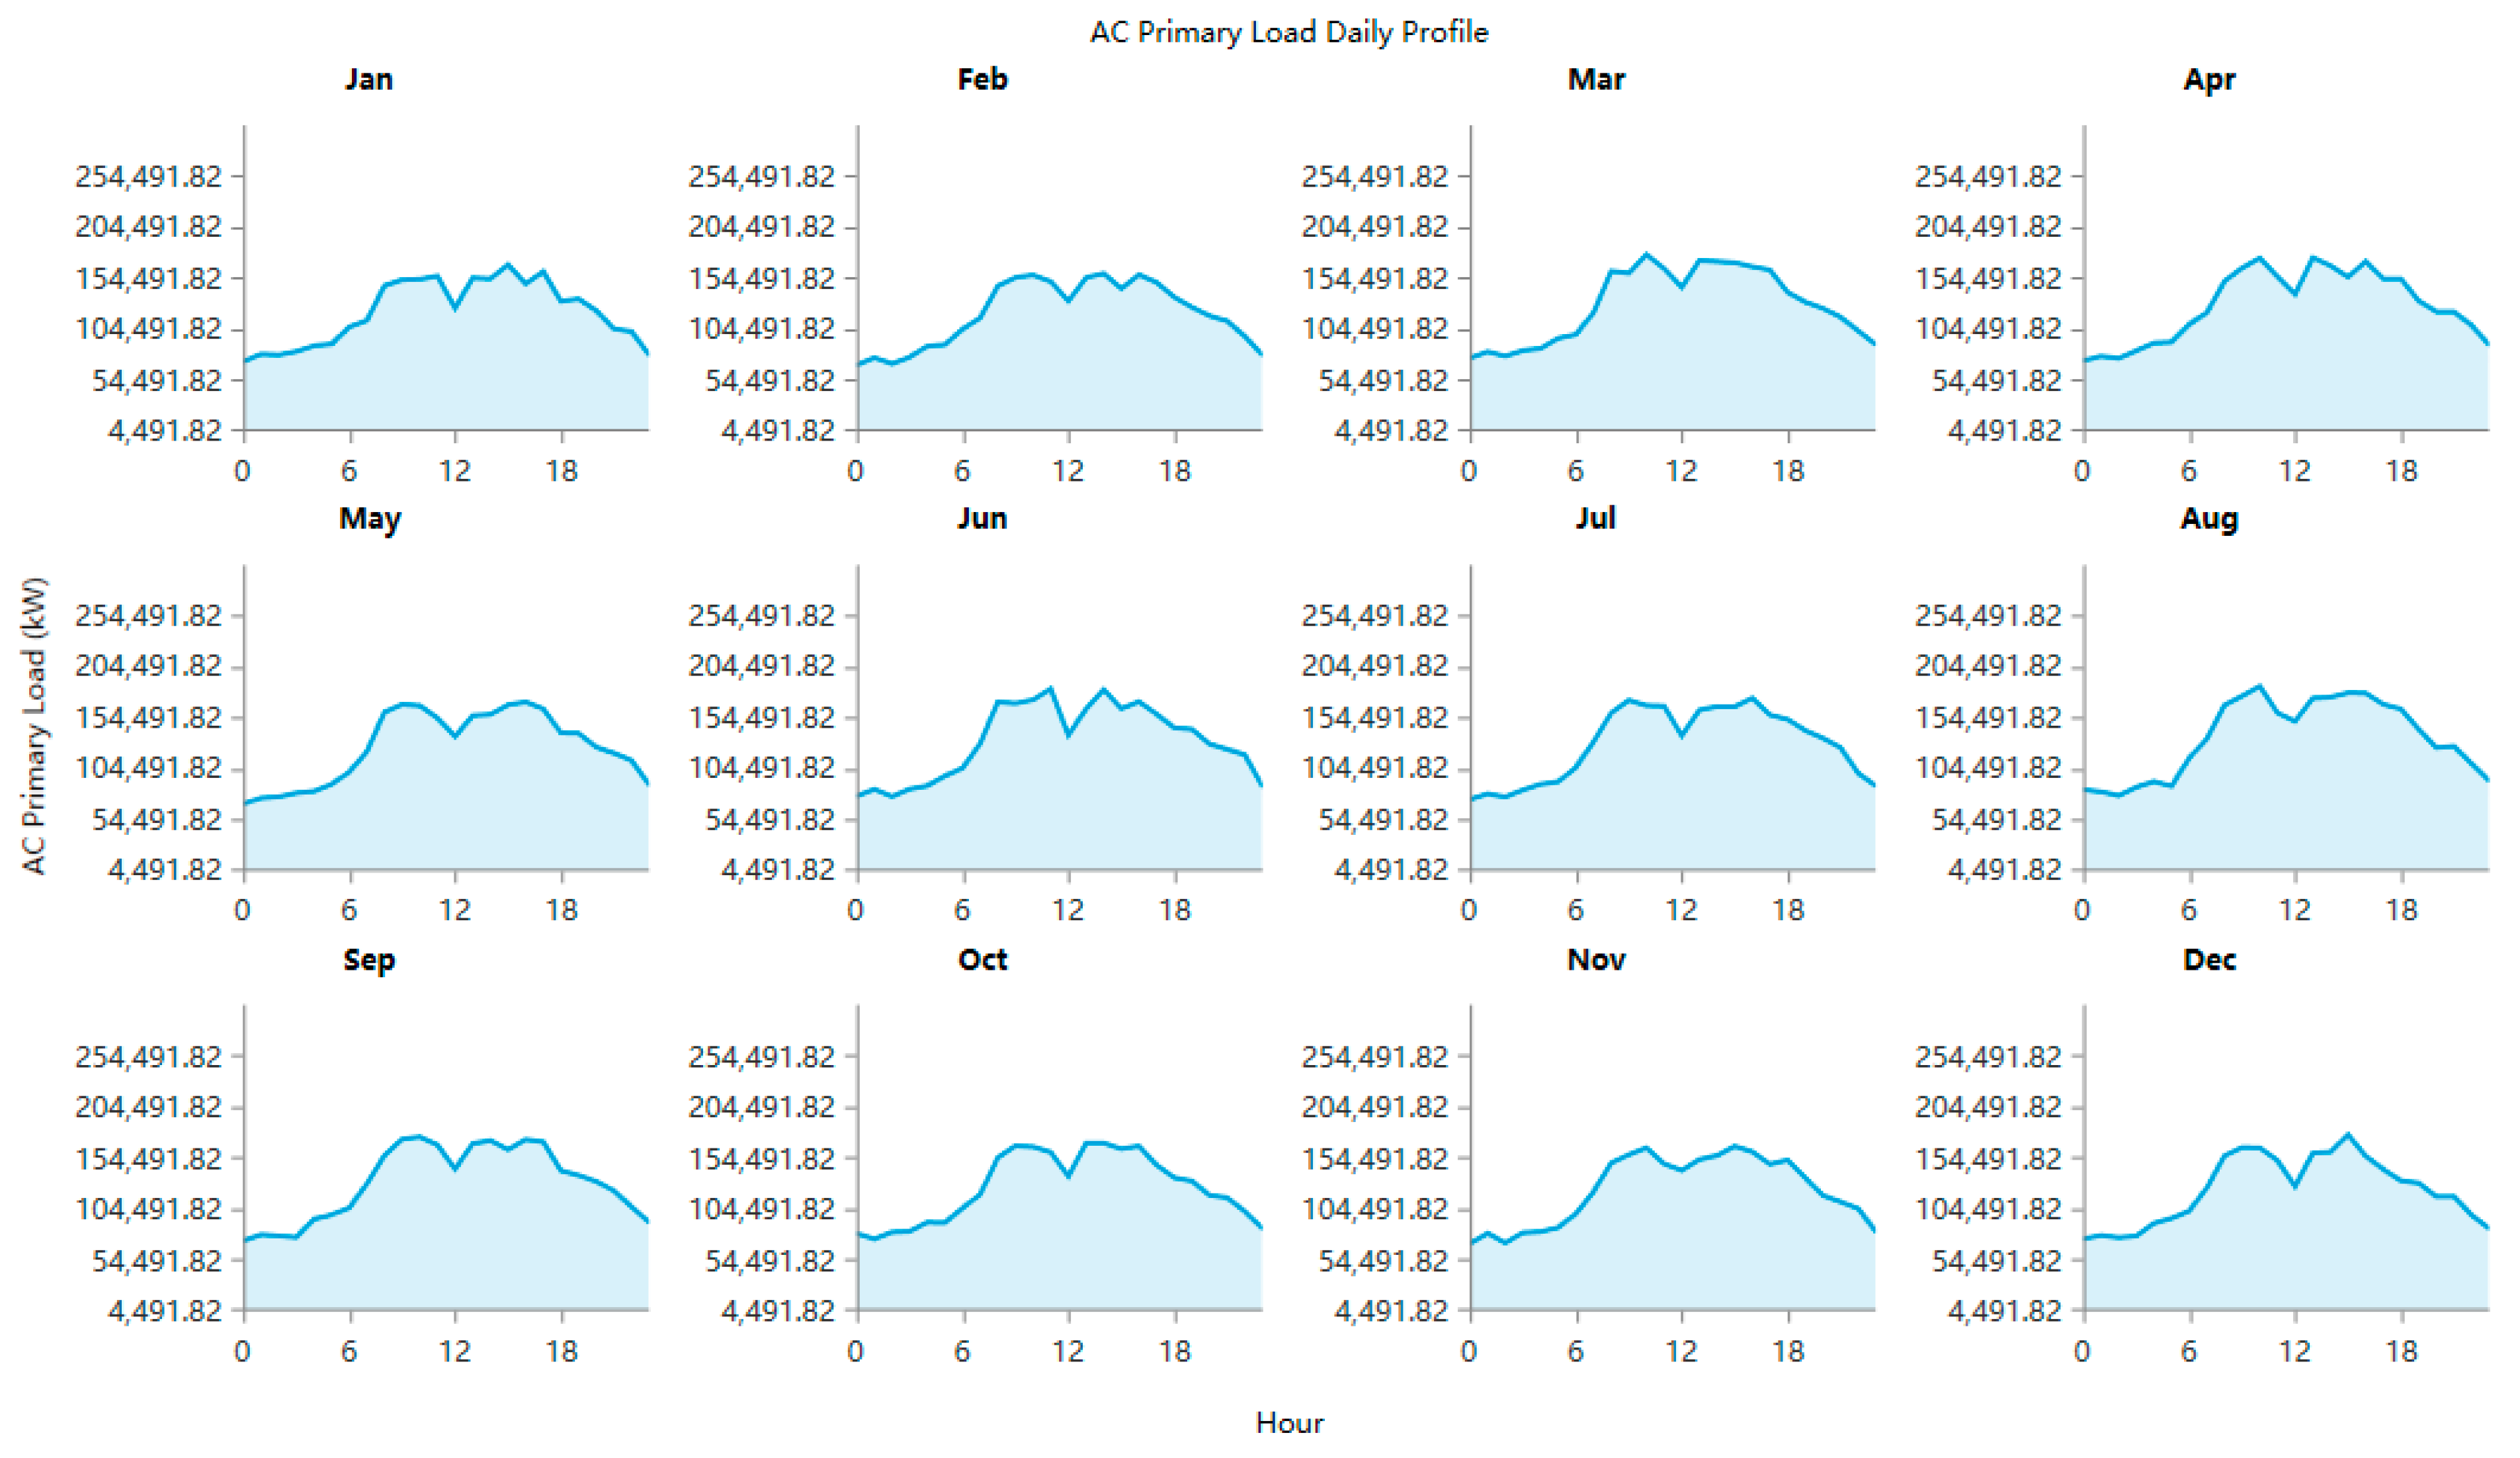
3.1. Electric Load and Price

According to data from the Zhongshan Statistical Bureau, the annual total electricity consumption of Sanjiao town in 2021 was 179.816 TWh. The daily 24-h industrial load and detailed monthly load demand curves are shown in Figure 4 and Figure 5, respectively.
Among them, the average daily total demand of residential electricity was about 490,794.52 kWh/d; the highest power demand reached 69.1 MW; the average daily total load demand of industrial electricity was about 2548 MWh/d; and the load demand at the highest time was 2587 MW.
At the time of writing, Sanjiao town mainly used grid power to meet the load demand. The local current peak and valley leveling tariffs are shown in Table 2.

3.2. Resource Data

The renewable energy sources required for the analysis were obtained from NASA’s 22-year meteorological database, retrieved through the PDAV tool under multiple-data-access options in HOMER-PRO. In the HOMER system, a year’s monthly average solar radiation, the sky clarity index, and the ambient temperature are used as the input GHI resources. Table 3 details the environmental factors (i.e., solar radiation and temperature) that affect solar power generation.
The solar energy resources in Zhongshan are abundant and relatively stable, which is favorable for the development and utilization of solar energy resources. The power output of most renewable energy-generating sets depends both on the design of the system components and the influence of the environmental factors. The output power of solar PV depends on solar radiation and ambient temperature. The average annual solar radiation at the selected site was 3.87 kWh/m2/day, and the average temperature was 22.49 °C. Figure 6 and Figure 7 show the solar radiation versus the clarity index and temperature for the town.

4. Results and Discussion

HOMER optimized the input system architecture by considering all the architectural combinations of the given components in the design. Economic parameters such as the net present value cost (NPC) and the LCOE were evaluated, and the optimal system architecture was compared with the base case system. The optimal sizing of solar PV and WT was kept constant to analyze the impact of the considered storage on the source–grid–load–storage scheme.

4.1. Technical Analysis

The optimum sizing of solar PV and wind turbines and the grid sale price were kept constant to analyze the impact of considering different energy storage methods on the source–grid–load–storage scenario. Table 4 summarizes the technical simulation results of the considered source–grid–load–storage system for different parameters, such as the optimal sizing of the modules, energy yield, unmet load, capacity shortage, renewable percentage (%), and fuel consumption.
The simulation results of the economic parameters of the source–grid–load–storage system with different energy storage methods are shown in Table 5. The economic analysis is dominated by the NPC, the COE decision, and other cost factors. Out of all the system configurations with energy storage, Case 4’s combination showed higher NPC and COE than the other combinations. However, Case 2 had the lowest NPC and COE, indicating that it was the most economical, followed closely by Case 1 and Case 3, with similar NPC and COE values. Case 1 simultaneously displayed the lowest investment, annualized, and O&M costs. On the contrary, Case 4’s investment, annualized, and O&M costs were the highest. Meanwhile, Cases 2 and 3 had similar investment, annualized, and O&M costs. Case 2’s system had the highest ROI and IRR and the fastest payback time, while Case 4 had the smallest ROI and IRR, 4.2 and 6.5, respectively, and the longest payback period, at 11.96 years. In Cases 1 and 2, the ROI, IRR, and payback period were comparable to those of Case 3, but slightly higher. Through a comparative analysis of the simulation results, it was found that the configuration of Case 2 demonstrated the lowest NPC and COE, while having the highest ROI and IRR, as well as the shortest payback period, thus providing an optimized economic system.
Case 2’s lithium-ion battery-based source–grid–load–storage configuration was, at the time of writing, the most economical solution for Sanjiao town. The comparative analysis showed that the Li-ion-based source network load storage system had significant techno-economic benefits compared to other stand-alone systems based on VNM, NAS, and hydrogen.
The main reasons for the hydrogen storage solution’s lack of economic feasibility are the current high investment and operating costs of hydrogen energy systems, as well as the long energy conversion process leading to energy loss, which keeps the NPC and the COE high.

4.2. Battery Performance Analysis

The energy storage configuration for the source–grid–load–storage system with various parameters is presented in Table 6. By analyzing the annual energy data, it was found that the system integrating electrolytic water for hydrogen production and fuel cells led the way, with 510,669,684 KWH/year in terms of energy input, demonstrating its potential to absorb large amounts of renewable energy. However, the total power consumption of such systems is as high as 111,354,170 KWH/year, mainly due to the energy conversion processes involved, such as the electrolysis of water and fuel cell reactions, requiring significant energy consumption.
A comparison of lithium-ion batteries with VNM energy storage technology showed that, although the VNM system had a 69,947,996 KWH/year energy input, its energy output was 489,635,970 KWH/year, which is lower than the 615,205,410 KWH/year output of lithium-ion batteries. These data reveal how efficient lithium-ion batteries are at releasing energy. A further analysis showed that the total power consumption of lithium-ion energy storage technology was only 8,184,954 KWH/year and that it achieved minimal storage losses, pointing to its high charge and discharge efficiency and excellent storage performance.
The sodium–sulfur battery system exhibited the lowest energy input (42,283,709 KWH/year) and output (35,941,153 KWH/year) for potential reasons that could be related to its inherently low energy density or significant energy loss. The case study further showed that Case 1 performed best in terms of storage wear costs, while Case 4 topped all other cases in terms of annual throughput, with 72,703,688 KWH/year. These findings highlight the unique advantages that distinct systems can exhibit in different modes of operation.
Considering the evaluation indicators, including the energy input and output, the total power consumption, the energy conversion rate, the storage loss, and the storage wear costs, the operation mode of Case 2 showed the best overall performance among the many options.

4.3. Environmental Analysis with Different Energy Storage Technologies

In the absence of a source–grid–load–storage system arrangement, the base case meets its energy consumption only through purchased electricity from the grid, which consumes fossil fuels during the process of electricity production, thus generating greenhouse gases (GHGs) and hazardous gases such as CO2, SO2, and NOX. The output of the source–grid–load–storage system’s comparative environmental analysis for the proposed site is shown in Table 7.
This study compared different system configurations and found that Case 1 had the highest carbon footprint due to a significant increase in indirect greenhouse gas emissions, caused by its greater reliance on outsourced power from the main grid, primarily derived from fossil fuel combustion. In contrast, Case 4 achieved the lowest pollutant and carbon emissions of 1.21 × 10⁸ kg/yr by integrating efficient hydrogen production from water electrolysis with fuel cell technology, optimizing energy management, and reducing direct dependence on fossil fuels to 25–30% less than the other scenarios. This result highlights the significant advantages of source–grid–load–storage systems combined with electrolytic hydrogen storage in reducing environmental pollution and improving energy efficiency, providing an important design reference for the sustainability of future energy systems.
As it can be seen from the detailed analysis above, no single combination is a clear winner in all cases. The Li-ion-based Case 2 combination could be identified as the most suitable optimization method at this stage. However, the hydrogen energy storage technology (Case 4) showed better emission reduction attributes.

4.4. Sensitivity Analysis and Discussion

This study explored how the costs of photovoltaics, wind energy, hydrogen storage, fuel cell, and electrolysis equipment affect the economics of hydrogen energy storage systems (PV/WT/grid/hydrogen). In the sensitivity analysis, this study ignored the impact of additional components (such as distributors, high-pressure tanks, cooling equipment, and compressors), because they only accounted for 1% of the system’s NPC. Table 8 details the sensitivity parameters and values used, with the LCOE superimposed on the NPC in the surface chart.
According to Swanson’s law, with the growth of market demand and production, it is anticipated that the cost of industrial products will decrease. As the world moves toward peak carbon and carbon-neutral goals, the cost of core components such as solar PVs, wind turbines, and energy storage will gradually decrease due to growing demand and advances in new types of power systems. Figure 8 shows the impact of the capital costs on the generation (PVs and wind turbines) and storage sides (hydrogen storage tanks, electrolysis equipment, and fuel cell) on the NPC and LCOE of hydrogen storage systems relative to the current conditions. In a scenario where the cost ratio on the storage side is equal to 1, as the cost ratio on the source side decreases from 1 to 0.1, the NPC of the hydrogen system declines from 8.90 billion to 6.36 billion CNY, and its LCOE drops from 0.359 to 0.234 CNY per kilowatt-hour. Similarly, at a source-side cost ratio of 1, when the storage-side cost ratio is reduced from 1 to 0.25, the NPC of the hydrogen source–grid–load–storage system decreases from 8.90 B to 7.78 B CNY, and the LCOE decreases from 0.359 to 0.314 CNY/kWh. The LCOE and NPC of the hydrogen source–grid–load–storage system are minimized when the source-side capital cost is reduced by 75% and the storage capital cost is reduced by 90%; in this case, they are both 40% less compared to the baseline scenario (capital cost ratio of 1).
The results show that the cost reduction in energy generation equipment contributed more to the reduction in the NPC and LCOE of the source–grid–load–storage system for hydrogen storage, while the cost reduction in equipment such as electrolyzed water for hydrogen production had a slightly smaller impact on the whole system’s NPC and LCOE. Hydrogen storage also suffers from a lower system energy conversion rate compared to other forms of storage, due to energy loss in water electrolysis, hydrogen storage, and the use of fuel cells. However, with research and innovation, the overall system energy conversion rate for hydrogen storage has great potential for improvement.

4.5. Discussion

Several potential technological advancements and policy interventions could contribute to cost reductions and enhance the economic viability of hydrogen storage systems. Firstly, improvements in electrolyzer technology that increase efficiency and durability could significantly reduce the capital and operational costs associated with hydrogen production. Secondly, advancements in fuel cell technology that lead to higher energy densities and longer lifespans could decrease both the replacement costs and operational inefficiencies. Thirdly, research into low-cost and efficient materials for hydrogen storage could mitigate issues related to the current high costs of storage tanks. Lastly, governmental policies such as subsidies for hydrogen storage technologies, tax incentives for companies investing in hydrogen infrastructure, and regulatory frameworks that support the development of a hydrogen market could collectively foster an environment conducive to the adoption and scaling of hydrogen storage solutions.

5. Conclusions and Suggestions

5.1. Conclusions

This study applied the HOMER-PRO software and examined various source–grid–load–storage systems to select the most feasible option among the considered arrangements and locations, obtaining the optimal system for industrial and residential energy consumption in Chinese cities. A summary of the main findings reported in this study is given below:
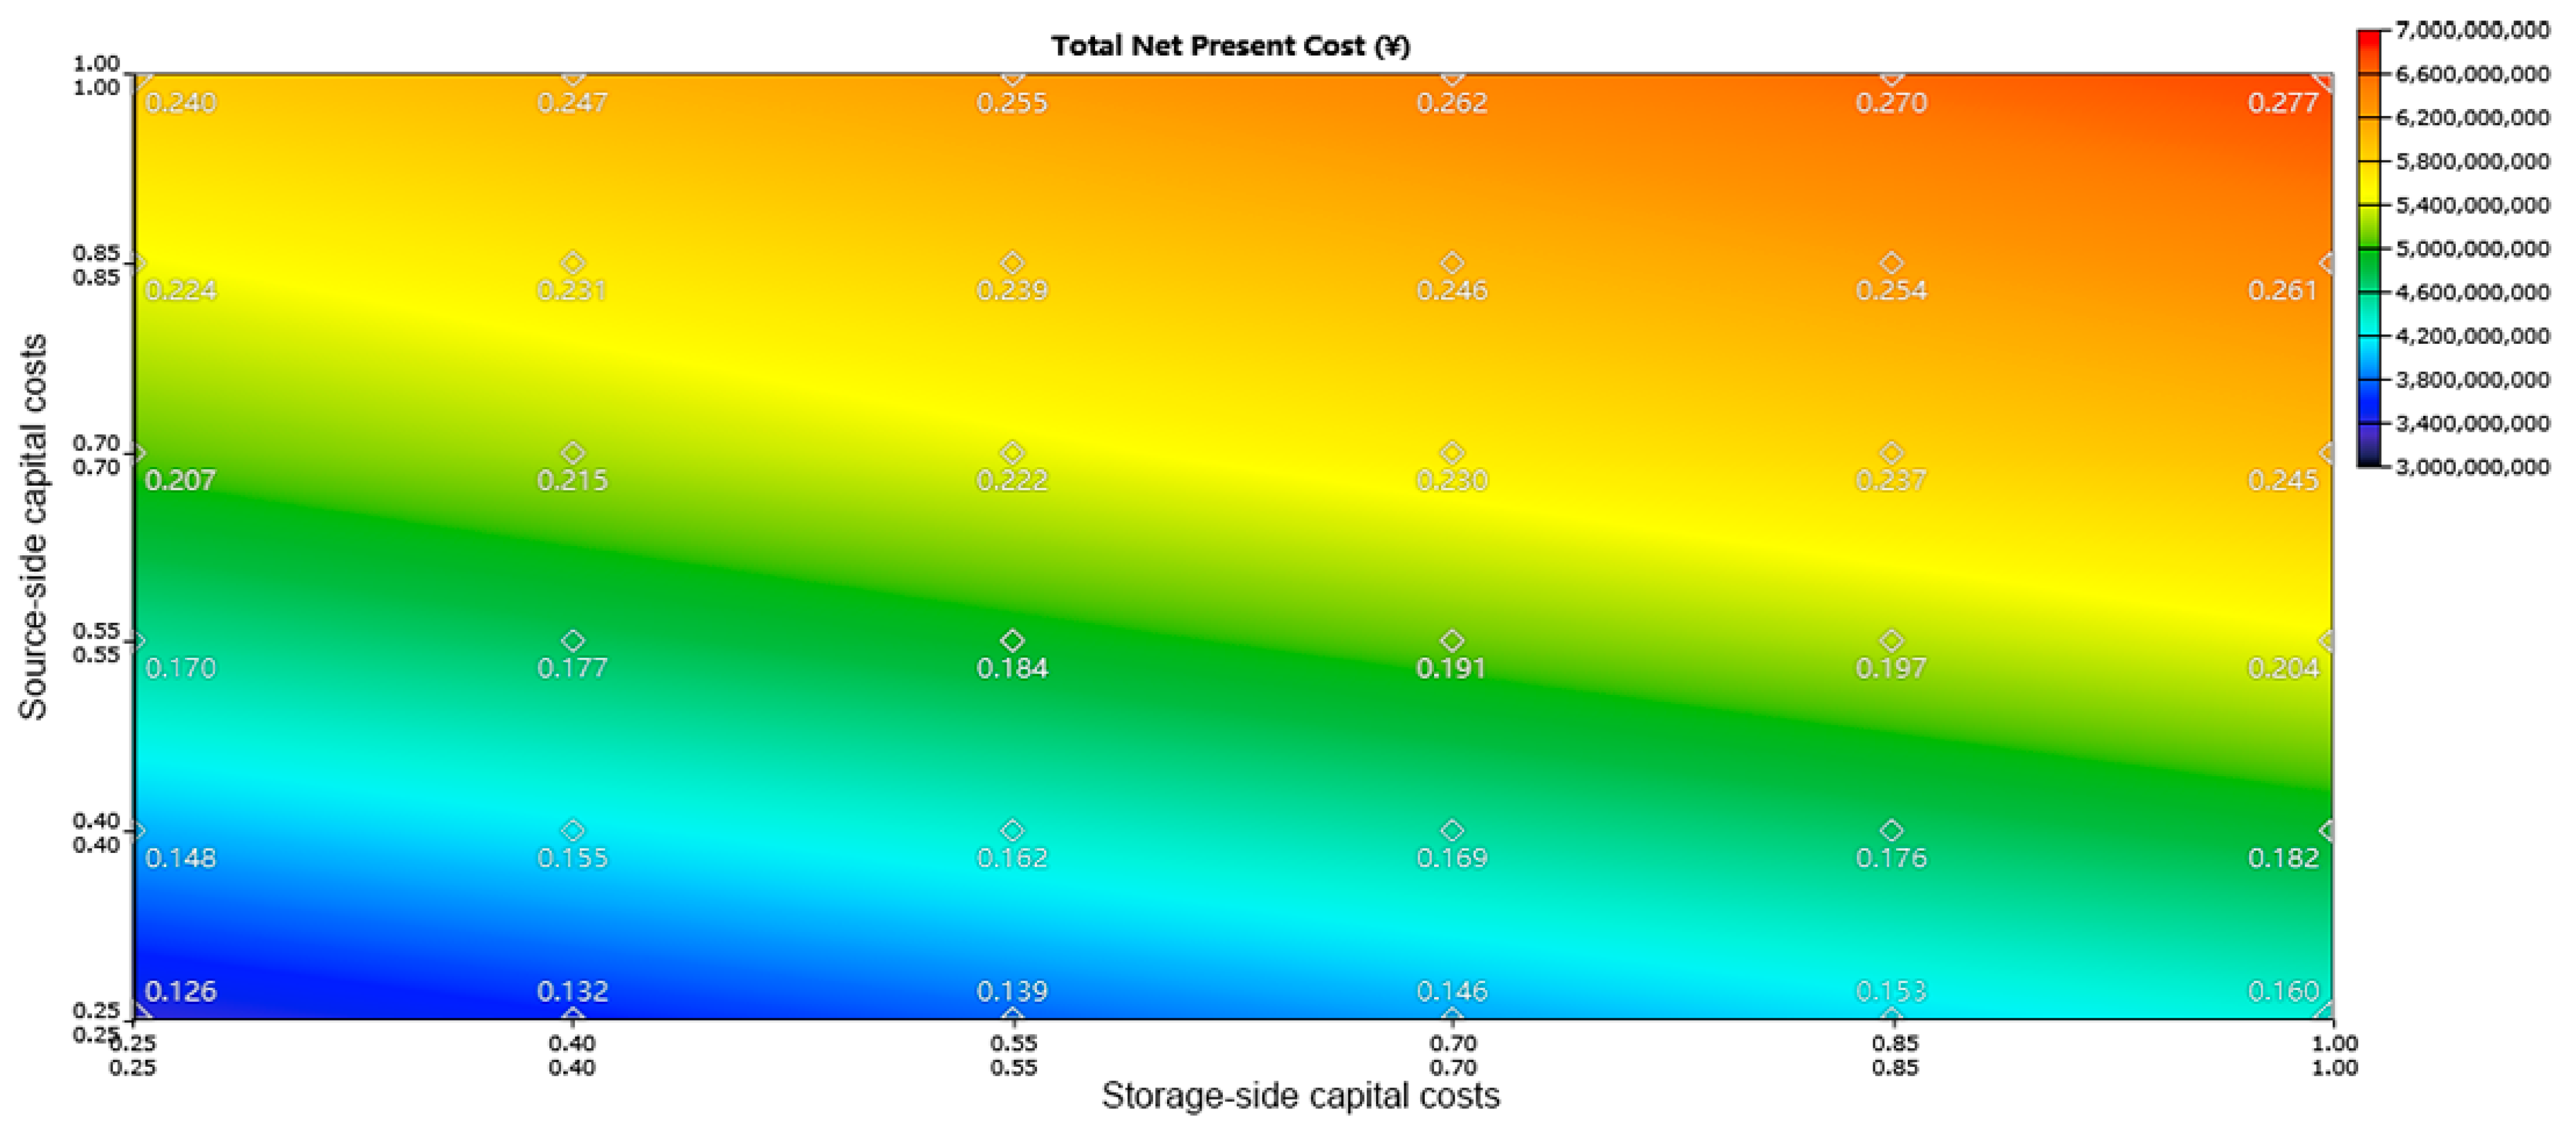
  • The PV/WT/grid/Li-ion combination provided the lowest COE and NPC among the studied source–grid–load–storage systems. The COEs for the PV/WT/VNM, Li-ion, NAS, and hydrogen storage hybrid options were 0.196 CNY/kWh, 0.201 CNY/kWh, 0.206 CNY/kWh, and 0.359 CNY/kWh, respectively, and the NPCs were 6.32 B, 4.30 B, 6.96 B, and 8.90 B, respectively. The hydrogen storage hybrid solution will only become cost-competitive against vanadium and Li-ion storage solutions when the capital costs on both the storage and source sides are reduced by around 70%. However, with environmental costs such as the increased carbon tax set to be introduced by China in its journey to carbon neutrality, the economic benefits of hydrogen as a storage solution might be improved, since it affords the most reductions in all three types of greenhouse gases compared to other storage solutions.
  • Our techno-economic analysis has shown that, currently, the best storage solution for Sanjiao town is the lithium-ion battery-based source–grid–load–storage system, due to its lower costs. However, since hydrogen-based energy storage systems have between 25% and 30% less carbon emissions than battery storage, hydrogen storage can also be considered for achieving carbon neutrality in Sanjiao town.
  • All the forms of storage considered would yield around 89–90% of the renewable energy share in the energy system for the industry-based Sanjiao town, which is significantly higher than the typical local grid target of around 44% [40]. This shows the important role of energy storage in ensuring a reliable energy supply system with a high share of renewable energy.
  • Compared to electrolytic hydrogen water and other forms of equipment, the reduction in the equipment costs on the power generation side contributed more to the reduction in hydrogen storage’s NPC and LCOE. Hydrogen storage also suffers from a lower system energy conversion rate compared to other forms of storage, due to energy loss in water electrolysis, hydrogen storage, and the use of fuel cells. However, with research and innovation, the overall system energy conversion rate for hydrogen storage has great potential for improvement.
  • A town-level source–grid–load–storage system could be the ideal industry–town-level energy solution, satisfying both energy demands and decarbonization needs. This is especially important for heavily industrialized developing countries in the Global South that are, at the same time, facing the pressure of decarbonization.
Despite our in-depth analysis of the town-level source–grid–load–storage system, there are still some shortcomings in our study:
  • In the economic analysis, this study did not consider the standby and capacity costs required for the microgrid system to connect to the power grid. This could be researched and manually added into the HOMER software in future works.
  • This study did not consider the effects of environmental costs on the economic indicators in the five cases. These costs include carbon taxes, subsidies for renewable energy and storage, and government plans for mandatory storage to be coupled with renewable capacity expansions for some provinces. In the future, these factors could be studied to analyze their impact on the different types of solutions, with or without energy storage, and, hence, form policy suggestions for the government when designing decarbonization road maps for industry clusters and towns.
  • The sensitivity analysis on price reduction predictions could be explored in more detail. The next steps of this study could use Wright’s law or Moore’s law to build cost reduction models for renewable energy and storage technologies, using historic data as input. With a more systematic approach to cost predictions, we would be able to perform a more detailed sensitivity analysis on when hydrogen as a storage option will become economically competitive for industrial clusters, compared to other forms of storage.

5.2. Policy Suggestions

Based on the above analysis, we put forward the following policy opinions on energy storage technologies:
  • Efficiency Improvements: Research and development focused on increasing a system’s energy conversion rate can significantly reduce losses during water electrolysis and fuel cell usage. Advances in materials science regarding electrodes and membranes might lead to more efficient electrolyzers and fuel cells.
  • Cost Reduction in Key Components: Investing in manufacturing scale-up and process optimization for components such as electrolyzers and fuel cells can lower their capital and replacement costs. Policies that incentivize mass production and adoption might bring economies of scale into effect.
  • Storage Techniques’ Innovation: Developing improved storage methods for hydrogen that minimize energy loss and extend storage equipment lifespan could contribute to reducing the overall O&M costs and enhancing system longevity.

Author Contributions

Conceptualization, J.Z. and X.L. (Xiaoyu Liu); data curation, N.S.; formal analysis, X.L. (Xi Liu); funding acquisition, P.W.; investigation, N.S.; methodology, X.L. (Xiaoyu Liu); project administration, S.Y.; resources, N.S.; software, M.L. and F.G.; supervision, G.H. (Gengsheng He); validation, M.L. and F.G.; visualization, G.H. (Guori Huang); writing—original draft, F.G.; writing—review and editing, J.Z., X.L. (Xiaoyu Liu), M.L., X.L. (Xi Liu), G.H. (Guori Huang), S.Y., G.H. (Gengsheng He), N.S. and P.W. All authors have read and agreed to the published version of the manuscript.

Funding

This research was funded by the Strategic Pilot Science and Technology Project supported by the Chinese Academy of Sciences (XDA29010500) and the Innovation Project supported by China Southern Power Grid Corp (YNKJXM20230013).

Data Availability Statement

All data that support the findings of this study are included within this article. Other related data associated with this study could be made available upon request.

Conflicts of Interest

Authors Jincan Zeng, Xi Liu, Guori Huang, Shangheng Yao, Gengsheng He and Nan Shang were employed by China Southern Power Grid. Author Minwei Liu was employed by Yunnan Power Grid Corp. The remaining authors declare that this research was conducted in the absence of any commercial or financial relationships that could be construed as potential conflicts of interest.

References

  1. Bajan, B.; Lukasiewicz, J.; Mrówczynska-Kaminska, A. Energy Consumption and Its Structures in Food Production Systems of the Visegrad Group Countries Compared with EU-15 Countries. Energies 2021, 14, 3945. [Google Scholar] [CrossRef]
  2. Pineiro-Villaverde, G.; García-Alvarez, M.T. Impact of Clean Energy Policies on Electricity Sector Carbon Emissions in the EU-28. Energies 2022, 15, 1040. [Google Scholar] [CrossRef]
  3. Gajdzik, B.; Sroka, W. Resource Intensity vs. Investment in Production Installations-The Case of the Steel Industry in Poland. Energies 2021, 14, 443. [Google Scholar] [CrossRef]
  4. Tucki, K.; Orynycz, O.; Swic, A.; Mitoraj-Wojtanek, M. The Development of Electromobility in Poland and EU States as a Tool for Management of CO2 Emissions. Energies 2019, 12, 2942. [Google Scholar] [CrossRef]
  5. Zhu, J.Z.; Zhao, Y.H.; Zheng, L. The Impact of the EU Carbon Border Adjustment Mechanism on China’s Exports to the EU. Energies 2024, 17, 509. [Google Scholar] [CrossRef]
  6. Council of the European Union. Energy 2020: A Policy Framework for Climate and Energy in the Period from 2020 to 2030; Council of the European Union: Brussels, Belgium, 2014. [Google Scholar]
  7. Yiwei, C. Continuing to Promote a Green and Low-Carbon Transition—Positive Results Have Been Achieved over the Past Three Years Since the Introduction of the “Dual-Carbon” Goal. Xinhua News, 22 September 2023. [Google Scholar]
  8. Koko, S.P. Optimal battery sizing for a grid-tied solar photovoltaic system supplying a residential load: A case study under South African solar irradiance. Energy Rep. 2022, 8, 410–418. [Google Scholar] [CrossRef]
  9. Chen, C.; Xing, J.; Li, Q.; Liu, S.; Ma, J.; Chen, J.; Han, L.; Qiu, W.; Lin, Z.; Yang, L. Wasserstein distance-based distributionally robust optimal scheduling in rural microgrid considering the coordinated interaction among source-grid-load-storage. Energy Rep. 2021, 7, 60–66. [Google Scholar] [CrossRef]
  10. Alsabry, A.; Szymanski, K.; Michalak, B. Energy, Economic and Environmental Analysis of Alternative, High-Efficiency Sources of Heat and Energy for Multi-Family Residential Buildings in Order to Increase Energy Efficiency in Poland. Energies 2023, 16, 2673. [Google Scholar] [CrossRef]
  11. Jahangiri, M.; Haghani, A.; Alidadi Shamsabadi, A.; Mostafaeipour, A.; Pomares, L.M. Feasibility study on the provision of electricity and hydrogen for domestic purposes in the south of Iran using grid-connected renewable energy plants. Energy Strategy Rev. 2019, 23, 23–32. [Google Scholar] [CrossRef]
  12. Hakan Açıkel, H.; Bayır, E. Evaluation of capacity of hybrid energy systems to decrease the environmental pollution. Fuel 2022, 328, 125356. [Google Scholar] [CrossRef]
  13. Zou, H.; Du, H.; Brown, M.A.; Mao, G. Large-scale PV power generation in China: A grid parity and techno-economic analysis. Energy 2017, 134, 256–268. [Google Scholar] [CrossRef]
  14. Kim, I.; James, J.-A.; Crittenden, J. The case study of combined cooling heat and power and photovoltaic systems for building customers using HOMER software. Electr. Power Syst. Res. 2017, 143, 490–502. [Google Scholar] [CrossRef]
  15. Ribó-Pérez, D.; Herraiz-Cañete, Á.; Alfonso-Solar, D.; Vargas-Salgado, C.; Gómez-Navarro, T. Modelling biomass gasifiers in hybrid renewable energy microgrids; a complete procedure for enabling gasifiers simulation in HOMER. Renew. Energy 2021, 174, 501–512. [Google Scholar] [CrossRef]
  16. Kobayakawa, T.; Kandpal, T.C. Optimal resource integration in a decentralized renewable energy system: Assessment of the existing system and simulation for its expansion. Energy Sustain. Dev. 2016, 34, 20–29. [Google Scholar] [CrossRef]
  17. Al kez, D.; Foley, A.M.; McIlwaine, N.; Morrow, D.J.; Hayes, B.P.; Zehir, M.A.; Mehigan, L.; Papari, B.; Edrington, C.S.; Baran, M. A critical evaluation of grid stability and codes, energy storage and smart loads in power systems with wind generation. Energy 2020, 205, 117671. [Google Scholar] [CrossRef]
  18. Demirci, A.; Öztürk, Z.; Tercan, S.M. Decision-making between hybrid renewable energy configurations and grid extension in rural areas for different climate zones. Energy 2023, 262, 125402. [Google Scholar] [CrossRef]
  19. Deshmukh, M.K.; Singh, A.B. Modeling of Energy Performance of Stand-Alone SPV System Using HOMER Pro. Energy Procedia 2019, 156, 90–94. [Google Scholar] [CrossRef]
  20. Amutha, W.M.; Rajini, V. Cost benefit and technical analysis of rural electrification alternatives in southern India using HOMER. Renew. Sustain. Energy Rev. 2016, 62, 236–246. [Google Scholar] [CrossRef]
  21. Akarsu, B.; Serdar Genç, M. Optimization of electricity and hydrogen production with hybrid renewable energy systems. Fuel 2022, 324, 124465. [Google Scholar] [CrossRef]
  22. He, L.; Zhang, S.; Chen, Y.; Ren, L.; Li, J. Techno-economic potential of a renewable energy-based microgrid system for a sustainable large-scale residential community in Beijing, China. Renew. Sustain. Energy Rev. 2018, 93, 631–641. [Google Scholar] [CrossRef]
  23. Li, C.; Zhou, D.; Zhang, L.; Shan, Y. Exploration on the feasibility of hybrid renewable energy generation in resource-based areas of China: Case study of a regeneration city. Energy Strategy Rev. 2022, 42, 100869. [Google Scholar] [CrossRef]
  24. Li, C.; Ge, X.; Zheng, Y.; Xu, C.; Ren, Y.; Song, C.; Yang, C. Techno-economic feasibility study of autonomous hybrid wind/PV/battery power system for a household in Urumqi, China. Energy 2013, 55, 263–272. [Google Scholar] [CrossRef]
  25. Mohammadi, M.; Ghasempour, R.; Razi Astaraei, F.; Ahmadi, E.; Aligholian, A.; Toopshekan, A. Optimal planning of renewable energy resource for a residential house considering economic and reliability criteria. Int. J. Electr. Power Energy Syst. 2018, 96, 261–273. [Google Scholar] [CrossRef]
  26. Shahzad, M.K.; Zahid, A.; ur Rashid, T.; Rehan, M.A.; Ali, M.; Ahmad, M. Techno-economic feasibility analysis of a solar-biomass off grid system for the electrification of remote rural areas in Pakistan using HOMER software. Renew. Energy 2017, 106, 264–273. [Google Scholar] [CrossRef]
  27. Kalamaras, E.; Belekoukia, M.; Lin, Z.; Xu, B.; Wang, H.; Xuan, J. Techno-economic Assessment of a Hybrid Off-grid DC System for Combined Heat and Power Generation in Remote Islands. Energy Procedia 2019, 158, 6315–6320. [Google Scholar] [CrossRef]
  28. Bhimaraju, A.; Mahesh, A.; Joshi, S.N. Techno-economic optimization of grid-connected solar-wind-pumped storage hybrid energy system using improved search space reduction algorithm. J. Energy Storage 2022, 52, 104778. [Google Scholar] [CrossRef]
  29. Budiman, F.N.; Ramli, M.A.M.; Milyani, A.H.; Bouchekara, H.R.E.H.; Rawa, M.; Muktiadji, R.F.; Seedahmed, M.M.A. Stochastic optimization for the scheduling of a grid-connected microgrid with a hybrid energy storage system considering multiple uncertainties. Energy Rep. 2022, 8, 7444–7456. [Google Scholar] [CrossRef]
  30. Maatallah, T.; Ghodhbane, N.; Ben Nasrallah, S. Assessment viability for hybrid energy system (PV/wind/diesel) with storage in the northernmost city in Africa, Bizerte, Tunisia. Renew. Sustain. Energy Rev. 2016, 59, 1639–1652. [Google Scholar] [CrossRef]
  31. Bhatt, A.; Ongsakul, W.; Madhu, M.N. Optimal techno-economic feasibility study of net-zero carbon emission microgrid integrating second-life battery energy storage system. Energy Convers. Manag. 2022, 266, 115825. [Google Scholar] [CrossRef]
  32. Khan, F.A.; Pal, N.; Saeed, S.H.; Yadav, A. Techno-economic and feasibility assessment of standalone solar Photovoltaic/Wind hybrid energy system for various storage techniques and different rural locations in India. Energy Convers. Manag. 2022, 270, 116217. [Google Scholar] [CrossRef]
  33. Ekren, O.; Hakan Canbaz, C.; Güvel, Ç.B. Sizing of a solar-wind hybrid electric vehicle charging station by using HOMER software. J. Clean. Prod. 2021, 279, 123615. [Google Scholar] [CrossRef]
  34. Nesamalar, J.J.D.; Suruthi, S.; Raja, S.C.; Tamilarasu, K. Techno-economic analysis of both on-grid and off-grid hybrid energy system with sensitivity analysis for an educational institution. Energy Convers. Manag. 2021, 239, 114188. [Google Scholar] [CrossRef]
  35. Ampah, J.D.; Jin, C.; Agyekum, E.B.; Afrane, S.; Geng, Z.; Adun, H.; Yusuf, A.A.; Liu, H.; Bamisile, O. Performance analysis and socio-enviro-economic feasibility study of a new hybrid energy system-based decarbonization approach for coal mine sites. Sci. Total Environ. 2023, 854, 158820. [Google Scholar] [CrossRef] [PubMed]
  36. Agyekum, E.B.; Ampah, J.D.; Afrane, S.; Adebayo, T.S.; Agbozo, E. A 3E, hydrogen production, irrigation, and employment potential assessment of a hybrid energy system for tropical weather conditions—Combination of HOMER software, shannon entropy, and TOPSIS. Int. J. Hydrogen Energy 2022, 47, 31073–31097. [Google Scholar] [CrossRef]
  37. Oltarzewska, A.; Krawczyk, D.A. Simulation of the Use of Ground and Air Source Heat Pumps in Different Climatic Conditions on the Example of Selected Cities: Warsaw, Madrid, Riga, and Rome. Energies 2021, 14, 6701. [Google Scholar] [CrossRef]
  38. China Hydrogen Alliance. Handbook of Hydrogen and Fuel Cell Industry in China; Science Press: Beijinng, China, 2023. [Google Scholar]
  39. Chuan CAI Securities limited liability company. Performance Cost Policy Driven, Lithium Penetration Is Unstoppable. 2020. Available online: https://vip.stock.finance.sina.com.cn/q/go.php/vReport_Show/kind/lastest/rptid/4543218/index.phtml (accessed on 29 March 2019).
  40. Guangdong Energy Administration. Implementation Plan for Promoting High-Quality Energy Development in Guangdong Province. 2023. Available online: https://www.baidu.com/link?url=lHC_FEmNE4FnbQ7HLCoJD3-f2DeSNEqA7eX0FH-dspW-1P8jHeFNzlA9Db14lSeS3RHqVfnzQR8CXrmaKr3y9E0rGNurriECjXGKt9fpd2q&wd=&eqid=c8a4563d000294c30000000665b1cc91 (accessed on 22 May 2023).
Figure 1. Geographical location and GDP of each city in the GBA (2019).
Energies 17 03074 g001
Figure 2. Procedural flow of the HOMER software in optimizing the system.
Energies 17 03074 g002
Figure 3. Structure of the source–grid–load–storage system.
Energies 17 03074 g003
Figure 4. The 24-h electricity load of printing, dyeing, and plating enterprises.
Energies 17 03074 g004
Figure 5. Sanjiao town’s monthly load requirement curve.
Energies 17 03074 g005
Figure 6. Solar radiation at the selected site with the clarity index.
Energies 17 03074 g006
Figure 7. Temperature data of the selected location.
Energies 17 03074 g007
Figure 8. Effects of source-side and storage-side capital costs on the economic performance of Case 4.
Energies 17 03074 g008
Table 1. Prices and lifespans of energy storage and other devices.
ComponentsCapital Cost (CNY/kW)Replacement Cost (CNY/kW)O&M Cost
(CNY/kW-yr)
Lifespan (Years)
PV System4200300010025
Wind System2812125012.525
Converter 3003001525
Storage (Li ion)16581000515
Storage (VNM)32001919840
Storage (NAS)215013794010
Hydrogen tank1000 CNY/kg800 CNY/kg10 CNY/kg25
Electrolyzer17009001515
Fuel Cell 200010000.01 CNY/operational hour20,000 h
Table 2. Peak–valley leveling tariffs for Sanjiao town.
Time10:00~12:00,
14:00~19:00
00:00~8:008:00~10:00,
12:00~14:00,
19:00~00:00
Price/CNY1.03770.2320.6104
Table 3. Solar radiation, clarity index, and temperature of the selected site.
MonthSolar Radiation
(kWh/m2/day)
Clarity IndexTemperature (°C)
13.0200.42614.270
22.7800.34116.680
33.0300.32119.940
43.6300.34723.630
54.2400.38626.100
64.5300.40727.520
74.9600.45028.060
84.6300.43628.090
94.3500.44626.670
104.2200.49723.800
113.7900.51919.770
123 2500.48315.370
Table 4. Comparative technical analysis of the considered system configurations.
CasePVWTStorageEnergy Produced
(kWh/yr)
Unmet Load
(kWh/yr)
Renewable Fraction (%)
Case 1300 M960 M176 MWh2,692,383,488089.6
Case 2300 M960 M173 MWh2,681,103,616090.1
Case 3300 M960 M136 MWh2,686,462,208090.8
Case 4300 M960 M300 T2,701,563,904089.4
Case 5300 M96 0M300 T2,699,556,096089.5
Table 5. Comparative economic analysis of the considered system configurations.
CaseNPC
(CNY)
COE
(CNY/kWh)
Annual CostCapital CostO&M CostROIIRRPayback
Case 16.63 B0.201172 M4.41 B161 M8.812.17.64
Case 26.25 B0.197189 M4.30 B170 M9.212.67.35
Case 36.95 B0.206207 M4.28 B185 M8.211.57.85
Case 47.31 B0.277182 M4.96 B202 M6.59.48.96
Table 6. Comparative battery performance analysis of the considered system configurations.
CaseEnergy In (kWh/yr)Energy Out
(kWh/yr)
Storage Depletion
(kWh/yr)
Losses (kWh/yr)Annual Throughput
(kWh/yr)
Storage Wear Cost (CNY/kWh)
Case 169,947,99648,963,597020,984,39958,522,6930
Case 268,356,15761,520,54106,835,61664,848,3440.15
Case 342,283,70935,941,15306,342,55638,983,6540.205
Case 4510,669,68472,703,688NA437,965,99672,703,688NA
Table 7. Comparative environmental analysis of the considered system configurations.
CaseCO2 (kg/yr)SO2 (kg/yr)NOX (kg/yr)
Case 1146,309,905370,182402,919
Case 2150,598,048381,031414,728
Case 3140,722,659356,045387,532
Case 4121,086,993306,377333,777
Case 5134,398,754408,850445,007
Base Case644,485,8701,630,6271,774,832
Table 8. Sensitivity analysis parameters and values.
ParameterValueInvestigated Effect
PV cost ratio0.25–1NPC and LCOE
WT cost ratio0.25–1NPC and LCOE
Hydrogen tank cost ratio0.25–1NPC and LCOE
Electrolyzer cost ratio0.25–1NPC and LCOE
Fuel cell0.25–1NPC and LCOE
ParameterValueInvestigated effect
Disclaimer/Publisher’s Note: The statements, opinions and data contained in all publications are solely those of the individual author(s) and contributor(s) and not of MDPI and/or the editor(s). MDPI and/or the editor(s) disclaim responsibility for any injury to people or property resulting from any ideas, methods, instructions or products referred to in the content.

